Article

A Frequency Domain Causality Approach Towards the Management of Supply Chain Digitalization and Environmental Quality in Saudi Arabia: What Is the Role of Green Innovation?


Department of Business Administration, Institute of Graduate Research and Studies, University of Mediterranean Karpasia, Mersin-10, Northern Cyprus, TR-10, Mersin 99010, Turkey
*
Author to whom correspondence should be addressed.
Sustainability 2026, 18(5), 2527; https://doi.org/10.3390/su18052527
Submission received: 11 January 2026 / Revised: 11 February 2026 / Accepted: 13 February 2026 / Published: 5 March 2026

Abstract

Assessing the quality of the environment is absolutely essential. However, there has been a lack of research evaluating the impact of the dimensions of Supply Chain Digitalization on the environment. Therefore, this research examines the impact of Supply Chain Digitalization (SCD), Green Innovation (GIN), Financial Globalization (FIG), and economic growth (GDP) on Greenhouse Gases (GHGs) in Saudi Arabia from 2000Q1 to 2022Q4, employing the Autoregressive Distributed Lag (ARDL) model, Frequency Domain Causality (FDC) approach, and Multiple Quantile-on-Quantile (MQQ) analysis. Saudi Arabia is considered a key player in SCD due to its strategic location in global trade, the alignment of its Vision 2030 economic diversification goals, and its significant investment in digital infrastructure and skills. The ARDL outcomes showed that in the short run, SCD and GDP increase GHGs, while GIN and FIG reduce GHGs. In the long run, SCD and GDP drive GHGs, while GIN reduces GHGs. The FDC test shows that SCD and FIG Granger-cause GHGs in the long term, while GDP Granger-causes GHGs in the short and long term. The MQQ analysis confirms that at lower quantiles, the combined effect of SCD, GIN, FIG, and GDP on GHGs tends to be negative. However, at middle and higher quantiles, the effect becomes positive. Based on these results, policies are recommended.

1. Introduction

Due to recent environmental occurrences, there is no denying the effects of climate change. Global support for the achievement of carbon neutrality has resulted from a growing awareness of its detrimental repercussions, both historical and contemporary [1,2]. The Paris Agreement, which called for countries to drastically cut their emissions, was the first agreement to highlight this commitment. Nevertheless, despite several initiatives, many nations’ pro-growth agendas have emerged as a significant barrier to accomplishing this objective [3].
There are different kinds of emissions, namely, CO2, N2O, and CH4. These emission types are called Greenhouse Gases (GHGs). CO2 contributes most to global warming and is mostly driven by human activities [4]. It emanates from the use of oil, gas, and coal, usually referred to as fossil fuels. CH4 is primarily from agriculture, fossil fuels, and waste management. The major contributors to N2O include agriculture, fossil fuels, and industrial processes. Based on empirical facts, Saudi Arabia has a population of 33.96 million, and recent per capita emissions are extremely high at 26.2 tonnes per capita/year. In 2024, GHGs in CO2 equivalent totaled 889.1 megatons CO2e. In addition, Saudi Arabia’s total historical contribution to global warming since 1850 has totaled 29,896.8 in megatons CO2e, and its total historical share stands at 0.8%. Furthermore, by 2024, total CO2 stood at 691.76 megatons, CH4 at 110.3 megatons CO2e, and N2O at 13.1 megatons CO2e [5]. From these facts, GHGs in Saudi Arabia need to be closely monitored so that the country can achieve its climate goals.
There are different factors that can drive GHGs, and these include Supply Chain Digitalization (SCD), Green Innovation (GIN), Financial Globalization (FIG), and economic expansion (GDP). The utilization of novel technologies that add value for businesses and provide several advantages is central to the current digital era [6,7]. Digitalization is the application of digital technologies (AI, Cloud Computing, Automation, Big Data, and IoT) and digitized data to generate and extract value in novel ways. Utilizing digitized data and procedures, digitalization involves mechanisms for engagement and insight. Digitized data serves as the foundation for knowledge in digitalization, which enables action and change. Thus, when that process is given room to develop and take hold, it results in digital transformation, which is the total reconstruction of the company to meet the new needs and opportunities brought about by digital technology [8]. Sustainable changes, particularly those related to the environment and society, can be accelerated by digitalization. Furthermore, as many experts have acknowledged, it can help reduce inequality in access to finance and successfully address persistent societal, environmental, and governance concerns [9].
SCD is becoming more and more popular in both study and practice [10]. The term SCD refers to the creation of information systems and the use of cutting-edge technologies that enhance the SC’s integration and agility, hence enhancing customer service and the organization’s long-term success [11]. SCD refers to an intelligent, customer-focused, internationally linked, system-integrated, data-driven mechanism that uses new technology to provide valuable goods and services at more reasonable prices [12]. In addition, a robust digital SC management implementation has been linked to a number of advantages, such as speed, flexibility, global reach, intelligence, transparency, and scalability. Another crucial element in lowering GHGs is GIN, which includes novel technology and procedures that lessen environmental harm [13]. By reusing natural resources, using purification techniques, and keeping an eye on green activities, GIN can lessen environmental destruction [14]. It is important to note that SCD and GIN work effectively through the channel of FIG. FIG evaluates the level of globalization of countries based on portfolio investment, FDI, international liabilities, stocks and assets, and regulations [15]. Lastly, economic expansion can be one of the major drivers of GHGs if an economy focuses on economic progress at the expense of the quality of the environment. This is known as the scale effect. However, with the adoption of environmentally friendly technologies, the impact of economic expansion on ecological quality becomes positive. This is regarded as the technique and composition effect. This analysis was proposed by [16].
Based on these discussions, this research investigates the impact of SCD, GIN, FIG, and GDP on GHGs in Saudi Arabia from 2000Q1 to 2022Q4 using the ARDL, FDC, and MQQ methodologies.
The gaps and contributions of this research are as follows: First, the discussion on the SCD and GHG nexus in the context of the Saudi Arabian economy is very scarce. This requires further investigation, which this research captures. In addition, the variable used to proxy for SCD, which is ICT goods exports, captures the technology supply side of the economy. The use of this variable is important because it boosts productivity, improves efficiency, facilitates innovation, and enables the creation of entirely new business models and industries. Secondly, the methods employed in this study are unique and fit the model of this study. The ARDL approach employed is flexible, can capture short-term data span, and can be used when the variables are integrated at mixed orders. This differs from the standard VAR models that require strict stationarity conditions. Furthermore, the FDC test employed is superior to the traditional Granger causality test because it examines causality in the short, medium, and long term. Lastly, the MQQ test used is non-parametric and advantageous in nature because it examines the collective impact of the independent variables on the dependent variable at different quantiles. Third, rather than using the technological innovation variable employed by other studies, this research used the GIN variable because it is one of the corrective lenses through which the environmental impact of digitalization is measured. The fourth contribution is that, rather than using individual indicators of GHGs like CO2, CH4, and N2O, this research used the aggregate GHG variable to prevent policy blind spots. Lastly, this study used quarterly data instead of annual data in order to capture the seasonality of the data.
The structure of this research is as follows: Section 1 captures the introduction; Section 2 captures the literature review; Section 3 dives into the data and methodologies employed; Section 4 captures the analysis and discussion; and Section 5 concludes the study.

2. Literature Review

This section examines the association between SCD, FIG, GIN, GDP and GHGs.

2.1. SCD and GHG Association

Employing the CB–SEM approach, the findings of [17] demonstrated that the metal industry’s SC decarbonization is directly and significantly impacted by the degree of digitalization of its SC operations. Cleaner industrial techniques, higher energy efficiency, and more effective resource utilization are all made possible by digital technologies. Significantly, the study finds that SC mapping is a key way that digitalization helps decarbonization. Organizations can discover carbon hotspots and areas for enhancement that digital solutions might solve by gaining visibility over their whole SC through thorough mapping. Ref. [18] opined that SCD has emerged as a crucial facilitator of both environmentally friendly production and efficiency in operations, which is at the center of the global movement for ecological preservation and sustainable development. The study found that SCD contributes significantly to GTFP among Chinese A-firms. More specifically, state-owned businesses, extremely polluting businesses, and economically developed areas are where SCD’s capacity to increase GTFP is most noticeable, giving the results a unique perspective. These results demonstrate SCD’s vital role in advancing ecological sustainability. Employing the double ML model, ref. [19] also found that SCD greatly improves organizational ESG performance. Furthermore, SCD boosts cross-country trade credit, enhances external monitoring, and increases internal efficiency of operations, all of which improve organizational ESG performance. Lastly, companies that operate in highly polluting sectors and have a greater collaborative culture and capacity for innovation are more likely to benefit from SCD in terms of ESG performance. Ref. [20] argued that a strong SC spurs natural resource rents, and this contributes to the degradation of the environment. The study further opined that the environment deteriorates as a direct result of global SCD. A number of industries, including transportation and manufacturing, greatly raise GHGs, which exacerbates air pollution and speeds up climate change. For example, just freight transportation was responsible for 8% of worldwide CO2 in 2018 [21]. Once more, SCD influences how natural resources are used in social, economic, and environmental contexts [22].
On the other hand, the findings show that globalization and the advancement of environmentally linked technology reduce CO2 emissions. This suggests that while economic expansion, digitalization, and energy intensity may increase emissions, there is evidence that they should decrease emissions through advances in technology, adopting green technologies, and placing a strong emphasis on ecological sustainability. Ref. [23] demonstrated that (i) an increase in SCD increases GHGs in the US across all quantiles and timeframes; (ii) efficiency in energy use (oil and gas) reduces GHGs; (iii) growth in the economy and FIG reduce GHGs; and (iv) all the regressors are capable of significantly predicting GHGs. Ref. [24] argued that there are various ways to explain why digitalization has a negative impact on GVCs’ CO2. Since data centers are known for storing, processing, and sending large amounts of energy-intensive information, they are the main source of dependency for the digital world. Countries increase their reliance on conventional energy derived from fossil fuels in order to meet this energy demand, which raises carbon emissions. According to [25], due to their heavy reliance on conventional energy, developing countries continue to rely heavily on the primary sector, which is inefficient in terms of energy use. Additionally, developing countries are becoming more integrated into GVCs as a result of the possible positive consequences of liberalization policies [26]. However, multinational firms are the primary forces behind GVCs, since they quickly embrace digital tools and gadgets to take part in them. In addition to being energy-intensive, these devices raise the energy requirements of data centers, which store and analyze data, especially in developing countries. As a result, the benefits of increased operational efficiency brought about by the use of digital tools during GVC participation are counterbalanced by the rise in demand for energy generated from conventional sources. According to [27], industrialized countries’ high-quality institutions and infrastructural development allow digitalization to foster green technology and Green Innovation. However, nations that are developing are dependent on traditional energy because they lack well-functioning institutions and ecologically friendly infrastructure. Based on these discussions, the hypothesis of this study is as follows:
H1: 
SCD can either drive or reduce GHGs.

2.2. FIG and GHG Association

In E7 economies, using the Quantile-on-Quantile Regression (QQR) approach, ref. [28] established that FIG had a beneficial impact on CO2 for Brazil, China, India, and Turkey in most quantiles, supporting the pollution-haven hypothesis. Additionally, in most quantiles for Mexico, Russia, and Indonesia, the pollution-halo concept is supported by the fact that FIG has a negative impact on CO2. Furthermore, FIG can forecast CO2 for the E7 countries, according to the unique causation in the quantiles technique. Using the QQKRLS approach for the United States economy, ref. [29] ascertained that there is a strong positive correlation between breakthroughs in solar energy, economic expansion, openness in trade, and the quality of the environment. In addition, ICT and FIG have been shown to improve the quality of the environment. In natural resource-abundant economies, using the MMQR, FMOLS, and DOLS techniques, ref. [30] found that clean energy consumption and FIG contribute to the quality of the environment, while GDP spurs ecological degradation. In G9 industrial economies, using the BSQR and MMQR methods, ref. [31] also confirmed that FIG drives ecological quality, while economic progress undermines it. For the top 10 economies, using the MMQR approach, ref. [32] established that FIG contributes to ecological quality across all quantiles. This is also established by [33] for the top 10 nuclear energy-consuming nations. Based on these discussions, FIG can either drive GHGs or reduce them.
H2: 
FIG can either drive or reduce GHGs.

2.3. GIN and GHG Association

Ref. [34] for China established that GIN contributes to the quality of the environment. In South Asian economies, ref. [35] found that GIN improves the environment. Ref. [14] concluded that political risk, green financing, GIN, and social globalization were found to be significantly positively correlated with the quality of the environment, while economic expansion and ecological quality were found to significantly negatively interact. In the top 10 green future economies, ref. [36] concluded that GIN and green growth are greatly enhancing the quality of the environment. The reciprocal relationship between green technologies and green growth suggests that both advance a clean and green environment. Using the NARDL approach for the Saudi Arabian economy, ref. [37] established that the adverse waves of GIN contribute to ecological degradation due to the low level of GIN, while the positive components of GIN remain insignificant. GDP also drives ecological degradation. These findings are also affirmed by [38,39,40]. Based on these assertions, GIN will drive ecological quality.
H3: 
GIN will reduce GHGs.

2.4. GDP and GHG Association

The associations between GDP and GHGs or ecological quality have been widely investigated by various studies. These studies have asserted that GDP can drive ecological degradation [41,42,43,44] or can contribute to a quality environment [23,45]. The conclusion of their results can be explained using the scale, composite, and technique effects [16,46]. In a nutshell, at the scale effect, a country focuses more on its macroeconomic objective of economic expansion, while at the composite and technique effect, newer forms of technologies are adopted, which drive ecological quality. Therefore, based on the structure of the Saudi Arabian economy, this research hypothesizes that GDP will drive ecological degradation.
H4: 
GDP will increase GHGs.

2.5. Gaps in the Literature

Based on the investigations, the following gaps are identified. First, very few studies have investigated the association between SCD and GHGs in Saudi Arabia. Second, the variables included in this research are unique because they are some of the factors that can affect the quality of the environment. Third, various techniques have been used, such as FMOLS, DOLS, MMQR, etc. None of these studies have employed the Frequency Domain Causality and MQQ methods. These are significant contributions to the literature.

3. Data and Methods

3.1. Theoretical Framework

Based on the research questions of this study, ref. [24] expanded on some theories, such as Porter’s Hypothesis (PH), the Pollution Heaven Hypothesis (PHH), and Ecological Modernization Theory (EMT). The function of innovations in boosting competitiveness while preserving ecological sustainability is covered under PH. By cutting waste and implementing low-carbon technology, digitalization helps businesses engaged in production and logistics operate more efficiently. According to the PHH, ecological deterioration occurs when businesses in developed nations relocate their production processes to nations with subpar institutions. Since digitalization is a technology of developed countries that they export to developing economies, it has both positive and negative effects on those countries. When digital monitoring and IoT-based tracking of GVCs’ CO2 are used, it helps to create sustainable GVCs. According to EMT, digitalization through intelligent systems of production, energy optimization, and intelligent monitoring helps to increase resource efficiency and green GVCs. Furthermore, intelligent SC tracking of CO2 enhances recycling and lowers waste. In summary, it can be said that SCD operates through three main channels: efficiency, scale, and structural effects. The efficiency effect occurs when digital technologies such as AI, the IoT, and real-time data analytics improve logistics optimization, reduce the consumption of fossils, minimize inventory waste, and enhance the efficiency of energy, which can lower emissions. This is consistent with EMT. The scale effect arises when digitalization increases production, trade volume, e-commerce activity, and logistics intensity, which may increase energy use and emissions. The structural effect occurs when digitalization gradually reshapes SC networks, industrial composition, and energy use patterns, potentially shifting economies toward cleaner production systems over time.

3.2. Data

The data employed in this research are from 2000Q1 to 2022Q4 using frequency conversion in E-views, and the variables include Supply Chain Digitalization (SCD), Financial Globalization (FIG), Green Innovation (GIN), economic growth (GDP), and Greenhouse Gases (GHGs). GHGs is the dependent variable, while SCD, FIG, GIN, and GDP are the independent variables. The study period starts from 2000Q1 because of the inadequacy of SCD data. The details of the variables and their sources can be seen in Table 1.
Furthermore, the model employed in this research, adopted from [23], is presented in Equation (1) and transformed into logarithms in Equation (2). Logging of variables helps to deal with the problem of outliers and extreme values.
GHGs = SCD + FIG + GIN + GDP
L G H G s t = μ 0 + μ 1 L S C D t + μ 2 L F I G t + μ 3 L G I N t + μ 4 L F D I t + ε t
where μ 1 μ 4 is the coefficient of the independent variables; μ 0 is the constant term; and ε t is the error term at time t.

3.3. Methods

The long- and short-term connections between SCD, FIG, GIN, FDI, and GHGs are investigated using the Autoregressive Distributed Lag (ARDL) bounds testing approach. When variables display mixed integration orders, such as I(0) and I(1), the ARDL method—developed by [51] Pesaran et al. (2001)—is very helpful. It yields reliable and effective estimates even with sample sizes that are comparatively small [52]. The ARDL model is presented in Equation (3).
L G H G s t = 0 + i = 1 p 1 L G H G s t 1 + i = 1 q 2 L S C D t 1 + i = 1 q 3 L G I N t 1 + i = 1 q 4 L F I G t 1 + 5 L G D P t 1 + μ 1 L G H G s t 1 + μ 2 L S C D t 1 + μ 3 L G I N t 1 + μ 4 L F I G t 1 + μ 5 L G D P t 1 + μ E C T + t
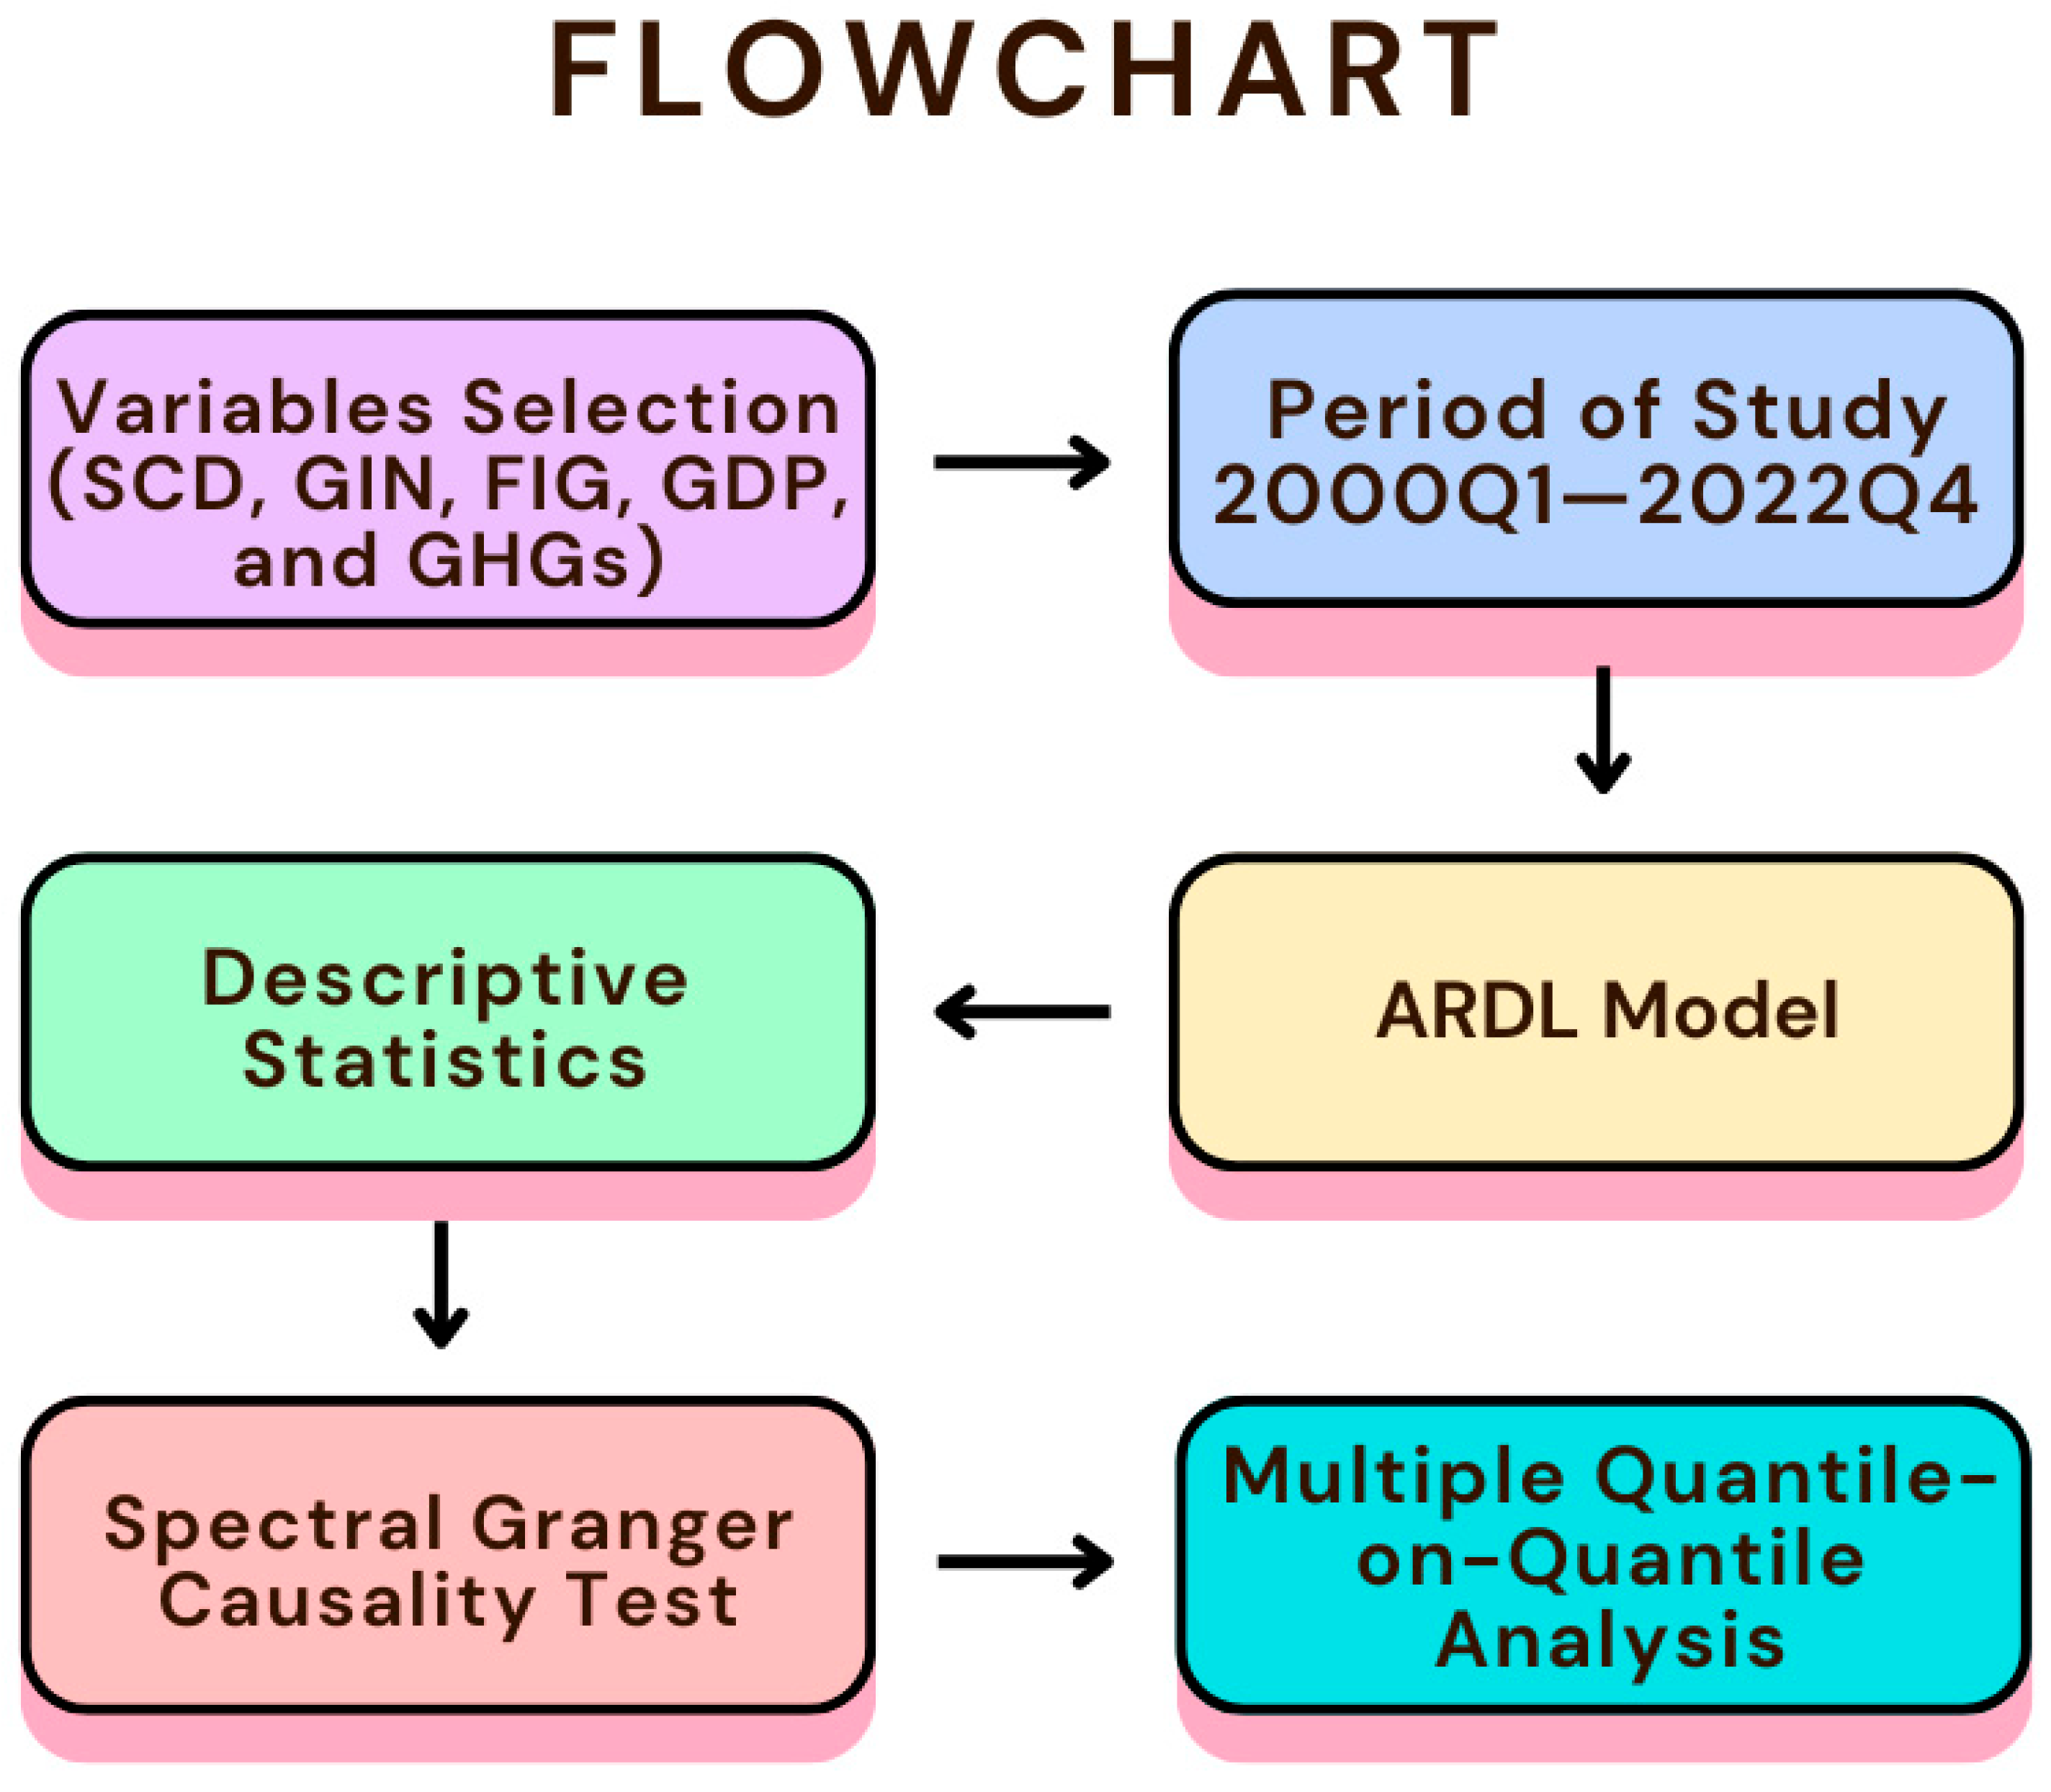
In Equation (3), the coefficients of regressors in the short run are denoted by 1 , 2 , 3 , 4   a n d   5 . The long-run coefficients are denoted by μ 2 , μ 3 , μ 4 , a n d μ 5 . 0 is the intercept or constant term. ECT is the error correction term, while t is the error term at time t. Furthermore, this research also used the Frequency Domain Causality (FDC) test proposed by [53] and the Multiple Quantile-on-Quantile (MQQ) approach. The FDC test assesses the degree of time-series fluctuations [54]. Seasonal changes can be eliminated from the small sample data, attributable to the FDC. Furthermore, the FDC test allows for the detection of causality between factors at short, medium, and long frequencies [55]. On the other hand, the MQQ estimation provides a detailed view of how the combined factors—SCD, GIN, FIG, and GDP—affect GHGs across different distributions of both the dependent and explanatory variables. This study’s workflow can be seen in Figure 1.

4. Analysis and Discussion

4.1. Analysis

4.1.1. Descriptive Statistics

Table 2 shows the description of variables across various parameters. First, examining the mean, it is evident that LGDP has the highest mean (27.04486), while LSCD has the lowest mean (−2.241676). This outcome is also similar to the medium, maximum, and minimum values. Regarding skewness, LSCD, LGIN, and LGDP are skewed adversely, while LGHGs and LFIG are positively skewed. In terms of kurtosis, LGHGs, LSCD, LGIN, and LGDP are platykurtic (<3), which implies thinner tails and fewer outliers. On the other hand, LFIG is leptokurtic (>3). In terms of normal distribution, LGHGs, LSCD, LGIN, and LFIG are normally distributed, while LGDP is not normally distributed. In addition, the Std. Dev for LSCD and LGIN is high, which indicates a moderate level of variability in LSCD and LGIN across all observations. Economically, this means that while LSCD and LGIN are present, their adoption is uneven.

4.1.2. Unit Root Analysis

The unit root analysis, namely ref. [56,57], is presented in Table 3. Firstly, the ADF test shows that LGHGs, LGIN, LFIG, and LGDP are not stationary at I(1), while LSCD is stationary at I(0). For the PP test, LGHGs and LSCD are stationary at I(0), while LGIN, LFIG, and LGDP are stationary at I(1). From these results, a mixed-order integration of I(0) and I(1) is confirmed, which justifies using the ARDL model.

4.1.3. Bounds Test

The bounds test in Table 4 confirms a long-term connection between the variables investigated. As observed, the F-stat value (6.994960) is greater than the I(0) and I(1) values.

4.1.4. ARDL Outcomes

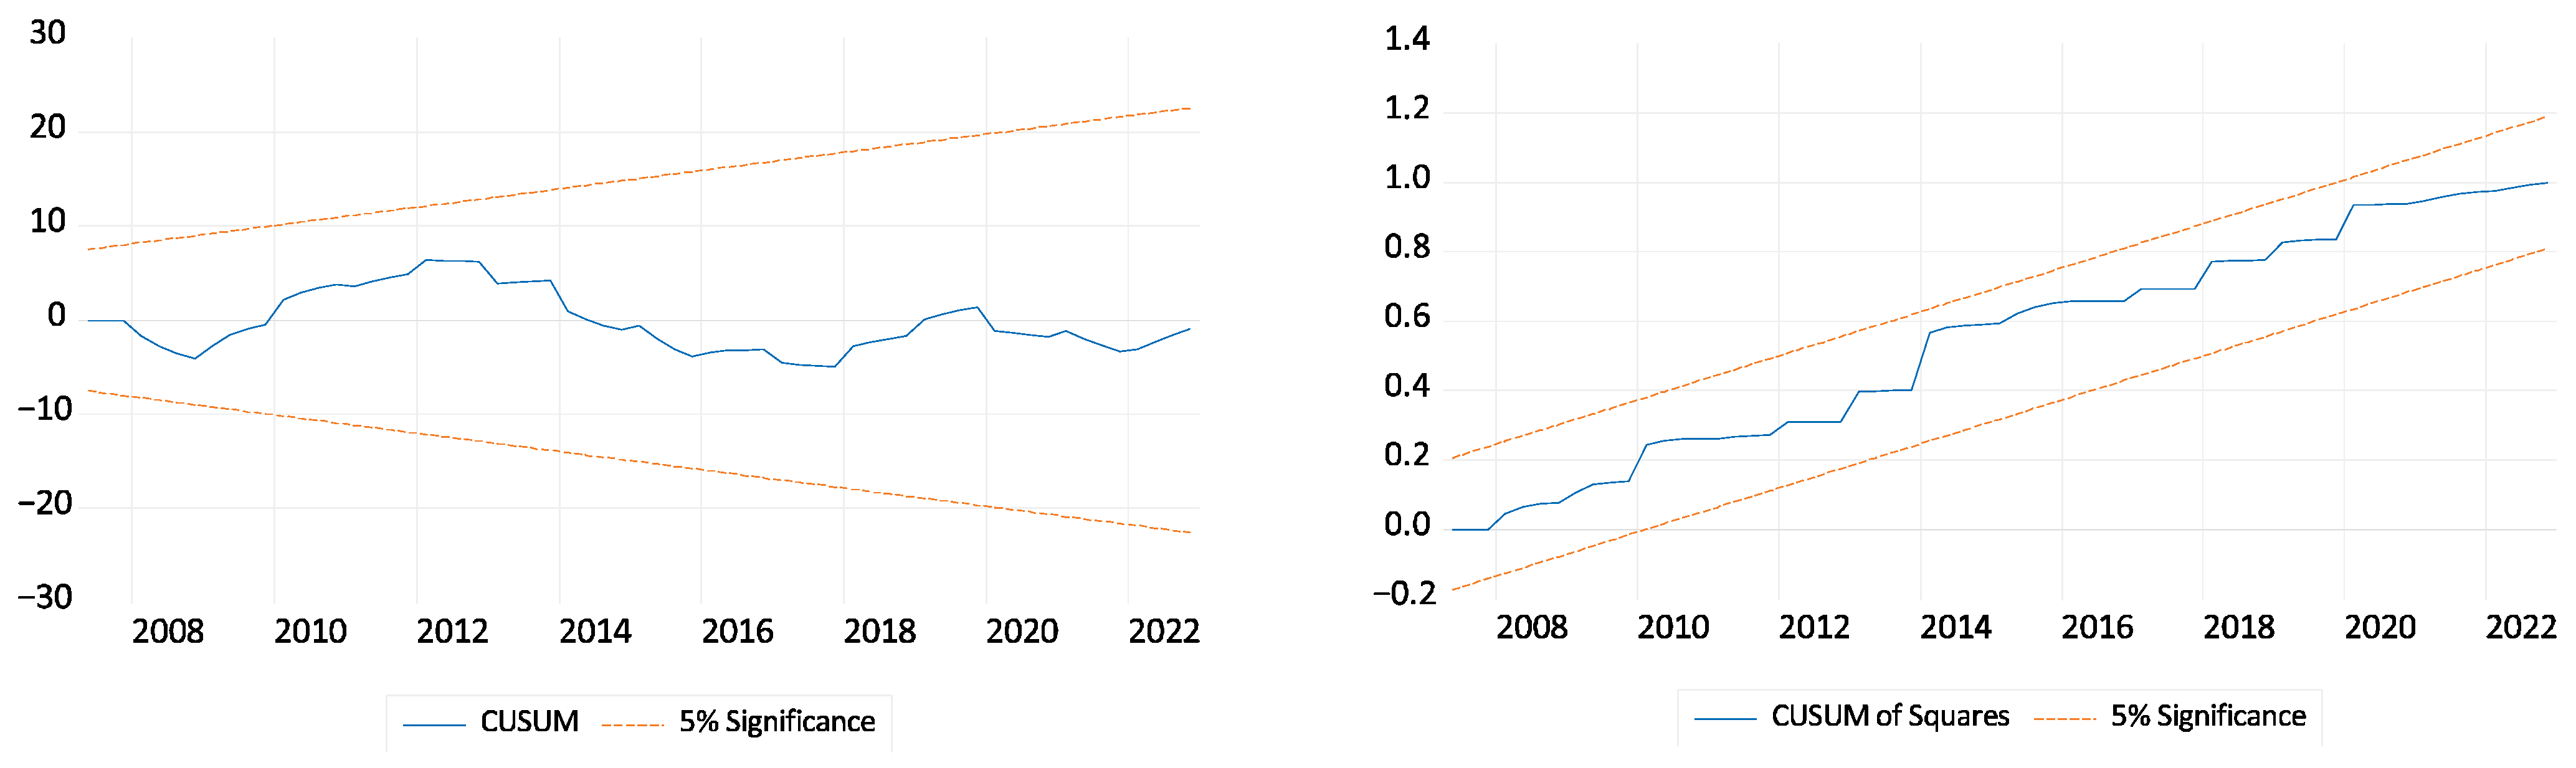
In Table 5, in the long run, LSCD, LFIG, and LGDP increase GHGs, while LGIN reduces GHGs. Empirically, as LSCD increases by 1%, GHGs rise by 0.01%; as LFIG increases by 1%, GHGs increase by 0.05%, although insignificantly. As LGDP rises by 1%, GHGs increase by 0.06%. On the other hand, as LGIN increases by 1%, GHGs reduce by 0.009%. In the short run, as LSCD increases by 1%, GHGs rise by 0.03%; as LFIG increases by 1%, GHGs decline by 0.23%. This is consistent and significant in the first, second, and third lags. LGIN decreases GHGs by 0.01%, while LGDP increases GHGs by 0.23%. In the short and long run, economic expansion had the greatest positive impact on GHGs. These results are reliable because some diagnostic tests were carried out. First, the independent variables used in this research explain 78% of the dependent variable, which is confirmed by the R-squared value. Second, the DW value, which is 1.77, is considered a good value because it falls between 1.5 and 2.5. Third, normality is confirmed, the model has no issue with serial correlation, homoskedasticity is confirmed, and the Ramsey RESET test outcome confirms that the model is of a good fit; i.e., the model structure is adequate or not mis-specified. In addition, the CUSUM and CUSUMQ in Figure 2 confirm the stability of the model because they fall within the 5% significance level.

4.1.5. Frequency Domain Causality

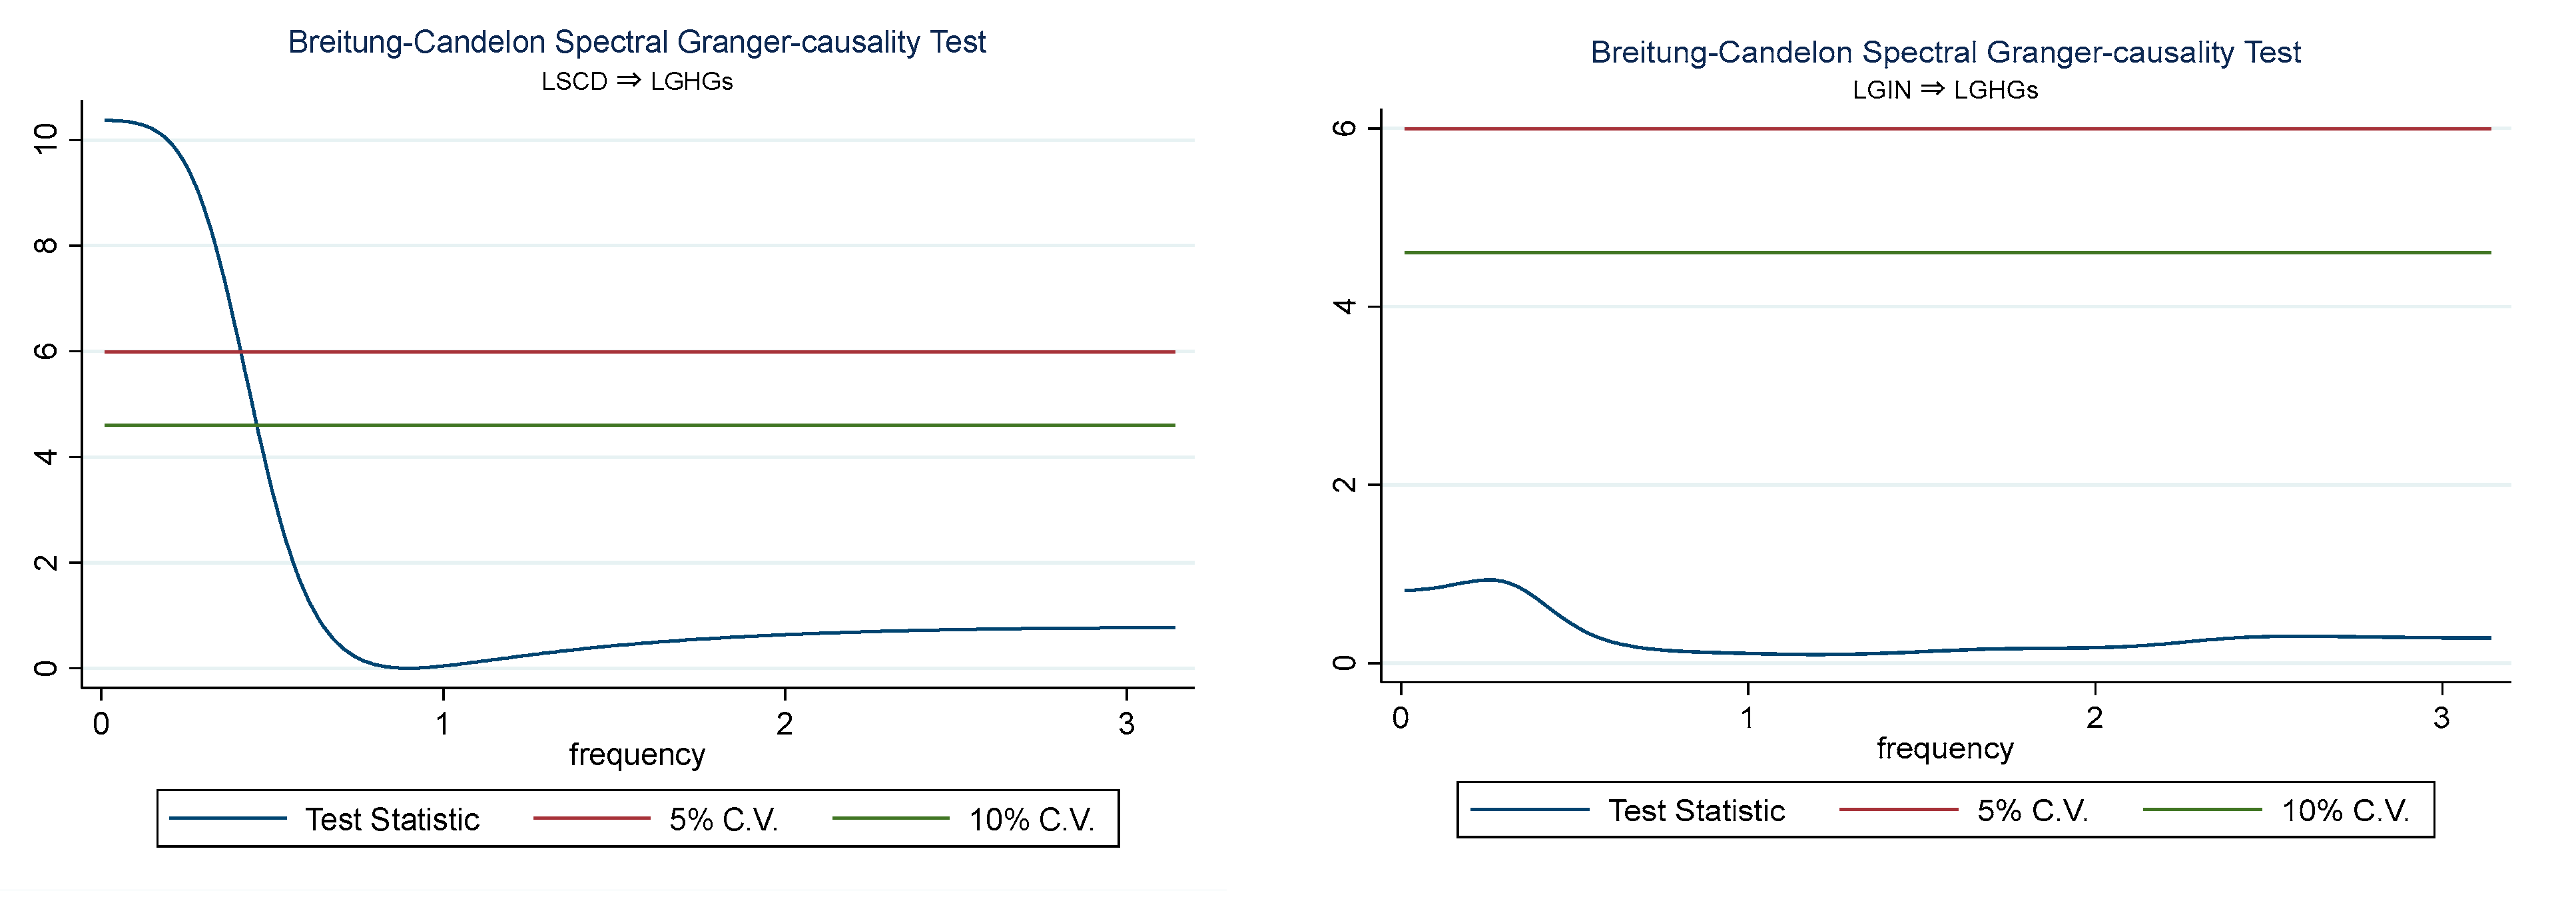
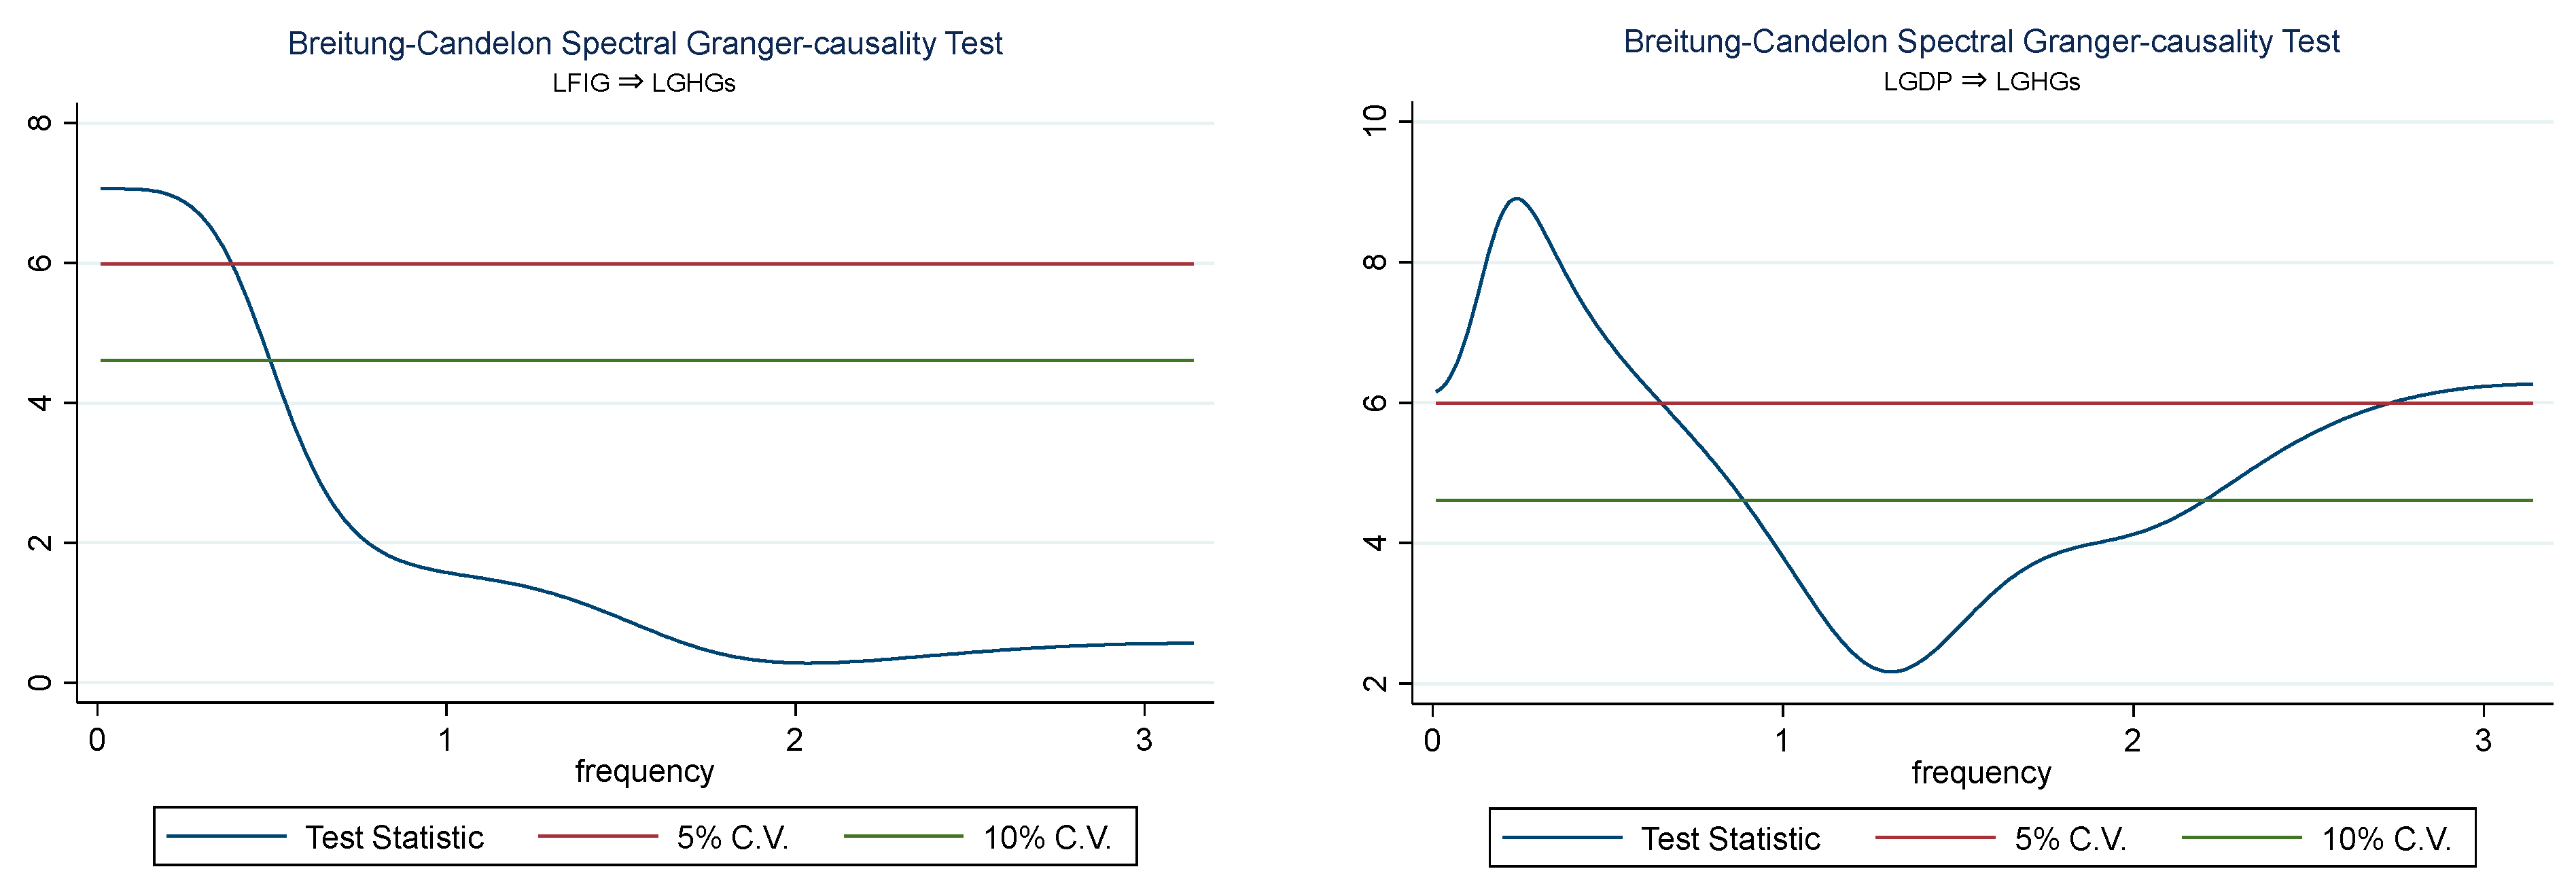
Figure 3 shows that LSCD Granger-causes LGHGs in the long term, while the short-term and medium-term impacts are insignificant. LGIN does not Granger-cause LGHGs in the short, medium, and long term. Lastly, LFIG Granger-causes LGHGs in the long term, while LGDP Granger-causes LGHGs in the short and long term. To confirm causality, the t-statistic should be greater than the confidence values, at either 5% or 10%. If SCD and FIG Granger-cause GHGs in the long term, but not in the short term, it means digitalization and international financial integration do not immediately affect emissions but gradually influence them through structural changes in the economy. In the short and medium term, firms are mainly investing in digital systems and infrastructure, which does not immediately change the use of energy or emissions linked to logistics. However, over time, production processes, logistics networks, and energy consumption patterns are reshaped, which significantly contributes to emissions. For FIG, in the short and medium term, foreign capital flows may mainly support financial market development without instantly changing production or energy use patterns. However, over time, FIG can reshape industrial structure, investment composition, the adoption of technology, and the demand for energy. Furthermore, the non-causal relationship between GIN and GHGs shows that GIN is part of the environmental system, but it is not the main driving force changing emissions over time. Lastly, the causal relationship between GDP and GHGs in the short, medium, and long term shows that GDP can adequately predict GHGs.

4.1.6. Multiple Quantile-on-Quantile (MQQ) Analysis

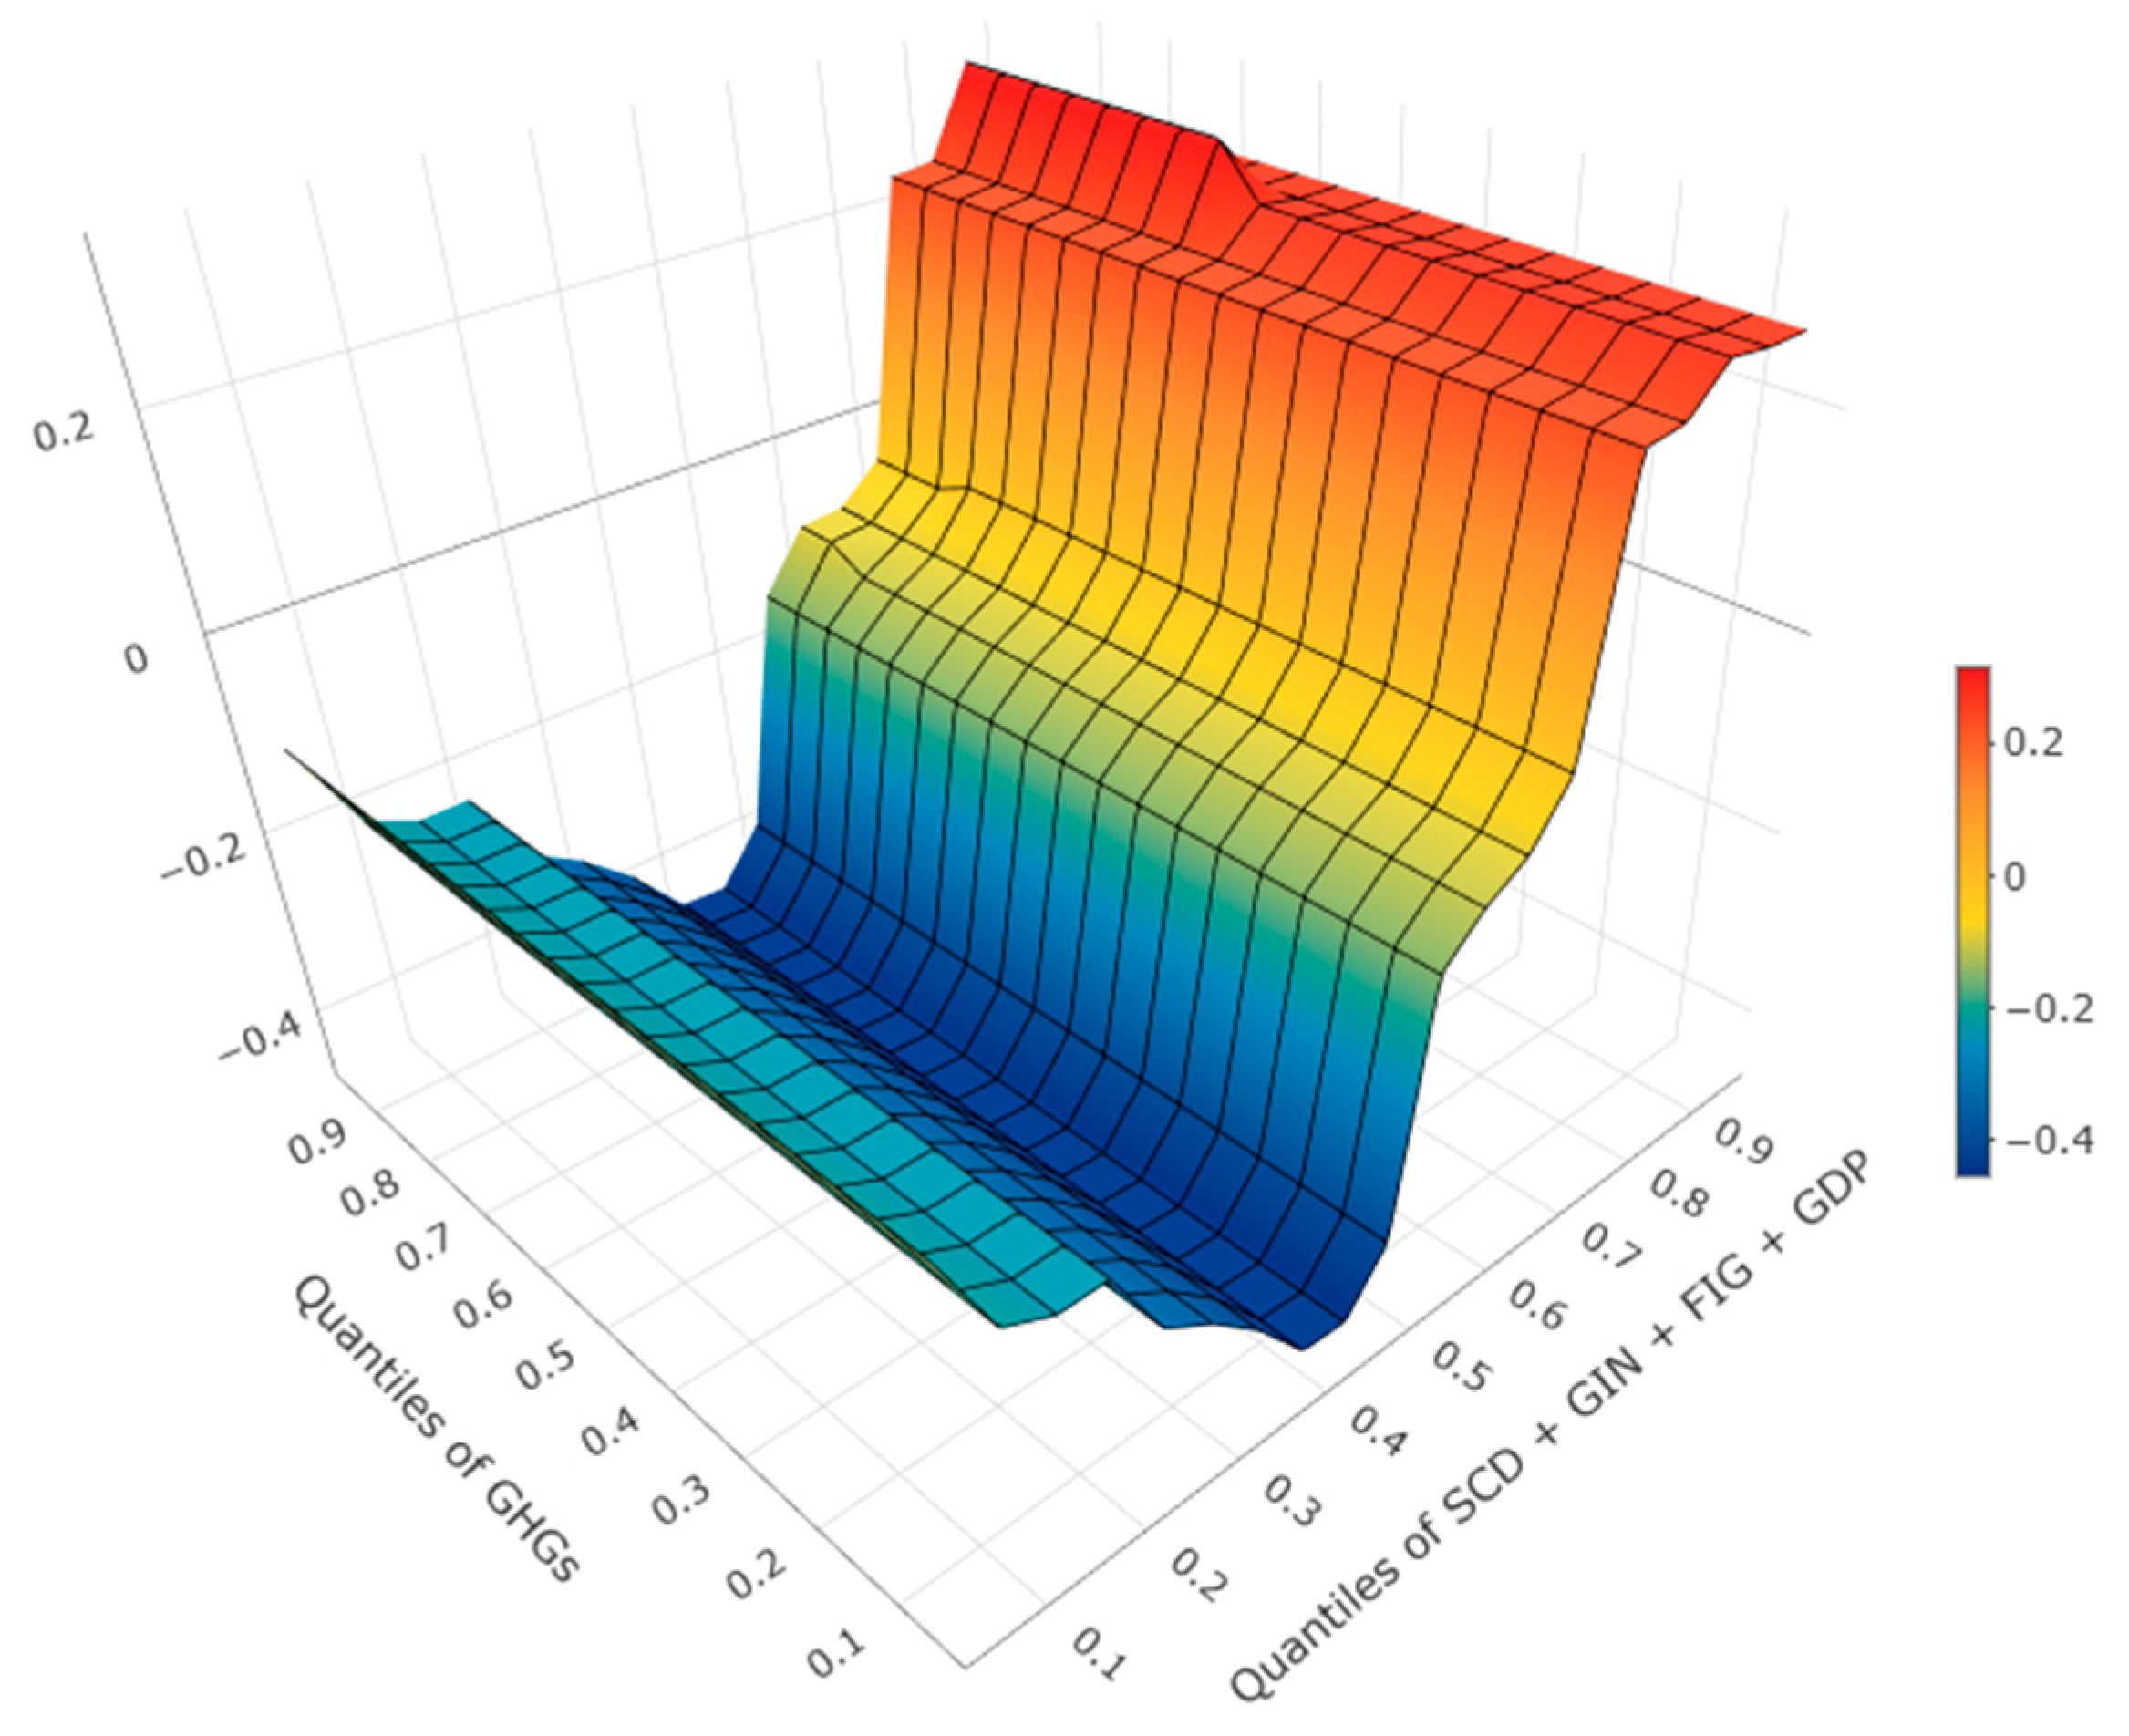
In Figure 4, the MQQ analysis provides a detailed view of how combined factors of SCD, GIN, FIG, and GDP affect GHGs across different distributions of dependent and explanatory variables. As evidenced in the 3D surface, the impact is highly heterogeneous and varies substantially across quantiles. At the lower quantiles of GHGs (0.10–0.30), the combined effect of SCD, GIN, FIG, and GDP tends to be negative, indicating that improvements in digitalized supply chains, innovation capacity, financial openness, and economic performance may contribute to the reduction in GHGs. This negative association is shown in the color blue. However, at the middle (0.40–0.60) and higher (0.70–0.95) quantiles, the dynamics shift. The surface plot demonstrates that the combined drivers exert a positive and increasingly stronger effect on GHGs. The positive association is shown in the colors yellow and red.

4.2. Discussion

First, based on the outcomes in the investigated literature, it has been ascertained that SCD can either spur or reduce GHGs. This research found that SCD increases GHGs in the long and short run. There are some justified reasons for these outcomes. Although digitalization is being regarded as a green solution, an investigation into the Saudi Arabian economy reveals a more complex reality. It is important to note that there are different indicators often used to proxy for SCD. When SCD is proxied by ICT goods exports, the increase in GHGs is driven by the energy-intensive manufacturing and logistics needed to produce and move digital hardware. Manufacturing ICT products such as semiconductors, telecommunication equipment, and electronic components demands a lot of energy, which in Saudi Arabia is still sourced from hydrocarbons. This creates a scale effect, where the expansion of the industrial sector to meet global export demand leads to a net rise in energy consumption that outweighs the efficiency gains provided by the digital tools themselves. This assertion aligns with the studies of [23,58]. On the contrary, other studies found that SCD improves the quality of the environment [17,18,19]. The positive association between SCD and GHGs is confirmed by the scale effect.
Second, as expected and based on the outcomes of other studies, GIN drives environmental quality in the short and long run. Ref. [34] opined that GIN is useful in lowering CO2 because it allows nations to transition their economic structures to more environmentally friendly energy sources. Ref. [59] stated that GIN is the key to minimizing ecological deterioration brought on by the rise in economic activities. Ref. [39] carried out a study on the Saudi Arabian economy and concluded that the adoption of state-of-the-art technologies covered by environmental patents will significantly lower Saudi Arabia’s CO2, which is good for the preservation of the environment. Thus, in the context of climate change and global warming, this is the main potential role of environmental patent-related technologies. Further studies that have confirmed these findings include [14,35,36], while the outcome of [37] was contrary. The negative association between GIN and GHGs is confirmed by Porter’s Hypothesis.
Third, for the impact of FIG on GHGs, a dual impact was found. In the short run, FIG reduces GHGs, while in the long run, the sign changes and becomes insignificant. These results suggest that increased FIG encourages governments, regional businesses, and international corporations to adopt ecologically friendly practices. This strategy offers enough funding for creating the cutting-edge, clean technologies required to increase energy efficiency. Additionally, FIG encourages increased R&D spending, which promotes green technology innovation and a sustainable environment. In a nutshell, FIG attracts foreign capital and green financing. On the other hand, the positive impact of FIG on GHGs occurs because the scale effect outweighs the initial gains of FIG. An adverse FIG–GHG nexus is confirmed by [28], and a positive FIG–GHG association is ascertained by [29,30]. It is also important to state that the long-term insignificant association between FIG and GHGs has some policy implications. The implication is that FIG is not sufficient to drive long-term environmental outcomes. This suggests that without targeted environmental regulations or incentives related to green incentives, financial flows might not systematically influence emissions levels. From a modeling standpoint, the insignificance may indicate that the effect of FIG is indirect or conditional, operating through channels such as energy structure, industrial composition, or green investment rather than directly affecting emissions. Therefore, policymakers should focus on linking FIG with clear ecological objectives, while future models could consider interaction terms or mediating variables to better capture these transmission variables.
Lastly, economic progress can have a negative impact on the quality of the environment since it often leads to an increase in natural resource extraction, levels of pollution, and increased strain on ecosystems. The drive for economic growth may lead to overuse of resources, destruction of habitat, deforestation, and pollution emissions, all of which contribute to climate change, water and air pollution, and biodiversity loss. Rapid urbanization and industrialization linked to economic expansion can also put stress on demand for energy, waste management systems, and infrastructure, exacerbating ecological issues. Although economic expansion can raise the standard of living, its detrimental effects on the environment underscore the significance of implementing sustainable practices and regulations that strike a balance between preservation of the environment and economic progress. This outcome is confirmed by [30,41,42,44] and contrary to the findings of [23,45]. The positive association between GDP and GHGs is also confirmed by the scale effect.

5. Conclusions, Policy Recommendation, and Future Research Suggestions

5.1. Conclusions

This research examines the impact of SCD, GIN, FIG, and GDP on GHGs in Saudi Arabia from 2000Q1 to 2022Q4 employing the ARDL model, FDC approach, and MQQ analysis. The ARDL outcomes showed that in the short run, SCD and GDP spur GHGs, while GIN and FIG reduce GHGs. In the long run, SCD and GDP drive GHGs, while GIN reduces GHGs. The FDC test shows that SCD and FIG Granger-cause GHGs in the long term, while GDP Granger-causes GHGs in the short and long term. The MQQ analysis confirms that at lower quantiles, the combined effect of SCD, GIN, FIG, and GDP on GHGs tends to be negative. However, at the middle and higher quantiles, the effect becomes positive. In addition, theoretically, this study shows how the PH, PHH, and EMT are linked with the quality of the environment, especially from the angle of GIN and SCD. The results are further confirmed by the scale effect and Porter’s Hypothesis.

5.2. Policy Recommendations

  • The Saudi Arabian government/key players should promote the application of rules that improve the sustainability of the environment in the digitalization of SC networks to lessen the detrimental consequences of this process on GHGs. Encouraging firms to make investments in low-carbon technologies, advocating for more independent CO2 audits, and fostering the development of digital solutions targeted at enhancing energy efficiency and cutting waste throughout the value chain are a few examples. On a national level, it is important to state that the digitalization strategies of Saudi Arabia are rooted in a wider structural transformation agenda under Vision 2030 and the Saudi Green Initiative, which aims to reduce CO2, while maintaining economic competitiveness and energy security. The national strategy clearly combines digital transformation with sustainable goals, which include the adoption of clean energy and achieving the net-zero emissions target by 2060. To achieve this, clean energy should be embraced in data centers, cloud infrastructures, and AI computing clusters. This is possible because Saudi Arabia is rapidly increasing its capacity for renewable energy adoption. To ensure these policies are effective, real-time carbon tracking, AI-based emission monitoring, and digital optimization of carbon capture processes are vital.
  • To bring about a meaningful change in the environment, the policymakers in Saudi Arabia should increase the share of green technology in the nation’s technology bundle. It is important to state that a decline in current GIN will probably raise the levels of pollution and jeopardize ecological sustainability. Therefore, an appropriate policy relating to the environment should be initiated and implemented. This can be achieved by providing incentives, such as promoting accessible credit for GIN, which will increase the proportion of green technologies and greatly reduce pollution in the environment.
  • Authorities in Saudi Arabia should encourage environmentally friendly financing and ecologically sustainable investments in order to use FIG as a tool to lessen ecological degradation. Ref. [33] argued that Saudi Arabia should embrace liberalization measures in order to support FIG. This calculated action can promote ecological sustainability objectives and stimulate the economy at the same time.
  • It has been established that economic growth is one of the major macroeconomic objectives. Therefore, the policymakers in Saudi Arabia must ensure that they find ways to drive economic expansion, while at the same time improving the quality of the environment. This can be achieved through the adoption and use of clean energy sources. Renewable energy replenishes itself, does not harm the environment, and is sustainable. Its use can be promoted through incentives and subsidies. At the same time, the use of unclean energy can be discouraged through carbon pricing.

5.3. Limitations and Future Research Suggestions

First, the focus of this research is Saudi Arabia. Thus, other studies can use other countries as a case study, either as a time series or a panel analysis. This will greatly contribute to the debate on the relationship between the variables. Second, this study used ICT goods exports to proxy for SCD, which captures the technology supply side of the economy. Other studies should use other variables to proxy for SCD, which captures the operational side of the economy, specifically the supply chain processes of firms. Thirdly, maintaining the model used in this research, non-parametric methods can be used, such as Bivariate Quantile-on-Quantile Analysis, Wavelet Quantile Regression, and Wavelet Quantile Correlation. Lastly, it has been observed that the link between SCD and natural resource rents needs to be further investigated. This is important because the association between SCD and natural resource rents can demonstrate how digital transformation can significantly influence how natural resources are extracted, managed, and traded within an economy. This investigation should be linked to the theories employed in this research.

Author Contributions

Conceptualization, M.A.K. and A.B.A.; methodology, A.B.A.; validation, A.K.; formal analysis, A.K.; data curation, M.A.K.; writing—original draft preparation, M.A.K.; visualization, A.B.A.; supervision, A.K.; project administration, A.B.A. All authors have read and agreed to the published version of the manuscript.

Funding

This research received no external funding.

Institutional Review Board Statement

Not applicable.

Informed Consent Statement

Not applicable.

Data Availability Statement

The data presented in this study are available on request from the corresponding author.

Conflicts of Interest

The authors declare no conflicts of interest.

Abbreviations

AIArtificial Intelligence
ARDLAutoregressive Distributed Lag
BSQRBootstrap Quantile Regression
CB–SEMCovariance-Based Structural Equation Modeling
CH4Methane Emissions
CO2Carbon dioxide Emissions
CO2eCarbon dioxide Emissions Equivalent
EMTEcological Modernization Theory
ESGEnvironmental, Social, and Governance
FDCFrequency Domain Causality
FDIForeign Direct Investment
GHGsGreenhouse Gases
GTFPGreen Total Factor Productivity
GVCGlobal Value Chain
ICTInformation and Communications Technology
IoTInternet of Things
MLMachine Learning
MMQRMethods of Moments Quantile Regression
MQQMultiple Quantile-on-Quantile
N20Nitrous Oxide Emissions
PHPorter’s Hypothesis
PHHPollution Heaven Hypothesis
QQKRLSQuantile Kernel-Based Regularized Least Squares
SCSupply Chain
SCDSupply Chain Digitalization
VARVector Autoregression

References

  1. Irfan, M.; Chen, Z.; Adebayo, T.S.; Al-Faryan, M.A.S. Socio-economic and technological drivers of sustainability and resources management: Demonstrating the role of information and communications technology and financial development using advanced wavelet coherence approach. Resour. Policy 2022, 79, 103038. [Google Scholar] [CrossRef] [Scilit]
  2. Zhang, X.; Hasan, M.M.; Waris, U. Assessing the nexus between natural resources and government effectiveness: Role of green innovation in shaping environmental sustainability of BRICS nations. Resour. Policy 2024, 93, 105024. [Google Scholar] [CrossRef] [Scilit]
  3. Adebayo, T.S.; Özkan, O. Investigating the influence of socioeconomic conditions, renewable energy and eco-innovation on environmental degradation in the United States: A wavelet quantile-based analysis. J. Clean. Prod. 2024, 434, 140321. [Google Scholar] [CrossRef] [Scilit]
  4. Somoye, O.A.; Akinwande, T.S. Exploring the association between the female gender, education expenditure, renewable energy consumption and CO2 emissions: Empirical evidence from Nigeria. OPEC Energy Rev. 2024, 48, 216–228. [Google Scholar] [CrossRef] [Scilit]
  5. Climate Change Tracker. Saudi Arabia’s Greenhouse Gas Emissions. 2025. Available online: https://climatechangetracker.org/nations/greenhouse-gas-emissions/saudi-arabia (accessed on 21 December 2025).
  6. Parida, V.; Sjödin, D.; Reim, W. Reviewing Literature on Digitalization, Business Model Innovation, and Sustainable Industry: Past Achievements and Future Promises. Sustainability 2019, 11, 391. [Google Scholar] [CrossRef] [Scilit]
  7. Scott, S.; Hughes, P.; Hodgkinson, I.; Kraus, S. Technology adoption factors in the digitization of popular culture: Analyzing the online gambling market. Technol. Forecast. Soc. Change 2019, 148, 119717. [Google Scholar] [CrossRef] [Scilit]
  8. Gobble, M.M. Digitalization, Digitization, and Innovation. Res.-Technol. Manag. 2018, 61, 56–59. [Google Scholar] [CrossRef] [Scilit]
  9. Broccardo, L.; Truant, E.; Dana, L.-P. The interlink between digitalization, sustainability, and performance: An Italian context. J. Bus. Res. 2023, 158, 113621. [Google Scholar] [CrossRef] [Scilit]
  10. Seyedghorban, Z.; Tahernejad, H.; Meriton, R.; Graham, G. Supply chain digitalization: Past, present and future. Prod. Plan. Control 2020, 31, 96–114. [Google Scholar] [CrossRef] [Scilit]
  11. Ageron, B.; Bentahar, O.; Gunasekaran, A. Digital supply chain: Challenges and future directions. Supply Chain. Forum Int. J. 2020, 21, 133–138. [Google Scholar] [CrossRef] [Scilit]
  12. Buyukozkan, G.; Göçer, F. Digital Supply Chain: Literature review and a proposed framework for future research. Comput. Ind. 2018, 97, 157–177. [Google Scholar] [CrossRef] [Scilit]
  13. Cai, H.H.; Yuan, Q.; Tang, S.; Nguyen, Q.; Dai, J.; Zheng, W. The moderating role of green innovation and ecofriendly goods in growth-greenhouse gas Nexus: A new policy dimension. Energy Econ. 2025, 142, 108190. [Google Scholar] [CrossRef] [Scilit]
  14. Kirikkaleli, D.; Adebayo, T.S. Political risk and environmental quality in Brazil: Role of green finance and green innovation. Int. J. Financ. Econ. 2022, 29, 1205–1218. [Google Scholar] [CrossRef] [Scilit]
  15. Kihombo, S.; Vaseer, A.I.; Ahmed, Z.; Chen, S.; Kirikkaleli, D.; Adebayo, T.S. Is there a tradeoff between financial globalization, economic growth, and environmental sustainability? An advanced panel analysis. Environ. Sci. Pollut. Res. 2022, 29, 3983–3993. [Google Scholar] [CrossRef] [Scilit]
  16. Grossman, G.; Krueger, A. Environmental Impacts of a North American Free Trade Agreement; National Bureau of Economic Research: Cambridge, MA, USA, 1991. [Google Scholar] [CrossRef] [Scilit]
  17. Jiang, H.; He, B.; Mubarik, M.S.; Shi, S. Role of supply chain digitalization and global supply chain in decarbonization of natural resources sector supply chain. J. Environ. Manag. 2024, 370, 122689. [Google Scholar] [CrossRef] [Scilit] [PubMed]
  18. Xue, R.; Ong, T.S.; Di Vaio, A. Environmentally Sustainable Development: The Role of Supply Chain Digitalization in Firms’ Green Productivity. Sustain. Dev. 2025, 33, 7807–7825. [Google Scholar] [CrossRef] [Scilit]
  19. Tian, L.; Tian, W.; Guo, M. Can supply chain digitalization open the way to sustainable development? Evidence from corporate ESG performance. Corp. Soc. Responsib. Environ. 2025, 32, 2332–2346. [Google Scholar] [CrossRef] [Scilit]
  20. Pilatin, A.; Radulescu, M.; Barut, A.; Görgün, M.R.; Çiftçi, H.; Alofaysan, H. Global Supply Chain Distribution and Natural Resources in the Era of Digitalization. Sustainability 2025, 17, 5843. [Google Scholar] [CrossRef] [Scilit]
  21. Rodrigue, J.-P. The Geography of Transport Systems; Routledge: New York, NY, USA, 2020. [Google Scholar]
  22. Subramaniam, R.C.; Ruwet, M.; Boschetti, F.; Fielke, S.; Fleming, A.; Dominguez-Martinez, R.M.; Plagányi, É.; Schrobback, P.; Melbourne-Thomas, J. The socio-ecological resilience and sustainability implications of seafood supply chain disruption. Rev. Fish Biol. Fish. 2023, 33, 1129–1154. [Google Scholar] [CrossRef] [Scilit]
  23. Wu, W.; Bi, S.; Zhan, Y.; Gu, X. Supply chain digitalization and energy efficiency (gas and oil): How do they contribute to achieving carbon neutrality targets? Energy Econ. 2025, 142, 108140. [Google Scholar] [CrossRef] [Scilit]
  24. Zhang, Y.; Khan, N.U.; Cai, H.H.; Tang, S.; Bousrih, J. Sowing the seeds of sustainability: Digitalization, renewable energy, and carbon emissions in emerging economies’ global value chains. J. Environ. Manag. 2025, 393, 127119. [Google Scholar] [CrossRef] [Scilit]
  25. Nuţă, F.M.; Sharafat, A.; Abban, O.J.; Khan, I.; Irfan, M.; Nuţă, A.C.; Dankyi, A.B.; Asghar, M. The relationship among urbanization, economic growth, renewable energy consumption, and environmental degradation: A comparative view of European and Asian emerging economies. Gondwana Res. 2024, 128, 325–339. [Google Scholar] [CrossRef] [Scilit]
  26. Qamri, G.M.; Ali, S.; Bashir, T.; Saeedi, M.A. Re-assessing the role of trade policy and import substitution industrialization: Empirical evidence from Pakistan. Pak. J. Commer. Soc. Sci. (PJCSS) 2024, 18, 1008–1031. [Google Scholar] [CrossRef] [Scilit]
  27. Zheng, M.; Zhang, X. Digitalization and renewable energy development: Analysis based on cross-country panel data. Energy 2025, 319, 135077. [Google Scholar] [CrossRef] [Scilit]
  28. Adebayo, T.S. Impact of financial globalization on environmental degradation in the E7 countries: Application of the hybrid nonparametric quantile causality approach. Probl. Ekorozwoju 2022, 17, 148–160. [Google Scholar] [CrossRef] [Scilit]
  29. Adebayo, T.S.; Saeed Meo, M.; Eweade, B.S.; Özkan, O. Examining the effects of solar energy Innovations, information and communication technology and financial globalization on environmental quality in the united States via Quantile-On-Quantile KRLS analysis. Sol. Energy 2024, 272, 112450. [Google Scholar] [CrossRef] [Scilit]
  30. Zhang, Y.; Radmehr, R.; Baba Ali, E.; Samour, A. Natural resources, financial globalization, renewable energy, and environmental quality: Novel findings from top natural resource abundant countries. Gondwana Res. 2025, 145, 170–182. [Google Scholar] [CrossRef] [Scilit]
  31. Du, J.; Rasool, Y.; Kashif, U. Asymmetric Impacts of Environmental Policy, Financial, and Trade Globalization on Ecological Footprints: Insights from G9 Industrial Nations. Sustainability 2025, 17, 1568. [Google Scholar] [CrossRef] [Scilit]
  32. Ahmed, Z.; Pata, U.K. Unveiling the influence of environmental taxes, socioeconomic conditions, renewable energy, and financial globalization on environmental sustainability. Nat. Resour. Forum 2025, 49, 1037–1056. [Google Scholar] [CrossRef] [Scilit]
  33. Ali, M.; Samour, A.; Soomro, S.A.; Khalid, W.; Tursoy, T. A step towards a sustainable environment in top-10 nuclear energy consumer countries: The role of financial globalization and nuclear energy. Nucl. Eng. Technol. 2025, 57, 103142. [Google Scholar] [CrossRef] [Scilit]
  34. Guo, J.; Zhou, Y.; Ali, S.; Shahzad, U.; Cui, L. Exploring the role of green innovation and investment in energy for environmental quality: An empirical appraisal from provincial data of China. J. Environ. Manag. 2021, 292, 112779. [Google Scholar] [CrossRef] [Scilit]
  35. Wen, J.; Ali, W.; Hussain, J.; Khan, N.A.; Hussain, H.; Ali, N.; Akhtar, R. Dynamics between green innovation and environmental quality: New insights into South Asian economies. Econ. Politica 2022, 39, 543–565. [Google Scholar] [CrossRef] [Scilit]
  36. Wei, S.; Jiandong, W.; Saleem, H. The impact of renewable energy transition, green growth, green trade and green innovation on environmental quality: Evidence from top 10 green future countries. Front. Environ. Sci. 2023, 10, 1076859. [Google Scholar] [CrossRef] [Scilit]
  37. Islam, M.S. Linking green innovation to environmental quality in Saudi Arabia: An application of the NARDL approach. Environ. Dev. Sustain. 2025, 27, 19741. [Google Scholar] [CrossRef] [Scilit]
  38. Alshammari, K.H.; Alshammari, A.F. Green Innovation and Its Effects on Innovation Climate and Environmental Sustainability: The Moderating Influence of Green Abilities and Strategies. Sustainability 2023, 15, 15898. [Google Scholar] [CrossRef] [Scilit]
  39. Kahia, M.; Jarraya, B.; Kahouli, B.; Omri, A. Do Environmental Innovation and Green Energy Matter for Environmental Sustainability? Evidence from Saudi Arabia (1990–2018). Energies 2023, 16, 1376. [Google Scholar] [CrossRef] [Scilit]
  40. Kahia, M.; Jarraya, B.; Kahouli, B.; Omri, A. The Role of Environmental Innovation and Green Energy Deployment in Environmental Protection: Evidence from Saudi Arabia. J. Knowl. Econ. 2024, 15, 337–363. [Google Scholar] [CrossRef] [Scilit]
  41. Agboola, M.O.; Bekun, F.V.; Joshua, U. Pathway to environmental sustainability: Nexus between economic growth, energy consumption, CO2 emission, oil rent and total natural resources rent in Saudi Arabia. Resour. Policy 2021, 74, 102380. [Google Scholar] [CrossRef] [Scilit]
  42. Burkart, S.; Mejía, D.; Junca, J.J. Estimating the environmental Kuznets curve for cattle production and environmental degradation in Latin America, Africa, and Southeast Asia. Sci. Rep. 2025, 15, 33613. [Google Scholar] [CrossRef] [Scilit]
  43. Omri, A.; Euchi, J.; Hasaballah, A.H.; Al-Tit, A. Determinants of environmental sustainability: Evidence from Saudi Arabia. Sci. Total Environ. 2019, 657, 1592–1601. [Google Scholar] [CrossRef] [Scilit] [PubMed]
  44. Xiu, G. Analyzing the impact of supply chain and digitalization in the Chinese economy: What is the role of energy consumption, government expenditure, and industrialization in environmental pollution? Energy Econ. 2025, 145, 108412. [Google Scholar] [CrossRef] [Scilit]
  45. Ullah, O.; Zeb, A.; Shuhai, N.; Din, N.U. Exploring the role of green investment, energy intensity and economic complexity in balancing the relationship between growth and environmental degradation. Clean Technol. Environ. Policy 2025, 27, 2119–2136. [Google Scholar] [CrossRef] [Scilit]
  46. Panayotou, T. Empirical Tests and Policy Analysis of Environmental Degradation at Different Stages of Economic Development; International Labour Organization: Geneva, Switzerland, 1993. [Google Scholar]
  47. OWD. Per Capita Greenhouse Gas Emissions Including Land Use. 2025. Available online: https://ourworldindata.org/grapher/per-capita-ghg-emissions?tab=table&country=~SAU&mapSelect=~SAU (accessed on 21 December 2025).
  48. World Bank. World Bank Open Data. 2025. Available online: https://data.worldbank.org/ (accessed on 21 December 2025).
  49. KOF. KOF Globalization Index. 2025. Available online: https://kof.ethz.ch/en/forecasts-and-indicators/indicators/kof-globalisation-index.html (accessed on 21 December 2025).
  50. OECD. Patent–Technology Difussion. 2025. Available online: https://data-explorer.oecd.org/vis?df[ds]=DisseminateFinalDMZ&df[id]=DSD_PAT_DIFF%40DF_PAT_DIFF&df[ag]=OECD.ENV.EPI&dq=SAU.A.GOODS..&pd=%2C&to[TIME_PERIOD]=false&vw=tb (accessed on 21 December 2025).
  51. Pesaran, M.H.; Shin, Y.; Smith, R.J. Bounds testing approaches to the analysis of level relationships. J. Appl. Econ. 2001, 16, 289–326. [Google Scholar] [CrossRef] [Scilit]
  52. Narayan, P.K. The saving and investment nexus for China: Evidence from cointegration tests. Appl. Econ. 2005, 37, 1979–1990. [Google Scholar] [CrossRef] [Scilit]
  53. Breitung, J.; Candelon, B. Testing for short- and long-run causality: A frequency-domain approach. J. Econom. 2006, 132, 363–378. [Google Scholar] [CrossRef] [Scilit]
  54. Adebayo, T.S. Revisiting the EKC hypothesis in an emerging market: An application of ARDL-based bounds and wavelet coherence approaches. SN Appl. Sci. 2020, 2, 1945. [Google Scholar] [CrossRef] [Scilit]
  55. Buonanno, P.; Carraro, C.; Galeotti, M. Endogenous induced technical change and the costs of Kyoto. Resour. Energy Econ. 2003, 25, 11–34. [Google Scholar] [CrossRef] [Scilit]
  56. Dickey, D.A.; Fuller, W.A. Distribution of the Estimators for Autoregressive Time Series with a Unit Root. J. Am. Stat. Assoc. 1979, 74, 427–431. [Google Scholar] [CrossRef] [Scilit]
  57. Phillips, P.C.B.; Perron, P. Testing for a unit root in time series regression. Biometrika 1988, 75, 335–346. [Google Scholar] [CrossRef]
  58. Waris, U.; Cui, L.; Abbas, S.; Shoaib, M. How has climate change been affected by electricity digitalization, supply chain digitalization, and green technologies? Building a path to environmentally sustainable development in E7 nations. Energy Econ. 2025, 145, 108428. [Google Scholar] [CrossRef] [Scilit]
  59. Balsalobre-Lorente, D.; Shahbaz, M.; Roubaud, D.; Farhani, S. How economic growth, renewable electricity and natural resources contribute to CO2 emissions? Energy Policy 2018, 113, 356–367. [Google Scholar] [CrossRef] [Scilit]
Figure 1. Flowchart.
Sustainability 18 02527 g001
Figure 2. CUSUM and CUSUMQ.
Sustainability 18 02527 g002
Figure 3. Frequency Domain Causality.
Sustainability 18 02527 g003aSustainability 18 02527 g003b
Figure 4. Multiple Quantile-on-Quantile Analysis.
Sustainability 18 02527 g004
Table 1. Description of variables.
SymbolsVariablesDescriptionSource
GHGsGreenhouse GasesPer capita greenhouse gas emissions, including land use[47]
SCDSupply Chain DigitalizationICT goods exports (% of total goods exports)[48]
FIGFinancial GlobalizationIndex[49]
GINGreen InnovationClimate change mitigation technologies in the production or processing of goods—measured in patents[50]
GDPEconomic GrowthGDP (constant 2015 US$)[48]
Table 2. Descriptive statistics.
LGHGSLSCDLGINLFIGLGDP
Mean3.222052−2.2416762.6796454.08226427.04486
Median3.224896−2.2072752.4849074.07753727.09489
Maximum3.295918−0.9162914.3438054.20469327.47939
Minimum3.156214−3.5065580.6931473.98898426.60568
Std. Dev.0.0403330.7453230.8920810.0480830.269689
Skewness0.145879−0.103683−0.0335640.415257−0.240549
Kurtosis2.1879562.0988722.8487213.2627421.756477
Jarque–Bera2.8540623.2776240.1050012.9086846.814922
Probability0.2400210.1942110.9488540.2335540.033125
Observations9292929292
Table 3. Unit root analysis.
ADFPP
VariablesI(0)I(1)I(0)I(1)Decision
LGHGs−2.596259−8.003159 *−3.855225 **−9.361173 *I(1)
LSCD−1.699249 ***−8.928230 *−1.678240 ***−8.927869 *I(0)
LGIN−2.821063−9.329327 *−3.038318−9.329327 *I(1)
LFIG−2.311795−9.384518 *−2.393671−9.384518 *I(1)
LGDP−2.952589−3.061235 **−2.661780−11.52021 *I(1)
* denotes p < 0.01, ** denotes p < 0.05 and *** denotes p < 0.10.
Table 4. Bounds test.
ARDL Bounds Test
Test StatisticValueSignificanceI(0)I(1)
F-statistic6.99496010%2.23.09
5%2.563.49
2.50%2.883.87
1%3.294.37
Table 5. ARDL outcomes.
Long-Run Analysis
VariableCoefficientStd. Errort-StatisticProb.
LSCD0.0140740.0077941.8057430.0751
LFIG0.0518350.0732090.7080400.4812
LGIN−0.0096330.003585−2.6870920.0089
LGDP0.0629000.0196053.2083720.0020
C1.3627830.6545472.0820250.0409
Short-run analysis
VariableCoefficientStd. Errort-StatisticProb.
D(LGHGS(−1))0.3411170.1004523.3958150.0011
D(LGHGS(−2))0.3407100.1004063.3933170.0011
D(LGHGS(−3))0.3402820.1003643.3904640.0011
D(LSCD)0.0309260.0122762.5191530.0140
D(LFIG)−0.2307780.109659−2.1045050.0388
D(LFIG(−1))−0.1871150.104342−1.7932870.0771
D(LFIG(−2))−0.1875660.104362−1.7972550.0765
D(LFIG(−3))−0.1880400.104383−1.8014370.0758
D(LGIN)−0.0156110.005431−2.8743760.0053
D(LGDP)0.2301740.0787692.9221210.0046
CointEq(−1) *−0.6940740.103600−6.6995760.0000
R-squared0.798560
Durbin–Watson (DW)1.773942
Residual DiagnosticsF-Statp-value
Normality test5.7969320.055108
Serial Correlation LM test2.1218590.1275
Heteroskedasticity Test2.0410040.1568
Ramsey Reset Test0.2291170.6337
* denotes long-run equilibrium value.
Disclaimer/Publisher’s Note: The statements, opinions and data contained in all publications are solely those of the individual author(s) and contributor(s) and not of MDPI and/or the editor(s). MDPI and/or the editor(s) disclaim responsibility for any injury to people or property resulting from any ideas, methods, instructions or products referred to in the content.