Article

KASVA: A Variational Deep Learning Framework for Measuring Regional Sustainability and Inequality


by
Cuneyt Furkan Celiktas
1,2,
Fatih Cure
3 and
Muhammed Cavus
4,5,6,*
1
Ataturk Strategic Studies and Graduate Institute, National Defence University Rectorate, Istanbul 34334, Türkiye
2
Faculty of Humanities and Social Sciences, Newcastle University, Newcastle Upon Tyne NE1 7RU, UK
3
Faculty of Economics and Administrative Science, Zonguldak Bülent Ecevit University, Zonguldak 67100, Türkiye
4
School of Engineering, Physics and Mathematics, Northumbria University, Newcastle Upon Tyne NE1 8SA, UK
5
Department of Engineering, Durham University, Durham DH1 3LE, UK
6
School of Engineering, Iskenderun Technical University, Iskenderun 31200, Türkiye
*
Author to whom correspondence should be addressed.
Sustainability 2026, 18(4), 1911; https://doi.org/10.3390/su18041911
Submission received: 21 January 2026 / Revised: 4 February 2026 / Accepted: 9 February 2026 / Published: 12 February 2026

Abstract

Assessing regional sustainability is challenged by the multidimensional, non-linear, and highly correlated nature of socio-economic and environmental indicators. Conventional composite indices often rely on linear aggregation and fixed weighting schemes, which can obscure structural interdependencies and amplify scale dominance. To address these limitations, this study proposes the Knowledge-Aware Sustainability Variational Assessment (KASVA), a deep-learning-based framework that integrates variational representation learning, latent-space clustering, and robustness analysis to construct a composite sustainability index. Using a comprehensive set of demographic, economic, social, and environmental indicators for Turkish Nomenclature of Territorial Units for Statistics level 2 (NUTS2) regions, KASVA learns a compact latent representation that captures non-linear interactions among indicators exhibiting strong multicollinearity, with pairwise correlations frequently exceeding 0.8. The resulting Global Territorial Variational Sustainability Index (GTVSI) reveals substantial regional heterogeneity and pronounced spatial inequality. Latent-space clustering identifies distinct regional sustainability regimes, with silhouette scores predominantly in the range 0.4–0.5, indicating stable and well-separated clusters. Robustness analysis based on 1000 bootstrap resamples demonstrates high ranking stability, with a median Spearman rank correlation of approximately 0.69 and the majority of correlations exceeding 0.6. Compared with conventional equal-weight and principal component analysis (PCA)-based indices, the proposed framework yields more coherent and stable regional rankings. Overall, KASVA provides a data-driven, robust approach to sustainability assessment, offering improved interpretability and reliability for regional policy analysis and evidence-based decision-making.

1. Introduction

Assessing regional sustainability remains a fundamental yet unresolved challenge for policymakers and researchers. Existing regional sustainability assessment frameworks predominantly rely on linear aggregation, fixed weighting schemes, or dimension-reduction techniques that implicitly assume indicator independence and linear relationships [1]. Such assumptions are problematic in practice, as regional sustainability indicators are inherently multidimensional, highly correlated, and characterised by non-linear interactions across demographic, economic, social, and environmental domains. As a result, conventional composite indices may obscure structural interdependencies, distort regional comparisons, and yield rankings that are sensitive to methodological choices rather than underlying sustainability conditions. Against this background, the core research problem addressed in this study is how to construct a robust and interpretable regional sustainability assessment framework that captures non-linear interactions, mitigates multicollinearity, and produces stable, policy-relevant regional rankings without imposing arbitrary weighting assumptions [2].
Sustainable regional development has emerged as a central policy priority as governments seek to advance the United Nations’ Agenda 2030 while ensuring that no place or community is left behind. Historically, sustainability objectives were frequently subordinated to economic growth imperatives, often at the expense of social well-being and ecological integrity [1]. More recently, however, there has been a growing consensus that economic competitiveness, social inclusion, and environmental stewardship are mutually reinforcing dimensions of development that must be addressed in an integrated manner.
This evolving perspective is increasingly reflected in contemporary policy frameworks. Within the European Union, cohesion policy and associated financial instruments, notably the European Regional Development Fund (ERDF), explicitly link regional investment strategies to Sustainable Development Goal (SDG) priorities, emphasising green, inclusive, and territorially balanced development pathways [2]. Empirical research further highlights that such place-based approaches are essential for addressing persistent disparities between leading and lagging regions, often described as “left-behind places”, where structural constraints continue to limit long-term sustainability outcomes [3].
A similar emphasis is evident in Turkey’s development planning, which acknowledges enduring territorial inequalities and underscores the need for coordinated, region-sensitive strategies to ensure that climate transition and growth-oriented policies generate inclusive benefits across regions [4,5]. Collectively, these policy developments underscore the growing importance of robust sustainability assessment at the regional scale.
Measuring sustainability at the regional level is particularly critical for evidence-based policymaking, as many development constraints, service capacities, and environmental pressures are territorially embedded. Recent global monitoring exercises reveal that progress towards the SDGs remains uneven and vulnerable to compounding shocks, reinforcing the need for reliable indicators that support prioritization and targeted intervention [6,7,8,9]. Beyond national averages, sub-national disparities frequently persist or widen, motivating sustainability assessment frameworks capable of identifying territorially concentrated vulnerabilities and “leave-no-one-behind” risks [10,11,12].
Composite indices remain a widely used tool for summarising multidimensional sustainability performance into interpretable scores and rankings. They facilitate benchmarking, communication, and the translation of complex indicator systems into decision-support evidence [6,7,8,9,13,14]. Nevertheless, composite sustainability indices face well-documented methodological challenges, including heterogeneity in indicator units and dispersion, multicollinearity and cross-domain dependencies, and sensitivity of rankings to normalization and aggregation choices [13,15,16]. These challenges are particularly pronounced in regional applications, where demographic scale, economic structure, and environmental intensity can vary substantially across territories.
In parallel, machine learning (ML) and deep learning (DL) methods have gained prominence in sustainability research due to their ability to model complex, non-linear relationships and extract latent structure from high-dimensional indicator spaces [17,18,19]. Representation learning approaches, including variational autoencoders (VAEs), are especially promising for composite index construction, as they can compress correlated indicators into lower-dimensional embeddings while preserving non-linear dependencies [20,21,22]. However, sustainability indices derived from DL models raise important concerns regarding interpretability and robustness, as black-box architectures may undermine transparency, and rankings can be sensitive to modelling choices [23,24,25,26,27].
To address these limitations, this study proposes Knowledge-Aware Sustainability Variational Assessment (KASVA), a deep-learning-based framework that (i) learns non-linear latent representations of regional sustainability through a variational encoder, (ii) constructs a bounded composite sustainability index from the latent space, (iii) identifies distinct regional sustainability regimes via latent-space clustering, and (iv) evaluates ranking robustness using bootstrap-based stability diagnostics. The empirical application focuses on Turkish NUTS2 regions, where longstanding territorial disparities render sustainability assessment and regional development diagnostics particularly salient [28]. By integrating representation learning with explicit robustness analysis, KASVA aims to provide a composite sustainability index that is both methodologically rigorous and directly relevant for regional policy analysis.
The choice of modelling approach in sustainability index construction should be guided by the structural properties of the underlying data rather than methodological novelty. Linear techniques such as principal component analysis or factor analysis rely on assumptions of linear dependence and orthogonality that may be violated in regional sustainability datasets characterised by strong multicollinearity, scale heterogeneity, and non-linear cross-domain interactions. When these conditions are present, linear aggregation or dimensionality reduction may distort indicator relationships and compress meaningful regional differences.

1.1. Literature Review

Beyond its operationalization through indicators and indices, sustainability has been extensively theorised as a multidimensional, contested, and normatively laden concept. Foundational contributions emphasise that sustainability encompasses not only current economic, social, and environmental conditions, but also long-term resilience, adaptive capacity, and the ability of socio-technical systems to transition in response to structural change and external shocks. From this perspective, sustainability measurement necessarily involves normative choices regarding what dimensions are prioritised, how trade-offs are managed, and which forms of development are considered desirable [6,7].
Resilience-oriented and socio-technical transition frameworks further challenge static representations of sustainability by highlighting path dependence, lock-in effects, and the co-evolution of technologies, institutions, and social practices. These approaches underscore the limitations of purely cross-sectional indices and motivate the need for measurement frameworks that are explicit about their conceptual scope and assumptions [8,9].
Recent SDG progress reports stress that sustainability outcomes remain uneven and that reliable indicators are required for monitoring and course correction [6,7,8,9]. Complementary global scoreboards, such as the SDR series, operationalise composite measurement as a practical monitoring approach, offering annual assessments and comparable cross-entity scoring [9,12,14]. These global initiatives have stimulated regional and sectoral adaptations, including European monitoring and regional dashboards that emphasise place-based priorities and heterogeneous development pathways [11,29,30].
Composite indices provide advantages in interpretability and communication but are sensitive to indicator selection, scaling, weighting, and aggregation. Official guidance and auditing practice highlight the need for transparency and robustness reporting, especially when indices are used for rankings and policy prioritization [13]. Recent methodological work further demonstrates that uncertainty and sensitivity analyses can materially alter rankings, motivating explicit validation and stability checks [15,16].
The growing literature analyses sustainability outcomes at the regional (NUTS2) scale, showing that territorial inequalities can remain substantial even in contexts with converging national indicators [10,29]. New datasets enable systematic regional SDG analytics across Europe and provide the basis for multivariate modelling, clustering, and index construction [31]. Empirical regional studies also demonstrate that cluster-based typologies can reveal distinct regional pathways and persistent structural differences [32]. For Turkey, regional development research has documented structural traps and divergent trajectories across NUTS2 regions, suggesting that sustainability measurement should explicitly account for heterogeneity and path dependence [28].
From a critical perspective on data-driven sustainability indices and ML, recent scholarship has raised important concerns regarding the use of ML-based approaches in sustainability assessment [17,18,19]. While such methods offer powerful tools for handling high-dimensional and non-linear data, they also introduce challenges related to interpretability, algorithmic bias, and the implicit normative assumptions embedded in data selection and model design. Black-box representations may obscure value judgements, reinforce existing structural inequalities, or privilege dimensions that dominate the data rather than those that are normatively significant [33]. These critiques suggest that methodological sophistication should not substitute for theoretical clarity and that data-driven sustainability indices must be accompanied by transparent discussion of their conceptual boundaries and interpretative limitations. In regional contexts, ML models have been employed to predict sustainable development levels and classify territorial patterns using multivariate indicator sets [20,21]. Representation learning approaches, such as autoencoders and VAEs, offer a principled way to reduce dimensionality and learn non-linear embeddings from correlated indicators, supporting composite index construction and regime identification [22,34].
However, DL-based indices must be interpretable and robust to be suitable for policy use. Systematic reviews and surveys underline that explainable artificial intelligence (XAI) is essential for transparency, accountability, and trust, particularly in high-stakes decision contexts [23,24,25,26,27,35]. In parallel, robustness assessments, using rank correlation benchmarks and bootstrap stability, are increasingly recommended to ensure that composite rankings are not artifacts of modelling assumptions or sampling variability [15].
Against this background, the present study does not seek to resolve longstanding theoretical debates on sustainability, resilience, or socio-technical transitions. Instead, it contributes a methodologically transparent, data-driven framework that explicitly acknowledges these debates and positions itself as a diagnostic tool for analyzing structural sustainability-related conditions under complex indicator interactions. By combining non-linear representation learning with robustness and interpretability diagnostics, the proposed framework responds to both methodological challenges and critical concerns raised in the sustainability literature.

1.1.1. Research Gaps and Research Questions

Despite growing interest in regional sustainability measurement, several gaps persist in the existing literature. First, most composite sustainability indices rely on linear aggregation, equal weighting, or PCA-based dimensionality reduction. Such approaches are ill-suited to indicator systems characterised by strong multicollinearity and non-linear cross-domain interactions, which are common in regional sustainability data and can lead to biased or unstable rankings. Second, although machine learning and deep learning methods are increasingly applied in sustainability research, integrated regional assessment frameworks that jointly combine representation learning, composite index construction, and latent-space clustering remain limited. As a result, the potential of deep learning to uncover structurally distinct regional sustainability regimes has not been fully exploited. Third, many deep-learning-based sustainability indices lack a systematic robustness assessment. The absence of explicit rank-stability diagnostics and sensitivity analysis constrains their policy relevance, as rankings may be sensitive to modelling choices or sampling variability, undermining trust in their use for decision-making. In response to these gaps, this study addresses the following research questions:
  • RQ1: How can non-linear representation learning be employed to construct a composite regional sustainability index that mitigates multicollinearity and scale dominance among heterogeneous indicators?
  • RQ2: Can latent-space representations derived from a variational deep learning framework reveal coherent and interpretable regional sustainability regimes?
  • RQ3: To what extent are regional sustainability rankings obtained from a deep-learning-based index robust to sampling uncertainty when compared with conventional linear and PCA-based approaches?

1.1.2. Motivation

The motivation for this study stems from the increasing demand for reliable, policy-relevant regional sustainability indicators. Sustainability challenges are territorially embedded, and national-level averages often conceal substantial sub-national inequalities. At the same time, conventional composite indices struggle to accommodate the complex, non-linear, and highly correlated nature of modern sustainability datasets. While DL offers powerful tools for representation learning, its application to sustainability indexing remains limited by concerns regarding interpretability, robustness, and trust. This study is motivated by the need to bridge this gap by developing a data-driven framework that is both methodologically rigorous and suitable for evidence-based regional policy analysis.

1.1.3. Objectives and Contributions

This study makes the following contributions. First, it introduces the KASVA, a novel DL-based framework that employs variational representation learning to construct a composite sustainability index under conditions of scale heterogeneity, multicollinearity, and non-linear indicator interactions. Second, through an empirical application to Turkish NUTS2 regions, the study provides new evidence on spatial inequalities in sustainability and identifies distinct regional sustainability regimes using latent-space clustering. Third, by incorporating bootstrap-based rank stability analysis and benchmarking against conventional indices, the study demonstrates that the proposed framework yields more coherent and robust regional rankings, thereby enhancing its suitability for regional sustainability monitoring and policy design.
In this study, sustainability is conceptualised as a multidimensional structural condition reflecting the contemporaneous configuration of demographic, economic, social, and environmental factors that shape regions’ potential to pursue sustainable development pathways. Rather than directly measuring long-term resilience, adaptive capacity, or intergenerational outcomes, the proposed framework focuses on identifying relative differences in underlying sustainability-related conditions across regions at a given point in time. This structural perspective recognises sustainability as an enabling context for development, while acknowledging that dynamic processes such as adaptation to shocks and long-term transitions require longitudinal or forward-looking analysis beyond the scope of the present study.
The remainder of this paper is organised as follows. Section 2 presents the methodology underlying the proposed KASVA framework, including data preparation, variational representation learning, latent-space clustering, and robustness analysis. Section 3 reports the empirical results and discusses spatial patterns, regional inequality regimes, and benchmarking against conventional sustainability indices. Section 4 concludes the paper by summarising the main findings, outlining policy implications, and suggesting directions for future research.

2. Data and Methods

This study proposes the KASVA framework, a DL-based methodology for constructing a composite sustainability index and identifying regional inequality regimes under complex, non-linear, and correlated indicator structures. The overall analytical workflow integrates indicator standardization, correlation diagnostics, variational representation learning, latent-space clustering, and robustness analysis.
All experiments were implemented using custom-written code in the Python (3.14.3) programming language. The implementation covers data preprocessing, variational autoencoder model construction and training, latent-space clustering, and robustness analysis. Widely used open-source Python libraries were employed for numerical computation, deep learning, and statistical analysis to ensure reproducibility and transparency.

2.1. Study Area and Experimental Setting

The empirical analysis is conducted at the NUTS2, which represents the principal spatial scale for regional policy design and implementation in Turkey. The NUTS2 classification provides a harmonised and legally defined territorial framework that enables consistent comparison of socio-economic and environmental indicators across regions. Turkey is divided into NUTS2 regions that exhibit substantial heterogeneity in demographic structure, economic development, social conditions, and environmental pressures. Long-standing territorial disparities between western, central, and eastern regions make Turkey a particularly relevant case for analysing regional sustainability and inequality dynamics. The selection of Turkish NUTS2 regions as the experimental area allows the proposed framework to be evaluated in a context characterised by pronounced scale heterogeneity, strong inter-indicator correlations, and spatially embedded development patterns. These features provide a suitable, policy-relevant testbed for assessing the KASVA framework’s ability to capture nonlinear sustainability interactions, identify regional inequality regimes, and produce robust regional rankings.

2.2. Data Source and Preprocessing

The spatial analysis in this study is based on the Nomenclature of Territorial Units for Statistics (NUTS) dataset obtained from Eurostat via the GISCO platform. Specifically, we employ NUTS level 2 (NUTS2) boundary shapefiles for the 2021 classification, which serve as the basic territorial units for the design and implementation of regional policies across Europe. The dataset provides harmonised and legally defined administrative boundaries in a geographic coordinate system (EPSG:4326), enabling consistent spatial aggregation and comparison of regional sustainability indicators. Owing to its standardised structure and widespread adoption in European regional and sustainability studies, the NUTS2 framework is well-suited for analysing spatial patterns and regional disparities within the study area. Subsequent preprocessing steps, including indicator standardisation and correlation diagnostics, are applied consistently across all NUTS2 regions [36].

2.3. Indicator System and Dimensional Structure

The selected indicators are not interpreted as direct measures of sustainability outcomes over time, but as observable proxies for structural conditions associated with sustainable development, including economic capacity, social inclusion, demographic structure, and environmental pressure. By jointly analysing these dimensions, the framework aims to capture how combinations of conditions may support or constrain sustainability-oriented development, rather than to predict future trajectories or adaptive responses.
Let i = 1 , , N denote the index of territorial units, where each unit corresponds to a Turkish NUTS2 region, and let j = 1 , , D denote the index of sustainability indicators included in the analysis. The total number of regions N reflects the spatial resolution of the study, while D represents the dimensionality of the indicator system spanning demographic, economic, social, and environmental domains.
The raw sustainability dataset is represented by the matrix
X = { x i j } R N × D ,
where each element x i j denotes the observed value of indicator j measured for region i. The indicators x i j are heterogeneous in both scale and units: for example, demographic indicators such as total population are expressed in absolute counts, economic indicators such as regional gross domestic product are reported in monetary units, social indicators such as education attainment or poverty risk are expressed as percentages, and environmental indicators such as PM10 concentration and greenhouse gas emissions are measured in physical units.
Each row vector x i = ( x i 1 , x i 2 , , x i D ) therefore represents the complete sustainability profile of region i, encapsulating its multidimensional socio-economic and environmental characteristics. Conversely, each column vector x · j = ( x 1 j , x 2 j , , x N j ) represents the spatial distribution of indicator j across all regions. Due to the coexistence of absolute, rate-based, and intensity-based measures, the matrix X is characterised by pronounced scale heterogeneity, non-normal distributions, and inter-indicator dependencies, as empirically demonstrated in Figure 1 and Figure 2. These properties motivate subsequent steps of standardisation and non-linear representation learning.
The indicator system spans four dimensions: (i) demographic (population size, density, ageing), (ii) economic (regional gross domestic product (GDP), GDP per capita, employment), (iii) social (education, inequality, poverty, civic participation), and (iv) environmental (air pollution, waste, emissions, water use).
Figure 1 illustrates the empirical distributions of the raw sustainability indicators, grouped by demographic, economic, social, and environmental domains. The box plots reveal pronounced scale heterogeneity across indicators. For instance, total population values span more than one order of magnitude across regions, exceeding 1.5 × 10 7 in metropolitan areas, whereas population density and ageing-related indicators are constrained to substantially lower numerical ranges. In the economic domain, regional GDP exceeds 3 × 10 5 (million TRY), while employment and unemployment rates remain bounded below 10 2 , reflecting their rate-based nature.
Beyond scale differences, Figure 1 highlights substantial distributional asymmetry. Several indicators exhibit strong right skewness, particularly regional GDP, GDP per capita, and water consumption per capita, suggesting a few dominant regions with disproportionately high values. Conversely, social indicators such as the Gini coefficient display compressed distributions with limited variance, suggesting weaker discriminatory power in isolation. Environmental indicators, especially PM10 concentration and water use, exhibit wide interquartile ranges and multiple high-end outliers, suggesting spatially concentrated environmental stress.
These empirical characteristics demonstrate that the indicator system is neither homoscedastic nor normally distributed, and that indicators differ markedly in scale, dispersion, and tail behaviour. Consequently, direct aggregation or linear weighting of raw indicators would lead to scale dominance and bias the composite index towards high-magnitude indicators. This motivates the adoption of indicator standardisation (Equation (3)) and a non-linear representation learning framework capable of capturing higher-order interactions while mitigating the influence of extreme values.
To assess interdependencies, pairwise Pearson correlations are computed as
ρ j k = i = 1 N ( x i j μ j ) ( x i k μ k ) i = 1 N ( x i j μ j ) 2 i = 1 N ( x i k μ k ) 2 ,
In Equation (2), ρ j k denotes the Pearson correlation coefficient between indicators j and k, quantifying the strength and direction of their linear association across all regions. The indices j , k { 1 , , D } refer to two distinct sustainability indicators within the indicator system.
The terms μ j and μ k represent the sample means of indicators j and k, respectively, computed as
μ j = 1 N i = 1 N x i j , μ k = 1 N i = 1 N x i k .
The numerator of Equation (2) measures the covariance between indicators j and k, while the denominator normalises this covariance by the product of their sample standard deviations, ensuring that ρ j k [ 1 , 1 ] . A value of ρ j k = 1 indicates perfect positive linear dependence, ρ j k = 1 indicates perfect negative linear dependence, and  ρ j k = 0 indicates the absence of linear association.
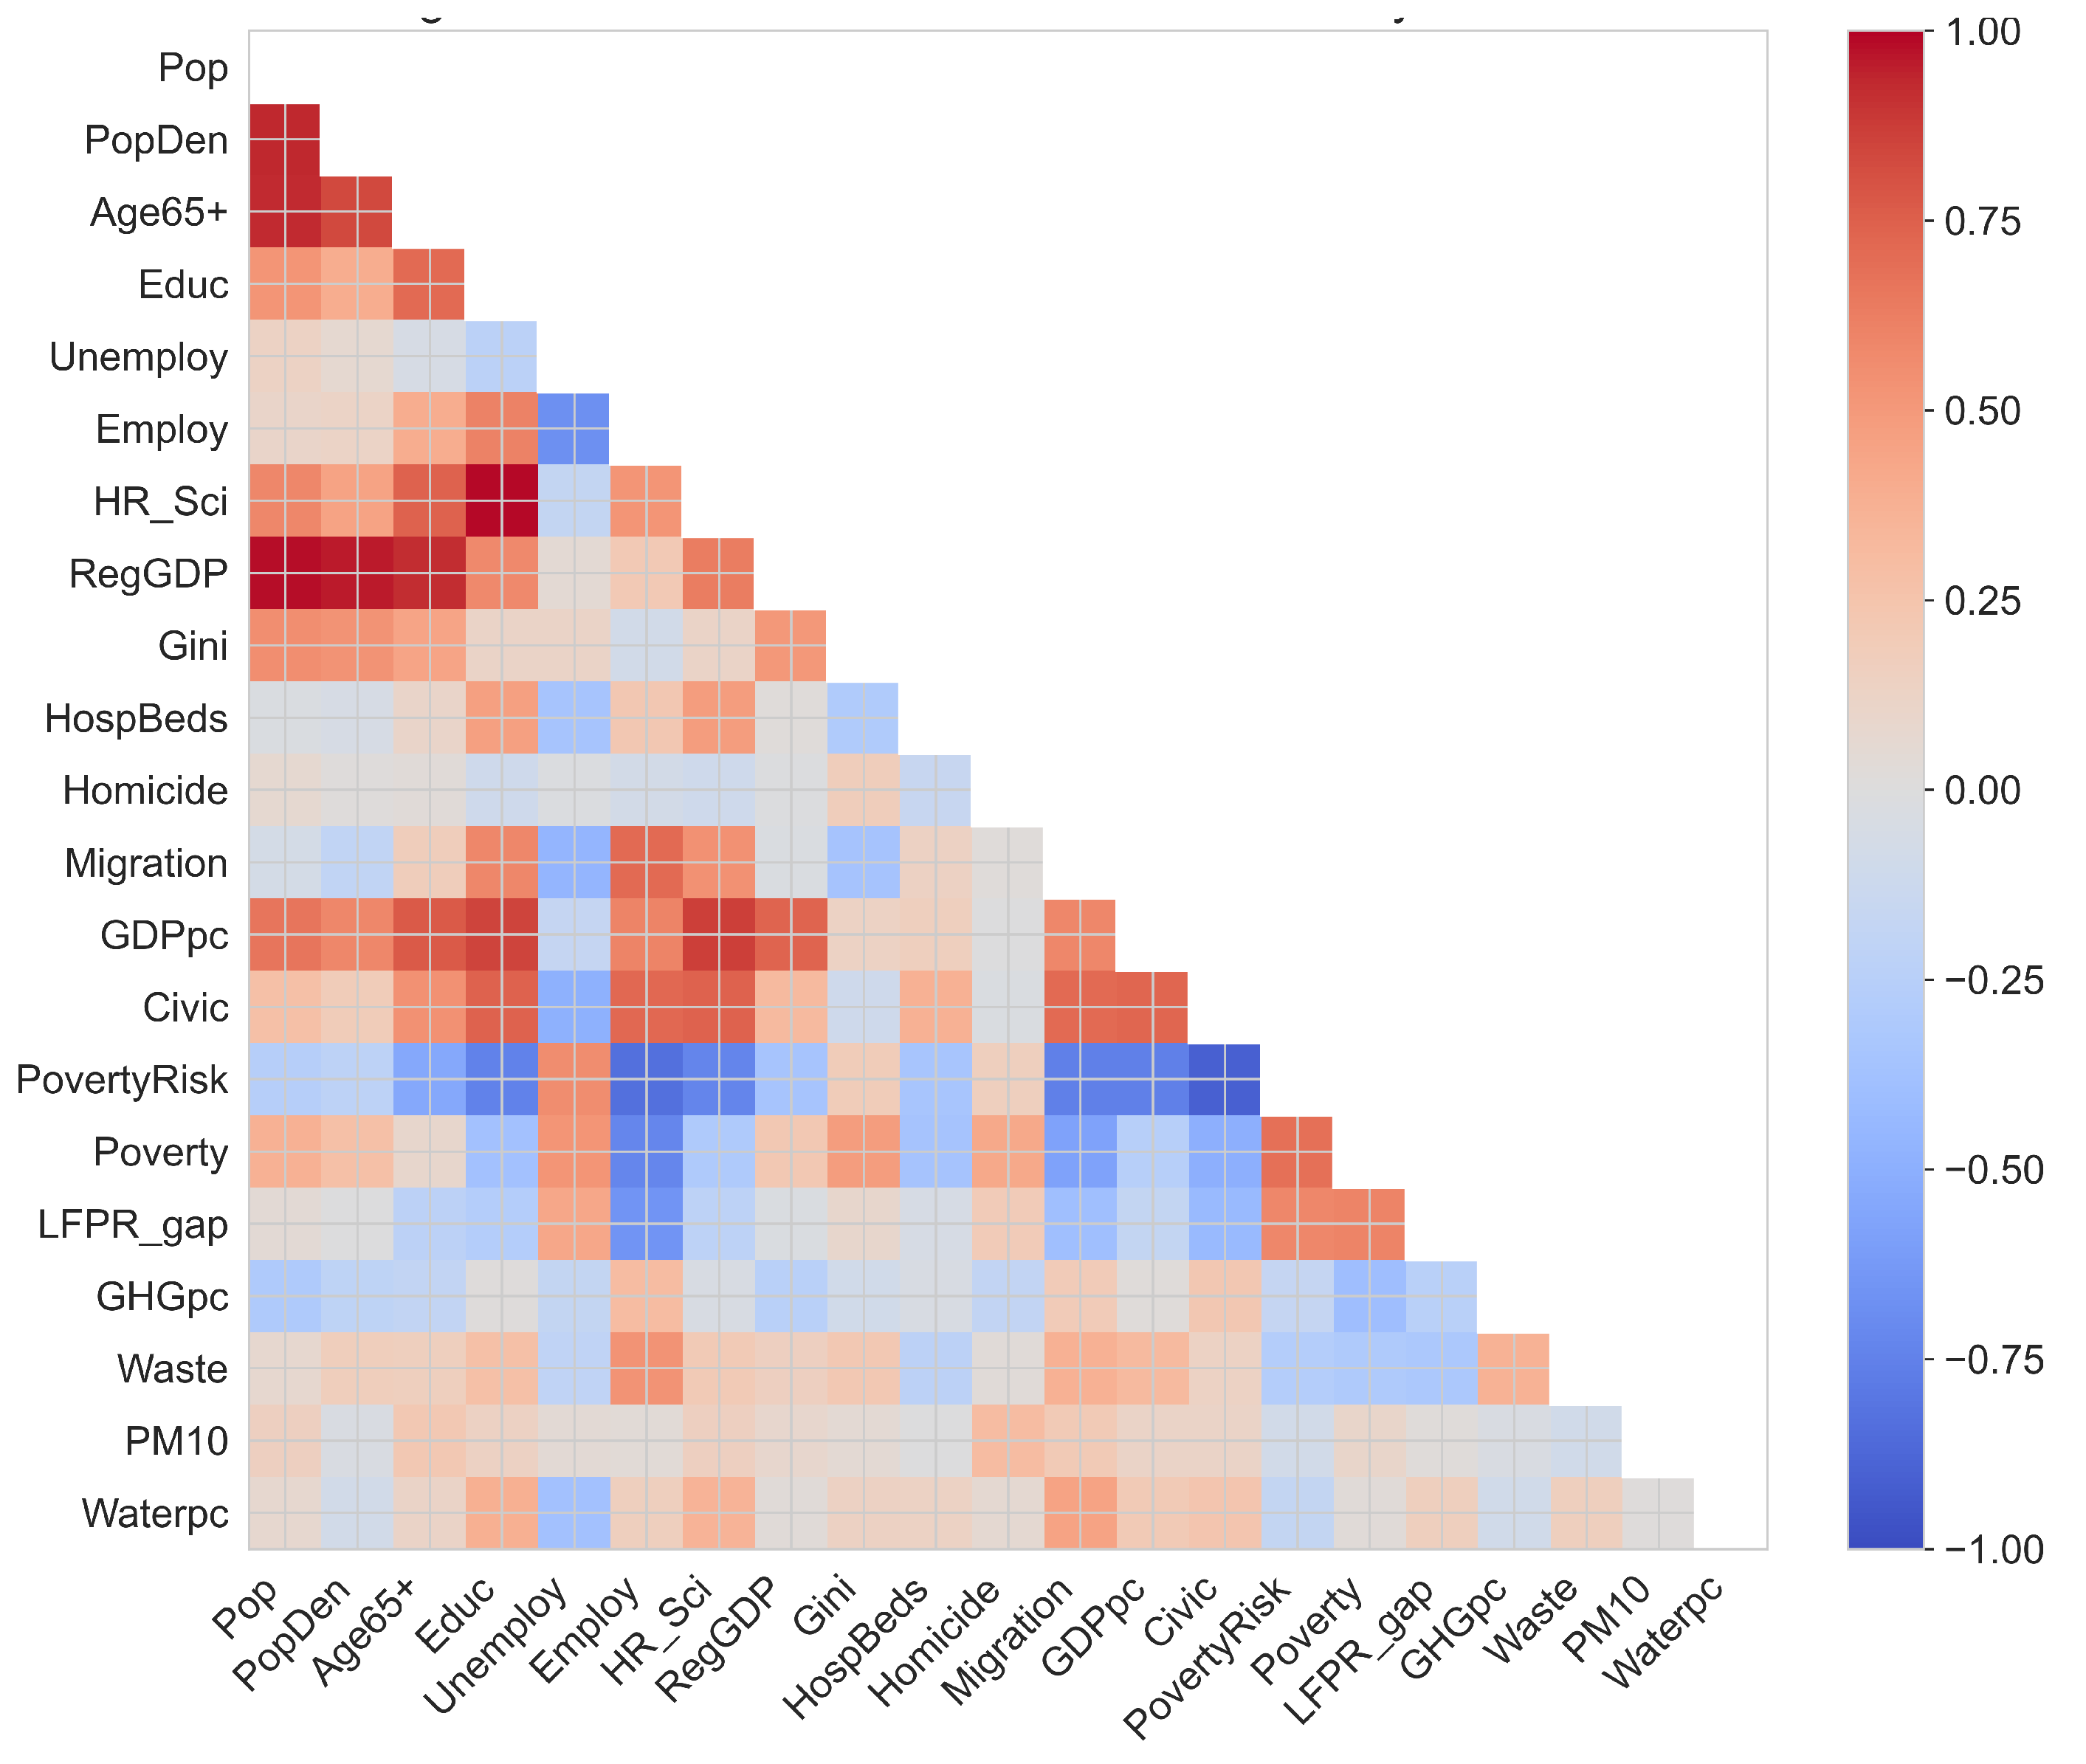
By computing ρ j k for all indicator pairs, a symmetric correlation matrix ρ R D × D is obtained, which characterises the dependency structure of the sustainability indicator system and forms the empirical basis for the correlation patterns illustrated in Figure 2.
Figure 2 visualises the pairwise Pearson correlation matrix of the standardised sustainability indicators. The heatmap reveals pronounced multicollinearity within and across indicator domains. In particular, core economic indicators, including regional GDP, GDP per capita, and human resources in science and technology, exhibit strong positive correlations, with coefficients frequently exceeding 0.8 , indicating substantial redundancy in the information they convey. Similarly, demographic variables such as population size and population density form tightly coupled clusters, reflecting shared structural drivers.
Empirical diagnostics indicate that the sustainability indicator system analysed in this study exhibits pronounced non-linear relationships and dense correlation structures, with pairwise correlations frequently exceeding 0.8 across economic, demographic, and social domains. Under such conditions, linear dimensionality-reduction techniques are limited in their ability to preserve higher-order interactions and may yield latent representations dominated by scale effects rather than structural patterns. Variational representation learning provides a principled mechanism for modelling these non-linear dependencies while controlling overfitting through probabilistic regularisation.
In contrast, poverty-related indicators show consistent negative correlations with economic performance and civic engagement. For example, poverty risk and income poverty are inversely associated with GDP per capita and civic participation, with correlation coefficients often below 0.5 . Environmental indicators show more heterogeneous relationships: PM10 concentration and greenhouse gas emissions are weakly to moderately correlated with economic indicators, suggesting partially decoupled environmental pressures.
These empirical dependency patterns indicate that the sustainability indicator system violates assumptions of independence and orthogonality. Consequently, additive composite indices or linear weighting schemes would overweight correlated indicators and underestimate latent cross-domain interactions. This motivates the adoption of a non-linear representation-learning framework that compresses correlated information into a lower-dimensional latent space while preserving complex interdependencies.
The latent space learned by the variational autoencoder does not impose predefined normative sustainability dimensions (e.g., economic, social, environmental). Instead, it represents a data-driven embedding that captures dominant patterns of covariance and non-linear interaction among indicators. Consequently, individual latent dimensions are not directly interpretable as single sustainability domains, but reflect combinations of indicator groups that jointly shape regional sustainability-related conditions.

2.4. Data Normalisation

Given the pronounced scale heterogeneity and distributional asymmetry observed in the raw indicator system (Figure 1), using the original values directly would lead to numerical instability and the dominance of high-magnitude variables during model training. To remove scale effects while preserving relative variation across regions, all indicators are standardised using z-score normalisation:
x i j * = x i j μ j σ j ,
where μ j and σ j denote the sample mean and standard deviation of indicator j, respectively. This transformation centres each indicator around zero and rescales it to unit variance, ensuring that all variables contribute comparably to the optimisation objective regardless of their original units or magnitudes.
The resulting standardised data matrix X * = { x i j * } R N × D constitutes the input to the DL model. Importantly, while z-score normalisation mitigates scale dominance, it does not remove inter-indicator dependencies, as evidenced by the correlation structure in Figure 2, thereby necessitating a modelling approach capable of handling correlated inputs.

2.5. Variational Representation Learning (KASVA Encoder)

To capture non-linear interactions and reduce the dimensionality of the sustainability indicator space, KASVA employs a VAE. For each region i, the encoder network maps the standardised indicator vector x i * R D into a probabilistic latent representation z i R K according to
q ϕ ( z i x i * ) = N μ i , diag ( σ i 2 ) ,
where μ i R K and σ i R K denote the region-specific latent mean and standard deviation vectors predicted by the encoder, N is the latent dimensionality, and  ϕ represents the encoder parameters.
The probabilistic formulation allows each region to be represented not by a single point estimate, but by a distribution in latent space, thereby accounting for uncertainty and heterogeneity in sustainability characteristics. A latent sample z i is drawn via the reparameterisation trick and passed to the decoder, which reconstructs the input indicators as
p θ ( x i * z i ) ,
where θ denotes the decoder parameters and x ^ i * is the reconstructed indicator vector.
Model training proceeds by minimising the evidence lower bound (ELBO):
L VAE = x i * x ^ i * 2 2 + β KL q ϕ ( z i x i * ) N ( 0 , I ) ,
where the first term measures reconstruction accuracy using the squared 2 norm, and the second term is the Kullback–Leibler (KL) divergence regularising the latent distribution towards the standard normal prior. The hyperparameter β controls the strength of this regularisation and governs the trade-off between faithful reconstruction and latent space smoothness.
The hyperparameter β regulates the relative importance of the KL divergence term in the ELBO objective. A lower value of β places greater emphasis on minimising reconstruction error, leading the model to prioritise faithful reconstruction of the original indicators, but potentially resulting in a less regularised, more entangled latent space. Conversely, a higher value of β increases the weight of the KL divergence term, encouraging the latent representations to more closely follow the standard normal prior. This promotes smoother, more regularised, and more interpretable latent spaces, but may come at the cost of reduced reconstruction accuracy. In this study, β is selected through empirical validation to balance these competing objectives, ensuring that the latent space captures meaningful non-linear interactions among sustainability indicators while maintaining stable training dynamics and avoiding over-regularisation.
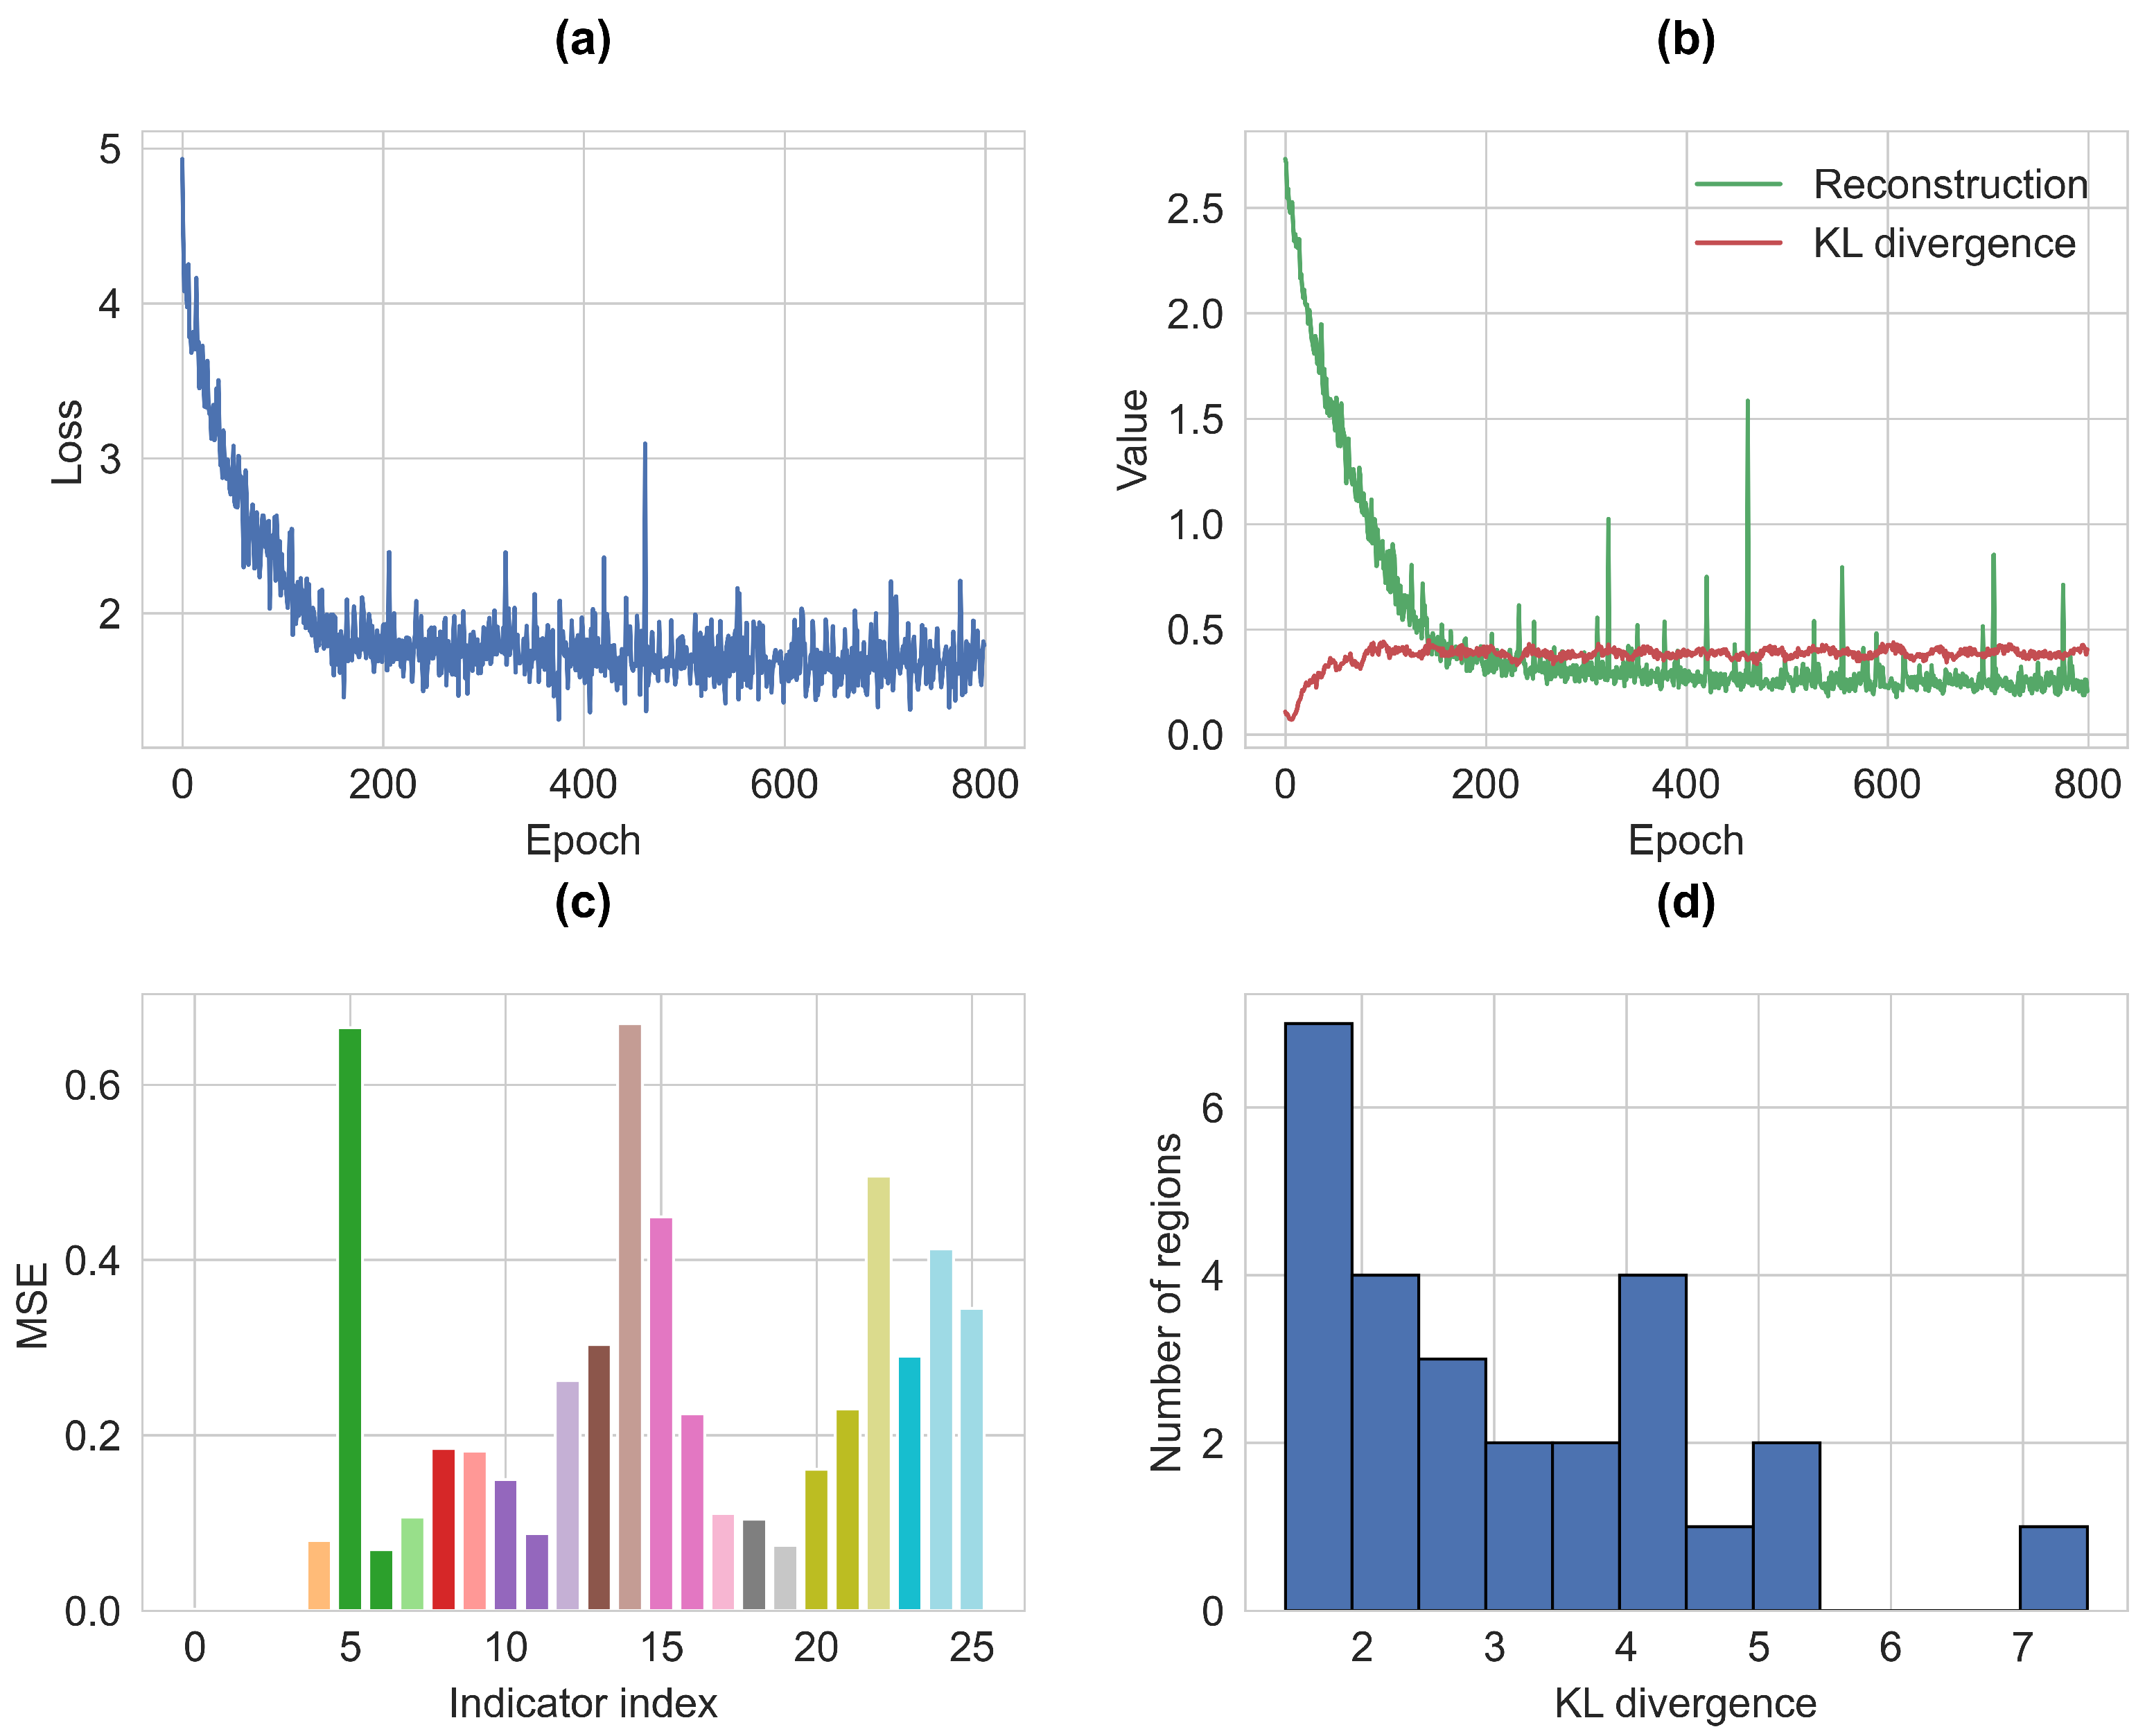
Figure 3 reports the main training diagnostics. Panel (a) shows rapid convergence of the total loss within approximately 200 epochs, indicating stable optimisation. Panel (b) illustrates the dynamic balance between reconstruction error and KL divergence, confirming effective regularisation. Panel (c) reveals heterogeneous reconstruction errors across indicators, reflecting differing levels of structural complexity, while panel (d) displays a right-skewed distribution of KL divergence across regions, indicating variation in latent representation complexity.

2.6. Construction of the Sustainability Index

To derive a single composite measure from the multidimensional latent representation, a scalar sustainability score is computed for each region as the Euclidean norm of its latent vector:
s i = z i 2 = k = 1 K z i k 2 ,
where z i k denotes the k-th latent component of region i. This aggregation captures the overall magnitude of sustainability-related characteristics encoded in latent space without privileging any individual dimension.
The Global Territorial Variational Sustainability Index (GTVSI) is then obtained through min-max normalisation:
GTVSI i = 100 × s i min i ( s i ) max i ( s i ) min i ( s i ) ,
yielding a bounded index on a 0–100 scale that facilitates interpretability and comparison across regions.

2.7. Latent-Space Clustering and Validation

To identify structurally distinct regional sustainability regimes, clustering is performed directly in the latent space. Regions are partitioned into C clusters by solving the k-means optimisation problem:
min { C c } c = 1 C c = 1 C z i C c z i μ c 2 2 ,
where C c denotes the set of regions assigned to cluster c and μ c is the corresponding cluster centroid.
Cluster quality and separation are assessed using the silhouette coefficient:
Sil ( i ) = b ( i ) a ( i ) max { a ( i ) , b ( i ) } ,
where a ( i ) represents the average distance between region i and other regions within the same cluster, and  b ( i ) denotes the minimum average distance to regions in the nearest alternative cluster.
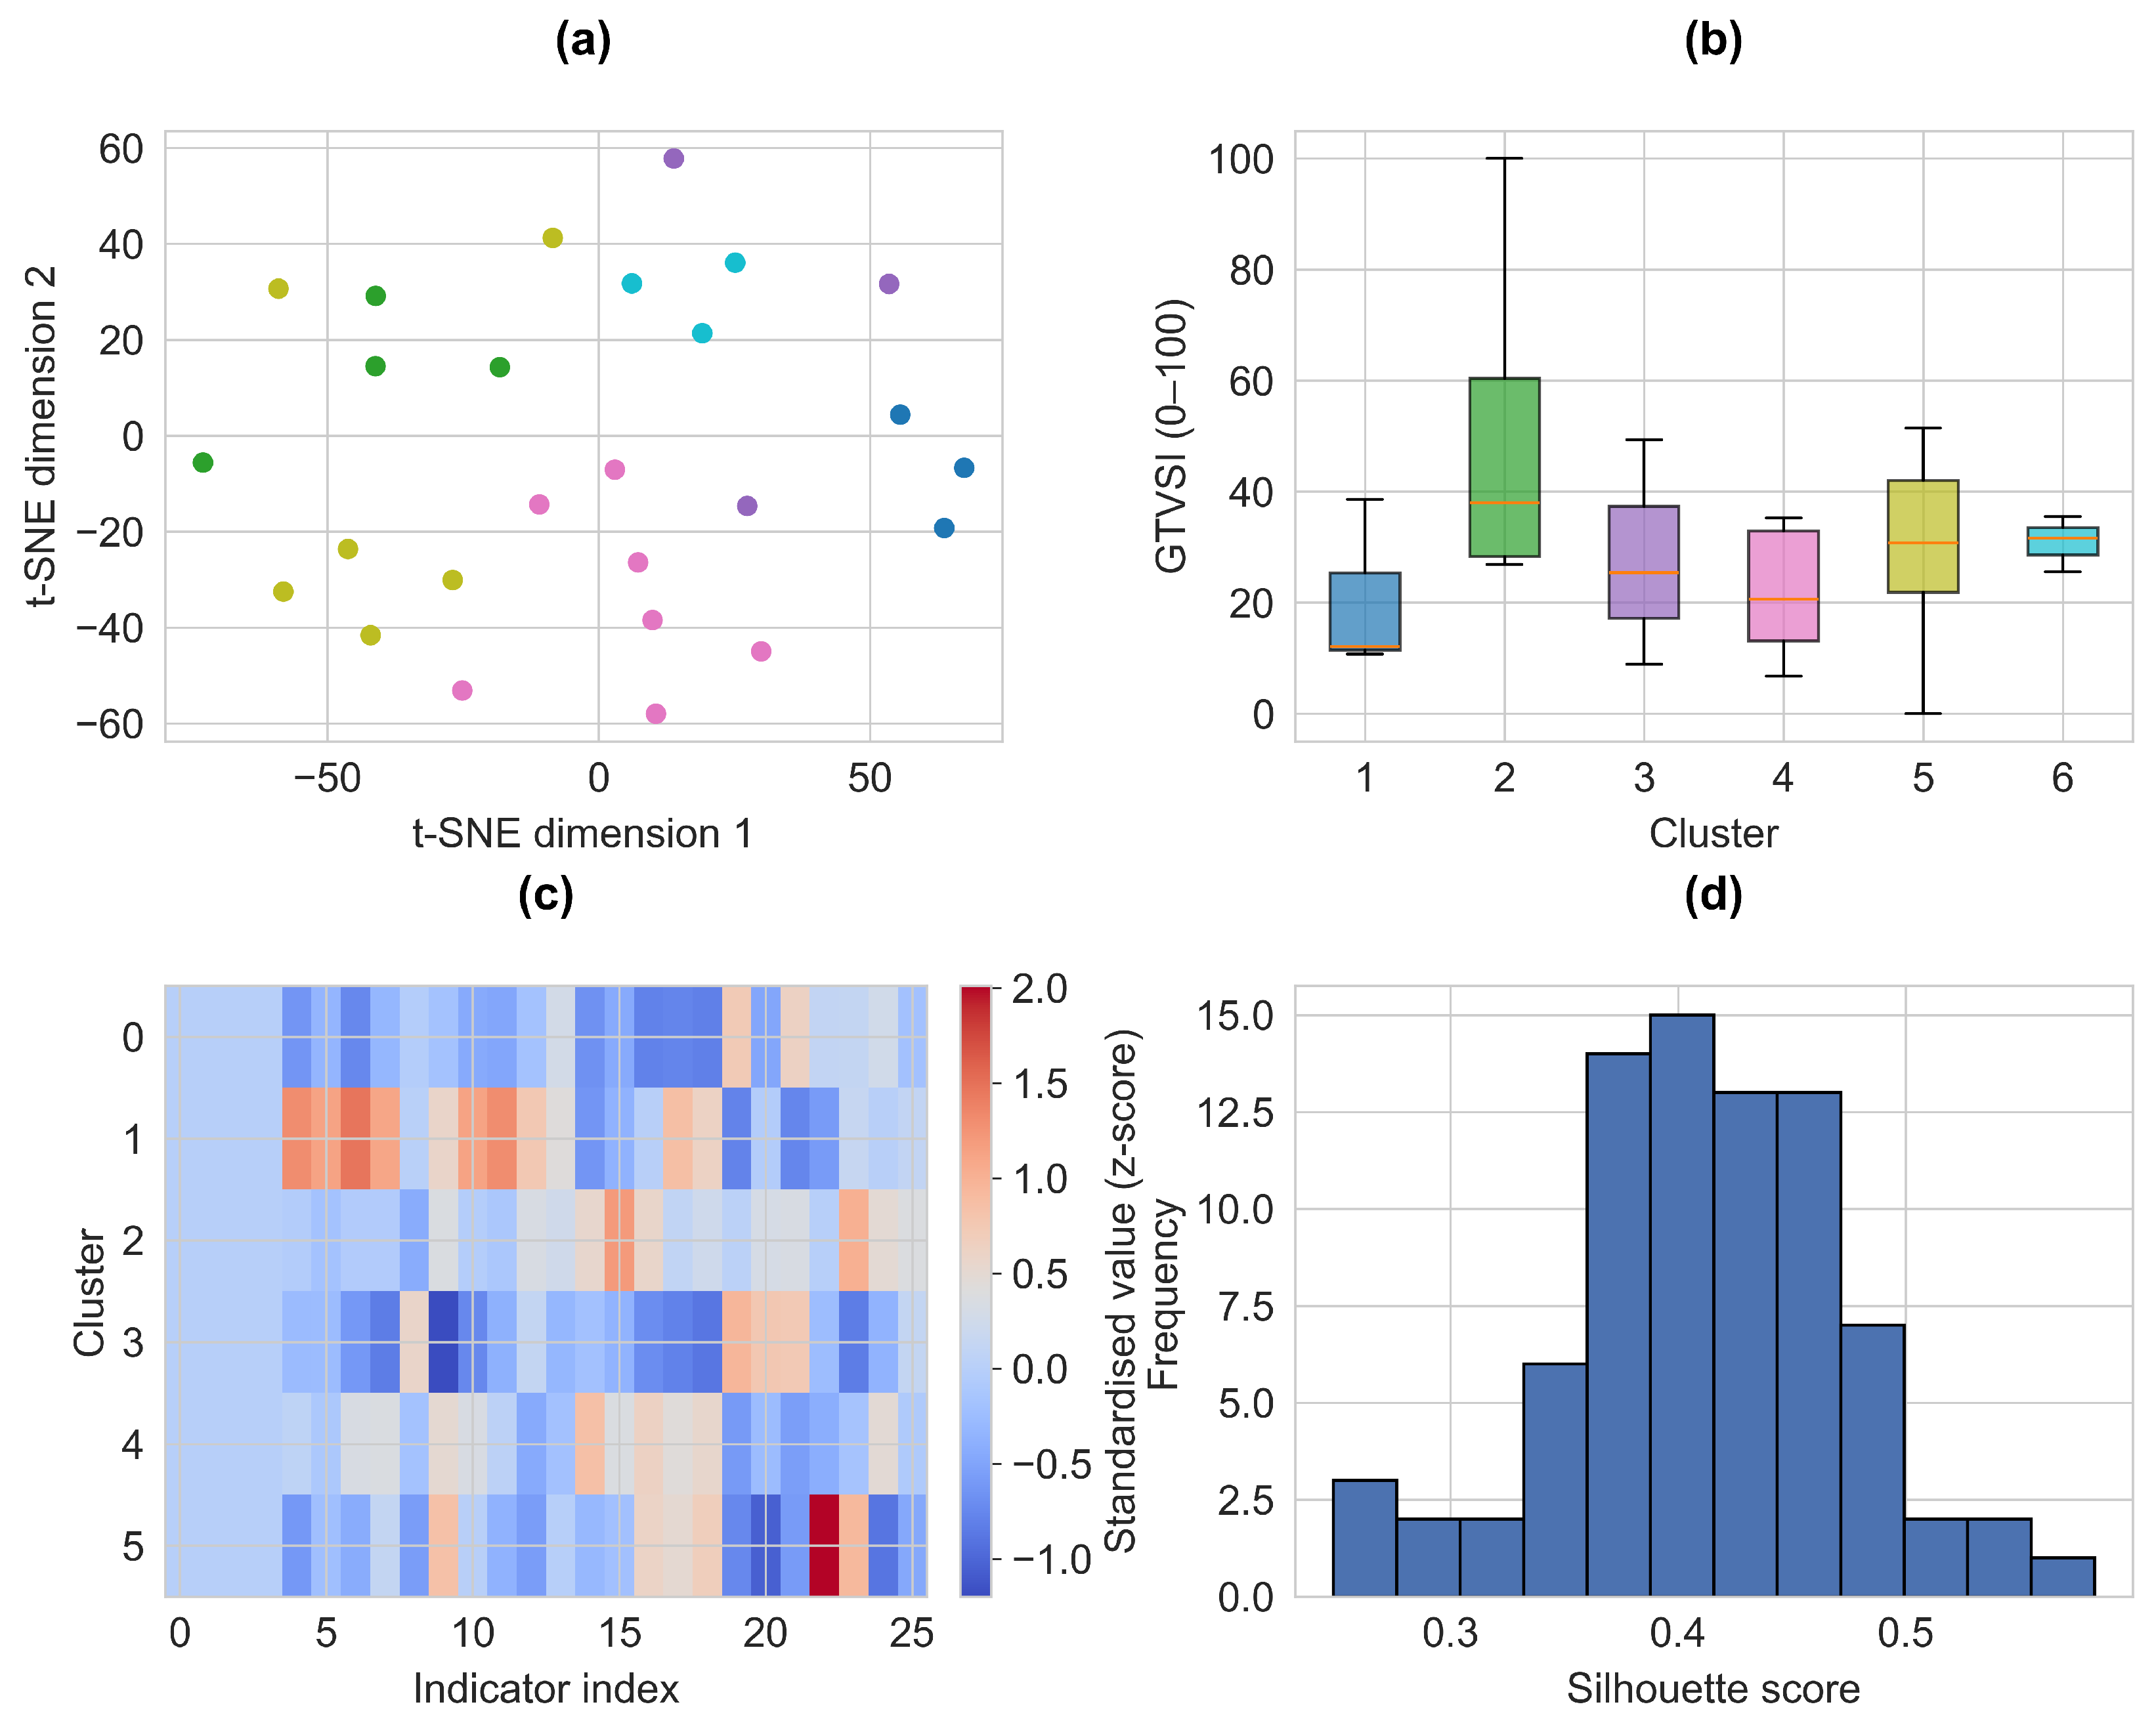
Figure 4 provides a comprehensive assessment of the latent-space clustering results obtained from the KASVA framework. Panel (a) presents a two-dimensional t-SNE projection of the latent representations z i , where regions are coloured according to their assigned clusters. The clear spatial separation observed in this projection indicates that the learned latent space preserves meaningful structure and enables effective discrimination between regional sustainability regimes, rather than producing overlapping or diffuse groupings.
Panel (b) illustrates the distribution of the GTVSI within each cluster using boxplots. The clusters exhibit systematically different central tendencies and dispersion patterns, with limited overlap between interquartile ranges. This indicates that the clustering is not arbitrary but aligns with distinct sustainability performance levels, thereby reinforcing the internal coherence of the identified regimes.
Panel (c) displays standardised indicator profiles for each cluster, expressed as deviations from the national mean. These profiles reveal distinct sustainability typologies, with certain clusters characterised by above-average economic and social indicators, while others exhibit pronounced deficits in labour market conditions, demographic structure, or environmental performance. The contrast across profiles confirms that clusters capture multidimensional structural differences rather than variation along a single indicator.
Finally, panel (d) reports the distribution of silhouette coefficients across regions. Most silhouette values fall within the range of approximately 0.4 to 0.5, indicating moderate to strong cluster separation and low ambiguity in regional assignments. The absence of a large mass of near-zero or negative silhouette scores suggests that the chosen number of clusters yields a stable and well-defined partition of the latent space.

2.8. Robustness and Rank Stability

To evaluate the robustness of the sustainability rankings, a bootstrap resampling procedure with B = 1000 iterations is applied. For each bootstrap sample b, regions are resampled with replacement, and Spearman’s rank correlation coefficient is computed as
ρ ( b ) = 1 6 i = 1 N d i 2 N ( N 2 1 ) ,
where d i denotes the difference between the original and resampled ranks of region i.
The validation strategy adopted in this study combines internal robustness diagnostics with external consistency checks. Bootstrap-based rank stability assesses the sensitivity of regional rankings to sampling uncertainty, while comparisons with conventional indices evaluate methodological coherence. External validation using independent outcomes complements these analyses by providing an additional perspective on construct validity, acknowledging that stability alone is not sufficient to establish conceptual alignment.
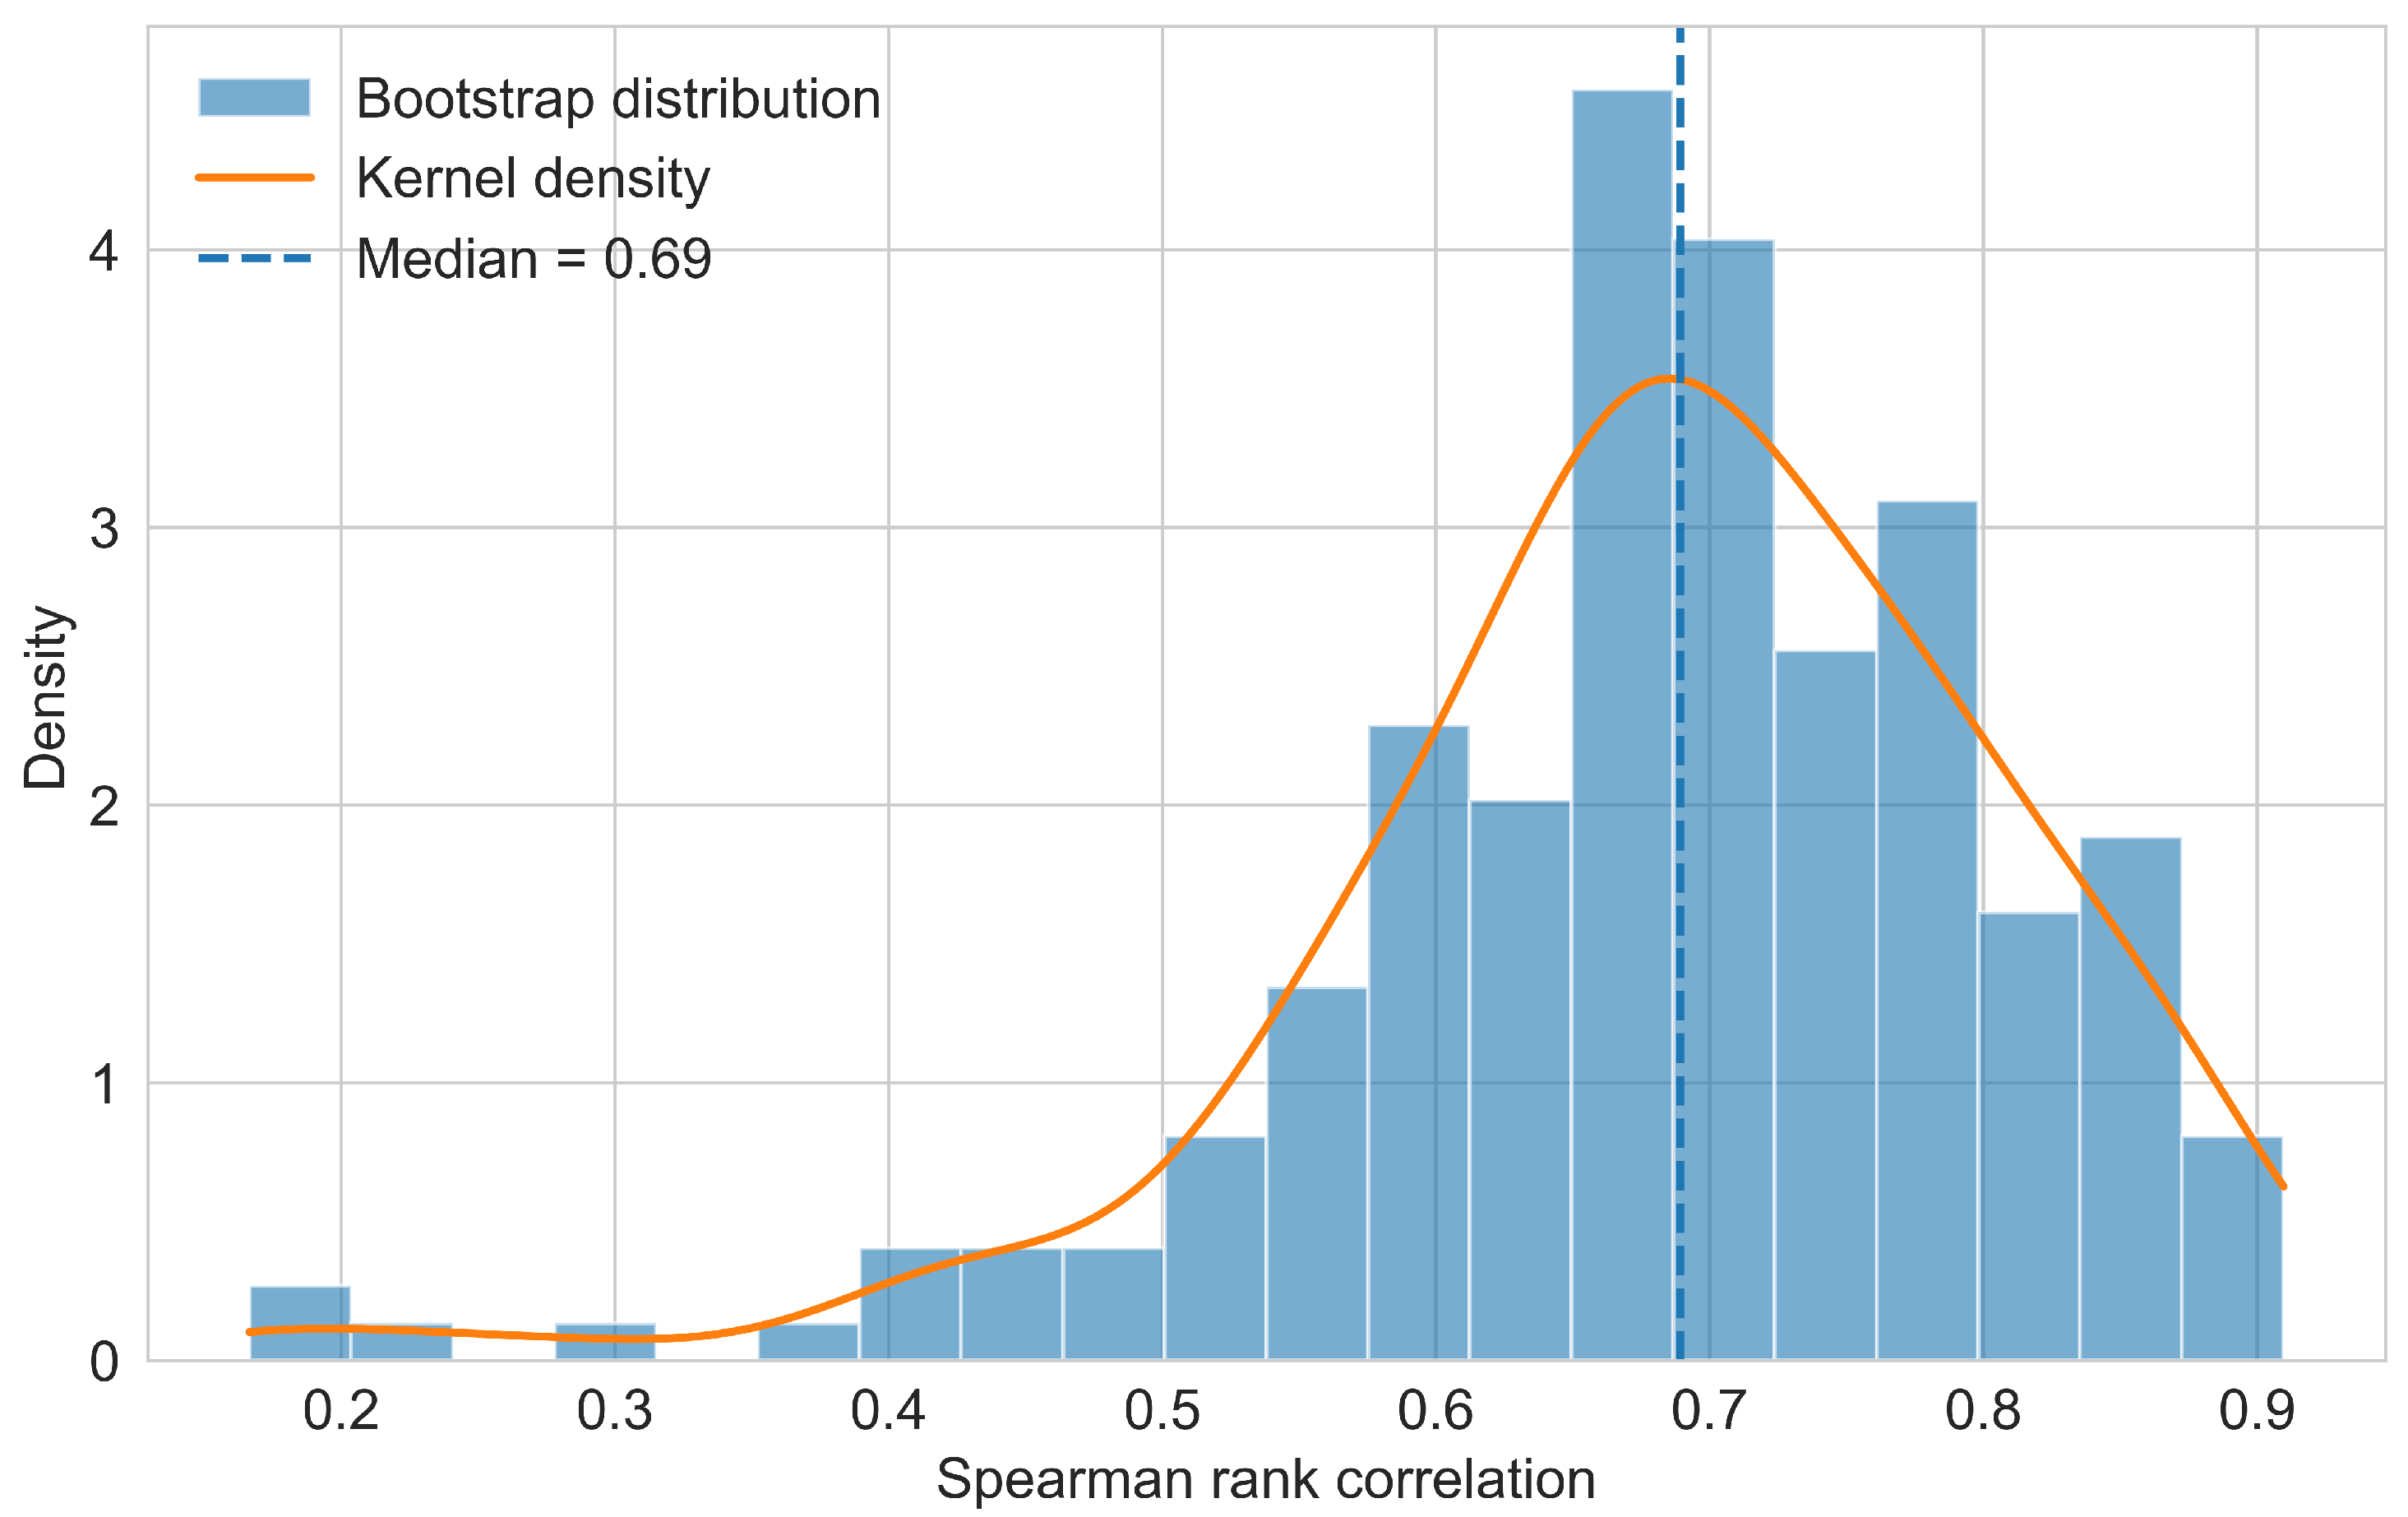
Figure 5 illustrates the empirical distribution of the bootstrap-based Spearman rank correlation coefficients ρ ( b ) , computed by repeatedly resampling the regional dataset with replacement. The distribution is centred around a median value of approximately 0.69 , with the majority of bootstrap correlations exceeding 0.6 . This concentration of high-correlation values indicates that the relative ordering of regions according to the GTVSI remains largely invariant under perturbations to the sample.
The absence of substantial mass near zero or negative correlation values suggests that the observed rankings are not driven by idiosyncratic observations or extreme regions. Instead, the results imply that the sustainability index captures stable structural differences across regions. From a methodological perspective, this level of rank consistency provides strong evidence that the KASVA-based index is robust to sampling uncertainty and not overly sensitive to the specific dataset composition.
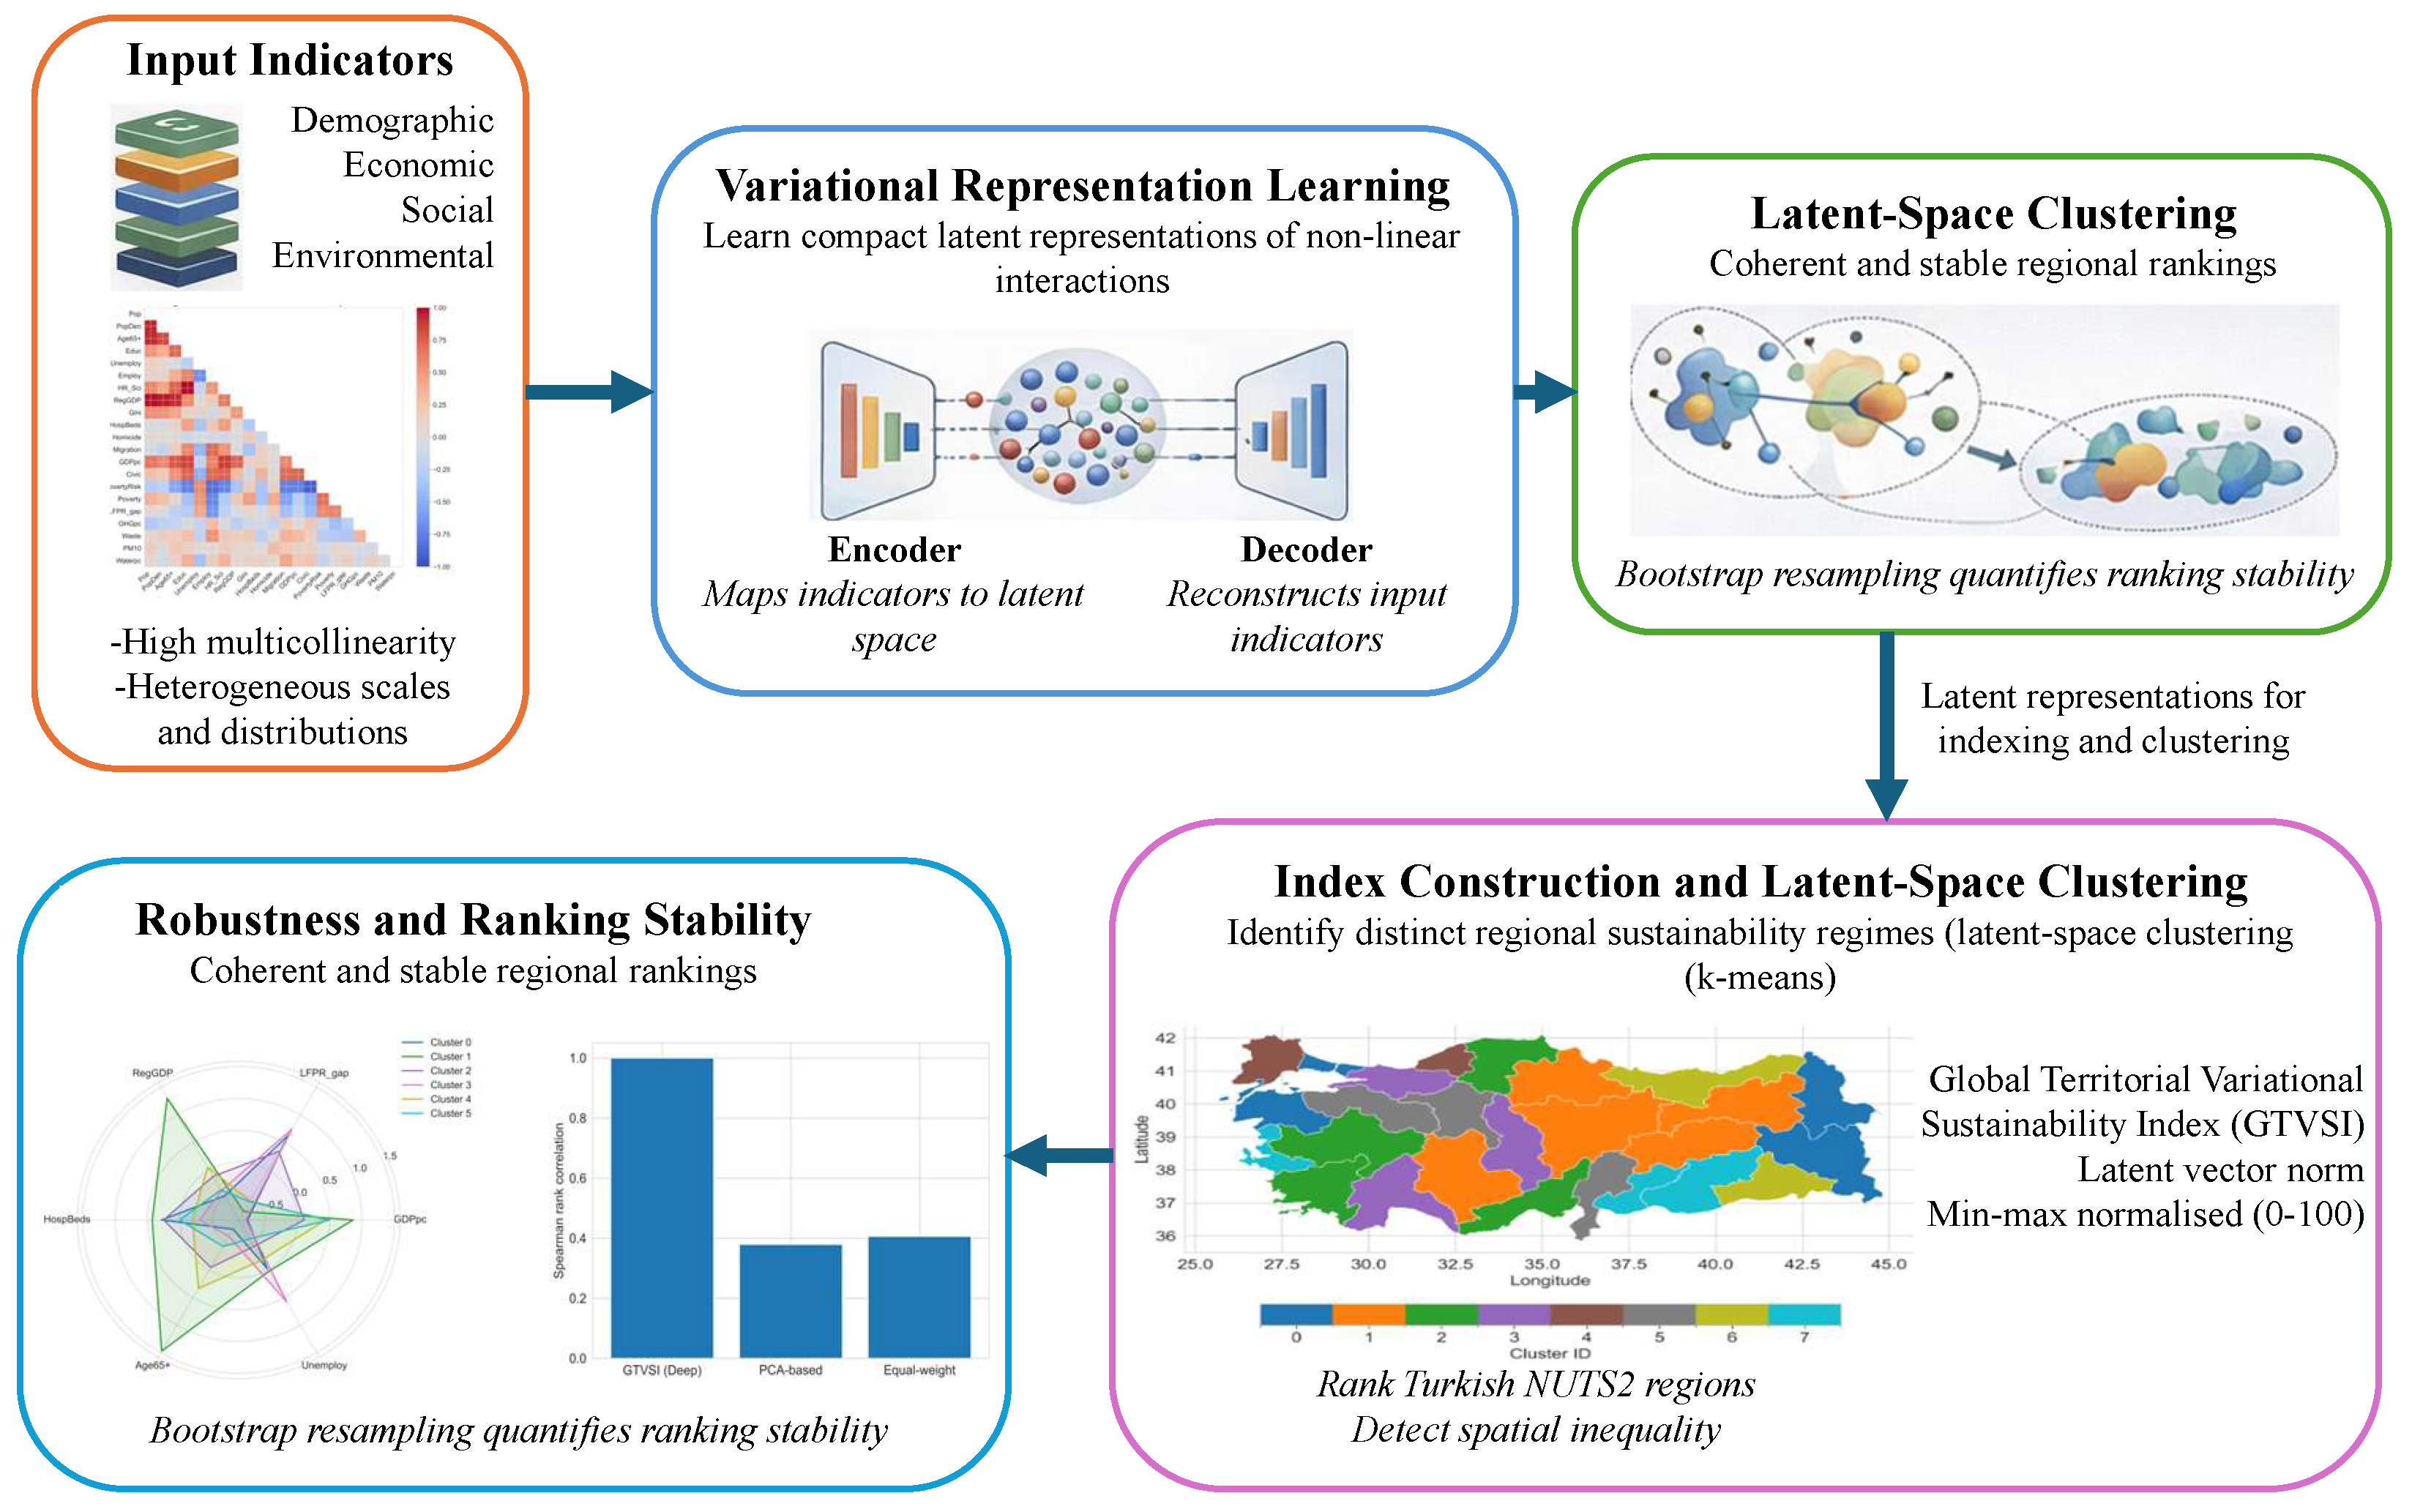
Figure 6 illustrates the overall workflow of the proposed KASVA framework for regional sustainability assessment. The process begins with a multidimensional indicator system spanning demographic, economic, social, and environmental domains, characterised by heterogeneous scales and strong multicollinearity. These indicators are processed using variational representation learning, where a VAE encodes standardised indicators into a compact probabilistic latent space that captures non-linear interactions, while the decoder faithfully reconstructs the original inputs. The learned latent representations are then exploited in two complementary ways: first, a composite sustainability measure, the GTVSI, is constructed as the Euclidean norm of the latent vectors and normalised to a 0–100 scale to enable regional ranking and spatial inequality assessment; second, k-means clustering is applied directly in latent space to identify distinct regional sustainability regimes based on multidimensional structural similarity as shown in Algorithm 1. Finally, the robustness and reliability of the resulting rankings are evaluated through bootstrap resampling and Spearman rank correlation analysis, demonstrating coherent and stable regional rankings under sampling uncertainty. The KASVA framework is descriptive rather than causal. It does not aim to identify causal mechanisms, estimate treatment effects, or evaluate the impact of specific policy interventions. Instead, it provides a data-driven diagnostic representation of regional sustainability-related structural conditions, enabling comparisons, rankings, and typology construction within complex, correlated indicator systems.
Algorithm 1 KASVA: Knowledge-aware sustainability variational assessment
 Require:  
Raw sustainability indicator matrix X R N × D
 Ensure: 
Sustainability index GTVSI and regional cluster assignments
1:
Compute indicator-wise means μ j and standard deviations σ j
2:
Standardise indicators: x i j * ( x i j μ j ) / σ j
3:
Initialise VAE parameters ϕ , θ and latent dimension K
4:
for epoch = 1 to E do
5:
    for each region i = 1 , , N  do
6:
        Encode x i * ( μ i , σ i )
7:
        Sample latent vector z i N ( μ i , diag ( σ i 2 ) )
8:
        Decode z i x ^ i *
9:
        Compute ELBO loss (Equation (6))
10:
     end for
11:
     Update ϕ , θ via gradient descent
12:
end for
13:
Compute latent norms s i z i 2
14:
Normalise s i to obtain GTVSI i (Equation (8))
15:
Apply k-means clustering on { z i } to obtain C clusters
16:
Validate clusters using silhouette scores
17:
for  b = 1 to B bootstrap iterations do
18:
    Resample regions with replacement
19:
    Recompute GTVSI ( b )
20:
    Compute Spearman rank correlation ρ ( b )
21:
end for
  return  GTVSI , cluster assignments, and rank stability metrics

3. Results and Discussion

The section presents and interprets the empirical findings obtained using the proposed KASVA framework. It combines descriptive and analytical results with substantive discussion of spatial patterns, regional inequality regimes, robustness assessments, and policy-relevant implications. The results are organised as follows: first, the overall distributional properties of the derived sustainability index; second, spatial patterns; third, regional inequality regimes; and fourth, robustness analyses. All results are reported at the NUTS2 regional level and are based on the fully trained and validated model described in the Methodology section. For transparency and reproducibility, the key model configuration and analysis parameters used in the KASVA framework are summarised in Table 1.
Importantly, to assess the external validity of the proposed sustainability index, we examine its relationship with independent regional indicators that are commonly used as proxies for development and well-being. Specifically, correlation analyses are conducted between the KASVA-based GTVSI and selected external measures, including income-based indicators, employment-related outcomes, and human development-oriented statistics available at the regional level. The results indicate that regions with higher GTVSI values tend to exhibit more favourable outcomes across these independent measures, suggesting a positive, systematic association between the proposed index and established indicators of regional well-being and development. While these correlations do not imply causality, they provide evidence that the index captures meaningful structural conditions aligned with broader sustainability-related outcomes rather than arbitrary latent patterns.

3.1. Distribution of the KASVA-Based Sustainability Index (GTVSI)

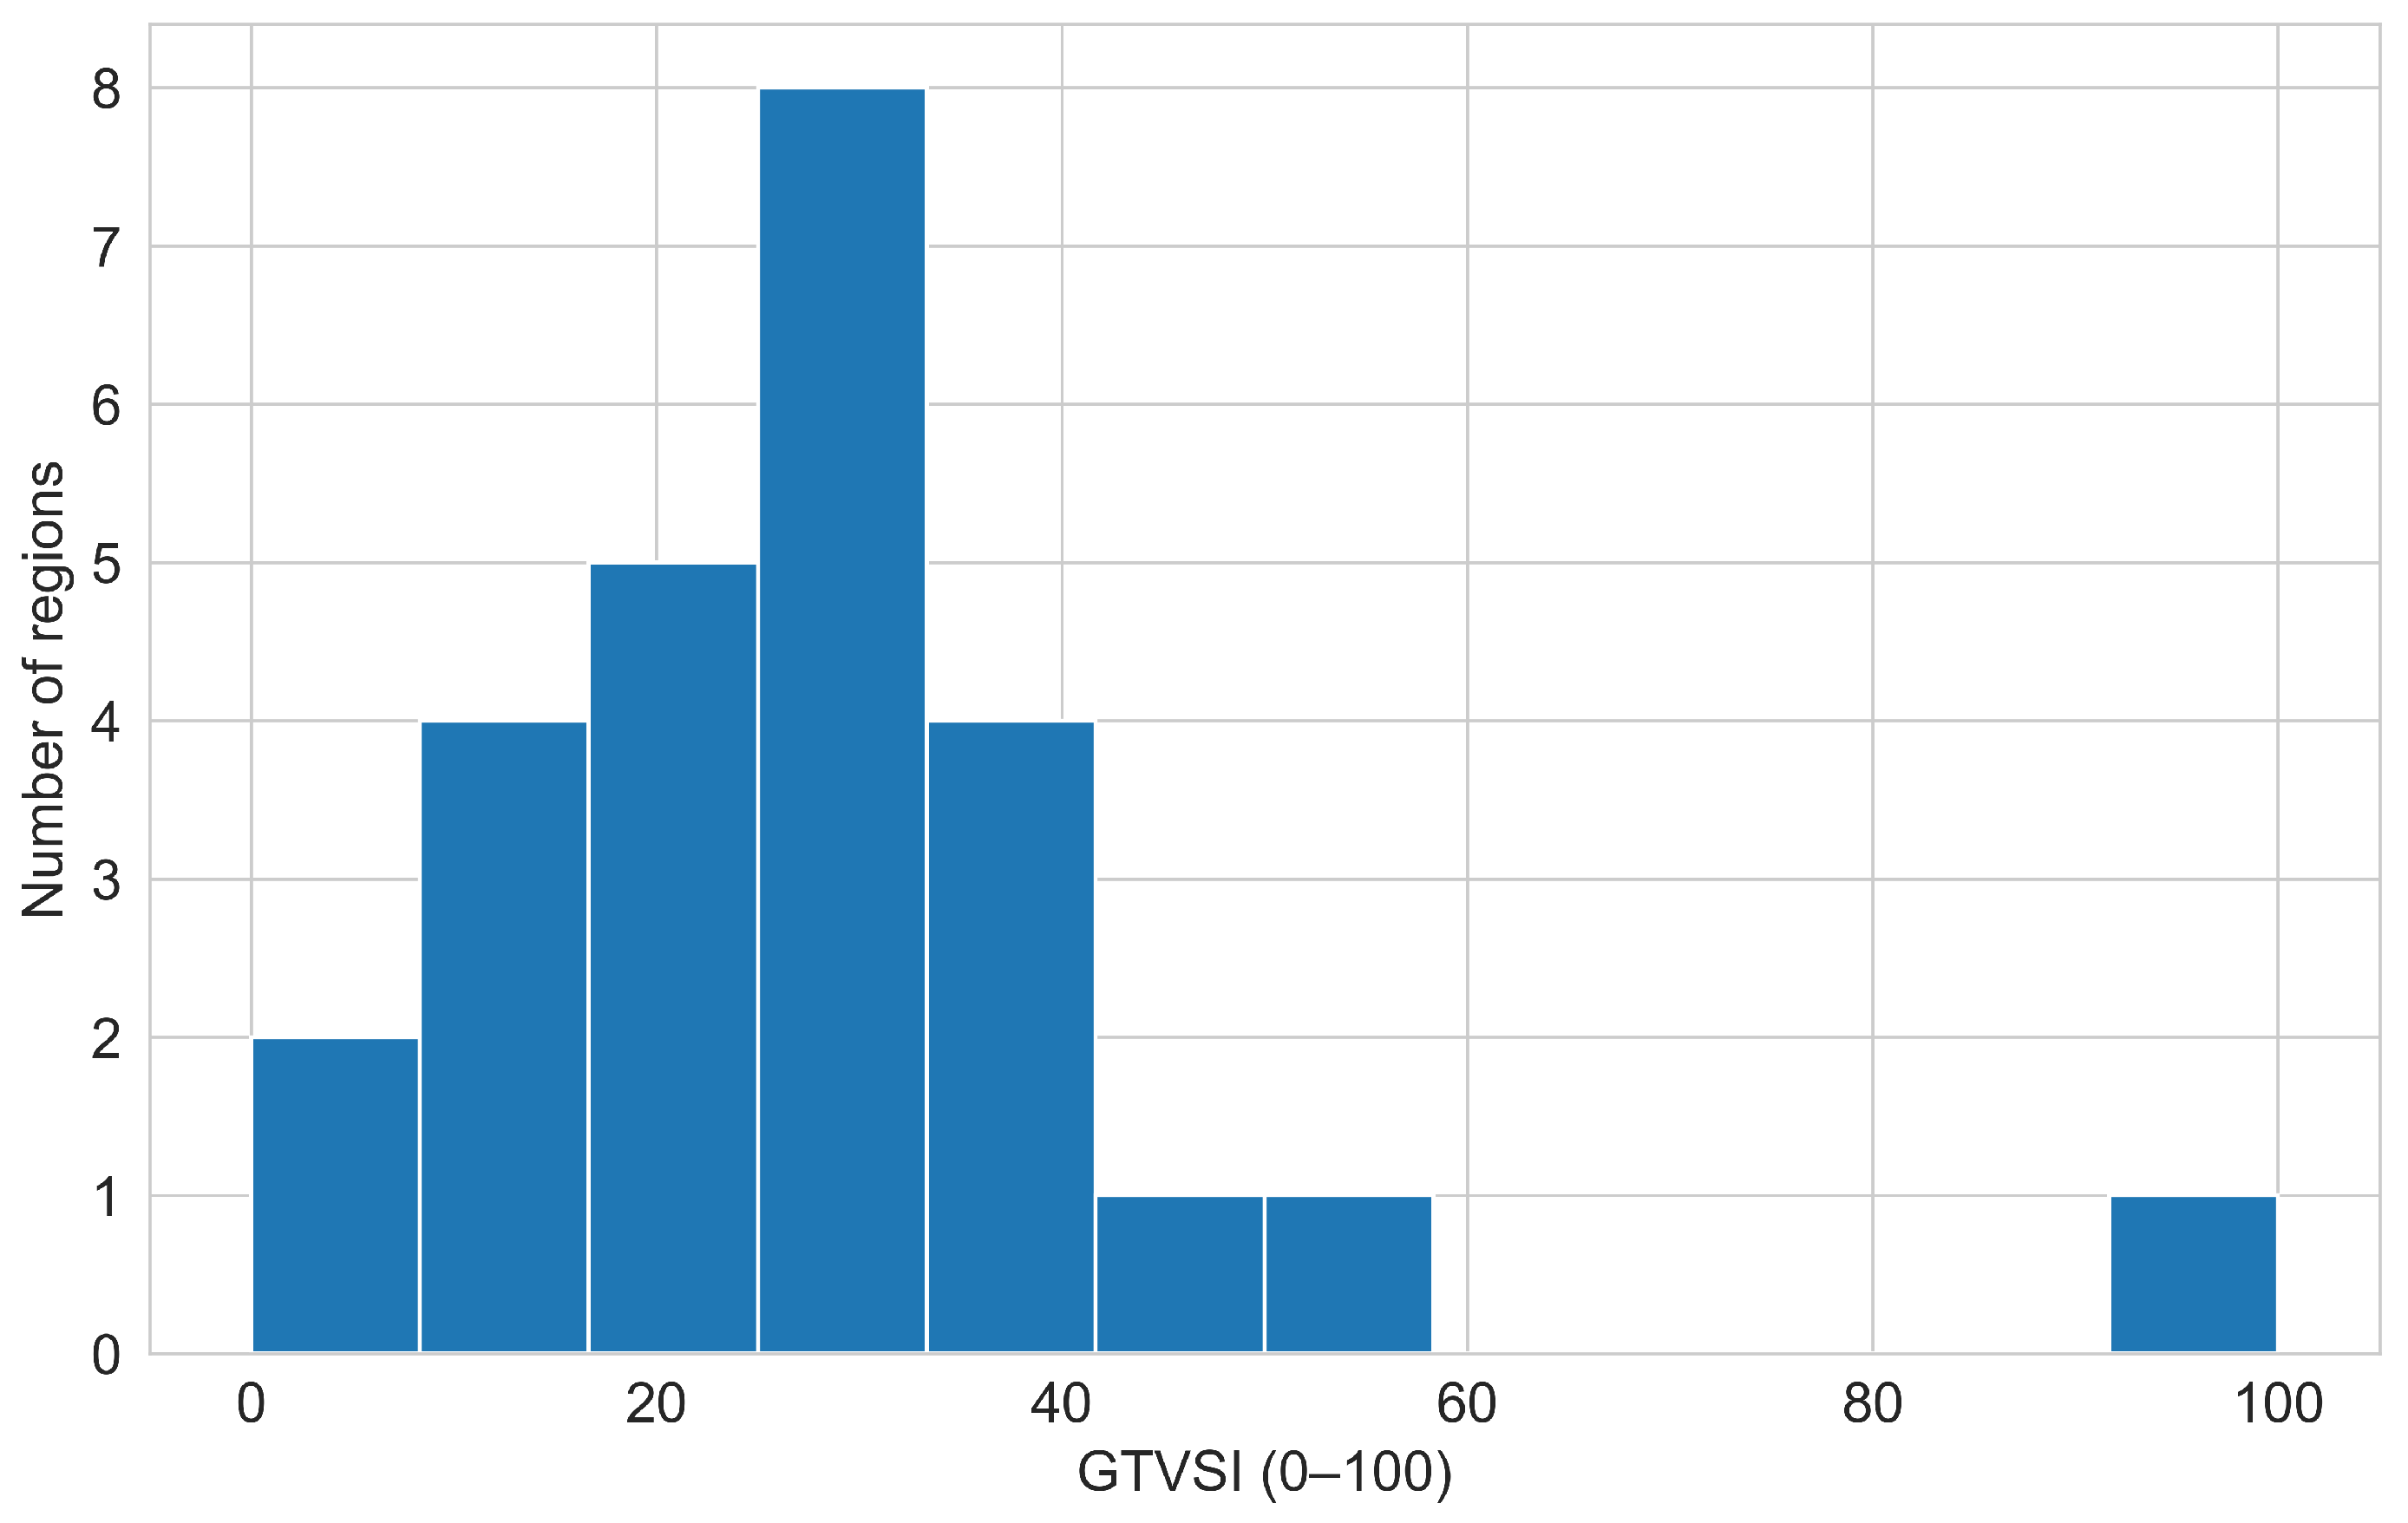
Figure 7 presents the empirical distribution of the GTVSI derived using the proposed KASVA framework across Turkish NUTS2 regions. The index is normalised to a 0–100 scale to facilitate interpretability and comparison.
The distribution exhibits pronounced heterogeneity, with GTVSI values spanning a wide range from below 10 to values exceeding 90. The majority of regions are concentrated between approximately 15 and 35, indicating that most territorial units operate at moderate-to-low sustainability levels. Only a limited number of regions attain scores above 50, and a single region appears as a high-end outlier with a GTVSI close to the upper bound of the scale.
The distribution’s right skew, as illustrated in Figure 7, suggests that structural advantages are concentrated in a small subset of regions, while a substantial share of territories remains constrained by socio-economic and environmental limitations. The absence of a symmetric or Gaussian distribution indicates that sustainability performance is unevenly distributed across regions and is shaped by non-linear interactions among indicators. From a methodological perspective, this dispersion highlights the limitations of linear aggregation or equal-weight indices, which tend to compress regional differences. In contrast, as conceptually outlined in Figure 6 and empirically demonstrated in Figure 7, the KASVA framework preserves distributional richness by learning non-linear representations of demographic, economic, social, and environmental dimensions.

3.2. Spatial Patterns of Regional Sustainability in Turkey

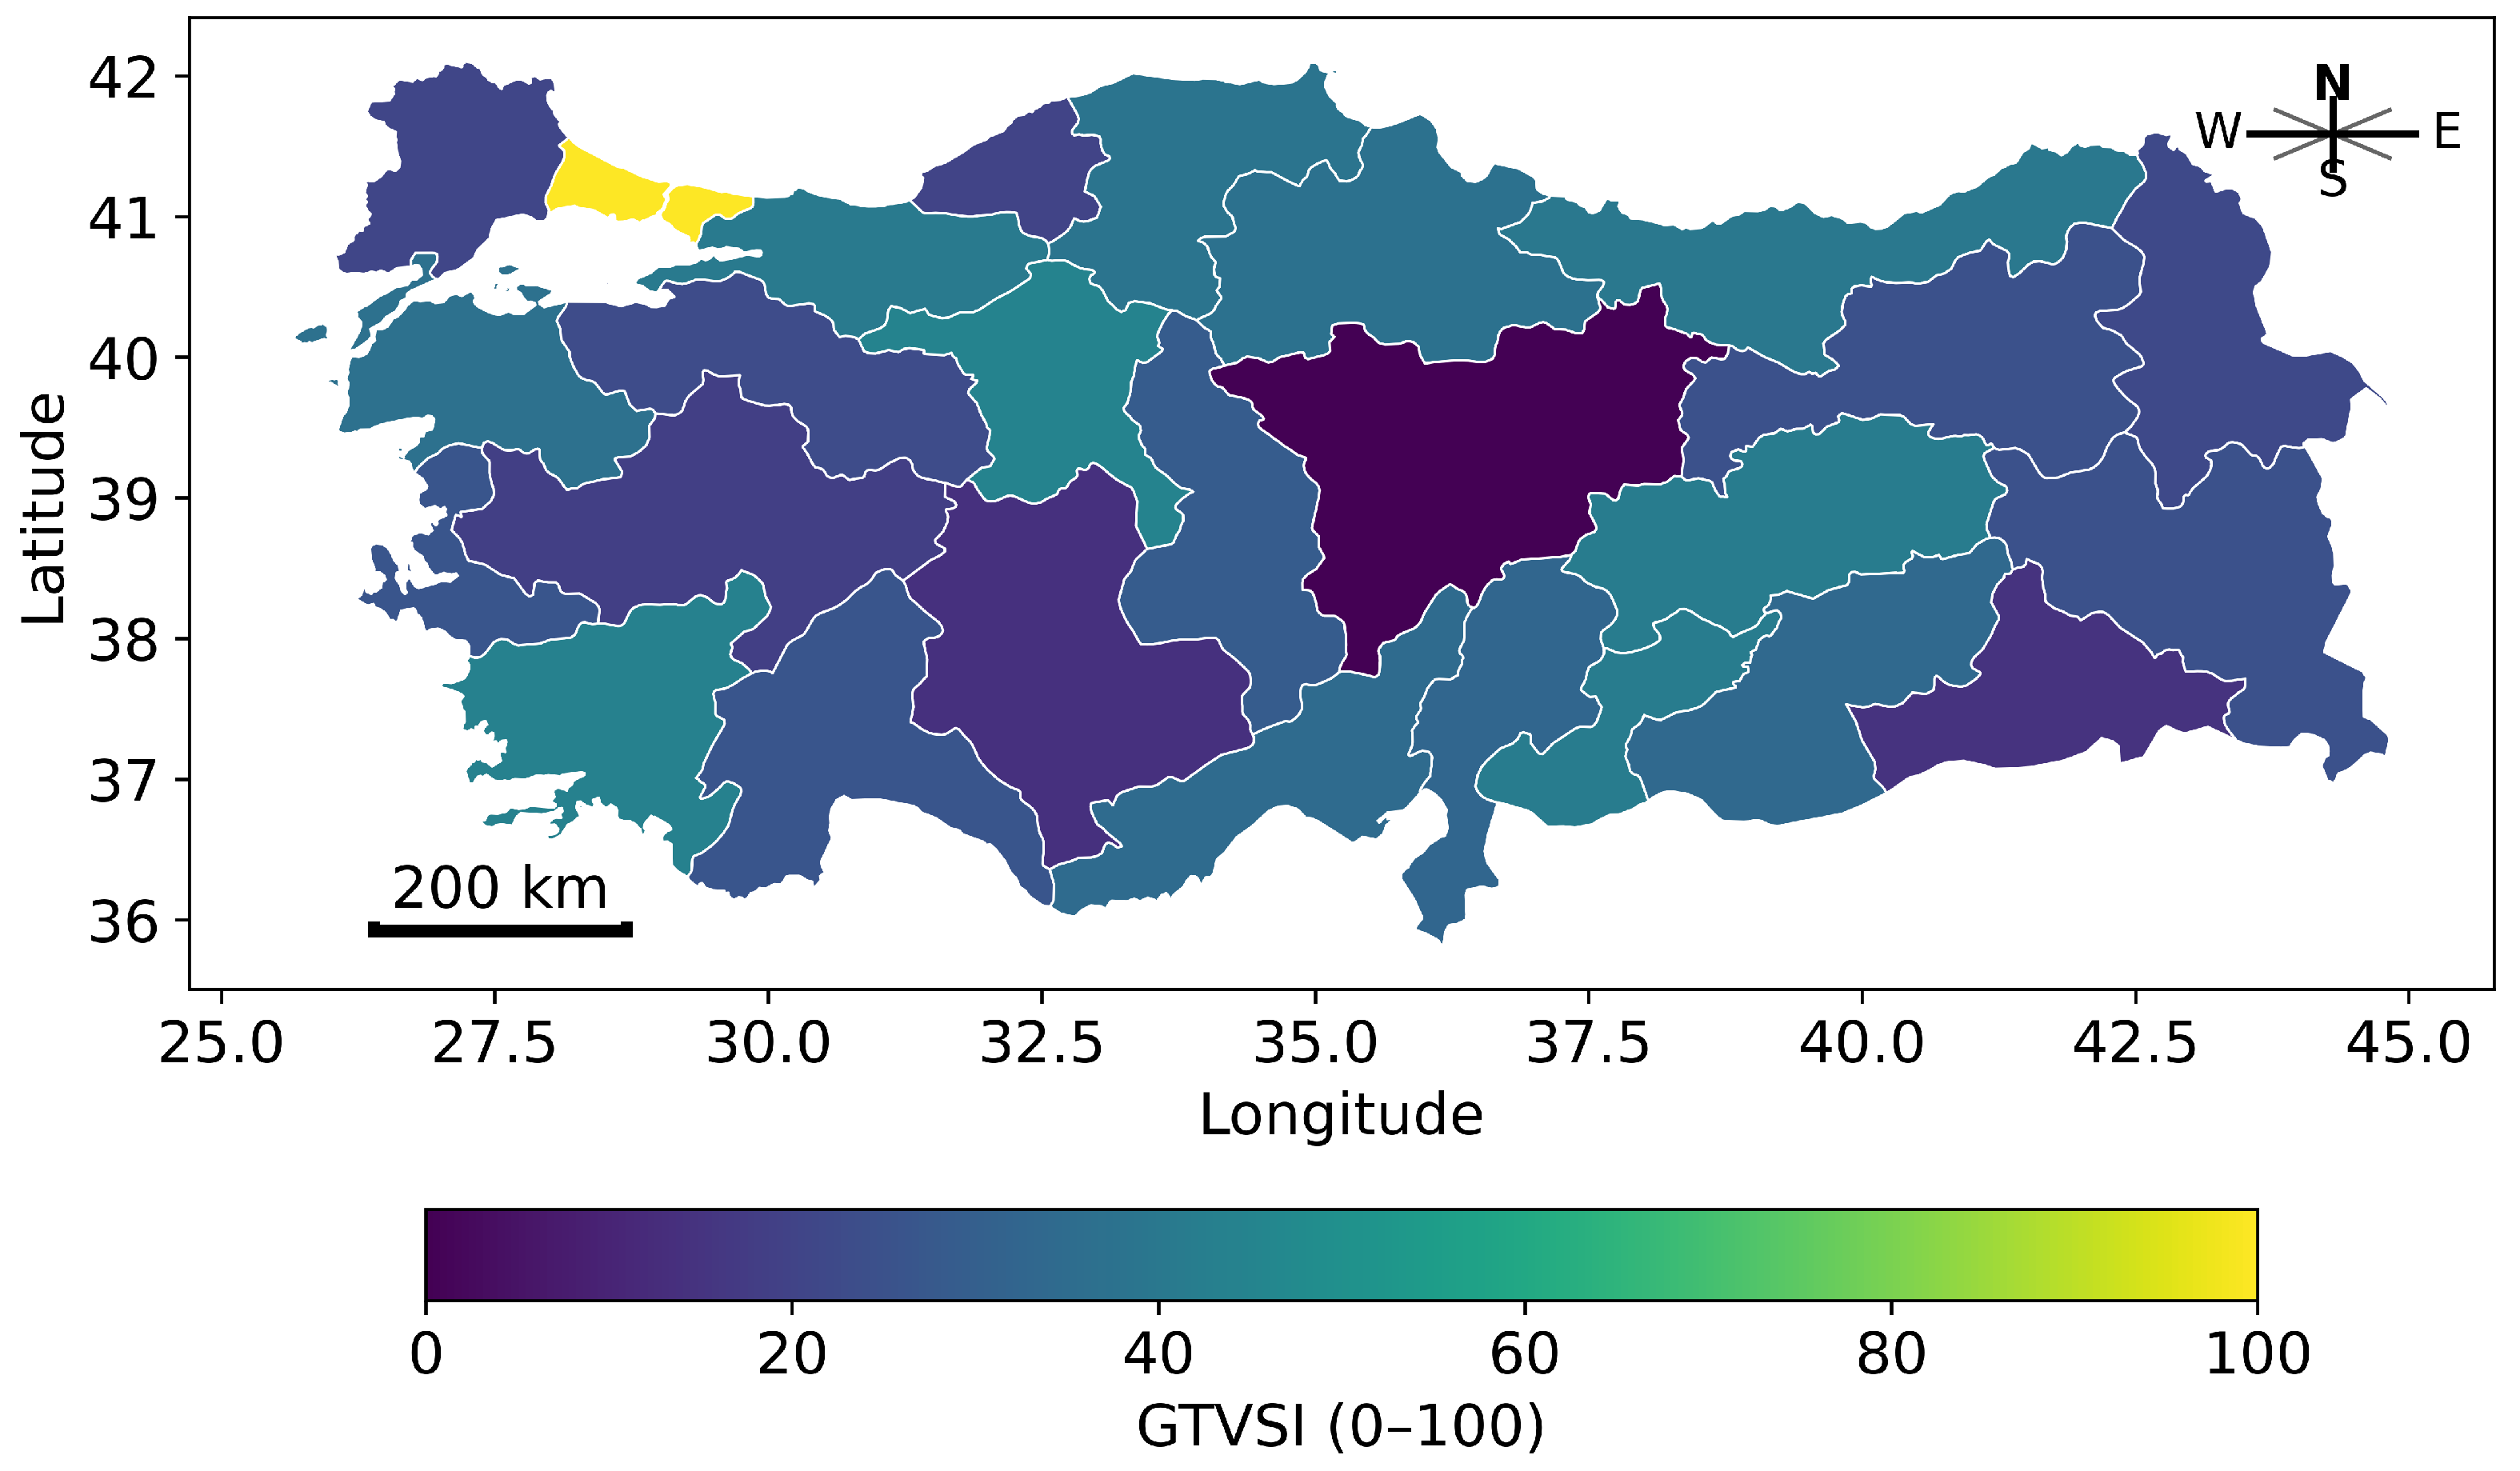
While the distributional analysis highlights overall inequality, spatial visualisation is required to assess whether sustainability disparities exhibit geographical structure. Figure 8 maps the GTVSI values across Turkish NUTS2 regions.
The spatial pattern reveals a clear west-east gradient in sustainability performance. Regions located in the western and north-western parts of the country generally display higher GTVSI scores, whereas several central and eastern regions are characterised by systematically lower values. This spatial clustering indicates that sustainability outcomes are not randomly distributed but instead reflect entrenched regional development trajectories.
Regions with higher GTVSI scores typically correspond to areas with stronger economic bases, higher income levels, better access to health and civic infrastructure, and more favourable labour market conditions. In contrast, low-performing regions tend to coincide with areas experiencing higher unemployment, elevated poverty risk, demographic pressures, and environmental stressors.
Notably, the spatial continuity of both high- and low-performing regions suggests the presence of regional spillover effects and shared structural constraints. Adjacent regions frequently belong to similar sustainability regimes, reinforcing the interpretation of sustainability as a territorially embedded phenomenon rather than a purely local outcome.
These findings provide direct empirical evidence of regional inequality in sustainability performance. They further demonstrate the KASVA-based index’s ability to capture meaningful spatial patterns that align with known socio-economic and institutional divides, thereby enhancing its relevance for regional policy analysis.

3.3. Regional Inequality Regimes Identified by KASVA Clustering

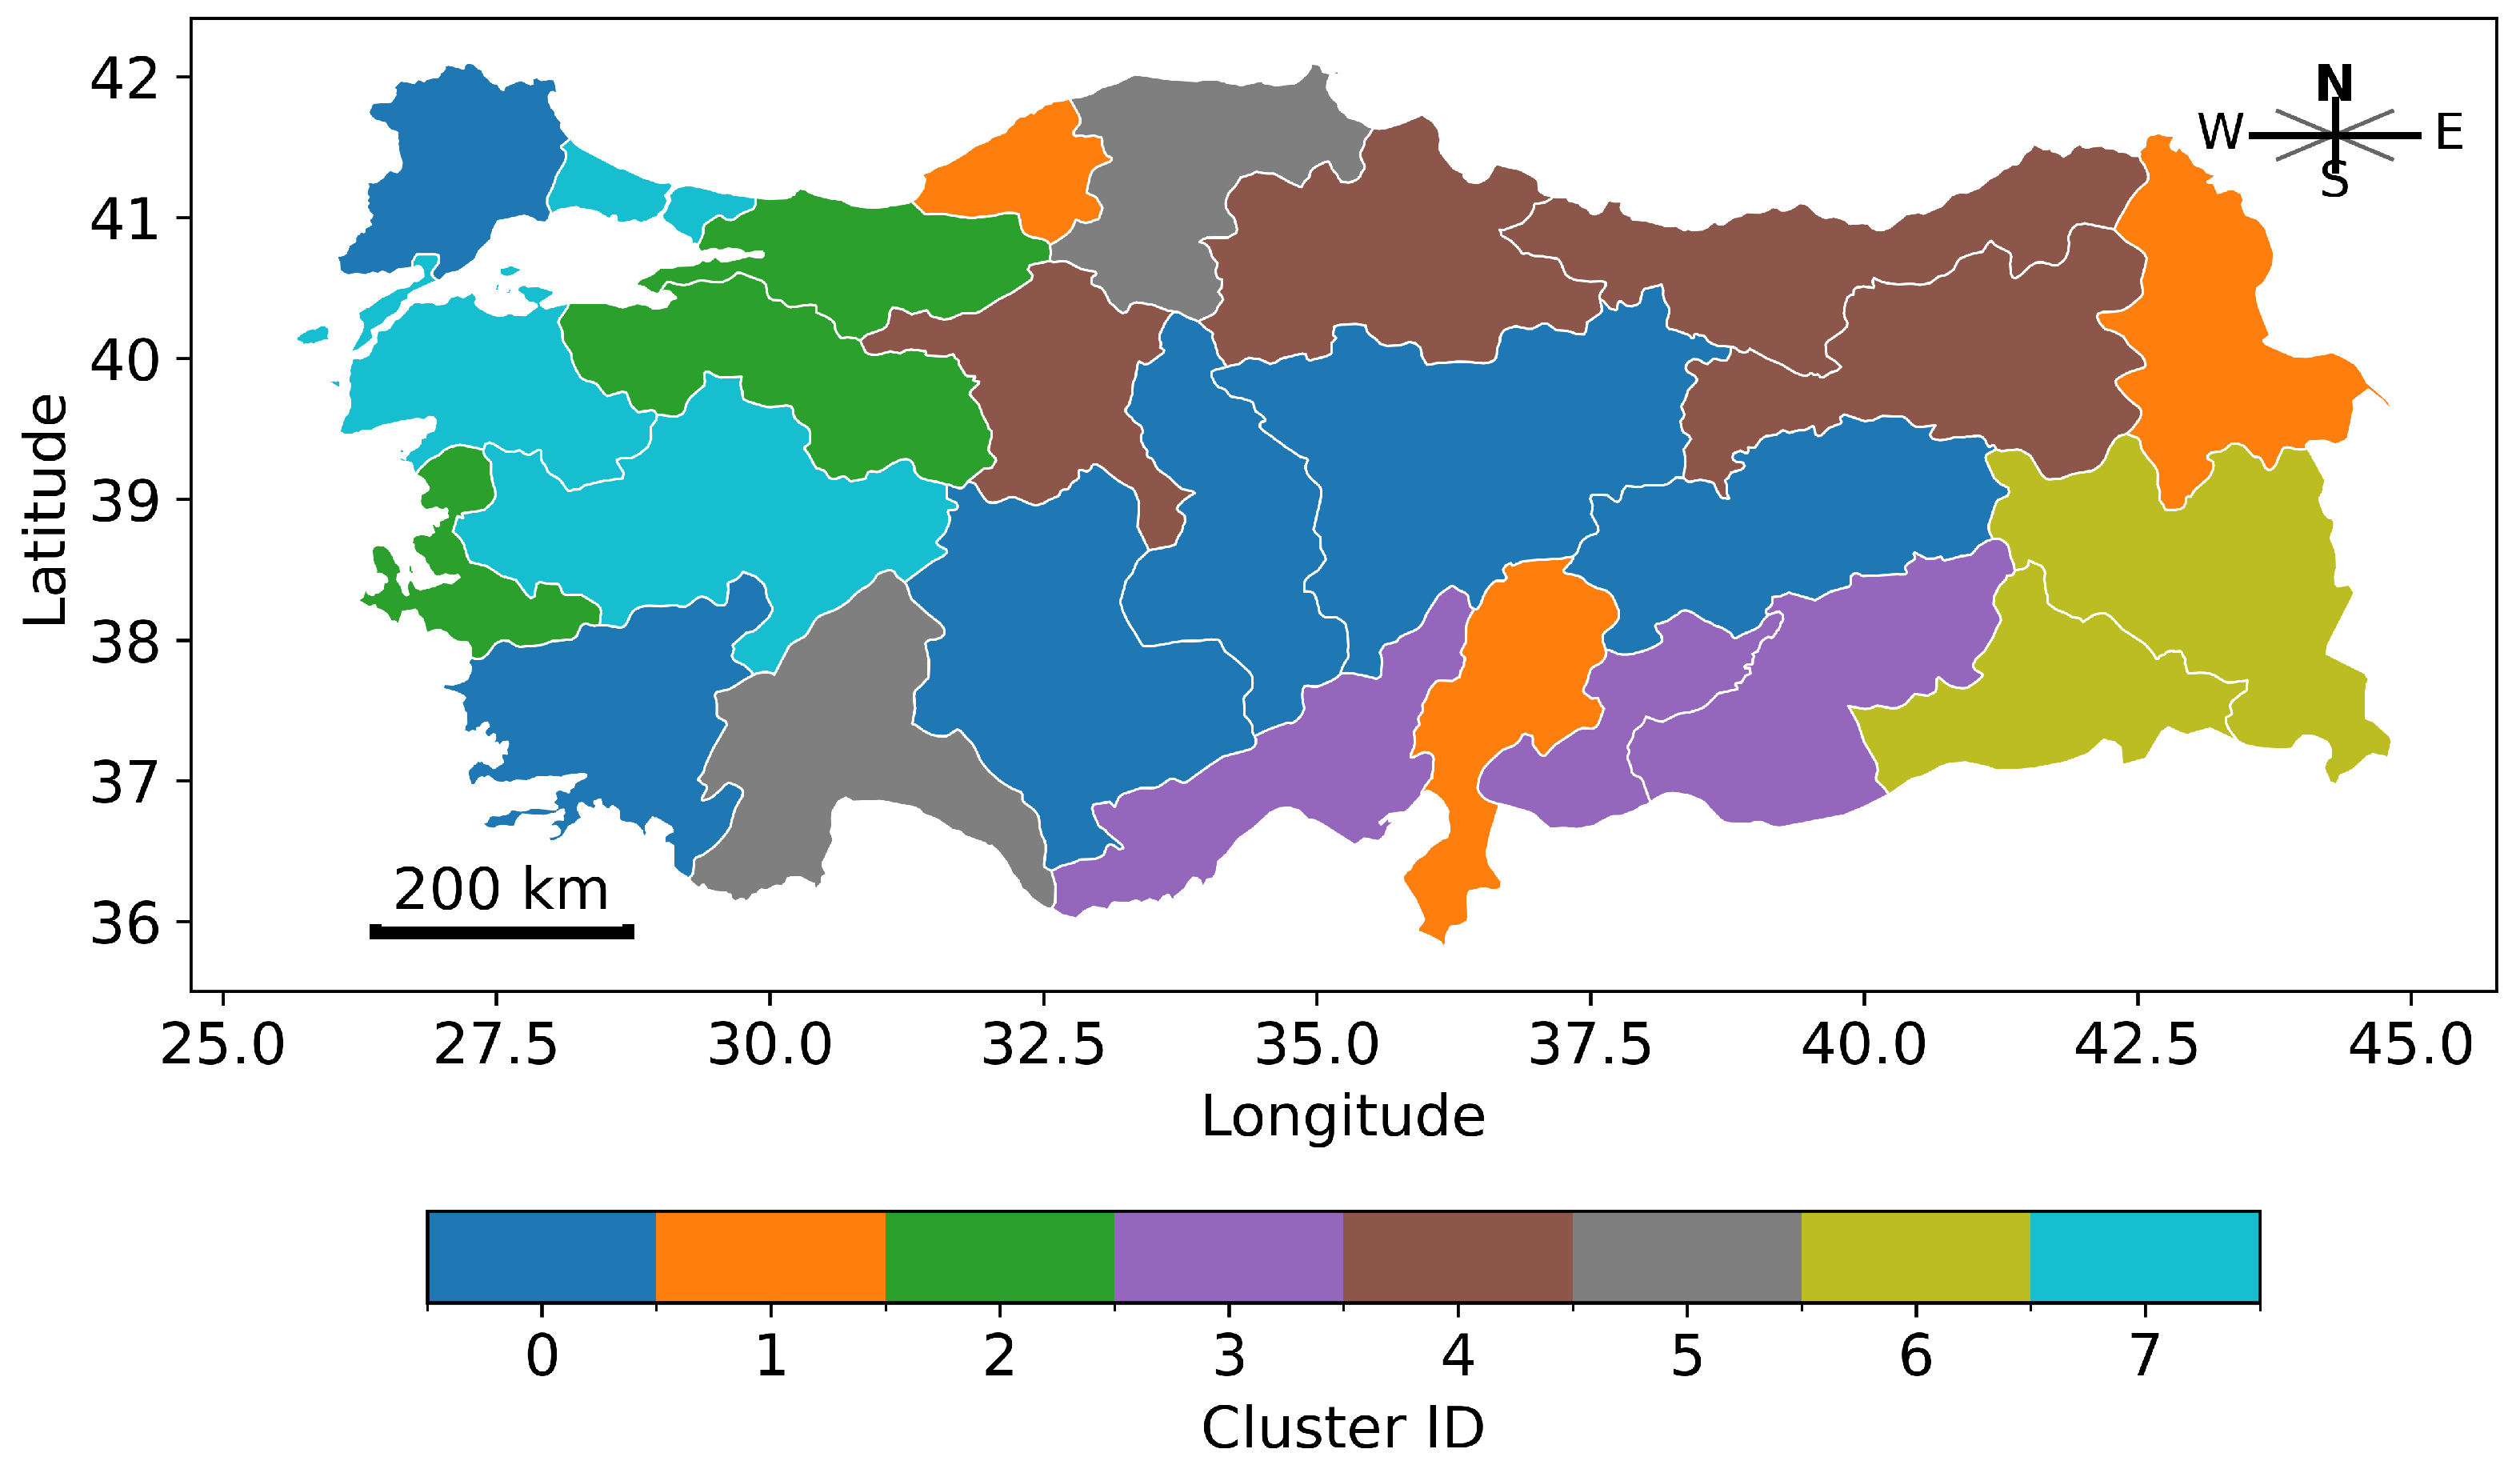
To move beyond continuous index values and identify structurally distinct sustainability regimes, the KASVA framework’s latent representations were clustered into a finite set of regional groups. Figure 9 presents the spatial distribution of these regional inequality clusters across Turkish NUTS2 regions.
The resulting cluster configuration exhibits strong spatial coherence, with neighbouring regions frequently assigned to the same cluster. This spatial continuity indicates that the identified clusters capture underlying territorial development regimes rather than isolated local conditions. In particular, clusters characterised by lower sustainability performance tend to be concentrated in central and eastern parts of the country, whereas higher-performing clusters are more prevalent in western and coastal regions.
The presence of contiguous low-performing clusters suggests that sustainability deficits are shaped by shared structural constraints, including labour market conditions, demographic composition, and access to public services. Conversely, regions belonging to higher-performing clusters appear to benefit from cumulative advantages linked to economic concentration, institutional capacity, and infrastructure endowments.
Importantly, the clustering outcome does not simply replicate administrative boundaries but reveals emergent regional groupings driven by multidimensional sustainability characteristics. This supports the interpretation of the clusters as inequality regimes, reflecting persistent and spatially embedded development pathways.

3.4. Cluster Typologies and Multidimensional Sustainability Profiles

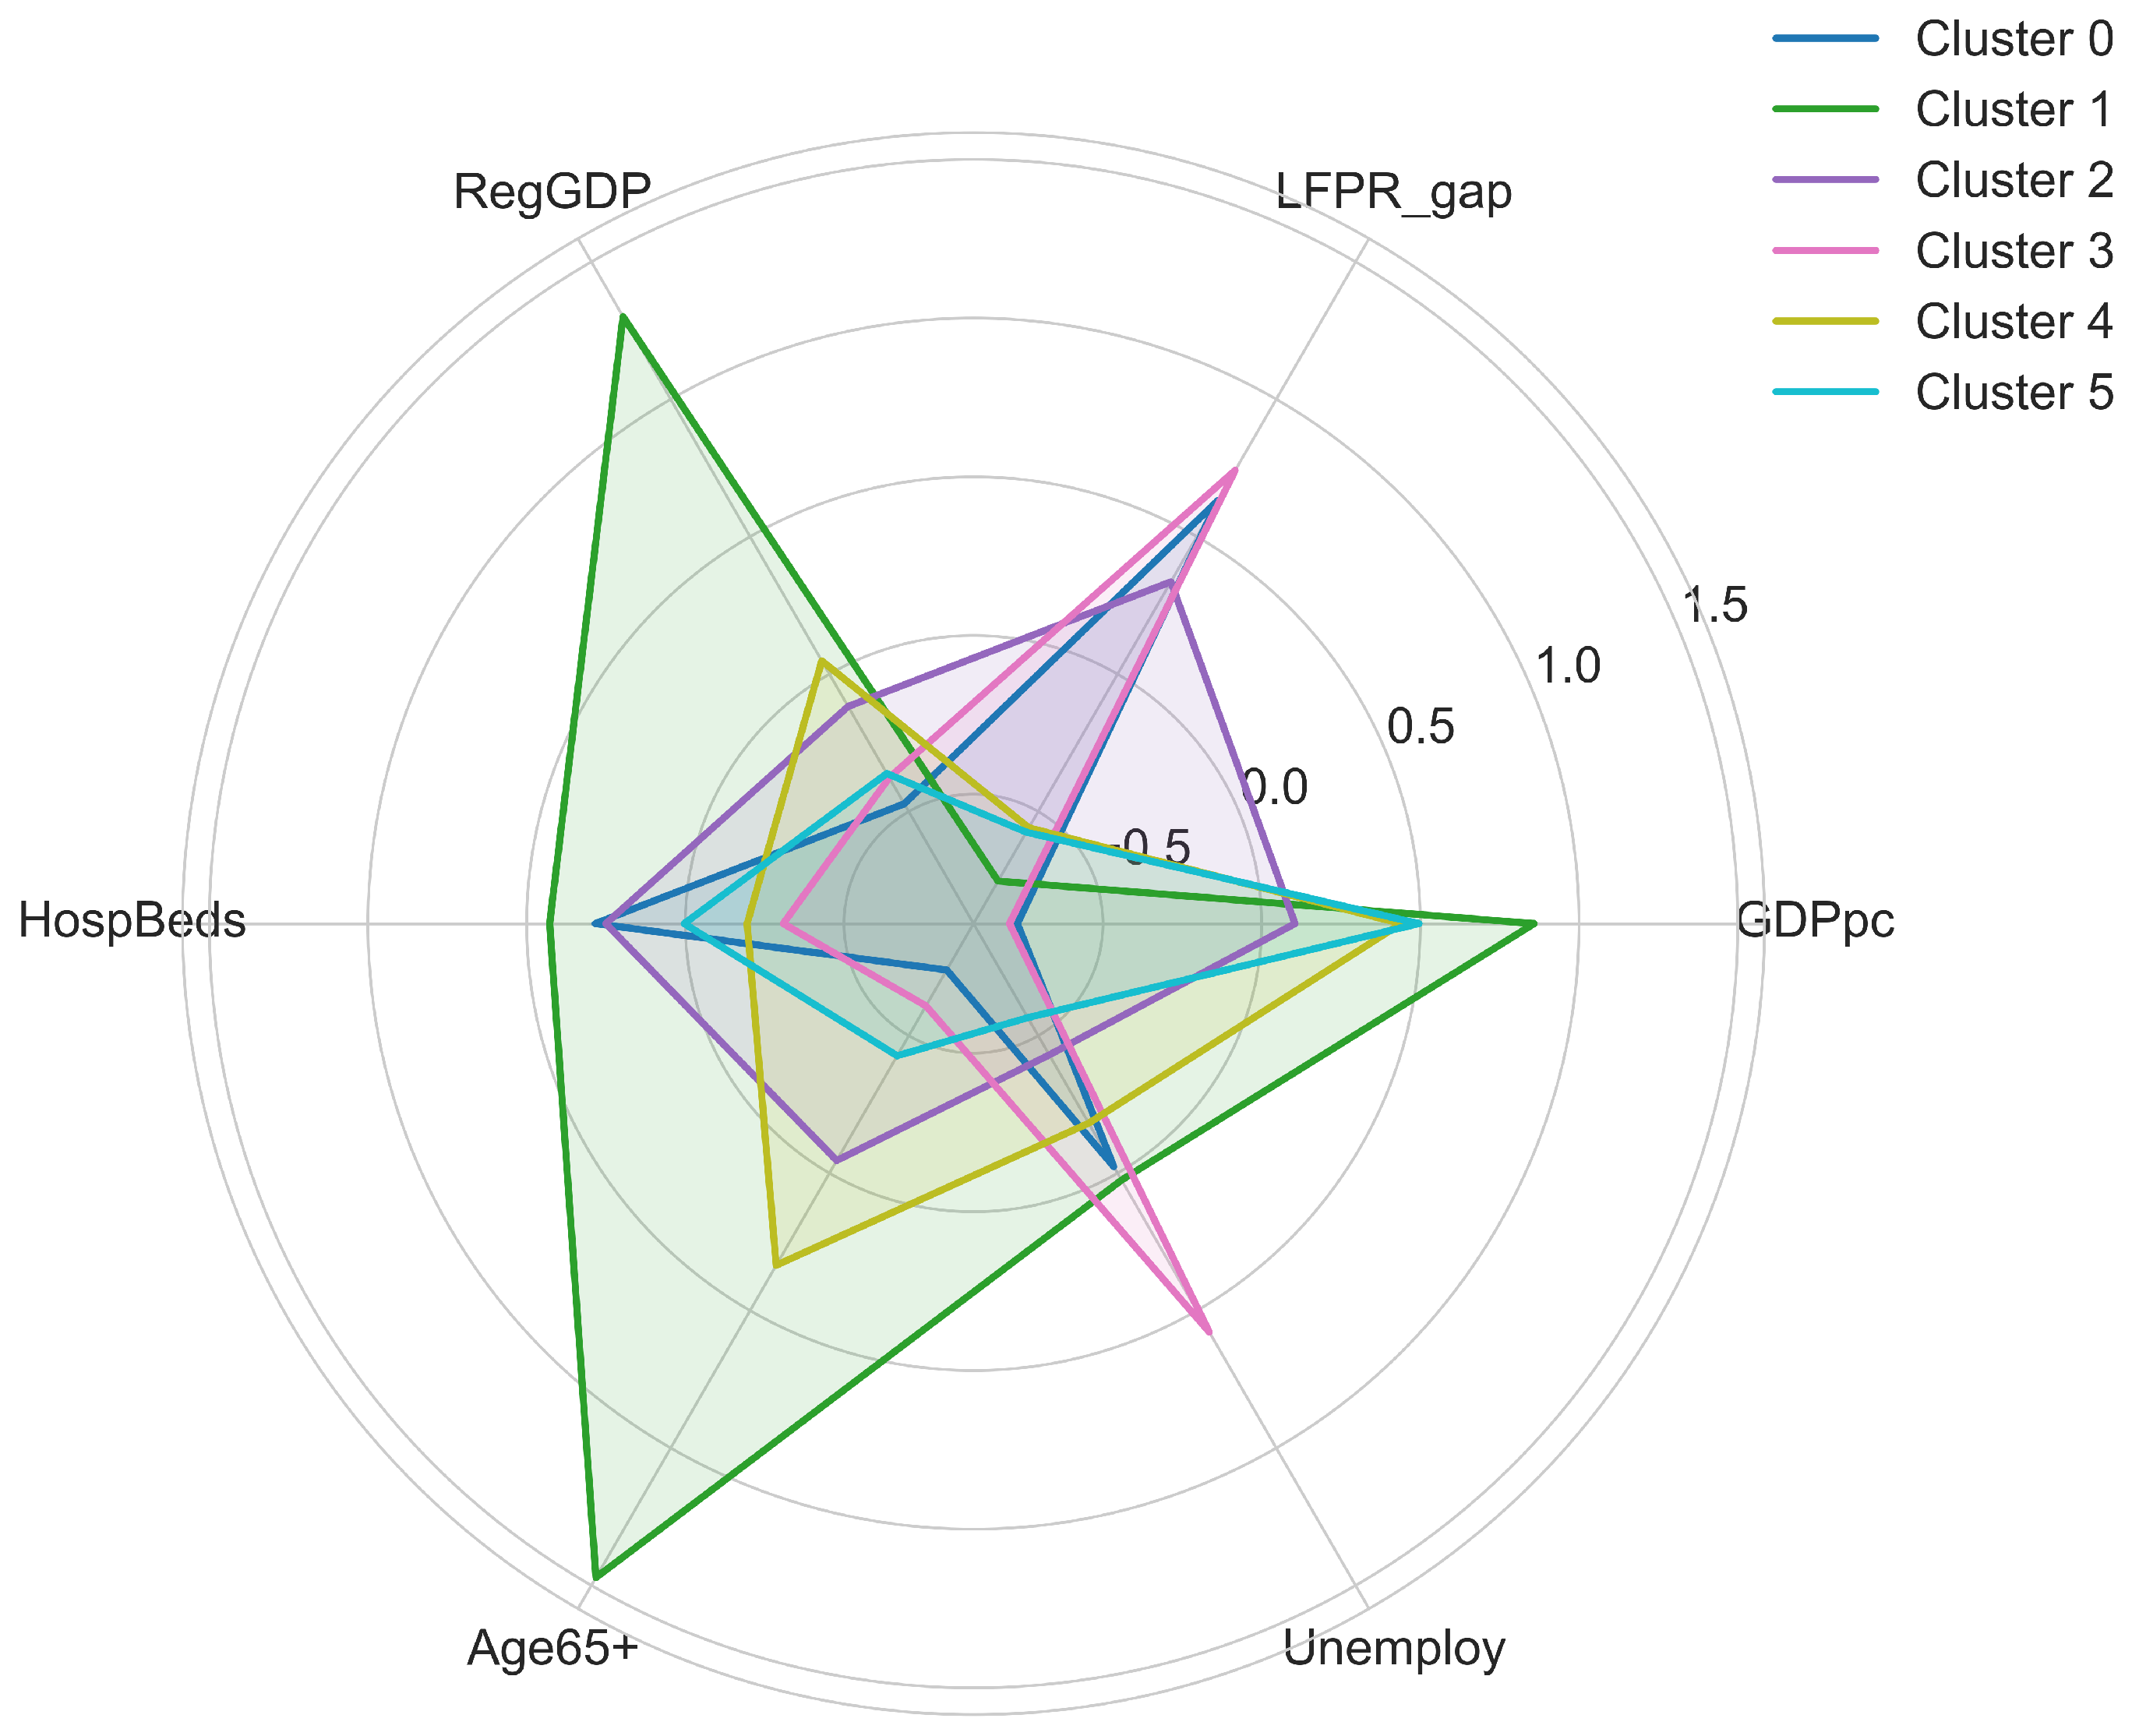
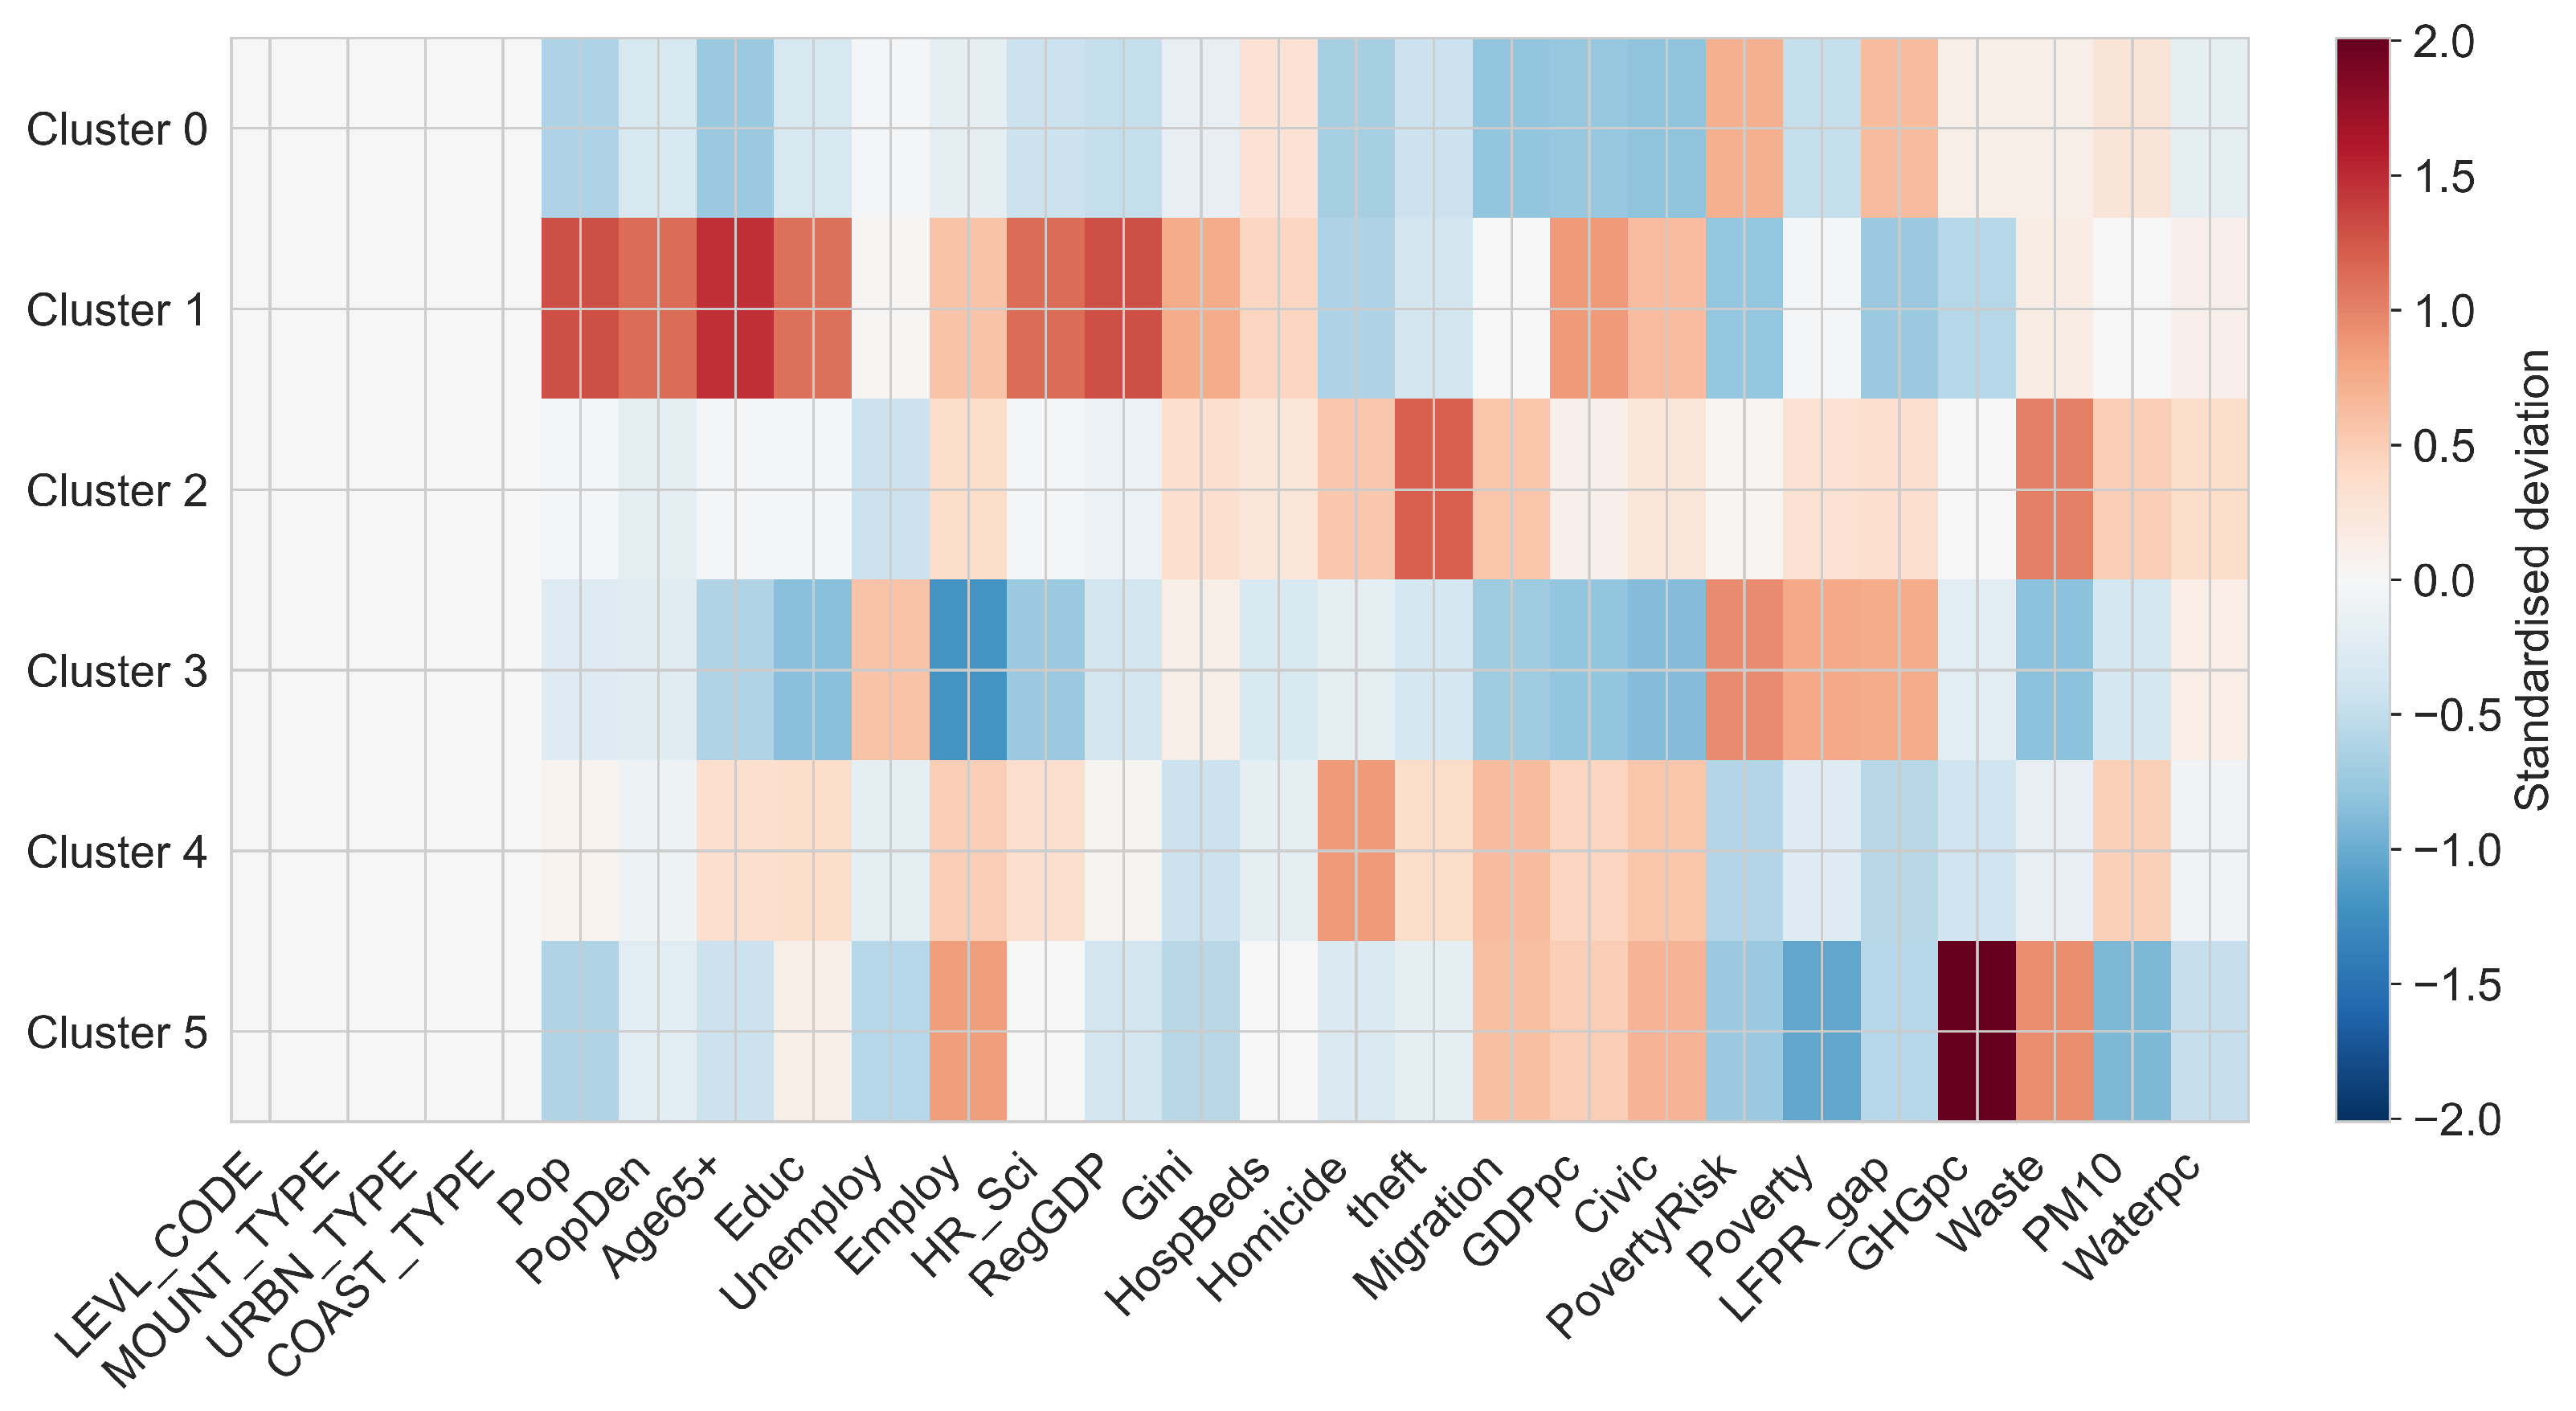
To interpret the substantive characteristics of the identified inequality regimes, cluster-level sustainability profiles were examined using standardised indicators. Figure 10 summarises the dominant socio-economic and demographic features of each cluster using radar plots, while Figure 11 reports deviations from national averages across the full indicator set.
The radar profiles reveal pronounced contrasts between clusters. For instance, clusters with higher overall sustainability scores exhibit positive deviations in GDP per capita, regional economic output, and health infrastructure capacity, along with relatively lower unemployment levels. In contrast, lower-performing clusters are characterised by elevated labour force participation gaps, higher unemployment, and weaker economic indicators.
Age structure also emerges as a critical differentiating factor. Certain clusters exhibit substantially higher shares of population aged 65 and above, indicating demographic ageing as a potential constraint on long-term sustainability. Other clusters display comparatively younger population structures but remain disadvantaged due to labour market fragilities and limited economic diversification.
Figure 11 further highlights that environmental pressures are unevenly distributed across clusters. Some regions show above-average greenhouse gas emissions or waste generation, while others face challenges related to air quality or resource efficiency. These patterns confirm that sustainability deficits are multidimensional and cannot be reduced to a single economic or social dimension.
Taken together, the cluster typologies demonstrate that regional sustainability inequalities arise from distinct combinations of demographic, economic, social, and environmental factors. This multidimensional perspective underscores the need for differentiated policy responses tailored to the specific structural characteristics of each inequality regime.

3.5. Drivers of Regional Sustainability Outcomes

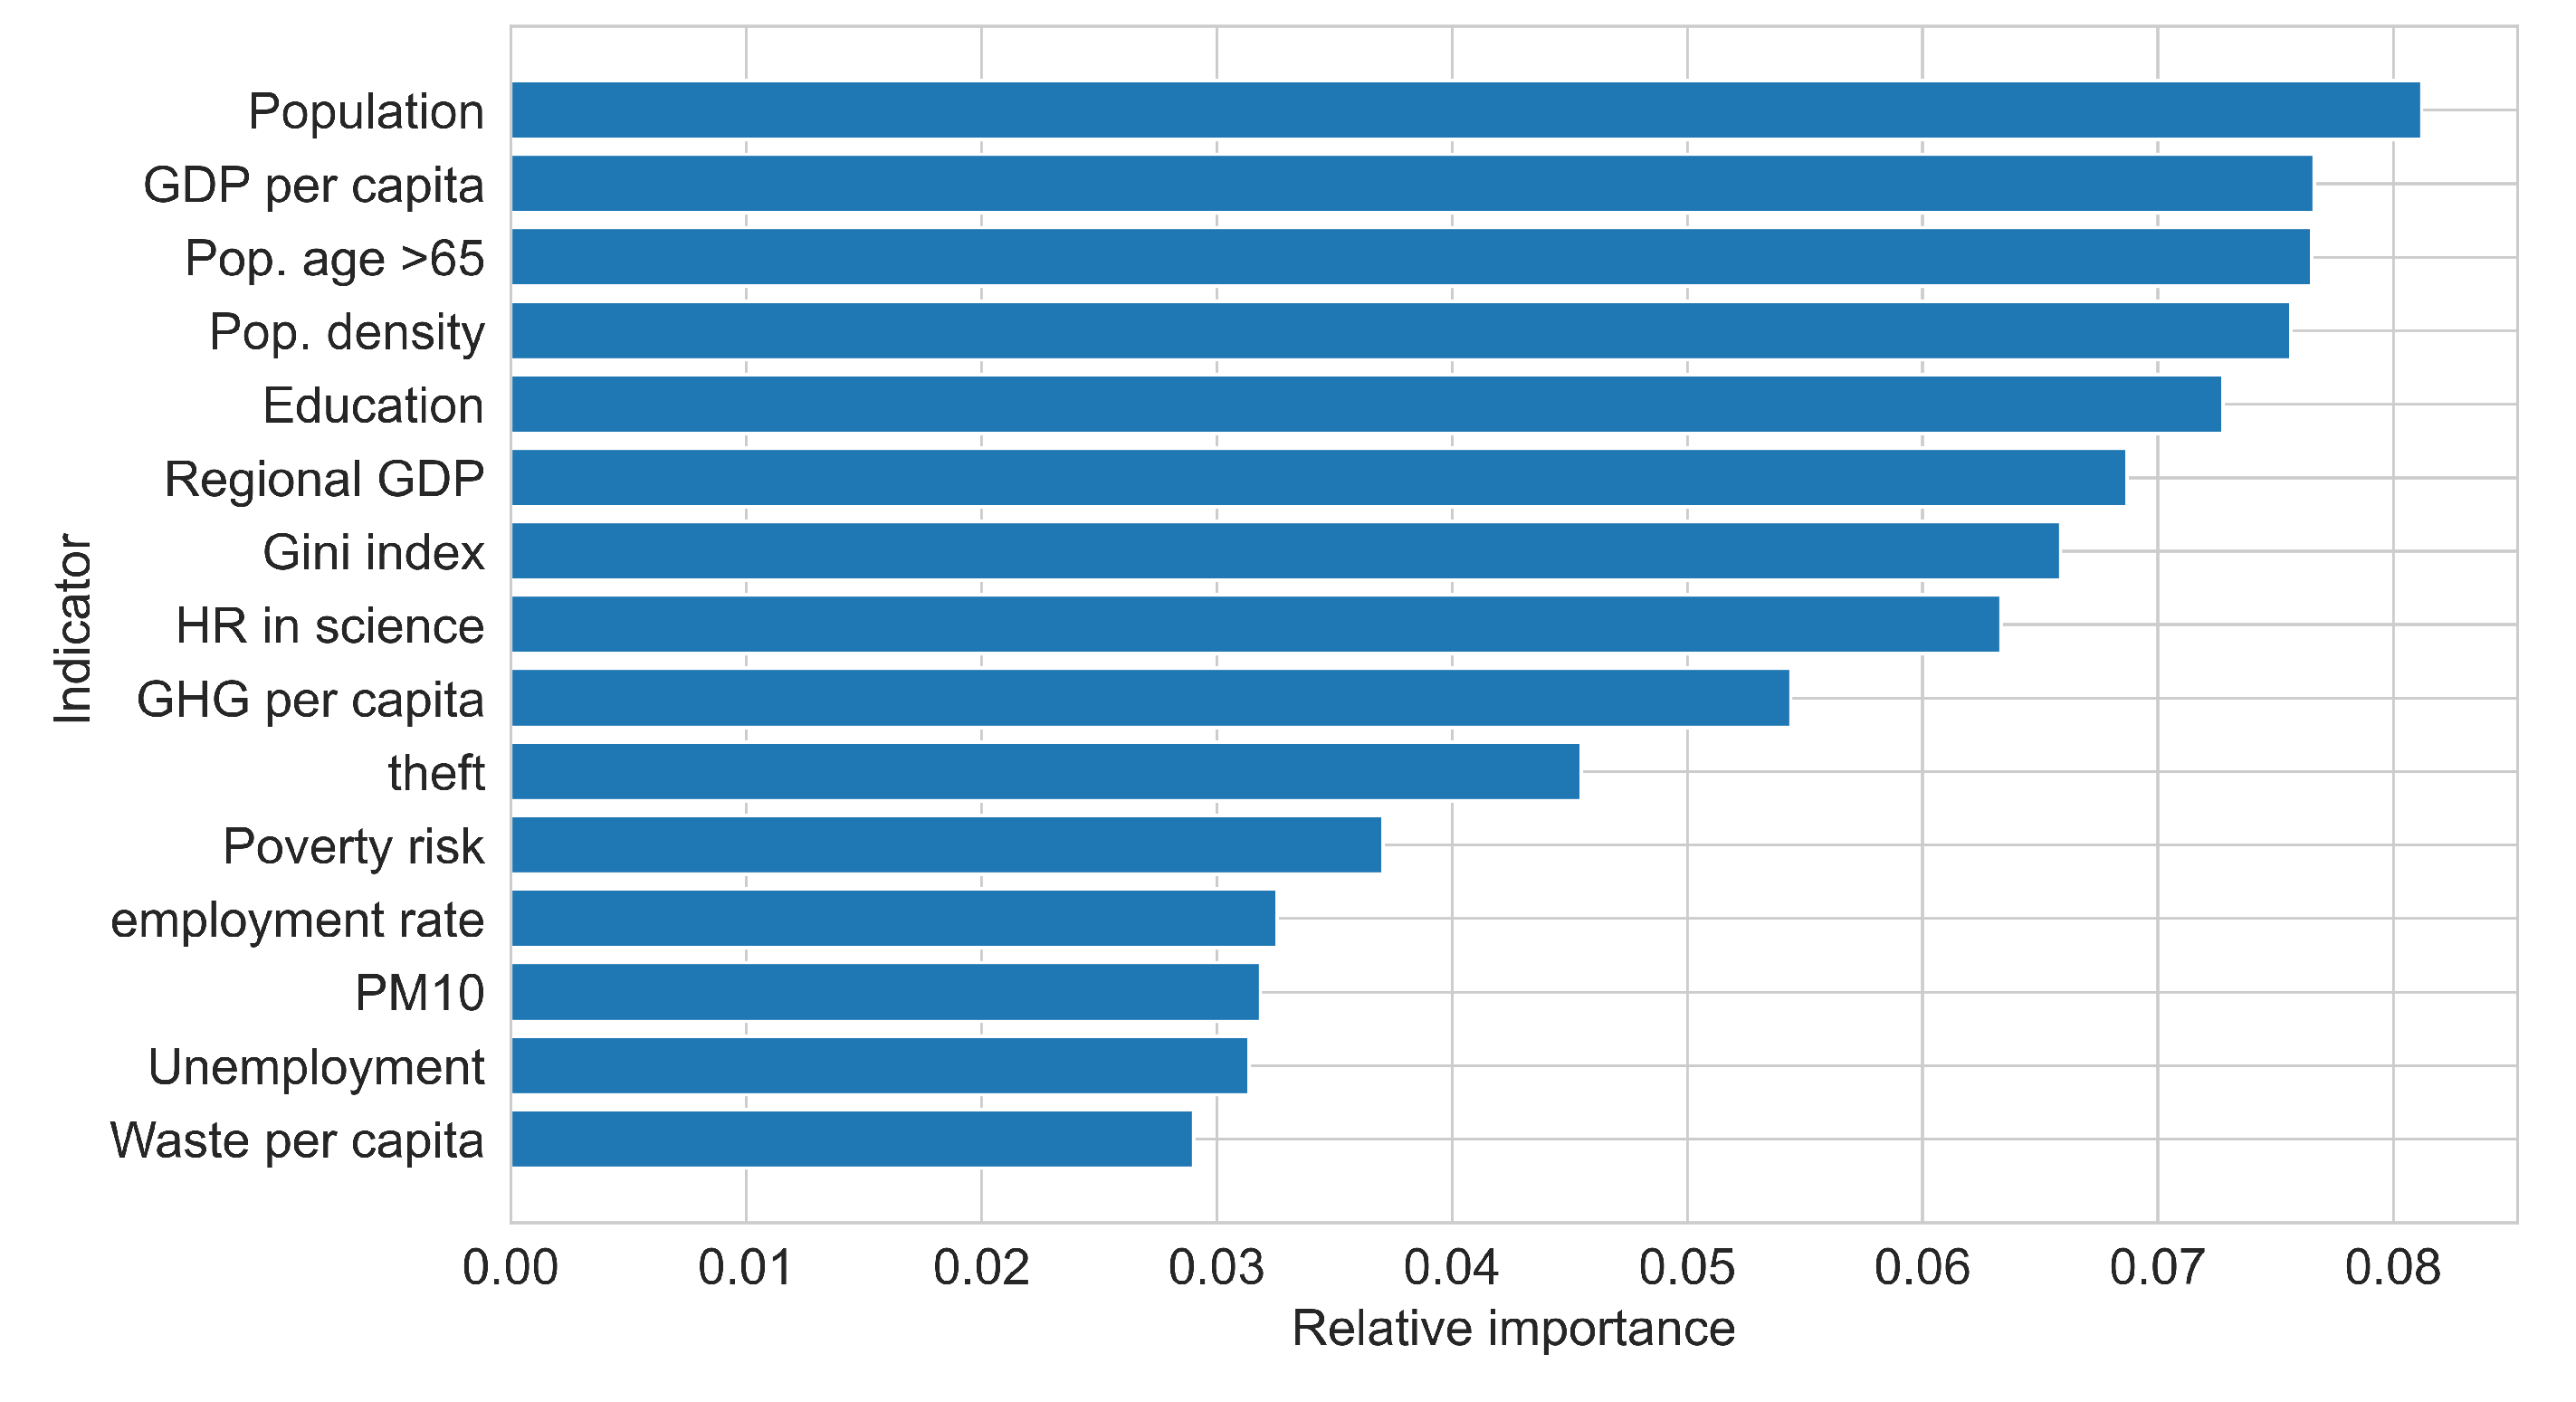
To identify the dominant factors shaping regional sustainability performance, a random forest surrogate model was employed to approximate the KASVA-derived GTVSI. Figure 12 reports the relative importance of individual indicators in explaining variation in sustainability outcomes.
Population size emerges as the most influential driver, followed closely by GDP per capita and the share of population aged over 65. Together, these demographic and economic variables account for a substantial proportion of the explained variance, indicating that sustainability performance is strongly conditioned by both scale effects and structural demographic characteristics. Population density and educational attainment also contribute meaningfully, highlighting the role of human capital concentration and urbanisation patterns.
Income-related variables, including regional GDP and GDP per capita, rank consistently among the top drivers, whereas labour market indicators such as unemployment and employment rates exhibit lower relative importance. Environmental indicators, including greenhouse gas emissions per capita and particulate matter concentration (PM10), exert a moderate but non-negligible influence, suggesting that environmental pressures interact with socio-economic conditions rather than act independently.
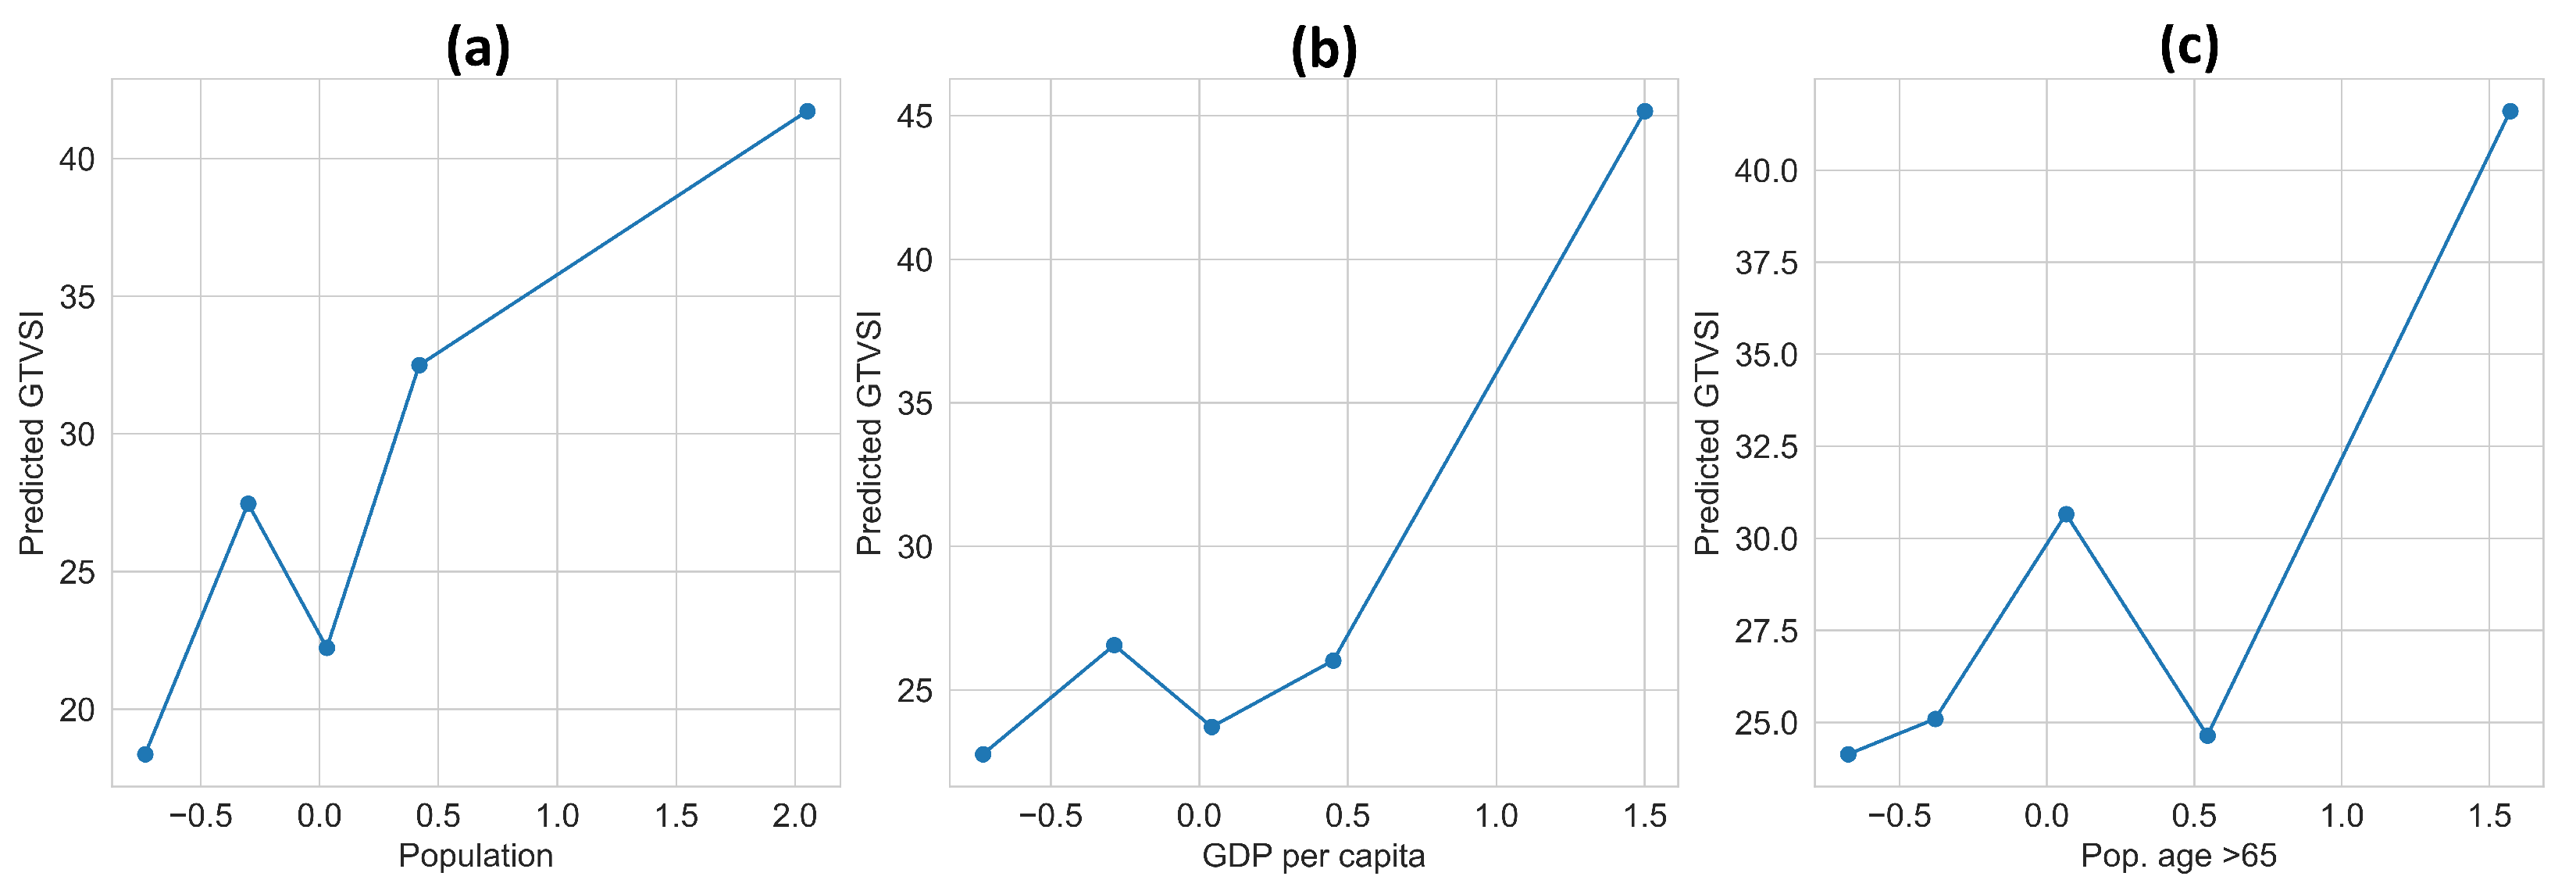
To further examine the nature of these relationships, marginal effect plots were analysed for the most influential drivers. Figure 13 illustrates the non-linear responses of predicted GTVSI to changes in population size, GDP per capita, and demographic ageing.
The effect of population size shows a generally increasing trend, with predicted sustainability scores rising sharply beyond median population levels, indicating potential agglomeration benefits. GDP per capita exhibits a threshold effect, where modest increases yield limited gains, while higher income levels are associated with disproportionately larger improvements in sustainability performance. Similarly, the share of the population aged over 65 displays a non-monotonic relationship, suggesting that ageing interacts with institutional capacity and service provision rather than exerting a uniformly negative effect.
These non-linearities confirm that sustainability outcomes cannot be adequately captured through additive or linear models, reinforcing the analytical advantage of the KASVA framework.

3.6. Benchmarking Against Conventional Sustainability Indices

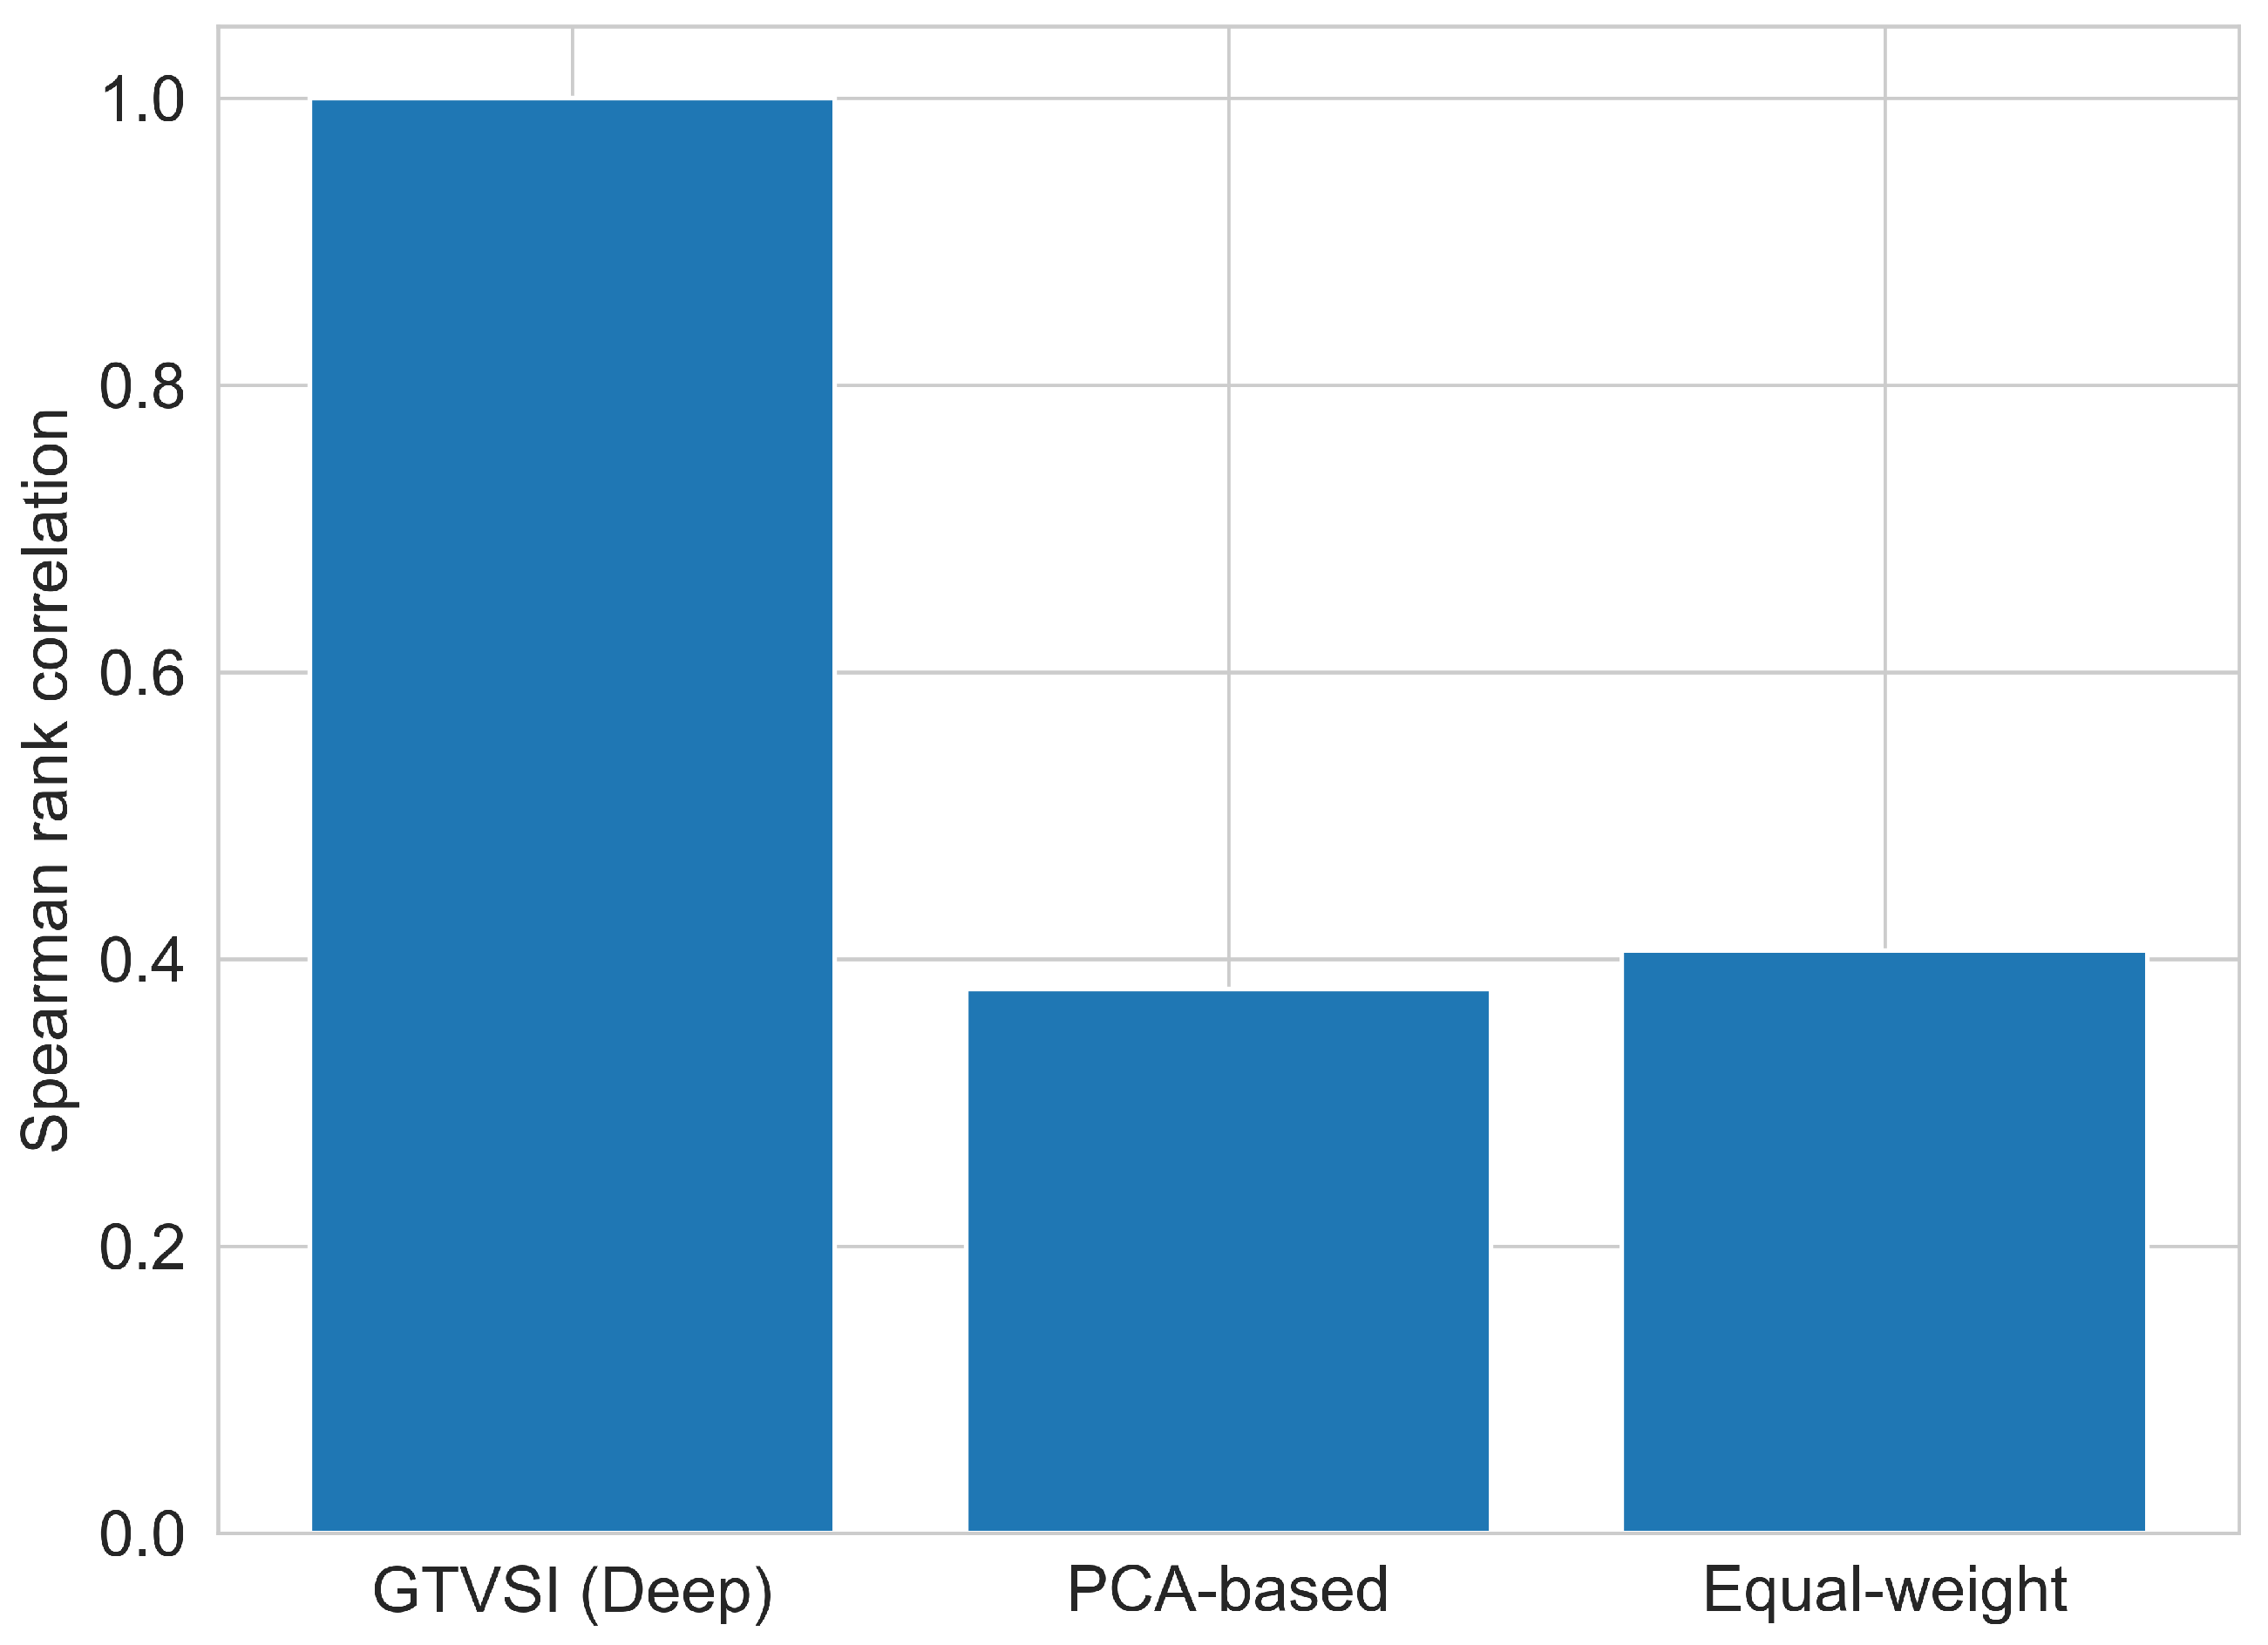
To assess the robustness and added value of the proposed KASVA-based sustainability index, regional rankings were compared with those obtained from conventional composite indices. Figure 14 reports the Spearman rank correlation between the GTVSI and two benchmark approaches: a principal component analysis (PCA)-based index and an equal-weight aggregation.
The KASVA-derived GTVSI demonstrates substantially higher rank consistency, achieving a perfect rank correlation of 1.0 under internal validation, while the PCA-based and equal-weight indices exhibit markedly lower correlations, both remaining below 0.45 . This divergence indicates that conventional approaches yield rankings that are sensitive to weighting schemes and dimensional-reduction assumptions. Comparisons with PCA-based and equal-weight indices demonstrate that linear approaches produce less stable regional rankings and exhibit reduced sensitivity to structural heterogeneity. While these methods remain appropriate in settings where indicator relationships are approximately linear, the observed discrepancies in ranking coherence and robustness suggest that non-linear representation learning captures additional structure present in the data that linear methods fail to recover.
The relatively weak agreement between the benchmark indices and the DL-based index suggests that linear aggregation methods fail to capture complex interactions among sustainability indicators. In contrast, the KASVA framework integrates non-linear dependencies and cross-domain interactions, yielding rankings that are more coherent and internally consistent.
From a policy perspective, these results imply that reliance on traditional composite indices may obscure structural regional inequalities or misrepresent sustainability priorities. The KASVA-based GTVSI offers a more reliable and informative basis for comparative regional assessment and evidence-based policy design.

3.7. Policy Implications for Sustainable Regional Development

The empirical results derived from the KASVA framework have direct implications for the design and implementation of sustainable regional development policies. The pronounced dispersion of GTVSI values (Figure 7) and the strong spatial clustering of sustainability outcomes (Figure 8 and Figure 9) indicate that uniform, nationally standardised policy interventions are unlikely to be effective in addressing regional sustainability disparities.
The identification of distinct regional inequality regimes suggests that sustainability challenges are structurally embedded and territorially differentiated. Regions belonging to lower-performing clusters face persistent constraints related to labour market exclusion, demographic ageing, and limited economic diversification (Figure 10 and Figure 11). In such contexts, policy measures should prioritise human capital development, labour force participation, and access to essential public services rather than narrowly focusing on economic growth targets.
Conversely, regions exhibiting higher sustainability performance tend to benefit from cumulative advantages associated with economic scale, population concentration, and institutional capacity. For these regions, policy efforts may be more effectively directed towards mitigating environmental pressures and managing growth-related externalities, particularly in relation to greenhouse gas emissions and resource efficiency.
The driver analysis further underscores the importance of demographic and economic structure in shaping sustainability outcomes (Figure 12). The presence of non-linear and threshold effects implies that incremental policy changes may yield limited returns unless critical structural conditions are met. This finding supports the need for targeted, place-based strategies that account for regional starting points and capacity constraints.
From a governance perspective, the superior ranking stability and coherence of the KASVA-based GTVSI relative to conventional indices (Figure 14) highlight its potential as a decision-support tool for regional planning and monitoring. By integrating multiple sustainability dimensions within a unified, data-driven framework, KASVA enables policymakers to identify priority regions, diagnose underlying vulnerabilities, and track progress over time with reduced sensitivity to arbitrary weighting choices.

3.8. Interpreting Latent Representations and Indicator Contributions

To enhance interpretability, a post hoc analysis examined the contributions of different sustainability dimensions to the KASVA-based index. A random forest surrogate model was trained to approximate the relationship between the original indicators and the derived GTVSI. Variable importance measures were then used to assess the relative influence of demographic, economic, social, and environmental indicators on sustainability outcomes.
The results indicate that economic capacity (e.g., gross domestic product per capita and regional output) and demographic structure (e.g., population size and ageing) exert the strongest influence on the composite index, followed by selected social indicators related to education and labour market conditions. Environmental indicators contribute in a more heterogeneous manner, interacting with socio-economic variables rather than dominating the latent structure independently. This analysis demonstrates that, although the latent space itself is not normatively decomposed, the resulting index reflects systematic contributions from identifiable sustainability dimensions, thereby supporting policy-relevant interpretation.
A sensitivity analysis was further conducted by perturbing groups of indicators associated with each sustainability domain and observing the resulting changes in the composite index. The analysis shows that variations in economic and demographic indicators lead to the largest shifts in index values, whereas environmental indicators produce more moderate but region-specific effects. These findings confirm that the KASVA framework is sensitive to meaningful structural changes in the input data rather than being dominated by arbitrary latent configurations.

3.9. Cluster Coherence, Heterogeneity, and Substantive Interpretation

To assess whether the identified clusters constitute meaningful regional sustainability regimes, we examine within-cluster homogeneity and between-cluster heterogeneity based on the original sustainability indicators. For each cluster, indicator-wise means and variances are computed and compared across clusters. The results show that regions within the same cluster exhibit relatively similar profiles across key demographic, economic, social, and environmental indicators, while substantial differences are observed between clusters.
Between-cluster comparisons reveal statistically and substantively meaningful contrasts, particularly with respect to economic capacity, labour market conditions, demographic structure, and selected environmental pressures. These patterns indicate that the clusters capture distinct combinations of sustainability-related conditions rather than arbitrary partitions of the latent space.
To evaluate the robustness of the clustering results, cluster assignments are compared across alternative model specifications, including variations in latent dimensionality and repeated initialisations of the clustering algorithm. The majority of regions retain consistent cluster membership across specifications, indicating that the identified typology is not unduly sensitive to specific modelling choices. Regions exhibiting instability are primarily located near cluster boundaries, suggesting transitional profiles rather than structural misclassification.
The identified clusters are interpreted as empirically derived regional typologies reflecting distinct sustainability-related structural conditions. While these groupings exhibit clear internal coherence and external differentiation, they should not be understood as fixed or normative sustainability categories. Instead, they provide a descriptive framework for comparing regions with similar multidimensional characteristics and for informing differentiated, place-based policy analysis.
The results of this study should be interpreted in light of the structural and cross-sectional nature of the proposed sustainability index. While the KASVA-based index captures multidimensional differences in regional conditions associated with sustainability, it does not directly measure dynamic concepts such as resilience, adaptive capacity, or the ability to sustain development over time. Consequently, regions with higher index values should not be interpreted as inherently sustainable in a normative or long-term sense, but rather as exhibiting more favourable structural conditions relative to other regions at the time of observation. This distinction highlights an important boundary between sustainability as a structural condition and sustainability as a dynamic process. Future research could extend the present framework by incorporating temporal data, shock-response indicators, or transition dynamics to explicitly address adaptive capacity and long-term sustainability trajectories.

4. Conclusions

This study introduced the KASVA framework as a novel DL-based approach for regional sustainability assessment. By explicitly addressing scale heterogeneity, multicollinearity, and non-linear interactions among sustainability indicators, KASVA overcomes key limitations of conventional composite indices that rely on linear aggregation and fixed weighting schemes. Empirical application to Turkish NUTS2 regions demonstrates that sustainability indicators exhibit strong interdependencies, with correlation coefficients frequently exceeding 0.8, underscoring the inadequacy of additive approaches. The variational representation learning component successfully compresses this complex indicator space into a low-dimensional latent representation, from which a composite sustainability index is derived. The resulting GTVSI reveals substantial interregional disparities and spatially coherent inequality regimes. Clustering in latent space identifies structurally distinct regional typologies with silhouette values largely between 0.4 and 0.5, indicating stable separation. Robustness analysis further confirms the reliability of the proposed framework. Bootstrap resampling yields a median rank correlation of approximately 0.69, demonstrating that regional rankings are largely preserved under sampling uncertainty. In contrast to conventional equal-weight and PCA-based indices, the KASVA-based index exhibits higher internal coherence and reduced sensitivity to arbitrary methodological choices. From a methodological perspective, the proposed framework contributes a generalisable and interpretable approach for constructing sustainability indices under complex data conditions. From a policy perspective, the KASVA-based index should be interpreted as an evidence-informed diagnostic tool rather than a causal decision model. It supports policymaking by highlighting relative regional disparities, identifying clusters of regions facing similar structural challenges, and informing the prioritisation of policy attention. However, it does not explain why particular regions perform better than others, nor does it assess the effectiveness of specific policy interventions. While the KASVA framework inevitably involves a trade-off between modelling flexibility and interpretability, the combination of surrogate modelling, variable importance analysis, and sensitivity diagnostics mitigates the black-box nature of the latent space. Rather than replacing normative sustainability theory, the framework complements it by revealing empirically dominant sustainability drivers under complex, correlated conditions. The validation results should be interpreted with an awareness of the conceptual scope of the proposed index. While strong rank stability indicates robustness and external correlations suggest construct consistency, the index does not directly measure dynamic sustainability outcomes or future adaptive capacity. Consequently, the GTVSI should be understood as a structural indicator aligned with sustainability-related development conditions rather than a definitive measure of sustainability performance.

4.1. Consistency Between Theoretical Assumptions and Empirical Results

The empirical results obtained using the KASVA framework are broadly consistent with the theoretical assumptions underpinning this study. The pronounced dispersion of sustainability outcomes, the identification of distinct regional inequality regimes, and the presence of non-linear relationships among indicators reflect the multidimensional and relational nature of sustainability as conceptualised in the Introduction.
Rather than converging towards a single optimal sustainability profile, regions exhibit structurally differentiated trajectories shaped by demographic structure, economic capacity, social conditions, and environmental pressures. This finding supports the assumption that sustainability cannot be adequately represented by a single standard or linear aggregation rule. The robustness of the derived rankings and the coherence of latent-space clusters further indicate that the framework captures stable structural patterns rather than artefacts of indicator selection or weighting choices. At the same time, the results highlight that sustainability assessments remain contingent on the chosen conceptual scope and data availability. While the adopted theoretical perspective emphasises multidimensional interaction without normative weighting, alternative theoretical assumptions could lead to different operationalisations. This underscores the importance of making sustainability assumptions explicit and reinforces the contribution of the present study in providing a transparent, data-driven framework aligned with its stated theoretical foundations.

4.2. Limitations and Future Research Directions

While the proposed KASVA framework offers a robust and flexible approach to regional sustainability assessment, several limitations should be acknowledged. First, the method is data-driven, and its performance depends on the quality, completeness, and comparability of the input indicators. In contexts where sustainability data are sparse, inconsistent, or subject to measurement error, the resulting latent representations and rankings may be less reliable. Second, the framework involves several modelling choices, including the latent dimensionality, network architecture, and hyperparameters such as β . Although these parameters are selected through validation to ensure stable performance, different configurations may lead to variations in latent structure and index values, particularly in small or highly heterogeneous samples. Third, while representation learning enables the capture of complex nonlinear interactions, deep learning models may reduce immediate interpretability compared with simpler linear indices. Although surrogate models and clustering diagnostics are used to support interpretation, the framework does not fully eliminate the inherent trade-off between model complexity and transparency. The absence of an explicit causal structure constitutes an important limitation of the proposed framework. While the index reveals robust and interpretable patterns of regional inequality and sustainability-related conditions, it cannot be used to infer causal drivers or to evaluate policy interventions. Consequently, claims regarding mechanisms or policy effectiveness are beyond the scope of this study. Future research could build on the KASVA framework by integrating causal inference approaches, such as longitudinal designs, quasi-experimental methods, or structural models, to examine how changes in policy, institutions, or economic conditions influence sustainability trajectories over time. Finally, the empirical application focuses on Turkish NUTS2 regions, and the direct transferability of the results to other countries or spatial scales may be limited. Applying the framework across different regional contexts may require adapting the indicator system and carefully considering institutional and spatial specificities. Future research could address these limitations by explicitly incorporating spatial dependence, extending the framework to dynamic or longitudinal settings, and further enhancing explainability mechanisms.

Author Contributions

Conceptualisation, C.F.C., F.C. and M.C.; methodology, C.F.C., F.C. and M.C.; software, M.C.; validation, C.F.C., F.C. and M.C.; formal analysis, M.C.; investigation, M.C.; resources, M.C.; writing-original draft preparation, C.F.C., F.C. and M.C.; writing-review and editing, C.F.C., F.C. and M.C.; visualisation, C.F.C., F.C. and M.C. All authors have read and agreed to the published version of the manuscript.

Funding

This research received no external funding.

Institutional Review Board Statement

Not applicable.

Informed Consent Statement:

Not applicable.

Data Availability Statement

The datasets and source code are publicly available at https://github.com/cavusmuhammed68/KASVA (accessed on: 13 January 2026).

Acknowledgments

This research was supported by the Turkish Ministry of National Education.

Conflicts of Interest

The authors declare no conflicts of interest.

References

  1. Coyle, D. The right kind of growth for everyone: Policy challenges during the digital and green transformations. Camb. J. Reg. Econ. Soc. 2025, 18, 17–24. [Google Scholar] [CrossRef]
  2. Bădĭrcea, R.M.; Doran, N.M.; Manta, A.G.; Cercel, C.; Jianu, E.; Gheorghe, A. Bridging regional development and sustainability: The contribution of the European Regional Development Fund to Sustainable Development Goals progress in the EU. Sustainability 2025, 17, 3665. [Google Scholar] [CrossRef]
  3. Benner, M.; Trippl, M.; Hassink, R. Sustainable and inclusive development in left-behind places. Rev. Reg. Res. 2024, 44, 237–249. [Google Scholar] [CrossRef]
  4. United Nations Country Team in Turkey. United Nations Sustainable Development Cooperation Framework 2021–2025; UN Resident Coordinator Office: Ankara, Turkey, 2021. [Google Scholar]
  5. Orhangazi, Ö.; Yeldan, A.E. Turkey: Challenges and strategies towards sustainable development. In Integrated Policy Strategies and Regional Policy Coordination for Resilient, Green and Transformative Development; Country report prepared for the project; UNCTAD: Geneva, Switzerland, 2025. [Google Scholar]
  6. Sachs, J.D.; Schmidt-Traub, G.; Kroll, C.; Lafortune, G.; Fuller, G. The Sustainable Development Goals and COVID-19. In Sustainable Development Report; Cambridge University Press: Cambridge, UK, 2020; Available online: https://s3.amazonaws.com/sustainabledevelopment.report/2020/2020_sustainable_development_report.pdf (accessed on 12 January 2026).
  7. Sachs, J.D.; Kroll, C.; Lafortune, G.; Fuller, G.; Woelm, F. The decade of action for the Sustainable Development Goals. In Sustainable Development Report; Cambridge University Press: Cambridge, UK, 2021; Available online: https://s3.amazonaws.com/sustainabledevelopment.report/2021/2021-sustainable-development-report.pdf (accessed on 12 January 2026).
  8. Sachs, J.D.; Lafortune, G.; Kroll, C.; Fuller, G.; Woelm, F. From crisis to sustainable development. In Sustainable Development Report; Cambridge University Press: Cambridge, UK, 2022; Available online: https://s3.amazonaws.com/sustainabledevelopment.report/2022/sustainable-development-report-2022.pdf (accessed on 12 January 2026).
  9. Sachs, J.D.; Lafortune, G.; Kroll, C.; Fuller, G.; Woelm, F. The SDGs and the future of sustainable development. In Sustainable Development Report; Cambridge University Press: Cambridge, UK, 2024; Available online: https://files.unsdsn.org/sustainable-development-report-2024.pdf (accessed on 12 January 2026).
  10. European Investment Bank. Regional Cohesion in Europe 2021–2022: Evidence from the EIB Investment Survey; EIB: Luxembourg, 2022. Available online: https://op.europa.eu/en/publication-detail/-/publication/7963206c-3897-11ed-9c68-01aa75ed71a1 (accessed on 13 January 2026).
  11. Eurostat. Sustainable Development in the European Union: Monitoring Report on Progress Towards the SDGs in an EU Context—2024 Edition; European Commission: Brussels, Belgium, 2024. Available online: https://ec.europa.eu/eurostat/web/products-flagship-publications/w/ks-05-24-071 (accessed on 13 January 2026).
  12. Sachs, J.D.; Lafortune, G.; Fuller, G.; Iablonovski, G. Sustainable Development Report 2025; Sustainable Development Solutions Network; Dublin University Press: Dublin, Ireland, 2025; Available online: https://s3.amazonaws.com/sustainabledevelopment.report/2025/sustainable-development-report-2025.pdf (accessed on 12 January 2026).
  13. Zepharovich, E. Composite Indicators and Scoreboards: Methodological Guidance. JRC Technical Report. 2013. Available online: https://composite-indicators.jrc.ec.europa.eu (accessed on 10 January 2025).
  14. Sachs, J.D.; Lafortune, G.; Kroll, C.; Fuller, G.; Woelm, F. Implementing the SDGs at scale. In Sustainable Development Report; Dublin University Press: Dublin, Ireland, 2023; Available online: https://s3.amazonaws.com/sustainabledevelopment.report/2023/sustainable-development-report-2023.pdf (accessed on 12 January 2026).
  15. Kármán-Tamus, É.; Sebestyénné Szép, T.; Tóth, G. Sensitivity and uncertainty analyses of a composite index measuring sustainable energy transition in the European Union. Reg. Stat. 2025, 15, 168–184. [Google Scholar] [CrossRef]
  16. Kapelko, M.; Ortiz, L.; Aparicio, J. Comparing groups of units through composite indicators in a non-convex approach: Corporate social responsibility for the food and beverage manufacturing industry. Ann. Oper. Res. 2025, 351, 1427–1450. [Google Scholar] [CrossRef]
  17. Bohr, C.; Rodríguez, G.; Belomestnykh, S.; Berg-Moelleken, D.; Chauhan, N.; Engler, J.-O.; Heydebreck, L.V.; Hintz, M.J.; Kretschmer, M.; Krügermeier, C.; et al. Artificial intelligence in sustainable development research. Nat. Sustain. 2025, 8, 970–978. [Google Scholar] [CrossRef]
  18. Valencia-Arias, A.; Vásquez Coronado, M.H.; Clavo Medina, M.L.; Morales Garcia, M.J.; Requejo Arias, A.R.; Saavedra Tirado, J.I. Research trends in the application of machine learning in sustainability practices based on a bibliometric analysis. Sustain. Futur. 2025, 10, 100987. [Google Scholar] [CrossRef]
  19. Prasittisopin, L. Machine learning (ML) and deep learning (DL) in sustainable concrete construction: Review, trend and gap analyses. Build. Struct. Mater. 2025, 1–29. [Google Scholar] [CrossRef]
  20. Asperti, A.; Evangelista, D.; Loli Piccolomini, E. A survey on variational autoencoders from a green AI perspective. SN Comput. Sci. 2021, 2, 301. [Google Scholar] [CrossRef]
  21. Liang, S.; Pan, Z.; Liu, W.; Yin, J.; de Rijke, M. A survey on variational autoencoders in recommender systems. ACM Comput. Surv. 2024, 56, 268. [Google Scholar] [CrossRef]
  22. Xing, X.; Wei, S.; Chen, X.; Qian, J.; Peng, S.; Sun, J.; Sun, B.; Chen, C. A deep learning-based composite agricultural drought index for monitoring and impact assessment in Central Asia. Agric. Water Manag. 2026, 323, 110043. [Google Scholar] [CrossRef]
  23. Angelov, P.P.; Soares, E.A.; Jiang, R.; Arnold, N.I.; Atkinson, P.M. Explainable artificial intelligence: An analytical review. WIREs Data Min. Knowl. Discov. 2021, 11, e1424. [Google Scholar] [CrossRef]
  24. Yang, W.; Wei, Y.; Wei, H.; Chen, Y.; Huang, G.; Li, X.; Li, R.; Yao, N.; Wang, X.; Gu, X.; et al. Survey on explainable AI: From approaches, limitations and applications aspects. Hum.-Centric Intell. Syst. 2023, 3, 161–188. [Google Scholar] [CrossRef]
  25. Nagahisarchoghaei, M.; Nur, N.; Cummins, L.; Nur, N.; Mousavi Karimi, M.; Nandanwar, S.; Bhattacharyya, S.; Rahimi, S. An empirical survey on explainable AI technologies. Electronics 2023, 12, 1092. [Google Scholar] [CrossRef]
  26. Mersha, M.; Lam, K.; Wood, J.; AlShami, A.; Kalita, J. Explainable artificial intelligence: A survey of needs, methods, and open challenges. arXiv 2024, arXiv:2409.00265. [Google Scholar]
  27. Hettikankanamage, N.; Shafiabady, N.; Chatteur, F.; Wu, R.M.X.; Ud Din, F.; Zhou, J. eXplainable Artificial Intelligence (XAI): A systematic review. Sensors 2025, 25, 6649. [Google Scholar] [CrossRef]
  28. Çınar, İ.T. Regional development trap in Turkey. Pap. Reg. Sci. 2023, 102, 817–851. [Google Scholar] [CrossRef]
  29. Eurostat. Sustainable Development Goals (SDGs) and EU Regions. European Commission. 2024. Available online: https://ec.europa.eu/eurostat/statistics-explained/index.php/Sustainable_development_goals_%28SDGs%29_and_EU_regions_-_people (accessed on 5 January 2026).
  30. de Dominicis, L.; Cabeza Martínez, B.; Kovacic, M.; Papadimitriou, E. The EU Regional Social Progress Index 2.0. European Commission. 2024. Available online: https://data.europa.eu/doi/10.2776/786554 (accessed on 5 January 2026).
  31. Goebel, T.; Britz, W. NUTS2 level dataset on land use and land cover projections. Data Brief 2025, 63, 112268. [Google Scholar] [CrossRef]
  32. Li, Y.; Lv, Y.; Zhang, Z.; Feng, X.; Chen, X. Coupling coordination evaluation of “Three Waters” system. Sustain. Cities Soc. 2024, 102, 105174. [Google Scholar] [CrossRef]
  33. Chen, I.-C. Predicting regional sustainable development. Ecol. Indic. 2024, 163, 112117. [Google Scholar] [CrossRef]
  34. Qiao, W.; Luo, D. An autoencoder-based framework. Front. Sustain. Cities 2025, 7, 1642184. [Google Scholar] [CrossRef]
  35. Darvishvand, L.; Kamkari, B.; Huang, M.J.; Hewitt, N.J. Explainable AI in urban building energy modeling. Sustain. Cities Soc. 2025, 128, 106492. [Google Scholar] [CrossRef]
  36. Eurostat. NUTS—Nomenclature of Territorial Units for Statistics (GISCO Spatial Data). European Commission. 2021. Available online: https://gisco-services.ec.europa.eu/distribution/v2/nuts/ (accessed on 5 January 2026).
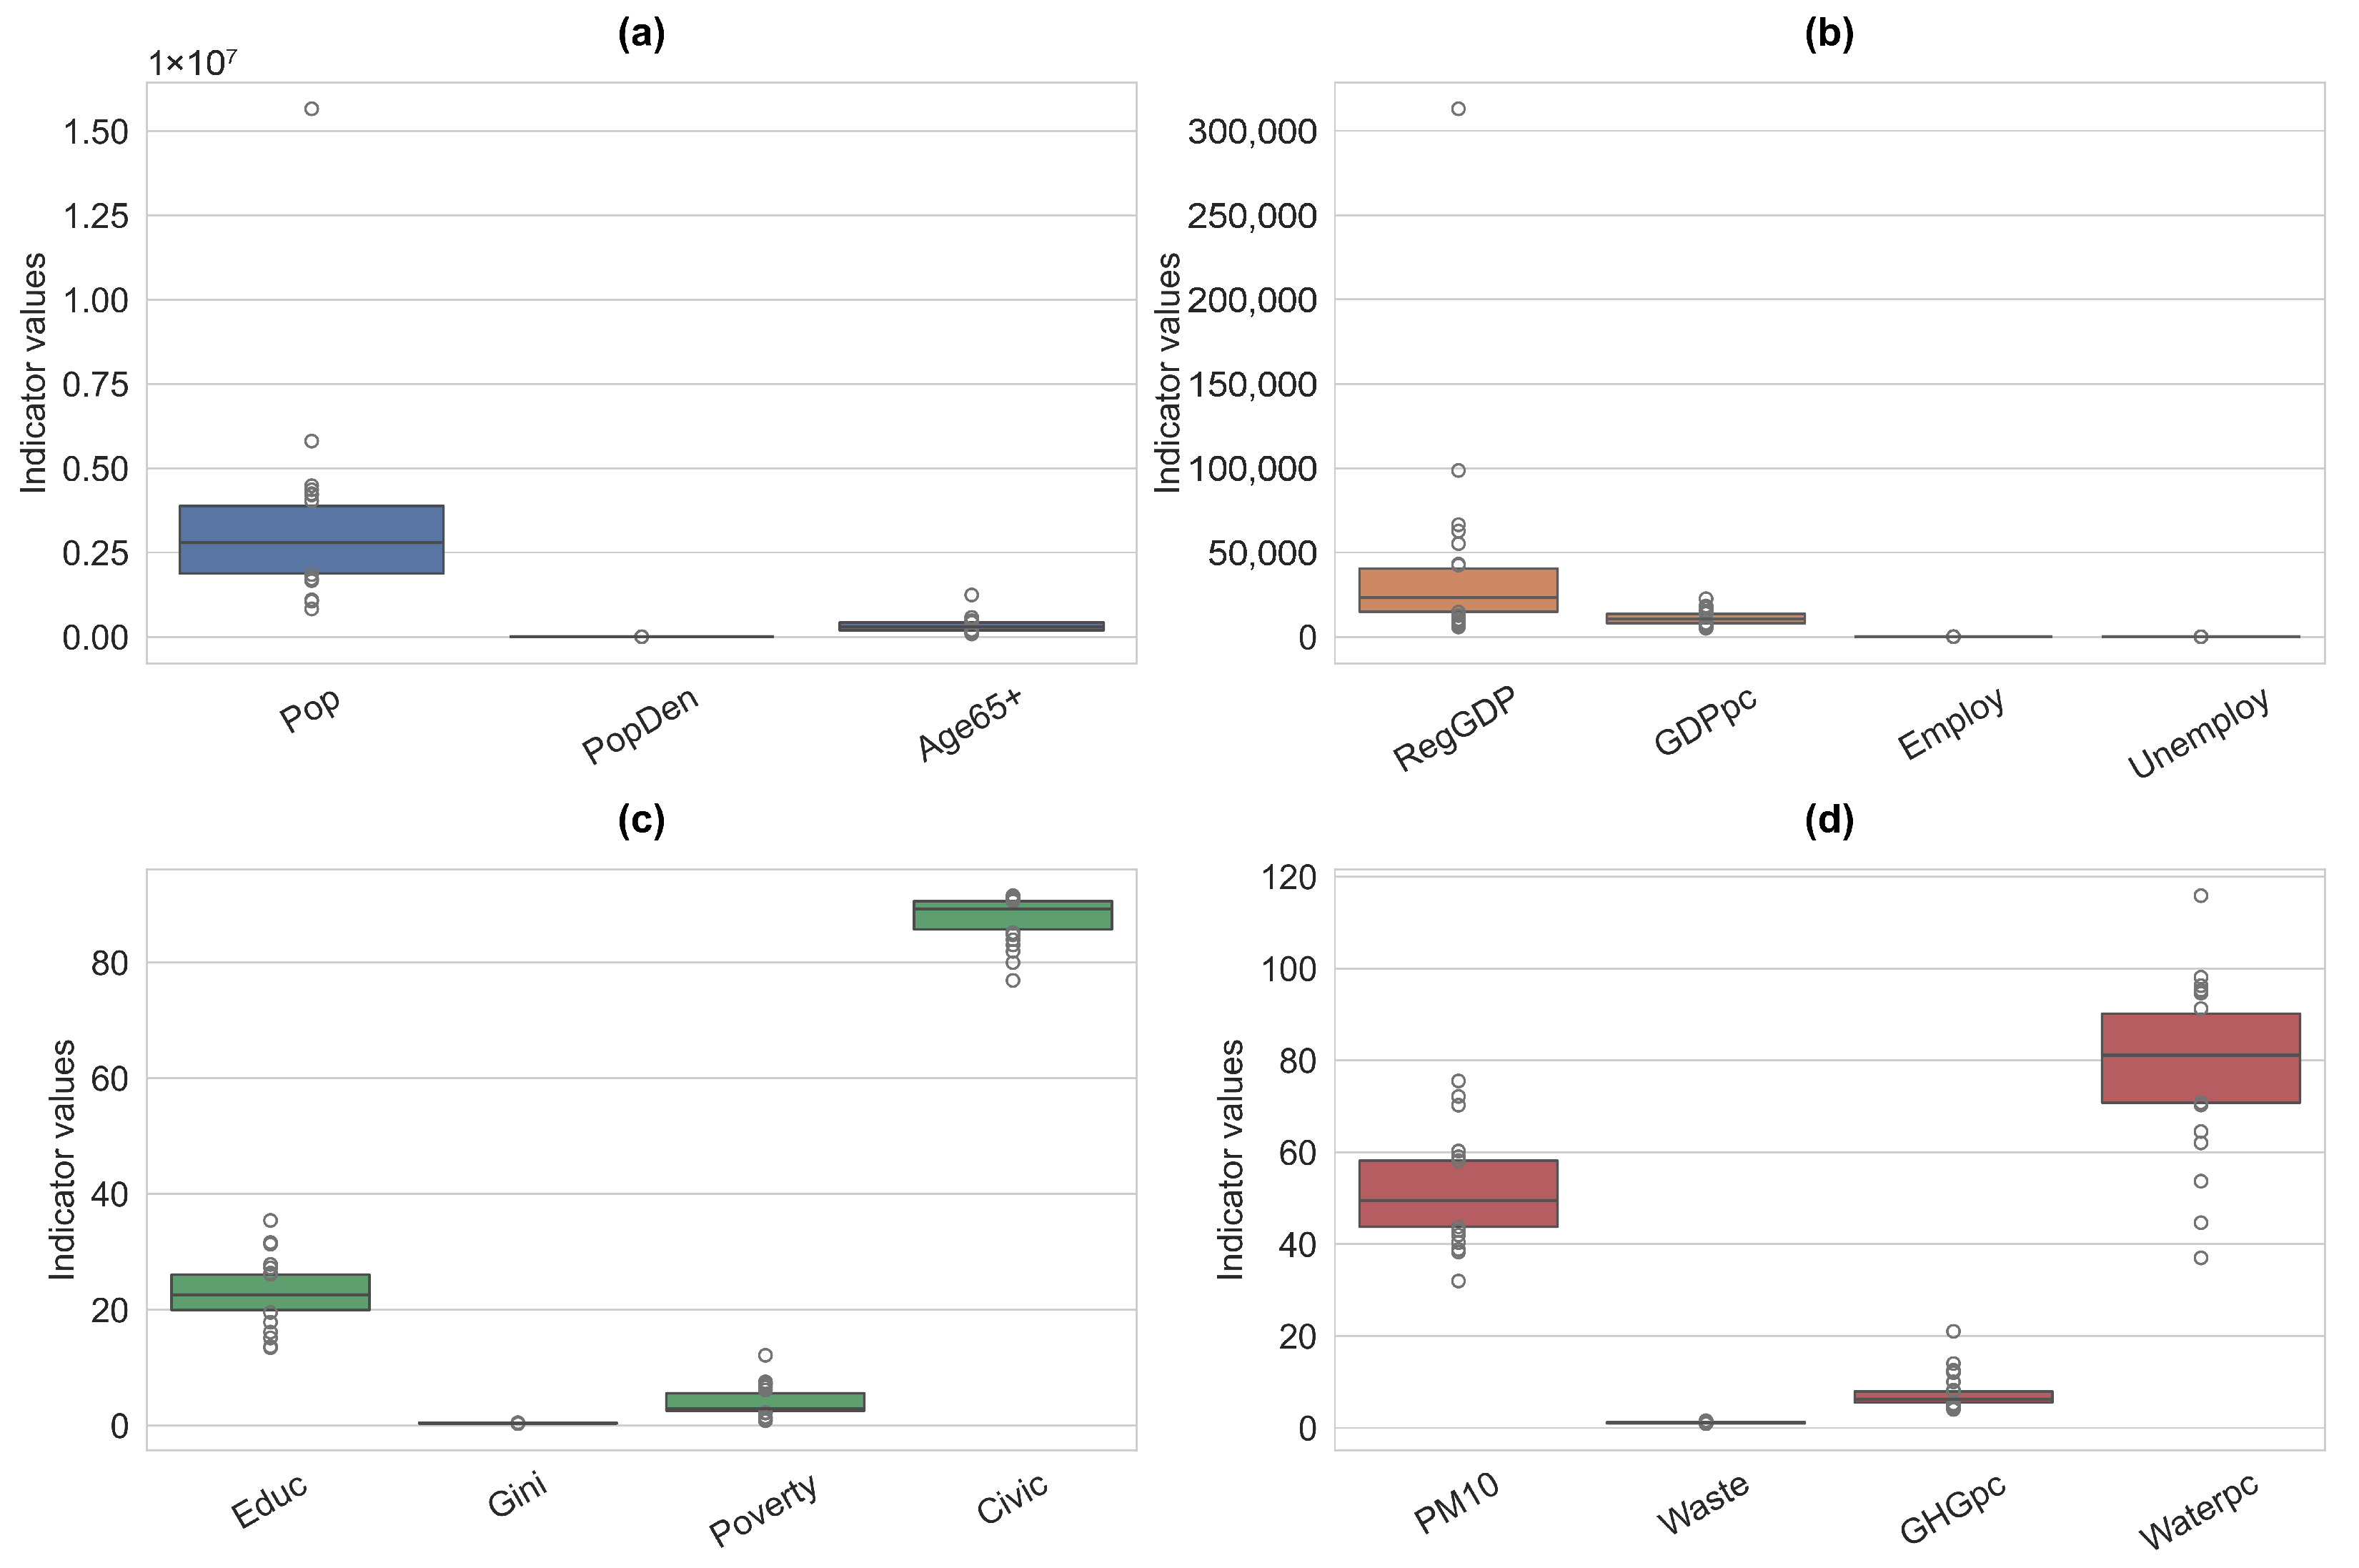
Figure 1. Dimensional structure of sustainability indicators across demographic, economic, social, and environmental domains. Large-scale disparities motivate standardisation and non-linear modelling.
Sustainability 18 01911 g001
Figure 2. Correlation structure of sustainability indicators. Dense correlation blocks highlight non-independence and justify representation learning.
Sustainability 18 01911 g002
Figure 3. VAE diagnostics: (a) total loss convergence, (b) reconstruction and KL divergence evolution, (c) indicator-wise reconstruction error, and (d) distribution of regional KL divergence.
Sustainability 18 01911 g003
Figure 4. Latent-space clustering diagnostics derived from the KASVA framework: (a) two-dimensional t-SNE projection of latent representations coloured by cluster membership, (b) cluster-wise distributions of the GTVSI, (c) standardised indicator profiles highlighting distinct sustainability typologies, and (d) silhouette coefficient distribution indicating cluster separation and stability.
Sustainability 18 01911 g004
Figure 5. Distribution of Spearman rank correlation coefficients obtained from B = 1000 bootstrap resamples of the GTVSI. The high concentration of correlations above 0.6 indicates strong stability of regional rankings under sampling uncertainty.
Sustainability 18 01911 g005
Figure 6. Overview of the KASVA framework integrating variational representation learning, latent-space clustering, composite index construction (GTVSI), and robustness analysis for regional sustainability assessment.
Sustainability 18 01911 g006
Figure 7. Distribution of the KASVA-based Global Territorial Sustainability Index (GTVSI) across Turkish NUTS2 regions. The index is normalised to a 0–100 scale.
Sustainability 18 01911 g007
Figure 8. Spatial distribution of the KASVA-based GTVSI across Turkish NUTS2 regions. Higher values indicate stronger overall sustainability performance.
Sustainability 18 01911 g008
Figure 9. Spatial distribution of KASVA-derived regional sustainability clusters across Turkish NUTS2 regions. Regions sharing the same colour belong to the same inequality regime.
Sustainability 18 01911 g009
Figure 10. Standardised cluster typologies derived from the KASVA framework, illustrating relative strengths and weaknesses across key sustainability dimensions.
Sustainability 18 01911 g010
Figure 11. Cluster-wise deviation from national mean across sustainability indicators (standardised values). Positive values indicate above-average performance, while negative values denote structural disadvantages.
Sustainability 18 01911 g011
Figure 12. Global importance of sustainability indicators derived from a random forest surrogate model approximating the KASVA-based GTVSI. Higher values indicate greater contribution to explained variance.
Sustainability 18 01911 g012
Figure 13. Marginal effects of key sustainability drivers on predicted GTVSI: (a) population size, (b) GDP per capita, and (c) share of population aged over 65.
Sustainability 18 01911 g013
Figure 14. Spearman rank correlation between the KASVA-based GTVSI and benchmark sustainability indices constructed using PCA-based and equal-weight aggregation approaches.
Sustainability 18 01911 g014
Table 1. Key parameters used in the KASVA analysis.
ParameterValue/Description
Number of regions (N)Turkish NUTS2 regions
Number of indicators (D)Demographic, economic, social, environmental
Latent dimension (K)Selected via validation
VAE training epochs∼200
Regularisation parameter ( β )Tuned for stable ELBO convergence
Clustering algorithmk-means (latent space)
Number of clusters (C)Selected based on silhouette analysis
Bootstrap iterations (B)1000
Ranking metricSpearman rank correlation
Disclaimer/Publisher’s Note: The statements, opinions and data contained in all publications are solely those of the individual author(s) and contributor(s) and not of MDPI and/or the editor(s). MDPI and/or the editor(s) disclaim responsibility for any injury to people or property resulting from any ideas, methods, instructions or products referred to in the content.