Article

Assessment of Eco-Geological Vulnerability Using Multiple Machine Learning Models: A Case Study of the Three Gorges Reservoir Area, China


1
107 Geology Team, Chongqing Bureau of Geology and Mineral Development, Chongqing 401120, China
2
Chengdu Center, China Geological Survey (Geosciences Innovation Center of Southwest China), Chengdu 610218, China
3
School of Earth Sciences, Shandong University of Science and Technology, Qingdao 266000, China
4
Geological Engineering Survey Company of Mining Subsidiary Taiyuan Iron & Steel (Group) Co., Ltd., Taiyuan 030003, China
5
College of Outstanding Engineers, China University of Geosciences, Wuhan 430074, China
6
China National Logging Corporation Qinghai Branch, Dunhuang 736200, China
*
Authors to whom correspondence should be addressed.
Sustainability 2026, 18(4), 1758; https://doi.org/10.3390/su18041758
Submission received: 31 December 2025 / Revised: 28 January 2026 / Accepted: 1 February 2026 / Published: 9 February 2026
(This article belongs to the Topic Water-Soil Pollution Control and Environmental Management)

Abstract

Precise assessment of the vulnerability characteristics of human–land systems is es-sential for ensuring ecological security and sustainable development in regions affected by large-scale engineering projects. Using the Three Gorges Reservoir Area as a case study, this research develops a comprehensive evaluation index system based on a coupled framework of “Geo-environmental Background—Ecosystem Structure—Anthropogenic Perturbation.” By integrating deep neural networks (DNN), convolutional neural networks (CNN), and the analytic hierarchy process (AHP) with multi-source data, we perform a thorough assessment of eco-geological vulnerability. The results reveal the following key findings: (1) In eco-geological vulnerability assessment, deep learning methods (DNN and CNN) significantly outperform traditional AHP, with CNN showing superior precision and specificity due to its ability to extract local spatial features effectively, while DNN exhibits stronger overall robustness. (2) The spatial distribution of eco-geological vulnerability in the reservoir area is notably heterogeneous, with high and Extreme vulnerability zones concentrated along the main riverbanks, major tributary estuaries, and urban peripheries. These zones are strongly coupled with steep terrain, erodible lithology, high geological hazard risks, and intensive human activity. (3) Although the overall vulnerability remains relatively stable, local sensitivity is increasing. Ecological restoration projects in mountainous regions have effectively mitigated vulnerability in the hinterlands, while rapid urbanization has exacerbated vulnerability in emerging urban areas. The study concludes that the spatial pattern of vulnerability is primarily influenced by the geological–ecological background, with human disturbance—especially land use intensity—acting as the primary driver of vulnerability dynamics and local hotspots of high vulnerability. Based on these findings, we recommend a differentiated management approach tailored to eco-geological units: for high and extreme vulnerability zones along river and urban corridors, efforts should focus on spatial constraints and systemic resto-ration; for low and negligible vulnerability zones in mountainous areas, strategies should aim to enhance ecosystem quality and stability, thus fostering a coordinated regional ecological security framework.

1. Introduction

Amid the intertwined challenges of global change and intensive human activities, the interactions between geological environments and ecosystems have become increasingly complex. The vulnerability of these coupled systems has emerged as a critical issue for regional sustainable development [1,2,3]. As a key component of Earth system science, eco-geology explores multi-sphere interactions across the lithosphere, pedosphere, and biosphere [4,5], thereby providing a geological perspective on ecosystem evolution [6,7,8]. Theoretically, this field focuses on the material cycles and energy transfer mechanisms within Earth’s critical zone [9,10]. Eco-geological research plays a crucial role in understanding the multi-sphere linkages and systemic risks in key ecological zones, areas impacted by major engineering projects, and ecologically sensitive regions.
The Three Gorges Reservoir Area (TGRA) in China, which lies within the footprint of the world’s largest hydroelectric project, is one of the most geologically complex regions. Its eco-geological stability is vital for the strategic security of the Yangtze River Economic Belt. Located in the transitional zone between China’s second and third topographic steps, the TGRA is characterized by active tectonic structures, diverse lithology, deeply incised terrain, and abundant rainfall, making it globally recognized as a hotspot for geological hazards. Since the impoundment of the reservoir, periodic fluctuations in water levels have significantly altered the hydrogeological conditions along the reservoir banks [11,12]. At the same time, large-scale resettlement, town relocation, and infrastructure development have drastically altered land cover and land-use patterns. The combined impact of natural and anthropogenic forces has disrupted the original eco-geological equilibrium, triggering a cascade of effects, including increased bank instability, heightened soil erosion risks, and fragmentation of biological habitats [13,14]. Thus, understanding the spatial patterns and driving mechanisms of eco-geological vulnerability in the TGRA is not only an academic necessity for advancing the understanding of human–land system coupling but also an urgent requirement for ensuring regional ecological security [15,16].
Previous studies have provided foundational insights into ecological vulnerability in the reservoir area [17,18]; however, several critical gaps remain [19,20]: (1) insufficient conceptual integration, with most studies focusing either on geological hazard risk or ecological sensitivity, without a comprehensive vulnerability assessment that integrates both dimensions within a unified framework; (2) the lack of a dynamic perspective, as most evaluations are static and fail to capture evolving patterns under the combined pressures of project operation and rapid urbanization; and (3) limited mechanistic analysis, where most drivers are described qualitatively rather than through a quantitative exploration of multi-factor interactions.
Within the fields of natural resources and ecological environments, vulnerability research has generally followed three main paths: First, geological environmental vulnerability assessments typically focus on geological hazard risk. With advances in 3S technology, methods such as information value models and machine learning are widely applied, but these studies predominantly concentrate on “hazard-prone environments,” often overlooking ecosystem regulatory functions [21,22]. Second, ecosystem vulnerability assessments tend to focus on the response of ecosystems to external stressors, often employing frameworks such as “exposure–sensitivity–adaptive capacity.” Research in the TGRA has primarily addressed soil erosion sensitivity and landscape ecological risk [23,24], but the influence of geological substrates has been less explored. Third, interdisciplinary eco-geological research has emerged to recognize the interconnectedness of geological and ecological systems, introducing concepts such as “geo-ecological risk” and conducting eco-geological environmental quality evaluations [25,26]. More recently, research teams in the Daliang Mountain area have introduced the concept of eco-geological vulnerability and explored related assessment methodologies [27]. Eco-geological vulnerability is defined as the susceptibility of Earth’s surface system (including the upper lithosphere, pedosphere, hydrosphere, and biosphere) to both internal and external disturbances, coupled with a limited ability to cope, rendering the system’s structure and function prone to alteration [28,29].
This study aims to address these gaps by using the TGRA as a case study (Figure 1a) to conduct a comprehensive assessment of eco-geological vulnerability. The specific objectives are: (1) to evaluate the spatial pattern of eco-geological vulnerability in the TGRA; (2) to identify the dominant factors influencing eco-geological vulnerability; and (3) to propose differentiated zoning strategies for ecological protection and restoration.

2. Materials and Methods

2.1. Research Materials

2.1.1. Eco-Geological Setting

(1)
Geological and geomorphic conditions
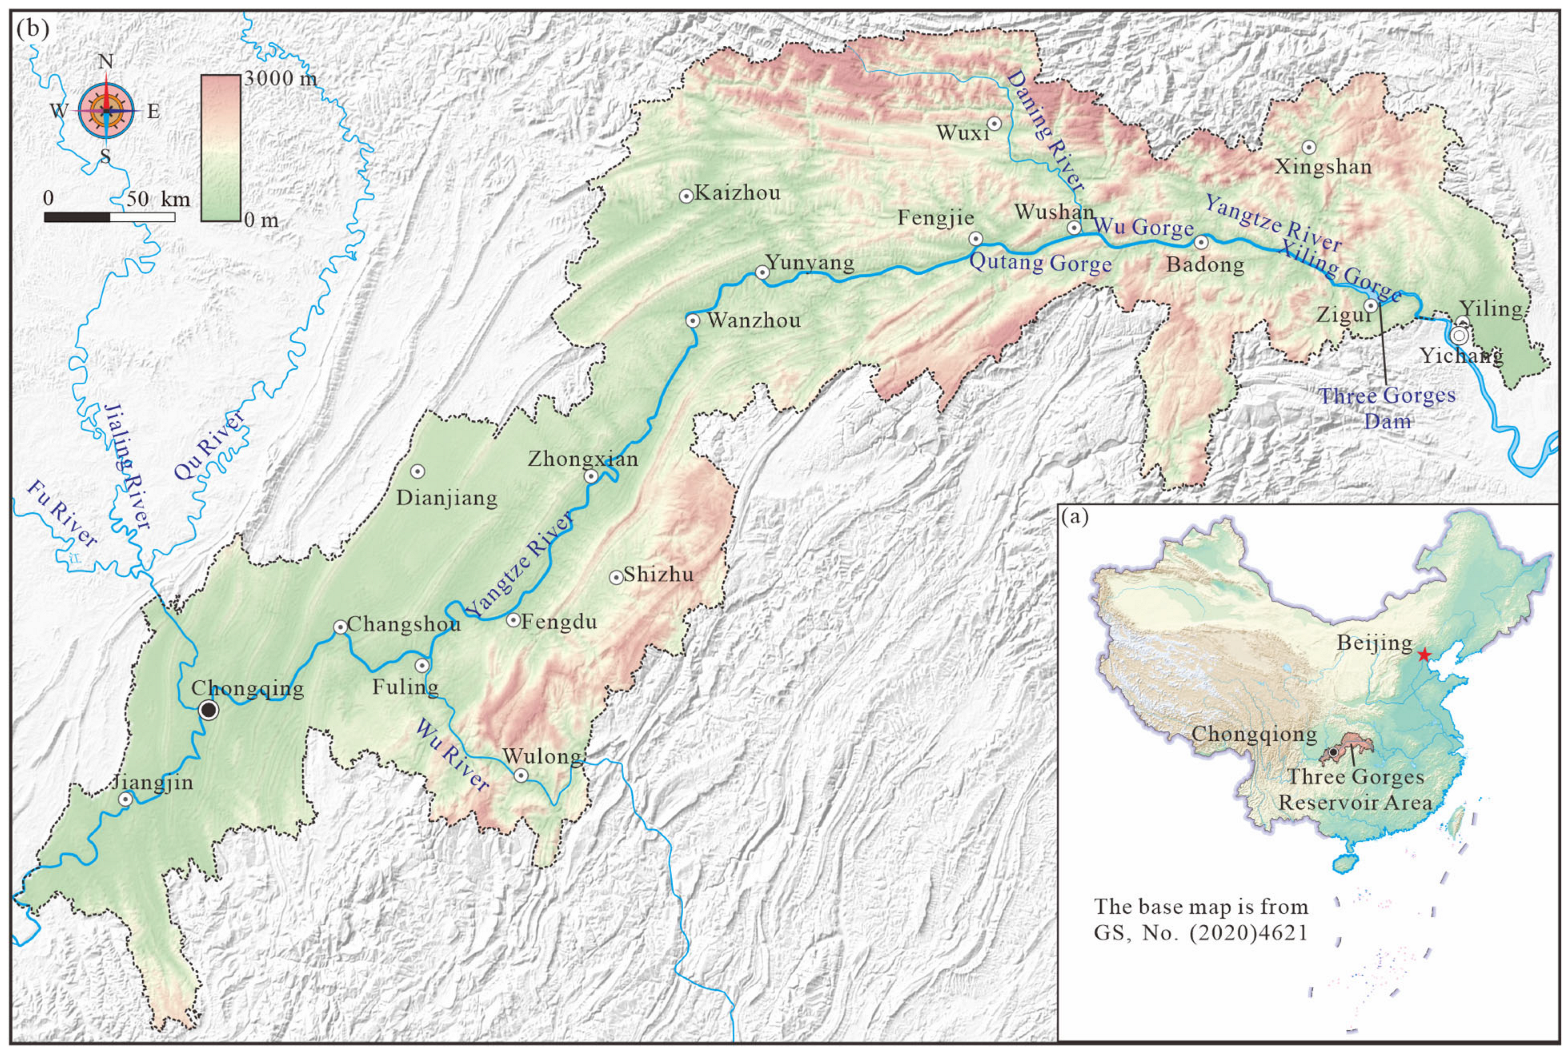
The Three Gorges Reservoir Area (TGRA) spans Hubei Province and Chongqing Municipality in China, covering approximately 59,200 km2 and encompassing 26 counties and districts (Figure 1b). Situated in the transitional zone between China’s second and third topographic steps, the area extends across the parallel ridge-valley region on the eastern margin of the Sichuan Basin, the Qinling-Daba Mountains, and the Wuling Mountains. Its diverse geographic and geomorphic features make it a region of significant strategic importance for national economic and social development.
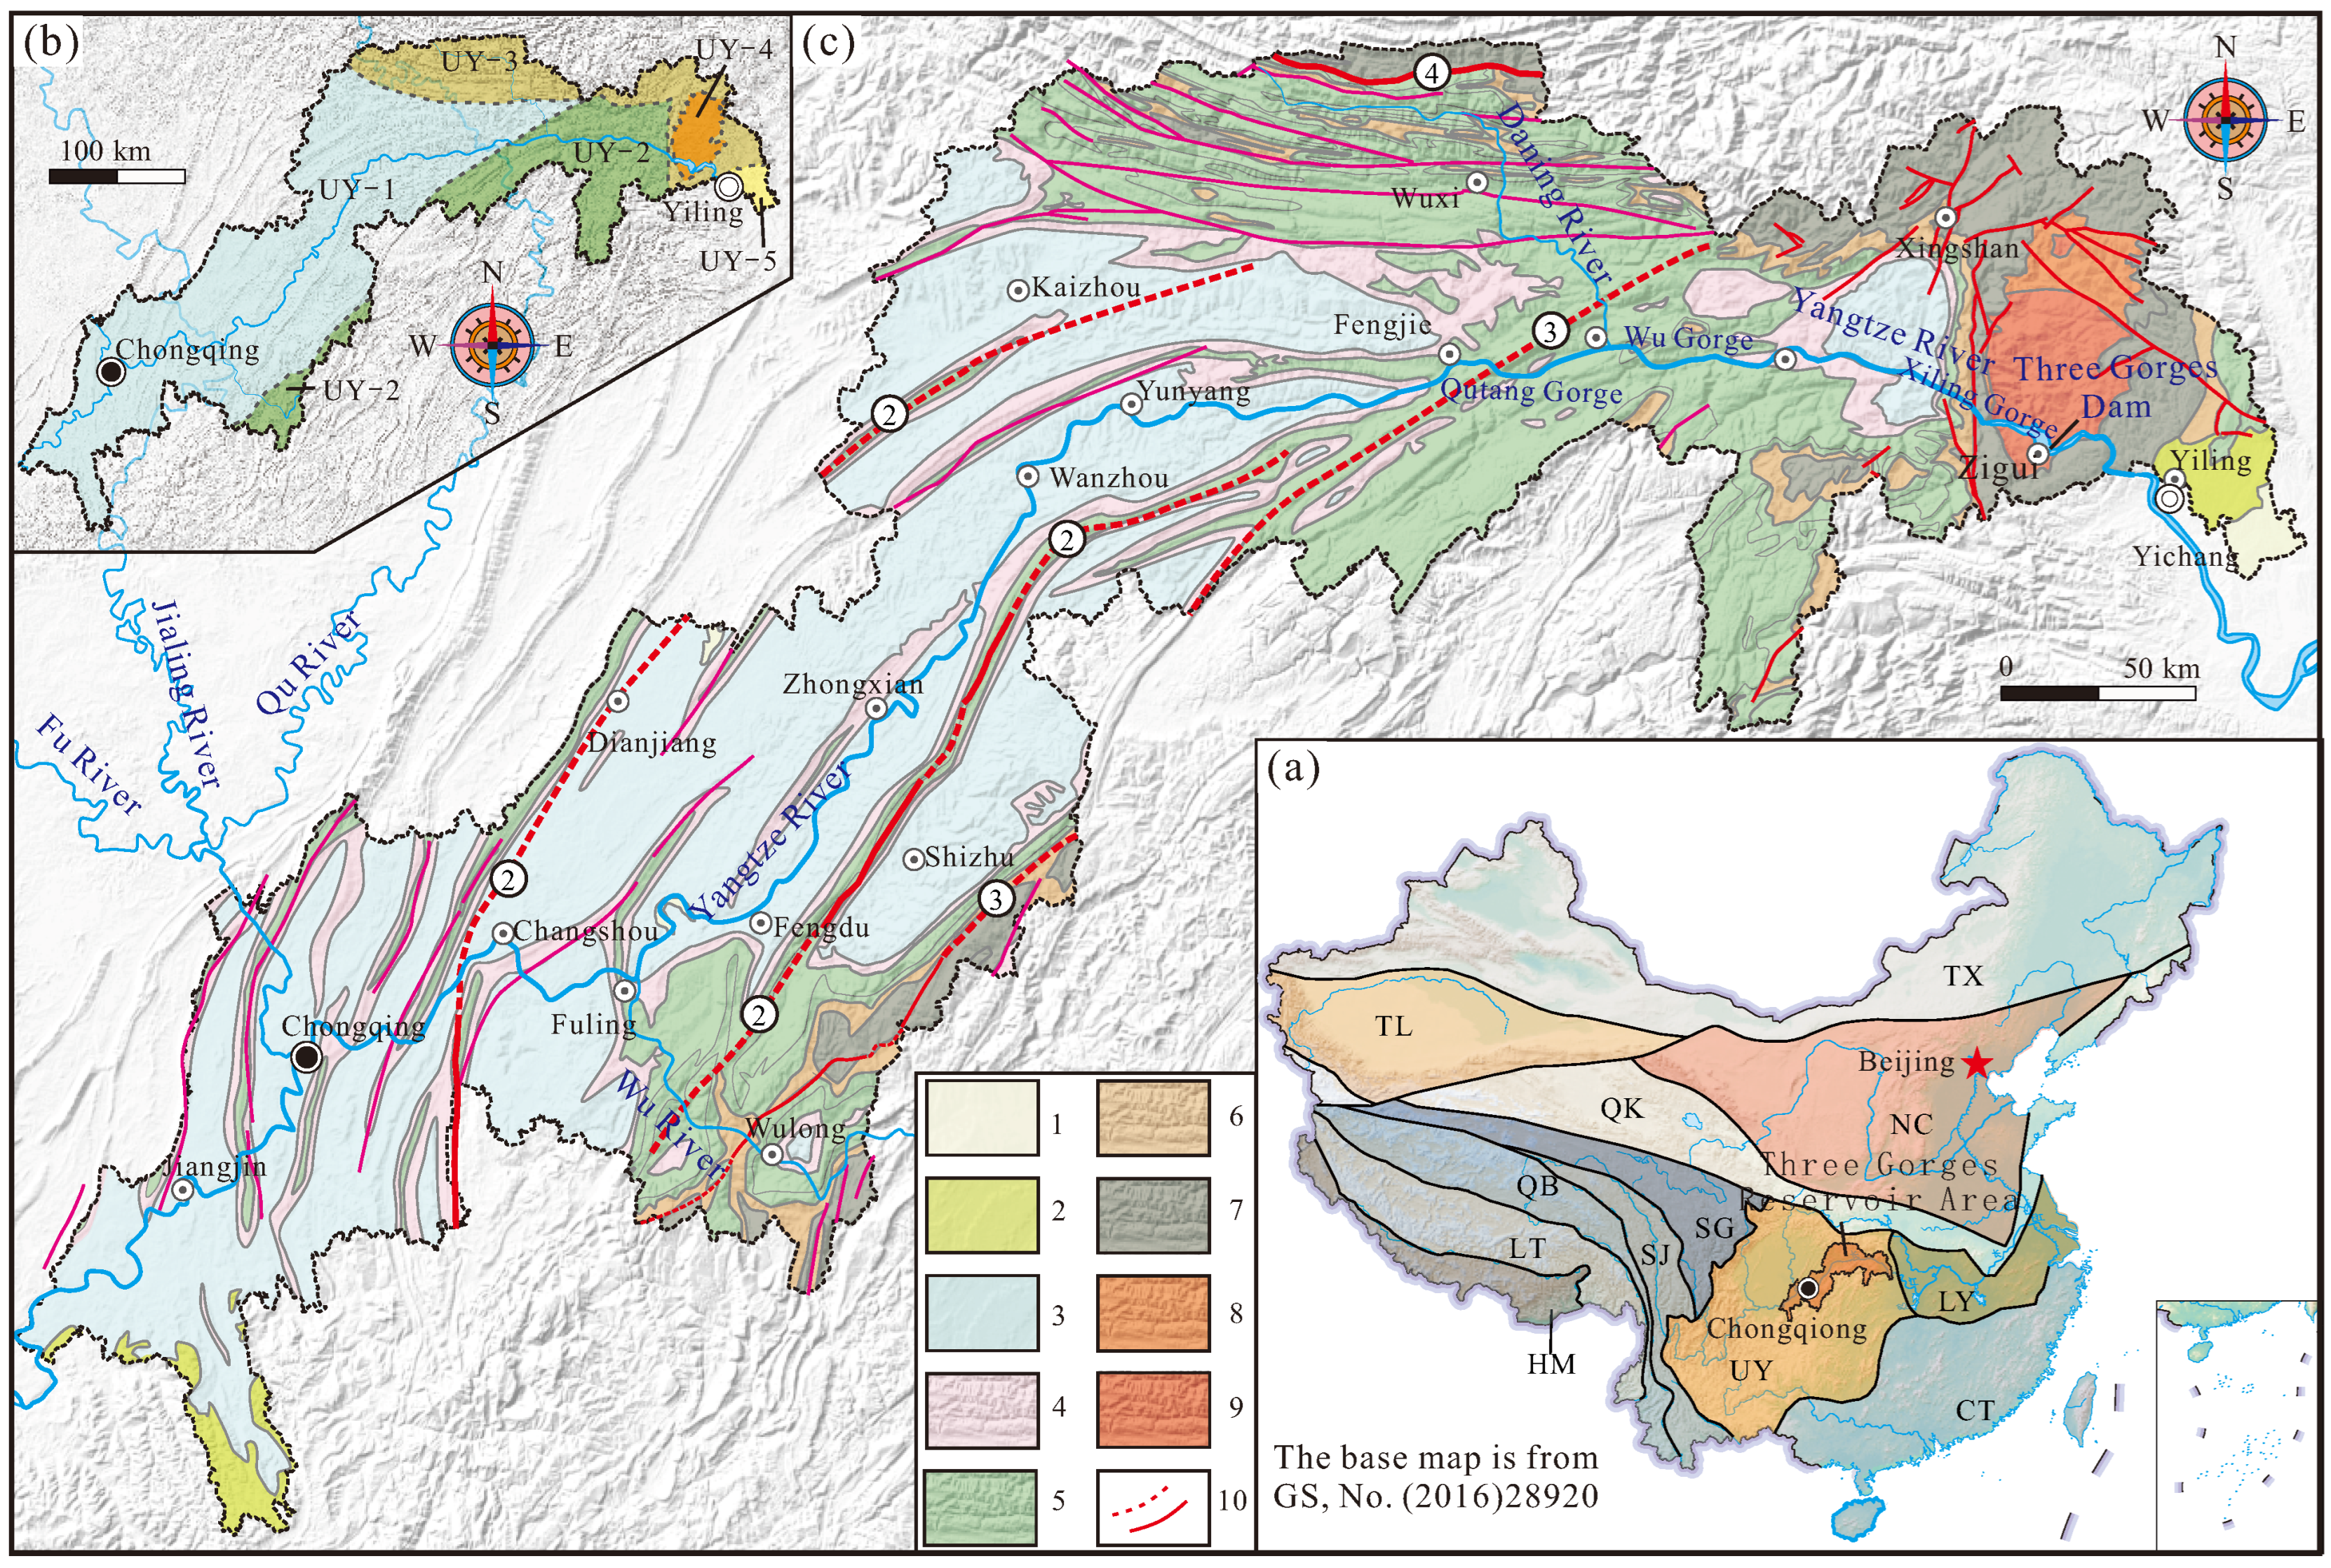
According to Geological Map of the People’s Republic of China (Southwestern Region) (1:1,500,000) [30], from a regional tectonic perspective, the reservoir area is located in the northern part of the Upper Yangtze Block [30]. It primarily consists of five third-order tectonic units: the Upper Yangtze Carbonate Platform Fold Belt (UY-3), the Sichuan Mesozoic Foreland Basin (UY-4), the Daba Shan Platform Marginal Fold Belt (UY-6), the Huangling Metamorphic Basement Complex (UY-7), and the Jianghan Faulted Basin (UY-8) (Figure 2a).
According to the Regional Geology of China · Chongqing Volume [31] and the Regional Geology of China Hubei Volume [33], Sedimentary rocks dominate the area, comprising over 90% of the total reservoir region (Figure 2b). These exposed strata range from the Pre-Sinian to the Quaternary System: Pre-Early Permian strata: Primarily found in southeastern Chongqing (Xiushan, Youyang, Qianjiang) and northeastern Chongqing (Chengkou, Wuxi) [34,35]. Middle Permian to Upper Jurassic strata: Exposed mainly in the core anticline areas of the central-western region. Middle-Upper Jurassic strata: Extensively distributed across central-western Chongqing. Lower Cretaceous strata: Limited to the mountainous areas south of Qijiang and Jiangjin. Upper Cretaceous strata: Sporadically exposed in the fold cores of southeastern Chongqing. Quaternary deposits: Primarily accumulated in river valleys throughout the area [36,37].
Metamorphic rocks are predominantly Upper Proterozoic basement metamorphic rocks, mainly exposed in the Huangling Metamorphic Basement Complex north of Yichang, with smaller occurrences in Chengkou (northeastern Chongqing), Youyang, and Xiushan (southeastern Chongqing). Magmatic rocks are mainly composed of Late Proterozoic intermediate to acidic intrusive rocks, which are concentrated in the Huangling Metamorphic Basement Complex, particularly around the Three Gorges Dam north of Yichang.
Through prolonged geological evolution, the TGRA has developed a relatively stable continental block structure (Figure 2c). According to the Tectonics of China [31], the region is characterized by several major fold-and-thrust belts, as well as significant large-scale fault systems, including the Huaying Shan Basement Fault Zone (Rongchang–Hechuan Fault Zone, ①), the Changshou-Nanchuan Basement Fault Zone (②), the Qiyao Shan Basement Fault Zone (③), and the Daba Shan Fault Zone (④). Structurally, the northeastern part of the reservoir area lies on the western margin of the Yangtze Paraplatform, while the central-northern portion features the Huangling Anticline. The southern region is home to the Changyang Anticline and the Renheping Syncline, and the western area contains the Wufeng Syncline. The northwestern part is defined by the Shennongjia Anticline, and the northern sector is marked by platform-margin fold belts (Figure 2c).
The Yangtze River cuts deeply through the area from west to east, forming steep valleys and pronounced topographic relief. Slopes exceeding 25° account for over 40% of the land area, providing substantial material conditions for soil erosion and slope instability. The distribution pattern of mountains (74%), hills (21.7%), and flat terrain (4.3%) highlights the acute conflict between limited land resources and human activities, with the per capita cultivated area ranging only from 0.05 to 0.14 hectares [38].
(2)
Climatic conditions
The TGRA’s humid subtropical monsoon climate background is characterized by highly concentrated precipitation, frequent rainstorm events, a pronounced concurrent occurrence of heat and rainfall, and high interannual variability. Based on the Spatial Interpolation Dataset of Meteorological Elements in the TGRA (Multi-year Average) from the National Earth System Science Data Center, this study analyzed the regional climate baseline [39]. Furthermore, the climatic conditions from May to June 2023 (the year of field investigation) were specifically compared with the long-term average state to reveal the particular meteorological context during the research period.
In terms of temperature, the multi-year average regional temperature ranges from 17 °C to 19 °C [39]. The average annual temperature in the reservoir area was 18.2 °C. The average temperature of the coldest month (January) was 6.5 °C, while that of the hottest month (July) was 28.8 °C. The annual extreme maximum temperature can reach 42 °C, and the annual extreme minimum temperature can drop to −5 °C. During the fieldwork from May to June 2023, the regional average temperature was 23.5 °C, which is 0.7 °C higher than the long-term average for the same period (22.8 °C), indicating an overall warmer state.
Regarding precipitation, the multi-year average annual rainfall in the region ranges from 1000 to 1300 mm, but its temporal and spatial distribution is highly uneven [39,40]. In terms of monthly distribution, precipitation is heavily concentrated from May to September, with these five months accounting for approximately 65–70% of the annual total. June and July are the peak precipitation periods, with monthly average rainfall often exceeding 200 mm. Such concentrated precipitation frequently occurs as short-duration, high-intensity rainstorms, with maximum daily precipitation exceeding 250 mm. From May to June 2023, the precipitation was generally consistent with the long-term average for the same period, but the rainfall events were more concentrated, imposing additional pressure on slope stability during the field investigation window.

2.1.2. Ecosystem Characteristics and Anthropogenic Socio-Economic Activities

(1)
Ecosystem Characteristics
The primary ecosystem in the TGRA is the subtropical evergreen broad-leaved forest, which forms a crucial ecological matrix for the region [41,42,43,44,45]. However, prolonged agricultural activities, fuelwood collection, and urban expansion have led to a significant decline in forest cover and considerable ecosystem degradation over time. In response to these challenges, the Chinese government has implemented major ecological restoration programs, such as the Grain for Green Program and the Natural Forest Protection Program. These initiatives have contributed to the general recovery of vegetation cover and an increase in forest coverage in recent years. Despite these efforts, current forest resources are primarily composed of secondary forests, shrublands, and plantations [46,47]. Compared to structurally intact and functionally mature primary forests, these stands still show gaps in community stability, species diversity, and critical ecological functions such as water conservation and soil retention. Thus, it is necessary to enhance both the quality and resilience of the ecosystem.
As a biodiversity hotspot in China, the reservoir area harbors abundant flora and fauna [48,49,50]. Despite this advantage, agricultural expansion, infrastructure development, and urban sprawl continue to exacerbate habitat fragmentation and encroachment, influencing the processes of species migration, gene flow, and population sustainability. After the impoundment of the Three Gorges Reservoir, the region’s ecological landscape underwent a dramatic transformation. The original fast-flowing, shallow-stream river ecosystem has been replaced by a fluctuating “lake-river” composite system characterized by substantial water-level variations and slower currents. This shift has had profound effects on hydrological processes, thermal stratification, and nutrient cycling within the reservoir. It has also negatively impacted the survival and reproduction of many aquatic species adapted to flowing-water environments, particularly endemic fish species, while continuously reshaping the ecosystem structure and functions of the drawdown zone and riparian wetlands.
(2)
Anthropogenic Socio-economic Activities
Simultaneously, the reservoir area supports intensive human socio-economic activities. With a population of approximately 20 million, the region faces a sharp conflict between human activities and land availability. The Three Gorges Project led to the resettlement of millions of residents, spurring large-scale urbanization, infrastructure development, and the construction of roads, bridges, and ports along the riverbanks. As a result, the riparian zones have become concentrated areas of urban, industrial, mining, and agricultural land use, with high land reclamation rates and frequent activities such as engineering excavation, slope modification, and surface hardening. This high-intensity development not only encroaches directly on ecological spaces but also significantly disrupts natural geological and ecological processes. Surface loads are altered, rock and soil stability is compromised, and surface runoff and infiltration conditions are modified. Consequently, human activities have become the dominant external driver of eco-geological environmental changes and system vulnerability in the reservoir area, making human-land interactions in the region particularly intense and complex [51].

2.2. Research Methods

2.2.1. Technical Route

This study follows a systematic technical framework of “data integration—model construction—comparative validation—application decision-making.” First, multi-source data covering geology, ecology, climate, and socio-economic activities in the TGRA were extensively collected, encompassing 22 key indicators such as lithology, topography, vegetation coverage, soil properties, distribution of geological hazards, and intensity of human activities. All datasets were uniformly georeferenced, resampled to a 30 m resolution, and standardized through preprocessing, and were subsequently compiled into a multi-band raster dataset to provide consistent spatialized inputs for subsequent modeling.
On this basis, two types of models were developed in parallel. On the one hand, deep learning techniques were adopted to design Deep Neural Network (DNN) and Convolutional Neural Network (CNN) models. Using 1477 field-surveyed sample points as the core, multi-dimensional feature data from surrounding 9 × 9 pixel windows were extracted to construct training and testing sets. Through iterative adjustments of network architecture, number of hidden layer nodes, learning rate, and other hyperparameters, the models were optimized based on comprehensive metrics such as loss curves, accuracy, precision, and F1 score until optimal performance was achieved. On the other hand, the traditional Analytic Hierarchy Process (AHP) was employed, where judgment matrices were constructed through expert consultation to determine the weights of each evaluation factor, ultimately generating a vulnerability index map via GIS-based weighted overlay analysis.
Subsequently, the evaluation results of the three methods—DNN, CNN, and AHP—were compared and validated across multiple dimensions. This involved not only quantifying model performance through statistical indicators such as confusion matrices, ROC curves, and AUC values but also conducting field validation at typical sample points to analyze differences among the methods in terms of spatial delineation accuracy, misclassification tendencies, and explanatory power. This process clarified the advantages of deep learning models in capturing complex nonlinear relationships and spatial features.
Finally, the assessment results from the optimal model were integrated with the eco-geological zoning of the reservoir area to systematically analyze the spatial differentiation patterns and dominant driving mechanisms of vulnerability. Guided by the principle of “zoning-based classification with priority given to key areas,” differentiated protection and restoration strategies were proposed tailored to the vulnerability levels within each eco-geological unit. These strategies emphasize rigid spatial regulation and ecological restoration for high-vulnerability areas, and ecosystem quality enhancement and functional maintenance for low-vulnerability areas, thereby providing refined and actionable decision-making support for optimizing the regional ecological security framework.

2.2.2. Data Selection and Preprocessing

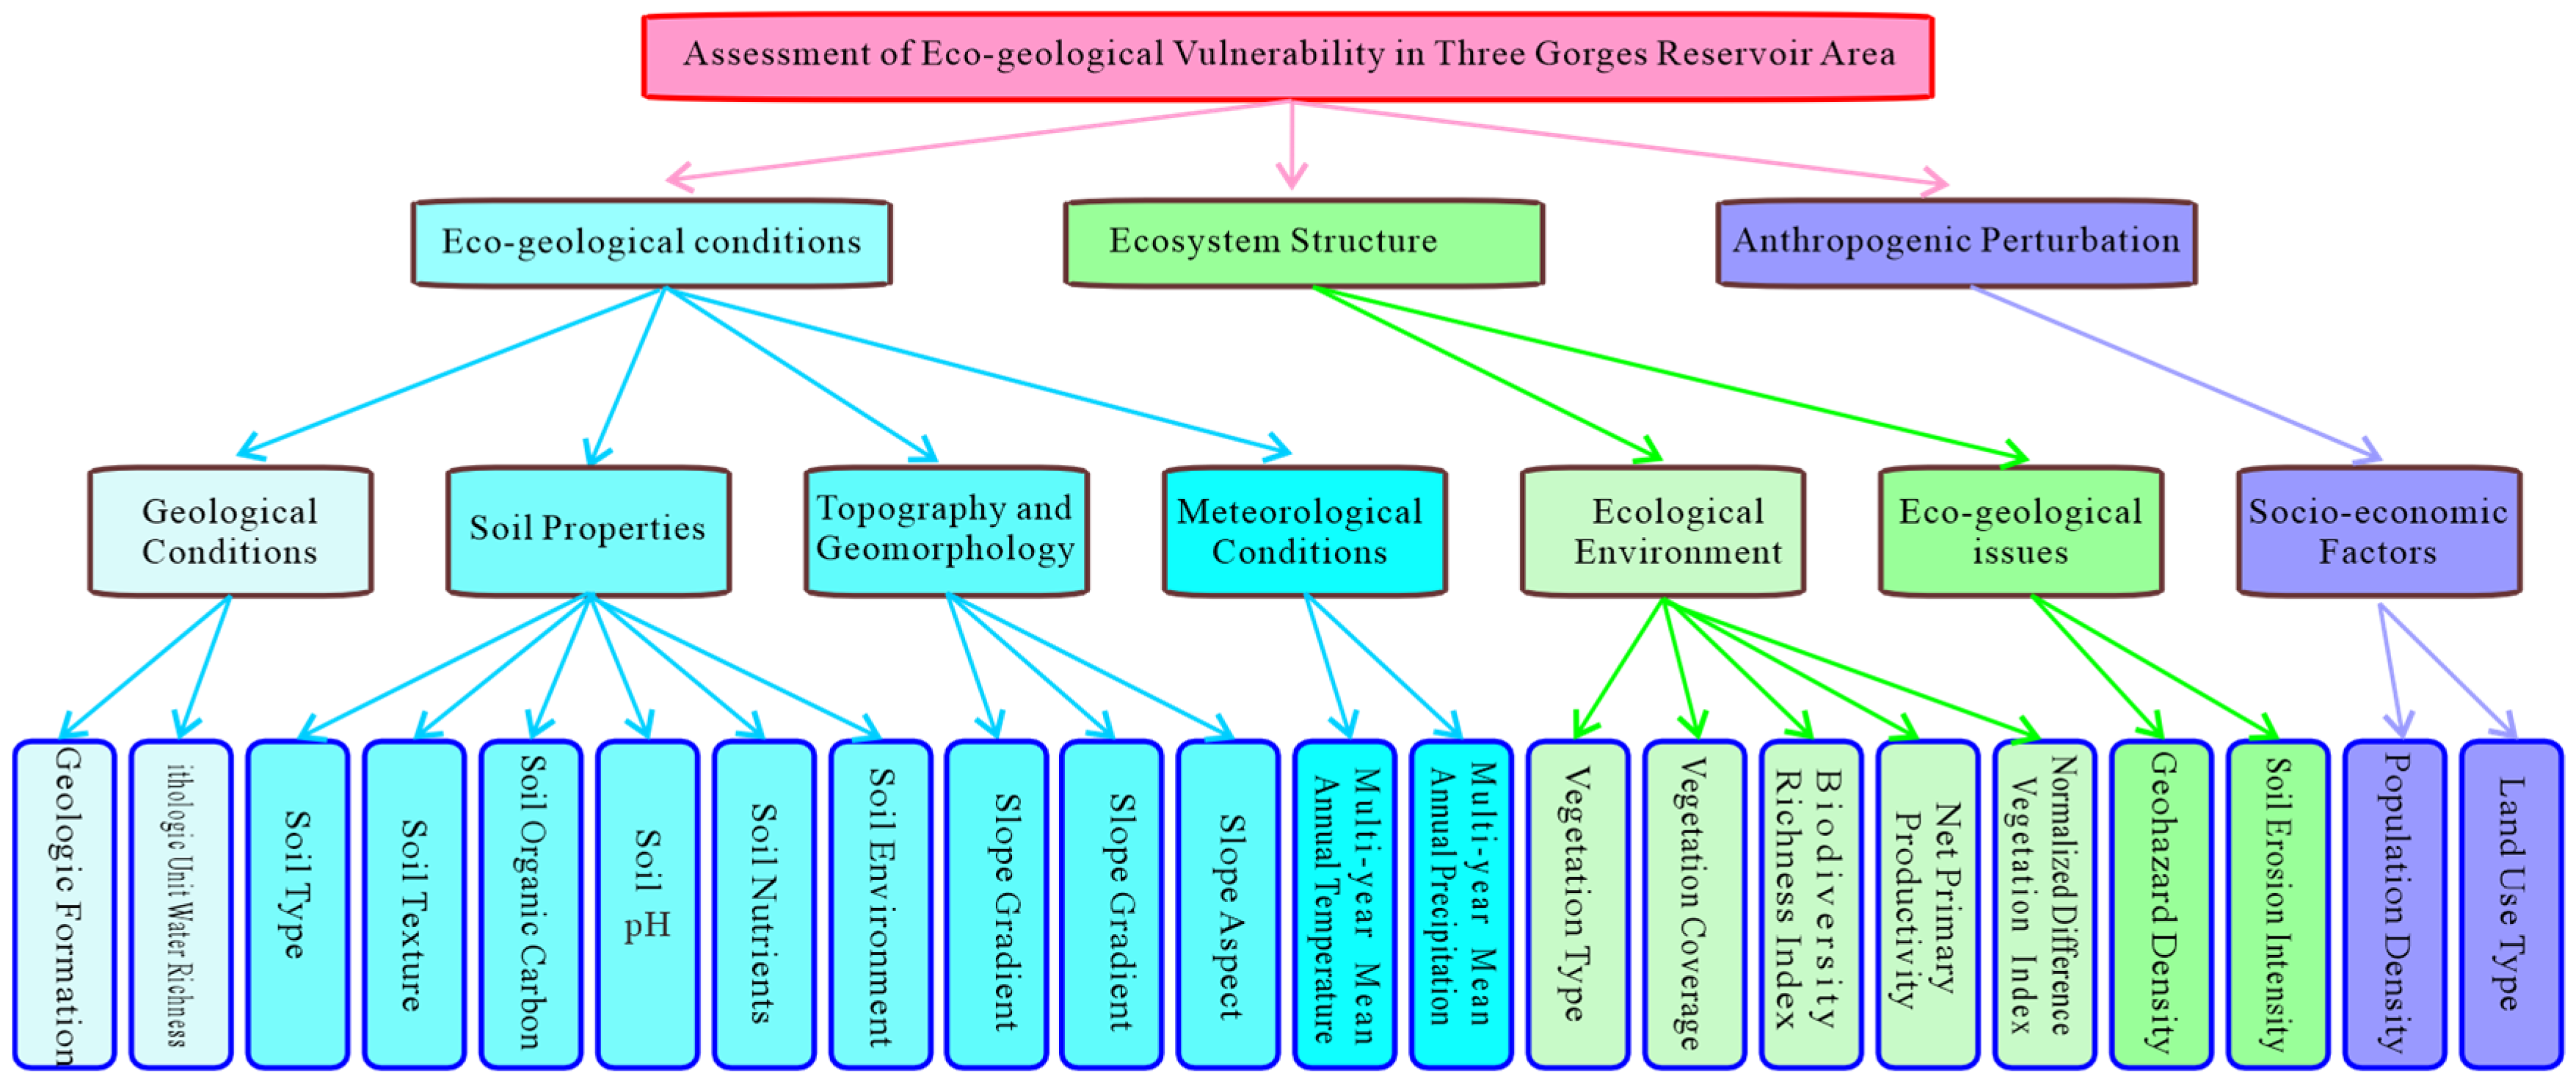
The factors influencing eco-geological vulnerability selected in this study encompass a range of data, including human activities, soil data, geological conditions, topography and landforms, and ecological data. These factors are classified into 7 categories with a total of 22 indicators (Figure 3, Table 1).
(1)
Field Data Collection
The field data collection for this study was supported by the Ecological Geology Survey Project in Key Areas of the Yangtze River Basin, funded by the China Geological Survey. Fieldwork was conducted from May to June 2023. A team of eco-geological experts from the Chengdu Center, China Geological Survey, and the 107 Geology Team, Chongqing Bureau of Geology and Mineral Development systematically investigated the TGRA along predefined transects. The survey was carried out in three phases: the initial phase focused on the Wushan area and its surrounding regions (including Wuxi, Badong, Yiling, and Zigui); the second phase extended to the outskirts of Chongqing’s main urban area (covering Yunyang, Wanzhou, Dianjiang, and adjacent regions); and the final phase concentrated on the vicinity of Jiangjin District in Chongqing.
During the fieldwork, GPS devices were used for precise point positioning, while profile measurements were taken at key locations. Soil and rock samples were collected for laboratory analysis, and habitat observations were integrated with remote sensing image interpretation. Each survey point was evaluated by the expert team and assigned a qualitative vulnerability label (0 for negligible vulnerability and 1 for Extreme vulnerability). In total, 1477 valid sampling points were collected, providing reliable ground-truth data for the subsequent eco-geological vulnerability modeling and assessment.
(2)
Research Data Acquisition
This study incorporated multi-source remote sensing and geospatial data. All datasets were resampled to a uniform spatial resolution of 30 m to ensure consistency. A systematic preprocessing pipeline was applied to the raw data, including data cleaning, outlier removal, and normalization, ensuring high data quality and consistency. After preprocessing, the complete dataset was divided into training and testing subsets following a predefined ratio. These subsets were then used for model training, hyperparameter tuning, and performance validation during subsequent analysis stages.

2.2.3. Vulnerability Assessment Methods

Traditional vulnerability assessments have predominantly relied on linear, weighted overlay methods [52]. In contrast, this study adopts a deep learning-based approach for assessing eco-geological vulnerability, specifically utilizing deep neural networks (DNN) and convolutional neural networks (CNN) to construct and evaluate models. To compare the outcomes of these advanced machine learning techniques with a conventional method, the analytic hierarchy process (AHP) was also employed. This comparative analysis aims to explore how different methodologies influence the understanding of eco-geological vulnerability and to assess their respective practical applicability. By integrating deep learning techniques, this study seeks to enhance the accuracy and comprehensiveness of eco-geological vulnerability evaluations. At the same time, incorporating the traditional AHP provides a broader analytical perspective, enabling a more nuanced understanding of ecosystem vulnerability. The comparison of results from these diverse methods is intended to offer more scientific and reliable evidence to inform future ecological conservation and management strategies.
(1)
Deep neural network (DNN)
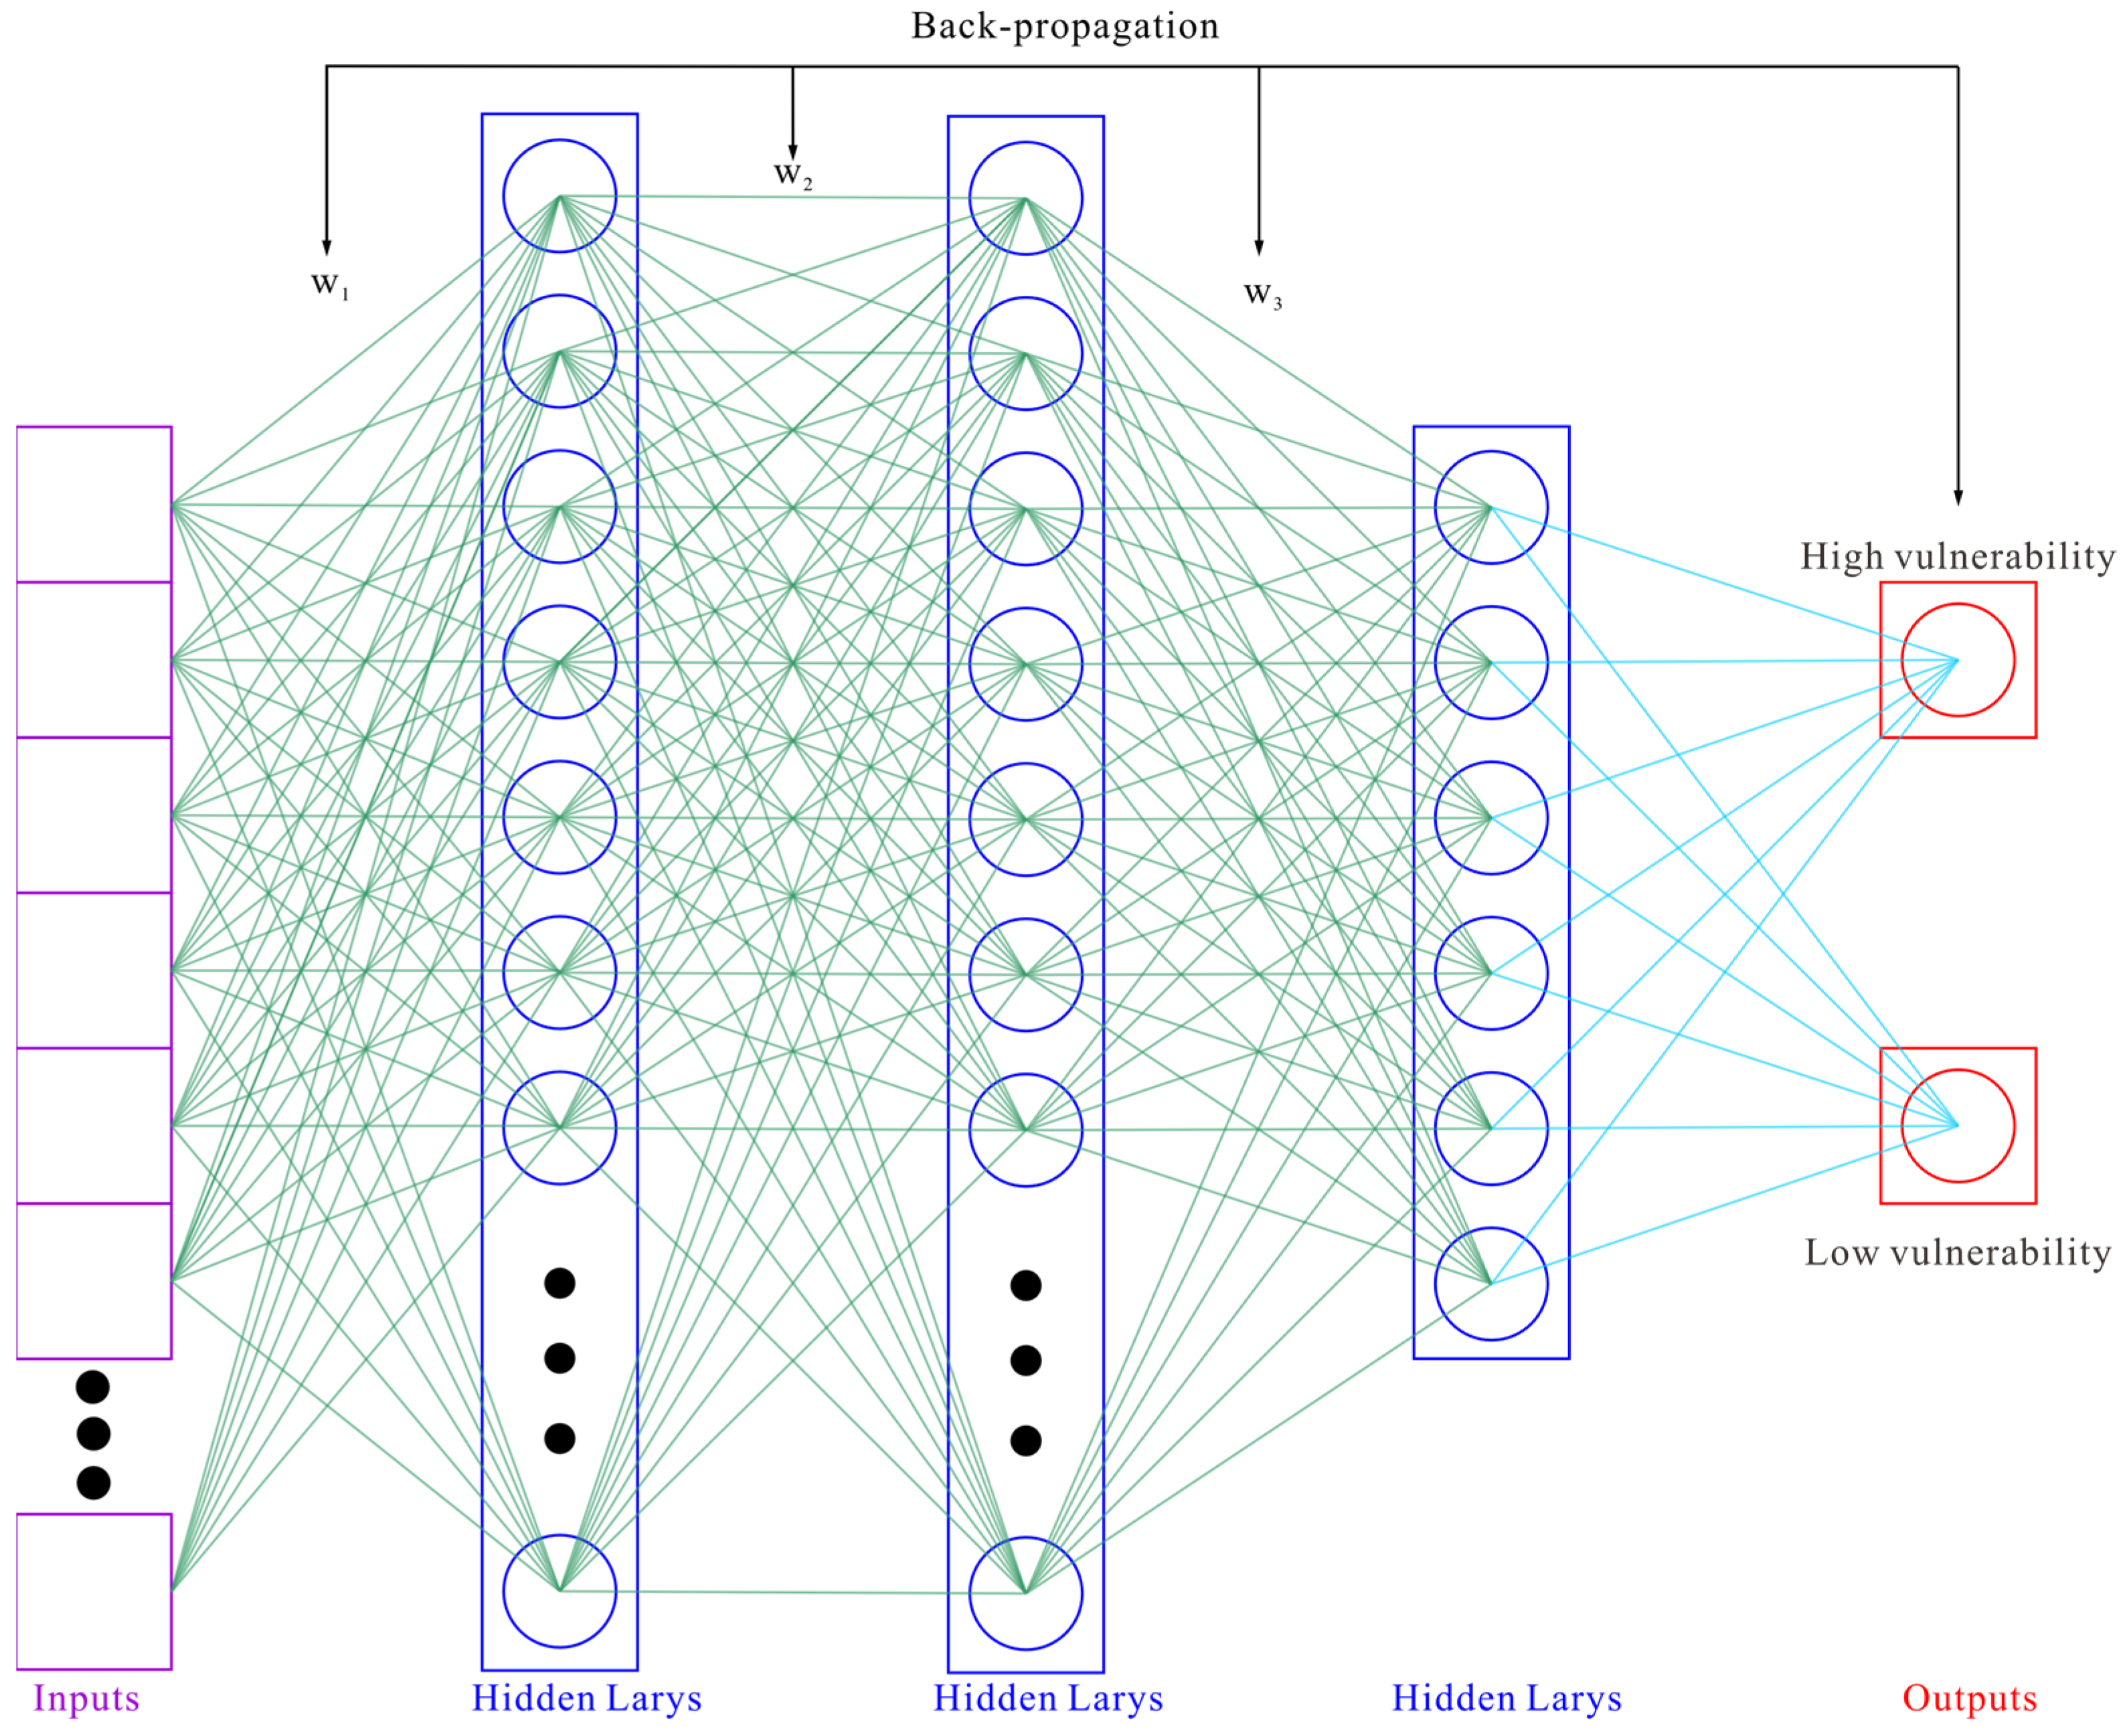
Deep Neural Networks (DNNs) have been widely applied to solve complex problems across various domains, including computer vision, natural language processing, speech recognition, and robotics [53,54,55]. A DNN consists of multiple layers of neural networks, typically including an input layer, several hidden layers, and an output layer. The deep architecture and hierarchical learning capability of DNNs enable them to handle intricate tasks and extract high-level abstract features from large volumes of labeled data (Figure 4). By adjusting weight parameters and incorporating non-linear activation functions, DNNs learn complex functional mappings. Model parameters are continuously optimized using the backpropagation algorithm to improve prediction accuracy on training data. This makes DNNs particularly effective for processing large-scale, high-dimensional data, providing a powerful tool for comprehensive analysis of complex multi-dimensional datasets in eco-geology and related fields.
(2)
Convolutional neural network (CNN)
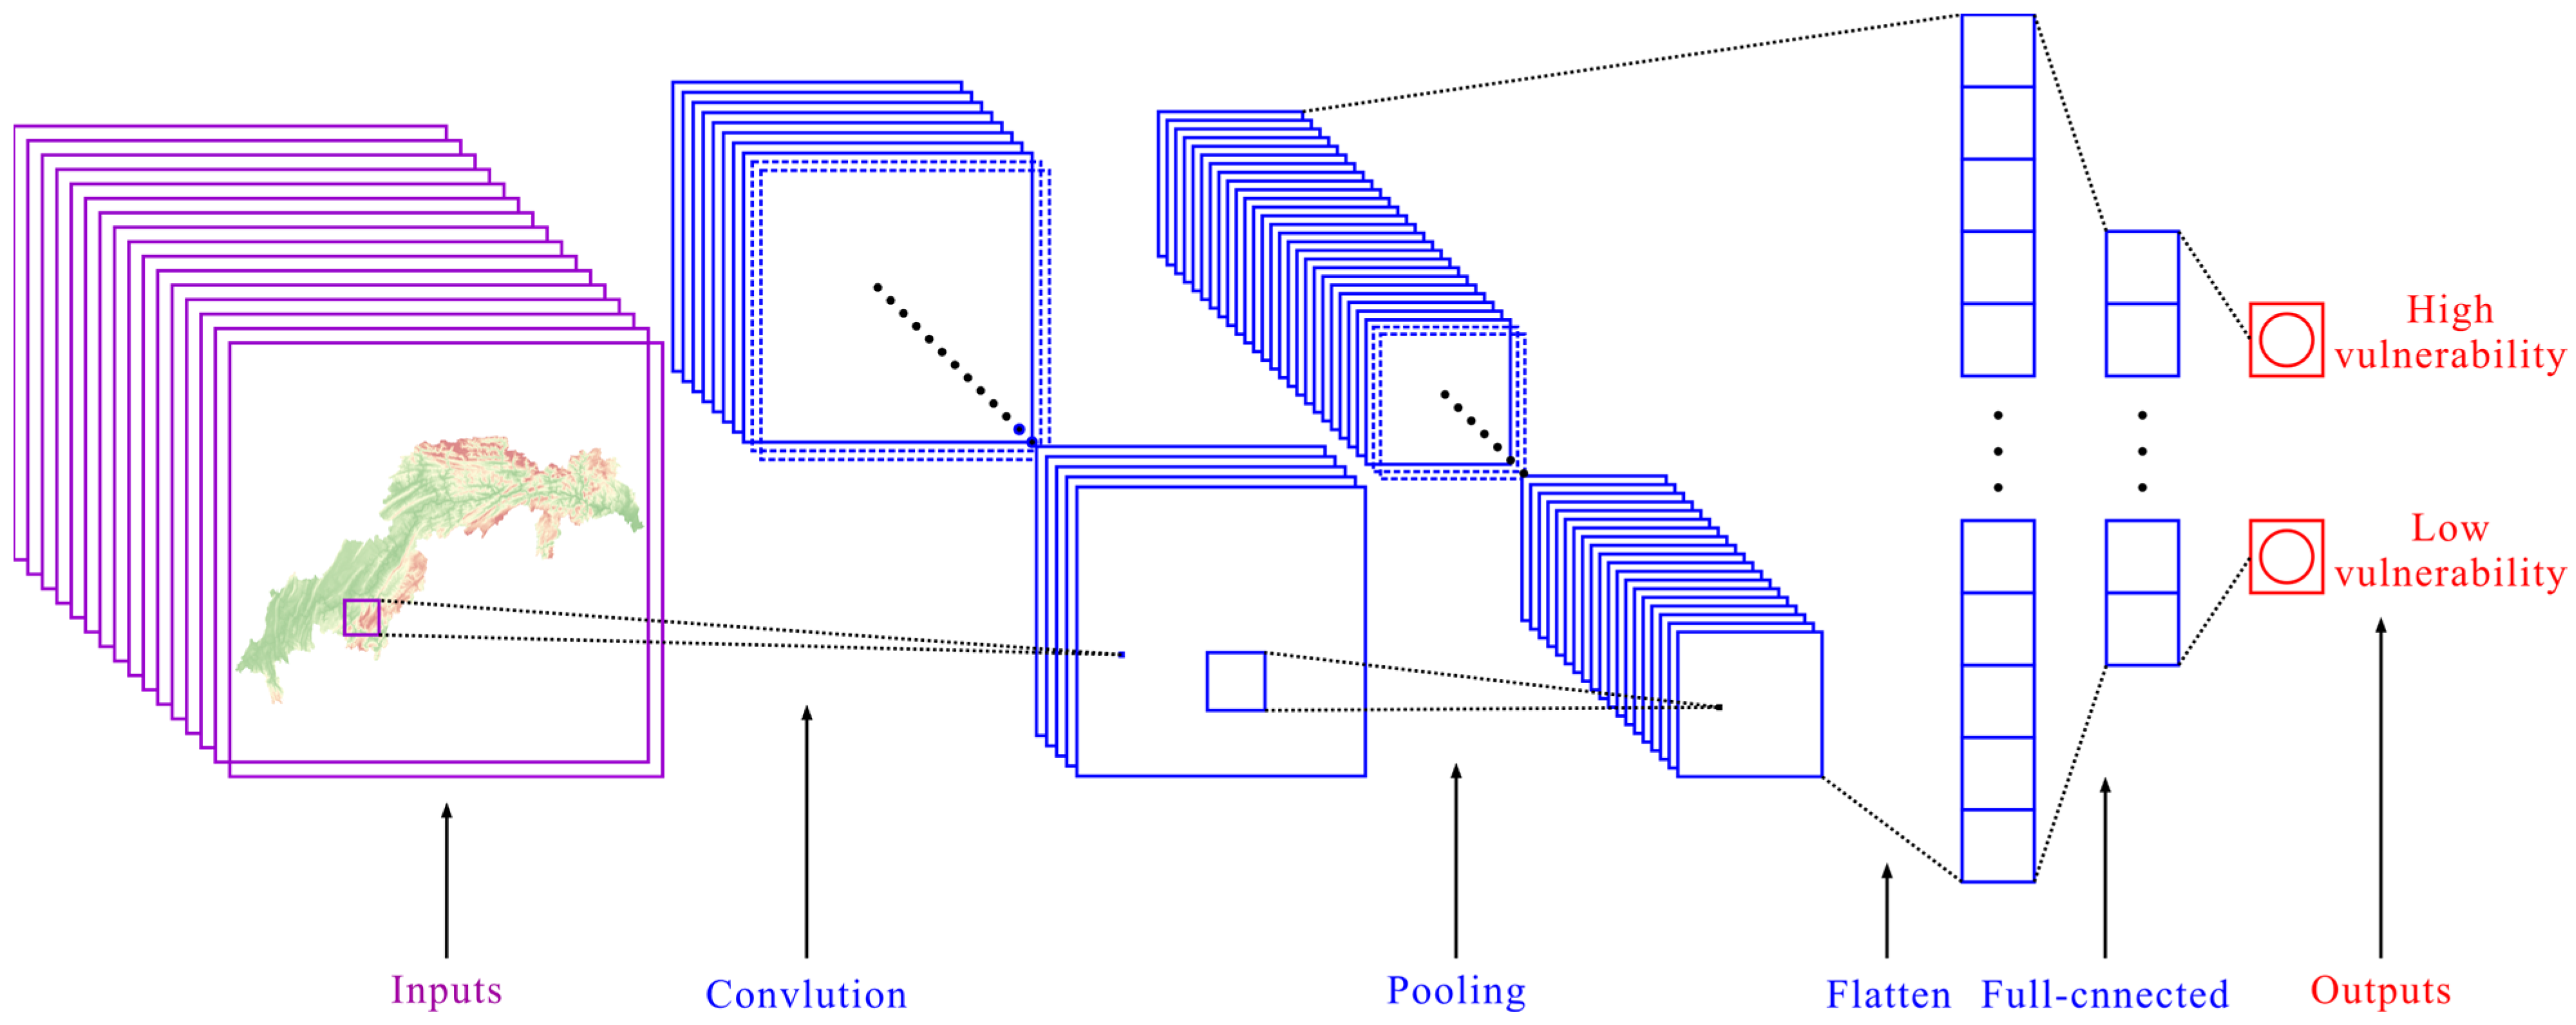
The primary advantage of Convolutional Neural Networks (CNNs) lies in their ability to automatically identify relevant features without explicit human supervision. CNNs have become widely used in fields such as computer vision, speech processing, and facial recognition. The architecture of CNNs is inspired by the neurons in the human and animal brain, resembling traditional neural networks [54,55,56]. In the human brain, complex cells in the visual cortex process visual information; CNNs emulate this organization to handle image data (Figure 5). Goodfellow et al. identified three key advantages of CNNs: equivariant representations, sparse interactions, and parameter sharing. Unlike traditional fully connected (FC) networks, CNNs use shared weights and local connectivity to fully leverage the 2D structure of input data, such as image signals. This approach uses far fewer parameters, streamlining the training process and increasing network speed—much like the way visual cortical cells process small, localized portions of a scene, extracting spatial correlations from them. Recently, CNNs have seen increasing adoption in earth sciences and ecological studies for classification and prediction tasks.
In comparison to DNNs, the CNN architecture (Figure 5) incorporates convolutional layers designed to extract local features from images. By sharing weights, CNNs reduce the number of parameters, enhancing their ability to capture local patterns and improving model generalizability. The convolutional layers process multi-dimensional image data, applying various kernels to compress image dimensions and assign weights accordingly. Pooling layers extract essential information while further reducing dimensionality, and activation layers introduce non-linearity, akin to activation functions in fully connected networks.
(3)
Analytic hierarchy process (AHP)
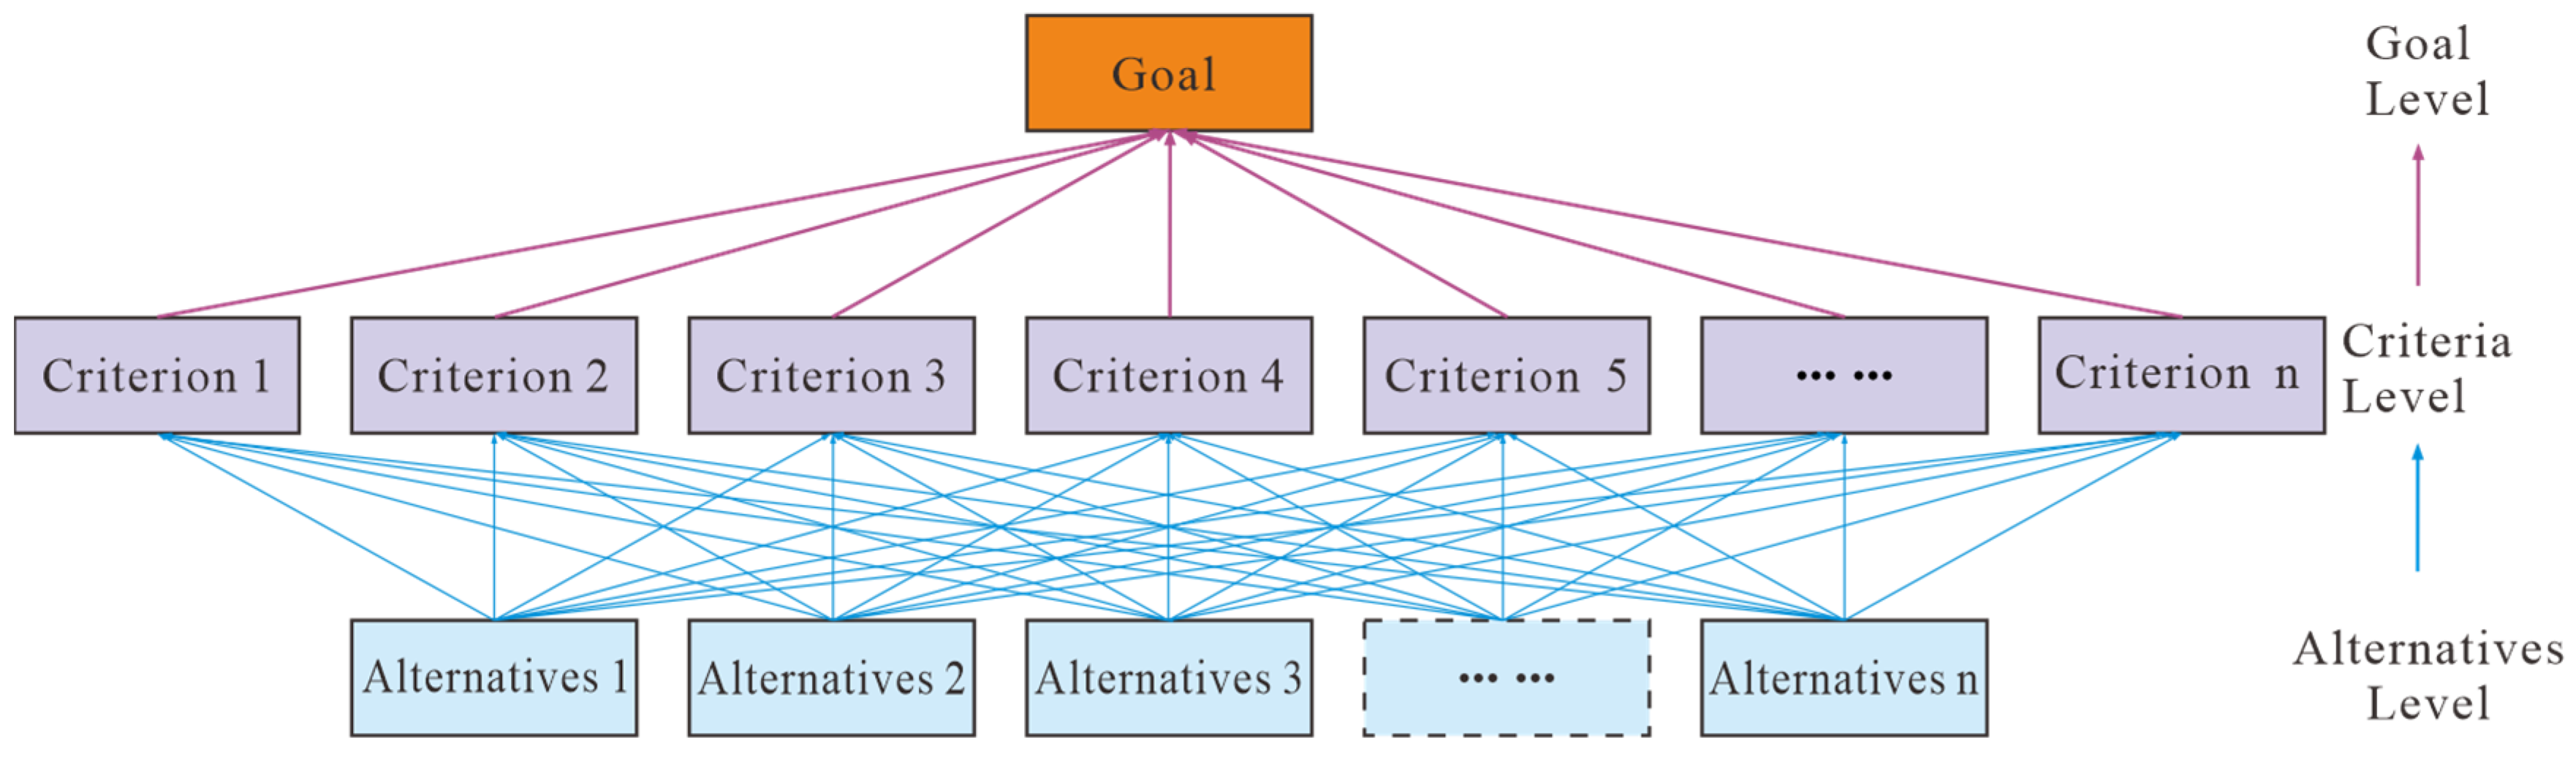
The Analytic Hierarchy Process (AHP) is a decision-analysis method that integrates qualitative and quantitative assessments [57,58]. It is used in structured settings to determine criterion weights and prioritize alternatives based on pairwise comparisons (Figure 6). AHP is particularly useful for addressing unstructured, complex decision-making problems involving multiple objectives, criteria, factors, and hierarchical levels. It has been widely applied in ecological, environmental, and resource evaluations [59]. By assigning different weights to various factors based on their relative importance to eco-geological vulnerability, AHP facilitates a comprehensive evaluation through weighted overlay analysis [60,61].
The Eco-geological Vulnerability Index (EGVI) results are classified into five levels using the natural breaks method: Negligible Vulnerability (Level I, EGVI < 0.3), Mild Vulnerability (Level II, 0.3 ≤ EGVI < 0.45), Moderate Vulnerability (Level III, 0.45 ≤ EGVI < 0.6), High Vulnerability (Level IV, 0.6 ≤ EGVI < 0.75), and Extreme vulnerability (Level V, EGVI ≥ 0.75). Using GIS spatial analysis tools, the area and transitions of each vulnerability level are quantified, and spatiotemporal evolution maps are created.

3. Results

3.1. Eco-Geological Vulnerability Assessment Models

3.1.1. Deep Neural Network (DNN)

The Deep Neural Network (DNN) model developed in this study was designed to learn the complex nonlinear relationships between eco-geological vulnerability factors and vulnerability levels. The model was trained using standard forward and backward propagation mechanisms. The input layer receives the factors influencing eco-geological vulnerability, which are then processed and abstracted through hidden layers with nonlinear activation functions. To ensure reproducibility, we report the detailed model configuration below:
Network Architecture and Hyperparameters: The model consists of an input layer, four fully connected hidden layers, and an output layer. The input data (a 9 × 9 × 16 window per sample) is first flattened. The number of neurons and the activation function for each layer are detailed in Table 2. This architecture enables high-level feature abstraction. The model was optimized using the binary cross-entropy loss function (Equation (1)) and the Adam optimizer. Key training hyperparameters are listed in Table 3.
BCE(y, t) = −[t·log(y) + (1 − t)·log(1 − y)]
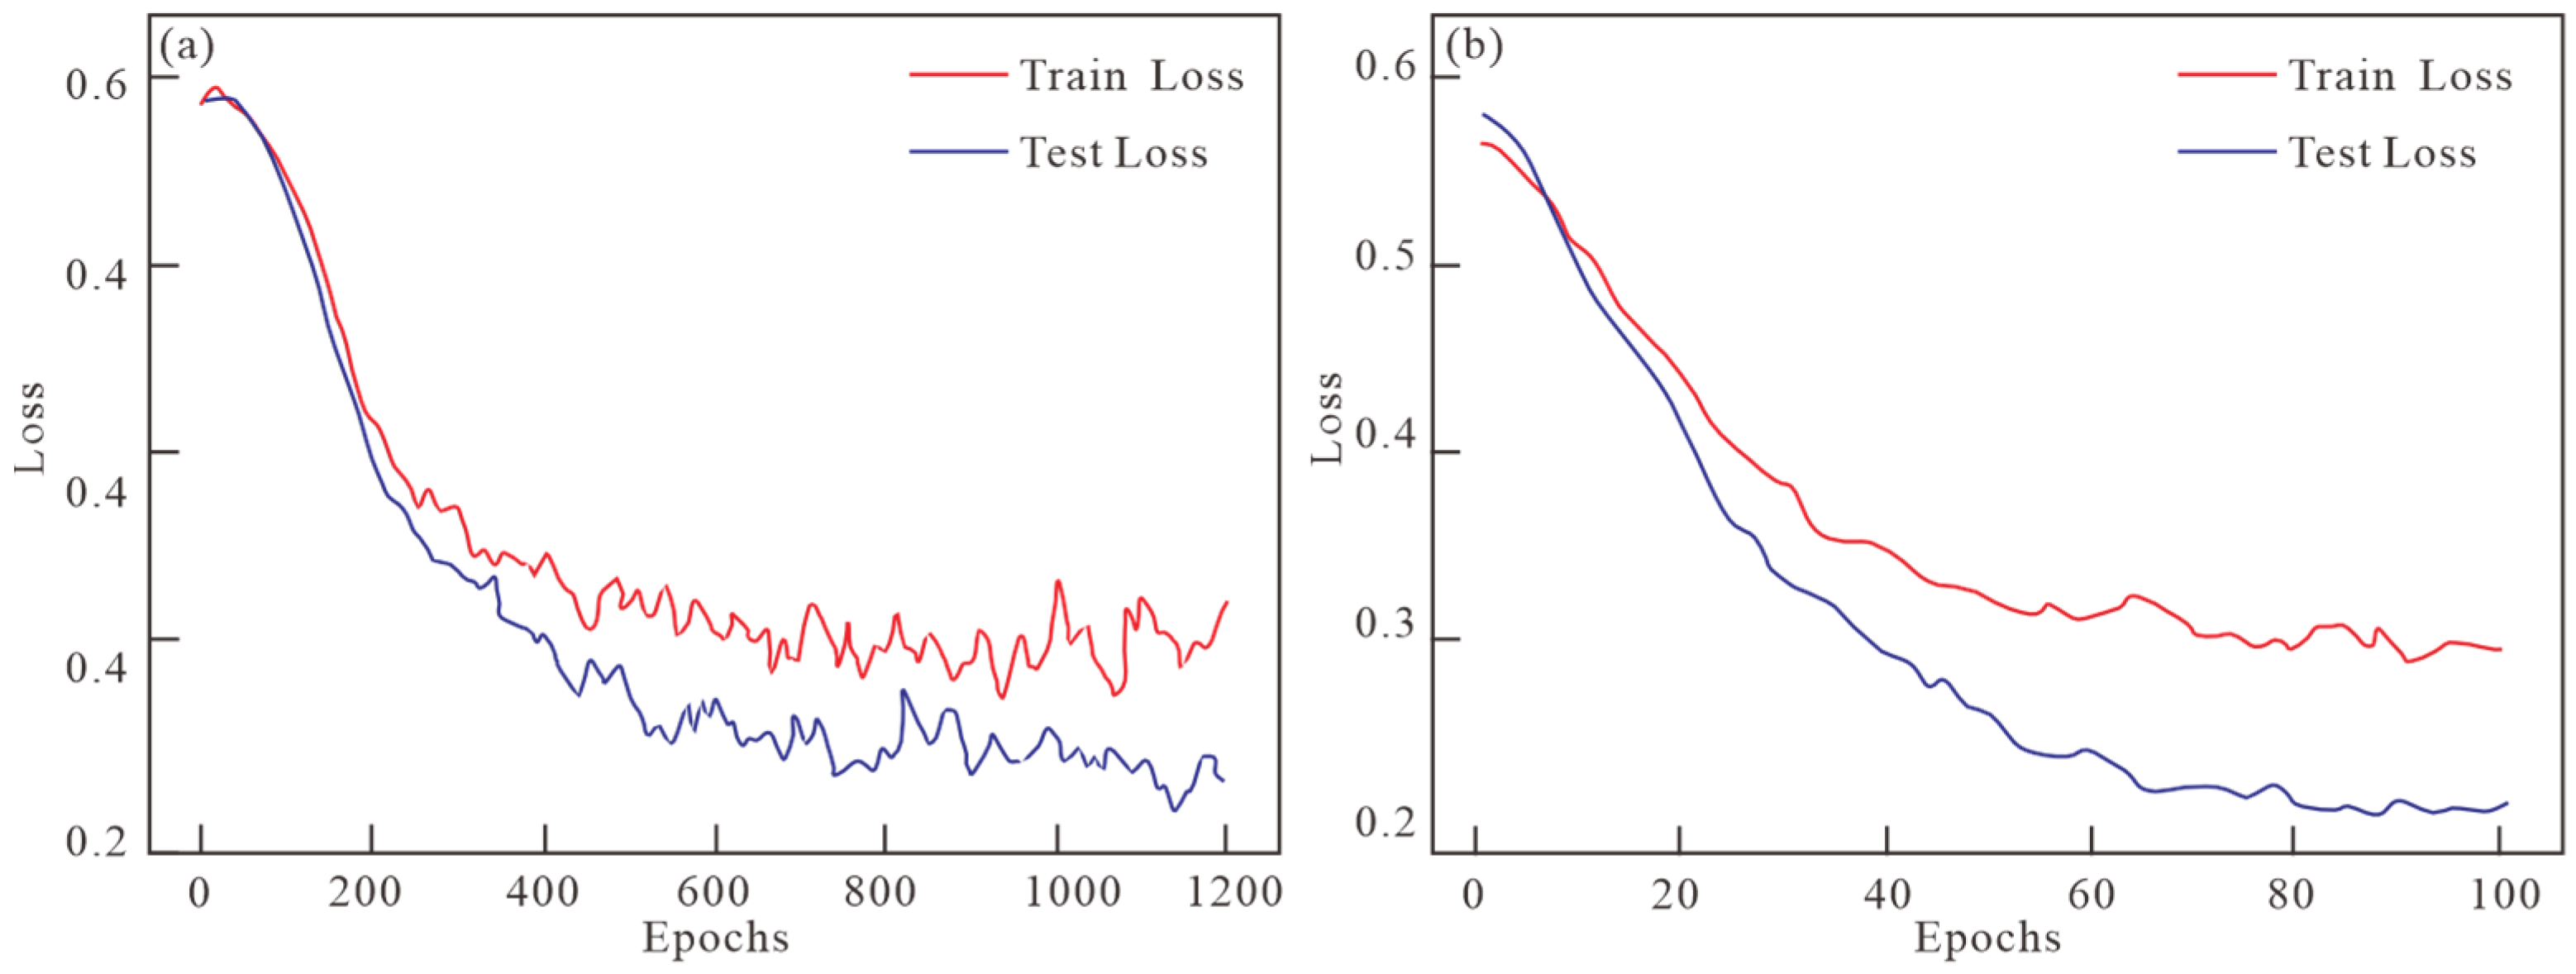
Training Configuration: The dataset was randomly split into training, validation, and test sets at a ratio of 70%:15%:15%. An early stopping strategy was adopted; training was terminated if the validation loss did not decrease for 10 consecutive epochs. To ensure reproducible results, a random seed (42) was fixed, and the final model was selected upon stabilization of the loss curve (convergence at epoch 1119; Figure 7). Ten independent training runs were conducted to evaluate stability.
Computational Environment: The model was implemented using Python 3.11 and mainstream deep learning frameworks on a hardware platform equipped with an NVIDIA GeForce GTX 1050 Ti GPU and an Intel Core i5-7300HQ CPU.

3.1.2. Convolutional Neural Network (CNN)

The CNN model was designed to effectively capture spatially localized correlations among eco-geological factors. The model input is a three-dimensional data block (9 × 9 × 16) representing a 9 × 9 pixel window centered on each sample point. To ensure reproducibility, its detailed configuration is reported as follows:
Network Architecture and Hyperparameters: The model core comprises two consecutive convolution-pooling modules. Each module contains a convolutional layer with a 3 × 3 kernel size (32 filters in the first, 64 in the second), followed by a 2 × 2 max-pooling layer. A Dropout layer (rate = 0.2) is added after each pooling layer. Extracted features are then flattened and passed through two fully connected layers (128 and 64 neurons) before the final Softmax output layer. The Adam optimizer was used for training, with hyperparameters detailed in Table 2.
Training Configuration: Consistent with the DNN model, the data was split 70%/15%/15%, early stopping was applied based on validation loss, and the random seed was fixed at 42. The model converged at epoch 72 (Figure 7). Ten independent runs were performed.
Computational Environment: The training was conducted on the same hardware platform as the DNN model.

3.1.3. Analytic Hierarchy Process (AHP)

As a traditional method for comparison, the Analytic Hierarchy Process (AHP) was also employed in this study for vulnerability assessment. First, based on the indicator system developed by the research team, each evaluation factor was assigned a grade, generating single-factor evaluation maps. A judgment matrix was then constructed through expert consultation to calculate the weight of each factor, with the consistency ratio of the matrix checked to ensure logical validity.
Subsequently, within the ArcGIS Pro 3.0 platform, all single-factor layers were weighted and overlaid according to the determined weights to produce a continuous vulnerability index map. To facilitate comparison with the deep learning model results, the initial evaluation values (ranging from 0 to 100) were normalized to the 0–1 scale and treated as vulnerability probabilities for subsequent analysis.

3.2. Model Training and Evaluation

To comprehensively evaluate model performance, this study employed multiple metrics, including loss curves, confusion matrices, accuracy, precision, recall, specificity, F1 score, as well as receiver operating characteristic (ROC) curves and the area under the curve (AUC) [62,63,64].
During the model training phase, the Adam optimizer was used, with the ReLU activation function applied to intermediate layers and Softmax to the output layer. Hyperparameters were adjusted using a trial-and-error approach, and training progress was monitored in real-time based on loss curves and accuracy (Table 3). The optimal model was saved when the loss curve stabilized and showed no further significant decline. Ultimately, the DNN model converged at the 1119th epoch, and the CNN model converged at the 72nd epoch (Figure 7).
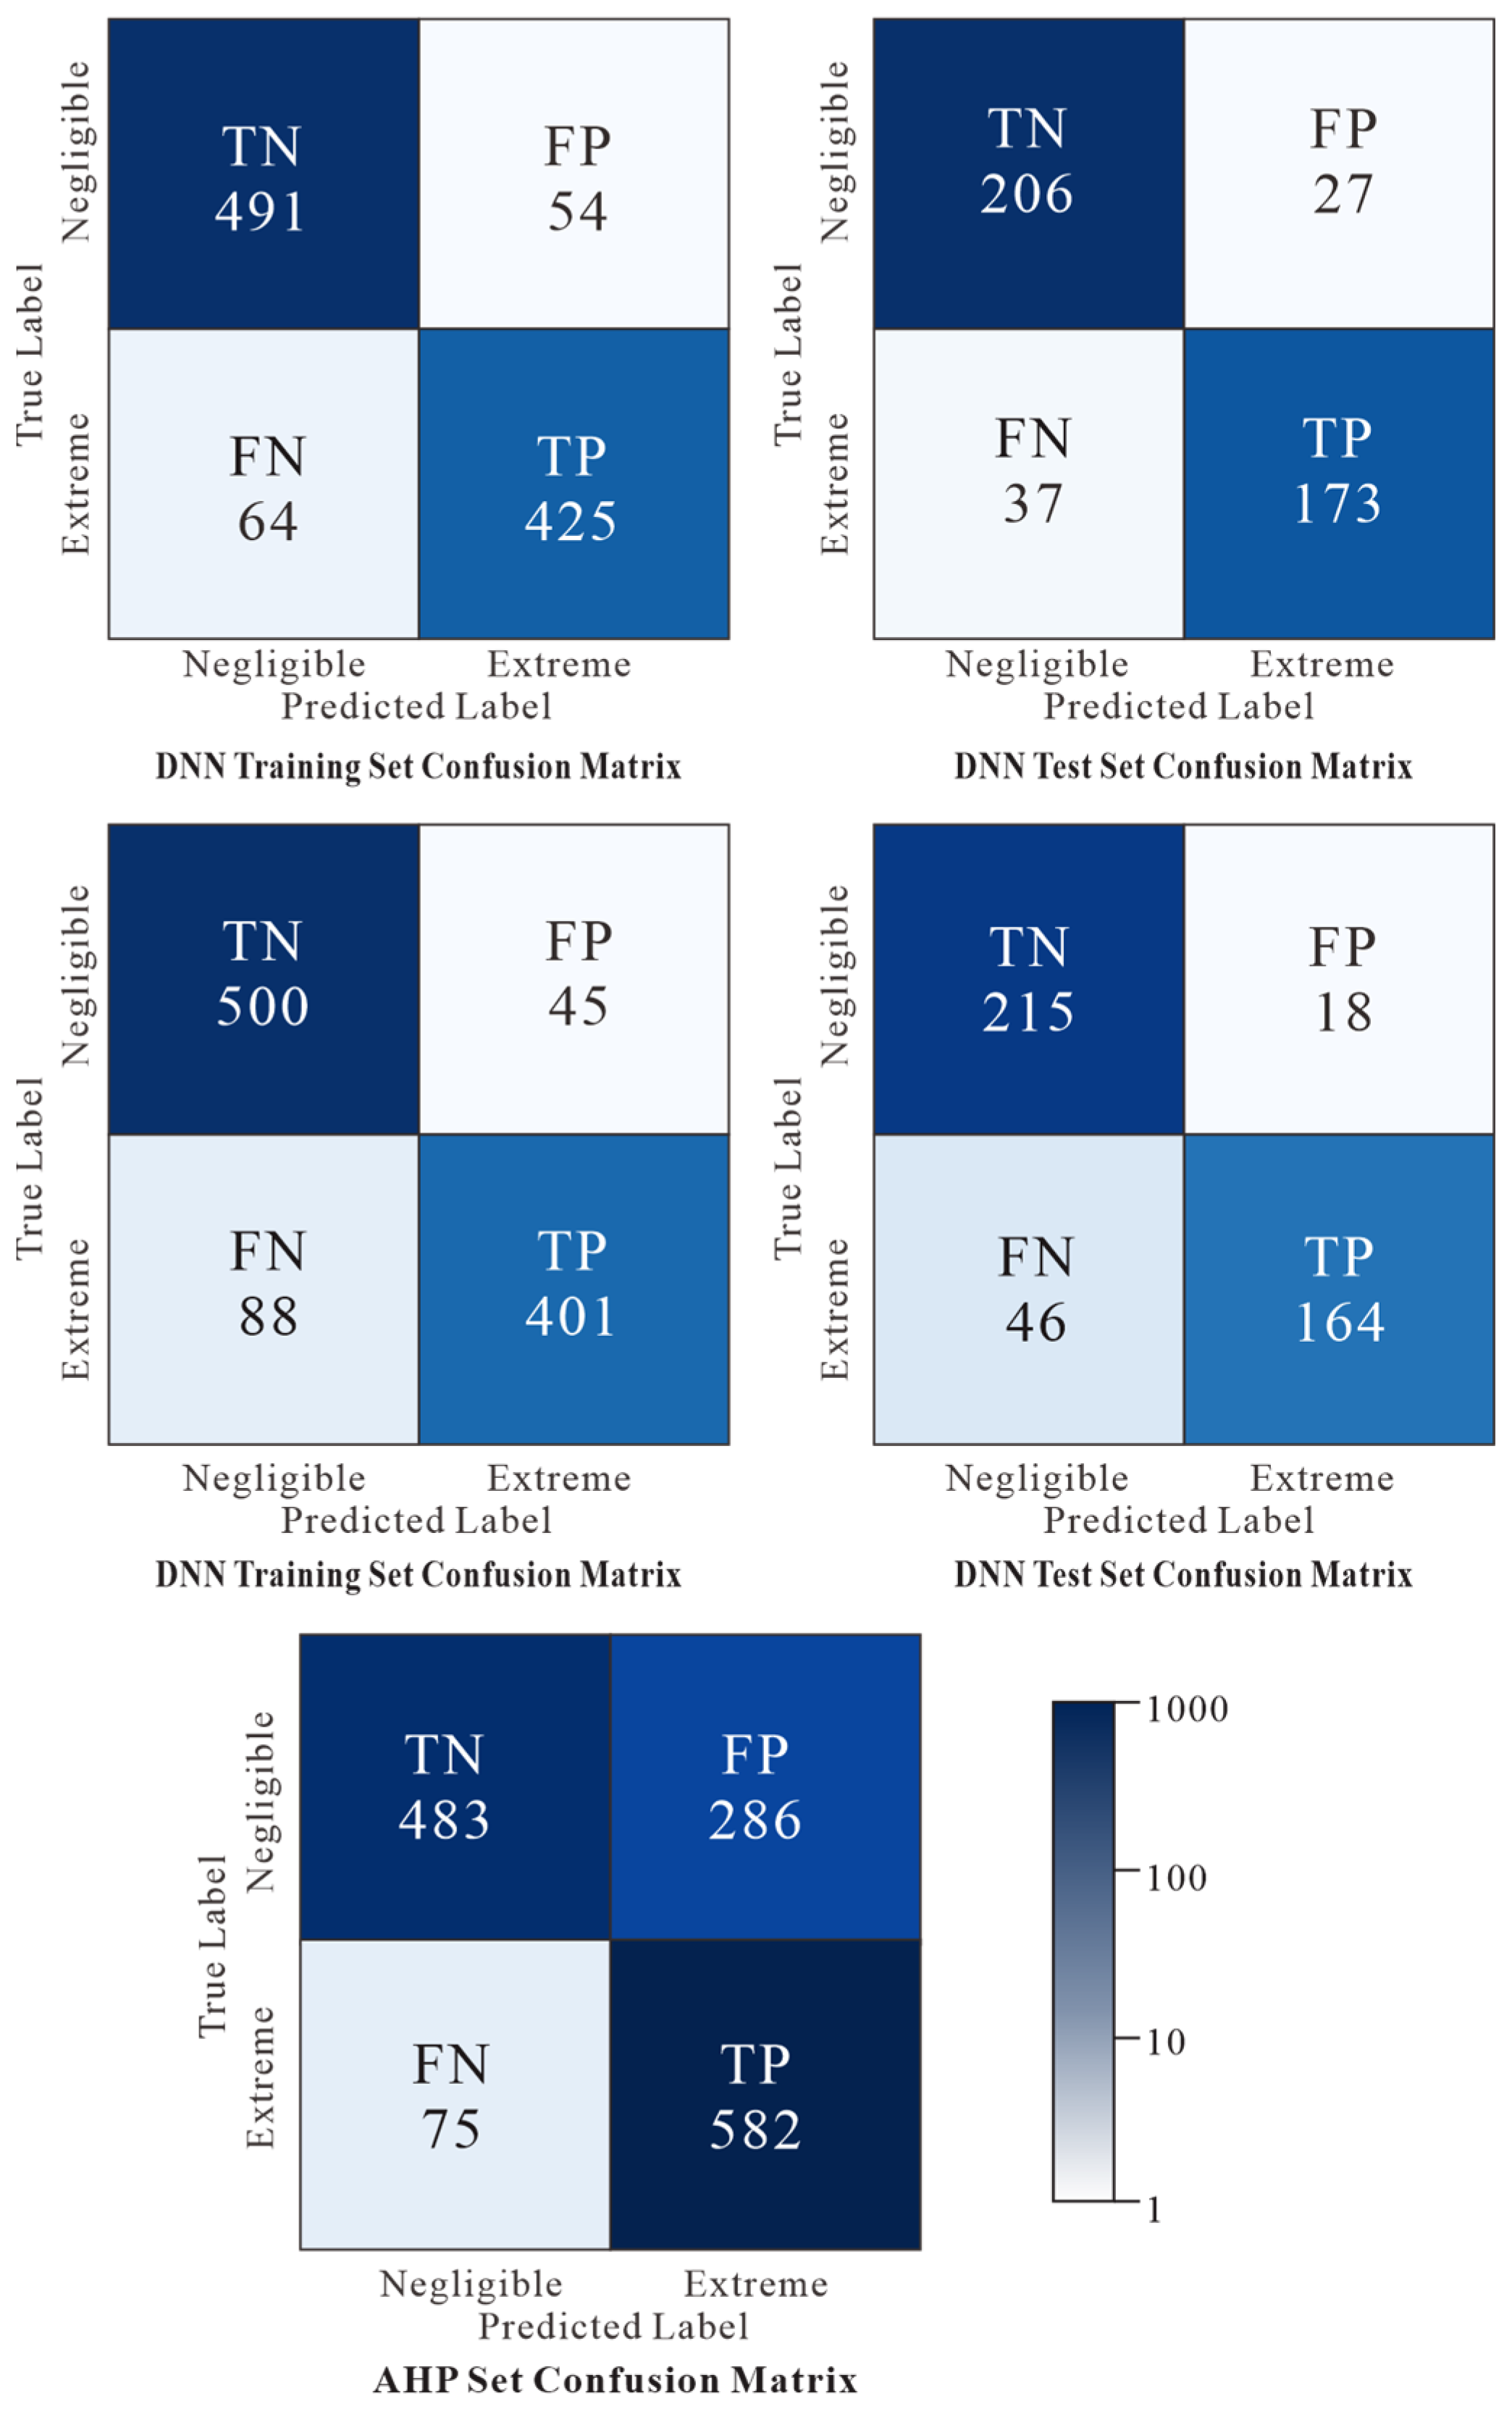
Predictions were made on both the training and test sets using the saved models, with an output probability greater than 0.5 classified as positive. Confusion matrices were then constructed (Figure 8). The analysis revealed that the DNN model misclassified 118 samples in the training set (64 false negatives, 54 false positives) and 64 samples in the test set (37 false negatives, 27 false positives). The CNN model misclassified 133 samples in the training set (88 false negatives, 45 false positives) and 64 samples in the test set (46 false negatives, 18 false positives). For comparison, the vulnerability index output from the AHP method (normalized to the 0–1 range) was binarized using a threshold of 0.5. This approach misclassified 361 samples across the entire dataset (75 false negatives, 286 false positives), indicating a notably high false positive rate.
Further calculation of various evaluation metrics (Table 4) yielded the following results. Accuracy: Both deep learning models (DNN and CNN) achieved accuracy values above 0.85 on both the training and test sets, while the AHP method attained an accuracy of 0.7468. Recall: The AHP method achieved the highest recall (0.8858), followed by DNN, while CNN performed relatively lower on the test set (0.7810). Precision: The CNN model performed best (0.8991 on the training set, 0.9011 on the test set), whereas the AHP method had the lowest precision (0.6705). Specificity: The CNN model demonstrated the highest specificity (0.9174 on the training set, 0.9227 on the test set), while the AHP method performed poorly (0.6281). F1 Score: DNN achieved the highest F1 score on the training set (0.8769), while the AHP method scored the lowest (0.7633).
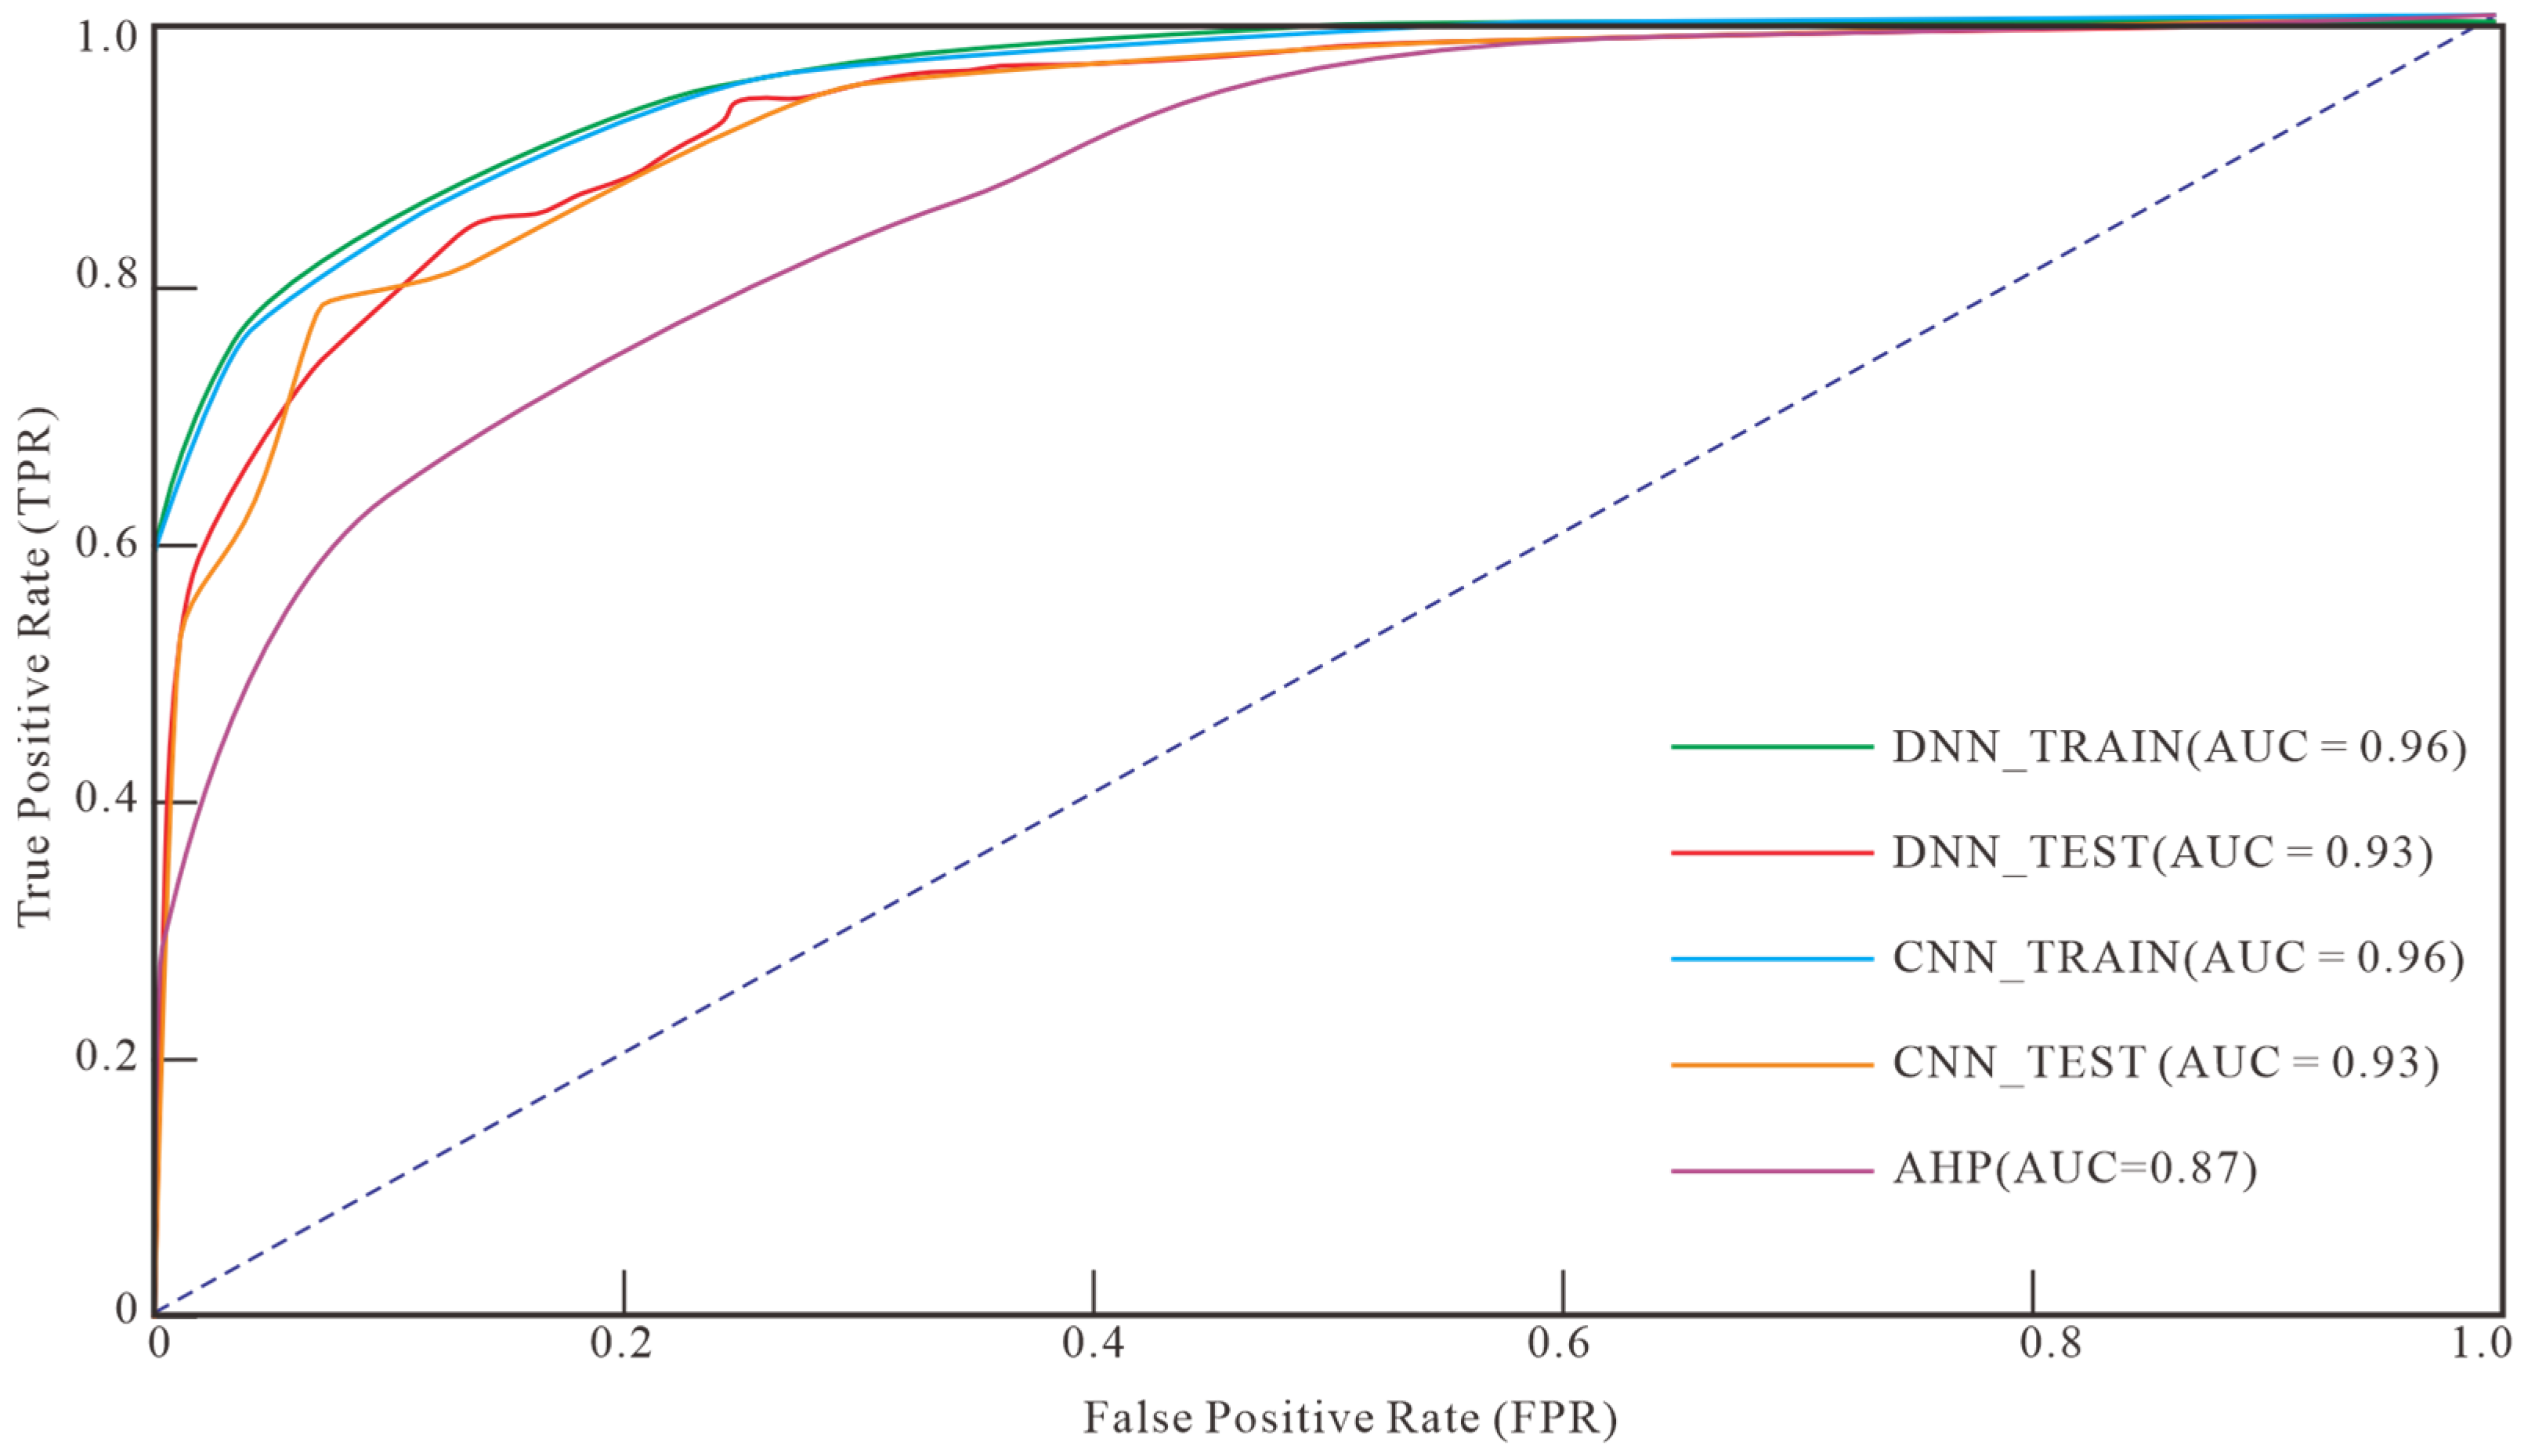
Additionally, analysis of the ROC curves and AUC values (Figure 9) showed that both DNN and CNN models performed excellently and consistently on the training and test sets (AUC values of 0.96 and 0.93, respectively). In contrast, the AHP model exhibited a significantly lower AUC value (0.87).
In summary, integrating insights from the confusion matrices, accuracy metrics, and AUC analysis demonstrates that both deep learning models (DNN and CNN) significantly outperform the traditional AHP method in overall evaluation performance. Specifically, the CNN model excels in precision and specificity. While the AHP method has a slight advantage in recall, it demonstrates notable deficiencies in precision, specificity, and overall discriminative ability (AUC). This suggests that the AHP method has limited effectiveness in handling the complex nonlinear evaluation tasks addressed in this study.

3.3. Evaluation Results

Based on the trained DNN and CNN models, this study utilized the PyTorch 1.10 framework to save the model parameters and employed the GDAL library to read multi-source raster data, which consisted of 16 bands with a spatial resolution of 30 m. For the entire study area, covering a total of 225,722,880 pixels, forward inference was conducted pixel by pixel by inputting the data into the models. This process generated the predicted probability (ranging from 0 to 1) for each location, indicating the likelihood of it belonging to the vulnerable class. Higher probability values correspond to greater eco-geological vulnerability. As a result, continuous spatial distribution maps of vulnerability were produced.
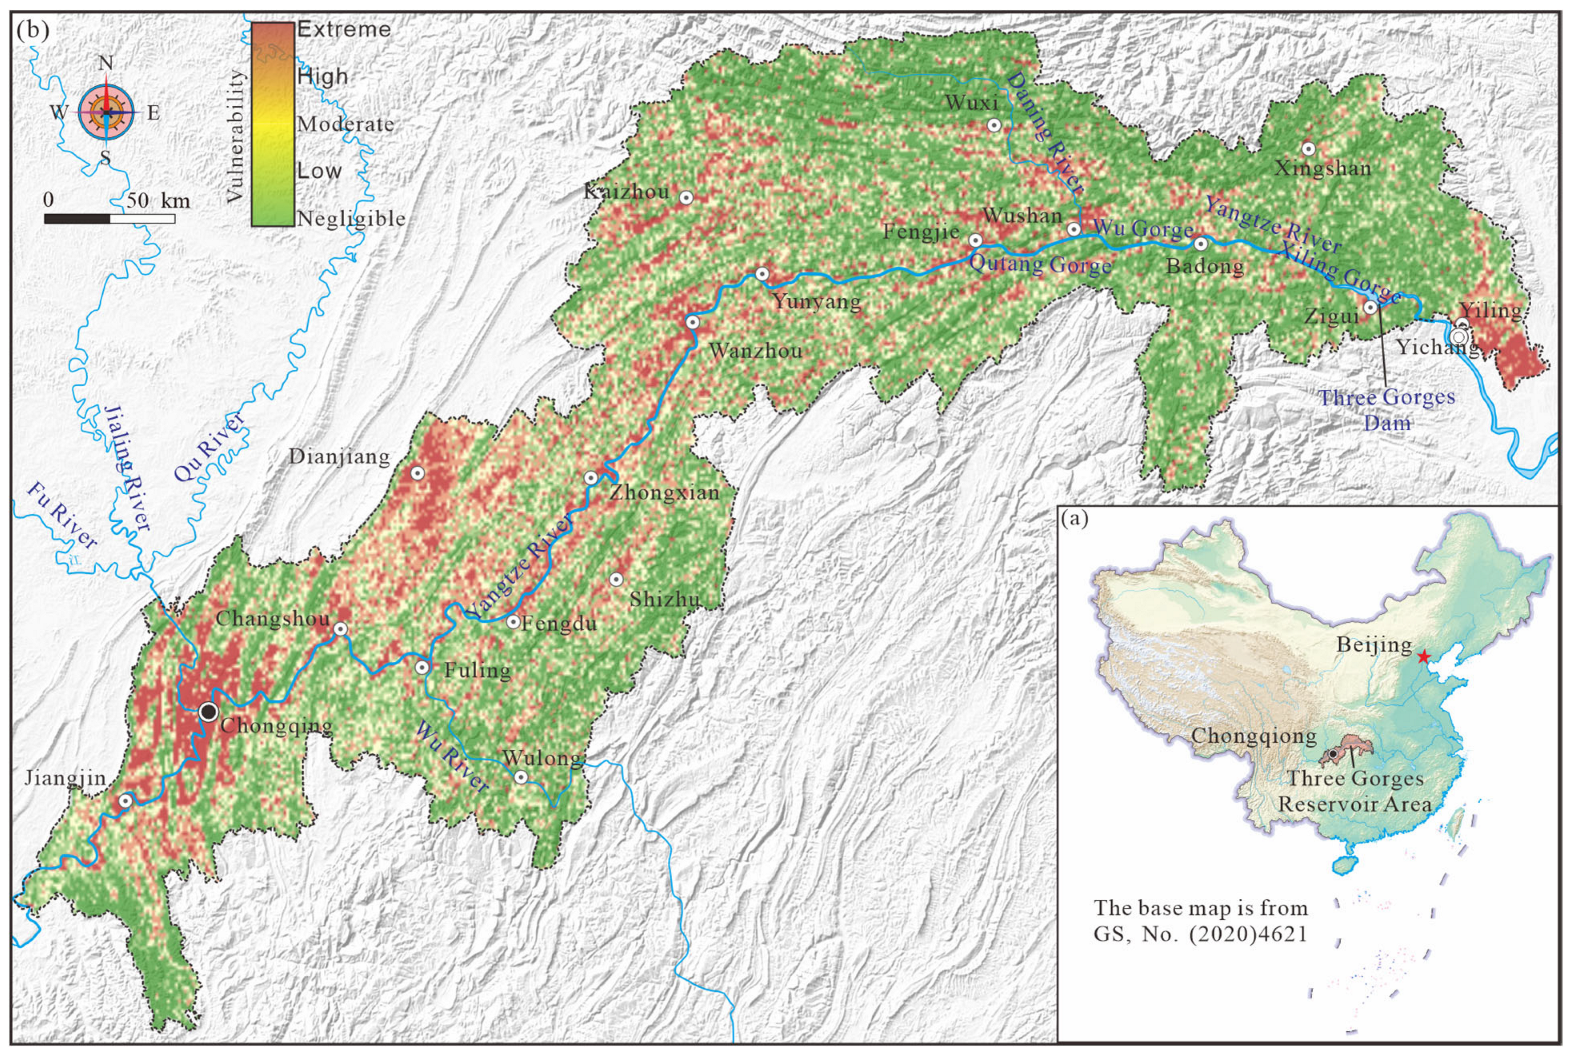
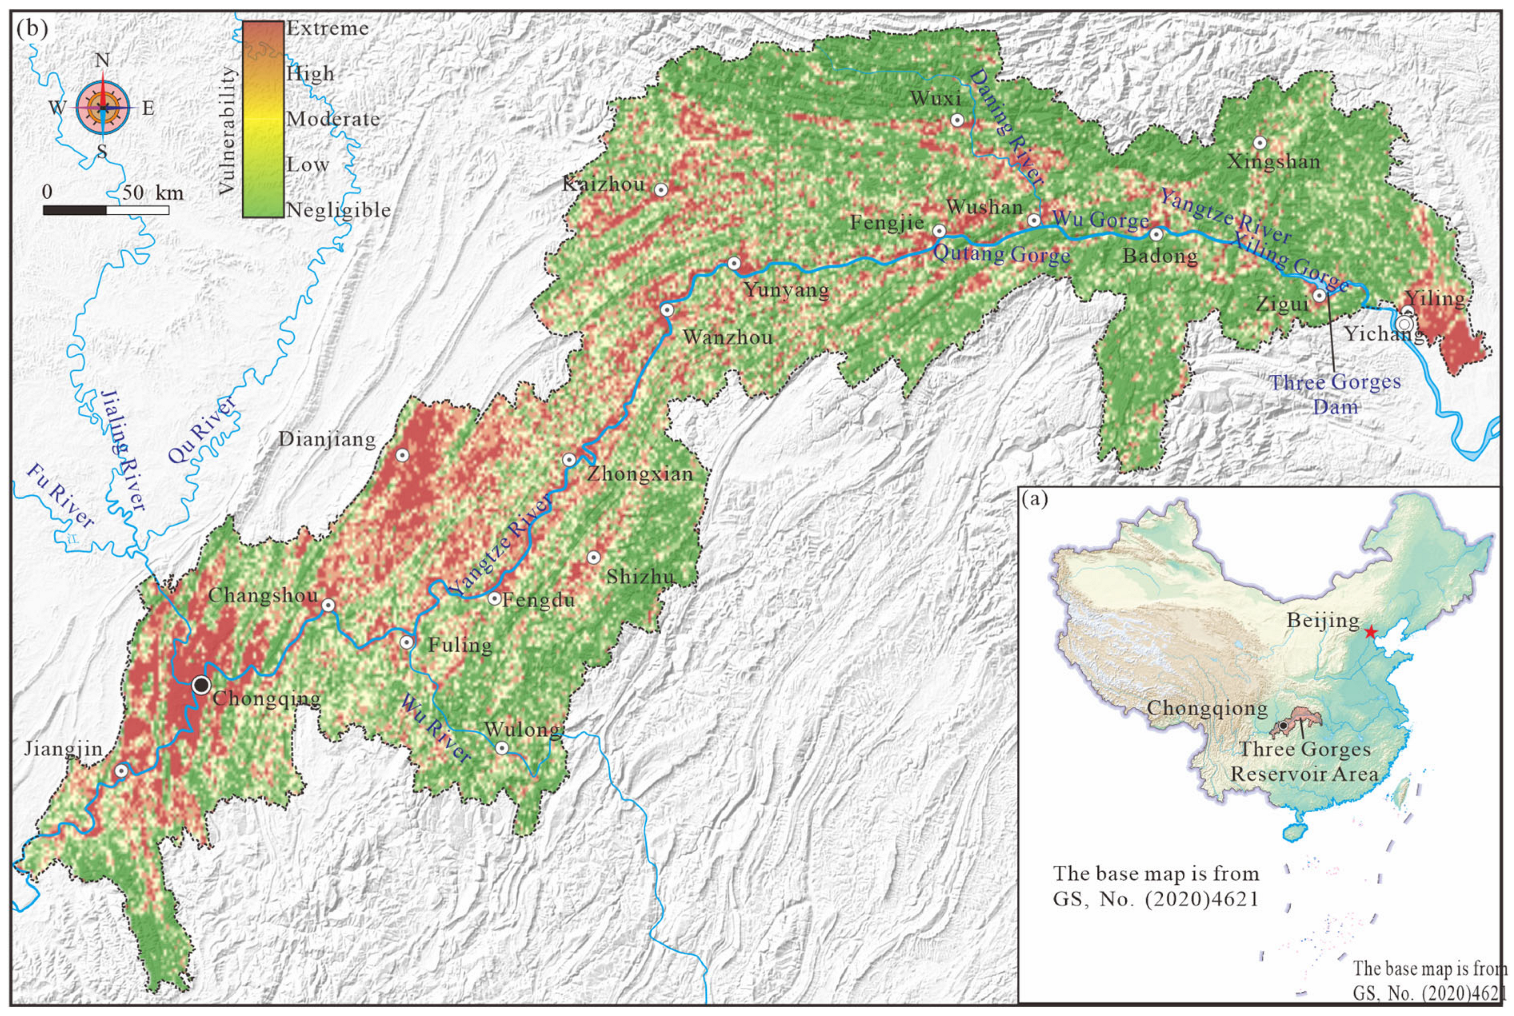
The evaluation results from the DNN model (Figure 10a) show that within the Three Gorges Reservoir Area (TGRA) (with a total area of approximately 59,200 km2), the area proportions for each vulnerability level are as follows (Figure 10b): the Extreme vulnerability zone covers 7549.58 km2, accounting for 12.75%; the High Vulnerability zone covers 7942.13 km2, accounting for 13.41%; the Moderate Vulnerability zone covers 9152.75 km2, accounting for 15.46%; the Low Vulnerability zone covers 12,279.88 km2, accounting for 20.74%; and the Negligible Vulnerability zone covers 22,295.64 km2, accounting for 37.65%. According to the DNN evaluation results, the Low vulnerability zone occupies the largest area within the TGRA, while the High and Extreme vulnerability zones are relatively smaller. This suggests that the overall vulnerability of the reservoir area is moderate to low.
The evaluation results from the CNN model (Figure 11a) show high consistency with those of the DNN, exhibiting a similar spatial distribution pattern l (Figure 11b). The area proportions for each vulnerability level are as follows: the Extreme vulnerability zone covers 6149.13 km2, accounting for 10.38%; the High Vulnerability zone covers 8023.27 km2, accounting for 13.55%; the Moderate Vulnerability zone covers 9651.54 km2, accounting for 16.30%; the Low Vulnerability zone covers 13,116.97 km2, accounting for 22.15%; and the Negligible Vulnerability zone covers 22,279.07 km2, accounting for 37.62%. As with the DNN model, the Low Vulnerability zone represents the largest proportion, aligning with the overall assessment results from the DNN model.
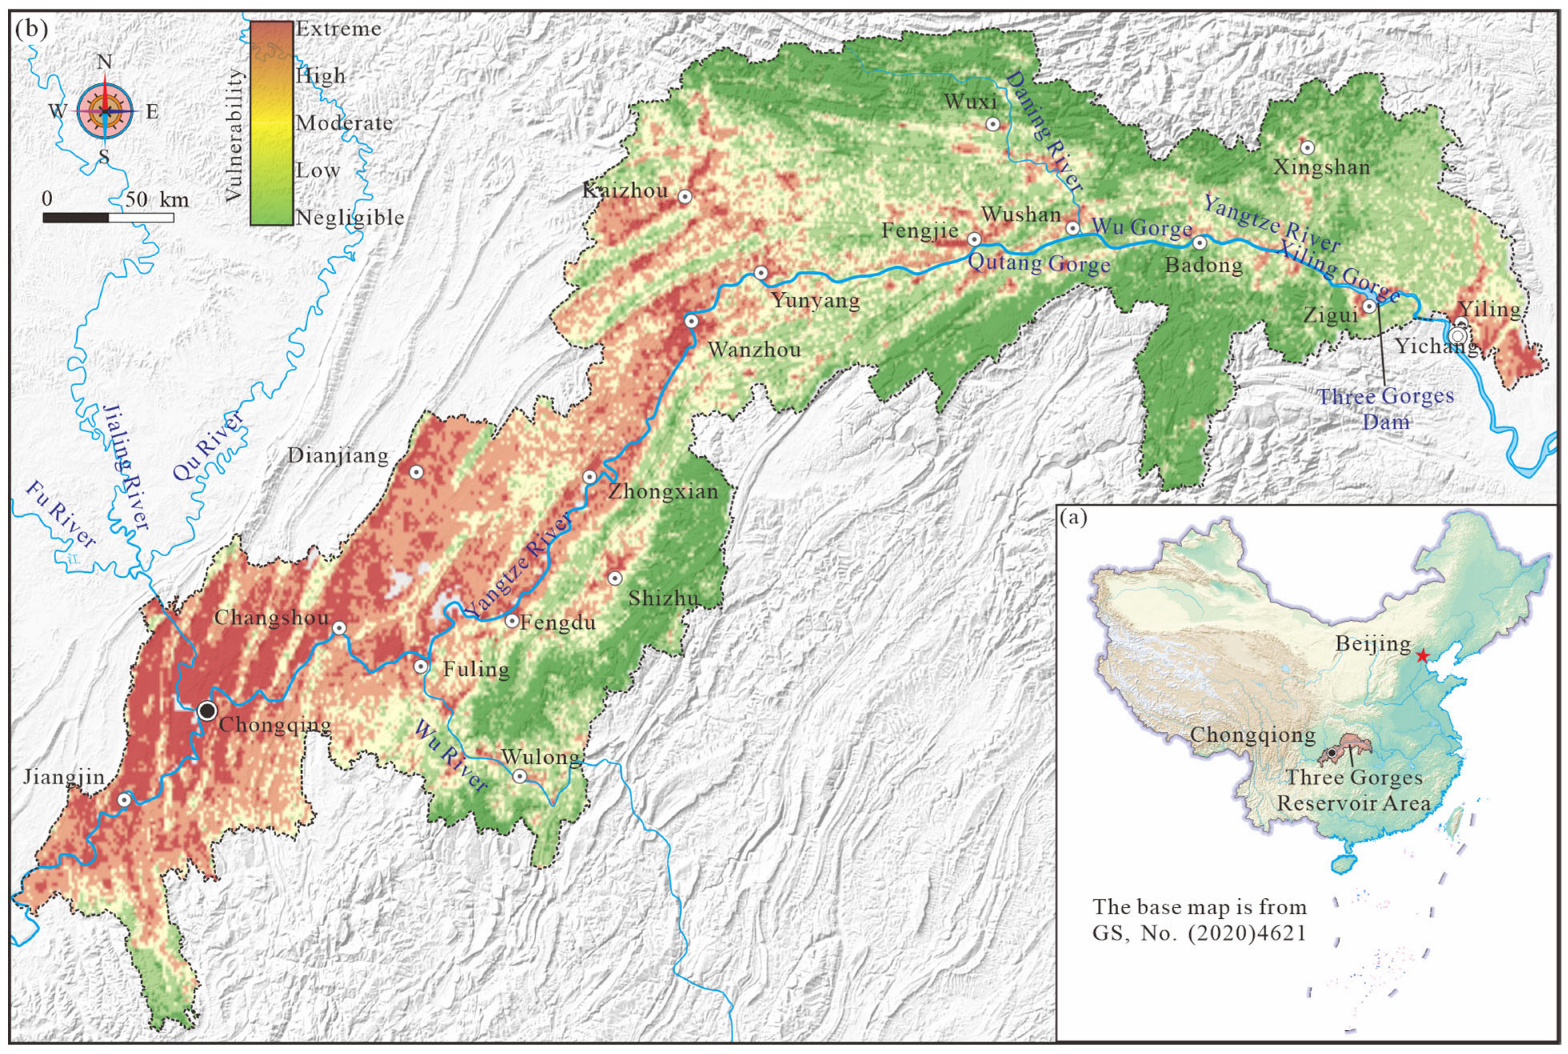
For comparison, the evaluation results from the AHP method (Figure 12a), after normalization and classification, show a distinctly different distribution (Figure 12b). The Extreme vulnerability zone covers 5841.59 km2 (9.86%); the High Vulnerability zone covers 12,932.95 km2 (21.84%); the Moderate Vulnerability zone covers 13,163.09 km2 (22.23%); the Low Vulnerability zone covers 14,864.36 km2 (25.10%); and the Negligible vulnerability zone covers 12,418.00 km2 (20.97%).
In the AHP evaluation, the TGRA is predominantly characterized by Moderate to Low Vulnerability zones. However, the areas classified as High and Extreme vulnerability are larger than those identified by the DNN and CNN models. Compared to the deep learning models, the AHP results show significantly larger areas of High and Extreme vulnerability, reflecting a tendency for the AHP method to overestimate vulnerability levels in these categories.

4. Discussion

4.1. Comparative Evaluation of Eco-Geological Vulnerability Assessment Methods

The evaluation results from the DNN and CNN models show high consistency in spatial distribution patterns (Figure 13). Both deep learning models indicate that the Negligible Vulnerability zone occupies the largest area proportion, with the area percentages progressively decreasing from this category to the Extreme vulnerability category. In contrast, the AHP method yields a notably smaller proportion of areas classified as Negligible Vulnerability, while the remaining four vulnerability levels exhibit a decreasing trend from Low to Extreme vulnerability.
Although the differences in area distribution across vulnerability levels among the three methods are not substantial, further validation was conducted to verify the accuracy of the assessments. This validation was based on 15 typical field survey points and their corresponding environmental images. Using an output probability greater than 0.5 as the threshold for classifying “vulnerable” areas, the predicted results were compared with field-validated labels. The number of correctly predicted points for each method is presented in Table 5 (with misclassified points indicated in bold and annotated with (FP) or (FN)). The validation results demonstrate that among the 15 typical points, the CNN model produced only one misclassification, the DNN model misclassified three points, and the AHP method misclassified five points. Therefore, based on image validation at typical points, the CNN model achieves the highest assessment accuracy, followed by the DNN model, while the AHP method performs relatively poorly. Nevertheless, the AHP method retains value in identifying potential risks due to its higher recall rate.
Integrating findings from model construction, training evaluation, and spatial validation, both deep learning models (DNN and CNN) demonstrate better applicability and higher accuracy in eco-geological vulnerability assessment. In comparison, although the traditional AHP method provides a systematic, comprehensive evaluation framework and shows a higher recall—indicating a certain sensitivity in identifying potentially vulnerable areas—its higher false positive rate and lower AUC value reveal limitations in discriminative capability, precision, and its ability to handle complex nonlinear relationships within eco-geological systems.
Specifically, the advantages of deep learning models are evident in the following aspects: the CNN model excels at extracting spatially localized features and suppressing false alarms (i.e., achieving high precision and specificity), while the DNN model performs slightly better in overall discriminative stability and comprehensive metrics, such as the F1 score. Both models effectively capture spatial correlations and complex characteristics between sample points and their surrounding pixels, thereby more accurately delineating the spatial patterns of vulnerability and identifying key influencing factors. Furthermore, deep learning models trained on large-scale datasets exhibit stronger generalization capabilities, making them more suitable for vulnerability assessments in unknown regions or complex scenarios.
Therefore, for tasks requiring high-precision spatial discrimination and mechanistic analysis, deep learning models not only surpass traditional methods but also provide more reliable and precise decision-making support for regional ecological risk management and spatial planning. Given that deep learning models, particularly the CNN, demonstrated superior assessment accuracy and reliability, the following analysis of the spatial patterns and driving mechanisms of eco-geological vulnerability in the reservoir area will primarily draw upon their evaluation results.

4.2. Spatial Patterns of Eco-Geological Vulnerability Based on the Optimal Model

Through the establishment of a comprehensive assessment framework that integrates the tripartite feedback of “Geo-environmental Background—Ecosystem Structure—Anthropogenic Perturbation,” this study utilized DNN, CNN, and AHP methods to assess the eco-geological vulnerability of the Three Gorges Reservoir Area (TGRA). The results indicate that the spatial distribution patterns of vulnerability revealed by the different methods are generally consistent. Low and Negligible vulnerability zones are primarily found in the forested mountainous areas of the central-northern and central-southern parts of the reservoir area, including northern Kaixian (now part of Kaizhou District), Wuxi, eastern Shizhu County, and southern Wushan and Badong. In contrast, High and Extreme vulnerability zones are concentrated in three distinct regions: the Chongqing metropolitan area at the tail of the reservoir, the parallel ridge-valley area in the central section, and the Yichang metropolitan area at the head of the reservoir (Figure 10b, Figure 11b and Figure 12b).
The eco-geological vulnerability in the Chongqing metropolitan area, located at the tail of the reservoir, is relatively high, resulting from the compounded effects of multiple stressors. From a natural background perspective, this region lies within the parallel ridge-valley area on the eastern margin of the Sichuan Basin, characterized by complex geological structures and intense bedrock weathering in some areas, which provide a material basis for geological hazards. Human activities have further amplified vulnerability through rapid urbanization over recent decades, which has led to large-scale conversion of natural and agricultural land into built-up areas. This transformation of land cover weakens the self-regulating capacity of ecosystems. The high-density population not only drives the exploitative development of land and water resources but also exerts continuous pressure on the surrounding environment through the generation of substantial domestic waste and construction debris. The construction and operation of dense urban infrastructure, including road networks, rail transit systems, and cross-river bridges, not only fragment ecological spaces but also directly disturb geological stability through excavation and filling activities. In operation, these infrastructures continually alter surface runoff patterns. Moreover, the hardening of surfaces in urban areas intensifies the urban heat island effect, modifies local microclimates, and diminishes the region’s natural buffering capacity against extreme precipitation and heatwaves, thus amplifying the system’s exposure and sensitivity. The interplay of these natural and anthropogenic processes collectively shapes the high-vulnerability pattern in this region.
The eco-geological vulnerability in the parallel ridge-valley area in the central section of the reservoir is driven by the acute conflict between unique physiographic conditions and intensive human disturbances. Geomorphologically, the region features a series of NE–SW-trending narrow anticlinal ridges alternating with broad synclinal valleys. This parallel ridge-valley structure results in steep slopes, shallow soil layers, and intense geomorphological processes, making the area highly susceptible to soil erosion and slope instability. The Yangtze River and its major tributaries meander through this region, with riparian zones serving as key ecologically sensitive transition areas between aquatic and terrestrial systems. However, engineering activities such as port and wharf construction, riverside road building, and shoreline modifications have severely degraded the original riparian ecosystems and natural shoreline morphology, undermining their buffering and filtration functions. After the impoundment of the Three Gorges Reservoir, periodic water-level fluctuations have intensified water-rock interactions along the reservoir banks, triggering widespread bank collapses and increasing landslide risks. Additionally, this region is a concentration point for agricultural and mining activities within the reservoir area. Agricultural practices, such as slope farming and economic forest cultivation, in the absence of effective soil and water conservation measures, exacerbate non-point source pollution and soil erosion. Historical pollution from some industrial and mining enterprises continues to pose long-term threats to soil and water quality. Consequently, the vulnerability in this area results from the deep coupling and cascading amplification of natural high-risk factors—such as topography, hydrology, and geology—with human disturbances including agricultural expansion, engineering construction, and industrial activities.
The eco-geological vulnerability of the Yichang metropolitan area, located at the head of the reservoir and serving as the gateway and regional transportation hub for the TGRA, is influenced by both its unique geographical setting and development model. Topographically, the area is relatively flatter compared to the central and western parts of the reservoir, dominated by hills and plains. However, the monsoon climate, characterized by concentrated and intense rainfall, facilitates rapid surface runoff convergence, increasing the risks of urban waterlogging and flooding in surrounding areas. Moreover, situated in the transition zone between the Huangling granitic basement and the Jianghan Plain, the area has complex geological conditions where human engineering activities easily induce slope instability. As a regional central city, Yichang has undergone rapid spatial expansion and industrial agglomeration, with urban expansion encroaching extensively on surrounding farmland, wetlands, and woodlands, directly compressing ecological space and fragmenting habitats. Industrialization has led to increased energy consumption and pollutant emissions, exerting compounded pressures on the atmosphere, water bodies, and soil environments. Additionally, as a major transportation hub—integrating waterway, rail, and road networks—substantial flows of people and goods have brought persistent disturbances to ecosystems through noise, dust pollution, and barrier effects. These pressures from urbanization, industrialization, and transportation network development, combined with the inherently sensitive natural background, collectively elevate eco-geological vulnerability in this region.
The eco-geological vulnerability of the TGRA exhibits the following characteristics:
Spatial Distribution: The vulnerability is highly uneven. High and Extreme vulnerability zones (accounting for 19.7% of the total area) are densely concentrated along the canyon banks of the middle section of the Yangtze River, at the estuaries of major tributaries, and around large towns. These zones are closely linked with steep terrain, hazard-prone areas, and intense human activity, forming the primary threat belt to the ecological security of the reservoir area.
Temporal Trends: The eco-geological vulnerability of the reservoir area exhibits a complex trend of “overall mitigation with localized sensitivity.” Ecological restoration projects have effectively reduced vulnerability in the mountainous hinterlands, whereas rapid urbanization and transportation infrastructure development have significantly increased vulnerability around emerging towns and along transportation corridors, primarily by altering land cover and disturbing geological environments. This highlights that the intensity of human activities, particularly land-use changes, is a key external driver of localized vulnerability deterioration.
Driving Mechanisms: Steep terrain, erodible lithology, and high geological hazard risks are the decisive natural factors that control the spatial differentiation of vulnerability. Human disturbances, particularly land-use intensity, are the key forces driving the dynamic evolution and localized sensitivity of vulnerability. A strong nonlinear synergistic interaction exists between these factors; development activities on steep slopes can dramatically amplify the inherent risks of the system.

4.3. Analysis of the Constraint Mechanisms of Geological Conditions on the Ecological Environment

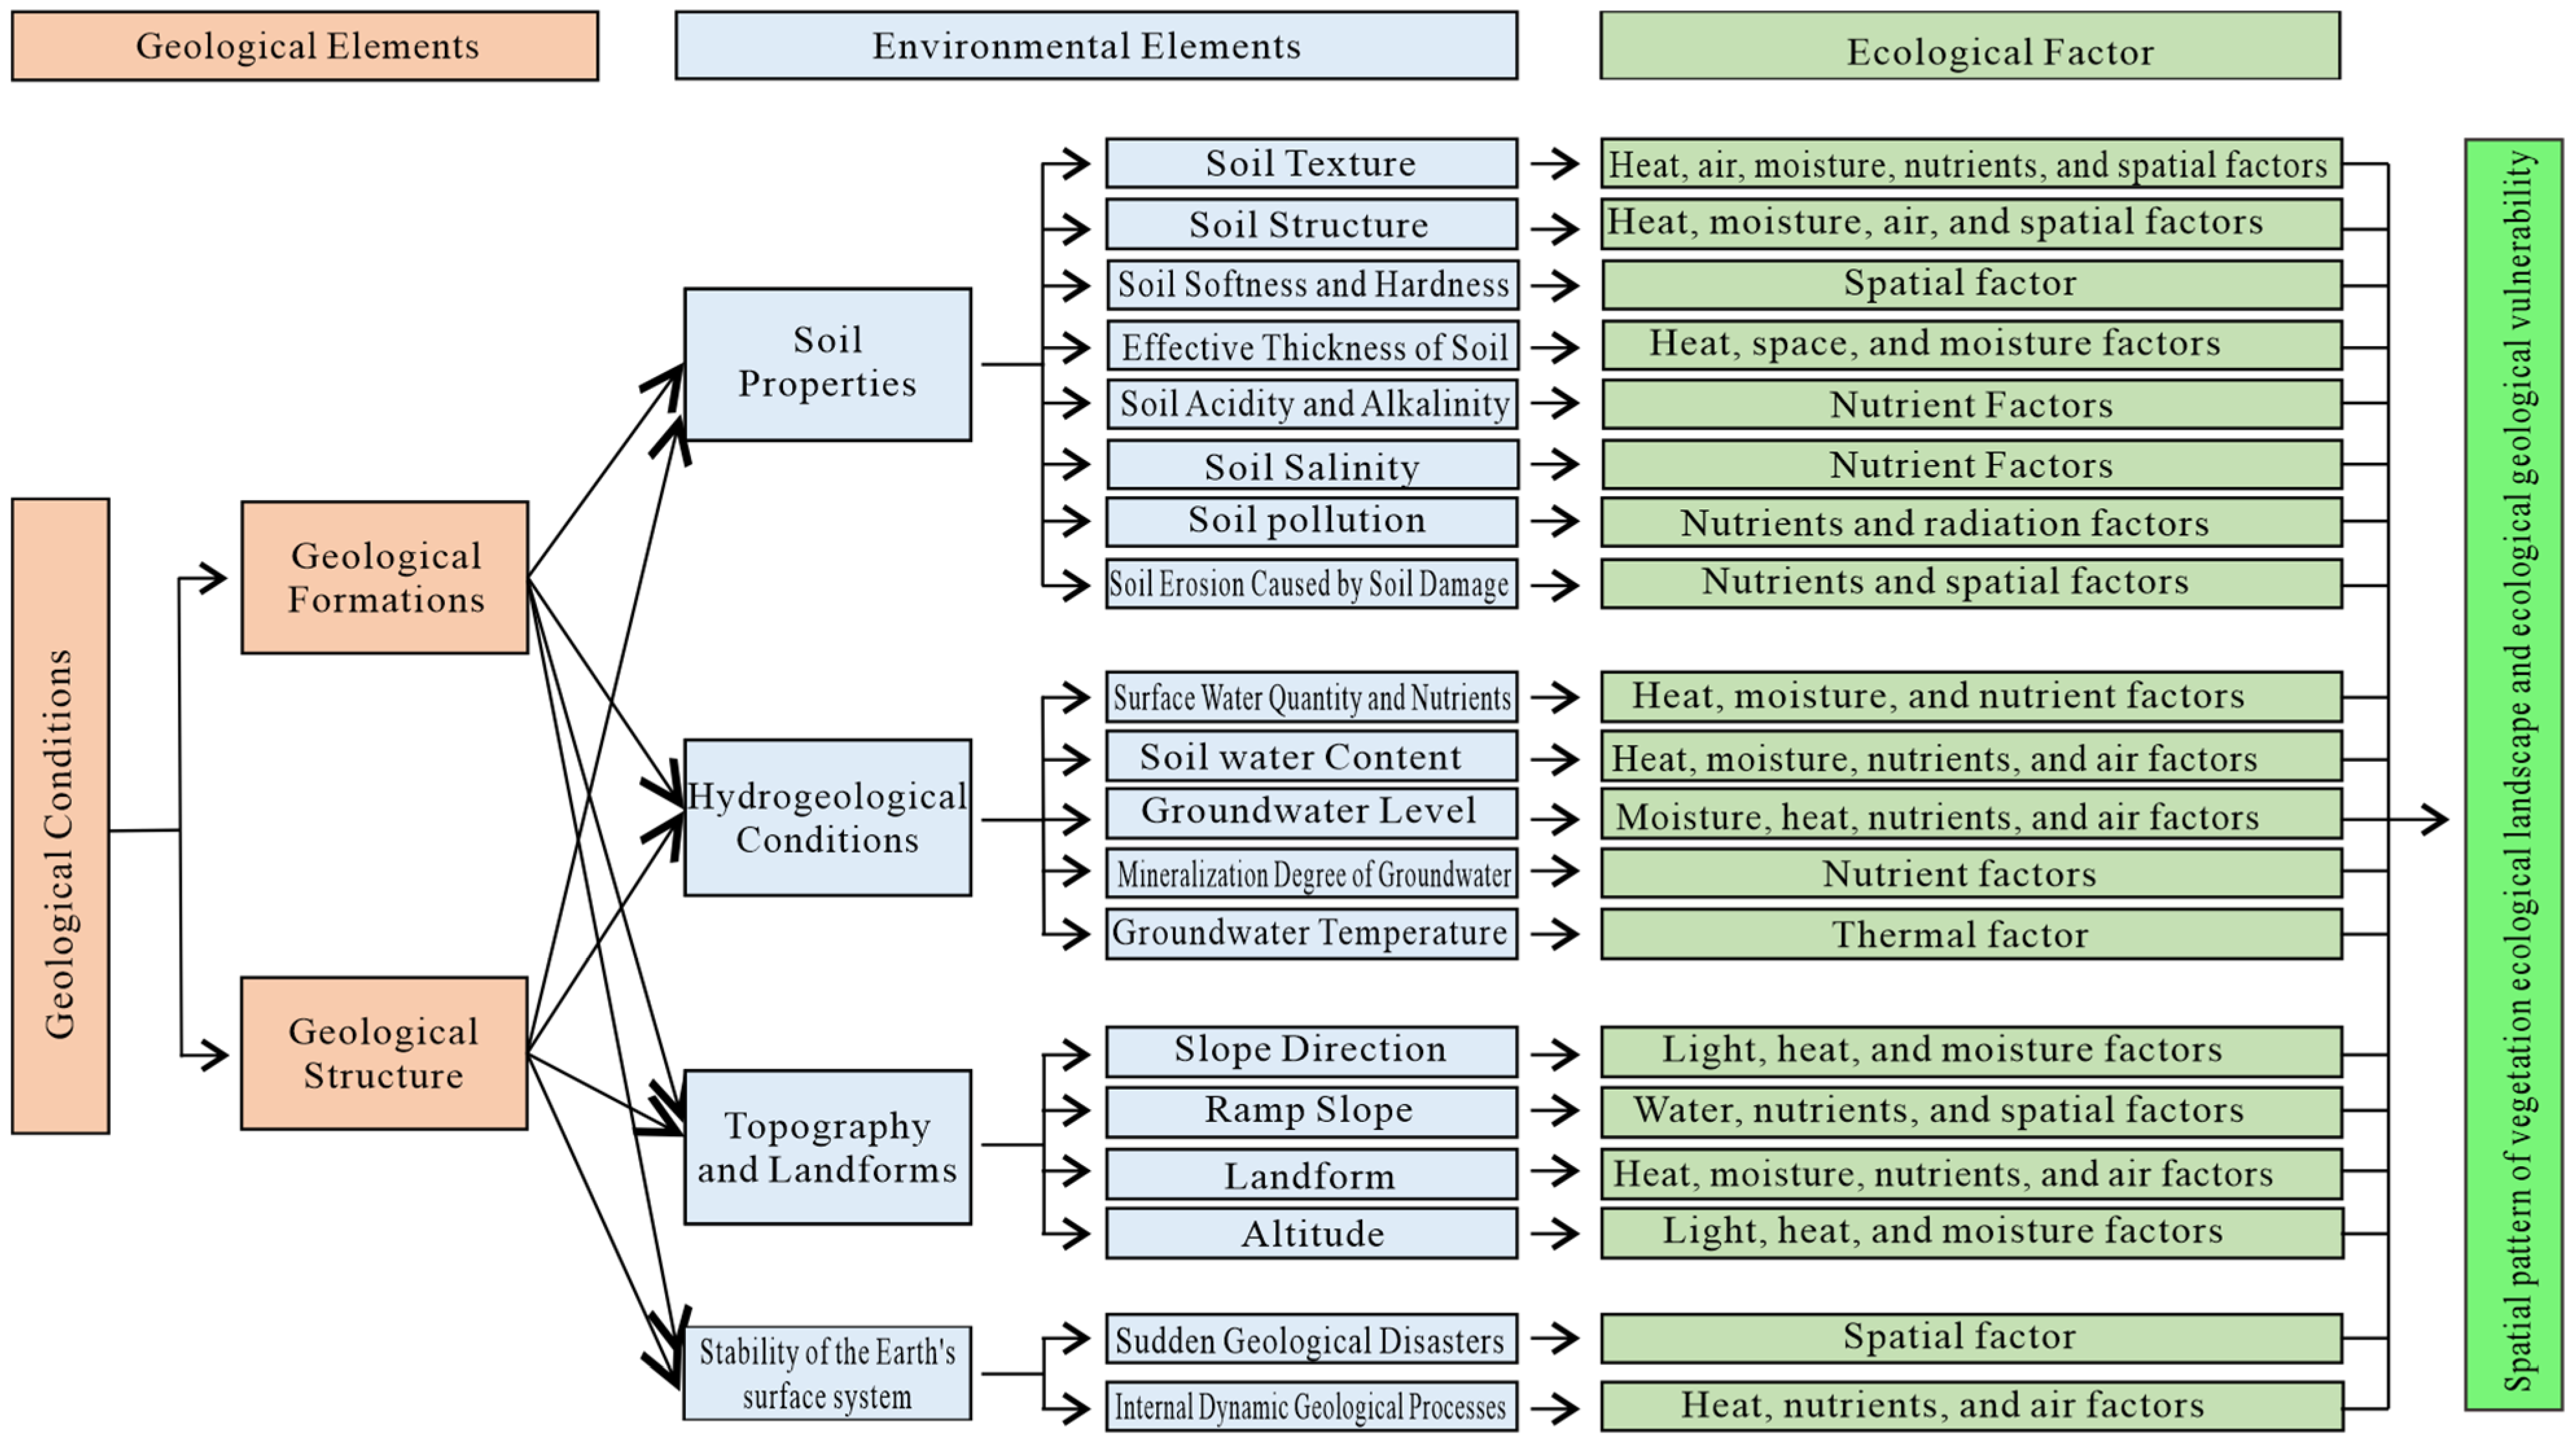
Geologic conditions constitute the material foundation of the geologic environment and fundamentally shape the spatial patterns and functional characteristics of surface ecosystems. Under broadly similar macroclimatic backgrounds, regional differences in lithologic composition (geologic formations) and geologic structure emerge as the primary drivers of variability in key environmental components, including soil properties, hydrological regimes, topography, and surface stability. These components, in turn, regulate the distribution and interaction of ecological factors—such as light, heat, water availability, nutrient supply, and habitat space—thereby determining ecosystem type, ecological quality, and successional pathways [65,66,67].
The constraining influence of geologic conditions on the ecological environment is a complex, multi-pathway, and multi-scale process. At its core, this influence can be attributed to two interrelated mechanisms: (1) control exerted by geologic formations, which provide the material and energy foundation for ecosystems, and (2) control exerted by geologic structure, which defines the spatial framework and dynamic context of ecosystem development (Figure 14).

4.3.1. Constraint Imposed by Geologic Formations: The Material Foundation

Geologic formations determine the material and energetic basis of ecosystem development through the physicochemical properties of parent rocks. This control is expressed in four principal dimensions.
(1)
Constraint on soil physical properties and site conditions
The mineral composition, grain size, and structural characteristics of bedrock directly influence the texture and structure of weathering products. For example, quartz-rich intermediate to acidic rocks, owing to their high resistance to weathering, commonly produce shallow, sandy soils. Carbonate terrains tend to develop clay-rich soils with low permeability, whereas soils derived from unconsolidated sediments such as alluvial deposits are typically well stratified and of moderate texture. Soil texture and structure directly affect water-holding capacity, nutrient retention, and rooting space, thereby constituting the primary physical site conditions for plant growth.
(2)
Constraint on soil chemical properties and fertility.
The chemical composition of parent rocks governs soil pH, base saturation, and the availability of mineral nutrients. Soils derived from intermediate to acidic rocks are generally acidic and deficient in base cations, whereas soils developed from basic or intermediate rocks are often enriched in calcium, magnesium, and phosphorus, resulting in neutral to fertile conditions. Carbonate-derived soils are typically highly base-saturated and alkaline. This geochemical background imposes fundamental constraints on species adaptation and community structure.
(3)
Constraint on elemental abundance or deficiency and associated ecological effects.
Geologic formations represent the ultimate source of all soil elements [68]. Their specific elemental composition—including essential nutrients such as phosphorus, potassium, and selenium, as well as potentially toxic elements like arsenic and cadmium—establishes the elemental baseline of soils [69,70]. The forms, transport and transformation patterns of these elements, and their comprehensive impacts on ecosystem quality represent a key research direction in environmental geochemistry [71]. This baseline not only influences the spatial distribution of natural vegetation but also strongly affects the quality of region-specific agricultural products and the formation of geo-authentic medicinal resources.
(4)
Constraint on pedogenesis and the rate of ecosystem development.
Rock hardness, mineral weathering resistance, and parent-material permeability jointly regulate the rate and trajectory of soil formation [72,73]. Weakly consolidated sandstones and mudstones weather relatively rapidly, facilitating the formation of productive soil layers, whereas hard crystalline rocks such as granite weather slowly. Permeability further affects processes such as leaching and illuviation, influencing the differentiation of soil profiles and, consequently, the pace at which stable ecosystems can be established.

4.3.2. Constraint Imposed by Geologic Structure: The Spatial Framework

Geologic structure—particularly neotectonic activity—constrains the spatial configuration and stability of ecological environments by shaping landforms, controlling material transport, and redistributing energy [1,74,75].
(1)
Constraint on geomorphic framework and habitat space.
From large-scale mountain belts and rift basins formed by plate tectonics, to regionally developed mountains, basins, and fault scarps produced by folding and faulting, and to volcanic plateaus shaped by magmatic activity, geologic structures establish the fundamental geomorphic skeleton of the Earth’s surface. This skeleton directly determines habitat types, connectivity, and spatial heterogeneity, thereby exerting a first-order control on large-scale biodiversity patterns.
(2)
Constraint on hydrological networks and groundwater systems.
Fractures, joints, and fissures generated by tectonic processes serve as critical storage spaces and flow pathways for groundwater. In regions dominated by extensional tectonics, dense fracture networks may form productive aquifer systems that provide essential water sources for vegetation in arid environments or sustain wetland ecosystems. At the same time, structural patterns influence the development, organization, and flow direction of surface drainage networks, thereby regulating material transport and sedimentary processes at the watershed scale.
(3)
Constraint on surface stability and geological hazard risk.
The intensity of tectonic activity is closely associated with the frequency and magnitude of geological hazards, including earthquakes, landslides, and debris flows [76,77]. In tectonically active regions, surface environments are inherently unstable, and ecosystems are frequently subjected to disturbance or catastrophic destruction, resulting in successional resets or prolonged stages of primary succession. Consequently, tectonic stability constitutes a key factor in evaluating ecosystem resilience and long-term sustainability.
In summary, geologic formations function as the material source, supplying the physical substrate and chemical elements necessary for ecosystem development, whereas geologic structure acts as the shaping force, defining the geomorphic space and dynamic conditions under which ecosystems evolve. Together, these two components form an integrated, multi-level constraint system through which geologic conditions influence the ecological environment—from material foundations to spatial organization. Elucidating this mechanism provides a critical scientific basis for the design and implementation of differentiated ecological protection and restoration strategies grounded in the underlying geologic template.

4.4. Zonation-Based Protection and Restoration Strategies Toward Ecological Security

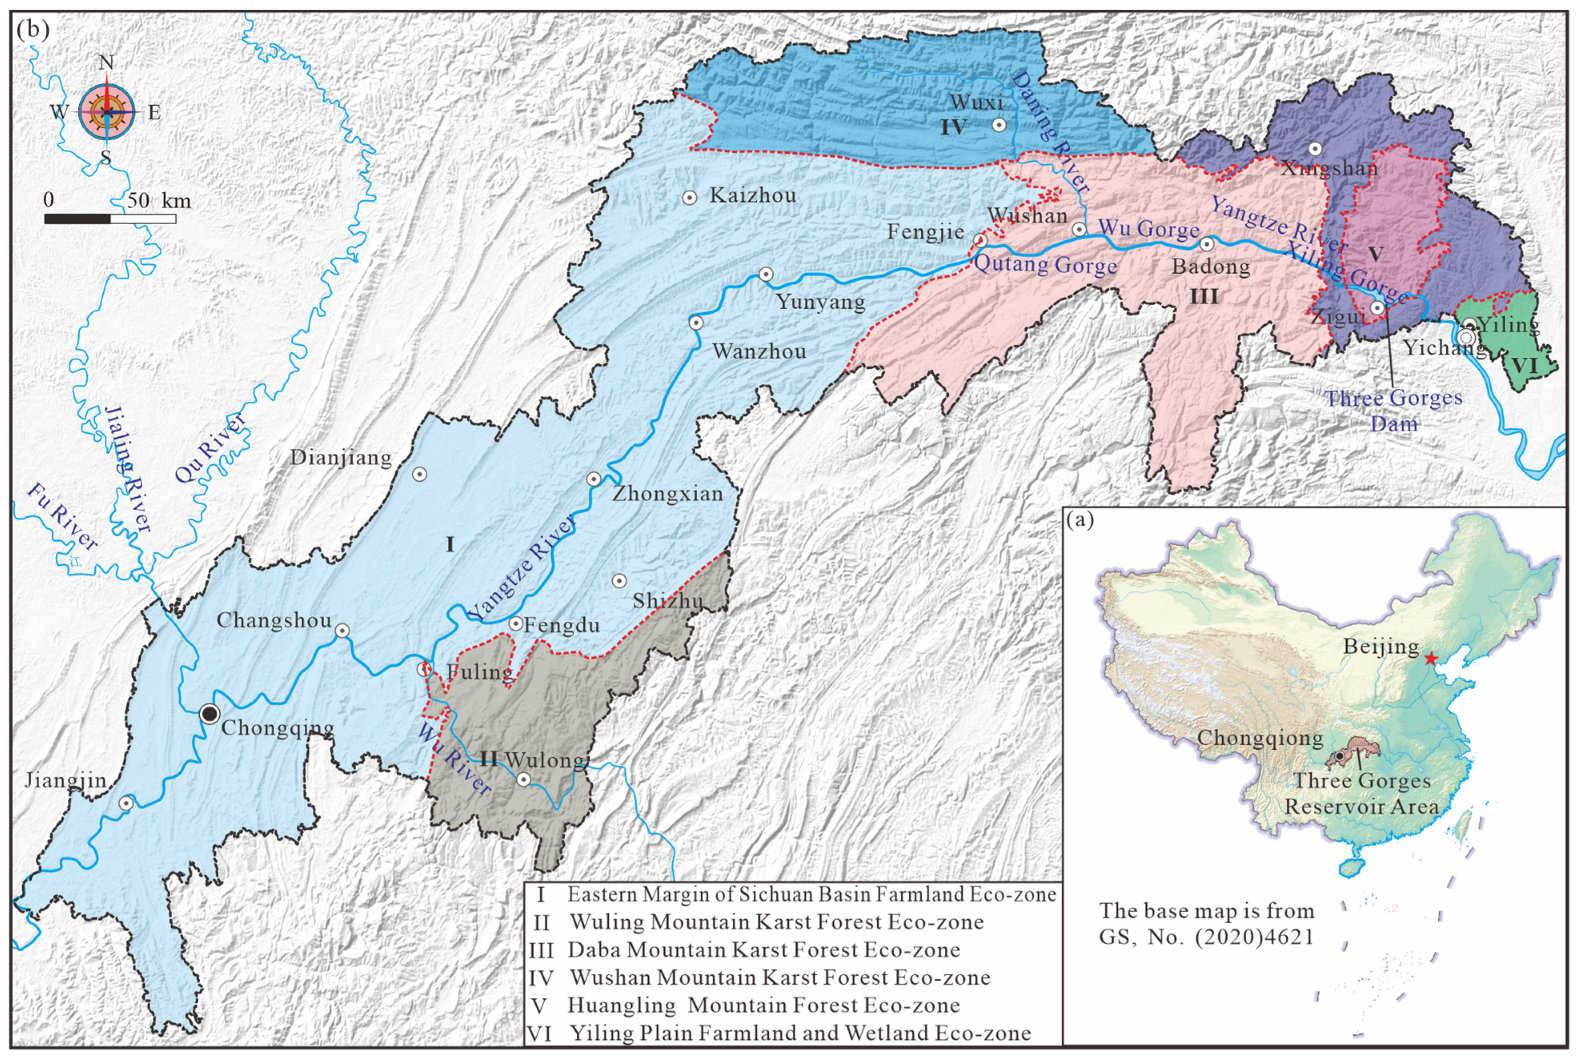
Based on the Ecological Zoning of China’s Terrestrial Ecosystems issued by the Ministry of Natural Resources of China, and incorporating the eco-geological context of the TGRA, this study divides the reservoir area into the following six eco-geological zones (Figure 15a): Eastern Margin of Sichuan Basin Farmland Eco-zone (I); Wuling Mountain Karst Forest Eco-zone (II); Wushan Mountain Karst Forest Eco-zone (III); Daba Mountain Karst Forest Eco-zone (IV); Huangling Mountain Forest Eco-zone (V); Yiling Plain Farmland and Wetland Eco-zone (VI) (Figure 15b).
Building upon the assessment results and considering the specific eco-geological conditions and challenges of each zone, we propose targeted strategies for ecological protection and restoration. By integrating the eco-geological vulnerability evaluation outcomes with the division of eco-geological units, we analyze the vulnerability characteristics, dominant eco-geological issues, and recommended management approaches for each sub-zone. This analysis provides more spatially specific management recommendations for ecological security.
Eastern Margin of Sichuan Basin Farmland Eco-zone (I). This zone spans approximately 30,725 km2, primarily located from the middle to the tail section of the reservoir area, including Chongqing’s main urban area and several districts/counties. It is characterized by parallel ridge-valley topography and Mesozoic clastic low-mountain hills. Vulnerability shows clear spatial differentiation: riparian zones and urban areas, which are heavily influenced by human activity, exhibit High and Extreme vulnerability, representing one of the most concentrated areas of vulnerability in the reservoir; the remaining areas are predominantly of Negligible and Low vulnerability. Key eco-geological issues include forest ecosystem degradation under high human pressure, severe soil erosion in hilly and mountainous areas, and localized ecosystem fragmentation. Regulation Recommendations: In High and Extreme vulnerability riparian and urban areas, optimize spatial planning according to ecological constraints, promote green infrastructure, and regulate development intensity to reduce ecological impacts. In ridge-valley mountainous areas, prioritize water-conservation forest development and comprehensive soil-erosion control measures. In southwestern areas with relatively intact ecosystems, focus on protecting natural ecosystems’ integrity and enhance ecological corridor construction and landscape connectivity.
Wuling Mountain Karst Forest Eco-zone (II). Covering approximately 5076 km2, this zone is characterized by karst mid-low mountain terrain. Eco-geological vulnerability is generally low. However, it faces combined threats of forest ecosystem degradation, soil erosion, and risks of rocky desertification. We recommend implementing ecological projects focused on natural forest conservation and near-natural restoration, with an emphasis on preventing the progression of rocky desertification. Integrated engineering and biological measures for soil and water conservation should be adopted to curb regional ecological degradation.
Daba Mountain Karst Forest Eco-zone (III). Spanning about 10,569 km2, this zone features typical karst mid-mountain landscapes. Eco-geological vulnerability is generally low, but primary issues include poor-quality natural forests, weakened ecosystem services, threatened biodiversity, and risks of soil erosion and potential rocky desertification. egulation Recommendations: Focus on biodiversity conservation and forest quality improvement by establishing and improving protected-area networks. Optimize stand structure and implement vegetation restoration and soil-water conservation projects to enhance ecosystem stability and resilience.
Wushan Mountain Karst Forest Eco-zone (IV). With an area of approximately 10,494 km2, this zone has relatively Negligible and low vulnerability and a sound ecological baseline. The main challenges include local destruction of natural vegetation, biodiversity threats, geological hazards, and soil erosion. A comprehensive protection-restoration strategy is required. Regulation Recommendations: Strengthen conservation of broad-leaved and mixed conifer-broadleaf forests. Establish an ecological protected-area network to maintain biodiversity and adopt coordinated “engineering-plus-ecological” measures in areas prone to geological hazards.
Huangling Mountain Forest Eco-zone (V). Covering about 1772 km2, this zone consists of mid-elevation, moderate-relief mountains with parent rocks dominated by hard intermediate-acidic intrusives and metamorphics. Eco-geological vulnerability is generally low. The core issue is historical vegetation destruction and associated soil erosion. Regulation Recommendations: Focus on mountain closure for natural regeneration and forest ecosystem conservation. Establish a soil-water conservation system using primarily biological measures, supplemented by engineering measures. Optimize water-resource management to maintain the functional stability of this zone as a key ecological barrier for the reservoir area.
Yiling Plain Farmland and Wetland Eco-zone (VI). Spanning about 583 km2, this zone is dominated by hilly and plain landscapes. It is directly affected by high-intensity urbanization and generally exhibits higher eco-geological vulnerability. Key challenges include reduced vegetation cover, soil erosion, water-quality pollution, and biodiversity decline. Regulation Recommendations: Emphasize strict protection and scientific delineation of ecological spaces during urbanization. Enhance vegetation restoration and ecological greenway construction in and around urban areas. Strengthen comprehensive soil-erosion control and systematic watershed water-pollution prevention efforts.
In conclusion, the eco-geological vulnerability of the TGRA exhibits clear spatial differentiation. Ecological regulation must adhere to the principle of “zoning by type and focusing on key areas.” For High and Extreme vulnerability riparian belts and urban clusters, strict spatial regulation and ecological restoration should be prioritized. For the extensive mountainous areas with Negligible and Low vulnerability, the focus should be on ecosystem conservation and quality improvement. This approach will help build an integrated, coordinated ecological security framework across the entire region, ensuring more sustainable land use and enhanced ecological resilience in the TGRA.

5. Conclusions

(1)
Deep learning approaches (DNN and CNN) offer substantial advantages in eco-geological vulnerability assessment, with overall performance significantly surpassing that of the traditional Analytic Hierarchy Process (AHP). The CNN model excels at extracting spatially localized features and minimizing false positives, whereas the DNN model exhibits slightly greater overall discriminative stability and stronger performance across comprehensive evaluation metrics.
(2)
Eco-geological vulnerability in the Three Gorges Reservoir Area displays marked spatial heterogeneity. Its distribution is primarily controlled by the baseline conditions of the “Geo-environmental Background—Ecosystem Structure,” while Anthropogenic Perturbation—particularly land use intensity—serve as the dominant drivers of dynamic changes and localized High and Extreme zones.
(3)
Zoning-based management according to eco-geological units provides an effective regulatory strategy. High and Extreme riparian and urban belts should be prioritized for strict ecological restoration and spatial control, whereas the extensive moderate- to low-vulnerability mountainous areas should focus on systematic enhancement of ecosystem quality. This differentiated approach supports the development of a coordinated, regionally integrated ecological security framework.

Author Contributions

Conceptualization, Z.Y. and J.Z.; methodology, H.L. (Hong Liu); software, Y.G., Z.T. and H.L. (Hui Liu); validation, H.L. (Hui Liu) and H.L. (Hong Liu); formal analysis, Z.Y.; investigation, Z.W., Z.T., J.Z. and Y.S.; resources, H.L. (Hong Liu); data curation, Y.G.; writing—original draft preparation, H.L. (Hong Liu); writing—review and editing, H.L. (Hong Liu) and H.L. (Hang Luo); visualization, H.C.; supervision, H.L. (Hong Liu); project administration, H.L. (Hong Liu); funding acquisition, H.C. All authors have read and agreed to the published version of the manuscript.

Funding

This research was funded by Chongqing Bureau of Geology and Mineral Development and Development, and China Geological Survey Project “Eco-geological Survey and Comprehensive Assessment of the Soil Erosion Area in the Upper Reaches of the Yangtze River” (Nos. DD20221776), Geochemical Survey in Southwestern China (DD20230247).

Institutional Review Board Statement

Not applicable.

Informed Consent Statement

Not applicable.

Data Availability Statement

All research data are included in the article, and all original data from the eco-geological survey and assessment are archived in the National Geological Archives (Beijing) and the Southwest Geological Archives (Chengdu) of China Geological Survey.

Acknowledgments

Acknowledgments are extended to Zhenjie Zhang from China University of Geosciences (Beijing).

Conflicts of Interest

Author Zhiwen Tian was employed by the Geological Engineering Survey Company of Mining Subsidiary Taiyuan Iron & Steel (Group) Co., Ltd. and author Hui Liu was employed by the China National Logging Corporation Qinghai Branch. The remaining authors declare that the research was conducted in the absence of any commercial or financial relationships that could be construed as a potential conflict of interest.

References

  1. Liu, H.; Li, W.C.; Ouyang, Y.; Zhang, J.H.; Zhang, T.J.; Li, Y.G.; Chen, M. Exploration and practice of the compilation of ecological geology series maps based on Geological Formations research, mountainous region in Southwest China—Exemplified by Qionghai-Lushan area, western margin of Yangtze Block. Acta Geol. Sin. 2023, 97, 623–638. [Google Scholar]
  2. Nie, H.F.; Xiao, C.L.; Dai, M.; Liu, J.; Shang, B.; Guo, Z.; Jiang, Q.G. Progresses and main achievements of ecogeological survey project. Geol. Surv. China 2021, 8, 1–12. [Google Scholar]
  3. Xiao, C.L.; Guo, Y.X.; Xue, H. Implications of the Mississippi River watershed monitoring and restoration for the watershed ecological protection and restoration in China. Geol. Surv. China 2021, 8, 87–95. [Google Scholar]
  4. Trofimov, V.T. Ecological Geology: A New Frontier in Earth Sciences. Earth Sci. Front. 2001, 8, 27–35. [Google Scholar]
  5. Li, W.Y.; Chen, X.Y.; Yi, J.; Zhong, B.; Li, T. Ecological quality assessment in Ganjiang new district based on remote sensing ecological index. J. East China Univ. Technol. Nat. Sci. 2020, 43, 83–89. [Google Scholar]
  6. Liu, H.; Huang, H.X.; Yuan, O.; Li, W.; Zhang, J.; Zhang, T. Soil’s geologic investigation in Daliangshan, Xichang, Sichuan. Sediment. Geol. Tethyan Geol. 2020, 40, 91–105. [Google Scholar]
  7. Yang, J.; Zhang, C. Earth’s critical zone: A holistic framework for geo-environmental researches. Hydrogeol. Eng. Geol. 2014, 41, 98–104. [Google Scholar]
  8. Wang, S.; Mo, B.; Zhao, J. Deep neural networks for choice analysis: Architecture design with alternative-specific utility functions. Transp. Res. Part C Emerg. Technol. 2020, 112, 234–251. [Google Scholar] [CrossRef]
  9. He, Z.W.; Huang, R.Q.; Sun, C.M.; Wu, B.Q.; Han, L.L.; He, F.Q.; Sun, Y.J.; Yin, J.Z.; Liu, S.J.; Zhao, Y.B. A brief discussion on “Eco-geology”. Sci. Technol. Manag. Land Resour. 2003, 20, 69–72. [Google Scholar]
  10. Wei, X.F.; Sun, H.Y.; Zhang, J.; Li, X.; Liu, F.; He, Z. Eco-geochemical process of characteristic forest fruit resources and its significance of quality improvement in Chengde city. Hydrogeol. Eng. Geol. 2020, 47, 99–108. [Google Scholar]
  11. Yi, Z.Q.; Yin, Y.P.; Zhang, Z.H.; Wang, L.; Wang, X.; Zhao, P.; Zhang, L. Deterioration and damage characteristics of rock masses within the fluctuating zone, Three Gorges Reservoir Area, China. Int. J. Rock Mech. Min. Sci. 2026, 199, 106421. [Google Scholar] [CrossRef]
  12. Yi, Z.Q.; Yin, Y.P.; Zhang, Z.H.; Wang, L.; Wang, X.; Zhang, N. Geological safety issues and recommendations for the Three Gorges Reservoir Area in China: A review and summary. J. Rock Mech. Geotech. Eng. 2025. [Google Scholar] [CrossRef]
  13. Jing, P.; Sheng, J.; Wang, Y.; Hu, T.; Guo, L.; Zhu, R.; Dong, K.; Mahmoud, A.; Liu, Y.; Li, X. Assessing the ecological security of the Three Gorges reservoir complex ecosystem based on the improved three-dimensional emergy ecological footprint model. Sci. Total Environ. 2024, 933, 173086. [Google Scholar] [CrossRef]
  14. Huang, C.; Cheng, J.; Liu, S.; Wan, Y.; Zhou, J.; Liu, Z.; Peng, C. Impacts of landscape dynamics on terrestrial ecosystem health in the Three Gorges Reservoir Area, China. J. Clean. Prod. 2024, 467, 142928. [Google Scholar] [CrossRef]
  15. Zhu, X.; Gao, J. Characteristics and influencing mechanisms of production-living-ecological space dynamics in the Three Gorges Reservoir Area (TGRA), Chongqing, China. Reg. Sustain. 2024, 5, 100139. [Google Scholar] [CrossRef]
  16. An, H.; Xiao, W.; Huang, J. Relationship of construction land expansion and ecological environment changes in the Three Gorges reservoir area of China. Ecol. Indic. 2023, 157, 111209. [Google Scholar] [CrossRef]
  17. Ma, J.; Li, C.X.; Wei, H.; Ma, P.; Yang, Y.J.; Ren, Q.S.; Zhang, W. Dynamic evaluation of ecological vulnerability in the Three Gorges Reservoir Region in Chongqing Municipality, China. Acta Ecol. Sin. 2015, 35, 7117–7129. [Google Scholar] [CrossRef]
  18. Zhang, D.; Chen, X.; Pang, X.; Guo, J.G.; Ren, G.G.; Luo, J.; Hua, G.H. Ecogeochemical characteristics and source analysis of heavy metal elements in Southern Yudu, Jiangxi Province. J. East China Univ. Technol. Nat. Sci. 2024, 47, 45–54. [Google Scholar]
  19. Huang, Z.X.; Li, M.G.; Feng, Z.B.; Chen, N.N.; Liu, Y. Ecological environment change in Dongxiang District based on remote sensing ecological index. J. East China Univ. Technol. Nat. Sci. 2022, 45, 60–66. [Google Scholar]
  20. Zou, Y.; Li, Z. Regional ecological effect of intensive development zones in Jiangxi Province. J. East China Univ. Technol. Nat. Sci. 2019, 42, 412–417. [Google Scholar]
  21. Wang, Z.J.; Su, Y. Analysis of Eco-environmental vulnerability characteristics of Hanzhong City, near the water source midway along the route of the south-to-north water transfer project, China. Acta Ecol. Sin. 2018, 38, 432–442. [Google Scholar]
  22. Sun, T.; Li, H.; Wu, K.; Chen, F.; Zhu, Z.; Hu, Z. Data-Driven Predictive Modelling of Mineral Prospectivity Using Machine Learning and Deep Learning Methods: A Case Study from Southern Jiangxi Province, China. Minerals 2020, 10, 102. [Google Scholar] [CrossRef]
  23. Peng, J.B.; Lan, H.X. Ecological Geology and Eco-geological Environment System. J. Earth Sci. Environ. 2022, 44, 877–893. [Google Scholar]
  24. Fang, Z.; Zhang, Y.F.; Ding, M.H. Ecological changes analysis based on RSEI in the national ecological civilization experimental area (Jiangxi): A case study of Fuzhou city. J. East China Inst. Technol. Nat. Sci. Ed. 2020, 43, 271–279. [Google Scholar]
  25. Yang, Z.; Li, W.; Pei, Y.; Qiao, W.; Wu, Y. Classification of the type of eco-geological environment of a coal mine district: A case study of an ecologically fragile region in Western China. J. Clean. Prod. 2018, 174, 1513–1526. [Google Scholar] [CrossRef]
  26. Zhao, Y.B.; Ni, Z.Y.; Ouyang, Y.; Chen, X.Y.; Wang, D.; Liu, J.J.; Liu, H. Research progress of eco-geological environment carrying capacity. Sediment. Geol. Tethyan Geol. 2022, 42, 529–541. [Google Scholar]
  27. Zhang, X.; Wang, C.; Fan, J.; Wang, H.; Li, H. Optimizing the Analytic Hierarchy Process through a Suitability Evaluation of Underground Space Development in Tonghu District, Huizhou City. Energies 2020, 13, 742. [Google Scholar] [CrossRef]
  28. Ouyang, Y.; Liu, H.; Zhang, J.H.; Zhang, T.J.; Shao, L. Exploration Techniques and Methods of the Eco−Geological Survey in Mountainous Region, Southwest China. Northwestern Geol. 2023, 56, 218–242. [Google Scholar]
  29. Wu, J.Y.; Liu, H.; Li, T.; Yang, Y.; Zhang, J.; Zhang, T.; Huang, Y.; Gao, W.; Shao, L. Evaluating the ecological vulnerability of Chongqing using deep learning. Environ. Sci. Pollut. Res. 2023, 30, 86365–86377. [Google Scholar] [CrossRef]
  30. Chengdu Center, China Geological Survey (Geosciences Innovation Center of Southwest China). Geological Map of the People’s Republic of China (Southwestern Region) (1:1,500,000); Geological Publishing House: Beijing, China, 2019.
  31. Pan, G.T.; Xiao, Q.H.; Lu, S.N.; Deng, J.F.; Feng, Y.M.; Zhang, K.X.; Zhang, Z.Y.; Wang, F.G. Tectonics of China; Geological Publishing House: Beijing, China, 2017; pp. 1–617. [Google Scholar]
  32. Chongqing Geological Survey Institute. Regional Geology of China Chongqing Volume; Geological Publishing House: Beijing, China, 2017; pp. 1–1000.
  33. Hubei Geological Survey Institute. Regional Geology of China Hubei Volume; Geological Publishing House: Beijing, China, 2017; pp. 1–1000.
  34. Men, Y.P.; Xu, X.S.; Mou, C.L.; Yu, Q.; Yan, J.F.; Liu, W. Sedimentary facies and palaeogeography of the evaporates in the middle-upper Yangtze area. Sediment. Geol. Tethyan Geol. 2010, 30, 58–64. [Google Scholar]
  35. Zheng, B.; Cao, J.F. Types and controls on the dolostone reservoirs in the Upper Carboniferous Huanglong Formation, Macaoba-Heiloumen region, Chongqing. Sediment. Geol. Tethyan Geol. 2014, 34, 98–103. [Google Scholar]
  36. Chen, Q.G.; Zheng, W.M.; Chang, X.J. An approach to the relationship between recharge, runoff and drainage of groundwater in the typical red beds: An example from Rongchang in Chongqing. Sediment. Geol. Tethyan Geol. 2011, 31, 107–112. [Google Scholar]
  37. Xiong, C.; Dai, H.; Chen, J.; Hu, X.F.; Wang, X.; Zhang, H.; Zhou, Y.; Wang, F.; Xie, X. The trace fossils and their sedimentary environments in the Cretaceous Jiaguan Formation, Qijiang, Chongqing. Sediment. Geol. Tethyan Geol. 2017, 37, 74–80. [Google Scholar]
  38. National Earth System Science Data Center. China 1:1,000,000 Digital Geomorphology Data. 2000. Available online: https://www.geodata.cn/data/datadetails.html?dataguid=2795222 (accessed on 1 December 2000).
  39. National Earth System Science Data Center. Spatial Interpolation Dataset of Meteorological Elements in the Three Gorges Reservoir Area (Multi-Year Average). 2020. Available online: https://www.geodata.cn/data/datadetails.html?dataguid=2032086 (accessed on 1 December 2000).
  40. Zeng, H.; Chen, X.; Jiang, Y.; Zou, X.; Cui, T.; Zhang, Q.; Sun, L. State of the climate over the Three Gorges Region of the Yangtze River basin in 2024. Atmos. Ocean. Sci. Lett. 2025, 18, 100664. [Google Scholar] [CrossRef]
  41. National Earth System Science Data Center. Spatial Distribution Data of Vegetation Types in the Three Gorges Reservoir Area (1980). 2020. Available online: https://www.geodata.cn/data/datadetails.html?dataguid=9267787 (accessed on 1 June 2000).
  42. National Earth System Science Data Center. 250m Resolution Vegetation Index of the Yangtze River Economic Belt (2000–2022); National Earth System Science Data Center: Beijing, China, 2023. [Google Scholar] [CrossRef]
  43. National Earth System Science Data Center. Spatial Distribution Data of Vegetation Types in the Yangtze River Basin (1-km Grid, 2000). 2020. Available online: https://www.geodata.cn/data/datadetails.html?dataguid=798098 (accessed on 1 June 2000).
  44. National Earth System Science Data Center. 1:1,000,000 Forest Vegetation Type Distribution Map of China (2013–2017). 2020. Available online: https://www.geodata.cn/data/datadetails.html?dataguid=181908644502087&docId=13790 (accessed on 1 June 2000).
  45. National Earth System Science Data Center. 1:1,000,000 Vegetation Data of the Yangtze River Economic Belt (2000). 2020. Available online: https://www.geodata.cn/data/datadetails.html?dataguid=272009327681362 (accessed on 1 June 2020).
  46. Chongqing Municipal Planning and Natural Resources Bureau. Chongqing Territorial Space Ecological Protection and Restoration Plan (2021–2035) [Government Planning Report]. 2022. Available online: https://fzggw.cq.gov.cn/zwxx/tzgg/202107/t20210706_9453386_wap.html (accessed on 1 June 2022).
  47. Chengdu Center, China Geological Survey. Recommendations for Ecological Protection and Comprehensive Management of Typical Ecological Issues in Chongqing [Technical Report]; Geological Publishing House: Beijing, China, 2022.
  48. Yi, X.; Huang, Y.; Shi, Y.; Ju, J.; Chen, J.; Wu, S. Functional trait differences between alien and native plants under hydrological variability in the riparian zone of the Three Gorges Reservoir. Ecol. Inform. 2025, 90, 103359. [Google Scholar] [CrossRef]
  49. Han, C.; Wang, X.; Chen, Z.; Chen, Y.; Zhou, W.; Lu, S.; Yang, W. Relationship between microbial community and environmental factors in the sediments of the perennial backwater region of the three gorges reservoir. Ecohydrol. Hydrobiol. 2025, 25, 100644. [Google Scholar] [CrossRef]
  50. Li, Y.; Yang, J.; Wang, Y.; Wu, H.; Ma, Y.; Wu, F.; Wang, D.; Wang, J. Sediment eDNA reveals damming triggered changes in algal and fish communities at the Three Gorges Reservoir in China. Environ. Res. 2025, 276, 121474. [Google Scholar] [CrossRef]
  51. Zhang, H.; Tang, Q.; He, X.; Yang, Q. Land use function changes and trade-offs/synergies across topographic gradients in the Three Gorges Reservoir Area, China. J. Clean. Prod. 2024, 469, 143233. [Google Scholar] [CrossRef]
  52. Yao, X.; Yu, K.Y.; Liu, J.; Yang, S.P.; He, P.; Deng, Y.B.; Yu, X.Y.; Chen, Z.H. Spatial and temporal changes of the ecological vulnerability in a serious soil erosion area, Southern China. Chin. J. Appl. Ecol. 2016, 27, 735–745. [Google Scholar]
  53. Wang, J.B.; Wei, X.F.; Zhang, H.Q.; Gan, F. The eco-geological survey based on geological formation, exemplified by integrated geological survey of National Ecological Civilization Demonstration Area in Chengde City, Hebei Province. Geol. China 2020, 47, 1611–1624. [Google Scholar]
  54. Alzubaidi, L.; Zhang, J.; Humaidi, A.J.; Al-Dujaili, A.; Duan, Y.; Al-Shamma, O.; Santamaría, J.; Fadhel, M.A.; Al-Amidie, M.; Farhan, L. Review of deep learning: Concepts, CNN architectures, challenges, applications, future directions. J. Big Data 2021, 8, 53. [Google Scholar] [CrossRef]
  55. Yang, D.; Li, X.; Qi, L.; Zhang, W.; Jiang, Z. Nebula: A Scalable and Flexible Accelerator for DNN Multi-Branch Blocks on Embedded Systems. Electronics 2022, 11, 505. [Google Scholar] [CrossRef]
  56. Azarafza, M.; Akgün, H.; Derakhshani, R. Deep learning-based landslide susceptibility mapping. Sci. Rep. 2021, 11, 2412. [Google Scholar] [CrossRef]
  57. Liu, Y.; Eckert, C.M.; Earl, C. A review of fuzzy AHP methods for decision-making with subjective judgements. Expert Syst. Appl. 2020, 161, 113738. [Google Scholar] [CrossRef]
  58. Zhao, Y.; Liu, H.; Qu, W.; Luan, P.; Sun, J. Research on Geological Safety Evaluation Index Systems and Methods for Assessing Underground Space in Coastal Bedrock Cities Based on a Back-Propagation Neural Network Comprehensive Evaluation-Analytic Hierarchy Process (BPCE-AHP). Sustainability 2023, 15, 8055. [Google Scholar] [CrossRef]
  59. Wang, F.; Lu, Y.; Li, J.; Ni, J. Evaluating Environmentally Sustainable Development Based on the PSR Framework and Variable Weigh Analytic Hierarchy Process. Int. J. Environ. Res. Public Health 2021, 18, 2836. [Google Scholar] [CrossRef] [PubMed]
  60. Wang, J.; Liu, S.; Song, Y.; Wang, J.; Wu, H. Environmental Risk Assessment of Subway Station Construction to Achieve Sustainability Using the Intuitionistic Fuzzy Analytic Hierarchy Process and Set Pair Analysis. Discret. Dyn. Nat. Soc. 2021, 2021, 5541493. [Google Scholar] [CrossRef]
  61. Xie, J.; Liu, B.; He, L.; Zhong, W.; Zhao, H.; Yang, X.; Mai, T. Quantitative Evaluation of the Adaptability of the Shield Machine Based on the Analytic Hierarchy Process (AHP) and Fuzzy Analytic Hierarchy Process (FAHP). Adv. Civ. Eng. 2022, 2022, 3268150. [Google Scholar] [CrossRef]
  62. Chicco, D.; Jurman, G. The advantages of the Matthews correlation coefficient (MCC) over F1 score and accuracy in binary classification evaluation. BMC Genom. 2020, 21, 6. [Google Scholar] [CrossRef] [PubMed]
  63. Chicco, D.; Tötsch, N.; Jurman, G. The Matthews correlation coefficient (MCC) is more reliable than balanced accuracy, bookmaker informedness, and markedness in two-class confusion matrix evaluation. BioData Min. 2021, 14, 13. [Google Scholar] [CrossRef] [PubMed]
  64. Maxwell, A.E.; Warner, T.A.; Guillén, L.A. Accuracy Assessment in Convolutional Neural Network-Based Deep Learning Remote Sensing Studies—Part 1: Literature Review. Remote Sens. 2021, 13, 2450. [Google Scholar] [CrossRef]
  65. Zhou, A.G.; Sun, Z.Y.; Xu, H.L.; Xu, Z.S. Study of indexes for assessment of geoenvironmental ecology suitability. Geoogical Sci. Technol. Inf. 2021, 40, 71–74. [Google Scholar]
  66. Gruber, F.E.; Baruck, J.; Mair, V.; Geitner, C. From geological to soil parent material maps—A random forest-supported analysis of geological map units and topography to support soil survey in south tyrol. Geoderma 2019, 354, 113884. [Google Scholar] [CrossRef]
  67. Wilson, M.J. The importance of parent material in soil classification: A review in a historical context. Catena 2019, 82, 104131. [Google Scholar] [CrossRef]
  68. Gao, L.; Zhuo, H.; Xu, D.; Qian, B.; Gao, B. Geochemical characteristics and environmental implication of rare earth elements in sediments from the Three Gorges Reservoir, China. Sci. Total Environ. 2024, 923, 171289. [Google Scholar] [CrossRef]
  69. Yan, M.S.; Huang, J.; He, Z.X.; Bao, L.R.; Luo, Y.H. The influence of geological background on trace elements of soil, a case study of Yubei area. Geophys. Geochem. Explor. 2018, 42, 199–205. [Google Scholar]
  70. Bonfatti, B.R.; Demattê, J.A.M.; Marques, K.P.P.; Poppiel, R.R.; Rizzo, R.; Mendes, W.d.S.; Silvero, N.E.; Safanelli, J.L. Digital mapping of soil parent material in a heterogeneous tropical area. Geomorphology 2020, 367, 107305. [Google Scholar] [CrossRef]
  71. Biedunkova, O.; Kuznietsov, P.; Mandryk, O. Study of the dominant modes of formation and variability of potentially toxic element concentrations and their impact on environmental quality. Chemosphere 2025, 388, 144688. [Google Scholar] [CrossRef]
  72. Liu, D.; Yang, R.; Zhang, L.; Xia, Z.; Zhang, Z.; Xiang, R.; Gao, F.; Zhang, W.; Ding, Y.; Shi, H. Mitigation performance and mechanism of the EICP for the erosion resistance of purple soil to concentrated flow in the Three Gorges Reservoir area. Soil Tillage Res. 2025, 254, 106744. [Google Scholar] [CrossRef]
  73. Zhu, P.; Yang, L.; Wang, D.; Feng, T.; Chen, X.; Li, C. Divergent driving mechanism of land uses on soil erodibility between different soil types in the ecological zone of Three Gorges Reservoir Area. J. Environ. Manag. 2025, 393, 127026. [Google Scholar] [CrossRef] [PubMed]
  74. Wang, R.; Zhao, K.; Wei, C.; Yi, X.; Li, K.; Cui, D. Slope protection effect of typical vegetation in the Three Gorges reservoir area under extreme rainfall. iScience 2024, 27, 110057. [Google Scholar] [CrossRef]
  75. Zhao, F.; Miao, F.; Wu, Y.; Gong, S.; Qian, Z.; Zheng, G. Integration of Interpretable Machine Learning and MT-InSAR for Dynamic Enhancement of Landslide Susceptibility in the Three Gorges Reservoir Area. J. Rock Mech. Geotech. Eng. 2025, in press. [Google Scholar] [CrossRef]
  76. Wang, X.; Yin, Y.; Zhang, Z.; Wang, L.; Huang, B. Research on the failure mode and kinematics of high-steep rock slides based on video target tracking: A case study of Bijiashan rock fall in Wu Gorge in the Three Gorges Reservoir area, China. Geomorphology 2025, 473, 109638. [Google Scholar] [CrossRef]
  77. Xie, Q.; Chen, Y.; Wu, Z.; Peng, H.; Fu, X.; Ban, Y. Investigation of morphological features and mechanical behavior of jointed limestone subjected to wet-dry cycles and cyclic shear in drawdown areas of the Three Gorges Reservoir. Eng. Geol. 2025, 350, 107990. [Google Scholar] [CrossRef]
Figure 1. Location Maps. (a) Location Map of the TGRA; (b) The location of the TGRA in China.
Sustainability 18 01758 g001
Figure 2. Geological Sketch Maps (Compiled based on References [30,31,32,33]). (a) Tectonic Sketch Map of China; (b) Tectonic Sketch Map of the TGRA; (c) Geological Sketch Map of the TGRA. 1—Quaternary System; 2—Cretaceous Terrigenous Clastic Rocks; 3—Jurassic Terrigenous Clastic Rocks; 4—Triassic Continental Marginal Clastic Rocks; 5—Carboniferous-Triassic Carbonate Rocks; 6—Silurian-Permian Continental Marginal Clastic Rocks; 7—Sinian-Ordovician Carbonate Rocks; 8—Pre-Sinian Metamorphic Rocks; 9—Proterozoic Intermediate-Acidic Rocks; 10—Faults and Inferred Faults.
Sustainability 18 01758 g002
Figure 3. Data for Eco-geological Vulnerability Assessment.
Sustainability 18 01758 g003
Figure 4. Schematic Diagram of the Deep Neural Network (DNN).
Sustainability 18 01758 g004
Figure 5. Schematic Diagram of the Convolutional Neural Network (CNN).
Sustainability 18 01758 g005
Figure 6. Schematic Diagram of the Analytic Hierarchy Process (AHP).
Sustainability 18 01758 g006
Figure 7. DNN (a) and CNN (b) loss curves for training and testing sets.
Sustainability 18 01758 g007
Figure 8. Confusion Matrix and Loss Curve. TP (True Positive): The actual class is positive, and the model predicts it as positive; TN (True Negative): The actual class is negative, and the model predicts it as negative; FP (False Positive): The actual class is negative, but the model predicts it as positive (false alarm); FN (False Negative): The actual class is positive, but the model predicts it as negative (missed detection).
Sustainability 18 01758 g008
Figure 9. ROC Curves and AUC Values of the Three Models.
Sustainability 18 01758 g009
Figure 10. Results of Eco-geological Vulnerability Assessment Using DNN. (a) The location of the TGRA in China; (b) Eco-geological Vulnerability Assessment Results of the TGRA (DNN).
Sustainability 18 01758 g010
Figure 11. Results of Eco-geological Vulnerability Assessment UsingCNN. (a) The location of the TGRA in China; (b) Eco-geological Vulnerability Assessment Results of the TGRA (CNN).
Sustainability 18 01758 g011
Figure 12. Results of Eco-geological Vulnerability Assessment Using AHP. (a) The location of the TGRA in China; (b) Eco-geological Vulnerability Assessment Results of the TGRA (AHP).
Sustainability 18 01758 g012
Figure 13. Area Proportion Distribution of Evaluation Results by Vulnerability Level for Each Model.
Sustainability 18 01758 g013
Figure 14. Schematic Diagram of Eestriction of Geological Conditions on Rcological Environment [28].
Sustainability 18 01758 g014
Figure 15. Eco-geological Zoning Map. (a) he location of the TGRA in Chinare; (b) Eco-geological Zoning of the TGRA.
Sustainability 18 01758 g015
Table 1. Data Resolution and Sources.
Data NameSpatial ResolutionData Source
Geo-environmental BackgroundGeological ConditionsGeologic Formation (Geologic Map)1:250,000GeoCloud: https://geocloud.cgs.gov.cn (accessed on 1 April 2023)
Lithologic Unit Water Richness (Hydrogeologic Map)1:250,000GeoCloud: https://geocloud.cgs.gov.cn (accessed on 1 April 2023)
Soil PropertiesSoil Type1:500,000National Earth System Science Data Center, China, https://www.geodata.cn (accessed on 1 April 2023)
Soil Texture1000 mNational Earth System Science Data Center, China, https://www.geodata.cn (accessed on 1 April 2023)
Soil Organic Carbon1000 mNational Earth System Science Data Center, China, https://www.geodata.cn (accessed on 1 April 2023)
Soil pH1000 mNational Earth System Science Data Center, China, https://www.geodata.cn (accessed on 1 April 2023)
Soil Nutrients (Land Quality Geochemistry)1:250,000GeoCloud: https://geocloud.cgs.gov.cn (accessed on 1 April 2023)
Soil Environment (Land Quality Geochemistry)1:250,000GeoCloud: https://geocloud.cgs.gov.cn (accessed on 1 April 2023)
Topography and GeomorphologyElevation30 mASTER GDEMV2, http://srtm.csi.cgiar.org/srtmdata (accessed on 1 April 2023)
Slope Gradient30 mASTER GDEMV2, http://srtm.csi.cgiar.org/srtmdata (accessed on 1 April 2023)
Slope Aspect30 mASTER GDEMV2, http://srtm.csi.cgiar.org/srtmdata (accessed on 1 April 2023)
Meteorological ConditionsMulti-year Mean Annual Temperature (2000~2024)1000 mNational Earth System Science Data Center, China, https://www.geodata.cn (accessed on 1 April 2023)
Multi-year Mean Annual Precipitation (2000~2024)1000 mNational Earth System Science Data Center, China, https://www.geodata.cn (accessed on 1 April 2023)
Ecosystem StructureEcological EnvironmentVegetation Type1:1,000,000National Earth System Science Data Center, China, https://www.geodata.cn (accessed on 1 April 2023)
Vegetation Coverage1000 mNational Earth System Science Data Center, China, https://www.geodata.cn (accessed on 1 April 2023)
Biodiversity Richness Index1000 mAn integrated Big BioData Infrastructure for CASEarth, https://bio-one.org.cn/ (accessed on 1 April 2023)
Net Primary Productivity (NPP)1000 mNational Earth System Science Data Center, China, https://www.geodata.cn (accessed on 1 April 2023)
Normalized Difference Vegetation Index (NDVI)1000 mNational Earth System Science Data Center, China, https://www.geodata.cn (accessed on 1 April 2023)
Eco-geological issuesGeohazard Density1:250,000National Earth System Science Data Center, China, https://www.geodata.cn (accessed on 1 April 2023)
Soil Erosion Intensity30 mNational Earth System Science Data Center, China, https://www.geodata.cn (accessed on 1 April 2023)
Anthropogenic PerturbationSocio-economic FactorsPopulation Density30 mworld pop, https://www.worldpop.org (accessed on 1 April 2023)
Land Use Type30 mResource and Environmental Science Data Platform, https://www.resdc.cn (accessed on 1 April 2023)
Table 2. Detailed Architecture of the DNN Model.
Layer No.Layer TypeInput DimensionOutput DimensionActivation FunctionRemarks
1Flatten16 × 9 × 91296-Flatten input
2Linear (Dense)129672-Fully connected layer
3Activation7272ReLUNonlinear activation
4Linear (Dense)72360-Fully connected layer
5Activation360360ReLUNonlinear activation
6Linear (Dense)36090-Fully connected layer
7Activation9090ReLUNonlinear activation
8Linear (Dense)9018-Fully connected layer
9Activation1818ReLUNonlinear activation
10Linear (Dense)182-Output layer
11Activation22SoftmaxProbability output
ReLU: Rectified Linear Unit; Softmax: Normalized Exponential Function.
Table 3. Model Parameter Settings.
ModelParameter Settings
DNNepoch = 1200lr = 0.000005batch size = 200
shuffle = true
CNNepoch = 100lr = 0.00005batch size = 200
shuffle = trueDropout = 0.2
Table 4. Model Performance Metrics (Mean and 95% Confidence Interval *).
ModelDatasetAccuracyRecallPrecisionSpecificityF1-Score
DNNTraining Set0.8830
(0.862, 0.908)
0.8814
(0.856, 0.914)
0.8725
(0.837, 0.898)
0.8844
(0.875, 0.923)
0.8769
(0.860, 0.890)
Test Set0.8578
(0.818, 0.889)
0.8429
(0.815, 0.907)
0.8551
(0.770, 0.872)
0.8712
(0.839, 0.919)
0.8489
(0.810, 0.870)
CNNTraining Set0.8714
(0.850, 0.890)
0.8200
(0.784, 0.852)
0.8991
(0.868, 0.924)
0.9174
(0.891, 0.938)
0.8578
(0.840, 0.880)
Test Set0.8555
(0.820, 0.885)
0.7810
(0.720, 0.832)
0.9011
(0.849, 0.936)
0.9227
(0.881, 0.951)
0.8367
(0.810, 0.860)
AHPFull Sample0.7468
(0.724, 0.769)
0.8858
(0.862, 0.910)
0.6705
(0.639, 0.702)
0.6281
(0.594, 0.662)
0.7633
(0.740, 0.780)
* Confidence intervals calculated using Wilson’s method.
Table 5. Comparison of Results from the Three Methods at Typical Sampling Points.
PointField-Validated VulnerabilityDNN PredictedCNN PredictedAHP Predicted
1Negligible (N)Negligible (TN)Negligible (TN)Extreme (FP)
2Extreme (P)Extreme (TP)Extreme (TP)Extreme (TP)
3Extreme (P)Extreme (TP)Extreme (TP)Extreme (TP)
4Extreme (P)Extreme (TP)Extreme (TP)Extreme (TP)
5Extreme (P)Extreme (TP)Negligible (FN)Negligible (FN)
6Extreme (P)Extreme (TP)Extreme (TP)Extreme (TP)
7Negligible (N)Extreme (FP)Negligible (TN)Extreme (FP)
8Extreme (P)Extreme (TP)Extreme (TP)Extreme (TP)
9Negligible (N)Negligible (TN)Negligible (TN)Negligible (TN)
10Extreme (P)Extreme (TP)Extreme (TP)Extreme (TP)
11Extreme (P)Extreme (TP)Extreme (TP)Extreme (TP)
12Extreme (P)Negligible (FN)Extreme (TP)Negligible (FN)
13Extreme (P)Negligible (FN)Extreme (TP)Extreme (TP)
14Extreme (P)Extreme (TP)Extreme (TP)Negligible (FN)
15Extreme (P)Extreme (TP)Extreme (TP)Extreme (TP)
Disclaimer/Publisher’s Note: The statements, opinions and data contained in all publications are solely those of the individual author(s) and contributor(s) and not of MDPI and/or the editor(s). MDPI and/or the editor(s) disclaim responsibility for any injury to people or property resulting from any ideas, methods, instructions or products referred to in the content.