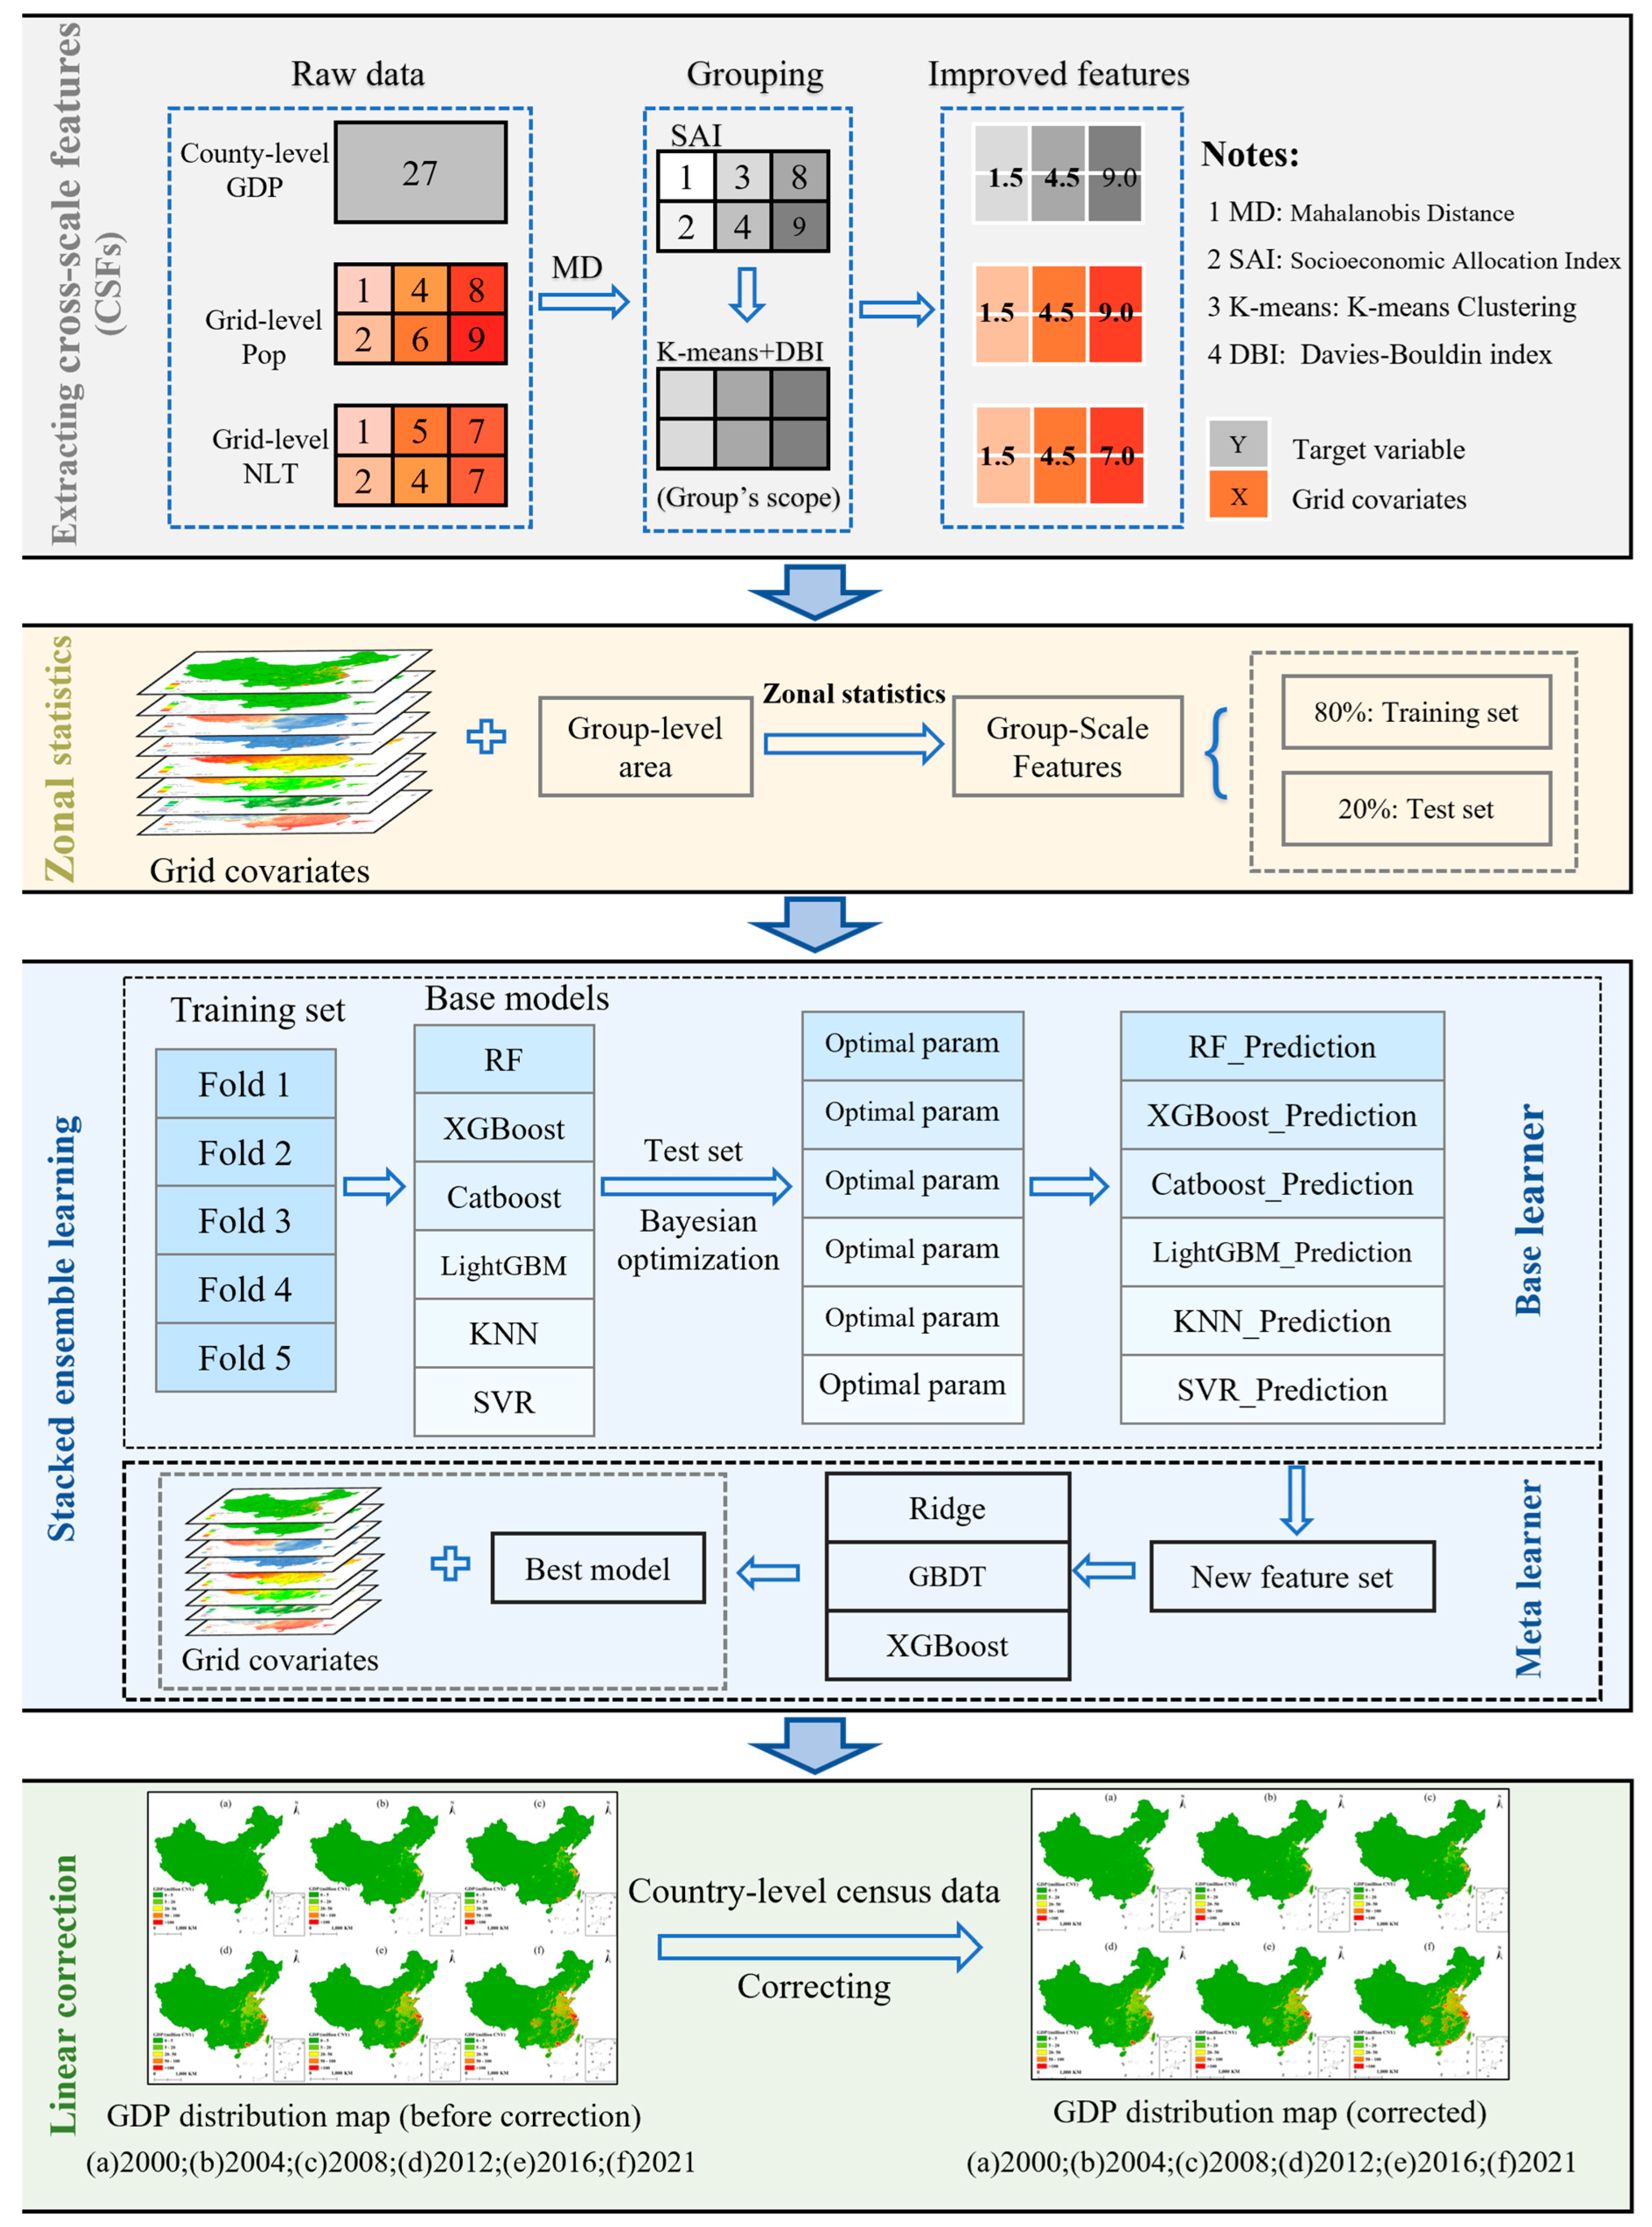
Constructing China’s Annual High-Resolution Gridded GDP Dataset (2000–2021) Using Cross-Scale Feature Extraction and Stacked Ensemble Learning



Abstract
1. Introduction
2. Data and Methods
2.1. Data
2.1.1. County-Level GDP Statistical Data
2.1.2. Gridded Covariate Data
2.2. Methods
2.2.1. Improved Cross-Scale Feature Extraction Method
2.2.2. GDP Spatialization Model Based on Stacked Ensemble Learning
2.2.3. Accuracy Evaluation Method
2.2.4. Dasymetric Mapping
3. Results
3.1. Accuracy Evaluation Results
3.2. Comparison of National Annual GDP Statistics and Predicted Data
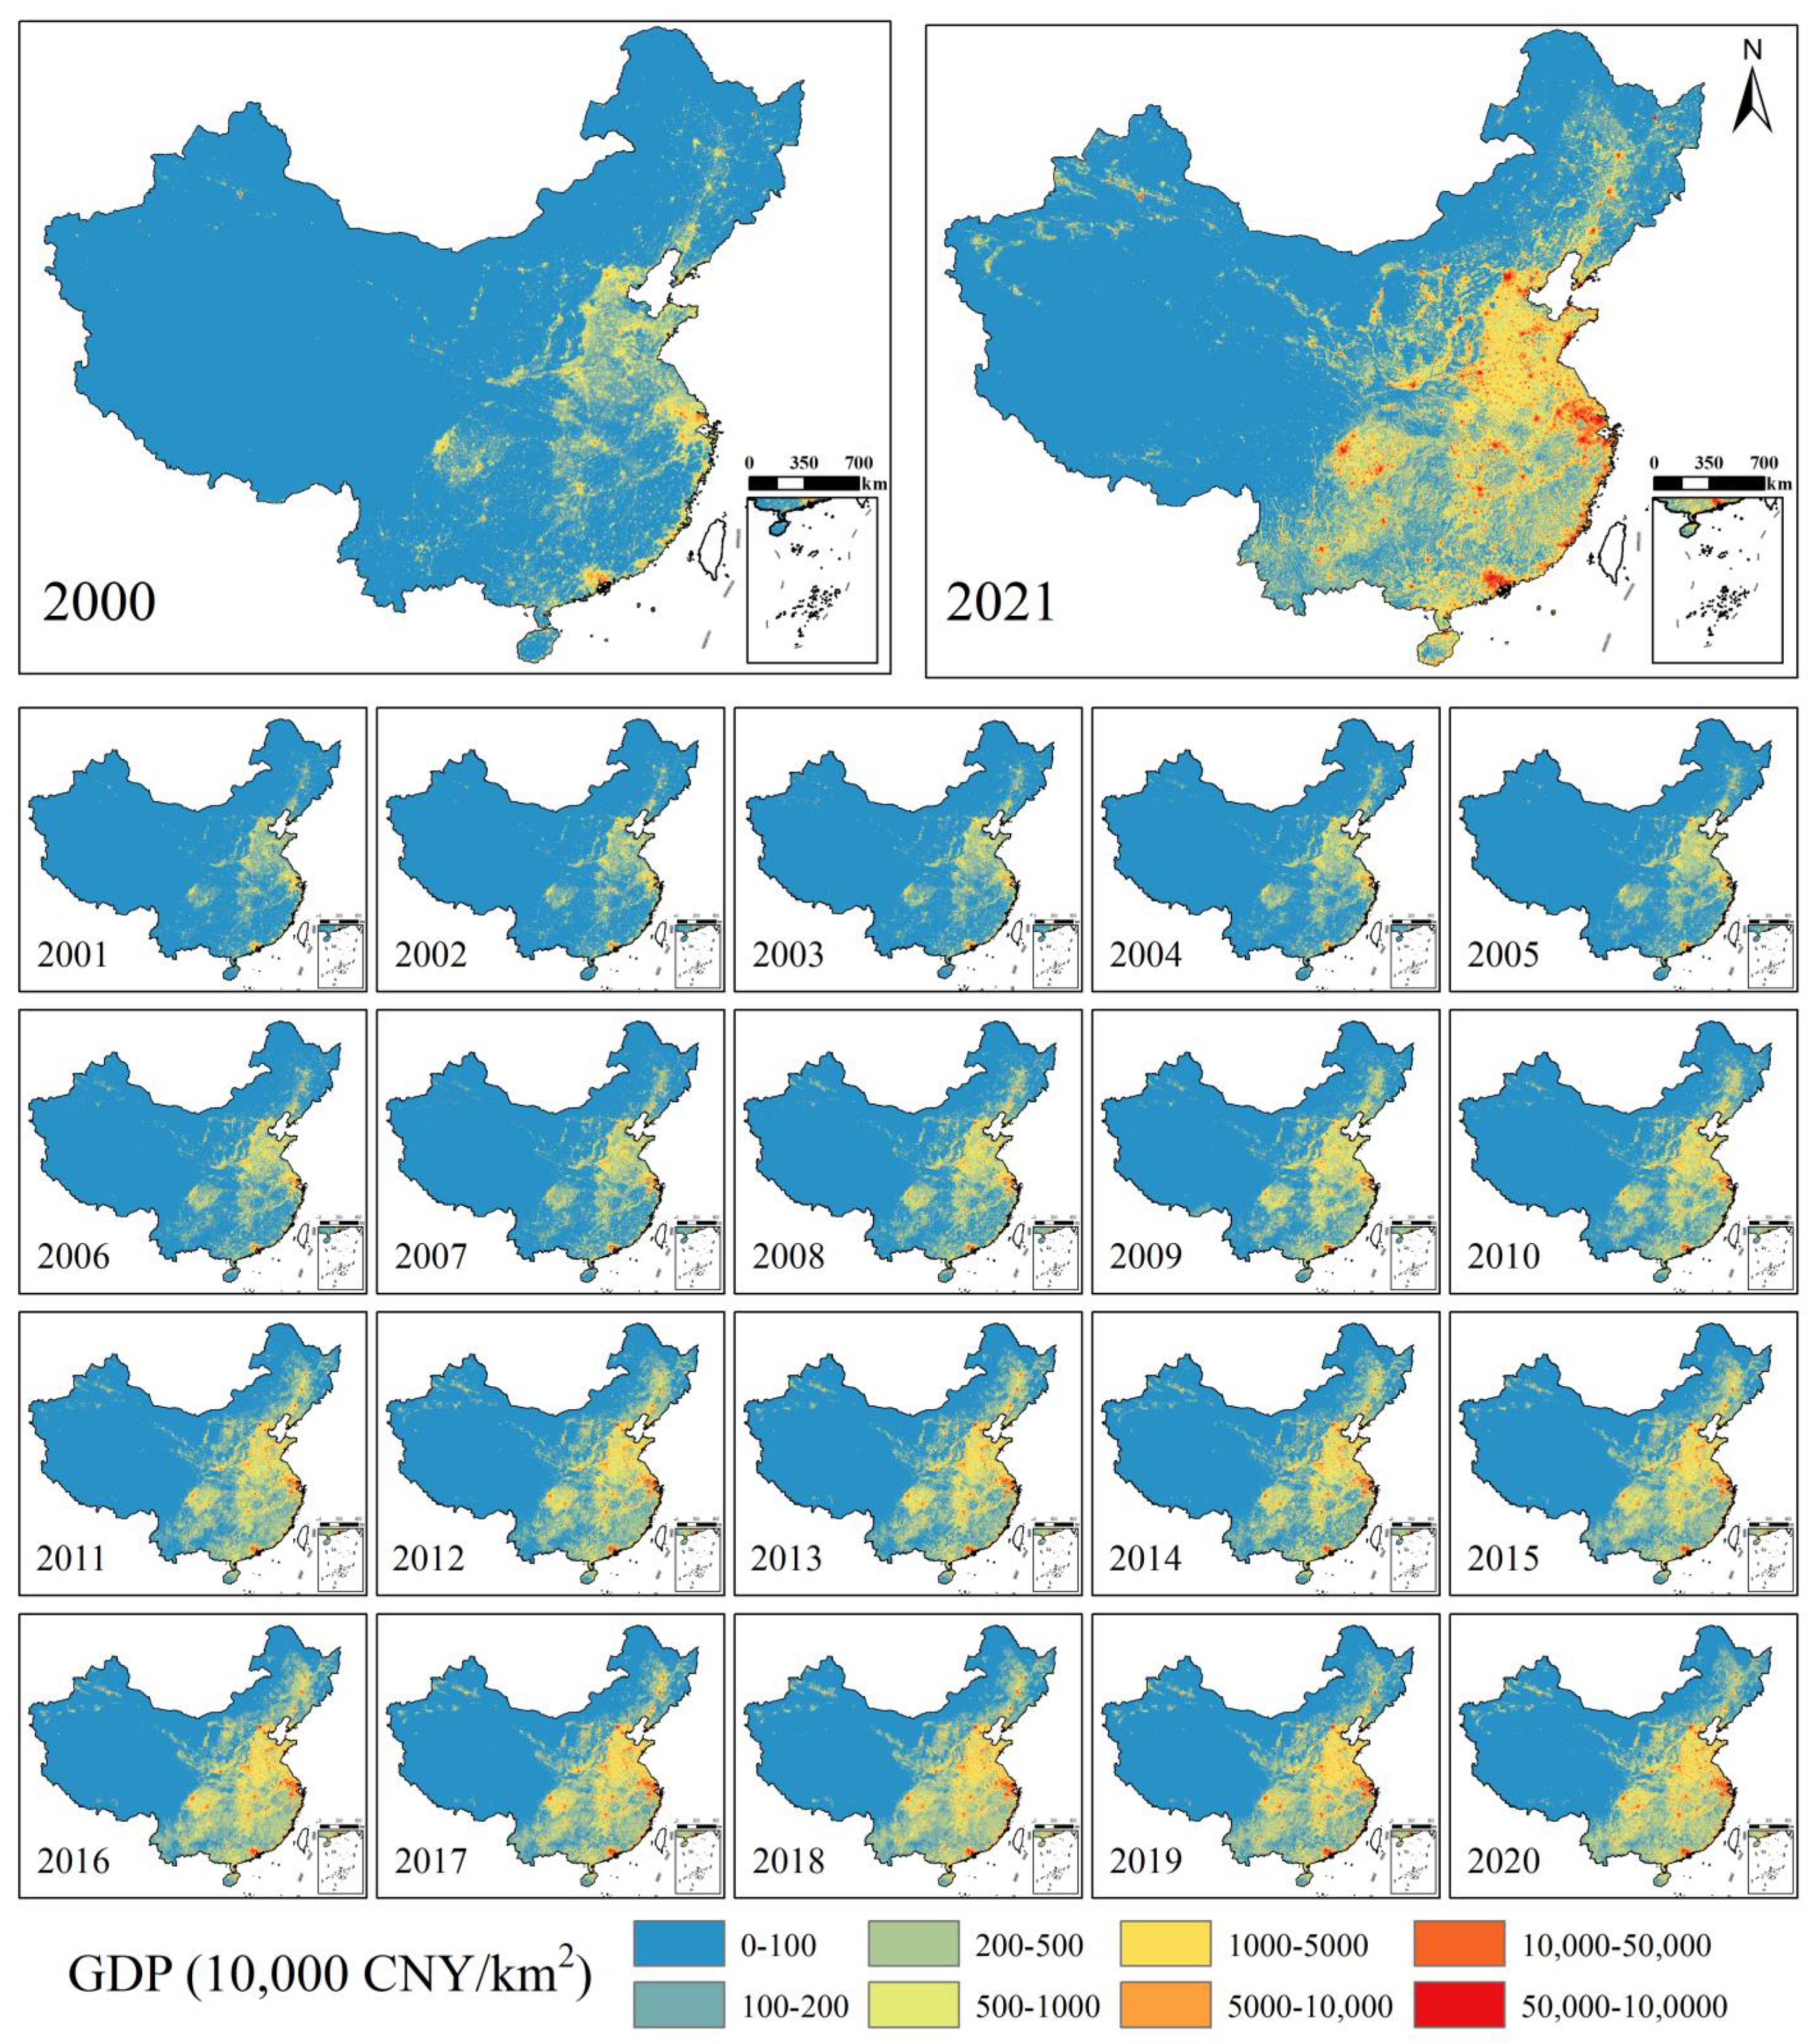
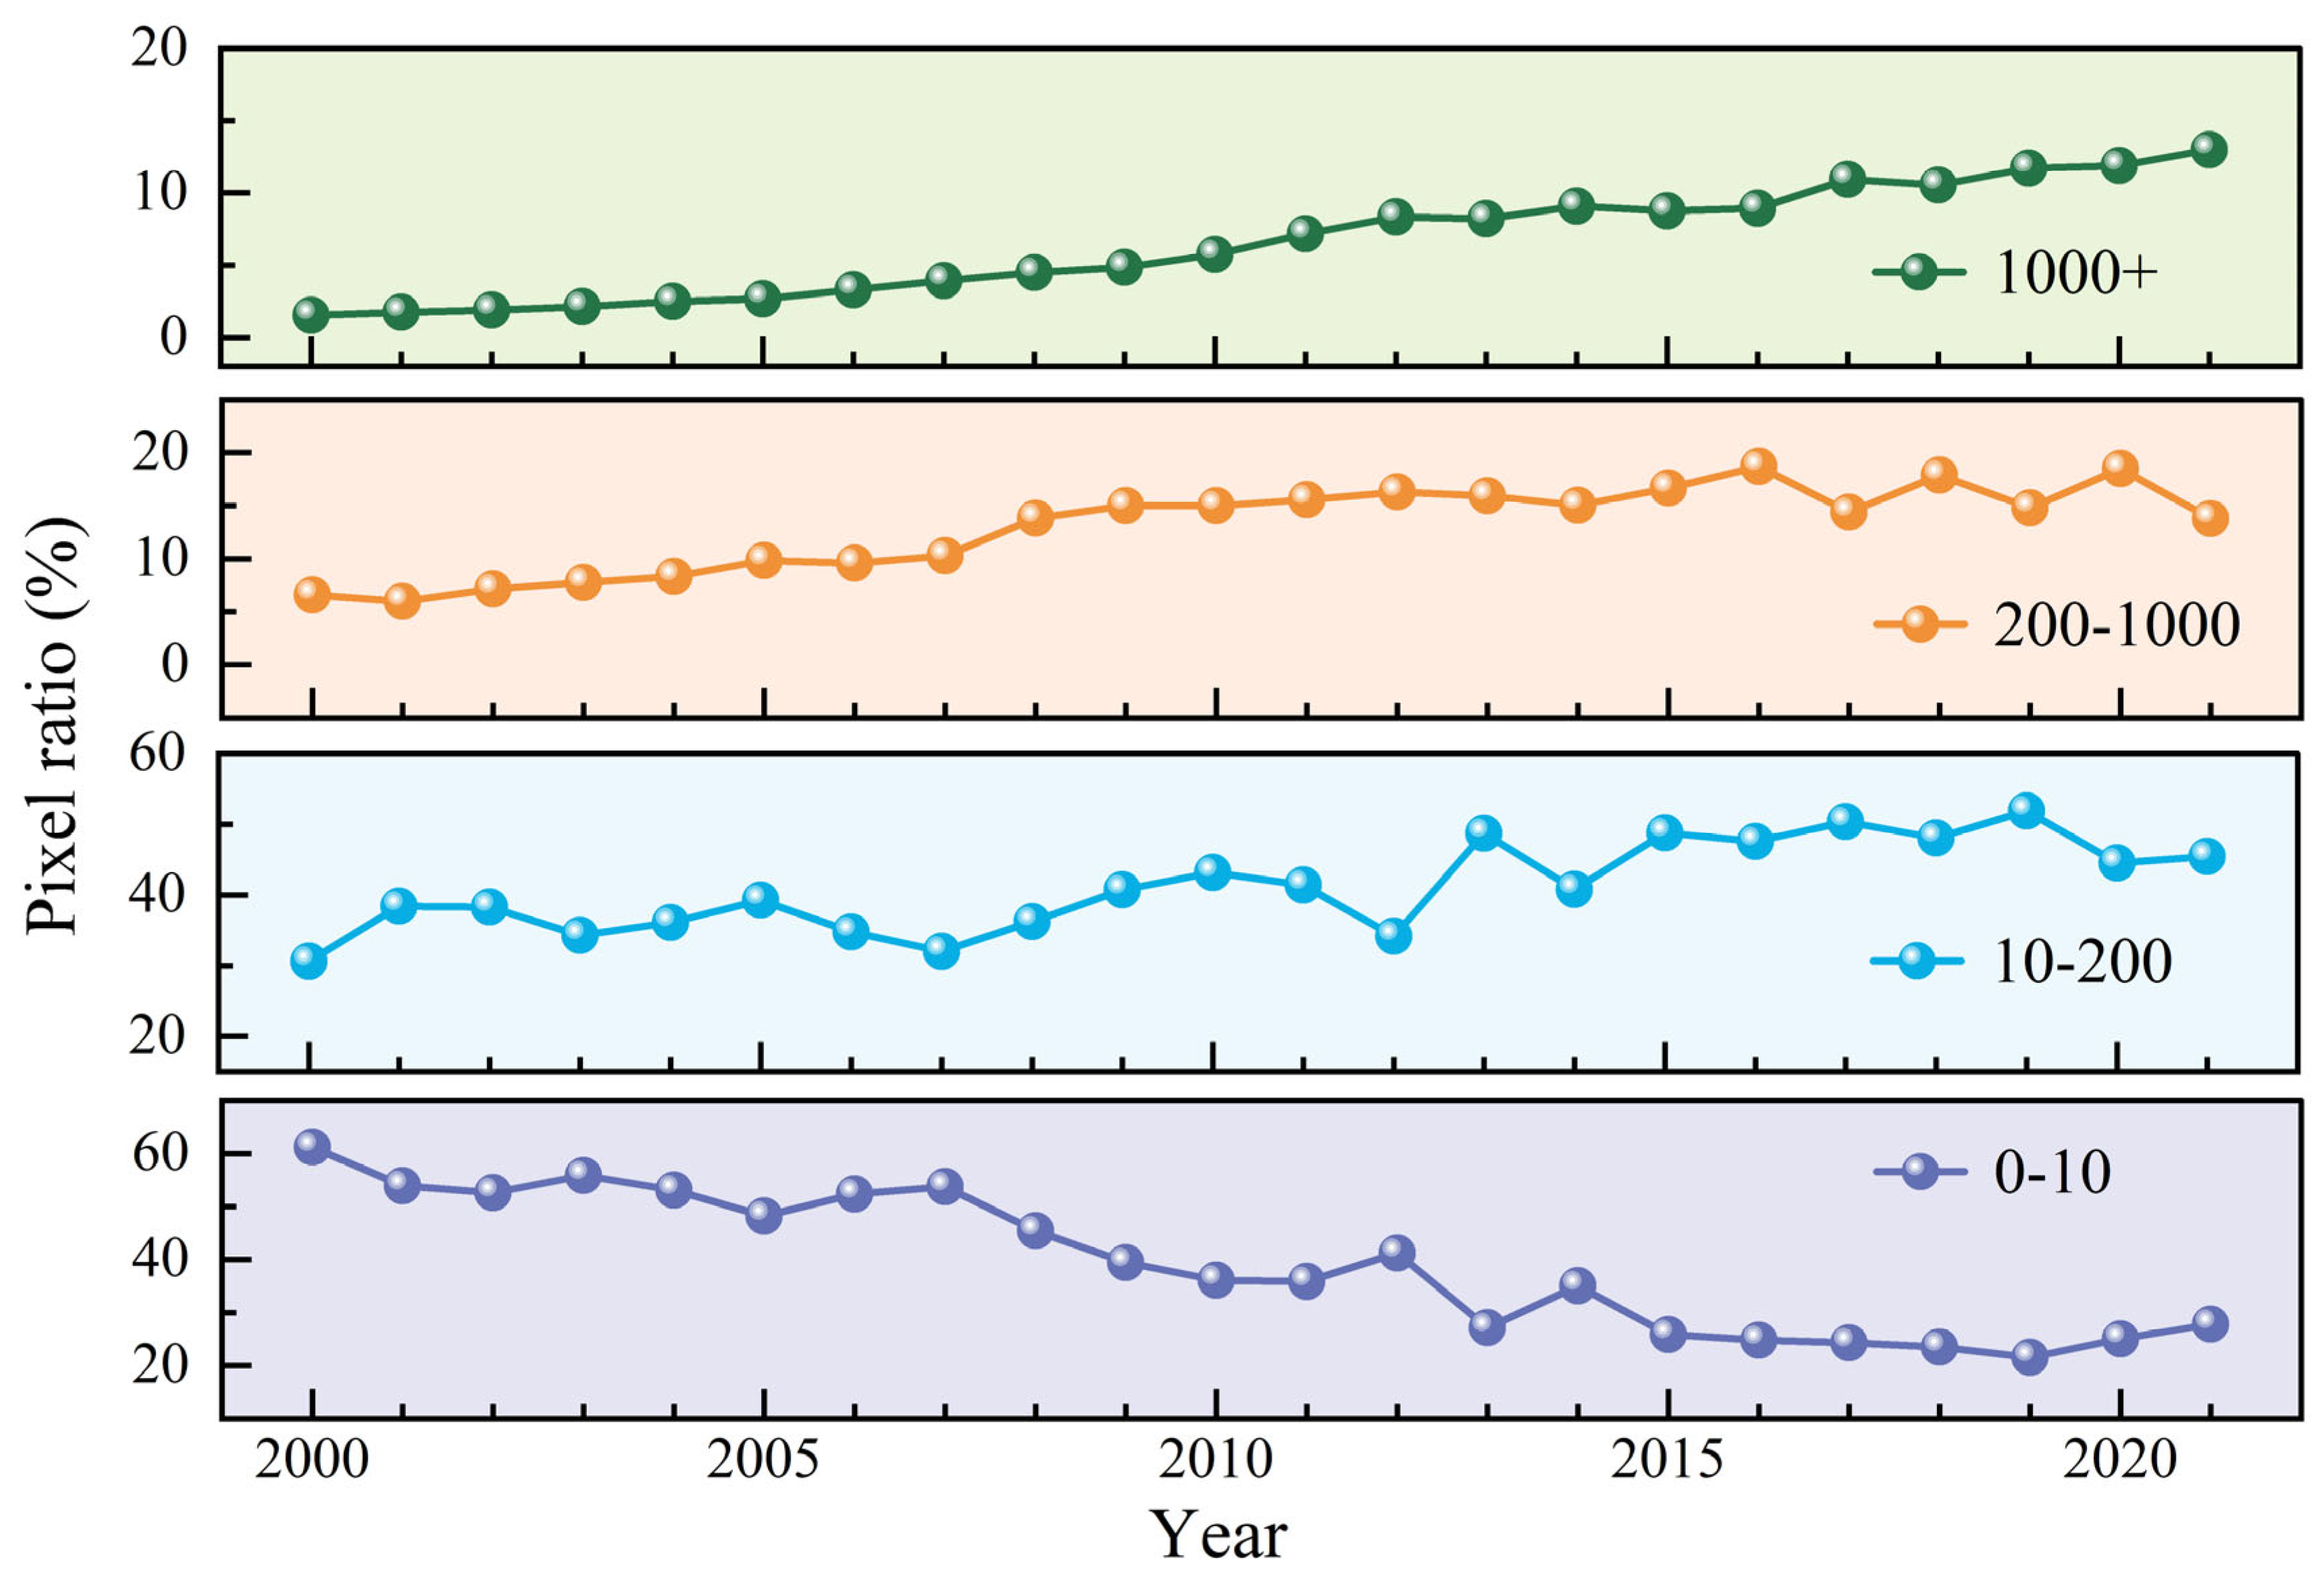
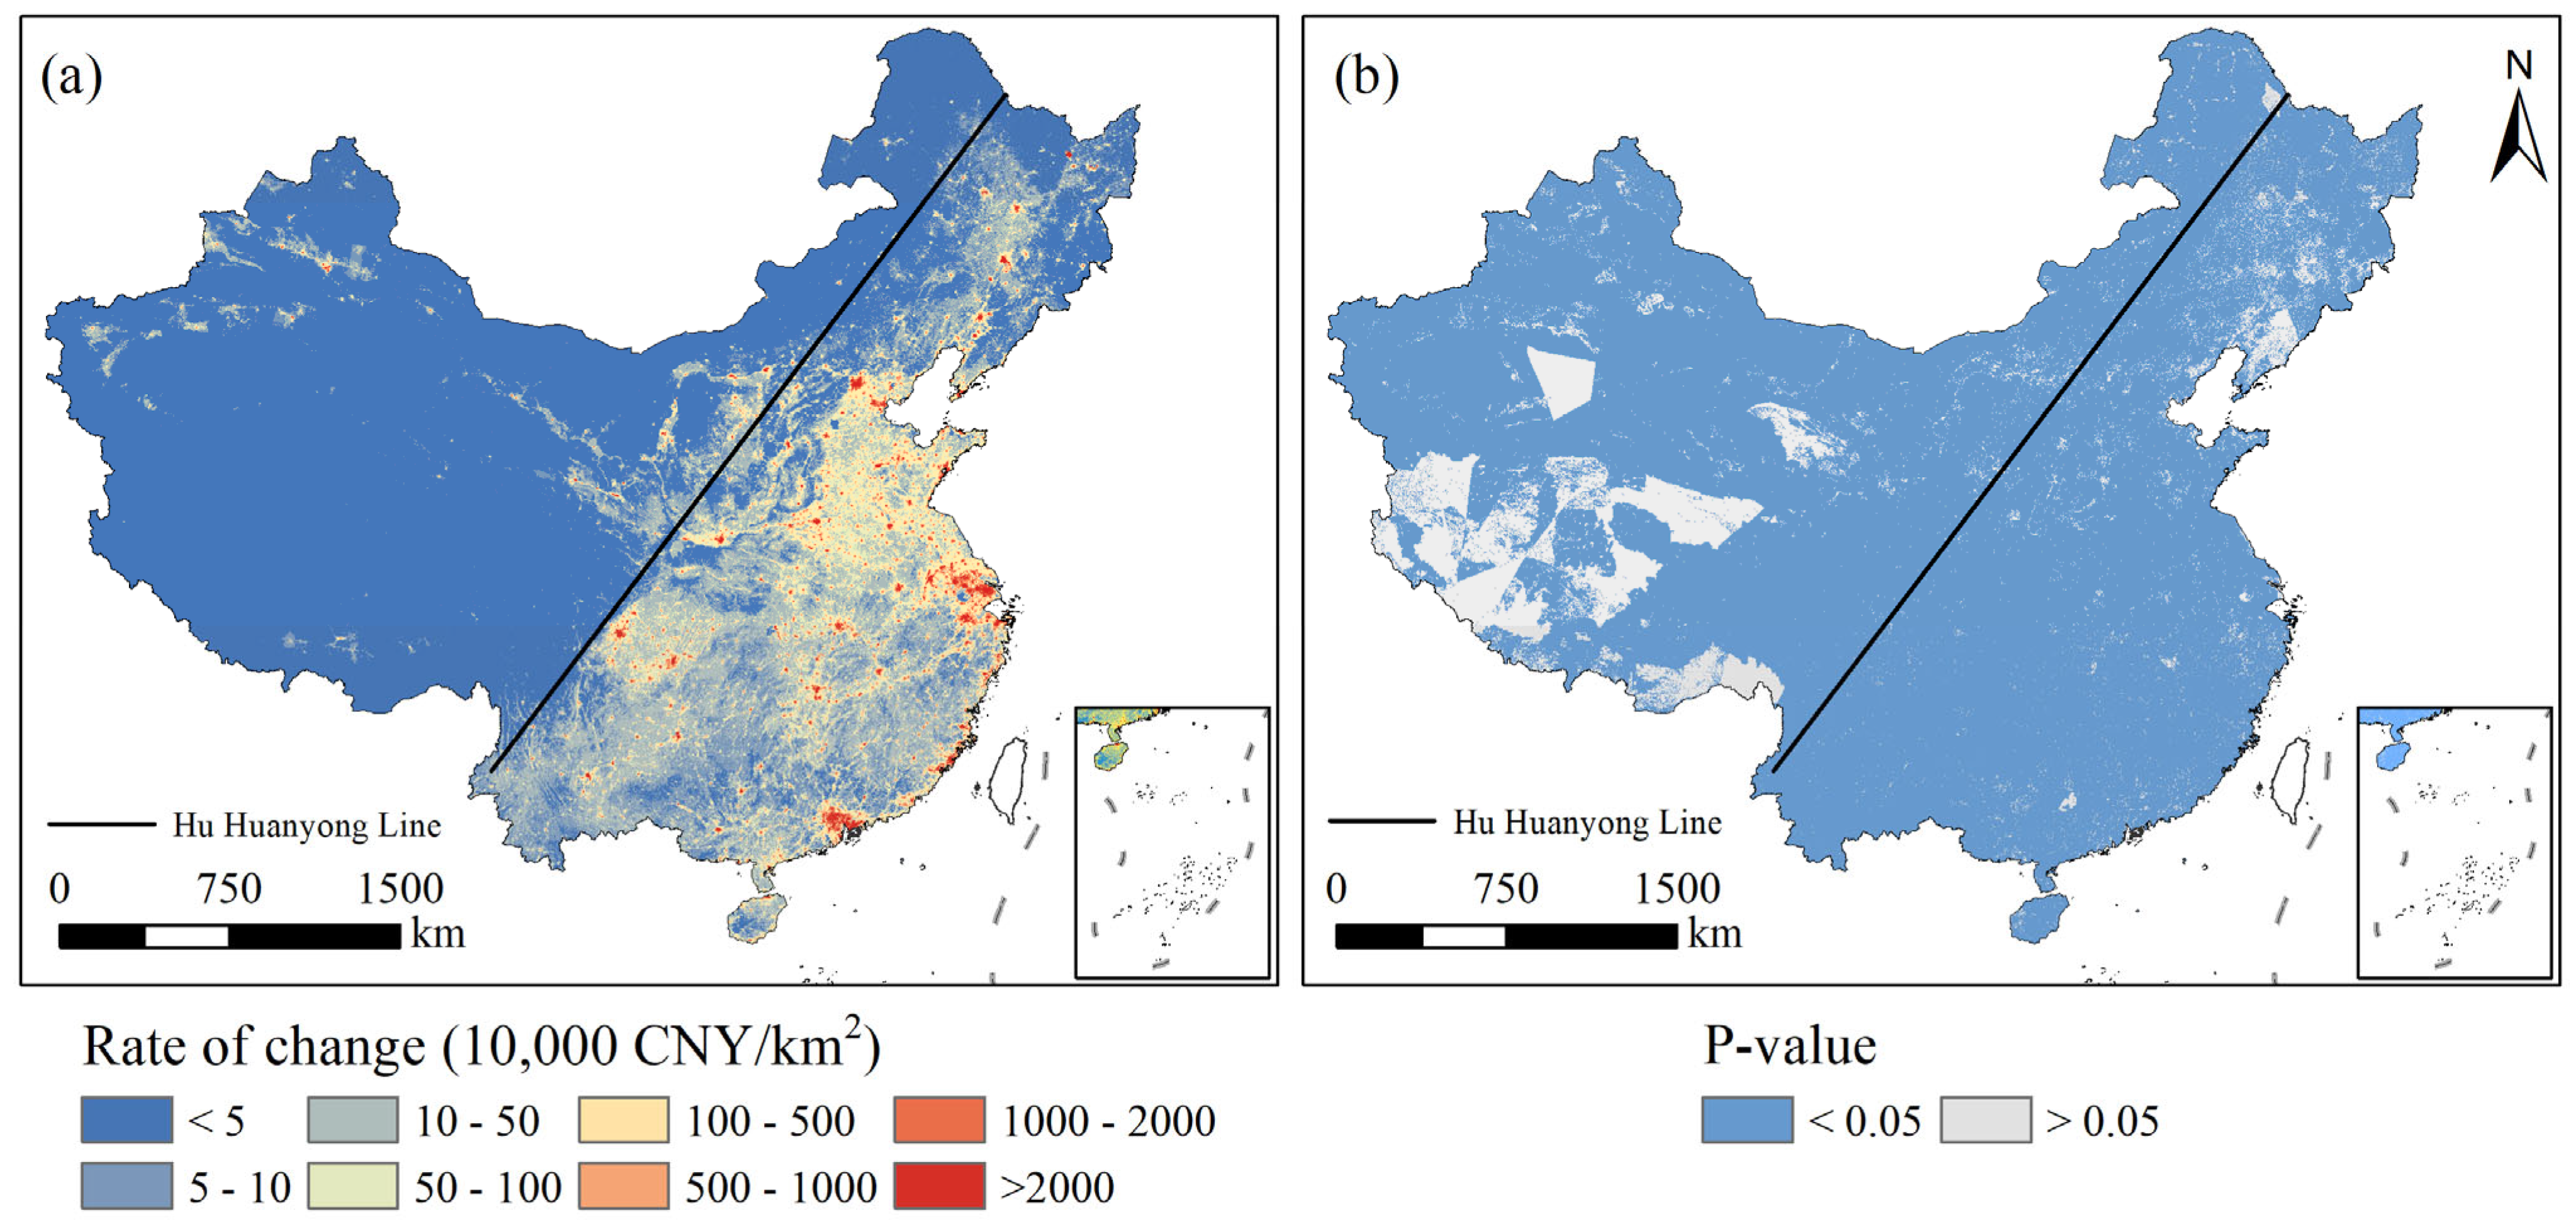
3.3. Long-Term Time Series GDP Gridded Maps
4. Discussion
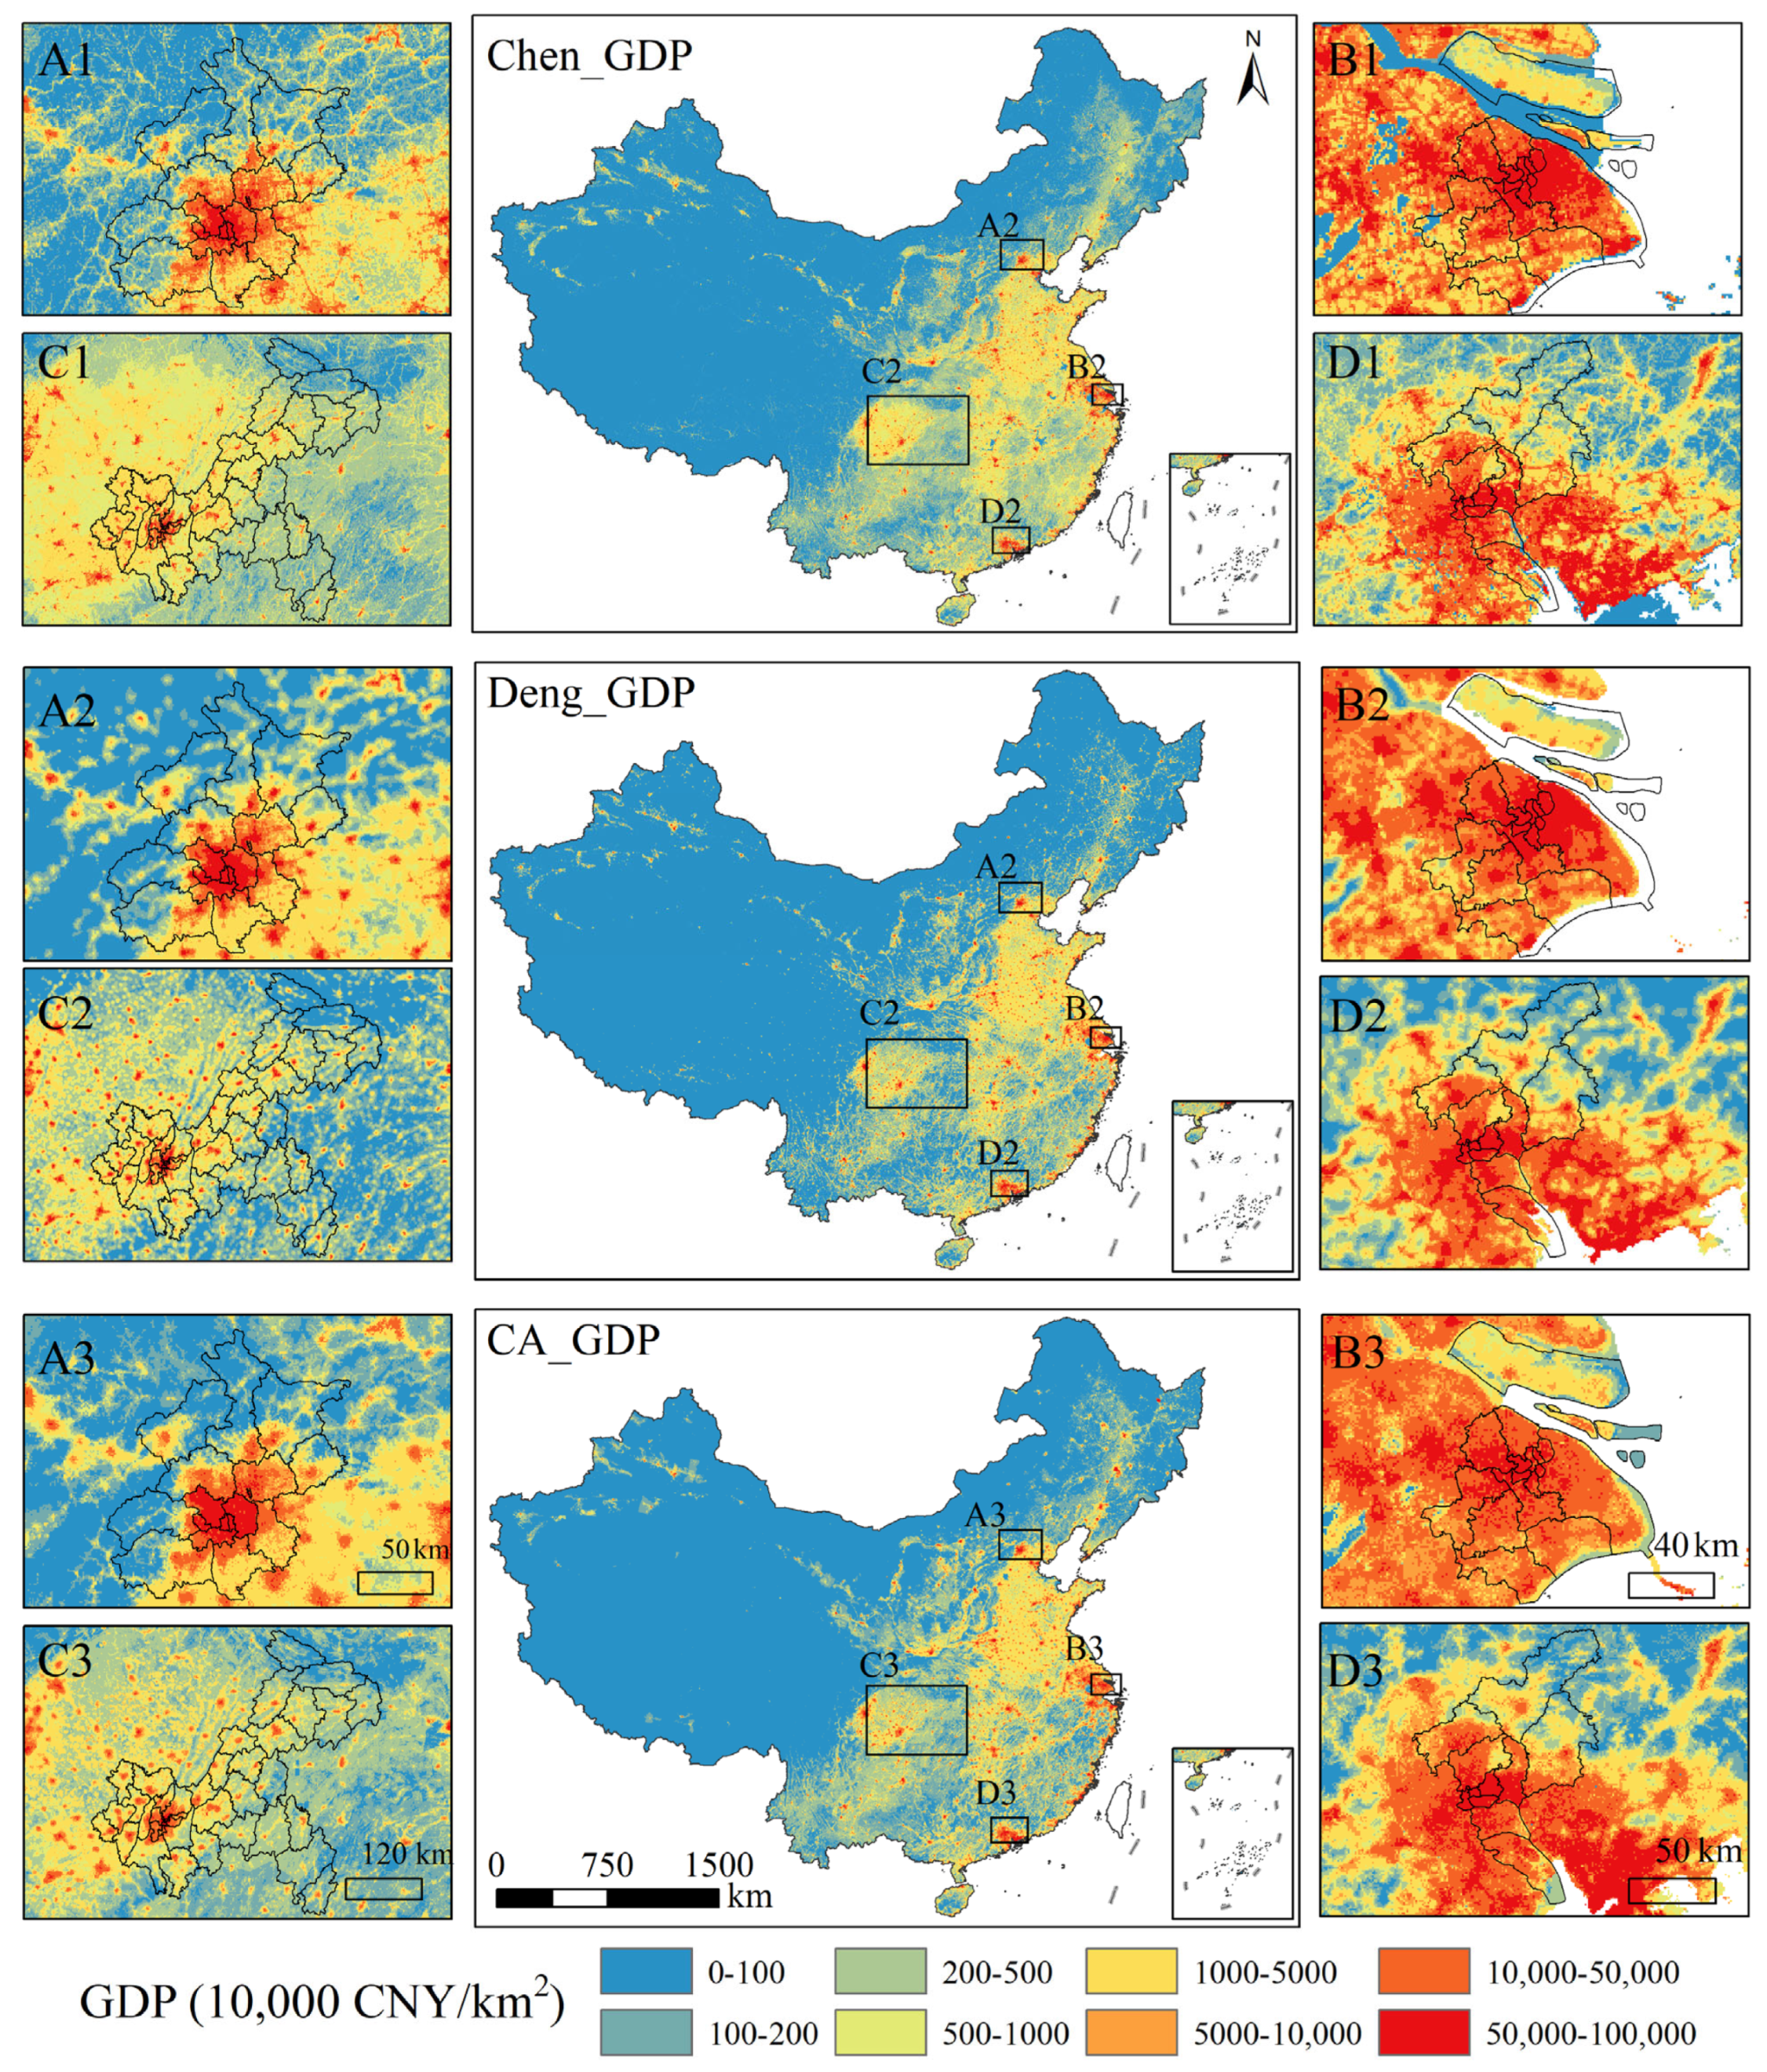
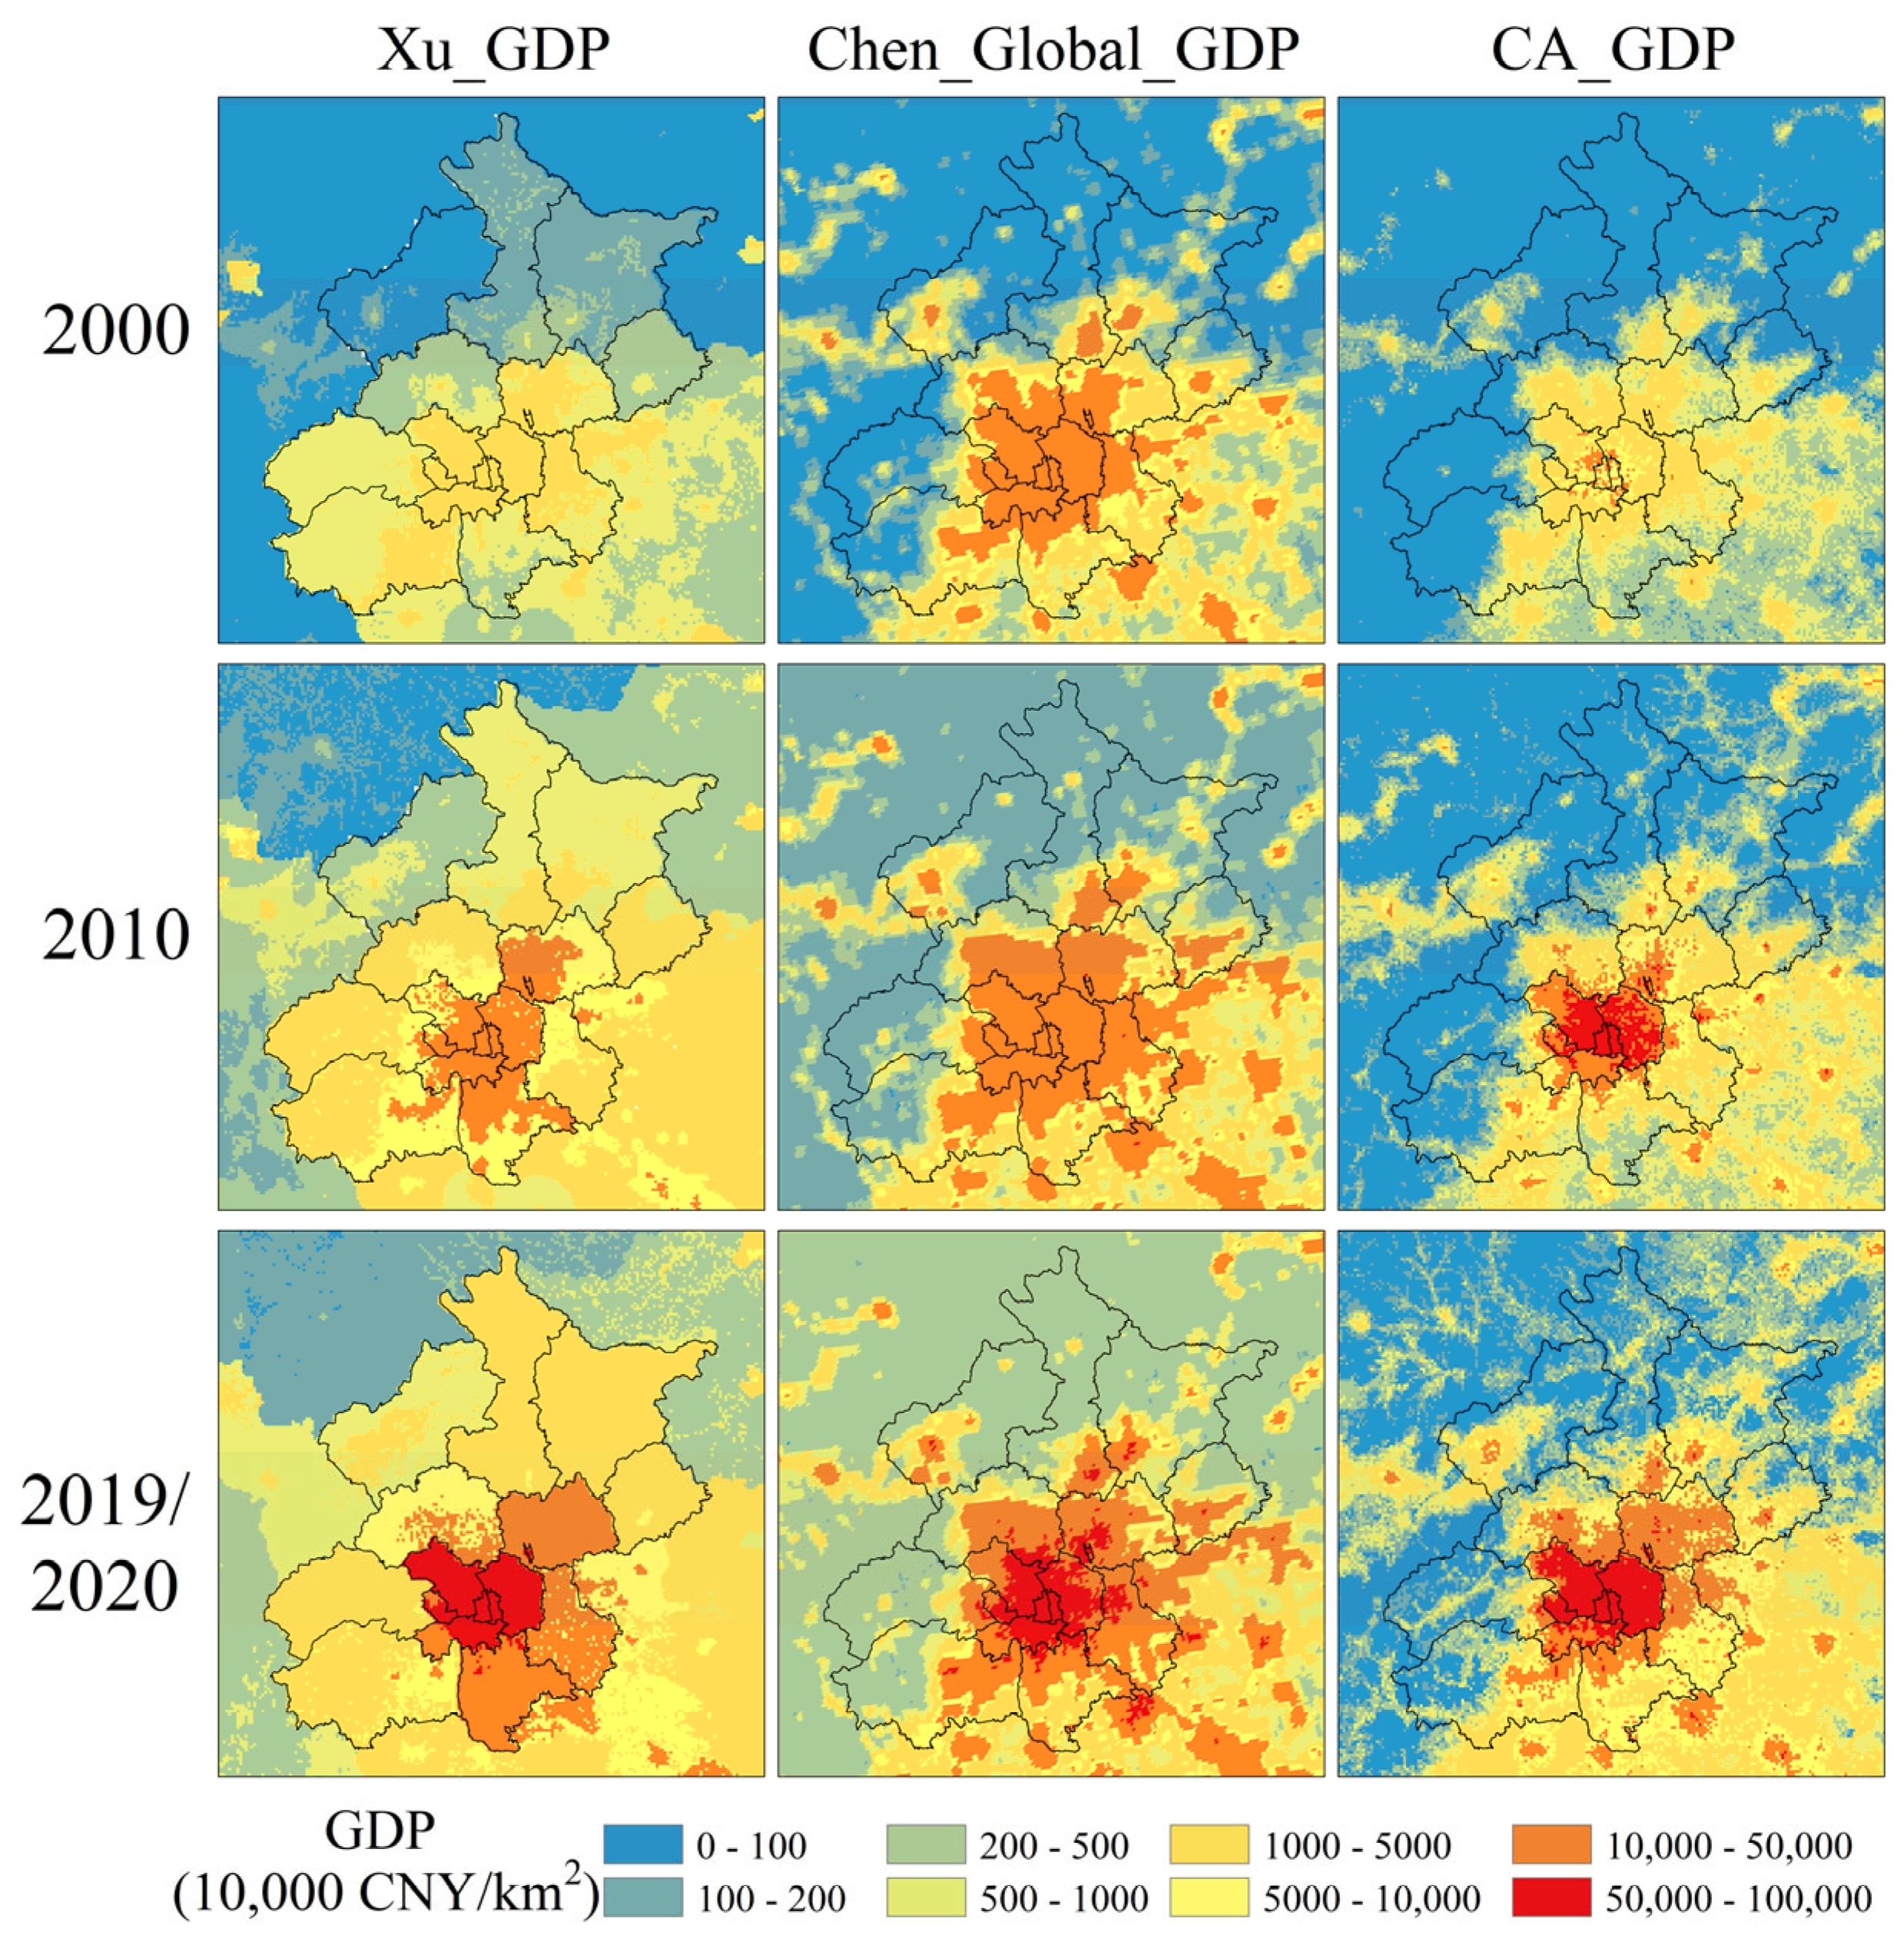
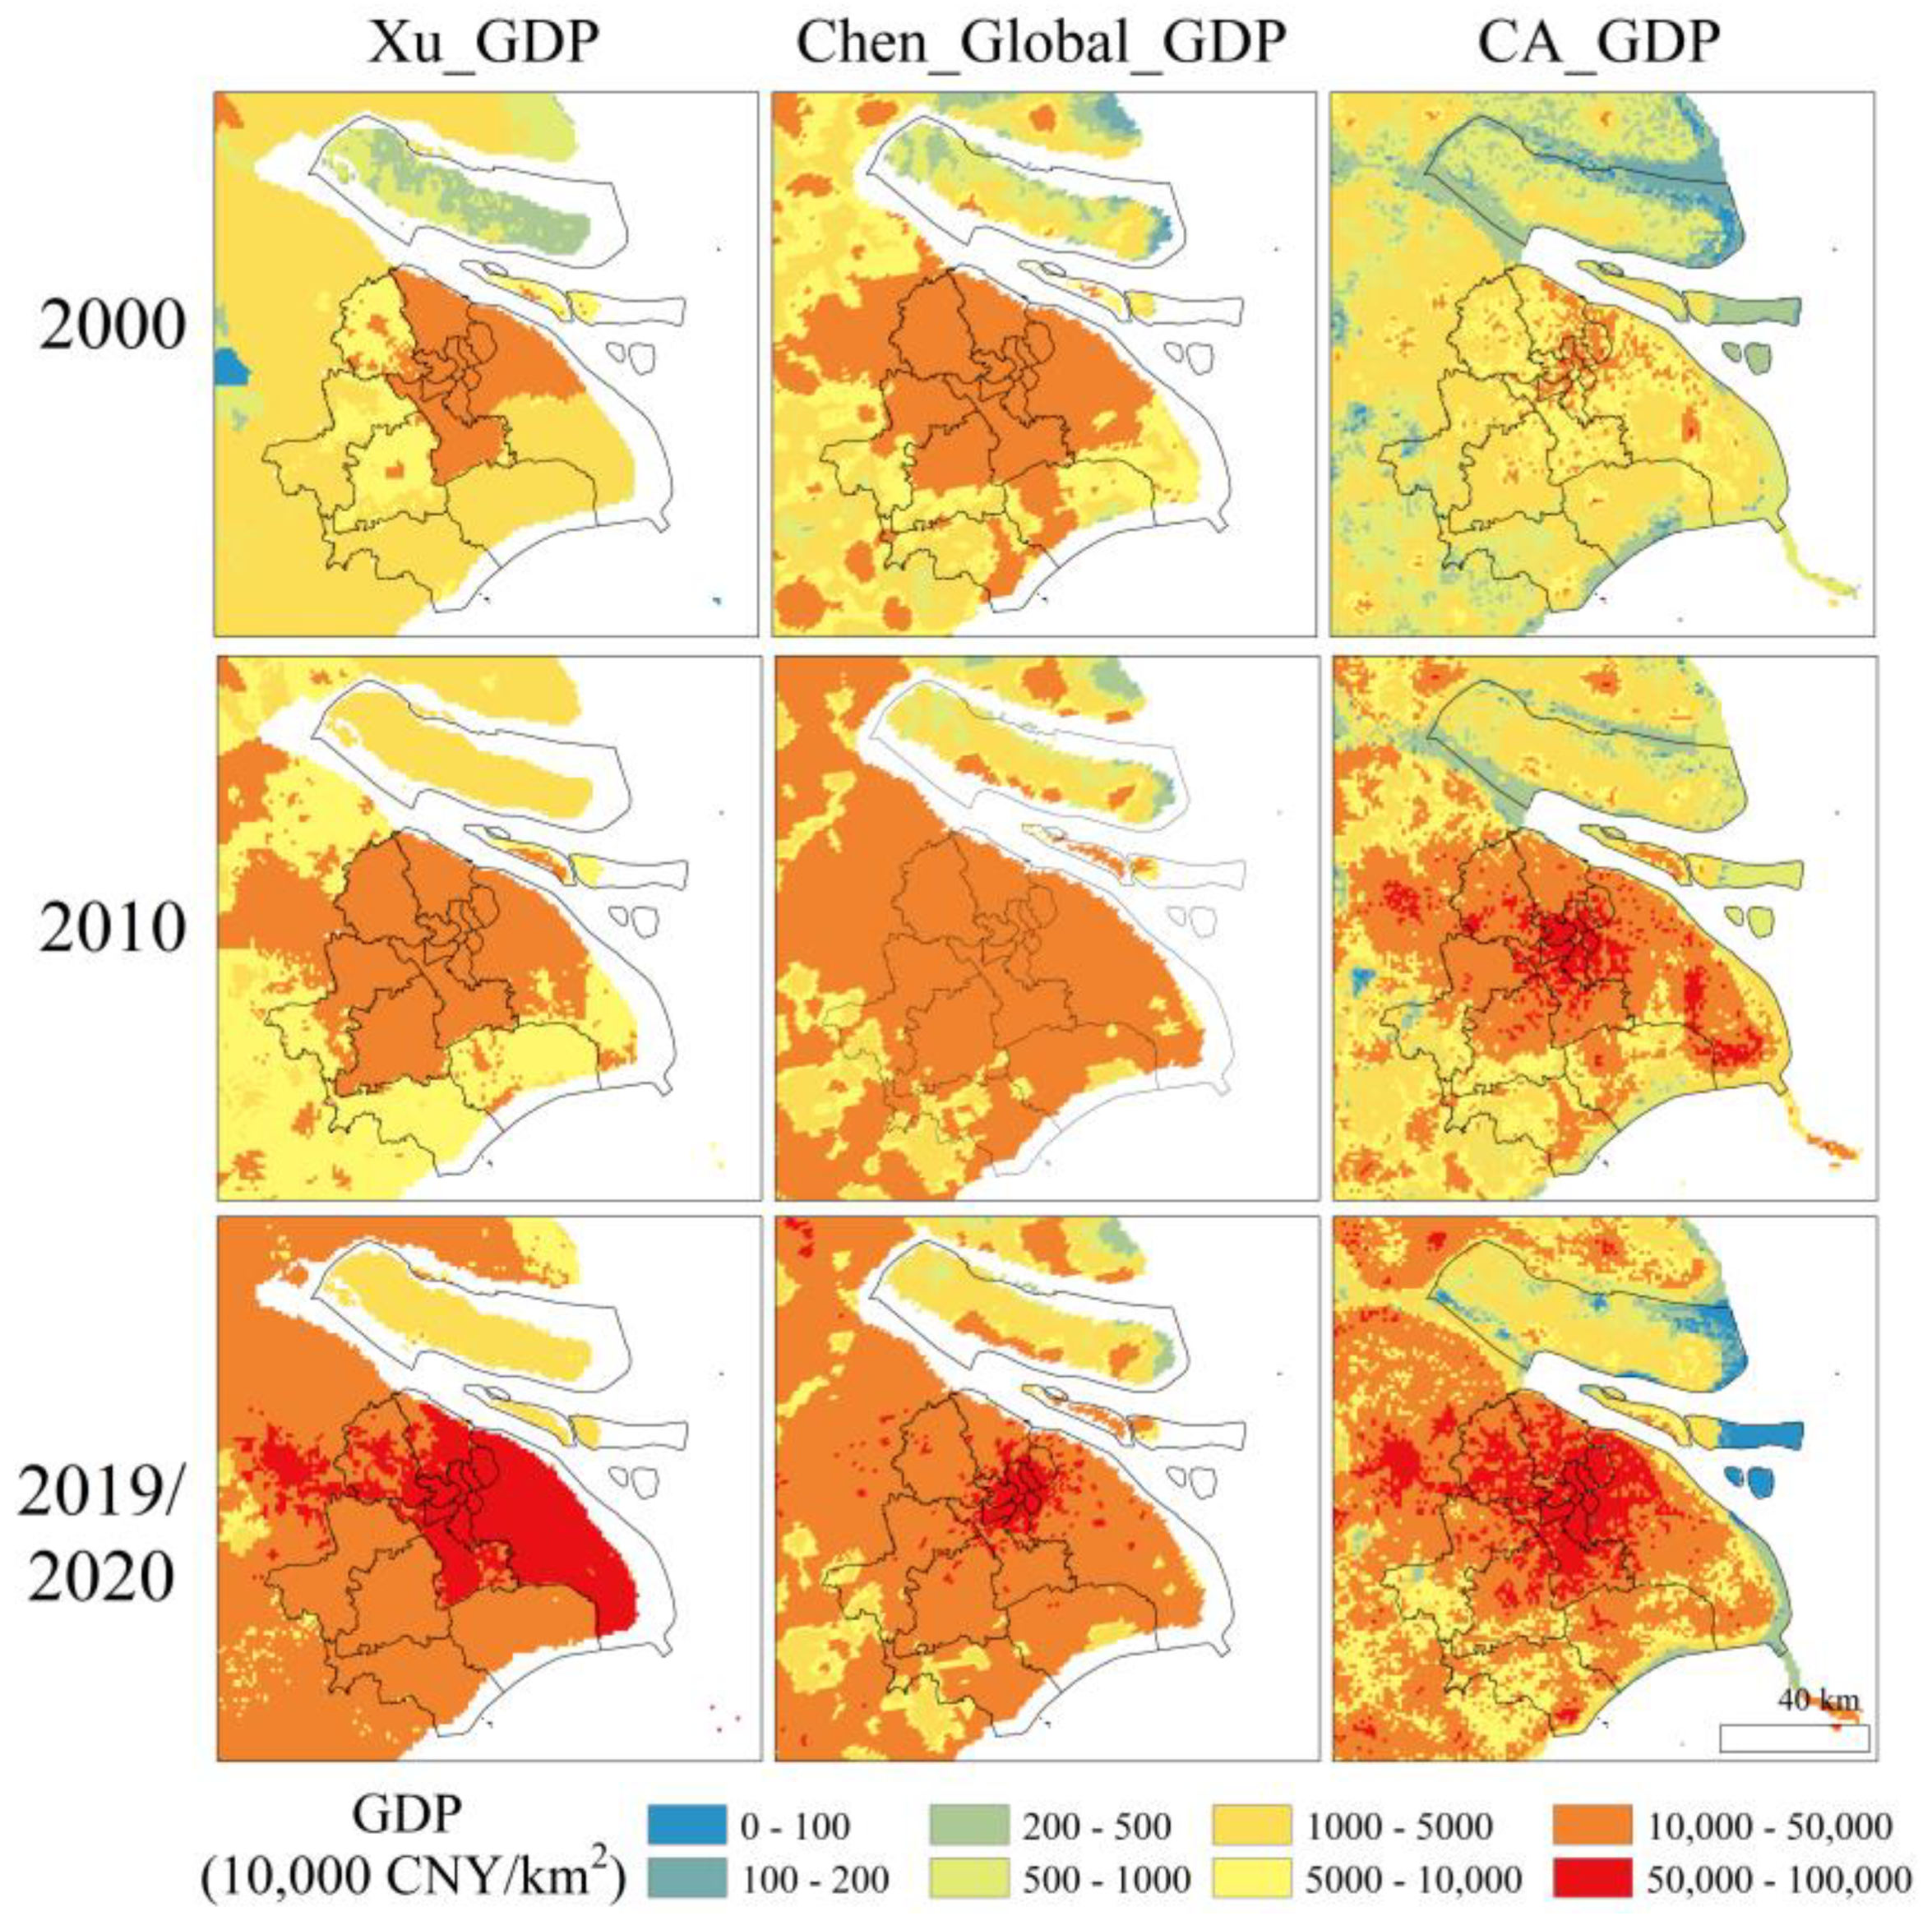
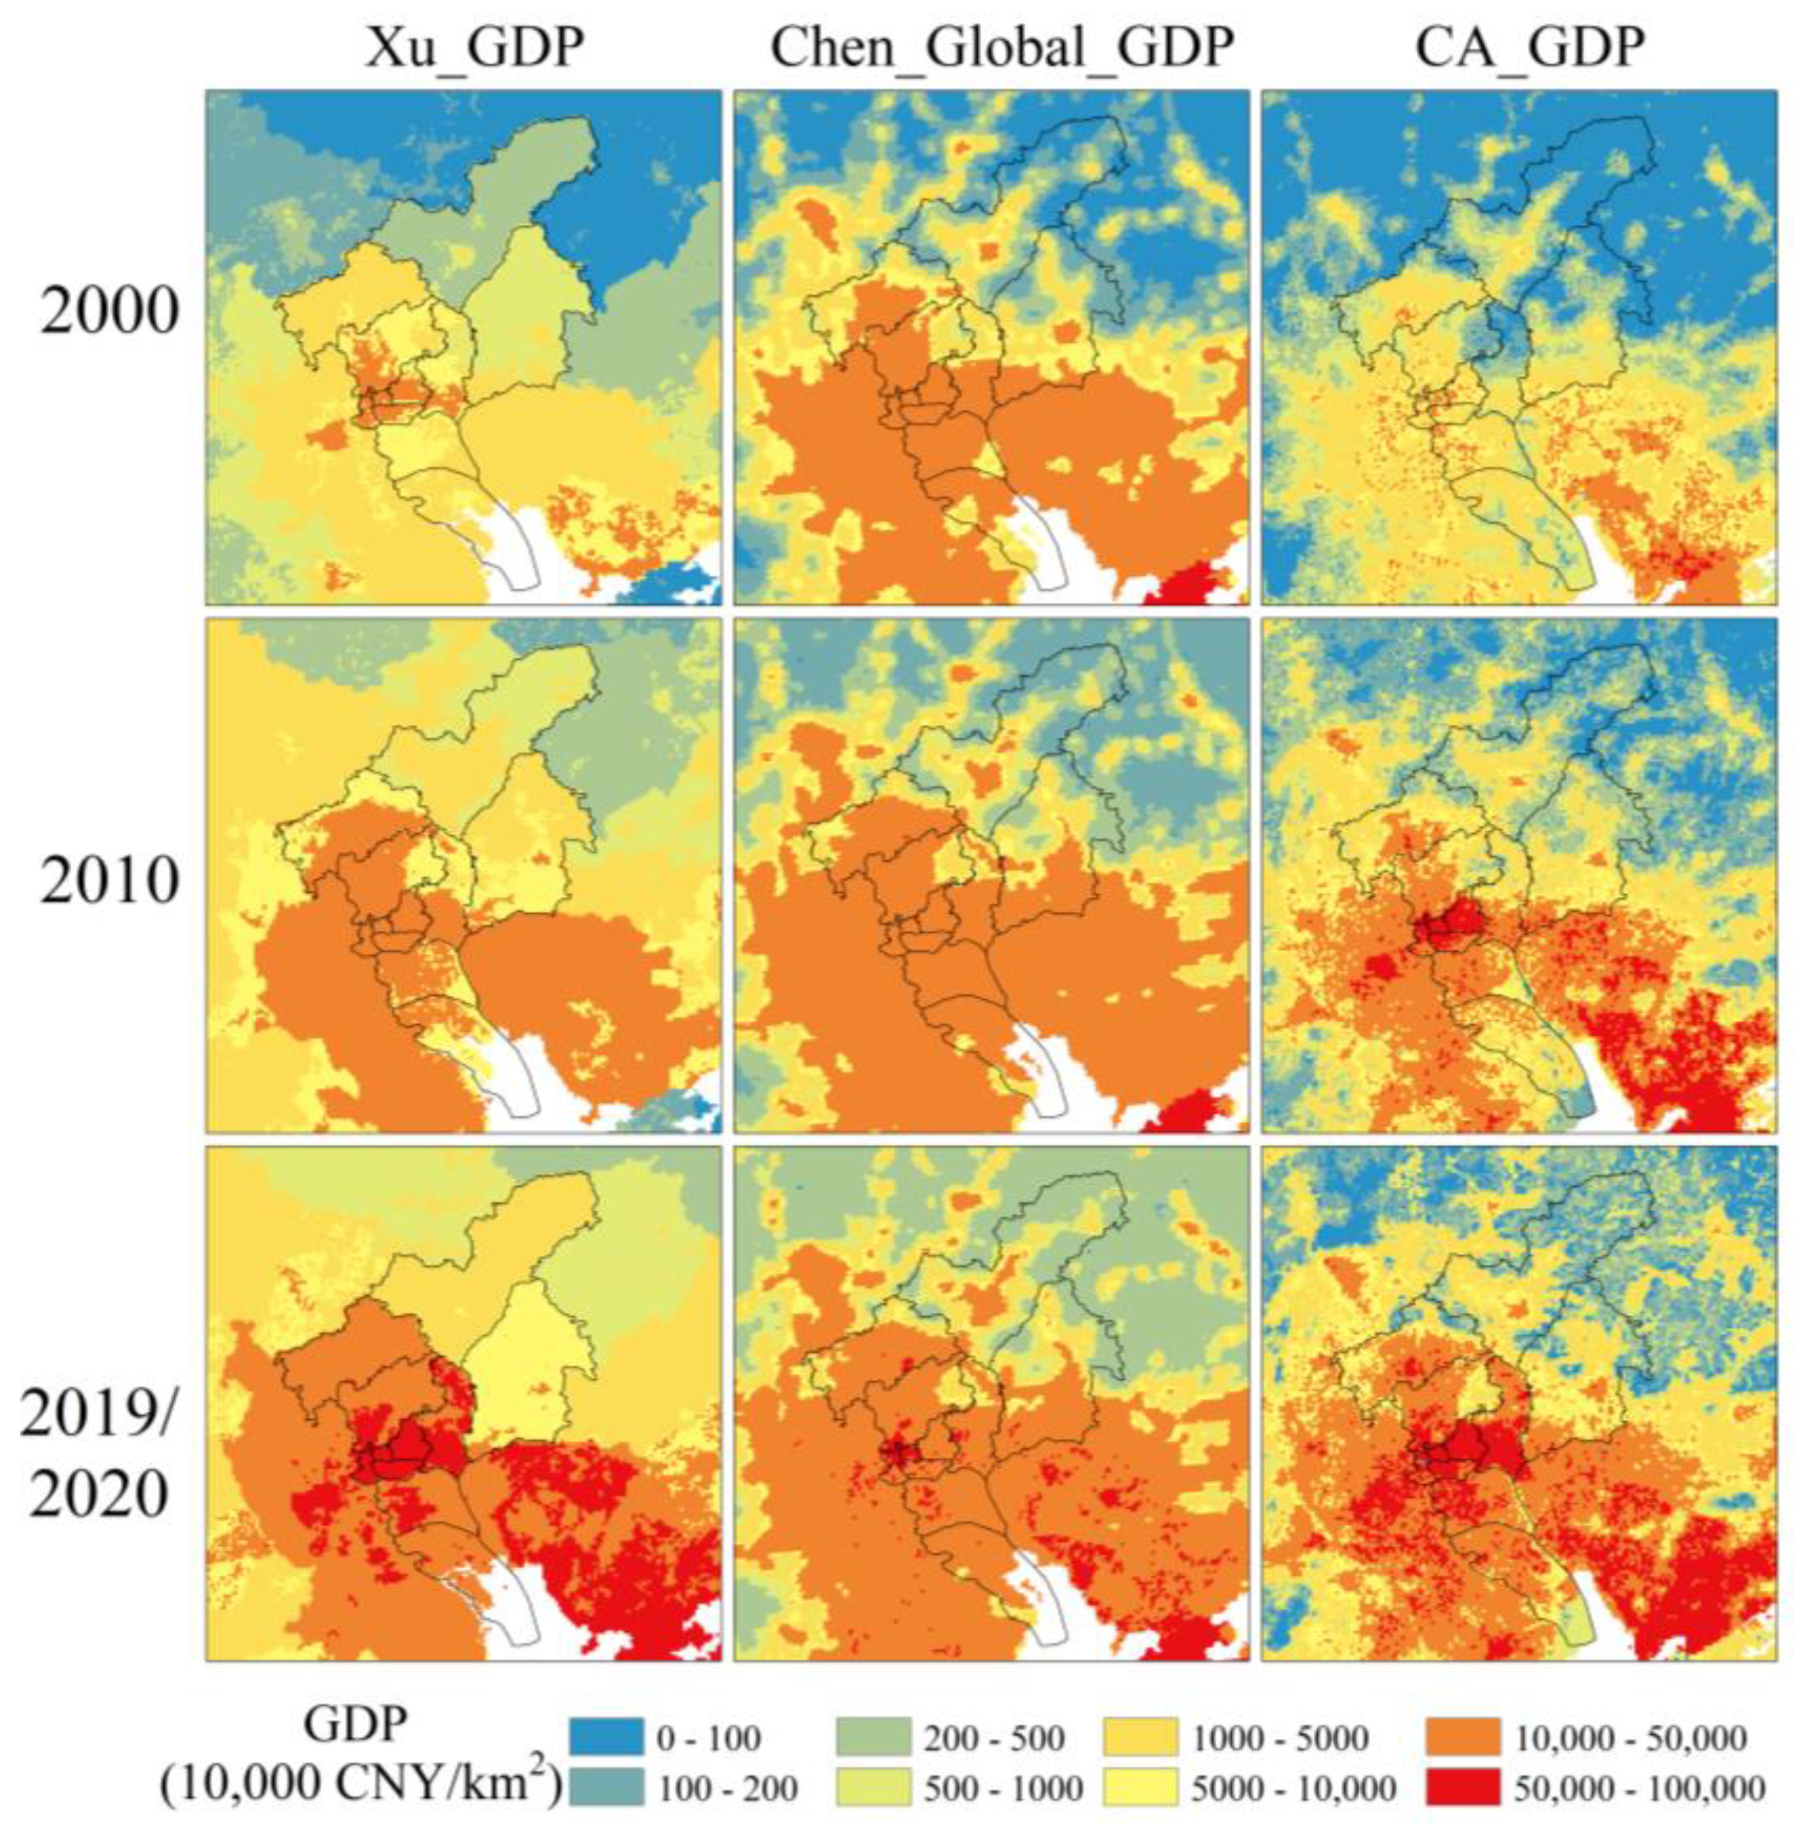
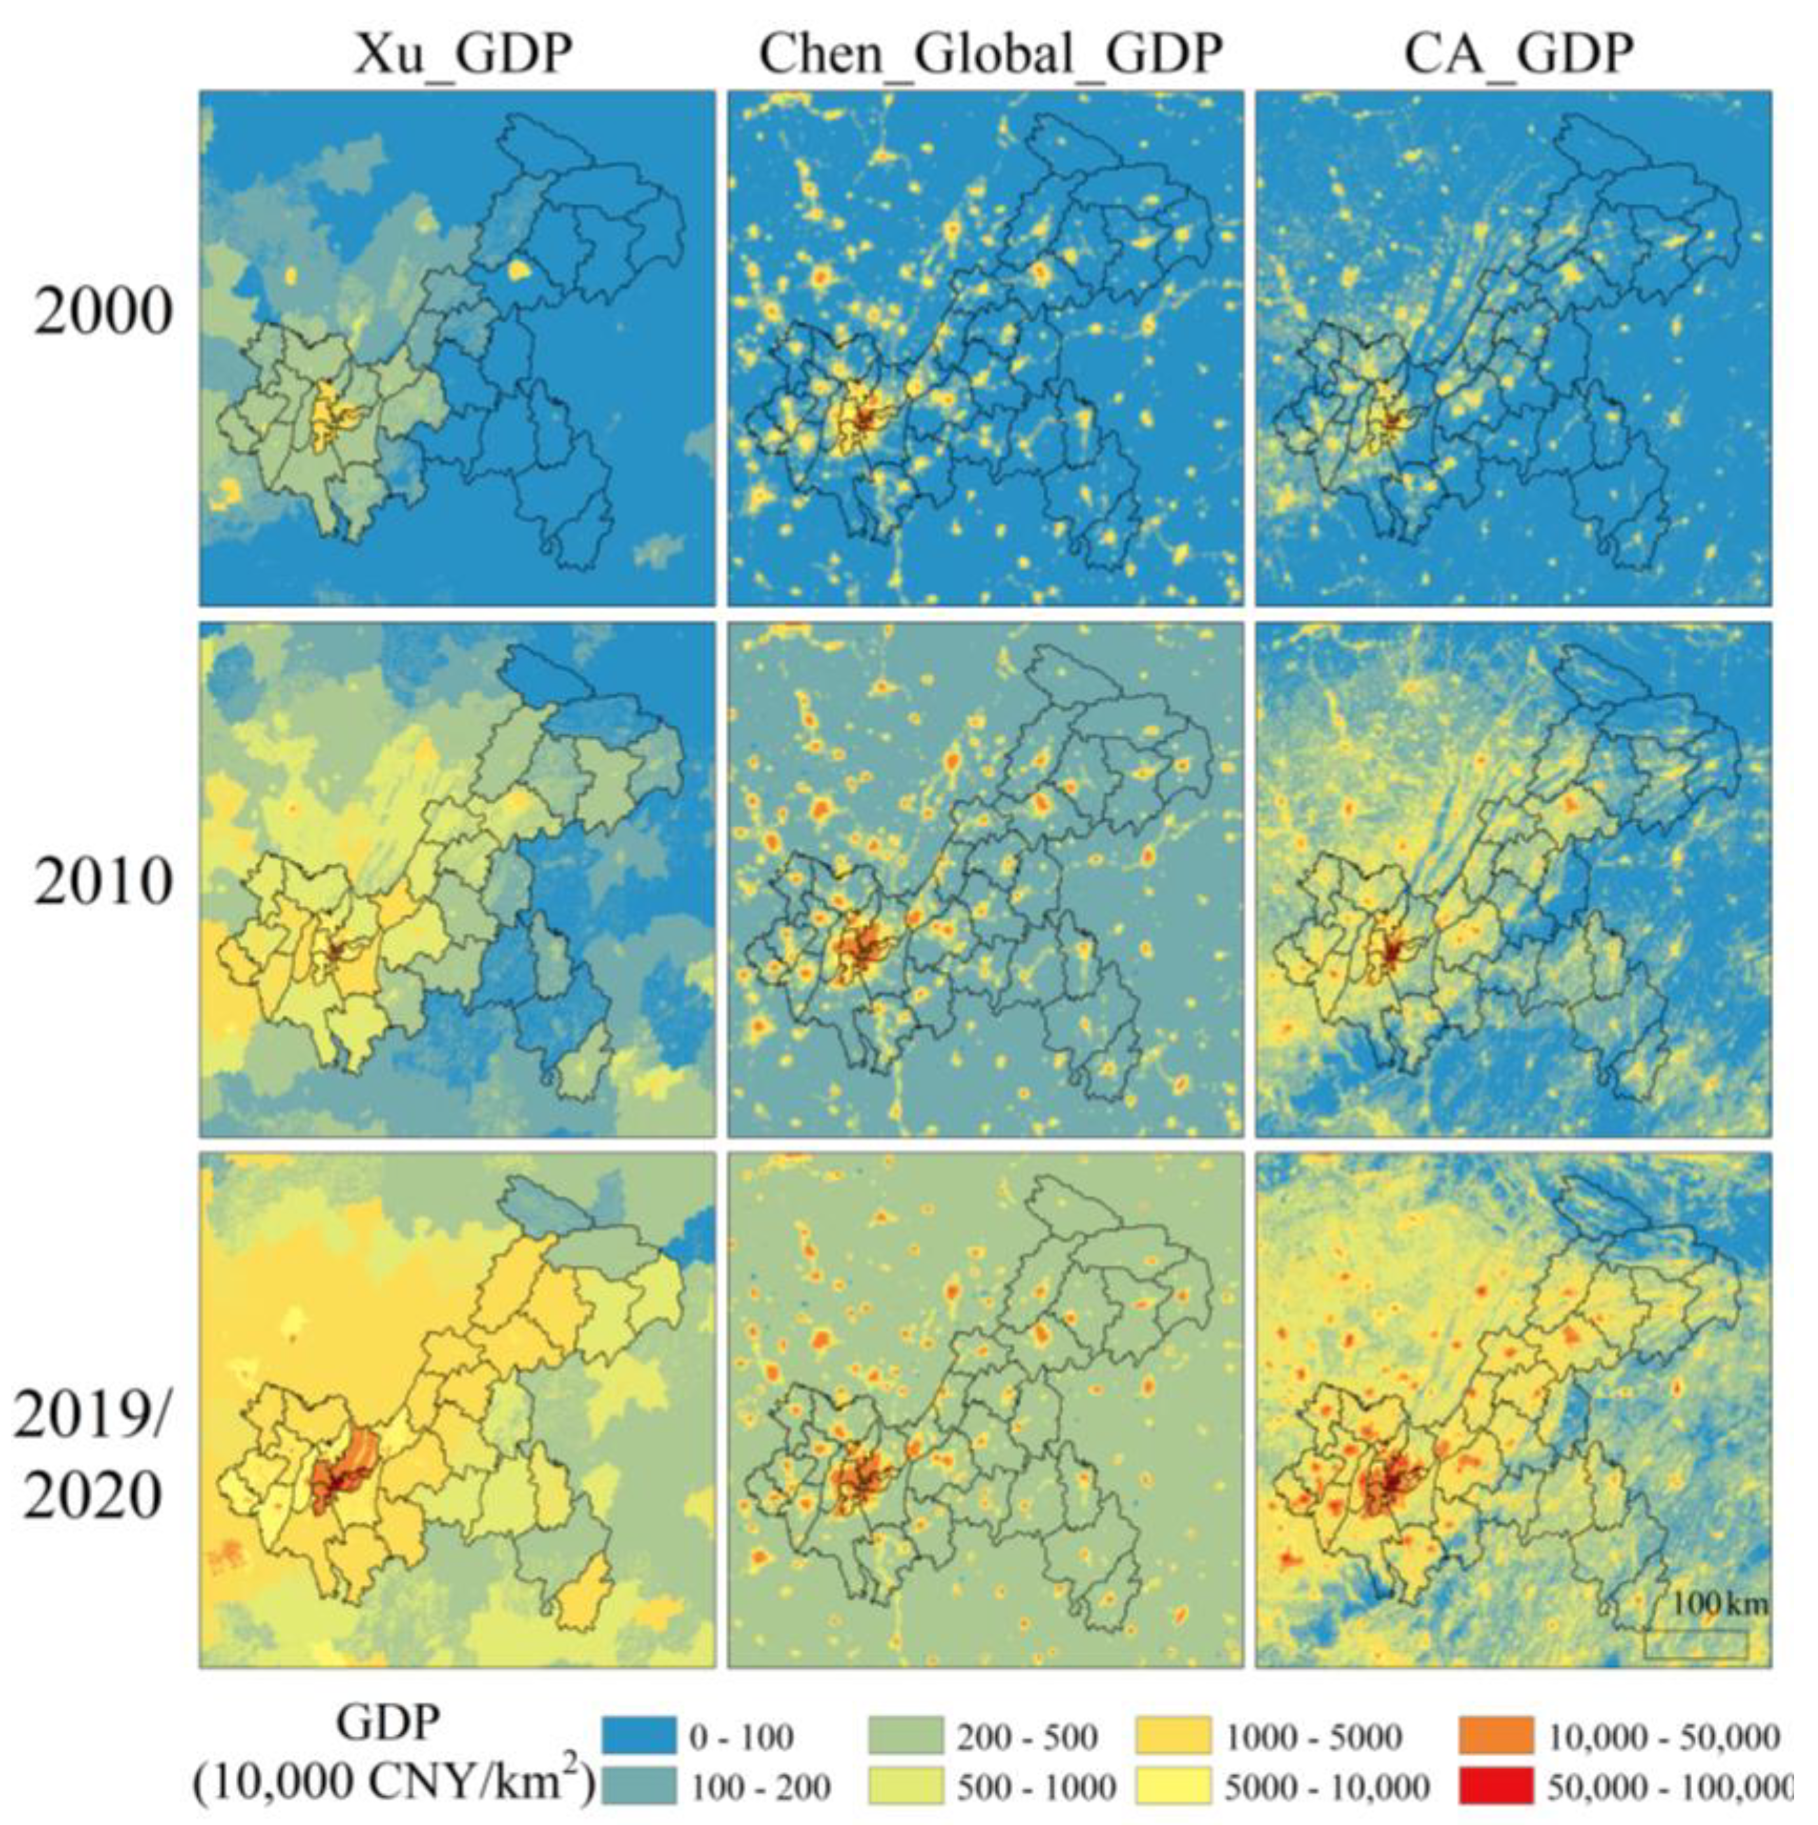
4.1. Comparison with Publicly Available Gridded GDP Datasets
4.2. Advancement of the Method
4.3. Limitations and Future Work
5. Conclusions
Supplementary Materials
Author Contributions
Funding
Institutional Review Board Statement
Informed Consent Statement
Data Availability Statement
Conflicts of Interest
Abbreviations
| GDP | Gross Domestic Product |
| CSFs | Cross-Scale Feature Extraction |
| SDGs | United Nations Sustainable Development Goals |
| CA_GDP | China’s Annual High-Resolution Gridded GDP Dataset |
| R2 | Coefficient of determination |
| MAE | Mean Absolute Error |
| RMSE | Root Mean Square Error |
| NTL | Nighttime Light |
| NDVI | Normalized Difference Vegetation Index |
| NPP | Net Primary Production |
| DEM | Digital Elevation Model |
| GlobPOP | Global Gridded Population |
| CLCD | China Land Cover Dataset |
| SAI | Socioeconomic Allocation Index |
| DBI | Davies–Bouldin Index |
| RF | Random Forest |
| XGBoost | Extreme Gradient Boosting |
| CatBoost | Categorical Boosting |
| LightGBM | Light Gradient Boosting Machine |
| KNN | K-Nearest Neighbors |
| SVR | Support Vector Regression |
| Ridge | Ridge Regression |
| GBDT | Gradient Boosting Decision Tree |
References
- Huang, Z.; Li, S.; Gao, F.; Wang, F.; Lin, J.; Tan, Z. Evaluating the performance of LBSM data to estimate the gross domestic product of China at multiple scales: A comparison with NPP-VIIRS nighttime light data. J. Clean. Prod. 2021, 328, 129558. [Google Scholar] [CrossRef] [Scilit]
- Gu, H.; Chen, C.; Lu, Y.; Chu, Y.; Ma, Y. Construction of regional economic development model based on remote sensing data. IOP Conf. Ser. Earth Environ. Sci. 2019, 310, 52060. [Google Scholar] [CrossRef] [Scilit]
- Wan, H.; Yoon, J.; Srikrishnan, V.; Daniel, B.; Judi, D. Landscape metrics regularly outperform other traditionally-used ancillary datasets in dasymetric mapping of population. Comput. Environ. Urban Syst. 2023, 99, 101899. [Google Scholar] [CrossRef] [Scilit]
- Chen, J.; Li, L. Regional Economic Activity Derived from MODIS Data: A Comparison with DMSP/OLS and NPP/VIIRS Nighttime Light Data. IEEE J. Sel. Top. Appl. Earth Obs. Remote Sens. 2019, 12, 3067–3077. [Google Scholar] [CrossRef] [Scilit]
- Wang, L.; Fan, H.; Wang, Y. Estimation of consumption potentiality using VIIRS night-time light data. PLoS ONE 2018, 13, e0206230. [Google Scholar] [CrossRef] [Scilit]
- Chen, Y.; Zhang, R.; Ge, Y.; Jin, Y.; Xia, Z. Downscaling Census Data for Gridded Population Mapping with Geographically Weighted Area-to-Point Regression Kriging. IEEE Access 2019, 7, 149132–149141. [Google Scholar] [CrossRef] [Scilit]
- Cao, X.; Wang, J.; Chen, J.; Shi, F. Spatialization of electricity consumption of China using saturation-corrected DMSP-OLS data. Int. J. Appl. Earth Obs. Geoinf. 2014, 28, 193–200. [Google Scholar] [CrossRef] [Scilit]
- Leyk, S.; Gaughan, A.E.; Adamo, S.B.; de Sherbinin, A.; Balk, D.; Freire, S.; Rose, A.; Stevens, F.R.; Blankespoor, B.; Frye, C.; et al. The spatial allocation of population: A review of large-scale gridded population data products and their fitness for use. Earth Syst. Sci. Data 2019, 11, 1385–1409. [Google Scholar] [CrossRef] [Scilit]
- Chen, Q.; Hou, X.; Zhang, X.; Ma, C. Improved GDP spatialization approach by combining land-use data and night-time light data: A case study in China’s continental coastal area. Int. J. Remote Sens. 2016, 37, 4610–4622. [Google Scholar] [CrossRef] [Scilit]
- Sutton, P.C.; Costanza, R. Global estimates of market and non-market values derived from nighttime satellite imagery, land cover, and ecosystem service valuation. Ecol. Econ. 2002, 41, 509–527. [Google Scholar] [CrossRef] [Scilit]
- Li, X.; Xu, H.; Chen, X.; Li, C. Potential of NPP-VIIRS Nighttime Light Imagery for Modeling the Regional Economy of China. Remote Sens. 2013, 5, 3057–3081. [Google Scholar] [CrossRef] [Scilit]
- Zhao, M.; Cheng, W.; Zhou, C.; Li, M.; Wang, N.; Liu, Q. GDP Spatialization and Economic Differences in South China Based on NPP-VIIRS Nighttime Light Imagery. Remote Sens. 2017, 9, 673. [Google Scholar] [CrossRef] [Scilit]
- Li, W.; Wu, M.; Niu, Z. Spatialization and Analysis of China’s GDP Based on NPP/VIIRS Data from 2013 to 2023. Appl. Sci. 2024, 14, 8599. [Google Scholar] [CrossRef] [Scilit]
- Zhao, N.; Liu, Y.; Cao, G.; Samson, E.L.; Zhang, J. Forecasting China’s GDP at the pixel level using nighttime lights time series and population images. GISci. Remote Sens. 2017, 54, 407–425. [Google Scholar] [CrossRef] [Scilit]
- Ustaoglu, E.; Bovkır, R.; Aydınoglu, A.C. Spatial distribution of GDP based on integrated NPS-VIIRS nighttime light and MODIS EVI data: A case study of Turkey. Environ. Dev. Sustain. 2021, 23, 10309–10343. [Google Scholar] [CrossRef] [Scilit]
- Li, F.; Mao, L.; Chen, Q.; Yang, X. Refined Estimation of Potential GDP Exposure in Low-Elevation Coastal Zones (LECZ) of China Based on Multi-Source Data and Random Forest. Remote Sens. 2023, 15, 1285. [Google Scholar] [CrossRef] [Scilit]
- Jin, Y.; Ge, Y.; Fan, H.; Li, Z.; Liu, Y.; Jia, Y. Mapping Gross Domestic Product Distribution at 1 km Resolution across Thailand Using the Random Forest Area-to-Area Regression Kriging Model. ISPRS Int. J. Geo-Inf. 2023, 12, 481. [Google Scholar] [CrossRef] [Scilit]
- Liang, H.; Guo, Z.; Wu, J.; Chen, Z. GDP spatialization in Ningbo City based on NPP/VIIRS night-time light and auxiliary data using random forest regression. Adv. Space Res. 2020, 65, 481–493. [Google Scholar] [CrossRef] [Scilit]
- Chen, Q.; Ye, T.; Zhao, N.; Ding, M.; Ouyang, Z.; Jia, P.; Yue, W.; Yang, X. Mapping China’s regional economic activity by integrating points-of-interest and remote sensing data with random forest. Environ. Plan. B Urban Anal. City Sci. 2021, 48, 1876–1894. [Google Scholar] [CrossRef] [Scilit]
- Liu, S.; Liu, W.; Zhou, Y.; Wang, S.; Wang, F.; Wang, Z. Mapping Gridded GDP Distribution of China Based on Remote Sensing Data and Machine Learning Methods. Remote Sens. 2025, 17, 1709. [Google Scholar] [CrossRef] [Scilit]
- Ramaharo, F.; Rasolofomanana, G. Nowcasting Madagascar’s real GDP using machine learning algorithms. arXiv 2023, arXiv:2401.10255. [Google Scholar]
- Chen, Y.; Wu, G.; Ge, Y.; Xu, Z. Mapping Gridded Gross Domestic Product Distribution of China Using Deep Learning with Multiple Geospatial Big Data. IEEE J. Sel. Top. Appl. Earth Obs. Remote Sens. 2022, 15, 1791–1802. [Google Scholar] [CrossRef] [Scilit]
- Doll, C.N.H.; Muller, J.; Morley, J.G. Mapping regional economic activity from night-time light satellite imagery. Ecol. Econ. 2006, 57, 75–92. [Google Scholar] [CrossRef] [Scilit]
- Deng, F.; Cao, L.; Li, F.; Li, L.; Man, W.; Chen, Y.; Liu, W.; Peng, C. Mapping China’s Changing Gross Domestic Product Distribution Using Remotely Sensed and Point-of-Interest Data with Geographical Random Forest Model. Sustainability 2023, 15, 8062. [Google Scholar] [CrossRef] [Scilit]
- Wu, N.; Yan, J.; Liang, D.; Sun, Z.; Ranjan, R.; Li, J. High-resolution mapping of GDP using multi-scale feature fusion by integrating remote sensing and POI data. Int. J. Appl. Earth Obs. Geoinf. 2024, 129, 103812. [Google Scholar] [CrossRef] [Scilit]
- Li, L.; Huang, C.; Zhang, Y.; Liu, L.; Wang, Z.; Zhang, H.; Ding, M.; Zhang, H. Mapping the multi-temporal grazing intensity on the Qinghai-Tibet Plateauusing geographically weighted random forest. Geogr. Sci. 2023, 43, 398–410. [Google Scholar]
- Meng, N.; Wang, L.; Qi, W.; Dai, X.; Li, Z.; Yang, Y.; Li, R.; Ma, J.; Zheng, H. A high-resolution gridded grazing dataset of grassland ecosystem on the Qinghai–Tibet Plateau in 1982–2015. Sci. Data 2023, 10, 68. [Google Scholar] [CrossRef] [Scilit]
- Ma, Y.; Lou, H.; Yan, M.; Sun, F.; Li, G. Spatio-temporal fusion graph convolutional network for traffic flow forecasting. Inf. Fusion. 2024, 104, 102196. [Google Scholar] [CrossRef] [Scilit]
- Mei, Y.; Gui, Z.; Wu, J.; Peng, D.; Li, R.; Wu, H.; Wei, Z. Population spatialization with pixel-level attribute grading by considering scale mismatch issue in regression modeling. Geo-Spat. Inf. Sci. 2022, 25, 365–382. [Google Scholar] [CrossRef] [Scilit]
- Liu, W.; Du, P.; Wang, D. Ensemble Learning for Spatial Interpolation of Soil Potassium Content Based on Environmental Information. PLoS ONE 2015, 10, e0124383. [Google Scholar] [CrossRef] [Scilit]
- Hao, Y.; Tian, C. A novel two-stage forecasting model based on error factor and ensemble method for multi-step wind power forecasting. Appl. Energy 2019, 238, 368–383. [Google Scholar] [CrossRef] [Scilit]
- Nguyen Van, L.; Lee, G. Optimizing Stacked Ensemble Machine Learning Models for Accurate Wildfire Severity Mapping. Remote Sens. 2025, 17, 854. [Google Scholar] [CrossRef] [Scilit]
- Dong, X.; Yu, Z.; Cao, W.; Shi, Y.; Ma, Q. A survey on ensemble learning. Front. Comput. Sci. 2020, 14, 241–258. [Google Scholar] [CrossRef] [Scilit]
- Xu, Z.; Wang, Y.; Sun, G.; Chen, Y.; Ma, Q.; Zhang, X. Generating Gridded Gross Domestic Product Data for China Using Geographically Weighted Ensemble Learning. ISPRS Int. J. Geo-Inf. 2023, 12, 123. [Google Scholar] [CrossRef] [Scilit]
- Chen, Y.; Xu, C.; Ge, Y.; Zhang, X.; Zhou, Y. A 100 m gridded population dataset of China’s seventh census using ensemble learning and big geospatial data. Earth Syst. Sci. Data 2024, 16, 3705–3718. [Google Scholar] [CrossRef] [Scilit]
- Song, Y.; Wu, S.; Chen, B.; Bell, M.L. Unraveling near real-time spatial dynamics of population using geographical ensemble learning. Int. J. Appl. Earth Obs. Geoinf. 2024, 130, 103882. [Google Scholar] [CrossRef] [Scilit]
- Fang, Z.; Wang, Y.; Peng, L.; Hong, H. A comparative study of heterogeneous ensemble-learning techniques for landslide susceptibility mapping. Int. J. Geogr. Inf. Sci. 2021, 35, 321–347. [Google Scholar] [CrossRef] [Scilit]
- Liu, H.; Wang, L.; Wang, J.; Ming, H.; Wu, X.; Xu, G.; Zhang, S. Multidimensional spatial inequality in China and its relationship with economic growth. Humanit. Soc. Sci. Commun. 2024, 11, 1415. [Google Scholar] [CrossRef] [Scilit]
- Ye, T.; Zhao, N.; Yang, X.; Ouyang, Z.; Liu, X.; Chen, Q.; Hu, K.; Yue, W.; Qi, J.; Li, Z.; et al. Improved population mapping for China using remotely sensed and points-of-interest data within a random forests model. Sci. Total Environ. 2019, 658, 936–946. [Google Scholar] [CrossRef] [Scilit]
- Wang, K.; Ji, X.; Liu, S.; Zhu, J.; Liu, K. Harnessing big data for sustainable urban management: A novel approach to gridded urban GDP dataset development. J. Clean. Prod. 2024, 444, 141205. [Google Scholar] [CrossRef] [Scilit]
- Wang, T.; Sun, F. Global gridded GDP data set consistent with the shared socioeconomic pathways. Sci. Data 2022, 9, 221. [Google Scholar] [CrossRef] [Scilit]
- Huang, W.; Deng, Y.; Chen, H.; Hai, Y.; Ma, A.; Duan, M.; Ming, L. Spatiotemporal changes in land use and identification of driving factor contributions in the Chengdu-Chongqing Economic Circle based on the random forest model. Environ. Sci. Pollut. Res. 2025, 32, 18975–18994. [Google Scholar] [CrossRef] [Scilit] [PubMed]
- Lang-Ritter, J.; Keskinen, M.; Tenkanen, H. Global gridded population datasets systematically underrepresent rural population. Nat. Commun. 2025, 16, 2170. [Google Scholar] [CrossRef] [Scilit] [PubMed]
- Liu, L.; Cao, X.; Li, S.; Jie, N. A 31-year (1990–2020) global gridded population dataset generated by cluster analysis and statistical learning. Sci. Data 2024, 11, 124. [Google Scholar] [CrossRef] [Scilit] [PubMed]
- Zheng, Y.; Yang, K.; Wei, C.; Fu, M.; Fan, M. An Improved Cross-Sensor Calibration Approach for DMSP-OLS and NPP-VIIRS Nighttime Light Data. IEEE J. Sel. Top. Appl. Earth Obs. Remote Sens. 2025, 18, 865–877. [Google Scholar] [CrossRef] [Scilit]
- Yang, J.; Huang, X. The 30 m annual land cover dataset and its dynamics in China from 1990 to 2019. Earth Syst. Sci. Data 2021, 13, 3907–3925. [Google Scholar] [CrossRef] [Scilit]
- Chen, J.; Gao, M.; Cheng, S.; Hou, W.; Song, M.; Liu, X.; Liu, Y. Global 1 km × 1 km gridded revised real gross domestic product and electricity consumption during 1992–2019 based on calibrated nighttime light data. Sci. Data 2022, 9, 202. [Google Scholar] [CrossRef] [Scilit]
- Peng, S.; Ding, Y.; Liu, W.; Li, Z. 1-km monthly mean temperature dataset for china (1901–2024). Earth Syst. Sci. Data 2019, 11, 1931–1946. [Google Scholar] [CrossRef] [Scilit]
- Didan, K. MODIS/Terra Vegetation Indices Monthly L3 Global 1 km SIN Grid V061; NASA Land Processes Distributed Active Archive Center: Sioux Falls, SD, USA, 2021. [Google Scholar]
- Running, S.; Zhao, M. MODIS/Terra Net Primary Production Gap-Filled Yearly L4 Global 500 m SIN Grid V061; NASA Land Processes Distributed Active Archive Center: Sioux Falls, SD, USA, 2021. [Google Scholar]
- Yuhui, P.; Yuan, Z.; Huibao, Y. Development of a representative driving cycle for urban buses based on the K-means cluster method. Clust. Comput. 2019, 22, 6871–6880. [Google Scholar] [CrossRef] [Scilit]
- Wolpert, D.H. Stacked Generalization. Neural Netw. 1992, 5, 241–259. [Google Scholar] [CrossRef] [Scilit]
- Dong, J.; Chen, Y.; Yao, B.; Zhang, X.; Zeng, N. A neural network boosting regression model based on XGBoost. Appl. Soft Comput. 2022, 125, 109067. [Google Scholar] [CrossRef] [Scilit]
- Breiman, L. Random Forests. Mach. Learn. 2001, 45, 5–32. [Google Scholar] [CrossRef] [Scilit]
- Chen, T.; Guestrin, C. XGBoost: A Scalable Tree Boosting System; ACM: New York, NY, USA, 2016; pp. 785–794. [Google Scholar]
- Prokhorenkova, L.; Gusev, G.; Vorobev, A.; Veronika Dorogush, A.; Gulin, A. CatBoost: Unbiased boosting with categorical features. arXiv 2019, arXiv:1706.09516v5. [Google Scholar] [CrossRef] [Scilit]
- Ke, G.; Meng, Q.; Finley, T.; Wang, T.; Chen, W.; Ma, W.; Ye, Q.; Liu, T.-Y. LightGBM: A Highly Efficient Gradient Boosting Decision Tree. In Proceedings of the 31st International Conference on Neural Information Processing Systems, Long Beach, CA, USA, 4–9 December 2017; Neural Information Processing Systems Foundation, Inc.: La Jolla, CA, USA, 2017. [Google Scholar]
- Steinbach, M.; Tan, P. kNN: K-Nearest Neighbors; Chapman and Hall/CRC: Boca Raton, FL, USA, 2009; pp. 165–176. [Google Scholar]
- Sun, Y.; Ding, S.; Zhang, Z.; Jia, W. An improved grid search algorithm to optimize SVR for prediction. Soft Comput. 2021, 25, 5633–5644. [Google Scholar] [CrossRef] [Scilit]
- Hoerl, A.E.; Kennard, R.W. Ridge regression: Applications to nonorthogonal problems. Technometrics 1970, 12, 69–82. [Google Scholar] [CrossRef]
- Liang, L.; Xian, Y.; Chen, M. Evolution Trend and Influencing Factors of Regional Population and EconomyGravity Center in China Since the Reform and Opening-Up. Econ. Geogr. 2022, 42, 93–103. [Google Scholar] [CrossRef]
- Hai, W.; Zhao, Z.; Wang, J.; Hou, Z. The Short-Term Impact of SARS on the Chinese Economy. Asian Econ. Pap. 2004, 3, 57–61. [Google Scholar] [CrossRef] [Scilit]
- Naseer, S.; Khalid, S.; Parveen, S.; Abbass, K.; Song, H.; Achim, M.V. COVID-19 outbreak: Impact on global economy. Front. Public Health 2023, 10, 1009393. [Google Scholar] [CrossRef] [Scilit]
- Hu, H. Distribution of population in China. Acta Geogr. Sin. 1935, 2, 33–74. [Google Scholar]
- Xu, X. China GDP Spatial Distribution Kilometre Grid Dataset. Resource and Environmental Science Data Kegistration and Publishing System. 2017. Available online: https://www.resdc.cn/DOI/doi.aspx?DOIid=33 (accessed on 1 July 2025).
- Chen, X.; Nordhaus, W.D. Using luminosity data as a proxy for economic statistics. Proc. Natl. Acad. Sci. USA 2011, 108, 8589–8594. [Google Scholar] [CrossRef] [Scilit]
- Chen, Z.J.; Luo, H.S.; Li, M.T.; Lin, J.Y.; Zhang, X.C.; Li, S.Y. Fine-scale poverty estimation by integrating SDGSAT-1 glimmer images and urban functional zoning data—ScienceDirect. Remote Sens. Environ. 2025, 329, 114925. [Google Scholar] [CrossRef] [Scilit]
- Wang, D.; Xie, Y.; Ma, C.; Zhao, Y.; Yan, D.; Chen, H.; Fu, B.; Wan, G.; Hou, X. Identification of Industrial Heat Source Production Areas Based on SDGSAT-1 Thermal Infrared Imager. Appl. Sci. 2024, 14, 2450. [Google Scholar] [CrossRef] [Scilit]
- Liu, S.; Zhou, Y.; Wang, F.; Wang, S.; Wang, Z.; Wang, Y.; Qin, G.; Wang, P.; Liu, M.; Huang, L. Lighting characteristics of public space in urban functional areas based on SDGSAT-1 glimmer imagery: A case study in Beijing, China. Remote Sens. Environ. 2024, 306, 114137. [Google Scholar] [CrossRef] [Scilit]
- Wu, Y.; Zhang, A. A feature re-weighting approach for relevance feedback in image retrieval. In Proceedings 2002 International Conference on Image Processing, Rochester, NY, USA, 22–25 September 2002; IEEE: New York, NY, USA, 2002; p. II. [Google Scholar]
- Lemaitre, G.; Nogueira, F.; Aridas, C.K. Imbalanced-learn: A python toolbox to tackle the curse of imbalanced datasets in machine learning. J. Mach. Learn. Res. 2017, 18, 1–5. [Google Scholar]



| Data | Data Source | Unit | Resolution | Time Period |
|---|---|---|---|---|
| Population | WorldPop: https://dx.doi.org/10.5258/SOTON/WP00675 GlobPOP: https://zenodo.org/records/11071404 (accessed on 1 July 2025). | People per km2 | 1000 m | 2000–2020, 2021 |
| NLT | https://dataverse.harvard.edu/dataset.xhtml?persistentId=doi:10.7910/DVN/GIYGJU (accessed on 1 July 2025). | nW/cm2/sr | 1000 m | 2020–2021 |
| Land cover | https://zenodo.org/records/12779975 (accessed on 1 July 2025). | / | 30 m | 2000–2021 |
| Electricity Consumption | https://doi.org/10.6084/m9.figshare.17004523.v1 (accessed on 1 July 2025). | MWh | 1000 m | 2000–2019 |
| Temperature | https://data.tpdc.ac.cn/zh-hans/data/71ab4677-b66c-4fd1-a004-b2a541c4d5bf (accessed on 1 July 2025). | °C | 1000 m | 2000–2021 |
| NDVI | https://www.earthdata.nasa.gov/ (accessed on 1 July 2025). | / | 1000 m | 2000–2021 |
| NPP | https://lpdaac.usgs.gov/products/mod17a3hgfv061/ (accessed on 1 July 2025). | kg C/m2 | 500 m | 2001–2021 |
| DEM | https://www.gebco.net/data_and_products/gridded_bathymetry_data/ (accessed on 1 July 2025). | m | 500 m | 2021 |
Disclaimer/Publisher’s Note: The statements, opinions and data contained in all publications are solely those of the individual author(s) and contributor(s) and not of MDPI and/or the editor(s). MDPI and/or the editor(s) disclaim responsibility for any injury to people or property resulting from any ideas, methods, instructions or products referred to in the content. |
© 2026 by the authors. Licensee MDPI, Basel, Switzerland. This article is an open access article distributed under the terms and conditions of the Creative Commons Attribution (CC BY) license.
Share and Cite
Deng, F.; Fan, Z.; Sun, M.; Fu, S.; Cao, X.; Yuan, Y.; Liu, W.; Li, L. Constructing China’s Annual High-Resolution Gridded GDP Dataset (2000–2021) Using Cross-Scale Feature Extraction and Stacked Ensemble Learning. Sustainability 2026, 18, 1558. https://doi.org/10.3390/su18031558
Deng F, Fan Z, Sun M, Fu S, Cao X, Yuan Y, Liu W, Li L. Constructing China’s Annual High-Resolution Gridded GDP Dataset (2000–2021) Using Cross-Scale Feature Extraction and Stacked Ensemble Learning. Sustainability. 2026; 18(3):1558. https://doi.org/10.3390/su18031558
Chicago/Turabian StyleDeng, Fuliang, Zhicheng Fan, Mei Sun, Shuimei Fu, Xin Cao, Ying Yuan, Wei Liu, and Lanhui Li. 2026. "Constructing China’s Annual High-Resolution Gridded GDP Dataset (2000–2021) Using Cross-Scale Feature Extraction and Stacked Ensemble Learning" Sustainability 18, no. 3: 1558. https://doi.org/10.3390/su18031558
APA StyleDeng, F., Fan, Z., Sun, M., Fu, S., Cao, X., Yuan, Y., Liu, W., & Li, L. (2026). Constructing China’s Annual High-Resolution Gridded GDP Dataset (2000–2021) Using Cross-Scale Feature Extraction and Stacked Ensemble Learning. Sustainability, 18(3), 1558. https://doi.org/10.3390/su18031558