Article

Can Digital–Real Economy Integration Enhance Urban Green Innovation Efficiency? Evidence from Environmental and Intellectual Property Regulation Perspectives

1
School of Applied Economics, Guizhou University of Finance and Economics, Guiyang 550025, China
2
Hunan Key Laboratory of Digital Economy and High-Quality Development, Hunan University of Technology and Business, Changsha 410205, China
3
School of Economics and Trade, Hunan University of Technology and Business, Changsha 410205, China
*
Authors to whom correspondence should be addressed.
Sustainability 2026, 18(3), 1306; https://doi.org/10.3390/su18031306
Submission received: 22 August 2025 / Revised: 24 October 2025 / Accepted: 11 November 2025 / Published: 28 January 2026

Abstract

Green innovation efficiency (GIE) serves as a key indicator of urban development toward “dual carbon” goals and sustainable growth. However, systematic evidence remains scarce regarding the impact of the digital-real economy integration (DRI) in urban green innovation efficiency (UGIE). Based on the dual institutional perspectives of government environmental regulation (ER) and intellectual property protection (IPP), this paper proposes an integrated theoretical framework that incorporates integration level, institutional environment, and green innovation. Leveraging panel data from 281 prefecture-level and higher-administered cities in China spanning 2013 to 2023, this paper explores the underlying mechanism and the observed threshold effect of DRI on UGIE. The primary findings are summarized below: (1) DRI promotes UGIE, which is mediated significantly through the institutional roles of ER and IPP. (2) The influence of DRI on GIE is characterized by a threshold effect at a value of 0.9657. Beyond this threshold, the marginal effect rises from 0.47463 to 0.52555, thereby providing evidence for the positive feedback hypothesis between integration level and institutional response. (3) A more significant effect of DRI on GIE could be observed in non-resource-based cities, such as the central cities, southern cities. This paper expands the interdisciplinary research on digital economy and urban sustainability, providing micro-level evidence for the tailored development of digital–green institutional combinations.

1. Introduction

With the deep integration of sustainable development into global urban ecological governance, green innovation has emerged as a central priority in policy agendas worldwide [1]. Rapid economic growth has come with an enormous environmental cost, especially for developing nations. The demands of high-quality economic development can no longer be met by conventional, comprehensive models of economic development, creating an urgent necessity for green innovation and sustainable economic development [2]. As a key driver of economic and social change, the deep integration of the digital economy into the real economy is widely viewed as a key strategic enabler for promoting green transformation [3]. DRI means the deep synergy and restructuring between digital technologies, data elements, and digital platforms with the real economy across dimensions such as factor allocation, production processes, and value creation; this ultimately promotes the efficiency of the real economy and digital transformation [4,5]. Recently, scholars have extensively explored how the digital economy influences green innovation [6,7], while a number of studies have also begun to explore the green effect of DRI [8]. Compared to the level of green innovation, green innovation efficiency (GIE), as a core benchmark of green innovation quality, is a crucial dimension for balancing the multidimensional goals of economy-, environment-, and resource-related coordinated development [9]. However, current research mostly examines how the digital economy affects green innovation from a single angle, paying little attention to the inherent connection between DRI and GIE. Furthermore, the existing literature on the green effects of DRI has focused primarily on the technological dimension [5], overlooking the crucial role of the institutional environment. As the DRI increases, the institutional environment could more effectively channel technological externalities into tangible green innovation outcomes [10], with stronger support and optimized resource allocation. However, the transmission mechanism of the institutional environment in the relationship between DRI and green innovation remains underexplored. Therefore, this paper investigates how DRI and GIE are linked from the perspective of institutional regulation. Such an investigation holds important theoretical and practical significance.
The potentially marginal contributions of this study mostly reside in two facets. First, unlike studies solely from the digital economy perspective [11], this paper employs a DRI perspective to develop an integrated theoretical analysis framework encompassing integration level, institutional environment, and green innovation. Second, from an institutional supervision perspective, this study incorporates environmental regulation and intellectual property protection as institutional-mediating variables, which thereby breaks through the limitations of existing technology-focused research. Also, this paper identifies their transmission role in the chain of DRI and GIE, thereby addressing the shortcomings of existing research that typically analyzes a single institutional-mediating factor [12].
The remaining schedule is as follows: Section 2 reviews the existing literature, synthesizing current research theoretically and empirically. Section 3 delineates the policy context and research hypotheses, establishing a theoretical framework. Section 4 details the research design, which includes the empirical model, data sources, and variable definitions. Section 5 analyzes the empirical level, testing the direct, indirect, and threshold effects of DRI on UGIE. Finally, Section 6 concludes with a summary of findings, corresponding policy recommendations, and an examination of the study’s drawbacks and prospective research avenues.

2. Literature Review

2.1. The Concept and Measurement of DRI

The notion of DRI emerged in the mid-2010s and rapidly became a common term in environmental economics and regional development studies after 2018. Theoretically, Brynjolfsson’s [4] research shows how the production processes are reshaped by digital elements and Perez’s [13] assertion holds that DRI represents a key stage in technology diffusion. These assertions provide a theoretical foundation for DRI. Subsequently, most scholars defined DRI as the integration of key digital components with the real economy, driven by data elements, digital technologies, the platform economy, and digital sharing, which encompasses every stage of the actual economy’s life cycle and manufacturing chain [14]. From a more intuitive perspective, DRI is the fusion of the real and digital economies [15]. The digital economy is a novel economic paradigm that employs data resources as fundamental production and output elements, relies on information technology networks as its principal medium, and applies computer technology applications to enhance economic efficiency and refine economic structure [16]. The real economy refers to the portion of a nation’s economy that produces goods and services, rather than financial services like banking and the stock market [17].
Empirical evidence from the literature indicates that the coupling coordination degree model is the method most frequently used in scholarly study [18,19]. The general practice of the coupling coordination method is to construct an indicator system for the digital economic system and the real economic system, respectively; use the entropy method to assign weights; calculate the coupling and coordination between the two; and finally obtain the coupling coordination [20]. Furthermore, a small number of scholars use input–output approaches to calculate the degree of DRI. Meng et al. (2023) utilized China’s input–output table to identify key sectors of the digital economy [5], including communication equipment and software, and employed the full consumption coefficient method to compute the digital penetration rate for each sector, thereby constructing an industry-level integration index.

2.2. The Concept, Measurement, and Determinants of GIE

Green innovation represents a convergence of innovation theory and sustainable development goals. The core is to create synergistic economic and environmental value through innovations in technology, products, processes, management, or institutions, thereby minimizing resource consumption and negative environmental impacts [21]. Green innovation efficiency (GIE) represents a conceptual extension of the core principle of “efficiency,” applied in the green innovation sphere [22]. Its core objective is to measure how well resource allocation is optimized in the “input–output” relationship within green innovation activities, rather than simply measure the intensity of innovation [23].
Concerning the assessment of GIE, scholars primarily adopt parametric and non-parametric methods. The parametric method was initially proposed by Aigner et al. (1977) and centers on the stochastic frontier production function (SFA) [24]. By defining the production function form and the composite error structure, it separates statistical noise from technical inefficiency, thereby estimating the green technical efficiency of decision-making units [25]. The non-parametric approach is founded on data envelopment analysis (DEA) developed by Charnes et al. (1978) and draws on linear programming concepts to compare homogeneous decision-making units with their frontier projections from a relative efficiency perspective [26,27]. Given that traditional DEA fails to incorporate undesirable outcomes such as environmental pollution and resource depletion into its efficiency evaluation framework, Tone (2001) further formulated a non-radial and non-angular SBM model that directly tackles these issues through slack variables, thereby significantly improving the accuracy of GIE assessments [28]. They have extended the original SBM model to develop a super-efficiency SBM model, which has been the mainstream tool for evaluating GIE [29].
Scholars have primarily examined the factors influencing UGIE by focusing on technological progress [30] and industrial structure upgrading [31]. Regarding technological progress, scholars have consistently confirmed its positive impact on UGIE [32]. In terms of industrial structure, industrial agglomeration exhibits an inverted U-shaped relationship with GIE [33], while industrial transfer has a positive effect on it [34]. Furthermore, some scholars have investigated the drivers of green innovation from the institutional perspective, with a primary focus on the impact of environmental regulations on UGIE [35]. They contend that a robust institutional environment can internalize the environmental externalities by green technologies, thereby boosting firms’ expected returns from such investments [36]. These studies are primarily categorized into the “promotion theory” [37], the “inhibition theory” [38], and the “nonlinear theory” [39]. In addition to environmental regulations, broader institutional arrangements, such as enhanced intellectual property protection, can also promote urban green innovation by lowering the transaction costs associated with green technologies [40].

2.3. The Effect of DRI on Green Innovation

With the booming development of the digital economy, scholars are paying more attention to its green effects. On the theoretical level, there are three main viewpoints on the green innovation effect of the digital economy, namely the “promotion theory”, the “inhibition theory”, and the “nonlinear theory”. First, the “promotion theory” will be examined. Digital economic development significantly improves GIE by optimizing factor allocation, promoting industrial upgrading, and accelerating technological iteration [41]. Second, the “inhibition theory” will be analyzed. In areas with inadequate digital infrastructure or a lack human resources, the digital economy can exacerbate resource distortions and reduce GIE [42]. Third, the “nonlinear theory” will be explored. The threshold model indicates that the positive effect only significantly increases after per capita digital infrastructure, financial development, or human capital exceeds a critical threshold [6]. This suggests that this effect is not static but distinctly nonlinear, posing the challenge of capturing its complexity using traditional linear models alone.
In recent years, scholars have incorporated DRI, rather than singular digital metrics, into their models, thus obtaining certain empirical findings on the green effects of DRI. At the micro-level, empirical evidence shows that for every 1% increase in DRI, corporate green innovation performance improves by 0.222% [8]. At the meso-level, DRI promotes industrial green transformation through green technology and scale effects [5]. A 1% increase in DRI leads to an average 1.41% increase in the efficiency of industrial technological upgrading. At the macro level, DRI reduces transaction costs and promotes industrial restructuring, thereby ultimately enhancing the city’s capability for urban green innovation and green total factor productivity (GTFP) [20,43].
The current literature predominantly addresses the influence of the digital economy on UGI, but little research examines the influence of DRI on GIE. The impact of institutions like ER and IPP on green innovation cannot be underestimated [44]. Concerning the mechanisms of action, there is no consensus on the influence of the digital economy on green innovation, with three competing hypotheses. Consequently, in-depth exploration and systematic analysis of how DRI affects GIE, especially regarding potential threshold characteristics at the integration level, are insufficiently proposed.
Therefore, employing a dataset of 281 Chinese cities spanning from prefectural to higher tiers, from 2013 to 2023, the paper suggests a composite metric framework encompassing the digital and real economies. First, the coupling coordination degree model is employed to assess the development level of DRI. Subsequently, a two-way fixed-effects model is adopted to examine the transmission mechanism through which DRI influences GIE, treating government environmental regulation (ER) and intellectual property protection (IPP) as institutional-mediating variables. Finally, a threshold regression model is utilized to identify potential nonlinear threshold effects.

3. Policy Context and Study Assumptions

3.1. Policy Context

The ongoing evolution of China’s DRI policy serves as a pivotal institutional mechanism not only for driving the digital transformation of industries but also for improving DRI and GIE. The policy has evolved through four phases, as shown in Table 1. Its core logic has progressively shifted from isolated technology applications to a systemic framework that integrates technology, data, and ecosystem collaboration. Deeply ingrained objectives like resource allocation optimization, energy efficiency enhancement, and green technology innovation are all closely tied to this process.
(1) The initial stage (before 2017) focuses on building a digital foundation for manufacturing. By popularizing industrial software- and cloud-based access to production equipment, it enhances the digitalization of R&D and design tools as well as production process accuracy, and reduces energy consumption. This lays a technical foundation for subsequent DRI and green innovation.
(2) The foundational stage (2017–2019) centers on establishing the industrial Internet system by developing an integrated infrastructure that encompasses network, platform, and security. In 2019, the industrial Internet platform interconnected over 73 million devices, achieving data interoperability across different devices and systems, which also scaled up DRI from initial technical pilots to full-scale, systemic deployment.
(3) The improvement stage (2020–2022) is characterized by breakthroughs in data systems and the establishment of macro goals. These systemic advances, such as data property rights and circulation transactions, will propel the data factor market to exceed 80 billion yuan in 2022, while the benefits of data-driven improvements in GIE will become increasingly evident.
(4) The deepening stage (2023 to present) focuses on the large-scale application of data factors and their integration with AI. The relevant policies in this period exhibit a balance between supply and demand. With data deeply embedded across 30 industries and contributing 67.6% to investment growth in 2024, a comprehensive shift has been marked by the policy framework towards the dual objectives of high quality and sustainable development.

3.2. Study Assumptions

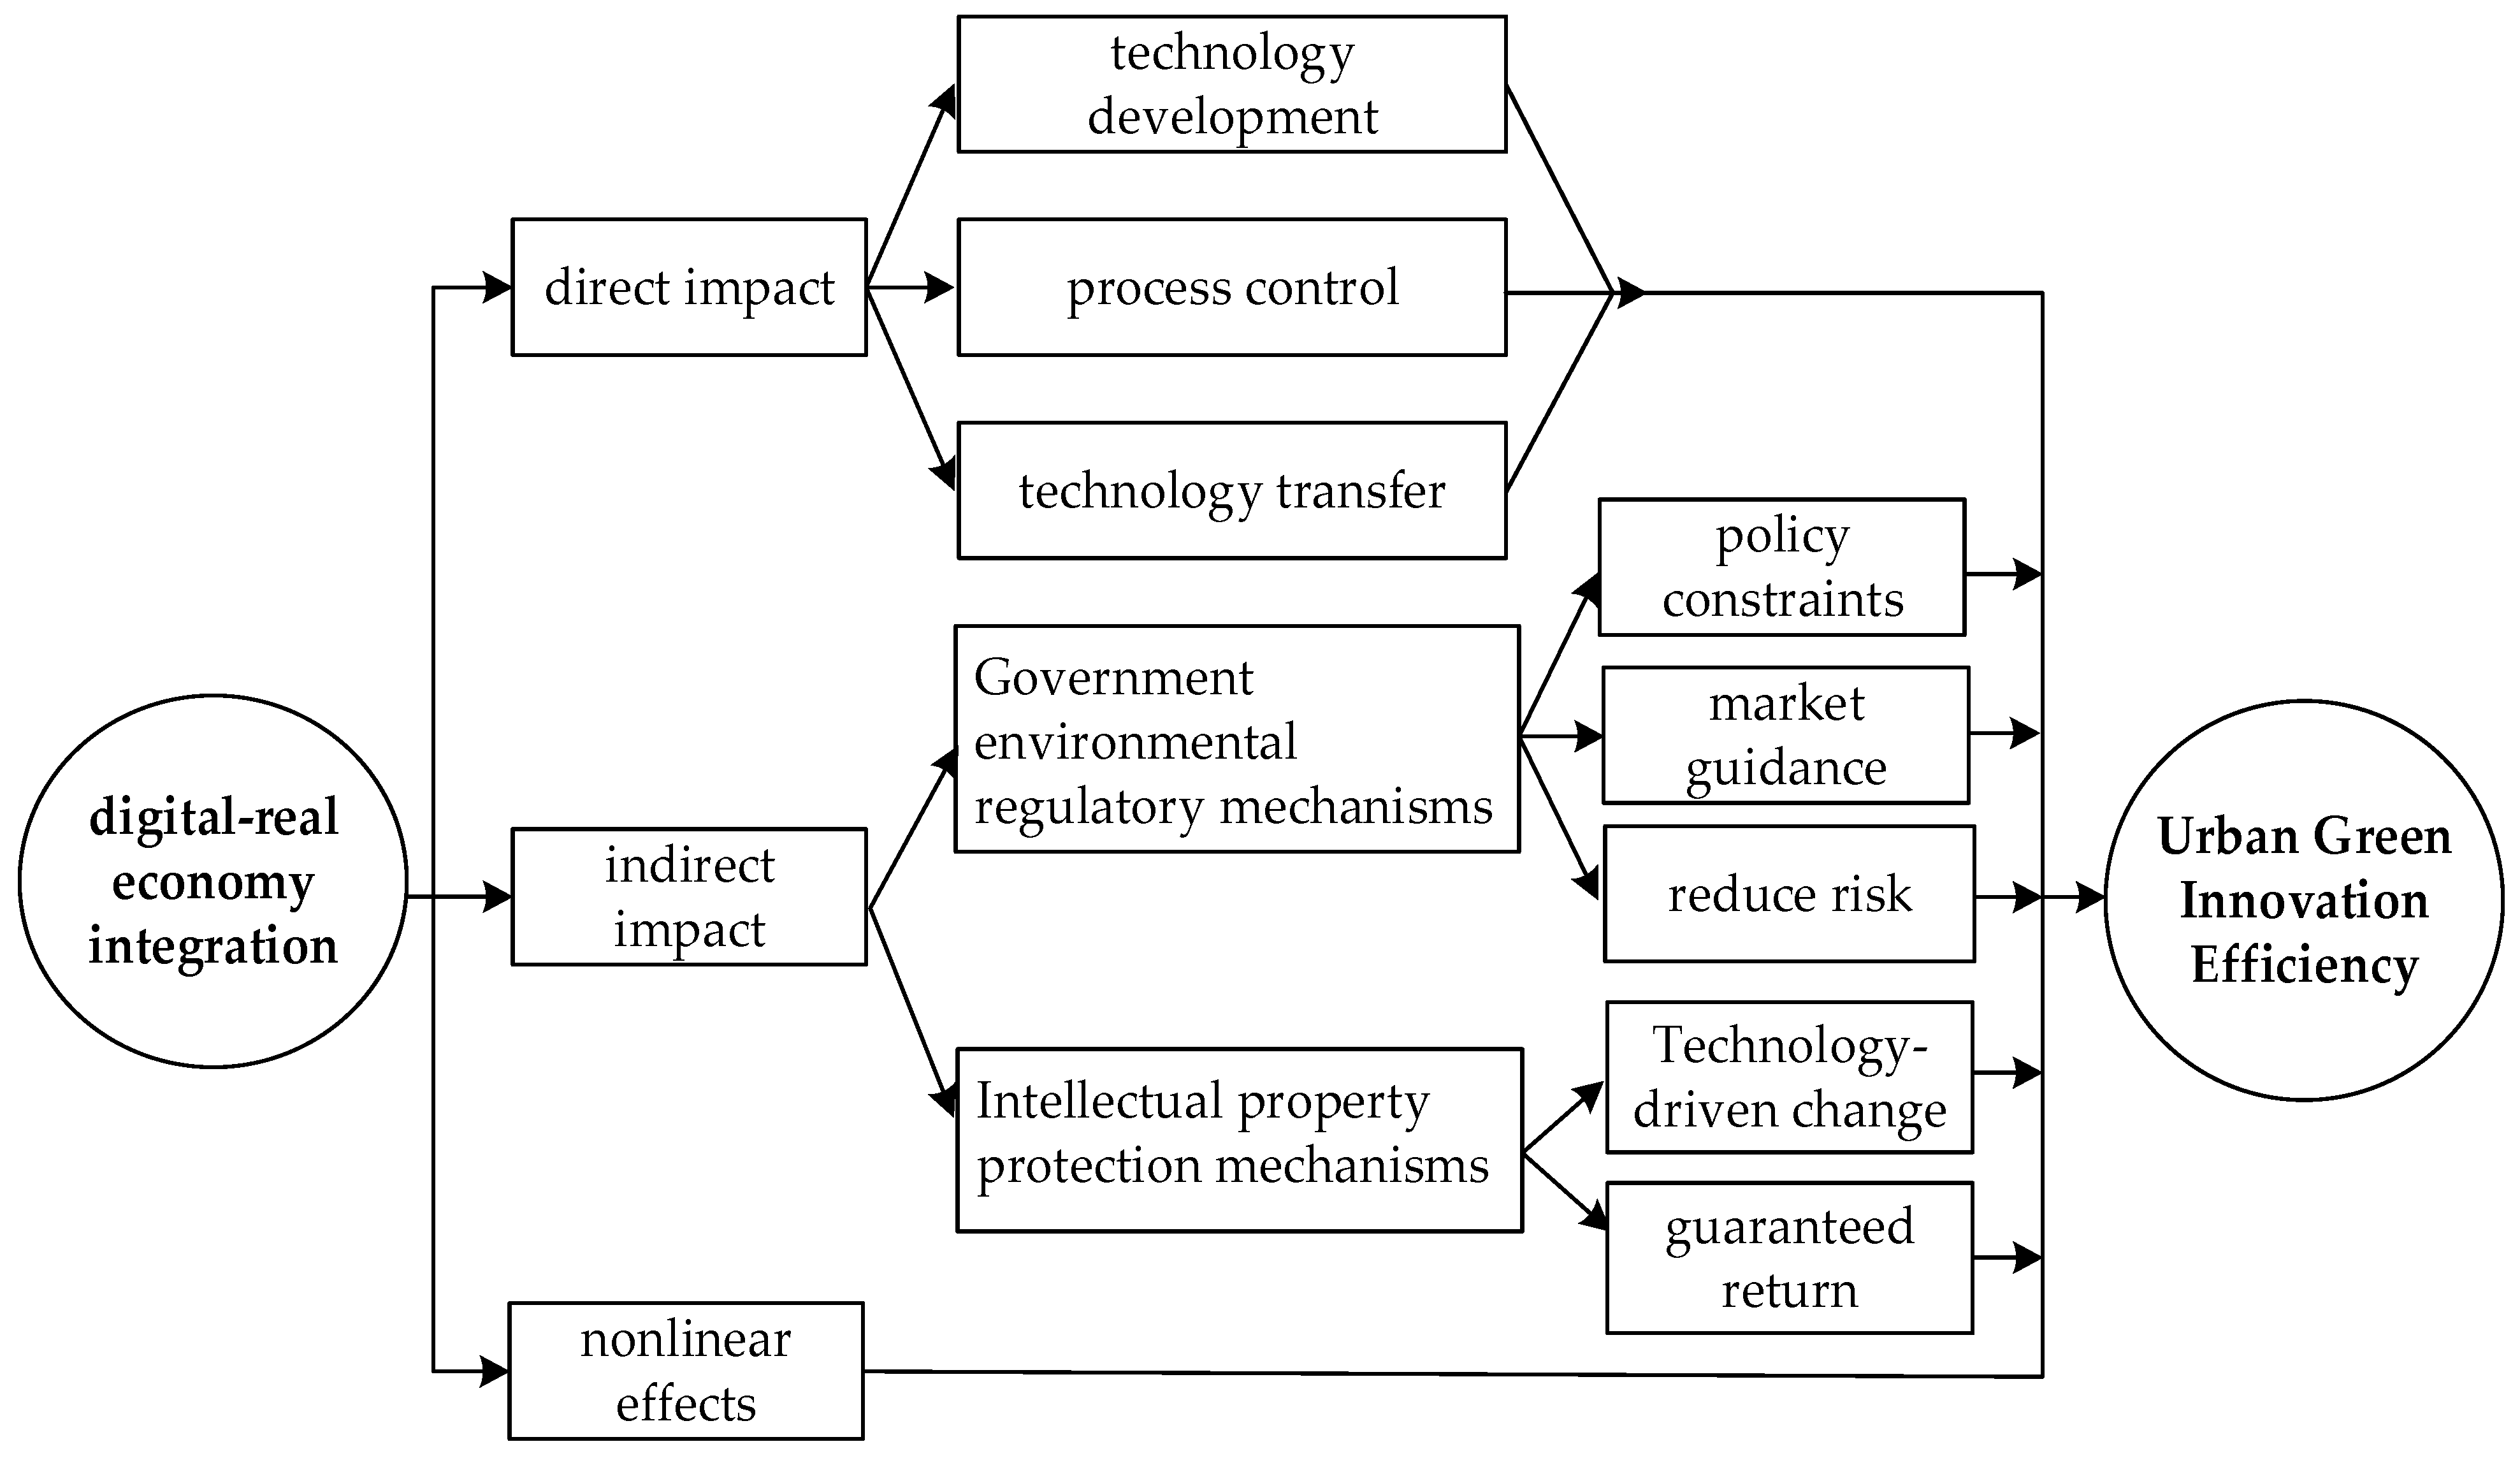
Figure 1 depicts the direct and indirect impacts of DRI on UGIE. First, by integrating digital technologies and other elements with the real economy, DRI directly impacts UGIE across three technological dimensions, which are R&D, process control, and technology transformation. Second, DRI can indirectly impact UGIE through ER and IPP. Third, DRI exerts a nonlinear impact on UGIE.

3.2.1. The Direct Impact of DRI on UGIE

UGIE is centered on green technology research and development and low-carbon result transformation, achieving coordinated development of the innovation process and ecological protection. It has the characteristics of technicality, low carbon, and high efficiency. DRI can directly improve UGIE in multiple ways. From a technological R&D perspective, digital technology is directly integrated into the innovation processes of the real economy. Artificial intelligence accelerates the screening and optimization of green patents, such as simulating molecular structures through algorithms in photovoltaic material R&D to shorten experimental cycles [11]; the industrial internet enables remote sharing of R&D equipment, allowing dispersed innovation entities to collaborate in real time, directly improving technological breakthrough efficiency [45]. From the perspective of process control, digital tools are directly embedded in the entire green innovation process. Big data facilitates real-time surveillance of energy usage metrics in research and development activities, while intelligent algorithms dynamically optimize resource allocation [46]. The Internet of Things enables precise control of low-carbon process parameters, directly reducing carbon emissions during the innovation process and achieving simultaneous progress in innovation and environmental protection [47]. From the perspective of technology transfer, DRI establishes a direct channel from “laboratory to production line” for green innovation. Digital twin technology enables virtual testing of new energy equipment, reducing energy consumption and emissions during physical testing [48]. Blockchain technology records green technology intellectual property information, directly shortening transaction processes and accelerating the rapid implementation of urban innovation outcomes [49].
Consequently, the subsequent research hypothesis is put forth:
Hypothesis 1:
DRI helps to promote UGIE.

3.2.2. Indirect Impact of DRI on UGIE

Institutional theory posits that institutions serve to constrain and shape organizational behavior [50]. As DRI advances, policymakers are harnessing technologies, including artificial intelligence, big data, and blockchain, to strengthen environmental regulation and reform the intellectual property system, thereby providing greater space for corporate innovation. The conducive institutional environment in this process plays a key intermediary role in transforming the technological momentum of DRI into potential energy for innovation.
(1)
Government Environmental Regulatory Mechanisms
DRI provides precise support for government environmental regulation (ER) through technology empowerment and data-driven approaches [51]. Digital technology can monitor enterprise production and environmental data in real time, driving improvements in resource utilization efficiency [8], overcoming the lag in traditional pollution control, and directly promoting higher industry emission standards. Governments can formulate targeted environmental policies based on precise data, forming a closed-loop system of “technical monitoring—standard improvement—policy tightening” [52], compelling enterprises to optimize production.
Strengthened ER promotes GIE through three pathways. First, regarding policy constraints, enterprises need to increase R&D in emissions reduction and energy-saving technologies [53], forming a “compliance pressure-innovation investment-efficiency improvement” model. Second, in terms of market guidance, digital systems provide dynamic feedback on policy effectiveness [54,55], directing resources toward low-carbon sectors. Consumer preferences also compel companies to increase green investments [56], validating the central point of the “Porter hypothesis”, which is that ER of appropriate intensity can incentivize companies to offset compliance costs through innovation. Third, in terms of technological pressure, digital monitoring increases pollution costs, forcing firms to invest in pollution control technologies [57], while firms leverage digital technologies to formulate innovation strategies, creating a virtuous cycle58 [58]. In summary, DRI drives the upgrading of ER through technological empowerment, while ER, through multiple mechanisms including policy, market, and technology, becomes the core catalyst for enhancing GIE [7].
Consequently, the subsequent research hypothesis is put forth:
Hypothesis 2:
DRI can enhance UGIE by improving environmental regulation effectiveness.
(2)
Intellectual Property Protection Mechanisms
The enhancement of DRI promotes improvements in intellectual property protection (IPP) levels [59]. In the process of DRI, the extensive utilization of digital technology has made the creation and circulation of key resources such as brands, technology, and copyright more frequent, objectively requiring a more comprehensive IPP mechanism to preserve the rightful rights and interests of innovative businesses [60]. At the same time, the production model transformation and active innovation activities brought about by DRI will also prompt all sectors of society to place greater emphasis on IPP, driving the improvement in relevant systems and strengthening enforcement efforts.
Enhancing IPP fosters essential incentives for green innovation endeavors. High-level IPP can incentivize urban entities to increase investments in green innovation by punishing infringement, fostering a favorable innovation environment, reducing innovation risks, and facilitating innovation transactions [61]. This helps mitigate issues arising from excessive imitation that undermine innovation incentives, thereby effectively translating green innovation into economic and environmental benefits [62]. Urban entities can derive stable returns from the exclusivity of digital patent rights, thereby engaging more actively in green innovation practices in production activities and improving GIE [63].
Consequently, the subsequent research hypothesis is put forth:
Hypothesis 3:
DRI can promote UGIE by improving the intellectual property protection system.

3.2.3. The Nonlinear Impact of DRI on UGIE

The influence of DRI on UGIE demonstrates a nonlinear effect [64]. As the degree of integration rises, the digitalization of the real economy deepens, further optimizing resource allocation and improving production efficiency. Additionally, various basic activities closely related to the digital economy, through penetration and diffusion within the real economy, can continuously generate more categories of basic activities, thereby enabling market entities to achieve increasing returns to scale. This reduces environmental pollution while creating greater social and economic benefits, thereby continuously enhancing the role of green economic efficiency [65]. The threshold effect emerges during the integration process based on its depth. When the degree of integration is minimal, digital technology is only sporadically embedded in green innovation processes, resulting in weak synergistic effects. However, once a critical threshold is crossed, digital elements deeply penetrate the entire innovation process, triggering effects such as resource synergy and the restructuring of innovation networks, significantly altering the intensity and pathways of these effects, and exhibiting nonlinear improvements 7. Additionally, urban heterogeneity, such as differences in resource-based and non-resource-based city attributes, moderates these effects. Resource-based cities, due to issues like industrial lock-in, exhibit weaker efficiency improvements during the early stages of integration, but their effects accelerate as digital technology addresses green transformation bottlenecks [52]. Non-resource-based cities may enter the high-efficiency area faster due to stronger innovation foundations, yet they may also face constraints from digital resource saturation, leading to changes in marginal effects. Both types of cities collectively result in the overall effects exhibiting nonlinearity [66]. Additionally, at the level of innovation ecosystem evolution, integration drives the ecosystem from a “scattered layout” to “systemic synergy.” Initially, it only optimizes local resources, with limited impact on overall efficiency. However, once a closed-loop ecosystem is established with the integration of data sharing, collaborative R&D, and results dissemination, GIE undergoes nonlinear growth driven by internal positive feedback loops [67]. These dimensions collectively constitute the nonlinear relationship between DRI and UGIE. Consequently, the subsequent research hypothesis is put forth:
Hypothesis 4:
The impact of DRI on UGIE exhibits nonlinear characteristics.

4. Research Design

4.1. Main Variables and Descriptions

4.1.1. Dependent Variable

The dependent variable is urban green innovation efficiency (UGIE). To ensure the scientific validity of measurement results, this study builds upon prevailing approaches in the field by employing the super-efficiency SBM model to evaluate UGIE [68]. The traditional SBM model addresses the input–output slack issue inherent to the DEA method and incorporates unexpected outputs. Based on this foundation, the super-efficiency SBM model further decomposes and compares efficiency values, thus yielding more accurate measurement outcomes. The following is the evaluation model:
min ρ = 1 1 m i = 1 m s i x i 0 1 + 1 s 1 + s 2 k = 1 s 1 s k + y k 0 + l = 1 s 2 s l z l o
j = 1 , j 0 n λ j x i j x i 0 s i i j = 1 , j 0 n λ j y k j y k 0 + s k + k j = 1 , j 0 n λ j z l j z l 0 s l l λ j 0 , s i 0 , s k + 0 , s l 0
In Formula (1), m, s 1 , and s 2 denote the quantity of input indicators, expected outputs, undesired outputs, respectively. x i 0 , y k 0 , and z l 0 are the input, expected output, and unexpected output values of the evaluated city, respectively. The slack variables for input, expected output, and unexpected output are denoted by s i , s k + , and s l , respectively. ρ denotes the efficiency value. If ρ > 1, it indicates that the city still has an efficiency advantage outside the reference set. Formula (2) is the constraint condition that excludes the influence of the evaluated city (j ≠ 0) on the reference set, ensuring that the efficiency value can truly reflect the super efficiency level.
The core of GIE lies in achieving the dual goals of economic growth and environmental cost reduction through optimal resource input. Therefore, the selection of indicators in this paper is guided by the comprehensive framework of the green innovation process, encompassing resource input, economic performance, and environmental impact. The input side encompasses labor, capital, and energy, and the output side explicitly differentiates between desired and unexpected outputs to ensure measurement reliability. The specific indicator evaluation system for GIE is shown in Table 2.

4.1.2. Core Explanatory Variables

The core explanatory variable is digital–real economy integration (DRI). Following the approach of Shi D et al. (2023) [69], this paper uses the city’s digital–real economy integration coupling index to measure this. DRI is characterized by the deep synergy and restructuring of the digital economy with the real economy. The coupling coordination model quantifies the intensity of their interaction and the level of coordinated development. It effectively captures the depth and quality of DRI to ensure that measurements are more scientific.
Given the equal importance of the digital economy and the real economy in fostering the sustainable development of China’s economy, this paper assigned equal weights of 0.5 to both systems. Each individual indication in the model is also given a value using a straightforward equal weighting technique. The academic community generally accepts this approach since it is clear and free of subjective prejudice. Regarding digital economy measurement, we refer to the methodological framework by the Organization for Economic Cooperation and Development (OECD) outlined in “Digital Economy Outlook 2017”. Building on existing research, this paper proposes the framework to incorporate four key dimensions as secondary indicators: “digital infrastructure,” “industry digitization,” “digital user engagement,” and “practical digital applications”. These dimensions collectively cover the technological foundation, core industrial sectors, market ecology, and penetration breadth of digital economy, thus forming a coherent and scientific structure. When examining the real economy, the analysis breaks it down into core sectors of agriculture, industrial production, construction, and transportation/telecommunications infrastructure, based on China’s national economic industry classification, thus resulting in comprehensive industry coverage. The specific indicator evaluation system is shown in Table 3. The formulas for calculating the coupling degree of DRI are as follows:
C = U 1 U 2 U 1 + U 2
In Equation (3), C represents the DRI degree, U 1 measures the level of progress within the digital economic sector, and U 2 indicates the real economy’s developmental progress.

4.1.3. Control Variables

The article at hand predominantly cites the work of Dong F et al. (2021) to set the following control variables: (1) Financial development level (FIN) is presented as the proportion of year-end loans and deposits of bank accounts to the city’s gross domestic output (GDP). (2) Human capital level (HUM) is measured as the year-end count of full-time undergraduate and vocational students divided by the total year-end population. (3) Government intervention level (GOV) is calculated as government fiscal expenditure divided by urban GDP. (4) Foreign direct investment (FDI) refers to the annual total of cross-border capital investments (excluding investments made in the establishment of foreign-invested enterprises in the same year). (5) Per capita GDP is calculated as GDP divided by the permanent resident population in the current year [70].

4.1.4. Mediating Variables

This paper selects mechanism variables from two aspects, namely government environmental regulation (ER) and intellectual property protection (IPP). The first is ER. Making reference to the approach of Zhang Jianpeng and Chen Shiyi (2021), 27 terms were chosen from the facets of safeguarding the environment, encompassing objectives, target entities, and strategies [71]. The proportion of the usage of these environmental phrases to that of terms in urban government work reports was employed to assess government environmental regulation. The second is IPP. Under the guidelines of WIPO et al. (2018), we used the number of intellectual property cases adjudicated by the local people’s court to gauge the city-level IPP [72]. Simultaneously, the city’s GDP was used under de-scaling treatment to compare the level of IPP at the city level.

4.2. Data Sources and Descriptive Statistics

For this research, we drew heavily on data from key sources, including the China Statistical Yearbook, the China Urban Statistical Yearbook, and various provincial and municipal statistical publications. We also tapped into the expertise of the Digital Currency Research Institute at Peking University and leveraged resources from the China Research Data Service Platform to round out our dataset. For some years, data for certain prefecture-level cities was missing, so this study used linear interpolation to fill in the gaps, ultimately obtaining 11 years of balanced panel data for 281 prefecture-level municipalities in China from 2013 to 2023. The specific meanings of each variable and descriptive statistics are presented in Table 4.

4.3. Model Setting

4.3.1. Benchmark Regression Model

According to the earlier analysis, in order to investigate how DRI affects UGIE, and considering the existence of unobservable factors in the model that remain constant at the city level across time and unobservable immutable factors at the individual level, we adopt a bidirectional fixed-effect model to explore how the development of DRI directly affects UGIE. The specific formula is as follows:
GIE i ,   t = β 0 + β 1 DRI i ,   t + δ N i ,   t + μ t + σ i + ε i ,   t
In this Formula (4), GIE i ,   t denotes the UGIE of city “i” in year “t”; DRI i ,   t manifests the DRI coupling degree index of city “i” in year “t”; β 0 is the intercept term of the model, while β 1 is the coefficient of the DRI coupling degree index, reflecting its impact on UGIE; N i , t represents the control variables, including the degree of financial development (expressed as the year-end deposit and loan balance of financial institutions divided by the city’s GDP), human capital level, degree of government intervention, actual foreign investment, and per capita GDP. In addition, μ t , σ i , and ε i ,   t represent the time-fixed effect, the city-fixed effect, and the random error term, respectively.

4.3.2. Mediating Effect Model

Given the inherent limitations of the traditional three-step approach for testing mediation effects, this paper employs the two-step method following Dell (2010) [73]. Based on the existing literature that has verified the positive effect of ER and IPP on GIE [74,75], we directly examine the impact of DRI on both ER and IPP and construct a mediation model, as shown in Formula (5):
M i ,   t = β 0 + β 1 DRI i ,   t + δ N i ,   t + μ t + σ i + ε i ,   t
In this model (5), M i , t represents a series of intermediary variables, including ER and IPP. The rest of the variables retain the same definitions as those in Formula (4).

4.3.3. Threshold Effect Model

To verify Hypothesis 4, this paper constructs the following threshold effect model:
G I E i ,   t = β 0 + β 1 DRI i ,   t I   q ,   t + β 2 DRI i , t I q i ,   t > γ + δ N i ,   t + μ t + σ i + ε i ,   t
Among them, q i ,   t are threshold variables, and the selected threshold variable is DRI. γ is the threshold value; I (·) is the indicator function; the rest of the variables retain the same definitions as those in Formula (4).

5. Empirical Analysis

5.1. Benchmark Regression Analysis

As shown in Table 5, the estimated coefficients of the DRI coupling index in the quadratic regression are all significantly positive, indicating that as the level of DRI in cities increases, it has a positive promoting effect on GIE, thereby validating Hypothesis 1. Column (1) presents the regression results of the two-way fixed-effects model without any control variables, where the regression coefficient of the DRI coupling index is significantly positive. In Column (2), a 1% increase in the DRI coupling index leads to an approximate 0.248% increase in UGIE, indicating that the level of DRI is a key factor influencing UGIE.
Control factors like human capital levels are significantly negatively correlated with UGIE. This outcome may be related to the direction of human capital allocation. If talent is invested more in non-green sectors, such as traditional industries and technological advancements in high-energy-consuming industries, rather than in green technology R&D and process improvement, it will be hard to transform human capital into green innovation momentum, and may even suppress GIE due to resource misallocation. Moreover, factors such as rising per capita GDP and the development of financial lending are inhibiting the improvement in UGIE. Reaching a higher level of per capita GDP can be possibly accompanied by over-reliance on traditional resource-based industries, leading to insufficient green innovation momentum and lagging economic structural transformation, which also conforms to the “potential resource curse effect”. In an imperfect financial system and insufficient marketization, insufficient marketization and financial lending practices may be more biased towards traditional industries, making it difficult for green innovation sectors characterized by long R&D cycles and high risks to obtain sufficient loans, which ultimately results in a negative correlation between financial loans and green innovation.

5.2. Mechanism Test

To further verify the impact of DRI on UGIE, the study suggests the intermediary hypothesis and nonlinear conjecture. Table 6 presents the mediation analysis results, while Table 7 and Table 8 display the threshold regression outcomes.

5.2.1. Mediating Mechanism Test

As shown in Table 6, DRI promotes both ER and IPP. For every 1% increase in the DRI coupling degree, ER increases by approximately 0.0009% and IPP rises by approximately 0.1%. Consequently, DRI can enhance the effectiveness of ER and IPP, thereby improving GIE. Hypothesis 2 and 3 is verified, showing that DRI has an indirect impact on GIE by optimizing the institutional environment. However, compared with IPP, the influence of DRI on ER is smaller. The potential reason is that the implementation of ER relies on a physical monitoring system and institutional implementation, which requires considerable time and resources for adaptation and coordination. Consequently, the impact of DRI on ER is indirect and delayed, with a comparatively low short-term marginal effect.

5.2.2. Nonlinear Test

In view of the theoretical explanation in the previous article, this paper empirically tests the existence of threshold effects by constructing a threshold model. Before conducting the estimation, it is essential to evaluate the existence of a threshold effect and the quantity of thresholds in the DRI. As seen from the test results in Table 7, the coupling degree of DRI has a threshold.
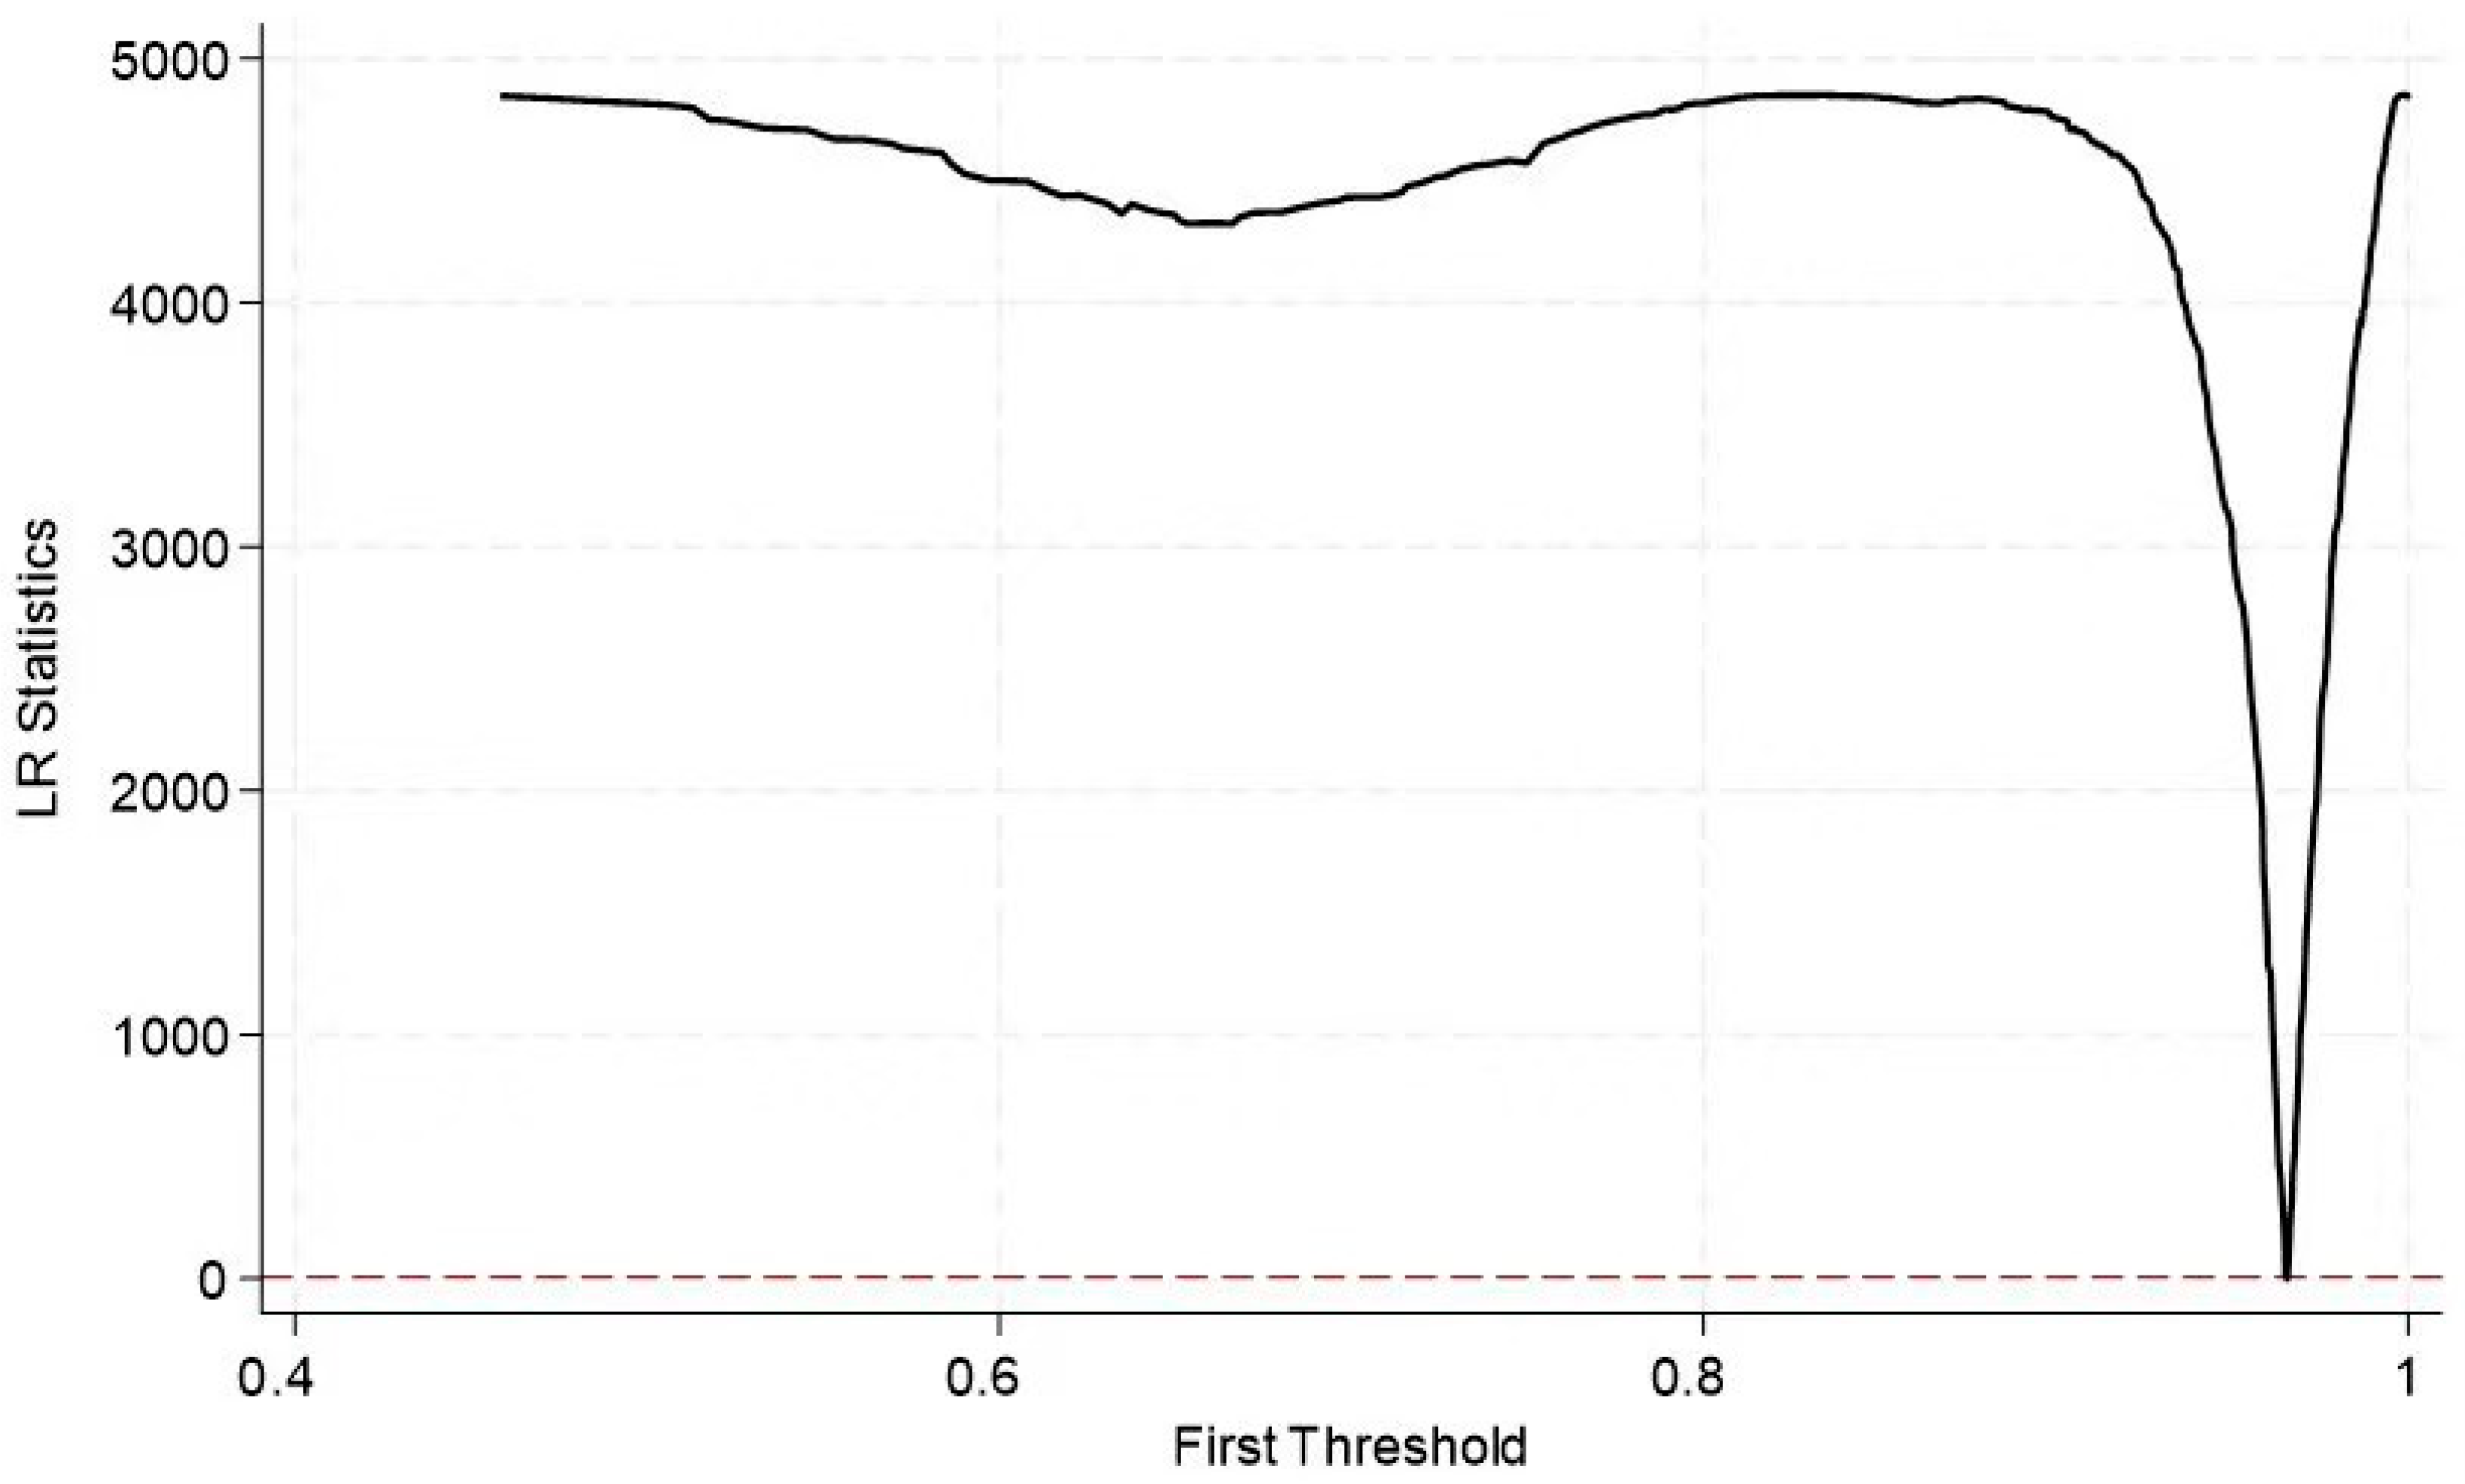
To facilitate the understanding of the identification of the threshold value and the construction process of the confidence interval, this paper also plots the likelihood ratio function graph for the identification of a single threshold. In Figure 2, the threshold variable value when the likelihood ratio statistic LR is zero is the estimated threshold value, and the critical value of all LR values at the 5% significance level is the confidence interval of the threshold estimate. The LR statistics keep approaching zero within the 95% confidence interval, thus accepting the null hypothesis that the threshold value is the true value.
Table 8 presents the panel threshold regression results using the DRI coupling degree as the threshold variable. From Table 8, it can be seen that the influence of DRI on UGIE has a significant single threshold effect. The estimated threshold value of the threshold variable qi,t is γ1 = 0.9657, and its 95% confidence interval (0.9653, 0.9662) is narrow, verifying the accuracy of the threshold value. When qi,t ≤ γ1, the marginal promoting effect of DRI on GIE is 0.47463, which is highly significant (p < 0.01); when qi,t crosses the threshold, this effect increases to 0.52555, which is highly significant (p < 0.01), indicating that when the threshold variable crosses the critical value, the promoting effect of DRI on UGIE strengthens. In summary, the impact of DRI on UGIE has a single threshold nonlinear characteristic based on its own coupling degree. Increasing the coupling degree can amplify the promoting effect on GIE, and Hypothesis 4 is verified.

5.3. Endogeneity and Robustness Test

5.3.1. Endogeneity Test

DRI can enhance GIE, but urban areas with elevated GIE may exhibit greater incentives to allocate resources to digital tech R&D, thereby promoting the improvement in DRI. This creates a bidirectional causal relationship, leading to endogeneity in the model, which should be appropriately addressed, thus avoiding parameter estimation bias and distorted conclusions. Thus, this paper adopts the following methods to test the endogeneity of the model:
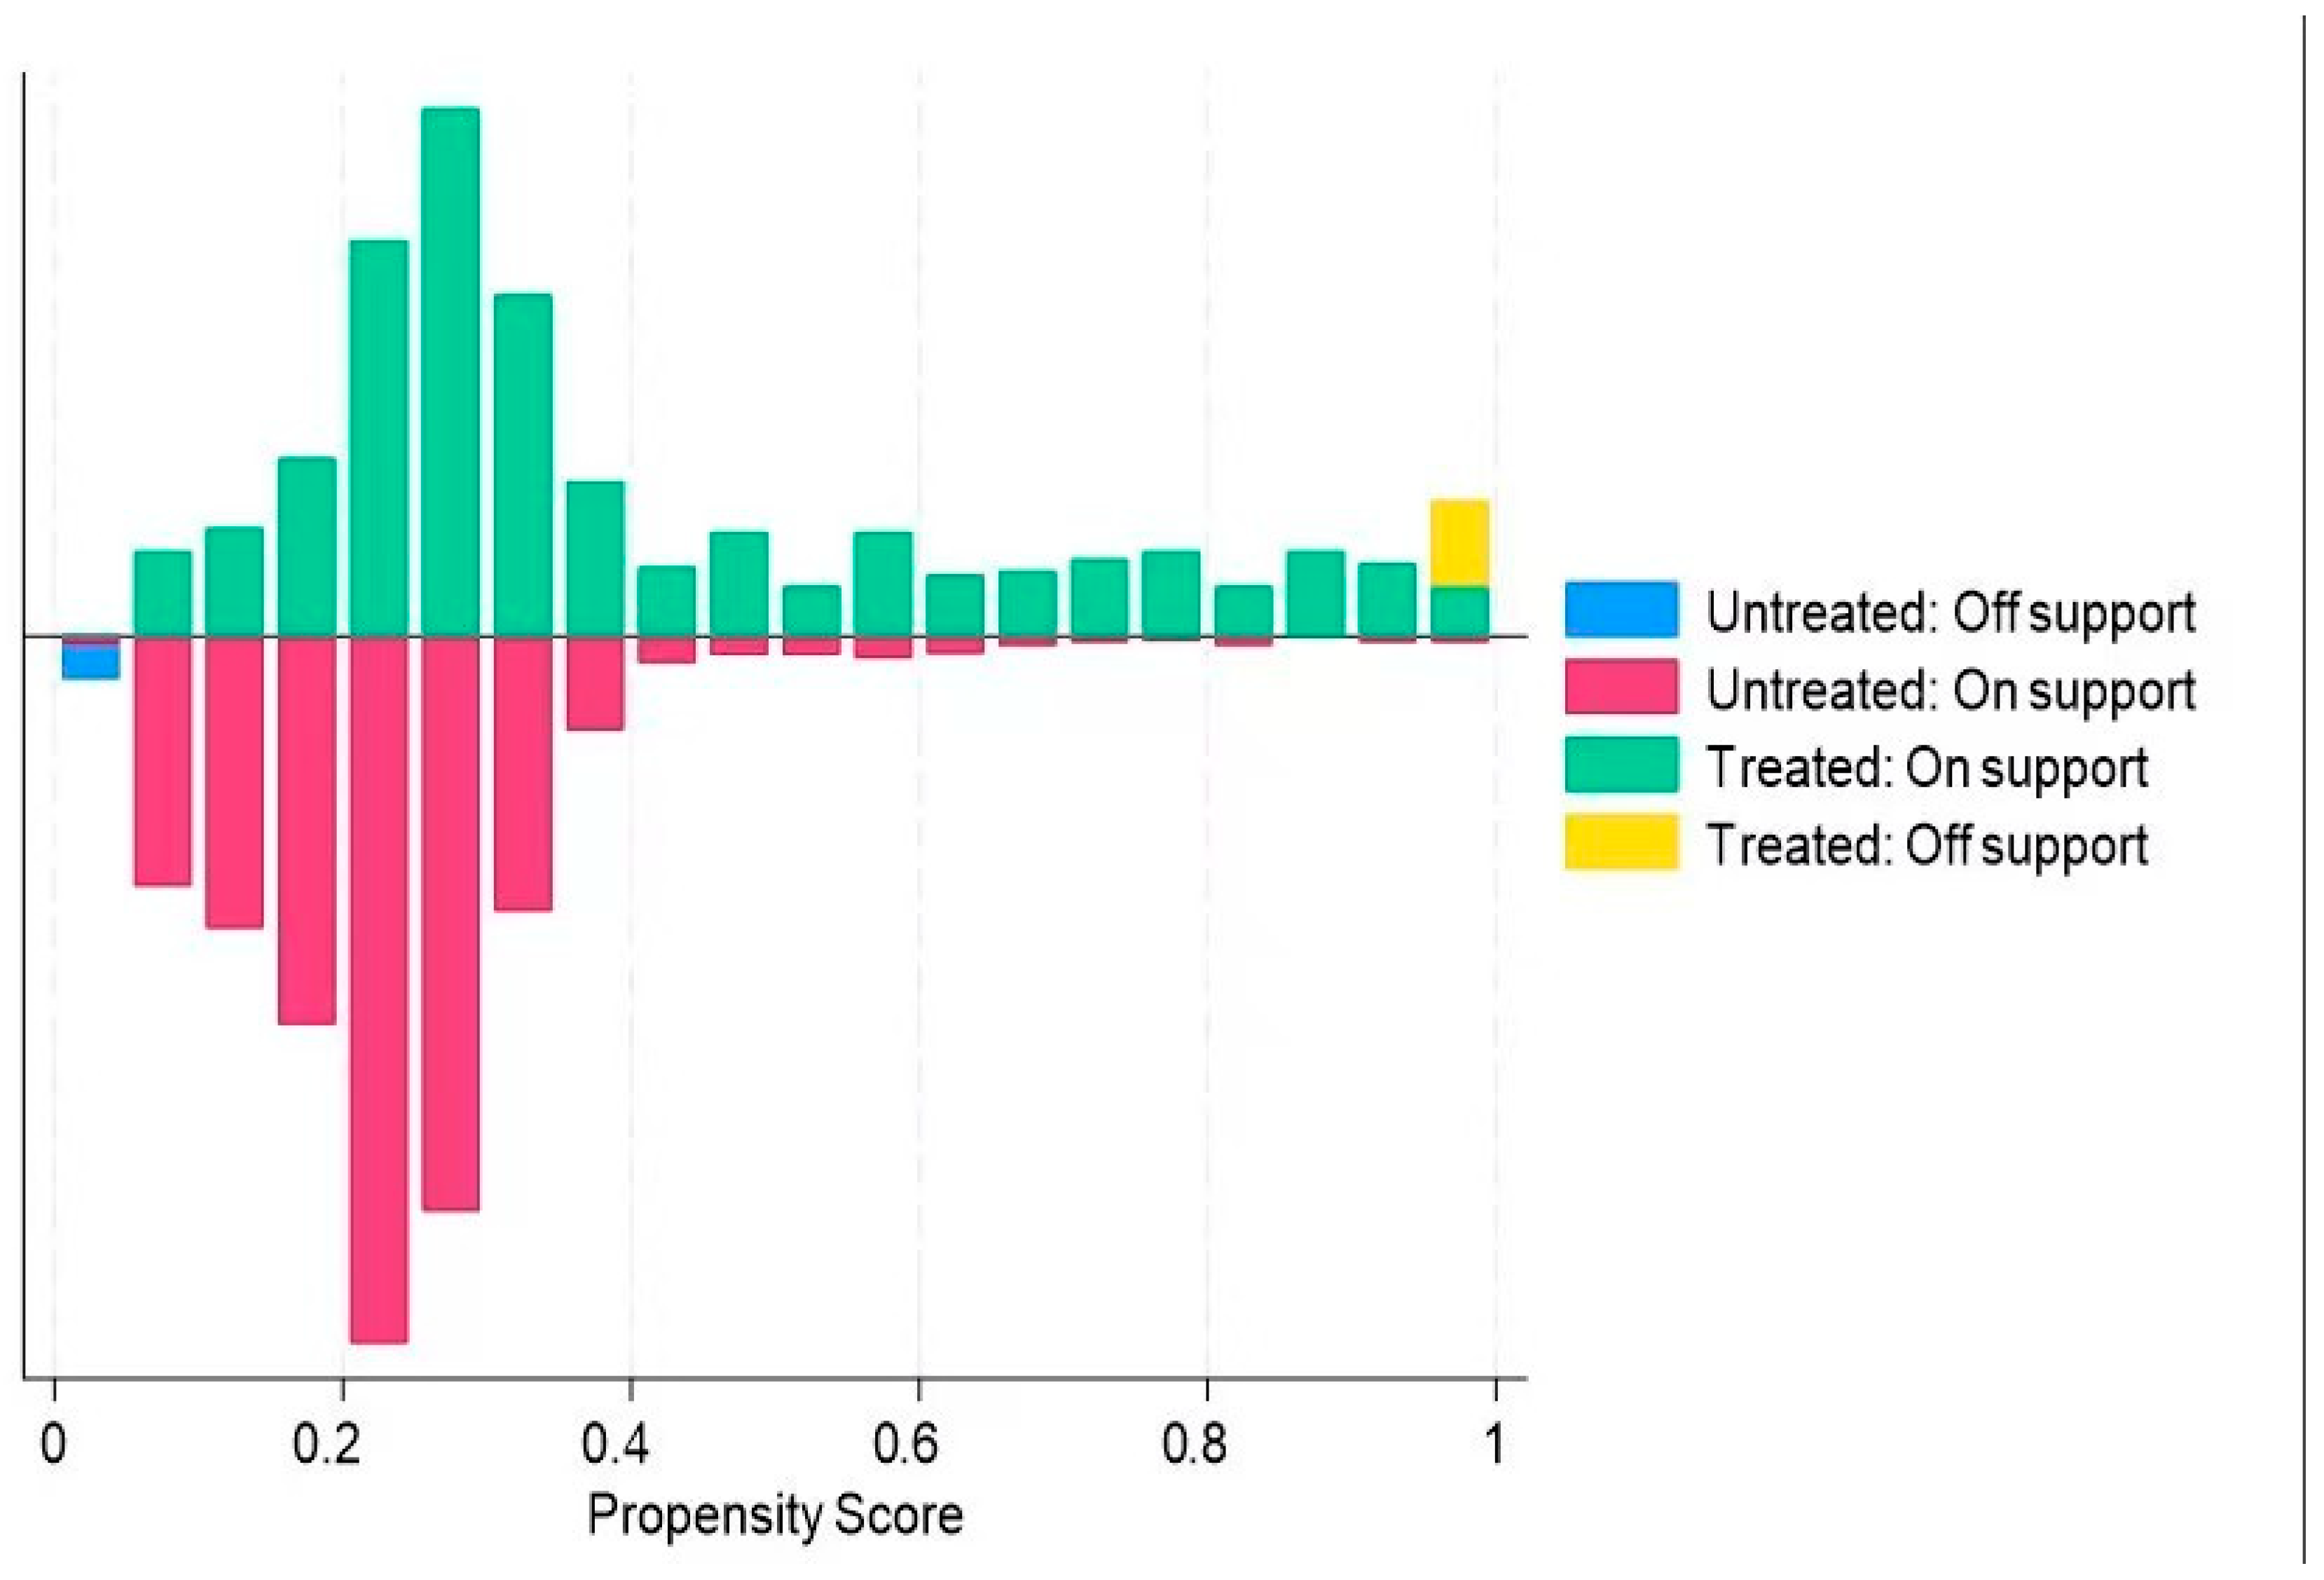
(1) Propensity score matching. As shown in Table 9, the p values of the covariates after matching are not significant, indicating that the distribution differences in the covariates between the treatment group and the control group have been notably reduced, and the inter-group differences in the covariates have been basically eliminated. This meets the key assumption of causal identification and demonstrates the effectiveness of the matching assessment.
From Figure 3, the treatment group and the control group have significant overlap in most propensity score intervals. This indicates that most samples in the treatment group can find matching objects in the control group, allowing for effective matching.
Column (1) of Table 10 shows the results of nearest neighbor matching by using the mean value of the DRI coupling degree as the standard to construct a binary variable. The regression coefficients remain significantly positive at the 1% level, consistent with the baseline regression results.
(2) With reference to the investigation of Campello M et al. (2018) [76], we used the explanatory variables that lagged one period as instrumental variables. It shown in Column (2) of Table 10.
From Columns (1) and (2) of Table 10, it can be observed that after the one-period-lagged explanatory variables are matched with the propensity score, they aligned with the initial regression findings. This also indicates that DRI still has a significant positive promoting effect on UGIE.

5.3.2. Robustness Test

To evaluate the dependability of the estimated outcomes, this paper examines the robustness of the benchmark regression results. (1) Reducing the sample size. Specifically, the sample data for 2021–2023 is excluded. It shown in Column (3) of Table 8. The regression coefficient remains significantly positive at the 1% level, consistent with the baseline regression results. (2) Winsorization: All variables are winsorized at the 1% level. It shown in Column (4) of Table 8. The regression coefficient remains notably positive, which is consistent with the benchmark regression results.

5.4. Heterogeneity Analysis

5.4.1. Analysis of Heterogeneity in Urban Resource Endowment

Resource-based and non-resource-based cities exhibit notable disparities in industrial dependence, transformation pressures, ecological governance requirements, and the efficiency of innovation resource allocation, resulting in a heterogeneous impact of DRI on GIE across the two city types. Based on this, this paper divides 281 cities into resource-based cities and non-resource-based cities according to the “National Sustainable Development Plan for Resource-Based Cities (2013–2020)” issued by the Chinese State Council to study the differences in GIE between the two groups due to DRI. Table 11 presents the results of the regression of urban resource endowment heterogeneity.
As seen from Table 11, DRI promotes the UGIE of both resource-based cities and non-resource-based cities. However, the promoting effect on non-resource-based cities is significantly higher than that on resource-based cities. For every 1% increase in the DRI coupling degree, the GIE of non-resource-based cities increases by approximately 0.29%, while that of resource-based cities increases by approximately 0.21%. The reason for this might be that non-resource-based cities have a more diversified industrial structure, with a focus on high-tech industries, and are more compatible with digital technologies, enabling them to quickly optimize production processes and develop green technologies through digital means. Their innovation ecosystem is well-developed, with a large number of research institutions, universities, and innovative enterprises, high R&D investment, strong talent attraction, and the ability to efficiently convert the results of DRI into green innovation, such as achieving precise energy regulation through industrial Internet or developing new energy technologies through big data. On the other hand, resource-based cities rely heavily on resource extraction and processing, with short supply chains and low added value. The penetration of digital technologies is difficult, and they need to first overcome problems such as the transformation of traditional production equipment and process reconfiguration, which is costly and time-consuming. At the same time, their R&D investment is low, and there is a shortage of talents, with innovation mainly concentrated on the improvement in resource extraction technologies, resulting in insufficient green innovation motivation.

5.4.2. Analysis of Heterogeneity in Urban Hierarchy

Cities at different administrative levels often differ in factors such as talent, capital, and labor, resulting in heterogeneous economic effects of digital industry clusters across cities of different administrative levels. Consequently, the study classifies the city sample into two categories according to their administrative rank: central cities (covering sub-provincial cities, provincial capitals, and municipalities) and peripheral cities.
From Table 12, the analysis indicates that DRI has a promoting effect on the GIE of both central cities and peripheral cities. However, the promoting effect on central cities is significantly higher than that on peripheral cities. For every 1% increase in the DRI coupling degree, the GIE of central cities increases by approximately 0.28%, while that of peripheral cities increases by approximately 0.23%. The reason for this might be that central cities have more complete digital infrastructure and market mechanisms.

5.4.3. Urban Location Heterogeneity

China’s economic development differs significantly between the north and south, with the south generally outperforming the north. Based on this, this paper divides 281 cities by southern and northern regions to analyze the differences in the GIE of southern and northern cities as a result of DRI. Table 13 presents the regression outcomes for urban locational heterogeneity.
Table 13 shows that DRI promotes UGIE in both southern and northern regions, but the effect on southern cities is markedly greater than that on northern cities. For each 1% rise in the DRI coupling degree, UGIE in southern regions grows by roughly 0.27%, whereas that in northern regions increases by approximately 0.22%. This may be due to the more complete digital infrastructure and deeper technological penetration in the south, as well as the fact that the real economy is dominated by high-tech and low-carbon industries, which are highly compatible with digital technologies, thus offering significant potential for green innovation. Furthermore, the south boasts a concentration of innovative factors, including talent and capital, productive industry–university–research collaboration, targeted market-oriented policy support, and a dynamic green consumer market, which collectively expedite the transformation towards green innovation integration. In contrast, the north has weaker digital infrastructure and technological penetration and faces greater challenges in transforming traditional high-carbon industries, which lacks innovative factors. The policy and market environments provide less support and push for integration, resulting in a weaker promoting effect than the south. This points to a difficult reality for cities in the south and north, whereby it is difficult to achieve coordinated growth in GIE, with southern cities being more able to benefit from the influence of DRI on UGIE.

6. Conclusions and Policy Recommendations

6.1. Conclusions

In the analysis of 281 Chinese prefecture-level cities spanning from 2013 to 2023, this paper thoroughly investigates how DRI affects UGIE. It delves deeper into understanding the underlying process, the thresholds involved, and the varied outcomes. Here is what we have deduced.
First, DRI exerts a substantial favorable influence on UGIE, and passed various robustness tests, indicating that DRI is an important driver of improving UGIE. This is consistent with previous research. Unlike previous research of Sun et al. (2024) conducted at the enterprise level, this study explores the green effects of DRI from the city level [8].
Second, mechanism tests reveal that ER and IPP serve as key mediators in the influence of DRI on UGIE. Specifically, DRI can enhance GIE through strengthening ER and improving the IPP system, etc. This is an extension of previous findings. Compared with the existing literature that focuses on technical aspects, this study advances the understanding of how DRI influences green innovation by employing the perspective of institutional environment.
Third, the threshold effect analysis reveals that DRI’s impact on UGIE has a single- threshold pattern that is correlated with coupling intensity. This is consistent with previous research. When the DRI coupling degree crosses the threshold value of 0.9657, the marginal effect jumps from 0.47463 to 0.52555, validating the positive feedback hypothesis between integration level and institutional response.
Fourth, heterogeneity analysis reveals that the impact of DRI on UGIE varies by city type, showing more pronounced effects in non-resource-based, central cities, and cities in the southern regions. This indicates that differences in resource endowments, development priorities, and geographical location result in heterogeneous effects of DRI in enabling green innovation.

6.2. Policy Recommendations

First, continuously deepen DRI. Governments at all levels should strengthen their guiding role in promoting DRI, thus unlocking the value of data elements. At the same time, the digital governance system should be improved to enhance its effectiveness and the digitalization of public services, providing institutional guarantees for integrated development.
Second, fully unleash the potential of DRI to enhance GIE. Digital technologies should penetrate green industries such as resource recycling. And digital approaches should be utilized to connect all links in the green innovation chain including R&D, production, distribution, and consumption, thus promoting collaborative innovation across the supply chain and strengthening the green orientation of integrated development.
Third, precisely identify the key intersections where DRI empowers GIE. Two core pathways, which are the strengthening of ER and the upgrading of IPP, should be focused on promoting the coordinated development of DRI with these elements, thus forming a policy synergy to further enhance the effect of DRI on UGIE.
Targeted policies should be formulated based on the development differences between cities with various resource endowments, cities of distinct administrative levels, and cities in different geographical locations. For example, in resource-based cities, efforts should be focused on promoting green industrial transformation through DRI, while in central cities, efforts should be made to strengthen the agglomeration effect of digital technology on green innovation factors, ensuring that the benefits of DRI are evenly distributed. Southern and eastern cities should be encouraged to collaborate in creating a closed loop from technology R&D to industrial application. By combining the eastern frontier innovations with the southern manufacturing prowess, it can form a national digital–green innovation consortium.

6.3. Constraints and Prospects of the Study

This study still has limitations which can be further explored in the following three areas: First, DRI is a complex concept that evolves dynamically at the theoretical level. While existing coupled evaluation models are generally applicable, future research could consider incorporating specific industry characteristics and development stages to construct a multidimensional evaluation system that integrates qualitative analysis with core indicators. Second, the super-efficiency SBM model’s measurement of UGIE is limited in its single dimensionality. It is recommended that subsequent research establishes a categorized evaluation framework to generate differentiated policy solutions through heterogeneous analysis of efficiency types. Third, regarding mechanism exploration, in addition to ER and IPP, factors such as residents’ green consumption awareness and carbon trading markets could be incorporated to systematically construct a multidimensional model of the interaction between DRI and GIR. These improvement directions will help deepen theoretical understanding and enhance the policy-guiding value of research results.

Author Contributions

Conceptualization, Y.F. and J.K.; methodology, B.X. and Y.F.; software, B.X. and Y.F.; validation, B.X. and Y.F.; formal analysis, Y.F. and J.K.; investigation, B.X. and Y.F.; resources, B.X. and P.X.; data curation, B.X. and J.K.; writing—original draft preparation, B.X. and Y.F.; writing—review and editing, J.K. and P.X.; visualization, Y.F. and B.X.; supervision, J.K. and P.X.; project administration, J.K. and P.X.; funding acquisition, B.X. and Y.F. All authors have read and agreed to the published version of the manuscript.

Funding

This study was supported by the Guizhou Provincial Innovation Foundation for Postgraduate “A Study on the Mechanism and Countermeasures of Digital–Real Economy Integration Affecting Export Technology Complexity from the Perspective of Global Value Chain Upgrading: A Case Study of Manufacturing Enterprises in Guizhou Province” (2025YJSKYJJ242).

Institutional Review Board Statement

Not applicable.

Informed Consent Statement

Not applicable.

Data Availability Statement

Data is available upon request from the author.

Conflicts of Interest

The authors declare no conflicts of interest.

References

  1. Oncel, S.S. (Ed.) A Sustainable Green Future: Perspectives on Energy, Economy, Industry, Cities and Environment; Springer Nature: Berlin/Heidelberg, Germany, 2023. [Google Scholar]
  2. Luo, S.; Yimamu, N.; Li, Y.; Wu, H.; Irfan, M.; Hao, Y. Digitalization and sustainable development: How could digital economy development improve green innovation in China? Bus. Strategy Environ. 2023, 32, 1847–1871. [Google Scholar] [CrossRef] [Scilit]
  3. Zhao, F.; Li, R.; Wu, Z.; Ru, X. Can the integration of digital and real economies stimulate residents’ consumption? Int. Rev. Financ. Anal. 2025, 103, 104260. [Google Scholar] [CrossRef] [Scilit]
  4. Brynjolfsson, E.; McAfee, A. The Second Machine Age: Work, Progress, and Prosperity in a Time of Brilliant Technologies; WW Norton & Company: New York, NY, USA, 2014. [Google Scholar]
  5. Meng, X.N.; Xu, S.C.; Hao, M.G. Can digital-real integration promote industrial green transformation: Fresh evidence from China’s industrial sector. J. Clean. Prod. 2023, 426, 139116. [Google Scholar] [CrossRef] [Scilit]
  6. Zhao, Y.; Fang, W. How does digital transformation affect green innovation performance? Evidence from China. Technol. Anal. Strateg. Manag. 2025, 37, 139–154. [Google Scholar] [CrossRef] [Scilit]
  7. Jiang, L.; Zhang, M.; Hu, S. Digital economy, green innovation and regional resource allocation efficiency: Evidence from 257 cities in China. Front. Environ. Sci. 2025, 13, 1529946. [Google Scholar] [CrossRef] [Scilit]
  8. Sun, G.; Fang, J.; Li, J.; Wang, X. Research on the impact of the integration of digital economy and real economy on enterprise green innovation. Technol. Forecast. Soc. Change 2024, 200, 123097. [Google Scholar] [CrossRef] [Scilit]
  9. Huizhong, D.; Xuan, L.; Renjie, Z. Spatial-temporal characteristics and driving factors of green innovation efficiency in Guangdong-Hong Kong-Macao Greater Bay Area. Econ. Geogr. 2021, 41, 134–144. [Google Scholar]
  10. Berrone, P.; Fosfuri, A.; Gelabert, L.; Gomez-Mejia, L.R. Necessity as the mother of ‘green’inventions: Institutional pressures and environmental innovations. Strateg. Manag. J. 2013, 34, 891–909. [Google Scholar] [CrossRef] [Scilit]
  11. Zheng, H.; Wang, Y.; Cai, J. Bridging green innovation and energy efficiency: The digital economy’s unique role in carbon neutrality. Environ. Dev. Sustain. 2025, 1–22. [Google Scholar] [CrossRef] [Scilit]
  12. Hall, B.H.; Helmers, C. Innovation and diffusion of clean/green technology: Can patent commons help? J. Environ. Econ. Manag. 2013, 66, 33–51. [Google Scholar] [CrossRef] [Scilit]
  13. Pérez, C.; Murray Leach, T. Technological Revolutions: Which Ones, How Many and Why It Matters—A Neo-Schumpeterian View; Historical Background Paper WP7-D7; Beyond 4: Scotts Valley, CA, USA, 2022; p. 1. [Google Scholar]
  14. Huang, R.; Wang, H. How is the development of industrial digital-real integration progressing?—Evidence from China’s cultural industries. Humanit. Soc. Sci. Commun. 2025, 12, 1–12. [Google Scholar] [CrossRef] [Scilit]
  15. Zhuang, J.; Fu, S.; Chen, L. How Digital Government Drives Technology Convergence between the Digital and Real Economy: Evidence from a Quasi-Natural Experiment in China. 2025. Available online: https://ssrn.com/abstract=5227025 (accessed on 20 July 2025).
  16. Yang, R.; Chen, B.; Wu, J. Does digital economy curb carbon intensity? New insights from China. Environ. Sci. Pollut. Res. 2023, 30, 123214–123225. [Google Scholar] [CrossRef] [Scilit]
  17. Roz, C. (Ed.) Cambridge Business English Dictionary; Cambridge University Press: Cambridge, UK, 2011. [Google Scholar]
  18. Wang, Z.; Lin, S.; Chen, Y.; Lyulyov, O.; Pimonenko, T. The digital economy and real economy: The dynamic interaction effect and the coupling coordination degree. Sustainability 2024, 16, 5769. [Google Scholar] [CrossRef] [Scilit]
  19. Shu, H.; Zhan, L.; Lin, X.; Zhou, X. Coordination measure for coupling system of digital economy and rural logistics: An evidence from China. PLoS ONE 2023, 18, e0281271. [Google Scholar] [CrossRef] [Scilit] [PubMed]
  20. Huang, T.; Xia, H. How Can Digital–Real Economy Integration Affect Urban Green Innovation? Evidence from China. Sustainability 2024, 16, 11072. [Google Scholar] [CrossRef] [Scilit]
  21. Shivdas, A. Demystifying Green Innovation: Past, present, and future research pathways guided by SDG mapping. Clean. Responsible Consum. 2025, 17, 100290. [Google Scholar] [CrossRef] [Scilit]
  22. Li, X.; Liu, X. Explaining the changes in the green technology innovation efficiency of construction enterprises. Humanit. Social. Sci. Commun. 2024, 11, 1–15. [Google Scholar] [CrossRef] [Scilit]
  23. Wang, Q.; Ren, S. Evaluation of green technology innovation efficiency in a regional context: A dynamic network slacks-based measuring approach. Technol. Forecast. Soc. Change 2022, 182, 121836. [Google Scholar] [CrossRef] [Scilit]
  24. Aigner, D.; Lovell, C.A.K.; Schmidt, P. Formulation and estimation of stochastic frontier production function models. J. Econom. 1977, 6, 21–37. [Google Scholar] [CrossRef] [Scilit]
  25. Miao, C.; Fang, D.; Sun, L.; Luo, Q. Natural resources utilization efficiency under the influence of green technological innovation. Resour. Conserv. Recycl. 2017, 126, 153–161. [Google Scholar] [CrossRef] [Scilit]
  26. Charnes, A.; Cooper, W.W.; Rhodes, E. Measuringthe efficiency of decision- making units. Eur. J. Oper. Res. 1978, 2, 429–444. [Google Scholar] [CrossRef] [Scilit]
  27. Mardani, M.; Salarpour, M. Measuring technical efficiency of potato production in Iran using robust data envelopment analysis. Inf. Process. Agric. 2015, 2, 6–14. [Google Scholar] [CrossRef] [Scilit]
  28. Tone, K. A slacks-based measure of efficiency in data envelopment analysis. Eur. J. Oper. Res. 2001, 130, 498–509. [Google Scholar] [CrossRef] [Scilit]
  29. Li, G.; Zhang, X.; Tian, A.; Zhou, Y. Spatial and Temporal differentiation of green innovation efficiency in manufacturing industry based on Super-SBM-ESDA and Tobit model: Taking the Yangtze river economic belt as an example. Ecol. Econ. 2024, 40, 67–79. [Google Scholar]
  30. Bai, D.; Li, M.; Wang, Y.; Mallek, S.; Shahzad, U. Impact mechanisms and spatial and temporal evolution of digital economy and green innovation: A perspective based on regional collaboration within urban agglomerations. Technol. Forecast. Soc. Change 2024, 207, 123613. [Google Scholar] [CrossRef] [Scilit]
  31. Wang, H.-J.; Zheng, M.-Q.; Yin, H.-T.; Chang, C.-P. Green innovation, industrial structure and urban eco-efficiency in Chinese cities. Econ. Anal. Policy 2024, 82, 1011–1024. [Google Scholar] [CrossRef] [Scilit]
  32. Luo, X.; Zhang, W. Green innovation efficiency: A threshold effect of research and development. Clean. Technol. Environ. Policy 2021, 23, 285–298. [Google Scholar] [CrossRef] [Scilit]
  33. Wang, H.; Hao, W. Impact of high-tech industrial agglomeration on the efficiency of green innovation in China. China Soft Sci. 2022, 8, 172–183. [Google Scholar]
  34. Mao, J.; Liu, Y. The impact of undertaking industrial relocation on green innovation efficiency in the yellow river basin: A two-stage analysis from an innovation value chain perspective. Sustainability 2025, 17, 1581. [Google Scholar] [CrossRef] [Scilit]
  35. Fan, F.; Lian, H.; Liu, X.; Wang, X. Can environmental regulation promote urban green innovation Efficiency? An empirical study based on Chinese cities. J. Clean. Prod. 2021, 287, 125060. [Google Scholar] [CrossRef] [Scilit]
  36. Demirel, P.; Kesidou, E. Stimulating different types of eco-innovation in the UK: Government policies and firm motivations. Ecol. Econ. 2011, 70, 1546–1557. [Google Scholar] [CrossRef] [Scilit]
  37. Wang, J.R.; Zhang, Y. Environmental regulation, green technological innovative intention and green technological innovative behavior. Stud. Sci. Sci. 2018, 36, 352–360. [Google Scholar]
  38. Sinn, H.W. Public policies against global warming: A supply side approach. Int. Tax Public Financ. 2008, 15, 360–394. [Google Scholar] [CrossRef] [Scilit]
  39. Shen, T.; Li, D.; Jin, Y.; Li, J. Impact of environmental regulation on efficiency of green innovation in China. Atmosphere 2022, 13, 767. [Google Scholar] [CrossRef] [Scilit]
  40. Yang, S.; Liu, F.; Wang, G.; Feng, D. Intellectual property system and urban green innovation: Evidence from China. Growth Change 2024, 55, e12689. [Google Scholar] [CrossRef] [Scilit]
  41. Li, G.; Li, X.; Huo, L. Digital economy, spatial spillover and industrial green innovation efficiency: Empirical evidence from China. Heliyon 2023, 9, e12875. [Google Scholar] [CrossRef] [Scilit]
  42. Lyu, Y.; Wang, W.; Wu, Y.; Zhang, J. How does digital economy affect green total factor productivity? Evidence from China. Sci. Total Environ. 2023, 857, 159428. [Google Scholar] [CrossRef] [Scilit]
  43. Guo, D.; Li, L.; Pang, G. Does the integration of digital and real economies promote urban green total factor productivity? Evidence from China. J. Environ. Manag. 2024, 370, 122934. [Google Scholar] [CrossRef] [Scilit]
  44. Wang, Y.; Shi, M.; Liu, J.; Huang, H.; Yu, K. Environmental pollution management effects of technological convergence between digital and real economy industries: A perspective of tripartite co-governance by company, government, and public. J. Clean. Prod. 2025, 501, 145201. [Google Scholar] [CrossRef] [Scilit]
  45. Ling, S.; Gao, H.; Yuan, D. Catalytic role of the digital economy in fostering corporate green technology innovation: A mechanism for sustainability transformation in China. Econ. Anal. Policy 2024, 84, 278–292. [Google Scholar] [CrossRef] [Scilit]
  46. Hu, J.; Chen, H.; Fan, J.; He, Z. The impact of digital infrastructure on provincial green innovation efficiency—Empirical evidence from China. Environ. Sci. Pollut. Res. 2024, 31, 9795–9810. [Google Scholar] [CrossRef] [Scilit]
  47. Li, X.; Zhang, Y.; Zhou, S.; Zhao, Z.; Zhao, Y. Exploration and future trends on spatial correlation of green innovation efficiency in strategic emerging industries under the digital economy: A social network analysis. J. Environ. Manag. 2024, 359, 121005. [Google Scholar] [CrossRef] [Scilit]
  48. Liu, B.; Wang, Y.; Jiang, N.; Zhang, X. The impact of digital industrialization and industrial digitalization on regional green innovation efficiency in China-From the perspective of the innovation value chain. J. Clean. Prod. 2024, 478, 144015. [Google Scholar] [CrossRef] [Scilit]
  49. Li, L.; Ma, X.; Zheng, Y.; Ma, S.; Zuo, J.; Goodsite, M. Facilitating urban green innovative efficiency from intergovernmental perspective in China. Sci. Rep. 2025, 15, 22751. [Google Scholar] [CrossRef] [Scilit]
  50. Scott, W.R. Institutions and Organizations: Ideas, Interests, and Identities; Sage Publications: Thousand Oaks, CA, USA, 2013. [Google Scholar]
  51. Xu, M.; Li, J.; Ping, Z.; Zhang, Q.; Liu, T.; Zhang, C.; Wang, H. Can local government’s attention allocated to green innovation improve the green innovation efficiency?—Evidence from China. Sustainability 2022, 14, 12059. [Google Scholar] [CrossRef] [Scilit]
  52. Chen, S.; Yang, Y.; Wu, T. Digital economy and green total factor productivity—Based on the empirical research on the resource-based cities. Environ. Sci. Pollut. Res. 2023, 30, 47394–47407. [Google Scholar] [CrossRef] [Scilit]
  53. Deng, F.; Cai, L.; Ma, X. Does digital transformation restrict the carbon emission intensity of enterprises? Evidence from listed manufacturing enterprises in China. Nat. Resour. Forum 2024, 48, 364–384. [Google Scholar] [CrossRef] [Scilit]
  54. Huang, L.; Zhang, H.; Si, H.; Wang, H. Can the digital economy promote urban green economic efficiency? Evidence from 273 cities in China. Ecol. Indic. 2023, 155, 110977. [Google Scholar] [CrossRef] [Scilit]
  55. Lai, Y.; He, X. Does urban green development attention improve energy resource misallocation? Environ. Res. Commun. 2025, 7, 015036. [Google Scholar] [CrossRef] [Scilit]
  56. Qiu, Y.; Liu, W.; Wu, J. Digital economy and urban green innovation: From the perspective of environmental regulation. J. Environ. Plan. Manag. 2025, 68, 267–289. [Google Scholar] [CrossRef] [Scilit]
  57. Ren, X.; Qin, X.; Li, Y.; Tian, Y. Impact of the digital economy on the green transformation of China’s manufacturing industry: A dual perspective of technological innovation and industrial structure optimization. J. Glob. Inf. Manag. (JGIM) 2023, 31, 1–22. [Google Scholar] [CrossRef] [Scilit]
  58. Haiman, L.; Jiancheng, L.; Zunhuan, S. Research on the impact of digital transformation on the green innovation of enterprises. Sci. Res. Manag. 2023, 44, 22. [Google Scholar]
  59. Fan, D.; Li, M. Digital Economy Development and Green Innovation Efficiency from a Two-Stage Innovation Value Chain Perspective. Sustainability 2024, 16, 4421. [Google Scholar] [CrossRef] [Scilit]
  60. Hou, B.; Zhang, Y.; Hong, J.; Shi, X.; Yang, Y. New Knowledge and Regional Entrepreneurship: The Role of Intellectual Property Protection in China. Knowl. Manag. Res. Pract. 2021, 31, 471–485. [Google Scholar] [CrossRef] [Scilit]
  61. Chen, D.; Chen, S. Patent protection policy and firms’ green technology innovation: Mediating roles of open innovation and human capital. Sustainability 2024, 16, 2217. [Google Scholar] [CrossRef] [Scilit]
  62. Chen, W.; Wu, Y. China’s New Environmental Protection Law and Green Innovation: Evidence from Prefecture-Level Cities. Complexity 2021, 2021, 5566357. [Google Scholar] [CrossRef] [Scilit]
  63. Rao, W.; Liu, P. Can Digital Innovation Improve Green Total Factor Productivity: Evidence from Digital Patents of China. Sustainability 2024, 16, 3891. [Google Scholar] [CrossRef] [Scilit]
  64. Zhang, Z.; Cheng, Y.; Zhang, J. Spatial spillover and threshold effects of digital economy on green innovation efficiency–based on provincial level data in China. Environ. Dev. Sustain. 2025, 27, 6733–6755. [Google Scholar] [CrossRef] [Scilit]
  65. Chen, X.; Hou, Y.; Fan, Z. Club convergence in urban green innovation efficiency: Identification, club features, and the nexus with the digital economy in China. J. Environ. Manag. 2025, 391, 126456. [Google Scholar] [CrossRef] [Scilit]
  66. Zhang, G.; Wang, J.; Liu, Y. How can green finance alleviate the energy trilemma? Evidence from Chinese urban areas. Energy Environ. 2025, 0958305X251354915. [Google Scholar] [CrossRef] [Scilit]
  67. Xu, Y.; Wang, R.; Zhang, S. Digital Economy, Green Innovation Efficiency, and New Quality Productive Forces: Empirical Evidence from Chinese Provincial Panel Data. Sustainability 2025, 17, 633. [Google Scholar] [CrossRef] [Scilit]
  68. Jiaqi, W.; Yang, L.; Fei, L. Study on Evaluation of Regional Green Innovation Efficiency in China-Based on Super-efficiency SBM Model and Malmquist Index. In Proceedings of the 2020 2nd International Conference on Economic Management and Model Engineering (ICEMME), Chongqing, China, 20–22 November 2020; pp. 487–492. [Google Scholar]
  69. Shi, D.; Sun, G. The influence of the integration of digital economy and real economy on green innovation. Reform 2023, 2, 1–13. [Google Scholar]
  70. Dong, F.; Li, Y.; Qin, C.; Sun, J. How industrial convergence affects regional green development efficiency: A spatial conditional process analysis. J. Environ. Manag. 2021, 300, 113738. [Google Scholar] [CrossRef] [Scilit]
  71. Zhang, J.; Chen, S. Financial Development, Environmental Regulations and Green Economic Transition. J. Financ. Econ. 2021, 47, 78–93. [Google Scholar] [CrossRef]
  72. WIPO. World Intellectual Property Indicators 2018; World Intellectual Property Organization: Geneva, Switzerland, 2018. [Google Scholar]
  73. Dell, M. The persistent effects of Peru’s mining mita. Econometrica 2010, 78, 1863–1903. [Google Scholar] [CrossRef] [Scilit]
  74. Wu, F.; Fu, X.; Zhang, T.; Wu, D.; Sindakis, S. Examining whether government environmental regulation promotes green innovation efficiency—Evidence from China’s Yangtze River Economic Belt. Sustainability 2022, 14, 1827. [Google Scholar] [CrossRef] [Scilit]
  75. Cao, Y.; Elahi, E.; Khalid, Z.; Li, P.; Sun, P. How do intellectual property rights affect green technological innovation? Empirical evidence from China. Sustainability 2023, 15, 7762. [Google Scholar] [CrossRef] [Scilit]
  76. Campello, M.; Gao, J.; Qiu, J.; Zhang, Y. Bankruptcy and the cost of organized labor: Evidence from union elections. Rev. Financ. Stud. 2018, 31, 980–1013. [Google Scholar] [CrossRef] [Scilit]
Figure 1. A theoretical framework for the impact of DRI on UGIE.
Sustainability 18 01306 g001
Figure 2. Likelihood ratio function graph.
Sustainability 18 01306 g002
Figure 3. Common trend range.
Sustainability 18 01306 g003
Table 1. Evolution of data-intensive policy.
Time PeriodPolicy Name/Core DocumentPolicy Core Content
The initial stage (before 2017)Guiding Opinions on Deepening the Integration of the Manufacturing Industry and the Internet for Development (2016)To propose a path for the digital transformation of manufacturing and advocate for the application of industrial Internet platforms, thus enabling green technological innovation through intelligent production.
Development Plan for Intelligent Manufacturing (2016–2020)To define a three-step strategy for smart manufacturing, focusing on areas such as intelligent equipment and industrial robots, thus laying the hardware foundation for a leap in GIE.
The foundational stage (2017–2019)Guiding Opinions on Deepening the Development of the Industrial Internet through the “Internet + Advanced Manufacturing Industry” (2017)To construct systems of the industrial Internet, including network, platform and security, and promote the construction of infrastructure such as 5G, thus reducing the cost of green innovation.
The improvement stage (2020–2022)Industrial Internet Innovation and Development Action Plan (2021–2023) (2020)To implement the “5G + Industrial Internet” initiative (codenamed the “512 Project”) and build fully connected factories based on 5G technology, thus achieving real-time data interoperability and enhancing GIE in the manufacturing industry.
Outline of the 14th Five-Year Plan for National Economic and Social Development of the People’s Republic of China (2021)To clearly define the dual drivers of digital industrialization and industrial digitization, thus providing technical support and application demand for improving GIE.
The deepening stage (2023 to present)Overall Layout Plan for the Construction of Digital China (2023)To build an overall framework for the construction of digital China to coordinate the development of digital infrastructure, data elements, and the entire digital economy value chain.
Work Priorities for the Development of the Digital Economy in 2025 (2025)To build a sector-specific policy framework for digital transformation and leverage data applications in unmanned driving and low-altitude economy, thus establishing a data-driven foundation for strategic green sectors.
Table 2. Green innovation efficiency evaluation index system.
Primary IndicatorSecondary IndicatorTertiary IndicatorIndicator Attributes
Input Labor inputTotal number of employees engaged in scientific and technological activities and in water conservancy, environment, and public facilities management
Capital input The sum of government expenditure on scientific programs and environmental governance
Energy input Total water supply
Total electricity consumption
Total liquefied petroleum gas supply
OutputExpected output Number of green patent authorizations+
Unexpected outputSulfur dioxide emissions+
Industrial wastewater discharge+
Industrial soot emissions +
Table 3. Assessment framework for digital and real economic integration.
Primary IndicatorSecondary IndicatorTertiary IndicatorIndicator Attributes
Digital economyDigital infrastructureQuantity of Internet connection subscribers per 100 individuals (households)+
Industry DigitizationPer capita telecoms business volume (yuan)+
Proportion of workers in the IT software and hardware business among urban unit personnel (%)+
Digital User SituationNumber of mobile phone users per 100 people (households)+
Practical Digital ApplicationsDigital inclusive finance index (%)+
Real economyAgricultureAggregate value of the entire output from the farming, forestry, livestock breeding, and fishing sectors (billion yuan)+
IndustryQuantity of businesses exceeding the specified size threshold (units)+
Industrial primary enterprise revenue (billion yuan)+
The total funds of large industrial companies (billion yuan)+
Industrial added value (billion yuan)+
ConstructionNumber of employees in the construction sector (10,000 people)+
Number of legal entities in the construction industry (units)+
Construction sector gross output (10,000 yuan)+
Main business revenue of construction sector (10,000 yuan)+
Transportation and Postal ServicesHighway passenger transportation (10,000 people)+
Road freight traffic (10,000 tons)+
Number of workers in postal, storage, and transport sectors (10,000 people)+
Road mileage (kilometers)+
Added value of transport sectors, warehousing, and postal services (100 million yuan)+
Table 4. Descriptive statistics of main variables.
Variable Name Sample Size Average Value Standard Deviation Minimum Value Maximum Value
GIE30370.150.130.0002831
DRI30370.8930.1320.26001
FIN30370.05640.07120.003060.5300
HUM30370.01920.02060.00020.1290
GOV30370.009770.009590.0001990.08120
FDI3037983.82.1870.130024.3290
GDP303754.82029.4742.056228.650
ER30370.003540.001460.0002940.0124
IPP30370.2610.37903.954
Table 5. Regression results of the benchmark model.
(1) (2)
UGIEUGIE
DRI0.299 ***0.248 ***
(12.378)(10.219)
FDI −0.000
(−0.219)
GDP −0.000 *
(−1.666)
FIN −0.145 **
(−2.004)
GOV 4.146 ***
(14.669)
HUM −0.616 *
(−1.771)
_cons−0.125 ***−0.071 **
(−5.140)(−2.480)
City-fixed effectYESYES
Time-fixed effectYESYES
N30373037
R20.0840.138
Note: The values in parentheses in the table are t-values. * indicates a significance level of 10%, ** indicates a significance level of 5%, and *** indicates a significance level of 1%. The same applies below.
Table 6. Regression results of the mediating model.
(1)(2)
ERIPP
DRI0.00090 ***0.09725 *
(3.38694)(1.65741)
Control variableYESYES
_cons0.00243 ***−0.00071
(7.31890)(−0.00925)
City-fixed effectsYESYES
Time-fixed effectYESYES
N30373037
R20.0750.086
Note: The values in parentheses in the table are t-values. * indicates a significance level of 10%, *** indicates a significance level of 1%.
Table 7. Results of threshold effect test.
Threshold VariableNumber of ThresholdsF-Statisticp-Value1% Critical Value5% Critical Value10% Critical Value
DRI coupling degree 11159.720.00019.500614.449312.8722
24997.730.00020.952516.219813.1851
392.500.6167262.9221194.0362167.4598
Table 8. Regression results of the threshold model.
(1)
UGIE
DRI × I(qi, t ≤ γ1)0.47463 ***
(23.63788)
DRI × I (qi, t > γ1)0.52555 ***
(32.29591)
γ10.9657
Confidence interval(0.9653, 0.9662)
Control variableYES
_cons−0.24977 ***
(−1.400)
Urban-fixed effectYES
Fixed-effect of timeYES
N3037
R20.809
Note: The values in parentheses in the table are t-values. *** indicates a significance level of 1%.
Table 9. Hypothesis test for PSM balance.
Covariate NameBefore Matching U
After Matching M
Mean ValueStandard DeviationT Valuep-Value
Treatment GroupControl Group
fdiU2050.7552.9958.216.220.000
M1606.11584.10.90.160.872
gdpU5363055301−5.7−1.280.202
M53841516527.51.480.138
finU0.091950.0420762.616.620.000
M0.081290.08551−5.3−0.860.391
govU0.012370.0087234.58.700.000
M0.01140.011063.20.540.589
humU0.027960.0156655.414.000.000
M0.027440.025598.31.350.178
Table 10. Endogeneity and robustness regression results.
(1)(2)(3)(4)
GIEGIEUGIE
LDRI 0.14867 ***
(5.32436)
DRI0.25098 *** 0.22013 ***
(4.43909) (6.85917)
DRI_w 0.25537 ***
(11.02294)
Control variableYESYESYESYES
_cons−0.053240.02071−0.03814−0.07098 **
(−0.74622)(0.57846)(−1.06012)(−2.48694)
Urban-fixed effectYESYESYESYES
Fixed-effect of timeYESYESYESYES
N899220022003037
R20.1040.1180.1260.162
Note: The values in parentheses in the table are t-values. ** indicates a significance level of 5%, and *** indicates a significance level of 1%.
Table 11. Results of urban resource endowment heterogeneity regression.
(1) (2)
Resource-based cityNon-resource-based cities
DRI0.20678 ***0.29385 ***
(5.33272)(9.33450)
Control variableYESYES
_cons−0.04057−0.1222408 ***
(−0.80591)(−3.26)
Urban-fixed effectYESYES
Fixed-effect of timeYESYES
N12121825
R20.1340.155
Note: The values in parentheses in the table are t-values. *** indicates a significance level of 1%.
Table 12. Results of the regression analysis on urban hierarchical heterogeneity.
(1) (2)
Central cityPeripheral cities
DRI0.28315 ***0.22825 ***
(4.04332)(9.10017)
Control variableYESYES
_cons−0.03564−0.06794 **
(−0.43182)(−2.00422)
Urban-fixed effectYESYES
Fixed-effect of timeYESYES
N3752662
R20.1750.138
Note: The values in parentheses in the table are t-values. ** indicates a significance level of 5%, and *** indicates a significance level of 1%.
Table 13. Regression outcomes of urban location heterogeneity.
(1) (2)
NorthSouth
DRI0.22274 ***0.26506 ***
(5.58106)(8.44466)
Control variablesYESYES
_cons−0.0336941−0.0899077 **
(−0.73)(−2.31)
Urban-fixed effectYESYES
Fixed-effect of timeYESYES
N11251350
R20.1130.163
Note: The values in parentheses in the table are t-values. ** indicates a significance level of 5%, and *** indicates a significance level of 1%.
Disclaimer/Publisher’s Note: The statements, opinions and data contained in all publications are solely those of the individual author(s) and contributor(s) and not of MDPI and/or the editor(s). MDPI and/or the editor(s) disclaim responsibility for any injury to people or property resulting from any ideas, methods, instructions or products referred to in the content.