Article

Research on the Forecasting of Strategic Mineral Resource Scrap and Gap Rate of Electric Vehicles Based on a Life Cycle Perspective


School of Metallurgy, Northeastern University, Shenyang 110819, China
*
Author to whom correspondence should be addressed.
Sustainability 2026, 18(3), 1300; https://doi.org/10.3390/su18031300
Submission received: 12 January 2026 / Revised: 25 January 2026 / Accepted: 26 January 2026 / Published: 28 January 2026
(This article belongs to the Section Waste and Recycling)

Abstract

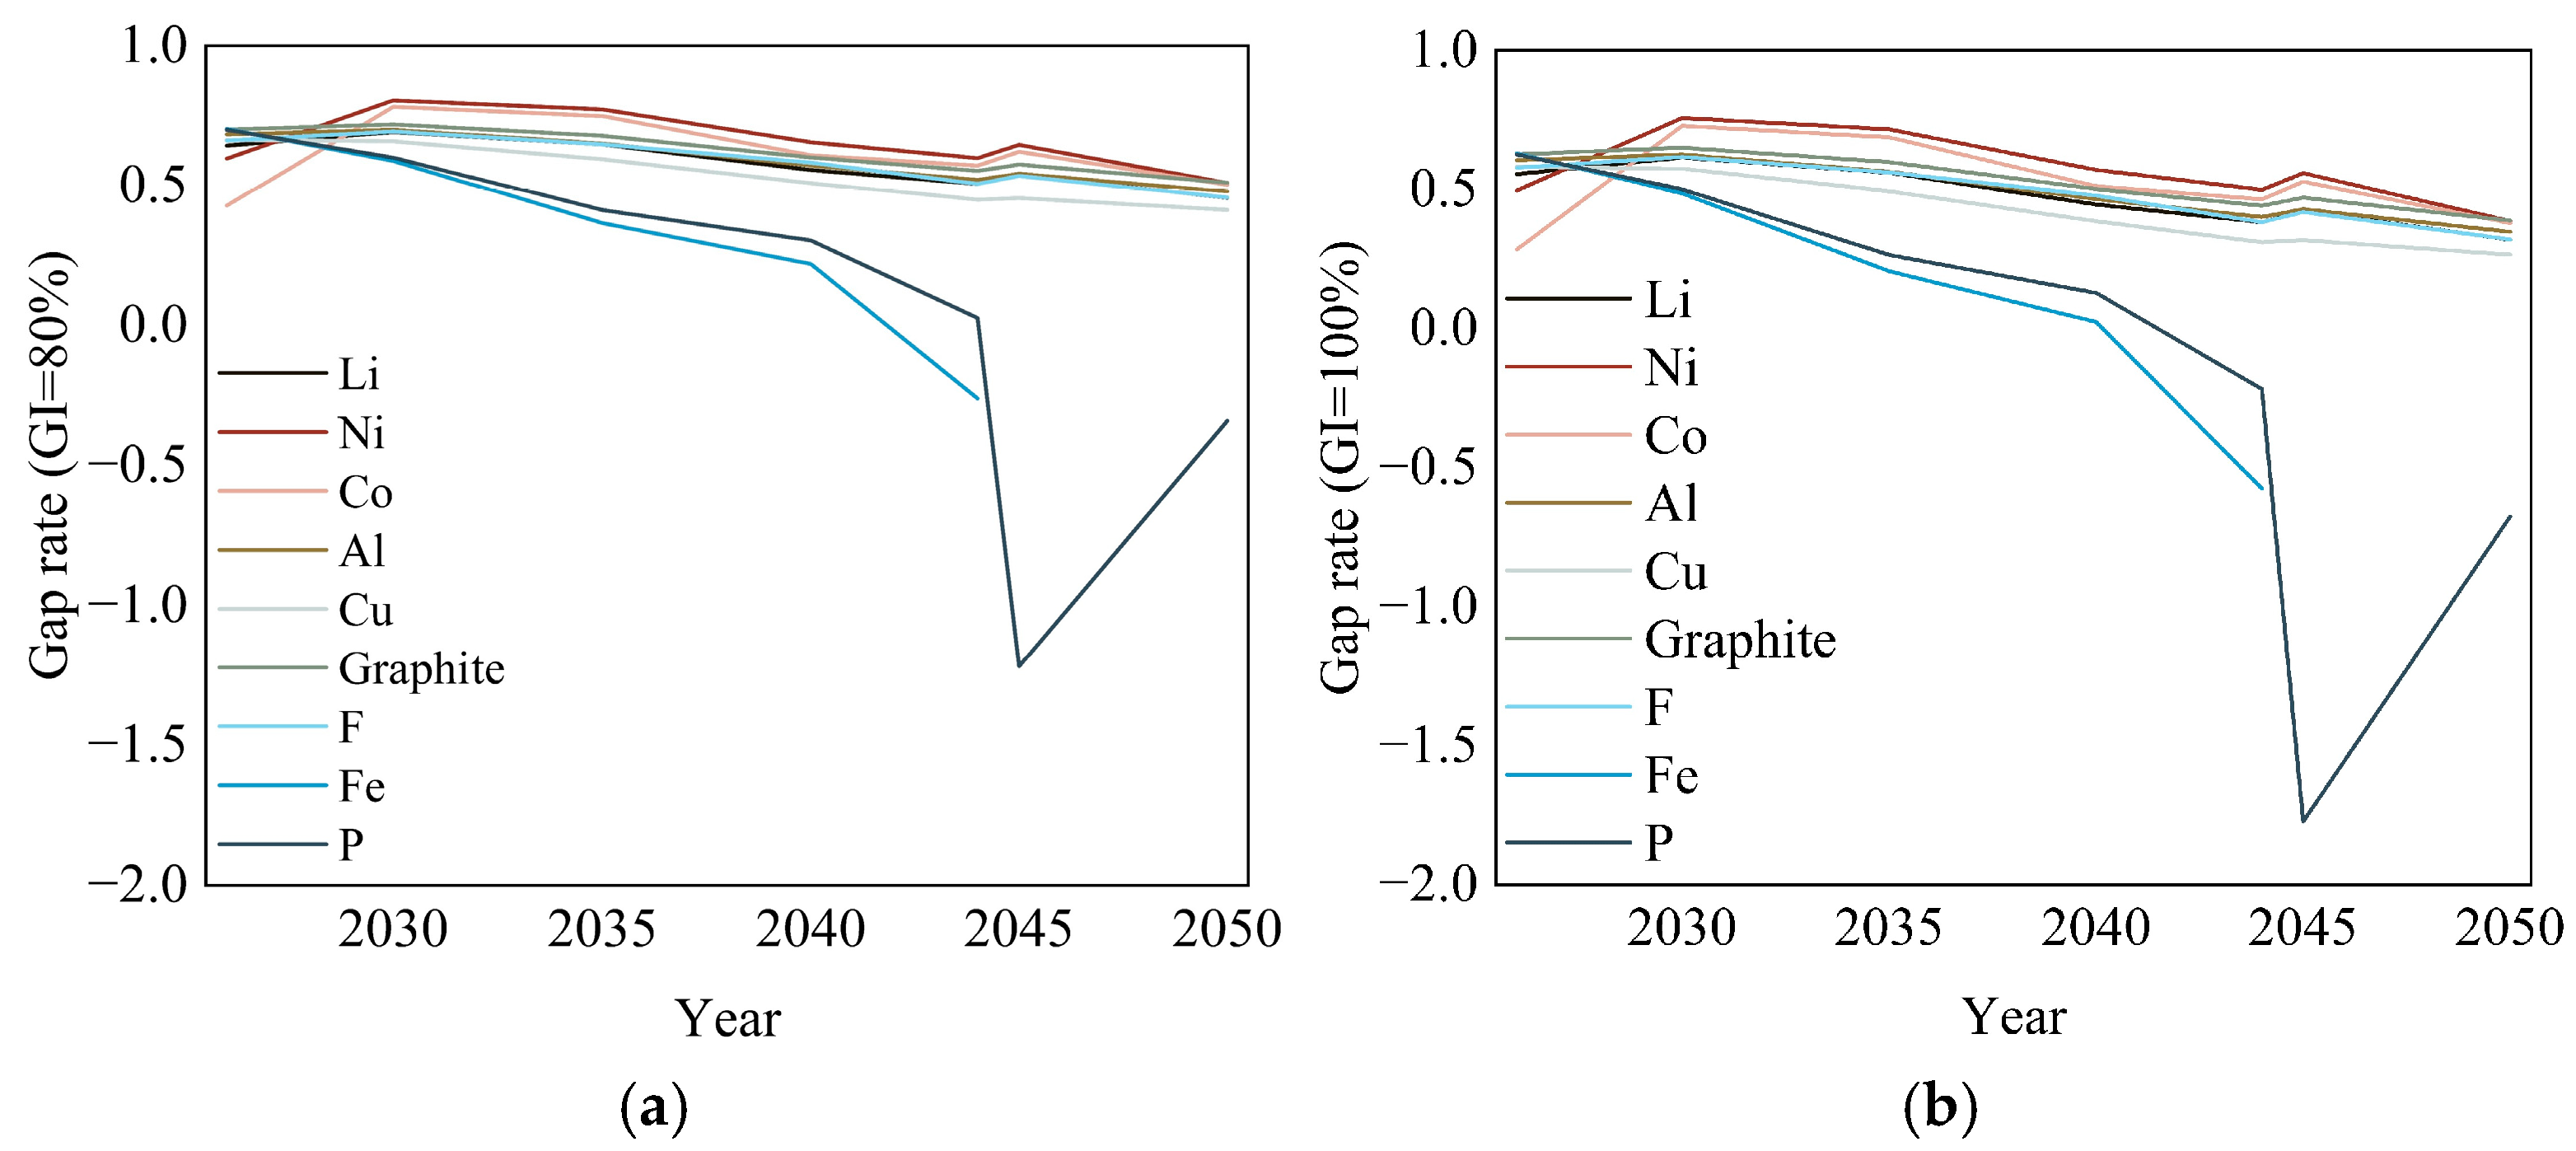
The rapid development of electric vehicles (EVs) will inevitably consume substantial scarce resources, posing risks and challenges to their supply chains. From a life cycle perspective, this study innovatively incorporates charging piles (CPs) into the research scope. Six scenarios are established to quantitatively analyze the scrap and recovery volume of 20 metallic and 3 non-metallic strategic mineral resources in lithium-ion batteries (LIBs) and CPs for China’s passenger EVs during 2010–2050. Under six scenarios, the results show that Al in LIBs and Fe in CPs have the highest scrap volumes, increasing from 2.69 t in 2010 to 2.98 × 10⁶ t in 2050 and from 34.76 t in 2024 to 1.14 × 10⁶ t in 2050, respectively. In contrast, Co in LIBs and Zr in CPs have the smallest scrap volumes, increasing from 0.22 t in 2012 to 8.25 × 10⁴ t in 2050 and from 8.8 × 10⁻⁷ t in 2024 to 1.52 × 10⁻⁵ t in 2050, respectively. Over 97% of Li, Co, Ni, and Al originates from LIBs during 2026–2050, while Fe and Cu from CPs show notable growth, underscoring recycling urgency. Recycle-demand analysis in LIB reveals the gap rate for nine elements. Seven elements’ gap rates are 0.39–0.81 (GI = 80%) and 0.25–0.75 (GI = 100%), while Fe’s gap rate turns to 0 in 2045 due to LFP phase-out and P’s gap rate reaches −1.22 (GI = 80%) and −1.77 (GI = 100%) in 2045 before rebounding.

1. Introduction

The development of modern society is inextricably linked to vehicles. Transportation represents one of the primary sectors in global energy consumption, emitting substantial amounts of CO2 that contributes to the greenhouse effect [1]. Road transport CO2 emissions account for 70% of the overall transport emissions [2]. With the global energy transition and the increasing demand for clean energy, China is committed to achieving a “Peak carbon” target by 2030 and a “Carbon neutrality” target by 2060 [3]. Conventional fuel vehicles emit substantial amounts of CO2 and are also exposed to issues including oil shortages and environmental pollution. These concerns have prompted China to promote electric vehicles (EVs) since 2009 [4]. Since then, EVs have developed rapidly in China. The production and sale volume were 12.89 million and 12.87 million in 2024 [5], respectively, with the ownership of 31.4 million. Meanwhile, the volume of vehicle (including EV and conventional vehicle) ownership per 1000 people in China is 226, which is lower than the 837 in the US and the 629 in Japan in 2022 [6], indicating substantial growth potential. EVs include battery electric vehicles (BEVs) and plug-in hybrid electric vehicle (PHEVs). According to the models, EVs can be divided into passenger vehicles, buses, lorries, etc. The proportion of buses and lorries is lower than that of passenger vehicles. EVs are developing rapidly in the field of passenger vehicles, so this study focuses on EV passenger vehicles as the research object.
Although EVs do not need to rely on fossil fuels, they require a new component as a power source. EVs generally rely on lithium-ion batteries (LIBs), a clean energy source, as a driving force for road transport tasks [7]. As “energy storage units”, LIBs have a limited amount of stored electricity and cannot power EVs continuously. Consequently, charging pile (CP) is required as an energy “bridge” to provide continuous power to LIBs. According to the Energy Saving and Electric Vehicle Yearbook, the ownership of CPs in China was 12.82 million in 2024. With the increasing prevalence of EVs, the amount of CPs will continue to rise in the future.
LIBs and CPs contain many metallic and non-metallic resources, such as Li, Co, Al, Cu, F, rare earth (RE), and graphite. The growth of EVs will inevitably consume substantial amounts of these resources, posing risks and challenges to their supply chains. In this study, we consider the strategic mineral resources (SMRs) involved in LIBs and CPs for EVs. The concept of SMRs was originally established by the U.S. In 1917, the U.S. called 16 minerals “strategic minerals” to stimulate their production and to control the distribution of fuels for war. Nowadays, SMRs are crucial in maintaining national economic stability and food security, supporting the development of high-tech industries and ensuring the modernization of military forces. In recent years, China has also begun to focus on strategic minerals.
The National Mineral Resources Plan (2016–2020) specifies that, to meet the needs of national economic security, national defense security, and the development of strategic emerging industries, China’s SMRs include six types of energy minerals such as oil, natural gas, and coal; fourteen types of metal minerals including Li, Co, and Ni; and four types of non-metallic minerals such as P and crystalline graphite. SMRs are the core of national resource security, which are crucial to the national economic security, national defense, and the development of strategic emerging industries [8]. However, currently, the gap between the supply and demand of many important minerals in China is still very significant, and the security of SMRs is still a cause for concern. With the rapid development of the EV industry, vehicle electrification will inevitably drive up the demand for these resources. Consequently, there is growing concern about the impacts of this trend [7,9].
In the context of the transition to the electrification of conventional vehicles, some scholars have compared the changes in demand for Li, Ni, Co, and rare metals between conventional vehicles and EVs, which in turn has led to recommendations to safeguard the sustainability of these resources [10,11].
Several studies have utilized methods such as material flow analysis (MFA) and critical raw material assessment models to analyze the demand and scrap volume of key metals including Li, Co, Ni, Mn, and graphite. These studies examine metabolic characteristics and provide recommendations to promote the sustainable development of the LIB industry [12,13]. Other research has established different scenarios and applied MFA and simulation methods to demonstrate that sound strategic planning and management strategies for end-of-life (EoL) LIBs can enhance recycling efficiency and ensure the sustainable supply of critical materials [14,15]. Shafique et al. analyzed the impacts of the LIB markets in China and the United States on the demand for elements such as Ni, Li, and Co, as well as the recycling and cascading use of materials from spent batteries, by setting up three distinct scenarios [16]. Shamugam et al. evaluated the total metal demand and criticality of LIBs in Germany based on two different battery market scenarios, analyzing potential challenges related to supply security, economic vulnerability, and environmental impacts [17]. Sun and Zhao et al. assessed future risks associated with Li, Co, and Ni in EVs under three scenarios, using methods such as life cycle assessment, and proposed corresponding strategies to mitigate these risks [18].
There is more research on the LIB recycling process. Previous studies have focused on the innovation of the recycling process [19,20,21,22,23]. Gao et al. established a green recycling evaluation system for LIBs [24]. Tian et al. analyzed the spatiotemporal characteristics of EoL LIBs in China by establishing different scenarios, examining the patterns of EoL batteries, the potential economic value of the recycling industry, and the distribution of recycling sites [25].
Previous studies on CPs have focused on solving the shortage of CPs [26,27], how to reasonably lay out the CPs [28,29], and the technology to improve the CP facilities [30]. Those studies did not mention the impact of SMRs in CPs, so this study takes CPs into account from a life cycle perspective.
Existing studies primarily focus on the scrap volume of EVs and related resources but often overlook the challenges posed by the rapid development and EoL charging infrastructure on critical resource supplies. Moreover, most research emphasizes the scrap volume of key metal resources, with limited attention given to non-metallic resources. Furthermore, existing studies mainly address the scrap volume of EVs, LIBs, and associated resources, without considering the actually recoverable quantities of these EoL resources.
We have noted that the electrolyte in LIBs contains LiPF6 [31,32,33], and improper disposal or an inappropriate selection of treatment processes will lead to severe consequences. Many studies tended to ignore the consumption of F, P, and Li in electrolytes and the consumption of P in LiFePO4 as cathode material. Meanwhile, F is extensively used in industrial and nuclear sectors, while P is extensively used in chemical production and agricultural industries. Given their strategic significance to economic development and national defense, both elements have been designated as SMRs by China. Consequently, this study incorporates F and P elements into research scope. From a life cycle perspective, this study systematically analyzes and predicts the scrap volume and gap rate of SMRs resulting from EV development. Based on the SMRs contained in LIBs and CPs, Al, Au, Co, Cr, Cu, Fe, Li, Mo, Ni, Sb, Sn, Zr, RE (Ce, Dy, Eu, Gd, Nd, Pr, Tb, Y), Graphite, F, and P are included in this study.
Figure 1 shows the life cycle process of LIBs and CPs from production to EoL recycling. Based on a life cycle perspective, this study sets up six different scenarios to forecast the ownership and scrap volume of EVs in China during 2010–2050, to determine the scrap volume of LIBs during 2010–2050 and CPs during 2018–2050. This study sets up two different scenarios by considering the recovery rate of LIBs under the premise of government intervention. By integrating the demand and scrap volume and the recovery rate of SMRs in LIBs, it further analyzes the impact of different levels of intervention on the SMR gap rate.

2. Material and Methodology

All result figures in this study were generated using Origin 2025b.

2.1. Projection of EV Ownership

The growth of vehicle ownership depends on the population and gross domestic product (GDP). Its growth trend follows an “S-shaped” curve and can be divided into three stages. The first stage is the slow-growth stage, during which the number of vehicles increases gradually. The second stage is the outbreak stage, when the number of vehicles explodes and penetrates the market. The third stage is the saturation stage, which is marked by a continuous influx of vehicles into the market, gradually reaching a state of saturation. There are three types of “S-shaped” curves, of which the Gompertz function and the Logistic function are deformations of the Richards function [34]. Some studies have used the Gompertz function to predict conventional passenger vehicle ownership in individual provinces or the whole of the Chinese mainland [16,35,36], and to predict EV ownership [37,38]. The Gompertz function is considered to be the best function for predicting vehicle ownership in China [34], so this study also uses the Gompertz function to predict ownership, and the calculation formula is shown in Equation (1).
O   = A · exp [ B · exp ( C · PGDP ) ] · P / 10 3
where O is the amount of EV ownership (unit: 10,000 vehicles); PGDP is the GDP per capita (unit: Dollar/person), where USD 1 is equal to CNY 7 due to the change in currency exchange rate from time to time; A is the saturation volume of EVs in 1000 people (unit: vehicles/1000 people); B and C are the parameters determining the shape of the curve; P is the population (unit: 10,000 people).
PGDP is calculated as the ratio of GDP to population. Data for population and GDP for 2010–2024 were sourced from the China Statistical Yearbook. The population for 2025–2050 is sourced from the medium scenario of China’s population in the future as projected by Chen [39], and is shown in Table S1; the growth rate of GDP is taken from Wang et al. [36] and is shown in Table S2. Data on EV ownership and sale volume are sourced from the Energy Saving and Electric Vehicle Yearbook, China Automotive Industry Yearbook, China Association of Automobile Manufacturers, and China Statistical Yearbook, which are shown in Tables S3 and S4.
The formula for calculating the saturation value in thousands for EVs is shown in Equation (2).
A =   A O   ×   y max
where AO is the saturation volume of conventional passenger vehicles in 1000 people (unit: vehicles/1000 people) and ymax is the saturation value of penetration of EVs (unit: %).
The penetration rate of EVs follows the “S-shaped” curve pattern and is predicted using a Logistic function. In this study, the maximum value of the penetration rate is determined based on relevant reports and a comparison of the fitted R2 values, and the expression of the Logistic function is shown in Equation (3).
y   = y max 1 + exp ( b     cT )
where y is the penetration rate of EVs in the current year (unit: %); ymax is the saturation value of EV penetration (unit: %); T is the time (2010, T = 1); and b and c are parameters that determine the shape of the curve.
To reduce uncertainties associated with GDP and population, this study sets six scenarios by varying AO and ymax. Specific values are shown in Table S5.

2.2. Projection of LIB Scrap Volume

Given the inherent uncertainty in the lifespan of electromechanical products, the Weibull function is employed to predict their lifespan distribution. This function has been widely used for battery EoL prediction in EVs [16,25,40]. The expression of the Weibull function is shown in Equation (4).
P   ( t , t n )   = k λ · ( T λ ) k 1 · exp [ ( T λ ) k ]
where P(t,tn) is the probability that EVs (t = 2010–2050, ttnt + Tmax) produced in year t will be scrapped in year tn (unless otherwise specified, all data and projections presented herein pertain to the 2010–2050 timeframe); T is the lifespan of the LIBs (1 ≤ TTmax); and k and λ determine the shape of the curves, and they can be calculated by Equations (5) and (6) [41].
( T ave T max ) k = k 1 k · ln 100
λ   = T ave · ( 1 1 k )   1 k
where Tave is the average lifespan of the LIBs and Tmax is the maximum lifespan of the LIBs.
In this study, it is set that the EV does not renew the LIB during the whole life cycle, i.e., the LIB is scrapped when the EV is scrapped. The average lifespan is taken as half of the maximum lifespan, and the value calculated by k is 2.833. With the development and advancement of technology in the future, the lifespan of LIBs will gradually increase. The maximum lifespan of LIBs is taken from the segmented battery lifespan according to time studied by Ai et al. The distribution is shown in Table S6 [42]. The distribution of Weibull lifespan of LIBs in this study is shown in Figure S1.
The formula for calculating the amount of EVs produced in year t and scrapped in year tn is shown in Equation (7). Since scrapping is counted by year, the scrap volume of EVs in a given year tx includes the amount produced in year t and scrapped in year tx, calculated as shown in Equation (8).
EoL ( t , t n ) = Demand ( t )   ×   P ( t , t n )
EoL ( t x ) = EoL ( t , t x )
where EoL(t,tn) is the amount of EVs demanded in year t and scrapped in year tn (ttn) (unit: 10,000 vehicles); Demand(t) is the amount of EVs demanded in year t (unit: 10,000 vehicles); EoL(tx) is the total scrap volume of EVs in year tx (unit: 10,000 vehicles); and EoL(t,tx) is the amount of EVs demanded in year t and scrapped in year tx (ttx) (unit: 10,000 vehicles).

2.3. Projection of EV Demand

The demand for EVs can be divided into two parts according to time, one for past years and the other for future years. The future (2025 and beyond) demand for EVs can be predicted in terms of retention and retirement, as shown in Equation (9).
Demand ( t d ) = O ( t d )     O ( t d 1 ) + E o L ( t d )
where Demand(td) is the demand in year td (td = 2025–2050) (unit: 10,000 vehicles); O(td) is the EV ownership in year td; O(td − 1) is the EV ownership in year td − 1 (unit: 10,000 vehicles); and EoL(td) is the total scrap volume of EVs in year td (ttd), calculated as in Equation (8) (unit: 10,000 vehicles).

2.4. Scrap Volume of SMR in LIBs

According to the theory of material flow and conservation, this study uses the method proposed by Zeng et al. for accounting [43]. The formula for calculating the amount of substance i scrapped in year tx is shown in Equation (10).
SCR i = AMCI i   ×   BC
where SCRi is the amount of i (i = Li (electrode), Ni, Co, Al, Cu, Graphite, LiPF6) scrapped in year tx (unit: kg); AMCIi is the average consumption intensity of substance i in the cathode materials of different LIBs (unit: kg/kWh); and BC is the total battery capacity of the batteries scrapped in year tx (unit: kWh).
The average consumption intensity of metal i in the cathode materials of different LIBs is related to the market share and consumption intensity of LIB type, as calculated in Equation (11) (Li in the electrolyte is not considered here).
AMCI i = j M ij ×   MSC j
where Mij is the consumption intensity of metal i in a given type of LIB j (unit: kg/kWh) and MSCj is the market share of a given type of LIB j.
Different types of LIBs and the different metals they contain have different consumption intensities, which is shown in Table S7 [44,45]. The market share of different types of LIBs varies due to a combination of performance, technology, and economics. These are shown in Figure S2 for the period 2010–2022 and Figure S3 for the period 2023–2050.
Not only will the market share of the batteries change, but the capacity of the batteries will also change with the development of future technology. In this study, we take the capacity of the batteries using non-linear equations, as studied by Geng et al. The values are shown in Table S8 [46]. The formula for calculating the total battery capacity of the scrapped battery at year tx is shown in Equation (12).
BC   =   BC BEV   ×   EoL BEV +   BC PHEV   ×   EoL PHEV
where BCBEV and BCPHEV are the capacity of batteries in BEV and PHEV produced in year t, respectively (unit: kWh/10,000 vehicles) and EoLBEV and EoLPHEV are the scrap volume of BEV and PHEV in year tn, respectively (unit: 10,000 vehicles).
Since PHEV is an override of internal combustion engine vehicles (ICEVs) and BEVs, the trend of future market share is that PHEVs will increase in the short term and will decrease after reaching a certain level, and the market share of BEVs is the opposite of that of PHEVs. The market share ratios set in this study are shown in Figure S4.
The P and F in LIBs are present in the electrolyte of the battery in the form of LiPF6. In addition, the P is also present in LFP in the form of LiFePO4, which is used as the cathode material for LIBs.
Based on the summary of the composition of LIBs and the law of mass conservation by Dai et al. and Daigo et al. [47,48], the present study uses the consumption intensity to account for the elements P and F in the electrolyte, i.e., using Equation (10). Since the content of LiPF6 is essentially equal in all types of LIBs, this study sets the electrolyte consumption intensity in LIBs within the scope of the study to 0.125 kg/kWh.
In order to account for the scrap volume of Li, P, and F in LiPF6, the formula for the scrapping of the F and P elements is given in Equation (13).
m i   =   SCR j   ×   M i M j
where mi is the scrap volume of element i in substance j (unit: kg), SCRj is the scrap vol- ume of substance j (unit: kg), Mi is the relative atomic mass of element i in substance j, and Mj is the relative molecular mass of substance j.
In this study, we account for the scrap volume of Li for LIBs in Section 2.3, which includes LFP. First, we calculate the scrap volume of LiFePO4 during 2010–2050. Finally, according to Equation (13), we determine the scrap volume of P and Fe for the LFP.

2.5. Accounting Method for SMRs in CPs

CPs are divided into public charging piles (PuCPs) and private charging piles (PrCPs) in terms of private and public sectors, and direct current charging piles (DCCPs) and alternating current charging piles (ACCPs) in terms of the type of current.
The scrap volume of CPs is calculated in the same way as the scrap volume of EVs, as shown in Equation (9). CP ownership is equal to the product of EV ownership and VCR. For a given year, the scrap volume of a specific CP type is calculated as the product of the scrap volume of total CPs and the market share historically prevailing for that specific CP within the production batch reaching EoL. The scrap volume of a given element in a specific type of CP is calculated as the product of its mass content in the specific CP and the scrap volume of the specific CP. The details are shown in Supplementary Material Part C.
Raghavan et al. predicted the demand for various types of metals required for the transition to vehicle electrification in road transport in Sweden, and this transition involves the use of CPs for EVs [11]. CPs in China are divided into PuCPs, PrCPs, DCCPs, and ACCPs, a classification consistent with Raghavan’s study. Hence, the mass of each metal type in private ACCPs, public DCCPs, and ACCPs studied by Raghavan et al. was taken and the fraction of metals belonging to China’s SMRs was selected (Table S9) in this study, and the scrap volume of SMRs in CPs was calculated based on the annual scrap volume of CPs.

2.6. SMRs Recycle-Demand Gap Analysis

The demand for SMRs in EVs is calculated using Equations (9)–(13). The amount of i demanded in year t is denoted as MADi (i = Li (electrode), Ni, Co, Al, Cu, Graphite and LiPF6). The only differences are the following: (1) the scrap volume in Equation (12) should be replaced with demand volume; (2) replacing SCRi with MADi in Equations (10) and (13).
The recovery of SMRs is calculated on the basis of the amount of resource scrap volume and the recovery rates under current technological conditions, i.e., the amount of SMRs recovered is equal to the product of the amount of SMR scrap volume and the recovery rate, which is denoted as Reci (i = Li, Ni, Co, Al, Cu, Graphite, Fe, P and F). The recovery rates are based on average values from various references and studies, with specific numerical data shown in Tables S10 and S11.
As LIBs increasingly reach their EoL, government intervention becomes particularly important. Therefore, this study incorporates the recovery rate of LIBs following government intervention, which is denoted as GIj (j = 80% and 100%). Based on relevant studies, two scenarios are comprehensively considered: 80% and 100% [38].
In order to describe the gap between recycled SMRs in EoL LIBs and SMR demand for EV LIBs each year, this study addresses the recycle-demand gap of SMRs through gap analysis. The resource gap rate is denoted as GAPi (i = Li, Ni, Co, Al, Cu, Graphite, Fe P and F), which is calculated by Equation (14).
GAP i = 1 SCR i   ×   Rec i   ×   GI j MAD i
When GAPi > 0, the SMR recovery volume is less than the demand; when GAPi < 0, the recovery volume is more than the demand. A higher GAPi value indicates a more severe shortage.
Due to the lack of regulation, SMR recycling from CPs has not received sufficient attention. To date, there have been no relevant reports on the recovery rates of SMRs from CPs. Therefore, this study does not account for the recovery rates of SMRs in CPs.

3. Results

3.1. EV and CP Ownership

Through regression analysis of EV ownership during 2014–2024, parameters B, C, and R2 of the Gompertz function fitted to 2014–2024 EV ownership data under six scenarios are shown in Table S12. An R2 value greater than 0.8 is considered indicative of a satisfactory fit.
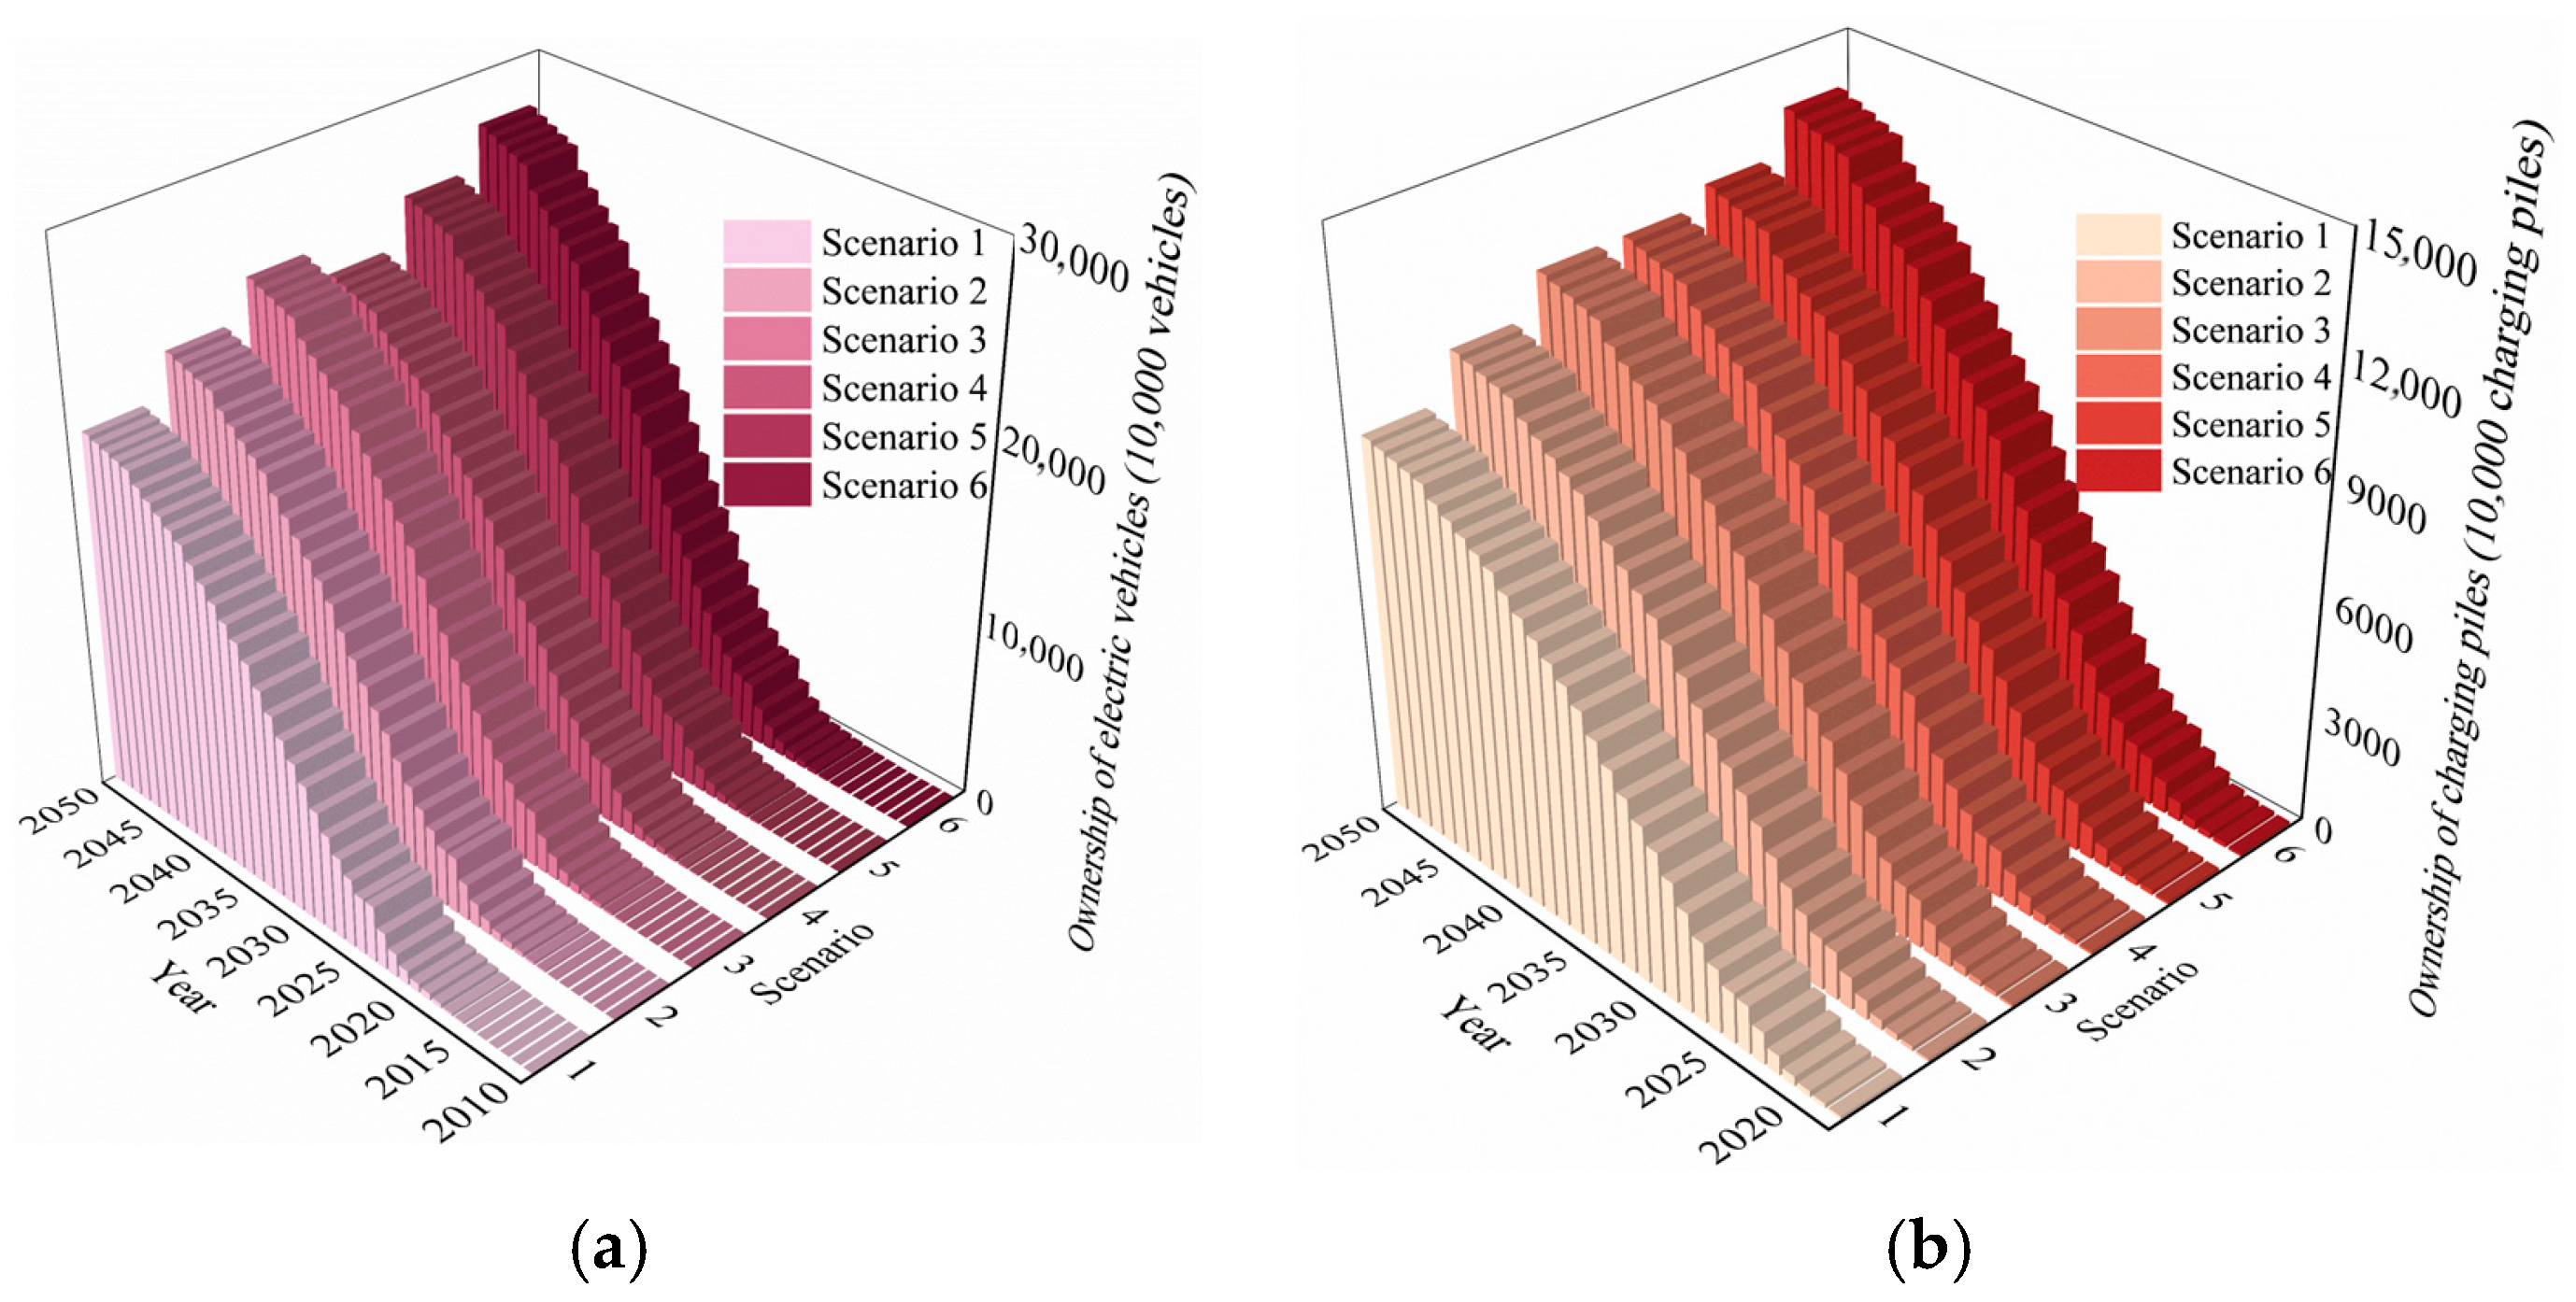
Figure 2 shows that the ownership of both EVs and CPs increases rapidly over time. By 2050, the predicted EV ownership under scenarios 1–6 will reach 196 million, 219 million, 240 million, 224 million, 250 million, and 273 million, respectively, with an average ownership of 234 million. Correspondingly, the predicted CP ownership under scenarios 1–6 will reach 98 million, 110 million, 120 million, 112 million, 125 million, and 136 million, respectively, with an average ownership of 117 million.

3.2. Scrap Volume of EVs and CPs

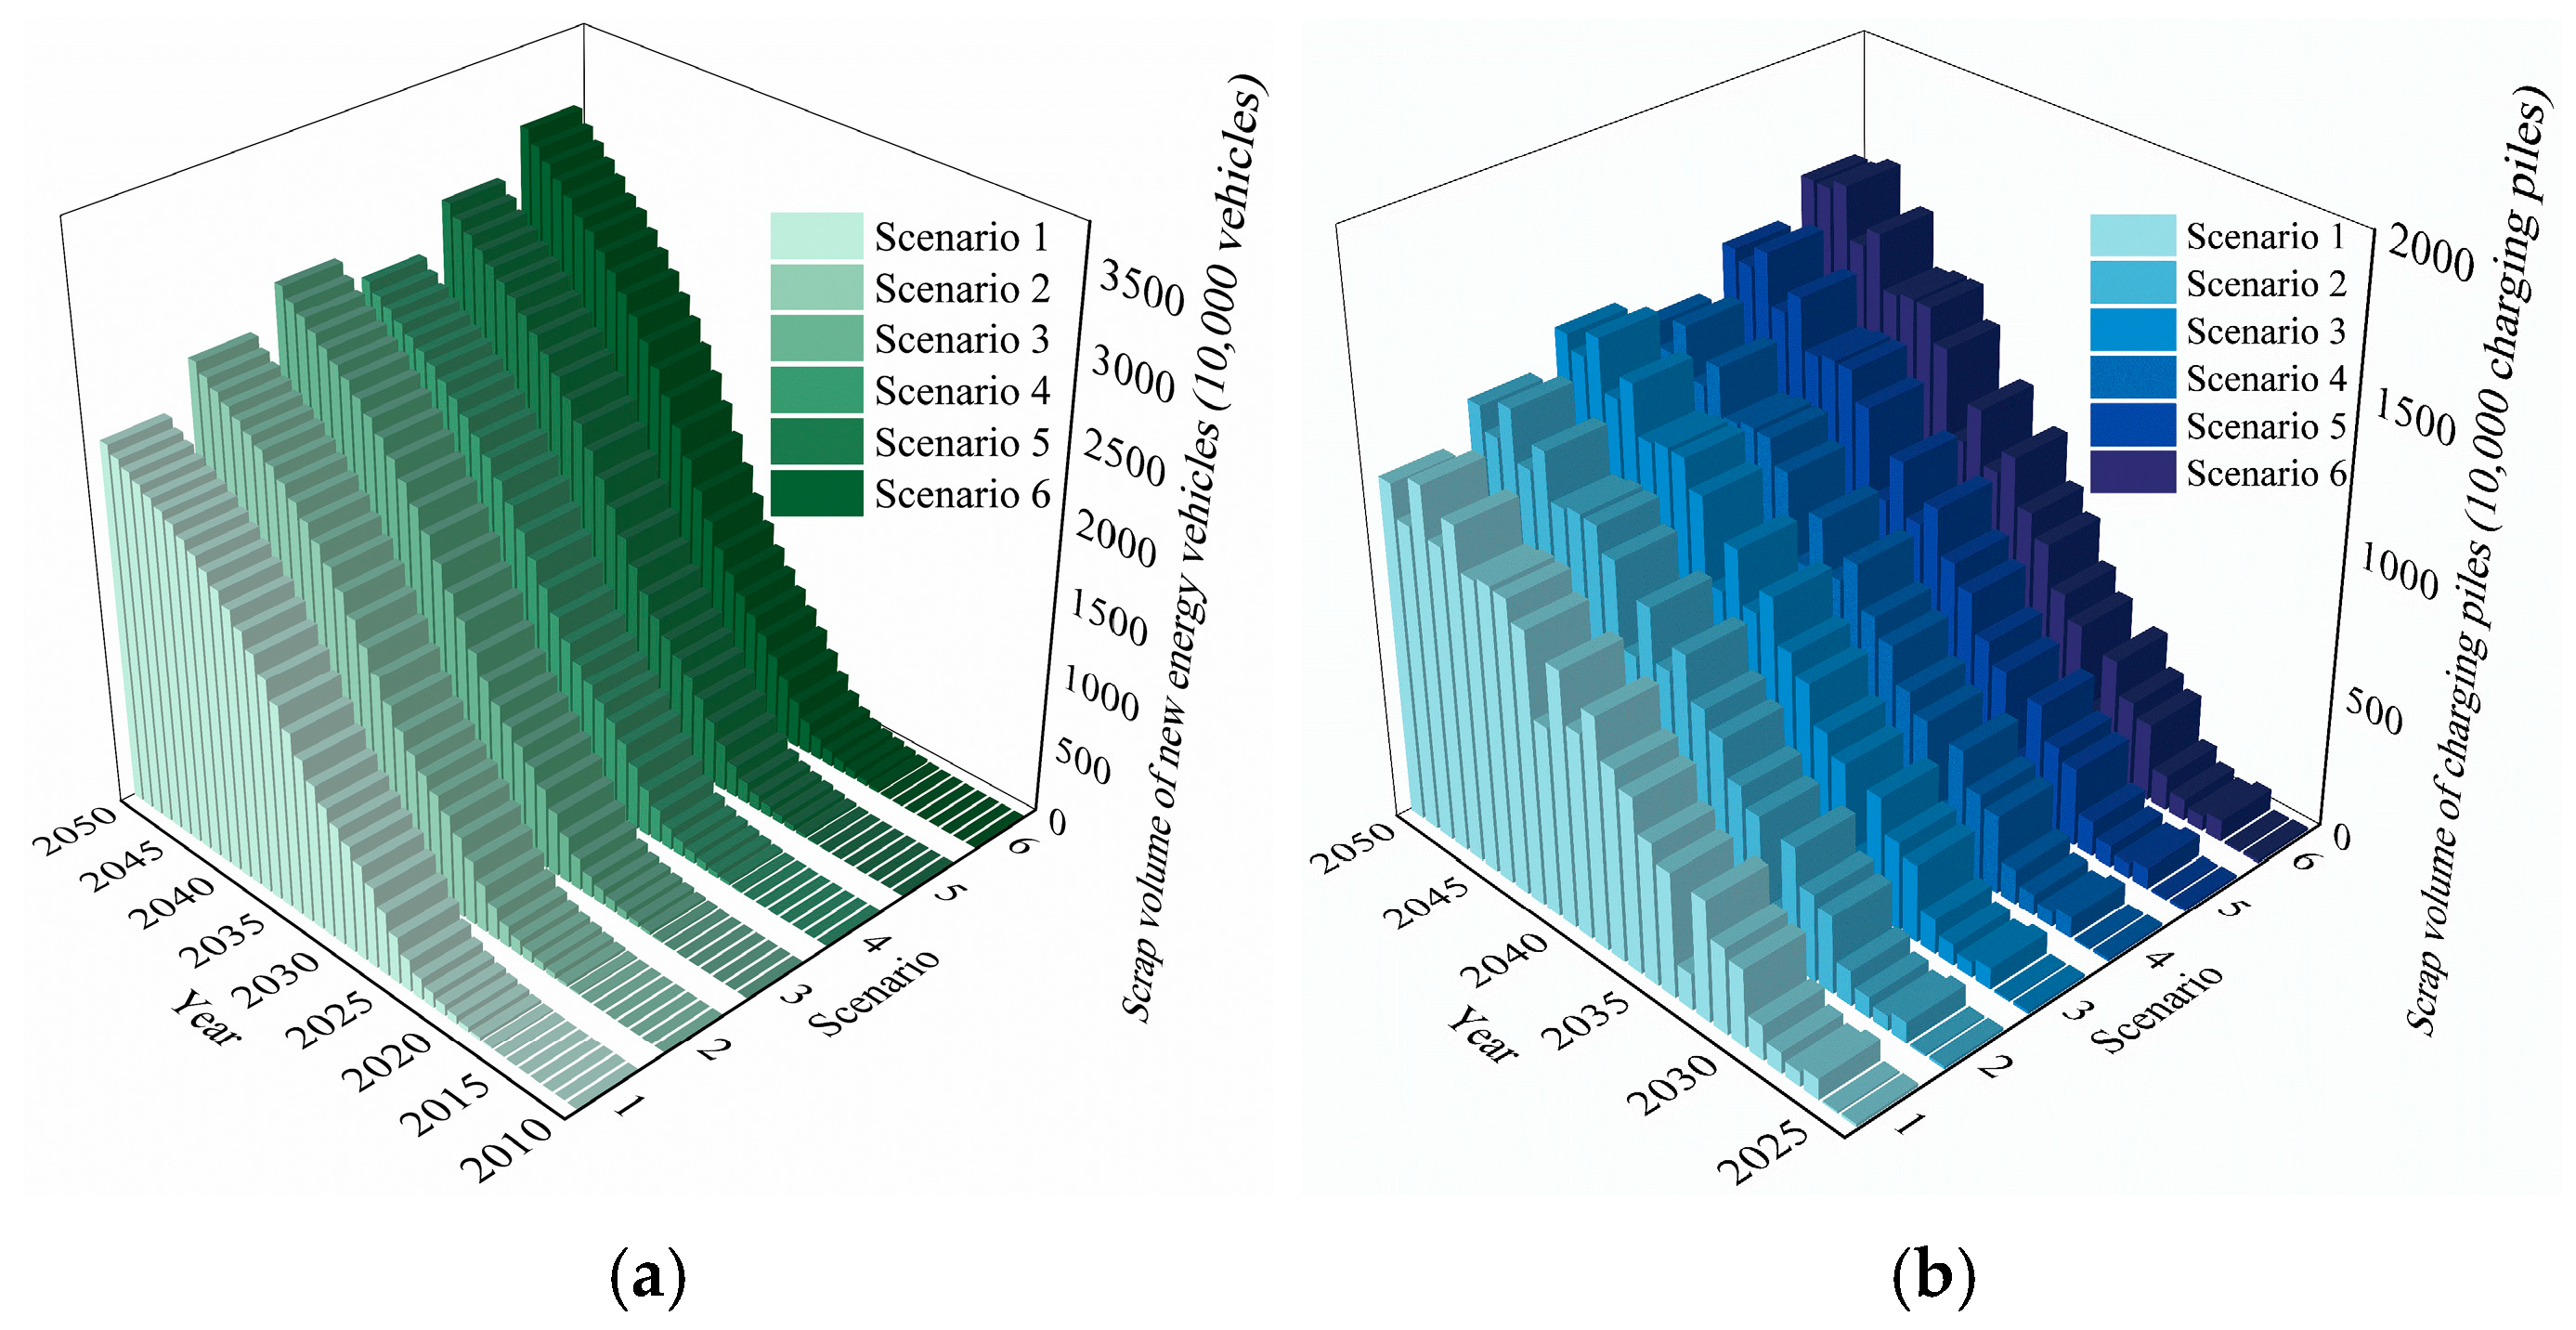
Combining Figure 2a and Figure 3a, we can find that, as the amount of EV ownership increases, the scrap volume of EVs also increases. Cumulative scrap volume of EVs under scenarios 1–6 is projected to reach 396 million, 428 million, 457 million, 435 million, 467 million, and 498 during 2010–2050, respectively, with an average cumulative scrap volume of 447 million EVs.
Combining Figure 2b and Figure 3b, we can find that, with the increase in the number of CPs, the scrap volume of CPs shows an increasing trend in fluctuation. The reason for the fluctuation is due to the different lifespans and market shares of DCCPs and ACCPs. Cumulative scrap volume of CPs under scenarios 1–6 is projected to reach 166 million, 181 million, 193 million, 184 million, 198 million, and 211 million during 2010–2050, respectively, with an average cumulative scrap volume of 189 million CPs. The scrap volume of various CPs under six scenarios during 2018–2050 are presented in Table S13.
According to the existing trend, more and more EVs and CPs will enter the EoL period. If they are not effectively recycled, then a large number of resources will be lost. In order to maintain the balance of supply and demand in the domestic EV industry, the degree of dependence on foreign countries for some of the key resources in LIBs and CPs will inevitably increase and pose a threat to the sustainable development of China’s SMRs.

3.3. Scrap Volume of SMRs in LIBs and CPs

3.3.1. Scrap Volume of SMRs in LIBs

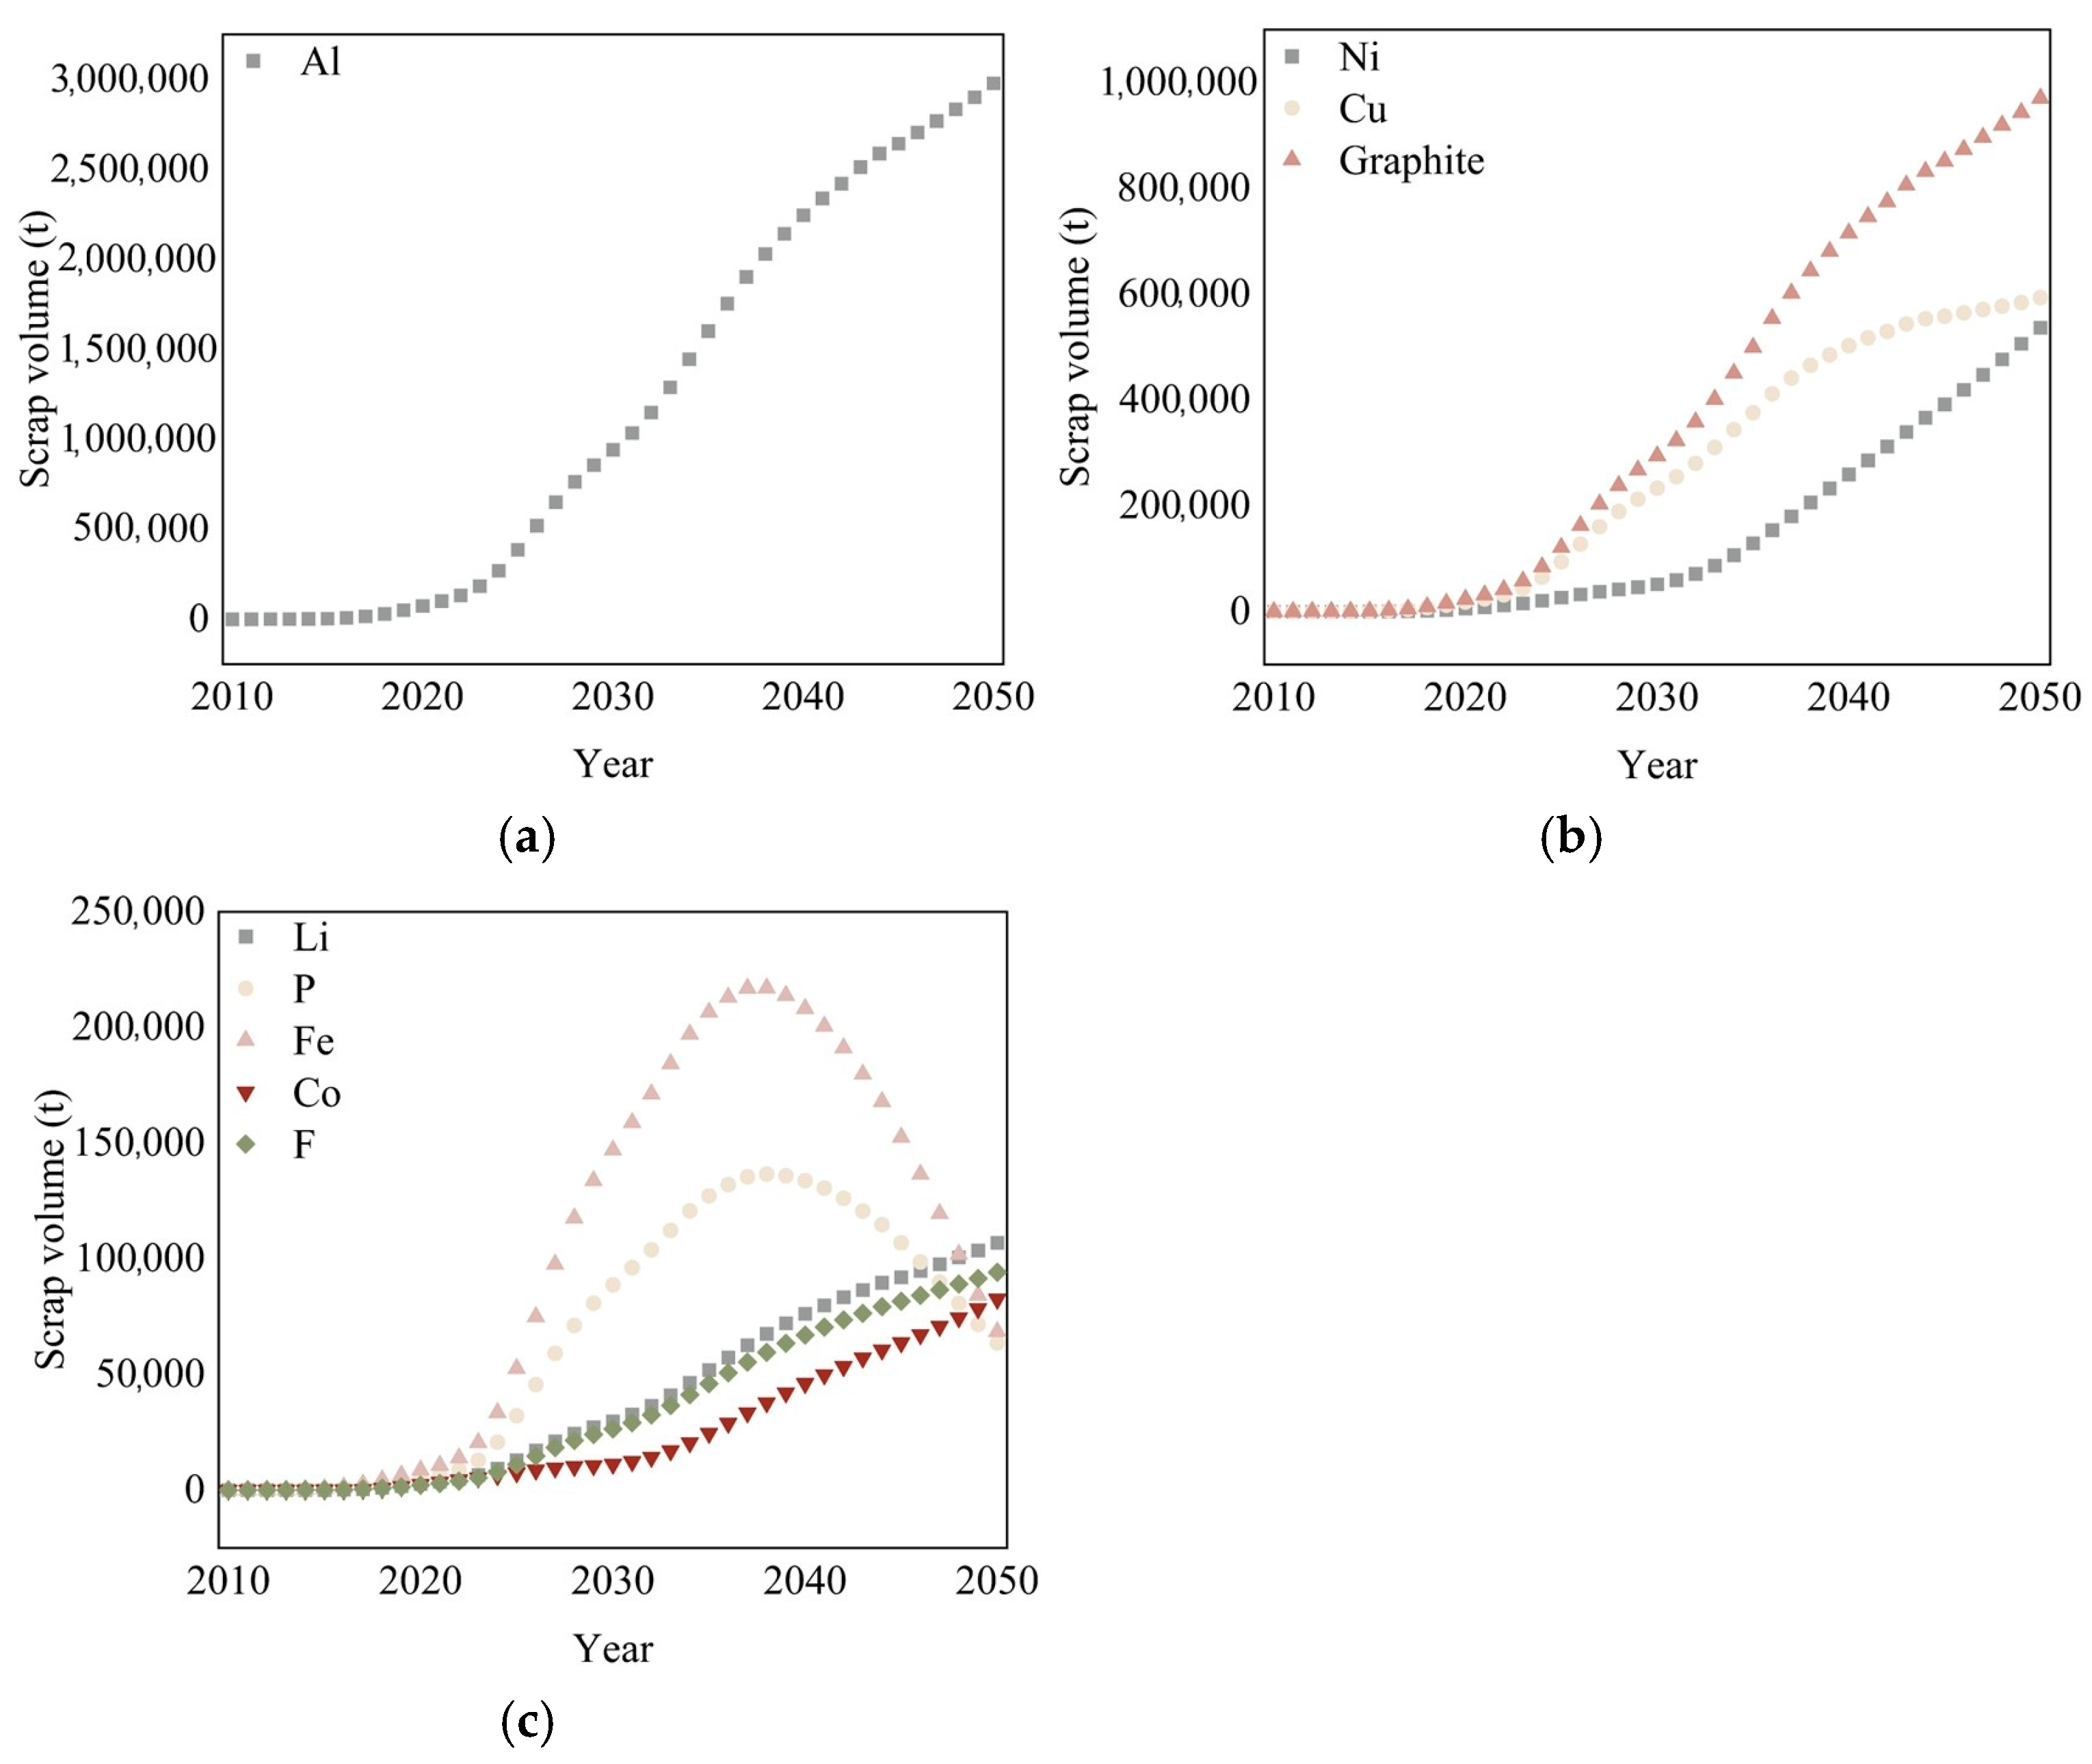
Figure 4 shows the results of averaging the scrap volume of SMRs in LIBs under six scenarios. In order to show more clearly the trend of the scrap volume of each resource over time, the scrap volume of each resource is divided into orders of magnitude to obtain three figures. Figure 4a–c show that the scrap volume decreases gradually, i.e., the scrap volume of Al is the largest, and the scrap volume of Co is the smallest. Since the market share of LIBs in 2010–2011 was all LFPs, and LFPs do not contain Ni and Co. Among these nine elements, the scrap volume of Ni and Co in 2010–2011 was 0 t, and the rest of the elements generated scrap volume in 2010. The scrap volume of Al, Ni, Co, Graphite, Li, Cu, and F started to increase gradually from 2010 onwards, and reached the maximum amount in 2050. Among them, Al has the fastest growth in scrap volume, approaching 9.42 × 10⁵ t in 2030 and reaching 2.98 × 10⁶ t in 2050. The scrap volume of graphite also increases rapidly, approaching 2.94 × 10⁵ t in 2030 and 9.71 × 10⁵ t in 2050. Compared with Al and graphite, the scrap volume of Ni and Cu increases at a slower rate. Specifically, the scrap volume of Cu tends to increase at a flat rate after 2040. The scrap volume of Co, Li, and F in Figure 4c shows a gradual growth trend but at a slow rate, with the scrap volume of 8.25 × 10⁴ t, 1.07 × 10⁵ t and 9.41 × 10⁴ t in 2050, respectively. Figure 4c shows that the scrap volume of Fe and P shows an increasing and then decreasing trend, reaching a maximum of 2.17 × 10⁵ t and 1.37 × 10⁵ t in 2038 and then decreasing to 6.84 × 10⁴ t and 6.36 × 10⁴ t in 2050, respectively.
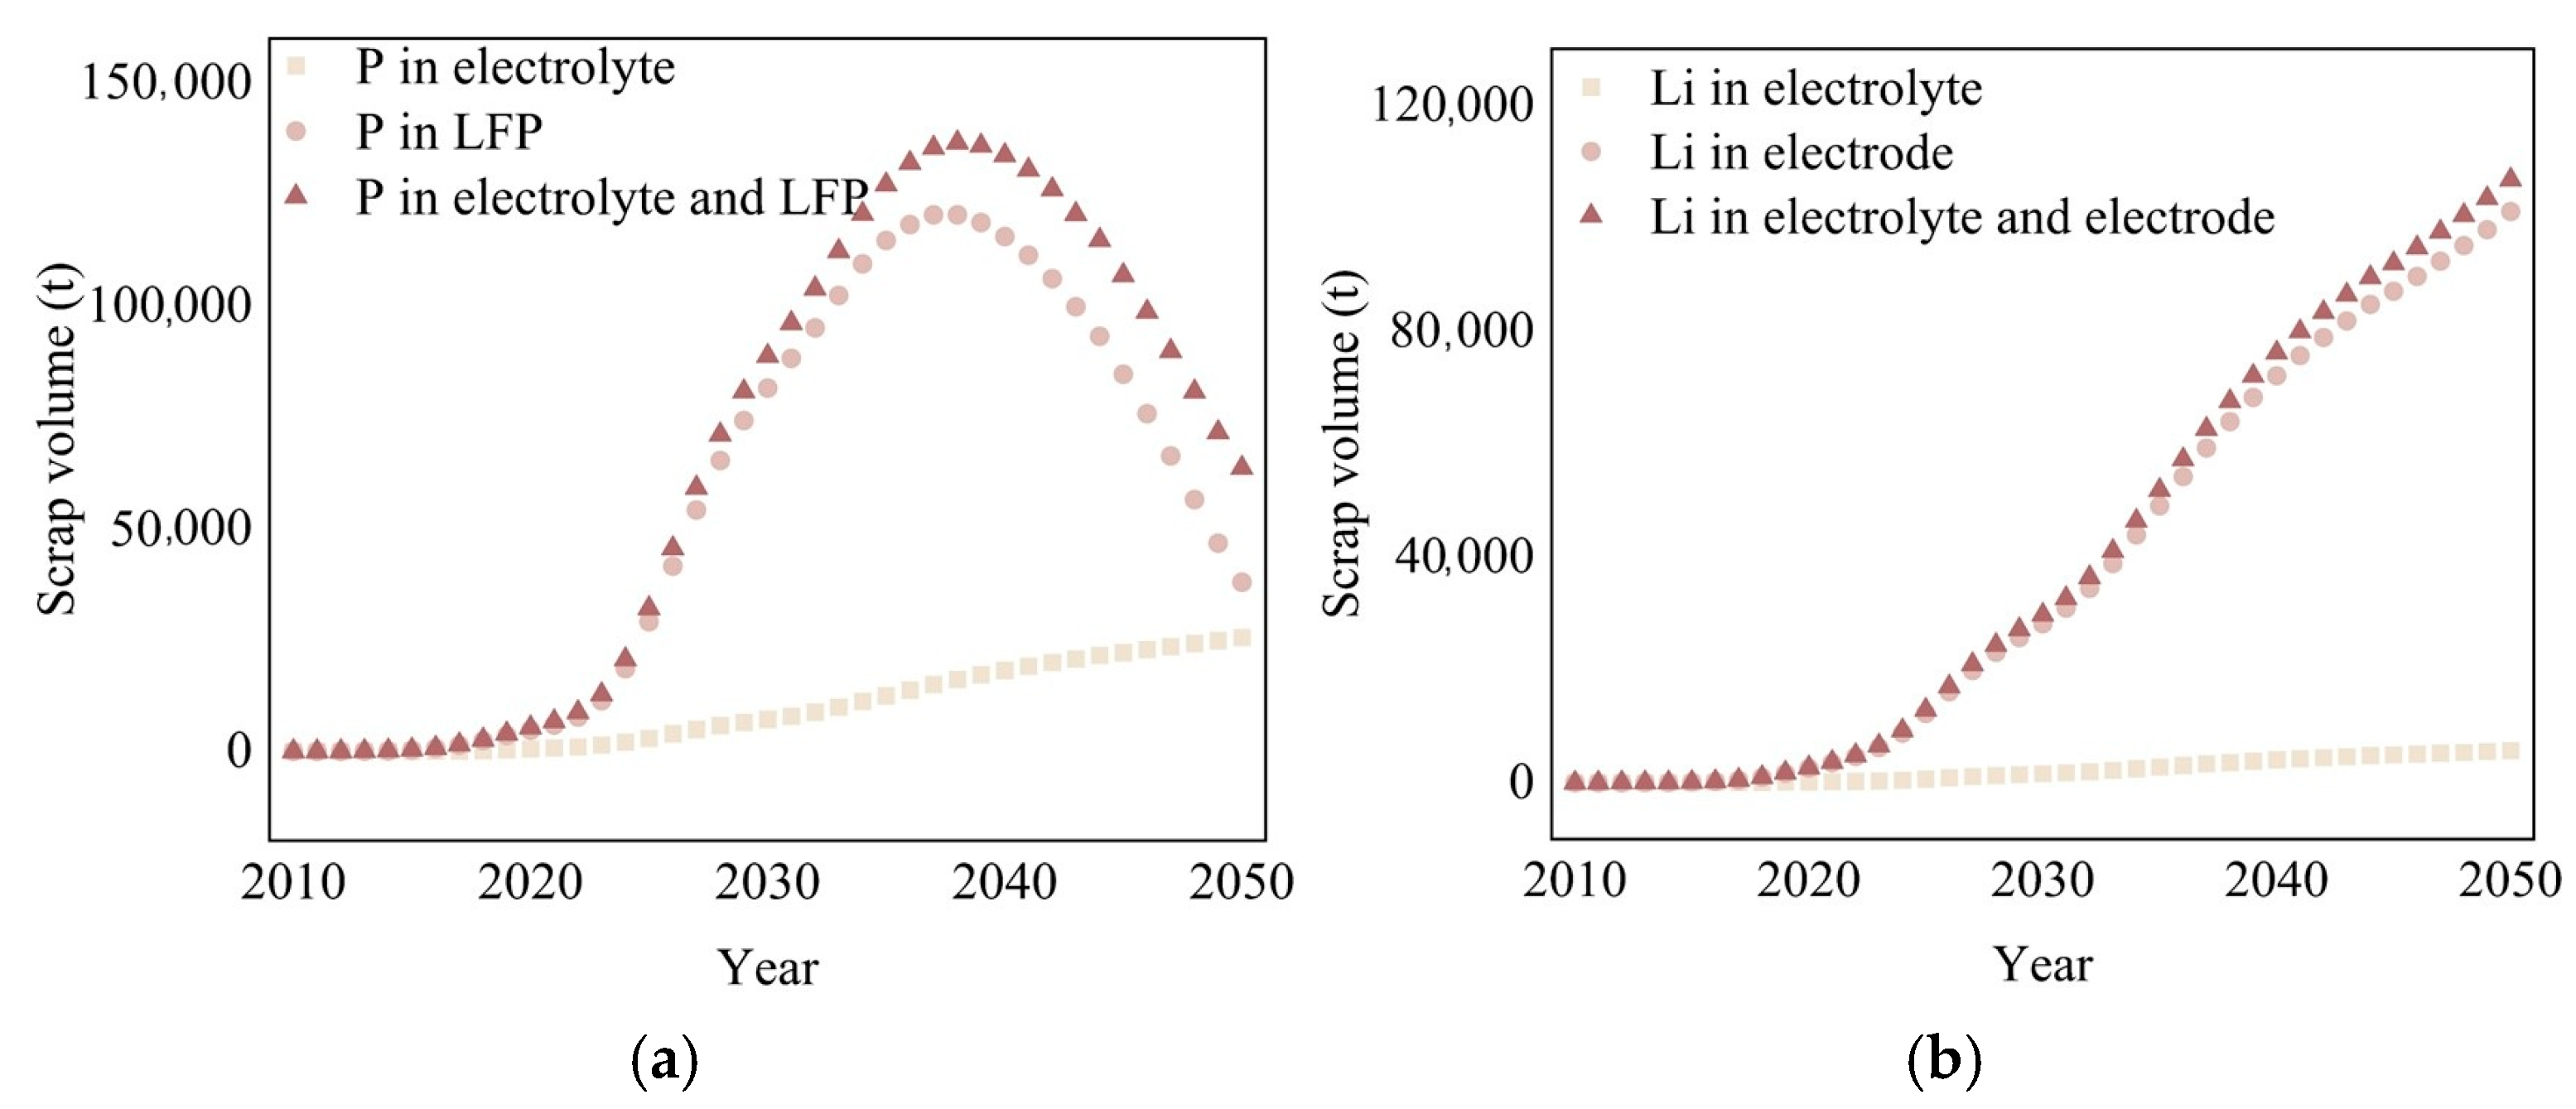
Figure 5a shows that the scrap volume of P in LFP is much larger than that of P in electrolyte. Specifically, the scrap volume of P exhibits a trend of increasing and then decreasing. It reaches a maximum of 1.20 × 10⁵ t in 2038 and then decreases to 3.8 × 10⁴ t in 2050. The scrap volume of P in electrolyte shows a trend of increasing year by year, and the scrap volume of P is 2.56 × 10⁴ t in 2050.
Combined with Figure 4c, it shows that, in 2038–2050, the decrease in the EoL of P is smaller than that of Fe. Figure 5a shows that the EoL source of P derives not only from LFP but also from the electrolyte. Consequently, while the scrap volume of both Fe and P is decreasing, the rate of decrease in P is slower than that of Fe.
Figure 5b shows that the scrap volume of Li in electrodes is much larger than that of Li in electrolyte. The scrap volume of Li in electrodes increases rapidly, approaching 2.81 × 104 t by 2030 and 1.012 × 105 t by 2050. The scrap volume of Li in electrolyte shows an increasing trend year by year, and scrap 5.70 × 10³ t in 2050.

3.3.2. Scrap Volume of SMRs in CPs

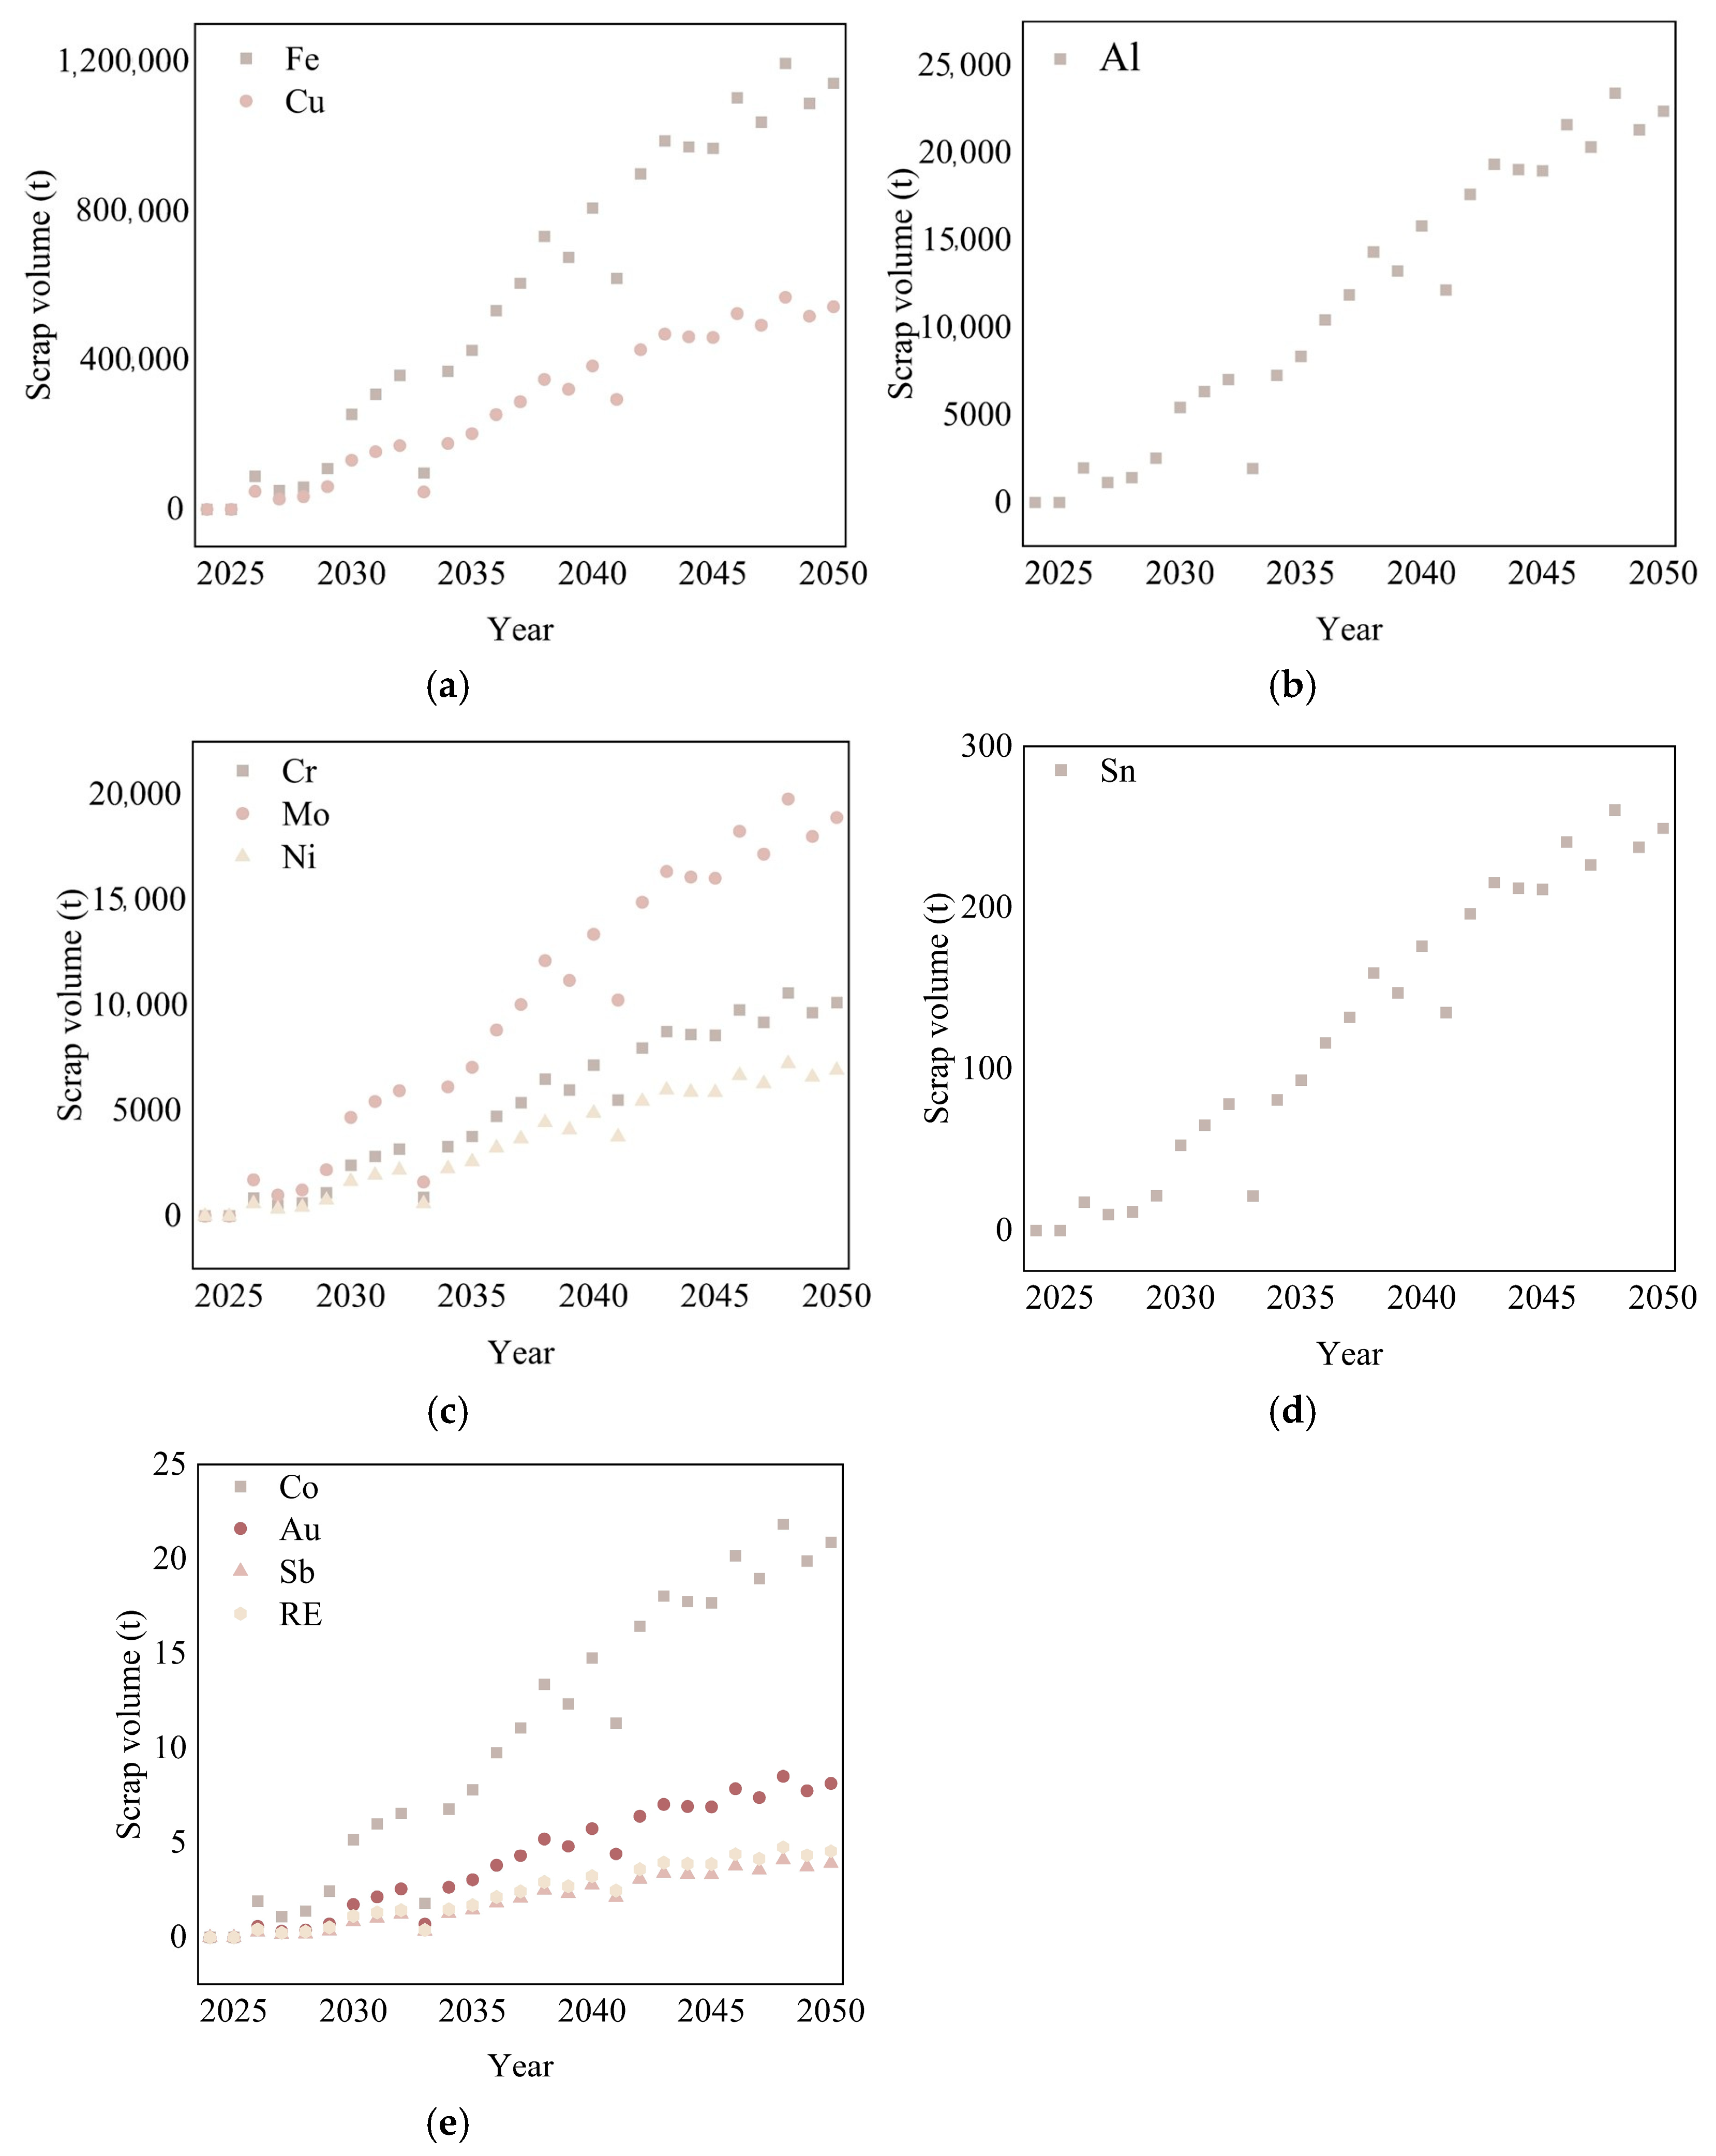
Figure 6 shows the results of averaging the scrap volume of SMRs in CPs under six scenarios. In order to show more clearly the trend of the scrap volume of each resource over time, the scrap volume of each resource is divided into orders of magnitude to obtain five figures, which decreases gradually. In addition to the elements in these five figures, small amounts of Li and Zr were scrapped. Among the RE elements scrapped, the amounts of Pr and Nd were much larger than those of the other RE elements, accounting for 54.9% and 44.4%, respectively. Additionally, a small amount of Dy, Ce, Eu, Gd, and Tb was also scrapped. In the five figures of Figure 6, the scrap volume of all SMRs increase successively from 2024, rising in fluctuation, reaching a minimum in 2025 and a maximum in 2048. Meanwhile, in Figure 6, it can be observed that the scrap volume in 2025, 2027, 2033, 2039, 2041, 2045, 2047, and 2049 shows a decrease compared to the neighboring years, which is caused by two factors: (1) differences in the scrap volume of various types of CPs; (2) variations in the content of SMRs in different types of CPs. Among these 20 elements, from the perspective of space and time, except for Zr, whose scrap volume in 2048 is 23 times that in 2025, the scrap volume of the other elements in 2048 is a thousand, ten thousand, or even more than one hundred thousand times that in 2025. This phenomenon results from three factors: (1) the scrap volume of different types of CPs exhibit variability; (2) the resource contents in these CPs also differ; and (3) the lower the content of a specific element in CPs, the smaller the annual variation in its scrap volume. Collectively, these factors determine the scrap volume dynamics of each resource. From an elemental perspective, Fe has the largest scrap volume, with 1.19 × 10⁷ t in 2048; Zr has the smallest scrap volume, with 1.52 × 10⁻⁵ t in 2048; Ce and Gd have the same scrap volume, with 2.62 × 10⁻⁴ t in 2048; and Sb and RE are close to each other, with 4.08 t and 4.76 t in 2048, respectively.

3.3.3. Common SMRs Scrapped in LIBs and CPs

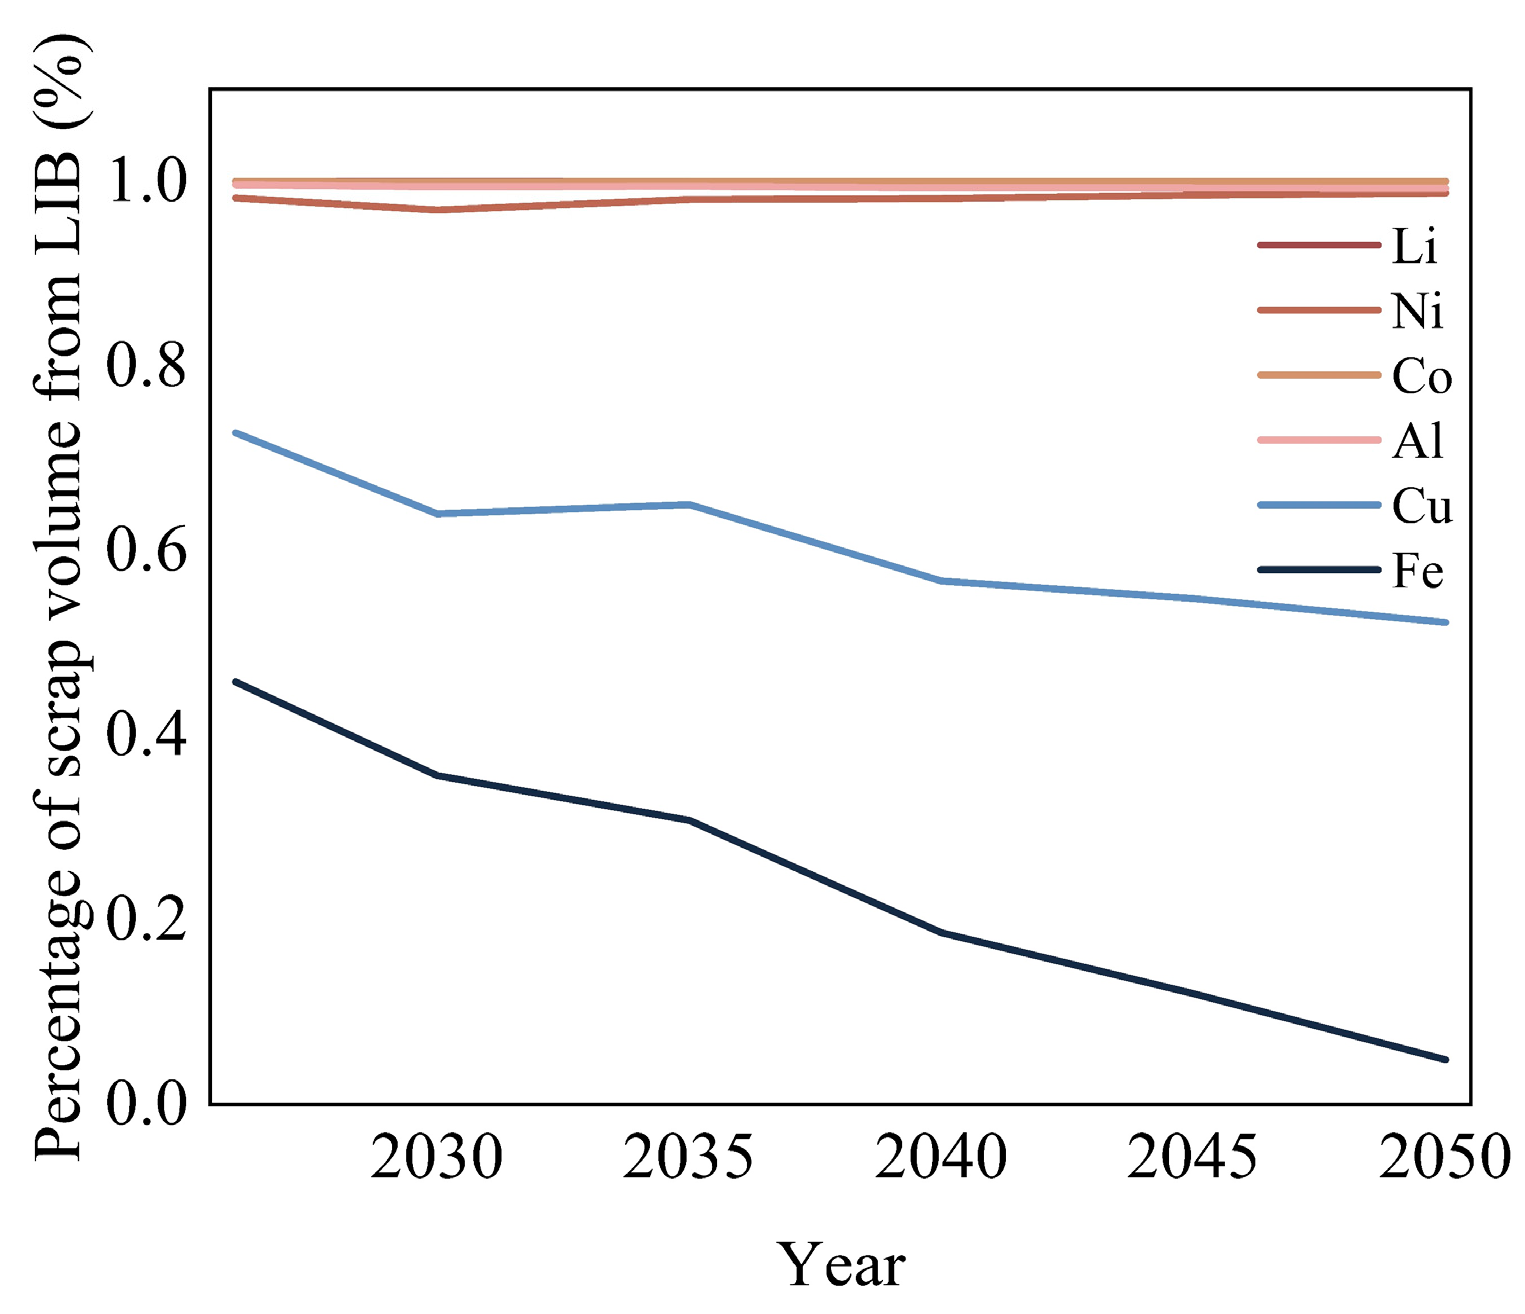
Figure 7 shows the projected percentage of scrap volume of common SMRs common to LIBs during 2026–2050. Regardless of the year, the EoL sources of Li, Ni, Co, and Al are almost entirely from LIBs. More than 99% of the scrap volume of Li, Co, and Al is from LIBs, and more than 97% of Ni is from LIBs. This is because CPs contain very small proportions of Li, Ni, and Co and LIBs contain high proportions of Al. Meanwhile, the EoL Fe and Cu from LIBs show a declining trend during 2026–2050 with fluctuations, which is attributed to two factors: (1) the scrap volume of CPs surges over time; (2) CPs contain high proportions of Fe and Cu. In 2030, 35.63% of the scrap volume of Fe originates from LIBs, while 64.37% originates from CPs. For Cu in the same year, 64% originates from LIBs and 36% from CPs. In 2050, the proportion for Fe from LIBs decreases to 4.87%, with CPs contributing 95.13%. Similarly, the proportion of Cu from LIBs decreases to 52.23%, with CPs contributing 47.77%. Therefore, Fe and Cu in EOL CPs are critical for recycling.

3.4. Impact of LIB Type on the Scrap Volume of SMRs

Under six scenarios, regardless of battery type, from the perspective of the overall scrap volume of LIBs, an average of 17.82 sets of batteries were scrapped in 2010, while an average of 0.28 billion sets of batteries were scrapped in 2050. This represents a 1.58 million times increase compared to 2010. Furthermore, an average of 396 million sets of batteries were cumulatively scrapped during 2010–2050. From the perspective of LIB installed capacity, an average of 609.74 kWh was scrapped in 2010, and an average of 803 million kWh was scrapped in 2050. This represents 1.32 million times more than that of 2010, and an average of 12.355 billion kWh was cumulatively scrapped during 2010–2050.
The intensity of metal consumption in different LIBs is different. Meanwhile, market share in different types of LIBs varies in different years. Hence, Table 1 lists the scrap volume of Li, Ni, Co, Al, Cu, and graphite in different types of LIBs from a cumulative perspective during 2010–2050 under six scenarios. Li, F, and P in the electrolyte and P and Fe in the LFP are not included in Table 1 because the electrolyte consumption intensity is the same in different types of LIBs. The LiPF6 consumption intensity is the same in each group of LIBs, considering that P and Fe as electrodes are only present in the LFP.
The magnitude of scrap for a given element often depends on the market share of that LIB and the intensity of metal consumption for that element. From the perspective of LIB type, NCM-811 has the largest scrap volume, with an average cumulative scrap volume of 204 million batteries, and NCM-111 has the smallest scrap volume, with an average cumulative scrap volume of 3.07 × 10⁵ batteries. From the perspective of EV loading volume, LFP has the largest scrap volume, with an average cumulative scrap volume of 4.313 billion kWh, and NCM-111 has the smallest scrap volume, with an average cumulative scrap volume of 0.1 billion kWh. NCM-111 has the smallest scrap volume, with an average cumulative scrap volume of 0.01 billion kWh. From the perspective of elements, Al in NCM-811 has the largest scrap volume, with an average cumulative scrap volume of 0.21 billion tonnes, and Li in NCM-111 has the smallest scrap volume, with an average cumulative scrap volume of 1.8 × 10³ t.
As can be seen from Table 1, under six scenarios, NCM-111 batteries show the smallest scrap volume of six elements and battery scrap due to their low capacity and low energy density. Under six scenarios, NCM-811 batteries show the largest scrap volume of six elements and battery scrap due to their large capacity, energy density, and market share. The following is noted:
(1)
LFP does not scrap Ni and Co, but a large amount of scrap P and Fe, which is closely related to the composition of the battery cathode. According to the existing trend, some EV manufacturers primarily promote LFP. However, due to the low energy density of LFP and the fact that the development of LFP is about to reach a bottleneck, the scrap volume of P and Fe in LFP will gradually decrease as existing LFP-equipped EVs are scrapped in the future. Cumulative scrap volume of Fe under six scenarios during 2010–2050 reaches 3.74 Mt, 3.98 Mt, 4.19 Mt, 4.03 Mt, 4.26 Mt, and 4.48 Mt, respectively, with an average cumulative scrap volume of 4.16 Mt. Cumulative scrap volume of P under six scenarios during 2010–2050 reaches 2.08 Mt, 2.21 Mt, 2.33 Mt, 2.24 Mt, 2.37 Mt, and 2.48 Mt, respectively, with an average cumulative scrap volume of 2.28 Mt.
(2)
NCA and NCM-811 are both batteries with high Ni content, but the market share of NCA is much smaller than that of NCM-811; this is due to the fact that NCA batteries are currently monopolized by Japanese and South Korean companies, which have stringent requirements compared to the production standards of NCM-811. At present, the environment for the production of NCA in China has not yet matured, and is faced with production barriers and challenges in the production process.

3.5. Impact of CP Type on Scrap Volume of SMRs

Due to variations in the types of CPs and their elemental composition being different, Table 2 lists the average scrap volume of SMRs in private ACCPs, public DCCPs, and ACCPs, each from a cumulative perspective during 2018–2050 under six scenarios. In terms of the types of elements scrapped, private ACCPs have the fewest types of elements scrapped and public DCCPs have the most types of elements scrapped. In terms of elemental scrap volume, in the private ACCPs, the cumulative scrap volume of Fe is the largest, with an average of 4.95 Mt; the cumulative scrap volume of Sb is the smallest, with an average of 24.15 t. In the public DCCPs, the cumulative scrap volume of Cu is the largest, with an average of 0.011 Mt; the cumulative scrap volume of Zr is the smallest, with an average of 0.22 kg. In the public ACCPs, the cumulative scrap volume of Fe is the largest, with an average of 10.52 Mt, and the cumulative scrap volume of Li is the smallest, with an average of 12.23 t. In the three types of CPs, the scrap volume of Al, Cr, Cu, Fe, Mo, Ni, and Sn are much larger than those of the rest of the elements. The scrap volume of the same element varies across different CPs, due to three factors: (1) different types of CPs require distinct components, resulting in varying demand for the element across different CPs; (2) variations in production processes among manufacturers for the same component, and differences in raw material sources; and (3) discrepancies in the size of individual CPs.
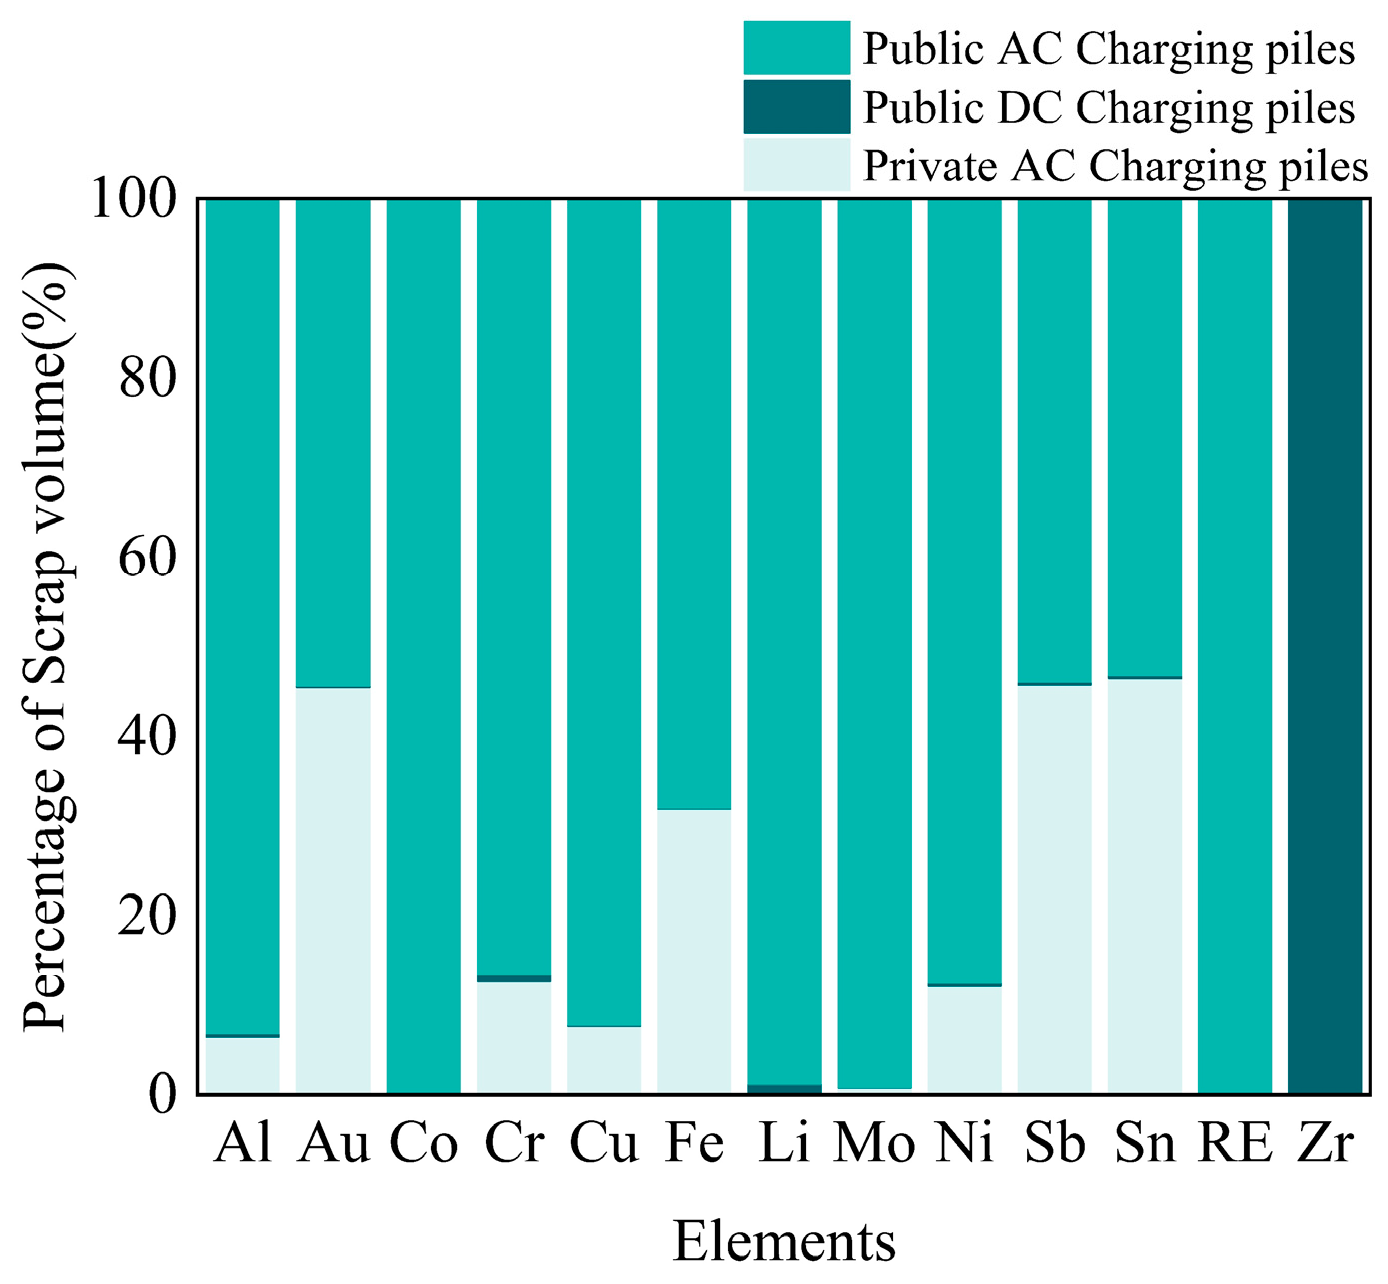
As shown in Figure 8, except for Zr, whose EoL source is only from public DCCPs, most of the EoL sources of the remaining elements are from public ACCPs, with the smallest percentage of EoL sources from public DCCPs. Au, Fe, Sb, and Sn accounted for approximately 55% of the scrap volume from public ACCPs. Al, Cr, Cu, and Ni accounted for approximately 90% of the scrap volume from public ACCPs. Li accounted for approximately 99% of the scrap volume from public ACCPs, and was the second-most scrapped element in public DCCPs other than Zr, accounting for 1.23%. Co, Mo, and RE accounted for approximately 99.5% of the waste from public ACCPs.

3.6. Recycle-Demand Gap Rate

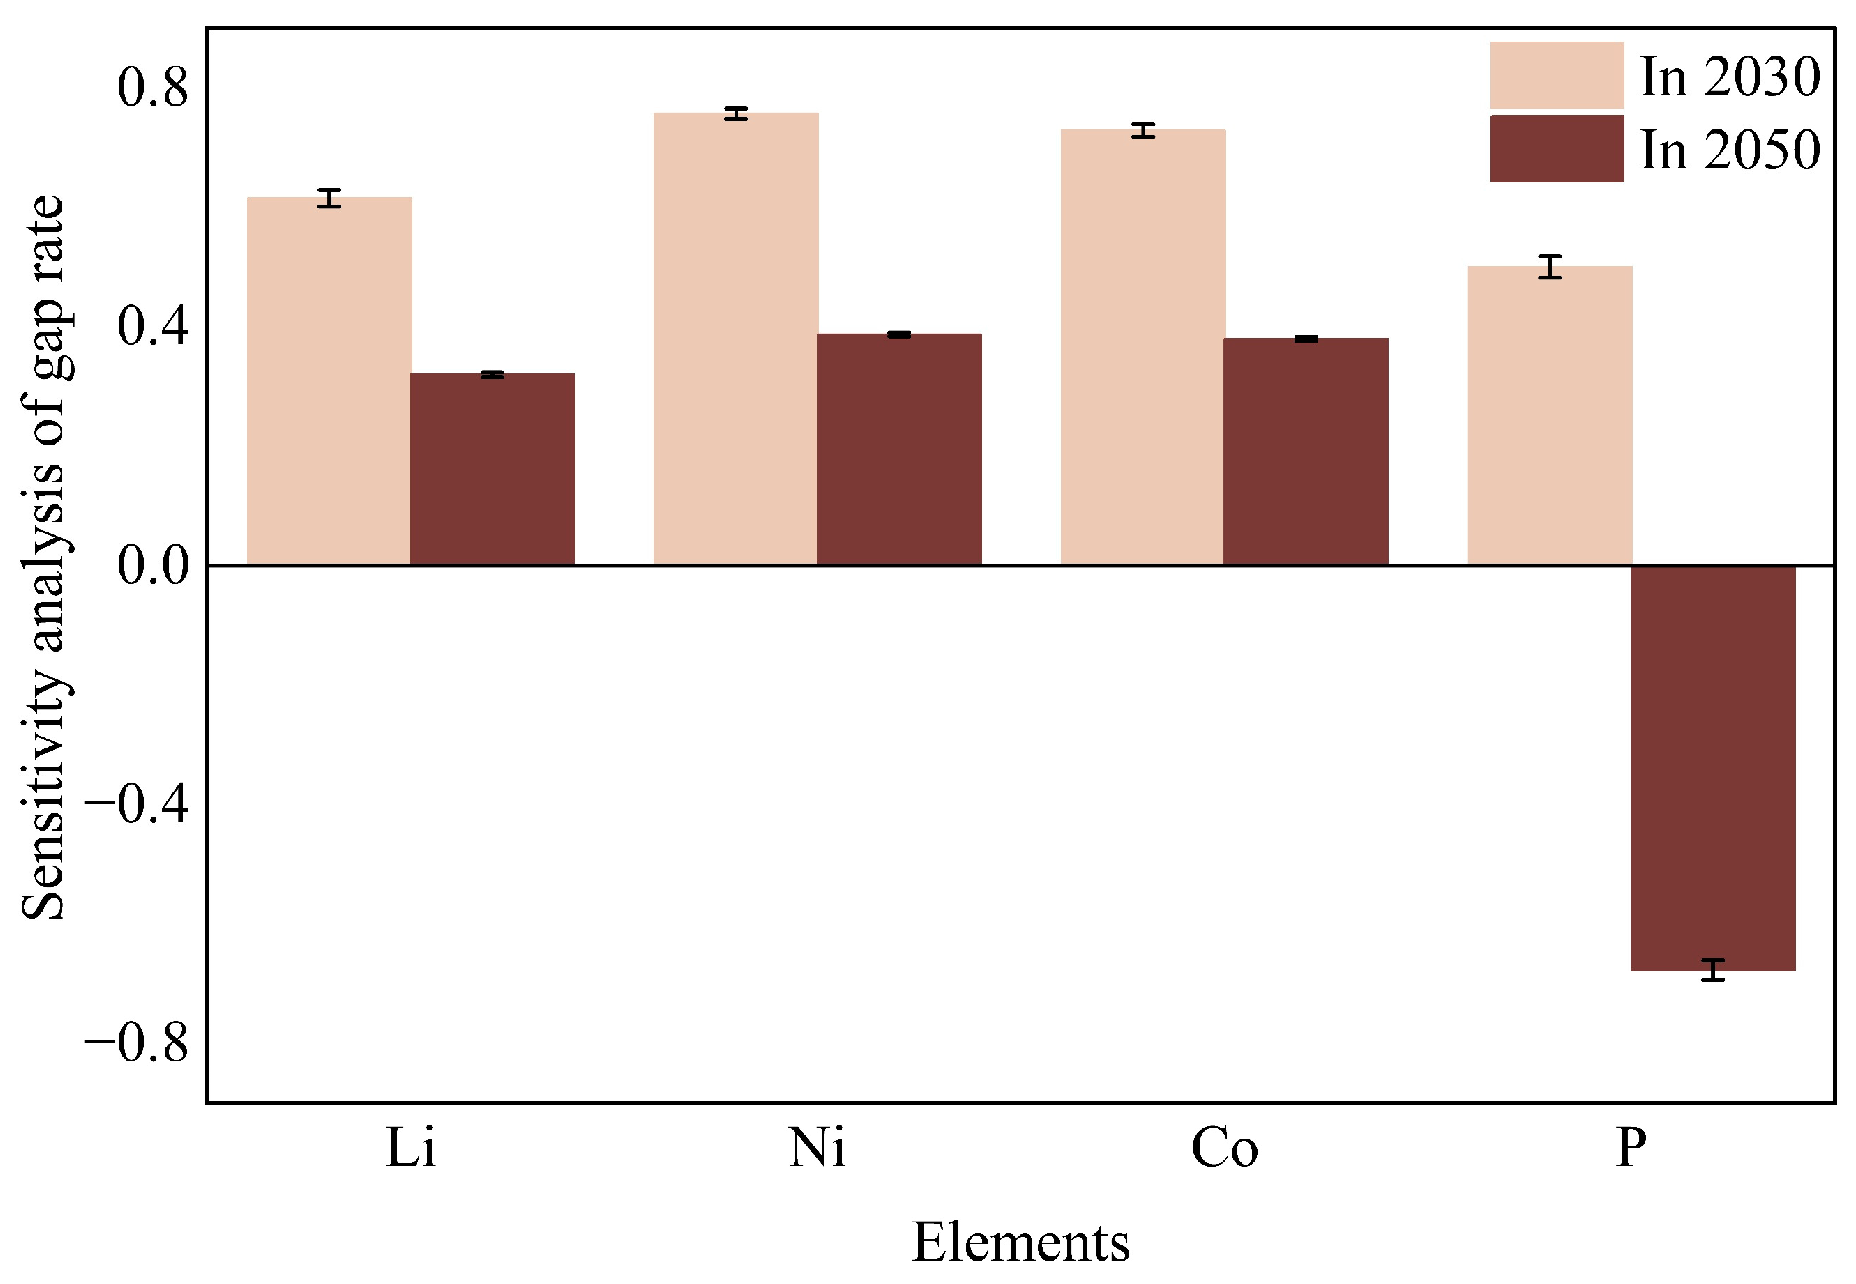
Figure 9 presents the sensitivity analysis of gap rate for representative elements in LIBs under six different scenarios for the years 2030 and 2050. The results show that the sensitivity among six scenarios is within 2%. This indicates that AO and ymax do not have a significant impact on the gap rate. Hence, this study calculates the gap rate by calculating the average of the demand and scrap volume of each SMR under six scenarios.
Figure 10 shows that the projected gap rates of the nine SMRs in LIBs generally exhibit a declining trend during 2026–2050, which indicates a narrowing gap in SMRs. This trend is closely linked to the annual demand and recovery volume of these SMRs. Among them, when GI = 80% and GI = 100%, the gap rates of the seven SMRs, excluding Fe and P, are within the range of 0.39–0.81 and 0.25–0.75, respectively. This result indicates that the stronger the government intervention in LIB recycling, the more significantly the gap rate decreases.
For Fe, as LFPs begin to phase out of the market starting in 2045, the demand for Fe drops to 0 from that year onward. Therefore, the trend line for 2045–2050 is not plotted in Figure 10. For P, its gap rate turns negative starting in 2040 when GI = 80%, reaching −0.04, indicating that the recovery volume of P exceeds its demand during 2040–2050. When GI = 100%, this phenomenon will move forward 2 years, reaching −0.10 in 2038. The sharp decline in P’s gap rate in 2045, down to −1.22 (GI = 80%) and −1.77 (GI = 100%), respectively, is attributed to the phase-out of LFP from the market, which is leading to less demand for P. Although the demand for P in LFP is 0 after 2045, the gap rate for P shows an upward trend from 2045 to 2050 due to the continued need for P in electrolytes of other types of LIBs.
It was reported that the actual loss rate during recycling and dismantling processes ranges from 5% to 15%. However, due to the difficulty in obtaining precise data, this study sets the recovery rates under ideal conditions. Thus, the actual shortfall rate is likely higher.

4. Discussion

Based on the results in Section 3, this study conducts discussions on five aspects of LIBs. These aspects include future technology routes, operations of LIBs, capacity of LIBs, dismantling process, recycling processes, government supervision, and international experience. With regard to CPs, this study discusses under a holistic perspective.

4.1. LIBs

From the perspective of future technology routes, the future direction of LIB development is towards technology routes with high energy density and prolonged LIB lifespan, e.g., solid-state batteries. At the same time, for a certain element in the battery, excessive demand and supply risks necessitate the search for alternative elements. For example, the research of sodium-ion batteries (SIBs) is now showing explosive growth, and is expected to complement LIBs in the field of large-scale electrochemical energy storage and low-speed EVs. Moreover, compared to LIBs, SIBs are safer, manufacturing SIBs can save 30–40% of the cost, and geopolitical supply risks can be eliminated because Na is much more abundant than Li in the Earth’s crust. The pace of commercialization has now taken off both domestically and internationally [49,50,51].
From the perspective of the operation of LIBs, the heat generated by internal electrochemical reactions and irreversible Joule heat accumulates in LIBs, which leads to a rapid temperature rise and an uneven temperature distribution. Exceeding the recommended temperature range of 40 °C not only reduces the lifespan of LIBs but also creates safety risks such as thermal runaway. Therefore, an effective thermal management system (TMS) is crucial for mitigating these risks [52,53,54]. Traditional thermal management methods for LIBs include air cooling, liquid cooling, and phase change material cooling [55]. However, immersion cooling systems for LIBs require more precise and uniform temperature regulation. Factors such as effective coolants, rational cold plate arrangement, auxiliary management systems, and optimizing module assembly strategy can enhance the performance of the TMS. This is critical for extending the lifespan of LIBs, thereby reducing the risk of premature battery disposal [55,56,57,58].
From the perspective of the capacity of LIBs, the warranty period of LIBs for EVs is appropriately extended. LIBs will inevitably fail in the course of use once the capacity of LIBs drops below 80% of the maximum capacity. Firstly, for decommissioned LIBs without significant wear, they can be considered for echelon use. This approach not only enables better utilization of second-life batteries but also helps alleviate the high demand for new LIBs in other industries, thereby reducing resource consumption [59]. Additionally, warranty services should be provided, which not only saves the purchaser the expensive costs required for battery replacement, but also reduces further consumption of resources.
From the perspective of dismantling process, the level of dismantling rate also determines the number of resources recovered. An increase in the dismantling rate can effectively avoid the loss of SMRs in LIBs and CPs. The dismantling process can be divided into destructive dismantling and non-destructive dismantling. Destructive dismantling should be avoided, while the development of non-destructive dismantling tools should be promoted. The efficiency of dismantling can be improved by improving the quality of dismantling personnel, upgrading dismantling equipment, and integrating large enterprises specialized in recycling [60,61]. In addition, thermal runaway should be avoided during the dismantling process, such as mechanical dismantling, as this not only prevents resource loss but also ensures operational safety [62].
From the perspective of the recycling process, the recycling process of electrode elements in LIBs for EVs is now mature and should now be developed in the direction of high economy. Meanwhile, the impact of SMR price fluctuations on recycling economy is also critical. Recently, the prices of key raw materials for LIB production, such as Li2CO3, NiSO4, and CoSO4, have shown an upward trend, which is a key factor affecting the enthusiasm for SMR recycling. Meanwhile, the recycling process of electrolyte needs to be improved due to the presence of F and P. Currently, China’s primary methods for handling waste electrolytes are direct incineration or direct discharge. These methods generate pollutants such as HF and H3PO4 [63,64], causing significant environmental contamination. Current recycling methods for electrolytes include machine centrifugation, evaporation–condensation, solvent extraction, and supercritical CO2 extraction [64]. How to further purify and separate the electrolytes in the electrolyte without destroying the electrolyte and the environment is the key to electrolyte recovery [33,65].
From the perspective of government supervision, regulators should strictly manage EoL EV processing by guiding formal recycling and preventing batteries from entering informal workshops. It was reported in 2023 that China only had 156 certified recyclers meeting official standards and only 25% of LIBs have been fully recycled, while rest of EoL LIBs ended up in informal workshops. These workshops operate flexibly but lack proper procedures, leading to inefficient resource recovery, environmental pollution, and safety hazards. Initiatives like the Action Program for Sound EV Power Battery Recycling System in 2025 aim to strengthen regulation. Additionally, subsidies can support formal recyclers facing high operational costs, particularly environmental treatment expenses. Since 2024, falling material prices have reduced profitability and dampened industry enthusiasm [66]. Financial incentives could improve recycling motivation and prevent “bad money driving out good”. Finally, extending producer responsibility (EPR) is essential. Battery manufacturers should manage EoL products and help build databases tracking material composition to improve the recycling of scarce elements.
In Europe, the EU has formulated corresponding recycling programs to ensure the sustainable development of resources. For example, in a certain year in the future, the recycled raw materials used in the production of LIBs should reach a certain percentage of the raw materials used. Moreover, the recycling process adopted by recycling enterprises should reach a certain value of the recovery rate of the elements, etc. [67]. China can tailor similar recycling programs to its own situation, all of which will help it to achieve the sustainable development of these SMRs.

4.2. CPs

According to the results of the scrap volume of SMRs in CPs accounted for in Section 3, the EoL CPs contain a large number of resources. CPs, compared to LIBs, have more types of EoL elements, which need to be paid attention to in the recycling of CPs. China currently has no corresponding regulations to regulate the recycling of CPs, which results in the loss of a large amount of SMRs in CPs. Therefore, China should firstly introduce appropriate laws and regulations to include the recycling of CPs into the scope of regulation, just like LIBs, and recycle the strategic minerals therein. Secondly, China should establish a life cycle database for CPs to better track the flow of resources from production to recycling, which can quantify the data of SMRs in CPs. Thirdly, the CPs should be effectively differentiated and dismantled, for example, by integrating the same type of components together. Fourthly, the elements in CPs with low content should be effectively recovered. Since the content of some elements in the CP is very low, there are certain difficulties in recycling these elements. Under the premise of guaranteeing low cost, there should be research into, and development of, new recycling processes to ensure effective recycling of this part of the resource. Finally, the EPR system is also vital for the recycling of CPs. Overall, the recovery of CPs should be developed in the direction of accurate separation, high economy, and policy guidance to close the loop.

5. Conclusions

This study sets six scenarios focusing on passenger EVs. Adopting a life cycle perspective, it projects the ownership and EoL quantities of EVs and CPs from 2010 to 2050, subsequently estimating the EoL flows of SMRs embedded in LIBs and CPs, while incorporating the gap rate of SMRs in LIBs under different degrees of government intervention.
The results from the six scenarios indicate an overall increasing trend in the scrap volume of SMRs from both LIBs and CPs. Specifically, in LIBs, Al has the highest scrap volume, increasing from 2.69 t in 2010 to 2.98 × 10⁶ t in 2050, while Co has the smallest scrap volume, increasing from 0.22 t in 2012 to 8.25 × 10⁴ t in 2050. In CPs, Fe has the largest scrap volume, increasing from 34.76 t in 2024 to 1.14 Mt in 2050, while Zr has the smallest scrap volume, increasing from 8.8 × 10⁻⁷ t in 2024 to 1.52 × 10⁻⁵ t in 2050. Regarding the common SMRs to both LIBs and CPs, from 2026 to 2050, over 97% of Li, Co, Ni, and Al originate from LIBs. In contrast, the proportions of Fe and Cu from LIBs show an overall declining trend, implying that an increasing amount of Fe and Cu is being scrapped from CPs. This highlights the urgency of recycling Fe and Cu from CPs. Through a recycle-demand gap analysis of SMRs in LIBs, by considering government intervention, this study finds that the gap rates for nine elements, except P and Fe, are within the range of 0.39–0.81 (GI = 80%) and 0.25–0.75 (GI = 100%). This result indicates that the stronger the government intervention in LIB recycling, the more significantly the gap rate decreases. The gap rate for Fe drops to 0 by 2045 due to the phase-out of the market share of LFP. The gap rate for P becomes negative starting in 2040 (GI = 80%) and 2038 (GI = 100%), reaches its lowest value of −1.22 (GI = 80%) and −1.77 (GI = 100%) in 2045 as LFPs are phased out of the market, and subsequently shows an upward trend due to the continued demand for electrolytes in other types of LIBs.
The issue of recycling is currently a matter requiring significant attention. Governments play a supervisory and guiding role in the recycling of LIBs. The recycling of CPs is equally importance to that of LIBs. Given the diverse types of SMRs contained in CPs and the lack of regulatory oversight, it is imperative to introduce policies to standardize the recycling process. This should be implemented while balancing economic viability with environmental costs to ensure effective resource recovery.
Future study in this field can build upon this study with the following improvements: (1) develop more accurate mathematical models to predict GDP and population in order to reduce the uncertainty of prediction results; (2) indicators such as resource loss rate due to potential thermal safety risks during dismantling, rate of dismantling, and dismantling rates in formal and informal recycling workshops can be incorporated into the study for the evaluation of recycling potential; (3) in the future, artificial intelligence could be incorporated into this field, for instance, applying U-Net, based on convolutional neural network principles, to the battery management system in order to better identify the current state of LIBs and more systematically determine whether they have entered the EoL stage [68,69], or metaheuristic algorithms can be applied to sustainable energy management to enhance convergence, stability, and accuracy [70]; and (4) when assessing EV industry’s resource impact across countries, tailor the evaluation to national conditions by adjusting indicators like EV penetration rate, vehicles per 1000 people, and VCR.

Supplementary Materials

The following supporting information can be downloaded at: https://www.mdpi.com/article/10.3390/su18031300/s1, Figure S1: Weibull lifespan distribution curve of this study; Figure S2: Market Share of LIB Types in EVs during 2010–2022; Figure S3: Market Share of LIB Types in EVs during 2023–2050; Figure S4: Market share of BEV and PHEV during 2010–2050; Figure S5: Figure 7’s partial enlarged view: Table S1: The projection of people in China during 2025–2050 (unit: billion); Table S2: The growth rate of GDP in China during 2025–2050; Table S3: The volume of EV ownership in China during 2014–2024 (unit: million); Table S4: The sale volume of EV in China during 2010–2024 (unit: million); Table S5: The six scenarios set up in this study; Table S6: Lifespan of LIBs in this study; Table S7: Consumption intensity of different metals Mij (unit: kg/kWh); Table S8: Battery capacity in EV (unit: kWh/vehicle); Table S9: Distribution of SMRs in different types of CPs (unit: kg); Table S10: Recovery rate (Reci) of elements in LIB’s electrode; Table S11: Recovery rate (Reci) of elements in LIB’s electrolyte (LiPF6); Table S12: Regression analysis results of the Gompertz function for EV ownership; Table S13: Scrap volume of various type CPs under 6 scenarios (unit: million) [11,33,34,36,39,42,44,45,46,63,64,71,72,73,74,75,76,77,78,79,80,81,82,83,84,85,86,87,88,89,90,91,92,93,94,95,96,97,98,99,100,101,102,103,104].

Author Contributions

Y.G.: Methodology, Investigation, Writing—Original Draft; J.A.: Conceptualization, Methodology, Investigation, Writing—Review and Editing; Y.Z.: Investigation, Writing—Review and Editing; J.C.: Investigation. All authors have read and agreed to the published version of the manuscript.

Funding

This work is supported by the Nation Key R&D Program of China (No. 2020YFC1909101).

Institutional Review Board Statement

Not applicable.

Informed Consent Statement

Not applicable.

Data Availability Statement

The data that support the findings of this study are available from the corresponding author on reasonable request.

Conflicts of Interest

The authors declare that they have no known competing financial interests or personal relationships that could have appeared to influence the work reported in this paper.

Abbreviations

ACCPAlternating current charging pile
BEVBattery electric vehicle
CPCharging pile
DCCPDirect current charging pile
EoLEnd of life
EPRExtending producer responsibility
EUEuropean Union
EVElectric vehicle
GDPGross domestic product
ICEVInternal combustion engine vehicle
LFPLithium iron phosphate
LIBLithium-ion battery
MFAMaterial flow analysis
NCANickel–cobalt–aluminum
NCMNickel–cobalt–manganese
PHEVPlug-in hybrid electric vehicle
PrCPPrivate charging pile
PuCPsPublic charging piles
RERare earth
SIBSodium-ion battery
SMRStrategic mineral resource
TMSThermal management system
VCRVehicle-to-charging pile ratio

References

  1. Bicer, Y.; Dincer, I. Life cycle environmental impact assessments and comparisons of alternative fuels for clean vehicles. Resour. Conserv. Recycl. 2018, 132, 141–157. [Google Scholar] [CrossRef]
  2. Kazancoglu, Y.; Ozbiltekin-Pala, M.; Ozkan-Ozen, Y.D. Prediction and evaluation of greenhouse gas emissions for sustainable road transport within Europe. Sustain. Cities Soc. 2021, 70, 102924. [Google Scholar] [CrossRef]
  3. The State Council. 2021. Available online: https://www.gov.cn (accessed on 19 April 2025).
  4. Gan, Y.; Lu, Z.; He, X.; Hao, C.; Wang, Y.; Cai, H.; Wang, M.; Elgowainy, A.; Przesmitzki, S.; Bouchard, J. Provincial greenhouse gas emissions of gasoline and plug-in electric vehicles in China: Comparison from the consumption-based electricity perspective. Environ. Sci. Technol. 2021, 55, 6944–6956. [Google Scholar] [CrossRef]
  5. China Automobile Industry Yearbook. 2024. Available online: https://www.shujuku.org/china-automobile-industry-yearbook-2024.html (accessed on 19 April 2025).
  6. International Statistical Yearbook. 2024. Available online: https://data.stats.gov.cn (accessed on 23 June 2025).
  7. Takimoto, H.; Kosai, S.; Watari, T.; Yamasue, E. Circular economy can mitigate rising mining demand from global vehicle electrification. Resour. Conserv. Recycl. 2024, 209, 107748. [Google Scholar] [CrossRef]
  8. China Geological Survey. 2016. Available online: https://www.cgs.gov.cn/ (accessed on 7 March 2025).
  9. Li, X.; Ge, J.; Chen, W.; Wang, P. Scenarios of rare earth elements demand driven by automotive electrification in China: 2018–2030. Resour. Conserv. Recycl. 2018, 145, 322–331. [Google Scholar] [CrossRef]
  10. Tang, C.; Sprecher, B.; Tukker, A.; Mogollón, J. The impact of climate policy implementation on lithium, cobalt and nickel demand: The case of the Dutch automotive sector up to 2040. Resour. Policy 2021, 74, 102351. [Google Scholar] [CrossRef]
  11. Raghavan, S.S.; Nordelöf, A.; Ljunggren, M.; Arvidsson, R. Metal requirements for road-based electromobility transitions in Sweden. Resour. Conserv. Recycl. 2023, 190, 106777. [Google Scholar] [CrossRef]
  12. Song, J.; Yan, W.; Cao, H.; Song, Q.; Ding, H.; Lv, Z.; Zhang, Y.; Sun, Z. Material flow analysis on critical raw materials of lithium-ion batteries in China. J. Clean. Prod. 2019, 215, 570–581. [Google Scholar] [CrossRef]
  13. Liu, W.; Liu, W.; Li, X.; Liu, T.; Ogunmoroti, A.E.; Li, M.; Bi, M.; Cui, Z. Dynamic material flow analysis of critical metals for lithium-ion battery system in China from 2000–2018. Resour. Conserv. Recycl. 2021, 164, 105122. [Google Scholar] [CrossRef]
  14. Castro, F.D.; Cutaia, L.; Vacvehicles, M. End-of-life automotive lithium-ion batteries (LIBs) in Brazil: Prediction of flows and revenues by 2030. Resour. Conserv. Recycl. 2021, 169, 105522. [Google Scholar] [CrossRef]
  15. Zong, Y.; Chen, X.; Chen, M.; Yan, W.; Zhang, X.; Zhang, C.; Zhang, X. Criticality assessment and material flow analysis of raw materials for power lithium-ion batteries in China: Towards sustainable supply and recycling. Resour. Conserv. Recycl. 2025, 217, 108189. [Google Scholar] [CrossRef]
  16. Shafique, M.; Rafiq, M.; Azam, A.; Luo, X. Material flow analysis for end-of-life lithium-ion batteries from battery electric vehicles in the USA and China. Resour. Conserv. Recycl. 2022, 178, 106061. [Google Scholar] [CrossRef]
  17. Bongartz, L.; Shammugam, S.; Gervais, E.; Schlegl, T. Multidimensional criticality assessment of metal requirements for lithium-ion batteries in electric vehicles and stationary storage applications in Germany by 2050. J. Clean. Prod. 2021, 292, 126056. [Google Scholar] [CrossRef]
  18. Sun, X.; Wang, F.; Wang, P.; Zhao, D.; Zhao, M.; Jiao, X.; Li, J.; Li, Z.; Geng, Y.; Sun, L. Risk analysis and eco-design strategies for critical mineral resources in China’s vehicle electrification process. Resour. Conserv. Recycl. 2025, 216, 108156. [Google Scholar] [CrossRef]
  19. Golmohammadzadeh, R.; Farajia, F.; Rashchi, T. Recovery of lithium and cobalt from spent lithiumion batteries (LIBs) using organic acids as leaching reagents: A review. Resour. Conserv. Recycl. 2018, 136, 418–435. [Google Scholar] [CrossRef]
  20. Alipanah, M.; Jin, H.; Zhou, Q.; Barboza, C.; Gazzo, D.; Thompson, V.; Fujita, Y.; Liu, J.; Anderko, A.; Reed, D. Sustainable bioleaching of lithium-ion batteries for critical metal recovery: Process optimization through design of experiments and thermodynamic modeling. Resour. Conserv. Recycl. 2023, 199, 107293. [Google Scholar] [CrossRef]
  21. Wang, M.; Xu, Z.; Dutta, S.; Liu, K.; Labianca, C.; Clark, J.H.; Zimmerman, J.B.; Tsang, D.C.W. Integrated assessment of deep eutectic solvents questions solvometallurgy as a sustainable recycling approach for lithium-ion batteries. One Earth 2023, 6, 1400–1413. [Google Scholar] [CrossRef]
  22. He, S.; Zuo, Q.; Shi, H.; Geng, Z.; Liu, C.; Ding, L.; Shao, P.; Yang, L.; Luo, X. Direct recovery of high-purity lithium via nanofiltration membranes from leaching solution of spent lithium batteries. Resour. Conserv. Recycl. 2024, 210, 107846. [Google Scholar] [CrossRef]
  23. Cun, Z.; Xing, P.; Wang, C.; Li, H.; Ma, S.; Sun, Z.; Wang, Q.; Guan, X. Stepwise recovery of critical metals from spent NCM lithium-ion battery via calcium hydroxide assisted pyrolysis and leaching. Resour. Conserv. Recycl. 2024, 202, 107390. [Google Scholar] [CrossRef]
  24. Ren, Z.; Li, H.; Wang, Y.; Zhang, G.; Wang, P.; Lv, L.; Sun, Z.; Gao, W. Green recycling assessment on typical spent lithium-ion batteries (LIBs): A multi-objective assessment. Resour. Conserv. Recycl. 2024, 206, 107648. [Google Scholar] [CrossRef]
  25. Wu, Y.; Yang, L.; Tian, X.; Li, Y.; Zuo, T. Temporal and spatial analysis for end-of-life power batteries from electric vehicles in China. Resour. Conserv. Recycl. 2020, 155, 104651. [Google Scholar] [CrossRef]
  26. Yang, X.; Liu, J.; Zhuge, C.; Wong, A.T.C.; Wang, P. Exploring the potential of sharing private charging posts: A data-driven micro-simulation approach. Sustain. Cities Soc. 2024, 100, 105053. [Google Scholar] [CrossRef]
  27. Liu, B.; Gao, X.; Wang, Y.; Zhao, S. Co-construction strategy of battery swapping stations and charging piles in China. Transp. Policy 2025, 169, 56–73. [Google Scholar] [CrossRef]
  28. Hu, X.; Yang, Z.; Sun, J.; Zhang, Y. Sharing economy of electric vehicle private charge posts. Transp. Res. Part B 2021, 152, 258–275. [Google Scholar] [CrossRef]
  29. Huang, X.; Mao, Z.; Lin, Y.; Shi, Q.; Liu, F.; Zhou, F. Sharing or privacy for private electric vehicle charging piles? Evidence from Chongqing. Technol. Forecast. Soc. Change 2024, 203, 123350. [Google Scholar] [CrossRef]
  30. Lyu, S.; Yuan, X.; Fei, Z.; Chen, Y. Stability analysis and self-excited oscillation suppression of DC charging pile under wide charging power range. Results Eng. 2025, 25, 104460. [Google Scholar] [CrossRef]
  31. Dai, Q.; Spangenberger, J.; Ahmed, S.; Gaines, L.; Kelly, J.C.; Wang, M. EverBatt: A Closed-Loop Battery Recycling Cost and Environmental Impacts Model; Argonne National Laboratory: Lemont, IL, USA, 2019. Available online: https://www.anl.gov/ (accessed on 3 October 2024).
  32. Mohr, M.; Peters, J.F.; Baumann, M.; Weil, M. Toward a cell-chemistry specific life cycle assessment of lithium-ion battery recycling processes. J. Ind. Ecol. 2020, 24, 1310–1322. [Google Scholar] [CrossRef]
  33. Srivastava, V.; Rantala, V.; Mehdipour, P.; Kauppinen, T.; Tuomikoski, S.; Heponiemi, A.; Runtti, H.; Tynjälä, P.; Reis, G.S.D.; Lassi, U. A comprehensive review of the reclamation of resources from spent lithium-ion batteries. Chem. Eng. J. 2023, 474, 145822. [Google Scholar] [CrossRef]
  34. Huo, H.; Wang, M. Modeling future vehicle sales and stock in China. Energy Policy 2012, 43, 17–29. [Google Scholar] [CrossRef]
  35. Bu, C.; Cui, X.; Li, R.; Li, J.; Zhang, Y.; Wang, C.; Cai, W. Achieving net-zero emissions in China’s passenger transport sector through regionally tailored mitigation strategies. Appl. Policy 2021, 284, 116265. [Google Scholar] [CrossRef]
  36. Cui, D.; Bi, Y.; Gu, Y.; Wang, H.; Gao, X.; Wang, P.; Sun, X.; Chen, W. Scenario analysis of waste tires from China’s vehicles future. J. Clean. Prod. 2024, 478, 143940. [Google Scholar] [CrossRef]
  37. Elshkaki, A. Long-term analysis of critical materials in future vehicles electrification in China and their national and global implications. Energy 2020, 202, 117697. [Google Scholar] [CrossRef]
  38. Liu, M.; Liu, W.; Zhang, M.; Pan, X.; Zhang, Q.; Zhang, M.; Ma, T.; Cui, Z. Analysis of the potential resource, environmental and economic impacts of EU battery and waste battery regulations on China’s lithium-ion battery industry. Resour. Conserv. Recycl. 2025, 219, 108314. [Google Scholar] [CrossRef]
  39. Chen, W. Forecasting negative population growth and population ageing in China. Soc. Sci. J. 2022, 5, 133–144. Available online: https://link.cnki.net/urlid/21.1012.C.20220908.1728.018 (accessed on 16 April 2025). (In Chinese)
  40. Yang, D.; Wang, M.; Luo, F.; Liu, W.; Chen, L.; Li, X. Evaluating the recycling potential and economic benefits of end-of-life power batteries in China based on different scenarios. Sustain. Prod. Consum. 2024, 47, 145–155. [Google Scholar] [CrossRef]
  41. Yang, H.; Song, X.; Zhang, X.; Lu, B.; Yang, D.; Li, B. Uncovering the in-use metal stocks and implied recycling potential in electric vehicle batteries considering cascaded use: A case study of China. Environ. Sci. Pollut. Res. 2021, 28, 45867–45878. [Google Scholar] [CrossRef] [PubMed]
  42. Ai, N.; Zheng, J.; Chen, W. U.S. end-of-life electric vehicle batteries: Dynamic inventory modeling and spatial analysis for regional solutions. Resour. Conserv. Recycl. 2019, 145, 208–219. [Google Scholar] [CrossRef]
  43. Zeng, A. The slow-release effect of recycling on rapid demand growth of critical metals from EV batteries up to 2050: Evidence from China. Resour. Policy 2023, 2023, 103504. [Google Scholar] [CrossRef]
  44. Argonne National Laboratory. BatPaC: Battery Manufacturing Cost Estimation. 2020. Available online: https://www.anl.gov/partnerships/batpac-battery-manufacturing-cost-estimation (accessed on 27 October 2024).
  45. Dunn, J.; Slattery, M.; Kendall, A.; Ambrose, H.; Shen, S. Circularity of lithium-ion battery materials in electric vehicles. Environ. Sci. Technol. 2021, 55, 5189–5198. [Google Scholar] [CrossRef]
  46. Hao, H.; Geng, Y.; Tate, J.E.; Liu, F.; Chen, K.; Sun, X.; Liu, Z.; Zhao, F. Impact of transport electrification on critical metal sustainability with a focus on the heavy-duty segment. Nat. Commun. 2019, 10, 5398. [Google Scholar] [CrossRef]
  47. Dai, Q.; Kelly, J.C.; Dunn, J.; Bensvides, P.T. Update of Bill-of-Materials and Cathode Materials Production for Lithium-Ion Batteries in the GREET Model; Argonne National Laboratory: Lemont, IL, USA, 2018. Available online: https://www.anl.gov/ (accessed on 15 November 2024).
  48. Gong, W.T.; Daigo, I.; Dunuwila, P.; Sun, X. The change of material flows and environmental impacts along with future upgrading scenarios of NCM battery in China. J. Clean. Prod. 2024, 463, 142758. [Google Scholar] [CrossRef]
  49. Rudola, A.; Wright, C.J.; Barker, J. Reviewing the safe shipping of lithium-ion and sodium-ion cells: A materials chemistry perspective. Energy Mater. Adv. 2021, 2021, 9798460. [Google Scholar] [CrossRef]
  50. Pei, L.; Han, Y.; Dong, J.; Wang, Y.; Liu, Y.; Liu, X.; Diao, Z.; Liu, J.; Wang, X. High-performance solid-state sodium-ion batteries for lightweight electric vehicles: A closed-loop feedback-optimized composite electrolyte design. eTransportation 2025, 25, 100439. [Google Scholar] [CrossRef]
  51. Pan, W.; Xu, X.; Yang, X.; Xuan, P. Opportunities and challenges of sodium-ion battery. J. Mater. Eng. 2025, 53, 1–14. Available online: https://link.cnki.net/urlid/11.1800.TB.20250628.1233.002 (accessed on 8 August 2025). (In Chinese)
  52. Chen, K.; Zhang, Z.; Wu, B.; Song, M.; Wu, X. An air-cooled system with a control strategy for efficient battery thermal management. Appl. Therm. Eng. 2024, 236, 121578. [Google Scholar] [CrossRef]
  53. Chen, X.; Shen, J.; Xu, X.; Wang, X.; Su, Y.; Qian, J. Performance of thermal management system for cylindrical battery containing bionic spiral fin wrapped with phase change material and embedded in liquid cooling plate. Renew. Energy 2024, 223, 120087. [Google Scholar] [CrossRef]
  54. Liu, W.; Placke, T.; Chau, K.T. Overview of batteries and battery management for electric vehicles. Energy Rep. 2022, 8, 4058–4084. [Google Scholar] [CrossRef]
  55. Liu, J.; Tao, L.; Yang, Q.; Wang, J. Recent advances in immersion cooling for thermal management of lithium-ion batteries. Renew. Sustain. Energy Rev. 2026, 226, 116492. [Google Scholar] [CrossRef]
  56. An, Z.; Zhao, S.; Du, X.; Pea, H.J.M.; Ding, Y.; Zhang, D.; Fu, J. Optimization design of lithium-ion battery thermal management system based on thermal resistance network analysis and cold plate arrangement. Therm. Sci. Eng. Prog. 2025, 68, 104335. [Google Scholar] [CrossRef]
  57. Bian, X.; Tao, H.; Li, Y.; Chu, Z.; Bai, X.; Xian, Y.; Yang, L.; Zhang, Z. Heat pipe/phase change material passive thermal management of power battery packs under different driving modes. Appl. Therm. Eng. 2024, 248, 123172. [Google Scholar] [CrossRef]
  58. Yang, X. Modular assembly strategy to construct lightweight thermal management system by developing high-stable phase change material units. Chem. Eng. Sci. 2024, 299, 120529. [Google Scholar] [CrossRef]
  59. Cheng, M.; Zhang, X.; Ran, A.; Wei, G.; Sun, H. Optimal dispatch approach for second-life batteries considering degradation with online SoH estimation. Renew. Sustain. Energy Rev. 2023, 173, 113053. [Google Scholar] [CrossRef]
  60. Hatcher, G.D.; Ijomah, W.L.; Windmill, J.F.C. Design for remanufacture: A literature review and future research needs. J. Clean. Prod. 2011, 19, 2004–2014. [Google Scholar] [CrossRef]
  61. Zhang, L.; Ji, K.; Liu, W.; Cui, X.; Liu, Y.; Cui, Z. Collaborative approach for environmental and economic optimization based on life cycle assessment of end-of-life vehicles’ dismantling in China. J. Clean. Prod. 2020, 276, 124288. [Google Scholar] [CrossRef]
  62. Younas, T.; Shalchian, H.; Ullah, M.; Vegliò, F.; Innocenzi, V. Optimizing dismantling approaches for recycling of li-ion batteries: Strategies, challenges and economic analysis. J. Energy Storage 2025, 132, 117918. [Google Scholar] [CrossRef]
  63. Niu, B.; Xu, Z.; Xiao, J.; Qin, Y. Recycling Hazardous and Valuable Electrolyte in Spent Lithium-Ion Batteries: Urgency, Progress, Challenge, and Viable Approach. Chem. Rev. 2023, 123, 8717–8735. [Google Scholar] [CrossRef]
  64. Yang, Y.; Zhang, H.; Song, D.; Wan, H.; Guo, H.; Cao, Y. Current status and research progress of recovery and recycling of electrolyte and anode materials of spent lithium-ion batteries. J. Cent. South Univ. (Sci. Technol.) 2024, 55, 4318–4331. (In Chinese) [Google Scholar] [CrossRef]
  65. Jin, S.; Mu, D.; Lu, Z.; Li, R.; Liu, Z.; Wang, Y.; Tian, S.; Dai, C. A comprehensive review on the recycling of spent lithium-ion batteries: Urgent status and technology advances. J. Clean. Prod. 2022, 340, 130535. [Google Scholar] [CrossRef]
  66. EVTank. White Paper on the Development of China’s Lithium-Ion Battery Industry (2024). Available online: http://www.evtank.cn/ (accessed on 2 May 2025).
  67. European Union (EU). Regulation (EU) 2023/1542 of the European Parliament and of the Council of 12 July 2023 Concerning Batteries and Waste Batteries, Amending Directive 2008/98/EC and Regulation (EU) 2019/1020 and Repealing Directive 2006/66/EC. 2023. Available online: http://data.europa.eu/eli/reg/2023/1542/oj (accessed on 18 May 2025).
  68. Nair, B.J.B.; Arjun, D.; Anandha Krishnan, S.; Nandhakishor, T.; Mohan Aditya, R.; Vinaykumar, R. Palm leaf manuscript classification based on degradation level using image analysis technique. In Proceedings of the 2025 12th International Conference on Computing for Sustainable Global Development (INDIACom), New Delhi, India, 2–4 April 2025. [Google Scholar] [CrossRef]
  69. Fan, X.; Zhang, W.; Zhang, C.; Chen, A.; An, F. SOC estimation of Li-ion battery using convolutional neural network with U-Net architecture. Energy 2022, 256, 124612. [Google Scholar] [CrossRef]
  70. Shaikh, M.S.; Raj, S.; Zheng, G.; Xie, S.; Wang, C.; Dong, X.; Lin, Y.; Wang, C.; Junejo, N.U.R. Applications, classifications, and challenges: A comprehensive evaluation of recently developed metaheuristics for search and analysis. Artif. Intell. Rev. 2025, 58, 390. [Google Scholar] [CrossRef]
  71. Azimi, G.; Chan, K.H. A review of contemporary and emerging recycling methods for lithium-ion batteries with a focus on NMC cathodes. Resour. Conserv. Recycl. 2024, 209, 107825. [Google Scholar] [CrossRef]
  72. Song, Y.; Huang, J.; Zhang, Y.; Wang, Z. Drivers of metal consumption in China: An input-output structural decomposition analysis. Resour. Policy 2019, 63, 101421. [Google Scholar] [CrossRef]
  73. Zhang, H. Research on Dynamic Material Flow Analysis and Recovery Potential of Nickel in China. Ph.D. Thesis, China University of Geosciences, Beijing, China, August 2023. Available online: https://kns.cnki.net/kcms2/article/abstract?v=zWoS8hcslzA_3YGfE7bmNKPn-H2by3toSYLcYDJfuIxdhc5EEjmMw9ycFaG5zfLa2rBDNiQyvg3HFGd8KNCA952PPvGe3N5neVLd037LA_ZQCCEloHKBnrinodbOO6Ik7Xq4Qm4hkBCBYjIenmdHzhM3WyYvENry-JIemPfvF7ctA053UbqtHq0X7OW_UPoO&uniplatform=NZKPT&language=CHS (accessed on 6 June 2025). (In Chinese)
  74. Energy Saving and Electric Vehicle Yearbook. Available online: http://www.gev.org.cn/ (accessed on 12 September 2024).
  75. Nation Bureau of Statistics. Available online: https://www.stats.gov.cn (accessed on 10 October 2024).
  76. China Automobile Industry Yearbook. Available online: https://www.shujuku.org/china-automobile-industry-yearbook.html (accessed on 13 September 2024).
  77. China Association of Automobile Manufacturers (CAAM). Available online: http://www.caam.org.cn/english (accessed on 20 September 2024).
  78. An, F.; Kang, L.; Qin, L.; Mao, S.; Wang, W.; Dror, M.B. A Study on China’s Timetable for Phasing-Out Traditional Ice-Vehicles. May 2019. Available online: https://www.transformcn.com/ (accessed on 4 April 2025).
  79. Wooda, E.; Alexanderb, M.; Bradley, T.H. Investigation of battery end-of-life conditions for plug-in hybrid electric vehicles. J. Power Sources 2011, 196, 5147–5154. [Google Scholar] [CrossRef]
  80. Lunz, B.; Yan, Z.; Gerschler, J.B.; Sauer, D.U. Influence of plug-in hybrid electric vehicle charging strategies on charging and battery degradation costs. Energy Policy 2012, 46, 511–519. [Google Scholar] [CrossRef]
  81. Lai, X.; Chen, Q.; Tang, X.; Zhou, Y.; Gao, F.; Guo, Y.; Bhagat, R.; Zheng, Y. Critical review of life cycle assessment of lithium-ion batteries for electric vehicles: A lifespan perspective. eTransportation 2022, 12, 100169. [Google Scholar] [CrossRef]
  82. Li, Y.; Zhu, W.; Zhang, L.; Liu, Y. Rare Earth Metallurgy and Environmental Protection; Chemical Industry Press (CIP): Beijing, China, 2024; p. 384. ISBN 9787122460011. [Google Scholar]
  83. Wang, Y.; An, N.; Wen, L.; Wang, L.; Jiang, X.; Hou, F.; Yin, Y.; Liang, J. Recent progress on the recycling technology of Li-ion batteries. J. Energy Chem. 2021, 55, 391–419. [Google Scholar] [CrossRef]
  84. Kamran, M.; Raugei, M.; Hutchinson, A. A dynamic material flow analysis of lithium-ion battery metals for electric vehicles and grid storage in the UK: Assessing the impact of shared mobility and end-of-life strategies. Resour. Conserv. Recycl. 2021, 167, 105412. [Google Scholar] [CrossRef]
  85. Pratap, B.; Mohan, T.V.K.; Amit, R.K.; Venugopal, S. Evaluating circular economy strategies for raw material recovery from end-of-life lithium-ion batteries: A system dynamics model. Sustain. Prod. Consum. 2024, 50, 191–204. [Google Scholar] [CrossRef]
  86. Ma, Z.; Zhuang, Y.; Deng, Y.; Song, X.; Zuo, X.; Xiao, X.; Nan, J. From spent graphite to amorphous sp2+sp3 vehiclesbon-coated sp2 graphite for high-performance lithium-ion batteries. J. Power Sources 2018, 376, 91–99. [Google Scholar] [CrossRef]
  87. Yu, W.; Guo, Y.; Shang, Z.; Zhang, Y.; Xu, S. A review on comprehensive recycling of spent power lithium-ion battery in China. eTransportation 2022, 11, 100155. [Google Scholar] [CrossRef]
  88. Zhao, L.; Tian, L.; Li, J.; Shi, F.; Chang, Y.; Yan, J.; Zhang, H. Recent progress in the recycling of spent graphite anodes: Failure mechanisms, repair techniques, and prospects. Energy Storage Mater. 2024, 71, 103640. [Google Scholar] [CrossRef]
  89. Yu, A.; Wei, Y.; Chen, W.; Peng, N.; Peng, L. Life cycle environmental impacts and vehiclesbon emissions: A case study of electric and gasoline vehicles in China. Transp. Res. Part D 2018, 65, 409–420. [Google Scholar] [CrossRef]
  90. Chen, M.; Ma, X.; Chen, B.; Arsenault, R.; Karlson, P.; Simon, N.; Wang, Y. Recycling End-of-Life Electric Vehicle Lithium-Ion Batteries. Joule 2019, 3, 2622–2646. [Google Scholar] [CrossRef]
  91. Xiao, J.; Li, J.; Xu, Z. Challenges to Future Development of Spent Lithium Ion Batteries Recovery from Environmental and Technological Perspectives. Environ. Sci. Technol. 2020, 54, 9–25. [Google Scholar] [CrossRef]
  92. Gao, W.; Nie, C.; Li, L.; Yan, S.; Zhou, W.; Zhu, X. Sustainable and efficient deep eutectic solvents in recycling of spent lithium-ion batteries: Recent advances and perspectives. J. Clean. Prod. 2024, 464, 142735. [Google Scholar] [CrossRef]
  93. Biswal, B.K.; Zhang, B.; Tran, P.T.M.; Zhang, J.; Balasubramanian, R. Recycling of spent lithium-ion batteries for a sustainable future: Recent advancements. Chem. Soc. Rev. 2024, 53, 5552–5592. [Google Scholar] [CrossRef]
  94. Islam, M.S.; Kushwaha, A.K.; Misra, M. Review on the recycling of anode graphite from waste lithium-ion batteries. J. Mater. Cycles Waste Manag. 2024, 26, 3341–3369. [Google Scholar] [CrossRef]
  95. Wang, Y.; Wu, J.; Hu, G.; Ma, W. Recovery of Li and Fe from spent lithium iron phosphate using organic acid leaching system. Trans. Nonferrous Met. Soc. China 2024, 34, 336–346. [Google Scholar] [CrossRef]
  96. Maheswari, M.U.; Reddy, K.R.; Aminabhavi, T.M.; Aravindan, V.; Meshram, P. Recycling strategies for renewable graphite and other vehiclesbon nanomaterials from used batteries: A review. J. Clean. Prod. 2025, 493, 144871. [Google Scholar] [CrossRef]
  97. Ji, P.; Yang, L.; Rao, F.; Liu, W. Damage-Free Recovery of Cathode and Anode Materials from Spent Lithium Battery with Flotation and Magnetic Separation: A Review. J. Sustain. Metall. 2025, 11, 683–709. [Google Scholar] [CrossRef]
  98. Qiu, B.; Liu, M.; Qu, X.; Zhang, B.; Xie, H.; Wang, D.; Lee, L.Y.S.; Yin, H. Recycling Spent Lithium-Ion Batteries Using Waste Benzene Containing Plastics: Synergetic Thermal Reduction and Benzene Decomposition. Environ. Sci. Technol. 2023, 57, 7599–7611. [Google Scholar] [CrossRef] [PubMed]
  99. He, K.; Zhang, Z.; Alai, L.; Zhang, F. A green process for exfoliating electrode materials and simultaneously extracting electrolyte from spent lithium-ion batteries. J. Hazard. Mater. 2019, 375, 43–51. [Google Scholar] [CrossRef] [PubMed]
  100. Zhang, S.; Zhang, P.; Xu, S. A Comprehensive Recycling Method for Spent Lithium-Ion Battery Electrolyte. China Patent No.110203949A, 6 September 2019. [Google Scholar]
  101. Zhou, W.; Chen, L.; Shi, Q. A Method for Recycling Spent Lithium-Ion Battery and Electrolyte. China Patent No. 112670613A, 16 April 2021. [Google Scholar]
  102. Li, A.; Zhang, X.; Yu, H. Recycling and Treatment Methods for Lithium-Ion Battery Electrolyte. China Patent No. 115332663A, 11 November 2022. [Google Scholar]
  103. Liu, Y.; Wei, W.; Lin, H. A Recycling Method for Electrolyte from Spent Lithium-Ion Battery. China Patent No. 115207506A, 18 October 2022. [Google Scholar]
  104. Liu, Y.; Wei, W.; Lin, H. A Recycling Method for Electrolyte from Spent Lithium-Ion Battery. China Patent No. 116780013A, 19 September 2023. [Google Scholar]
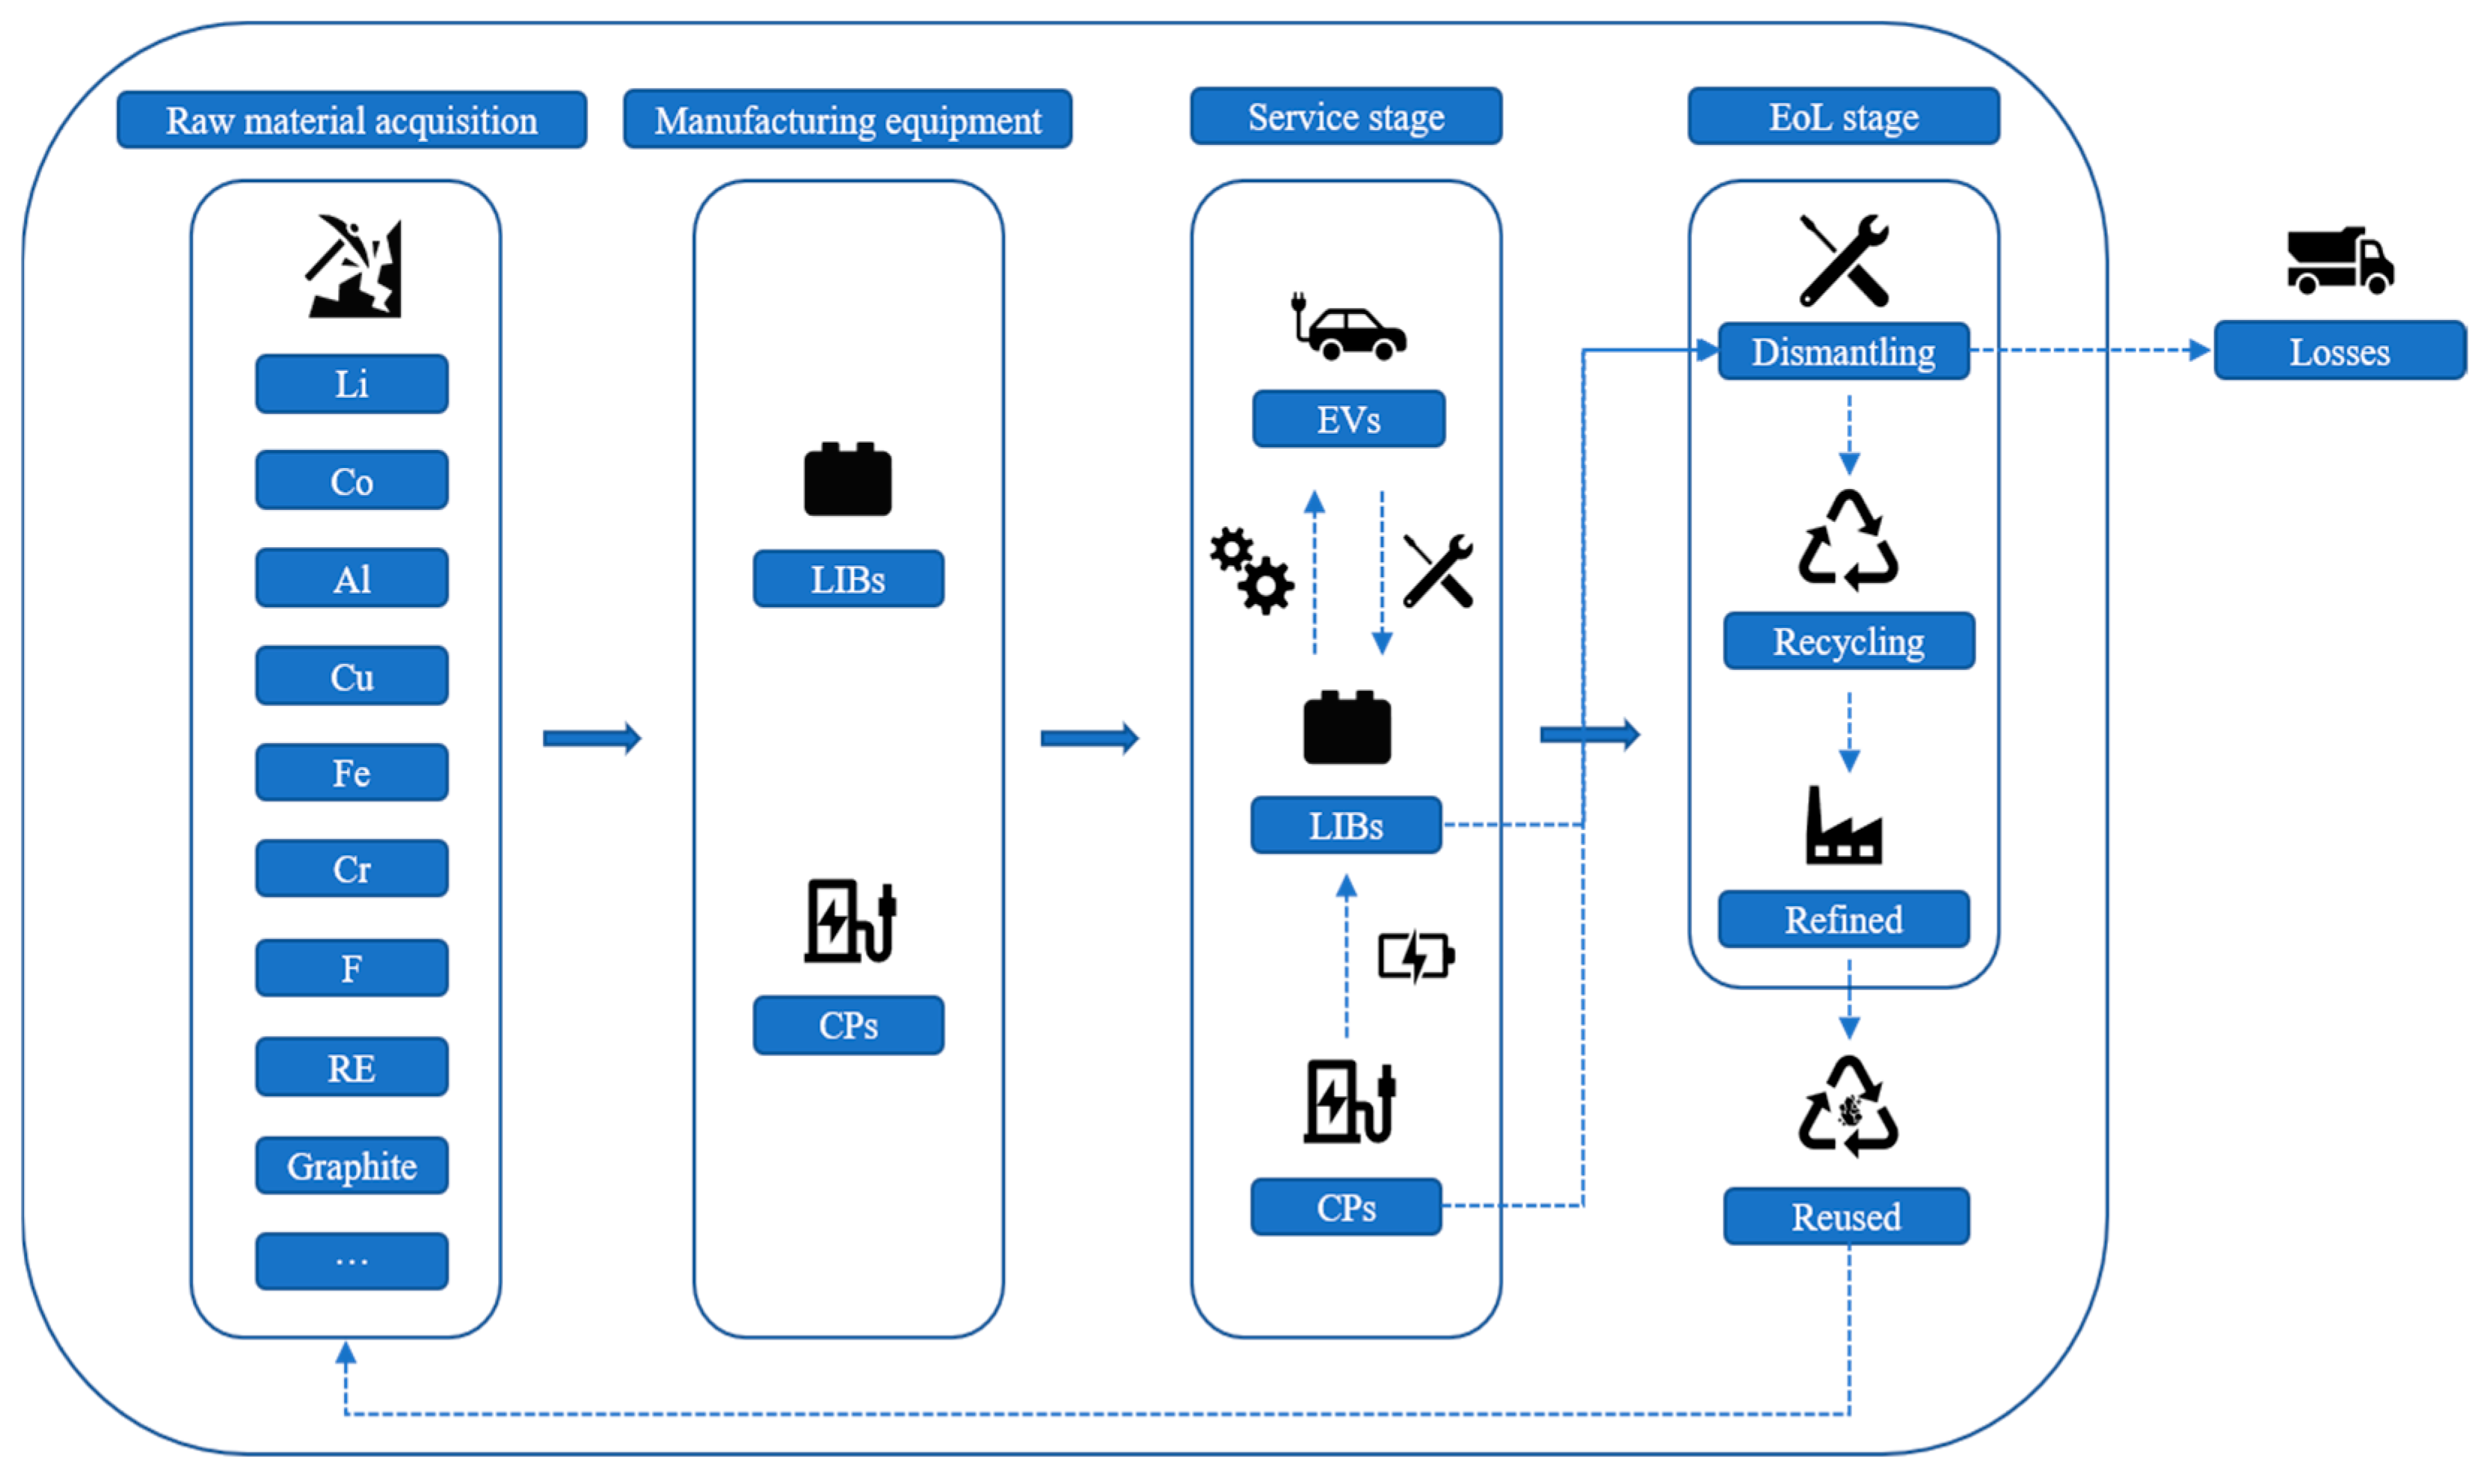
Figure 1. The life cycle process of LIBs and CPs from production to EoL recycling.
Sustainability 18 01300 g001
Figure 2. Annual ownership of EVs and CPs under six scenarios, where (a) EVs; (b) CPs.
Sustainability 18 01300 g002
Figure 3. Annual scrap volume of EVs and CPs under six scenarios, where (a) EVs; (b) CPs.
Sustainability 18 01300 g003
Figure 4. Annual average scrap volume of SMRs in LIBs during 2010–2050, where (a) Al; (b) Ni, Cu, and Graphite; (c) Li, P, Fe, Co, and F.
Sustainability 18 01300 g004
Figure 5. Annual average scrap volume of Li and P in LIBs by component during 2010–2050, where (a) P; (b) Li.
Sustainability 18 01300 g005
Figure 6. Annual average scrap volume of SMRs in CPs during 2024–2050, where (a) Fe and Cu; (b) Al; (c) Cr, Mo, and Ni; (d) Sn; (e) Co, Au, Sb and RE.
Sustainability 18 01300 g006
Figure 7. Percentage of scrap volume of common SMRs from LIBs during 2026–2050 (the partial enlarged view is shown in Figure S5).
Sustainability 18 01300 g007
Figure 8. Percentage of different SMR EoL source in each type of CP during 2018–2050.
Sustainability 18 01300 g008
Figure 9. The sensitivity analysis of gap rate for representative elements in LIBs under six different scenarios for the years 2030 and 2050.
Sustainability 18 01300 g009
Figure 10. Recycle-demand gap rate of SMRs in LIB during 2026–2050, where (a) GI = 80%; (b) GI = 100%.
Sustainability 18 01300 g010
Table 1. Average cumulative scrap volume of Li, Ni, Co, Al, Cu, and graphite in different LIBs during 2010–2050 under six scenarios (unit: 104 t).
Type of LIBLi
(Electrode)
NiCoAlCuGraphite
NCM-1110.180.440.443.890.841.22
NCM-5324.1515.486.2293.5620.04229.74
NCM-62221.4496.4032.32547.74109.78174.20
NCM-81166.83423.3752.922061.13387.28677.91
NCA7.7851.259.69222.7043.0174.58
LFP50.85//1897.61508.00582.64
Table 2. Average cumulative scrap volume of SMRs in the three types of CPs under six scenarios during 2018–2050 (unit: t).
ElementsPrivate ACCPsPublic DCCPsPublic ACCPs
Al1.96 × 1051.31 × 1032.84 × 105
Au50.020.1959.73
Co00.93284.41
Cr1.75 × 104988.801.19 × 105
Cu5.66 × 1051.09 × 1046.83 × 106
Fe4.95 × 1068.78 × 1031.05 × 107
Li00.1512.23
Mo2.07 × 103139.152.56 × 105
Ni1.14 × 104355.538.25 × 104
Sb24.150.1828.44
Sn1.57 × 10311.5517.92
RE00.0562.14
Zr02.2 × 10−40
Disclaimer/Publisher’s Note: The statements, opinions and data contained in all publications are solely those of the individual author(s) and contributor(s) and not of MDPI and/or the editor(s). MDPI and/or the editor(s) disclaim responsibility for any injury to people or property resulting from any ideas, methods, instructions or products referred to in the content.