Article

Exploring Floor-Sitting as Adaptive Behavior in Tropical Apartment Residents: Regional and Indoor Climatic Influences in Indonesia

1
Department of Architecture and Building Engineering, School of Environment and Society, Institute of Science Tokyo, 4259-G5-2 Nagatsuda-cho, Midori-ku, Yokohama 226-8501, Japan
2
Department of Architecture, Faculty of Civil Engineering, Planning and Earth Sciences, Institut Teknologi Sepuluh Nopember, Surabaya 60111, Indonesia
3
Graduate School of Advanced Science and Engineering, Hiroshima University, 1-5-1 Kagamiyama, Higashi-Hiroshima, Hiroshima 739-8529, Japan
*
Author to whom correspondence should be addressed.
Sustainability 2026, 18(2), 865; https://doi.org/10.3390/su18020865
Submission received: 2 December 2025 / Revised: 6 January 2026 / Accepted: 11 January 2026 / Published: 14 January 2026
(This article belongs to the Section Sustainable Urban and Rural Development)

Abstract

In the tropical climates of Southeast Asia, the growing reliance on air conditioning (AC) for space cooling not only increases household energy consumption but may also diminish the role of culturally rooted adaptive behaviors such as floor-sitting. This study aims to explore the interaction between climatic factors, including regional and indoor climates, and thermally adaptive behaviors in Indonesian apartments, with a focus on floor-sitting. First, a large-scale questionnaire was conducted to analyze these interactions among different regional climates. Second, in-depth indoor climate measurements and a point-in-time questionnaire were conducted among the residents in the hotter regions. In the hotter regions like Jabodetabek (Jakarta metropolitan area) and Surabaya, floor-sitting was primarily conducted without using AC, often alongside fans in low-rise housing. In the cooler region of Bandung, floor-sitting was a common adaptive behavior with window openings in both high-rise and low-rise buildings. The in-depth measurement showed that low-rise buildings using higher thermal mass materials maintained stable indoor conditions for both air and floor temperatures even in the hotter region. The respondents could obtain coolness and remain thermally comfortable through a floor-sitting posture without using AC, especially when air and floor temperatures were both less than 31 °C. These results demonstrated that floor-sitting is a vital behavior that adapts to regional and indoor climatic conditions in the tropics while achieving thermal comfort and relying less on AC devices.

1. Introduction

1.1. Building Typology, Energy Use, and Adaptive Behavior in Southeast Asia

In Southeast Asia, populations are continuously increasing with economic growth, forming rapid urbanization in large cities. Owing to urbanization, building typologies are currently experiencing a significant transition, shifting from predominantly landed to vertical housing. In Indonesia, vertical housing generally consists of low-rise and high-rise multi-story apartments, which are increasingly promoted as solutions to rapid urbanization, limited land availability, population growth, and the demand for affordable housing in large cities. The earliest form of public vertical housing—Rumah Susun (walk-up or multi-story flats)—was introduced in the 1980s through government-supported housing programs [1,2]. Among them, Rusunawa (Rumah Susun Sewa) consists of rental units fully owned and managed by the government for eligible low-income households. Rusunami (Rumah Susun Sederhana Milik) represents a specific category of simple/low-cost ownership flats that can be purchased by low-income groups, making it an attractive option for middle-income groups who are seeking affordable and livable housing. Rusunami was first built in the 2000s [2], and the number of high-rise apartments has continued to increase over the last two decades. This transformation in housing form is closely tied to changes in residents’ lifestyles [3,4,5], thermal adaptation practices (e.g., window opening and air conditioning usage) [6], and building energy demand [7,8].
Such economic growth and urbanization also led to cultural shifts from traditional to modern (i.e., Western) lifestyles for residents in Southeast Asia. Western influences during this transition often change the way people behave in their houses and cause an increase in household energy consumption, with a greater dependence on energy-consuming appliances [9]. Energy demand projections highlight the importance of this trend. According to Latha et al. [10], Indonesia’s annual electricity consumption is expected to rise sharply between 2000 and 2030, mainly driven by the rapid growth of residential sectors. Among household appliances, air conditioner (AC) ownership is projected to increase substantially, making it one of the most influential factors shaping household electricity consumption and its peak demand [11,12,13].
In residential environments, especially in tropical climates like Southeast Asia, occupant adaptive behavior plays a critical role in forming thermal comfort and energy usage patterns [14]. While much attention has been given to architectural and mechanical solutions for indoor climate control, the adaptive behaviors of occupants—particularly those related to posture and spatial use—remain underexplored. In Indonesia, floor-sitting is known as a culturally embedded practice, commonly performed throughout the day for activities such as eating, studying, relaxing, and gathering [15]. This means that floor-sitting has been discussed mainly in view of adaptive behaviors influenced by local and regional cultures [16,17]. Beyond its cultural significance, floor-sitting may also serve as a thermally adaptive behavior, providing increased contact with cooler surfaces [18,19] and promoting comfort in tropical climates without relying on AC usage [20]. Erwindi et al. (2025) revealed that the reasons for preferring floor-sitting included comfort, coolness, and habit [18]. However, the growing reliance on active thermal adaptation strategies, particularly AC, not only increases household energy consumption but may also diminish the role of culturally rooted adaptive behaviors such as floor-sitting. They have rarely been studied and should be explored further.

1.2. Regional and Indoor Climatic Factors

To discuss thermally adaptive behaviors, it is important to fully consider the climatic contexts, including regional climate and indoor climate. Indonesia is known as a tropical country; however, there are different climatic zones owing to the country’s vast size and complex terrain. Putra et al. [21] developed climate zones for determining appropriate passive cooling techniques in Indonesia and classified the entire Indonesian territory into eight climate zones. In particular, there are mainly two climate categories: hotter regions among lowland areas (e.g., Jakarta and Surabaya) and cooler regions among highland areas (e.g., Bandung and Bogor). Mori et al. (2020) indicated the differences in window-opening, AC usage, and fan usage patterns between hotter and cooler regions in Indonesia [22].
In addition, building types, design, and materials are dominant factors influencing indoor climates and should therefore be considered when discussing thermally adaptive behaviors. In Indonesia, low-rise apartments (≤5 floors) mainly apply conventional reinforced concrete with high thermal mass for the main structure and have a single-loaded corridor. In contrast, medium- and high-rise buildings (>5 floors) apply precast concrete with low thermal mass and a double-loaded corridor [23]. Alfata et al. (2015) revealed that different building types affected indoor climate and residents’ thermal comfort [24].

1.3. Research Questions and Gap

Erwindi et al. (2025) indicated that behavioral adaptations with floor-sitting remain viable in achieving thermal comfort through survey results in Jabodetabek (Jakarta metropolitan area), Indonesia [18]. In the region, thermal comfort across different building types was mainly reported as comfortable by residents in their units while showing floor-sitting behavior, even for respondents who did not own AC. Accordingly, this raises the question of how regional and indoor climates form thermally adaptive behaviors in tropical apartment residents, with a particular focus on floor-sitting. Empirical evidence is still limited on how floor-sitting, as a culturally rooted habit, relates to thermal adaptations and comfort across different regional and indoor climates. Sitting posture is an understudied form of thermal adaptation [14], and the combined effects of regional and indoor climates on such behavior have seldom been investigated in depth.

1.4. Research Objectives

This study explores the interaction between climatic factors, including regional and indoor climates, and thermally adaptive behaviors in Indonesian apartments. In particular, it investigates the role of floor-sitting practices as a thermal adaptation strategy and compares their occurrence with other adaptation methods—such as AC and fan usage—across different climates and building types. By analyzing large-scale questionnaire data alongside in-depth indoor climate measurements, this study identifies key factors that influence thermally adaptive behavior in both low-rise and high-rise apartment settings. Further, the paper is structured in two parts, with the first part presenting a comparative analysis among different regional climates using a large-scale questionnaire to examine regional differences in floor-usage behavior, thermal adaptation strategies, thermal comfort perception, and household energy consumption. The second part involves in-depth indoor climate measurements, including air and floor temperatures, and a point-in-time questionnaire to explore the relationship between building types, indoor climates, floor-usage behavior, thermal adaptations, and thermal comfort. Through this combined approach, the study will provide insights into how floor-sitting as a traditional practice can support sustainable living in modern housing environments while also addressing broader questions of energy-saving and occupant-centered design in tropical contexts.

2. Methodology

2.1. Large-Scale Questionnaire Survey

2.1.1. Survey Design

This study used a cross-sectional and nationwide questionnaire survey to investigate floor-usage behaviors, thermal adaptation methods, thermal comfort, and household energy consumption across five cities—Bandung, Jabodetabek, Surabaya, Makassar, and Medan. The questionnaire was structured to document naturally occurring practices in daily life, mainly focusing on floor-sitting behaviors in these cities [25,26]. This method provided systematic data collection and qualitative insights, offering a comprehensive view of behavioral adaptation to climate and housing conditions [27,28].
Respondents represented a broad range of educational and income levels from low- to high-income households. With prior approval from building managers, trained surveyors from a survey company (IPSOS Indonesia) visited residential units, explained the survey purpose, and obtained informed consent. The questionnaire was conducted face-to-face, ensuring clarity and reliability in responses, and respondents received an honorarium in recognition of their contribution. Table 1 lists the categories and question items [18]. The questionnaire comprised 86 questions organized into six main categories and 24 sub-categories of questions. Category I covers individual and residential information. Category II addresses energy usage in daily activities, including AC use, residents’ lifestyle patterns, and psychological factors. Category III includes questions related to daily activities such as gathering, mealtime, studying, relaxing, and sleeping in their units. Category IV covers questions about foot coverings and floor-covering types at daily activity areas. Category V includes questions on postures during daily activities and thermal comfort levels. Category VI includes questions aimed at identifying specific body parts in direct contact with the floor and preferences for floor contact during the above-mentioned daily activities.

2.1.2. Building Typology

In the Indonesian context, vertical housing is formally classified into Rusunawa, Rusunami, and condominiums. Rusunawa are government-owned rental apartments provided for low-income households. Rusunami refers to ownership-based housing mainly for low- and middle-income groups subsidized by government assistance [29]. Condominiums, on the other hand, are privately developed high-end residences primarily accommodating high-income residents [30]. Beyond this economic distinction, vertical residences are also differentiated into high-rise and low-rise developments based on their building characteristics, which depend on their structural scale and form [23]. Based on the building design and materials, as described in Section 1.2, the classification of Low-rise (≤5 floors) and High-rise (>5 floors) was used for the study analysis. Rusunawa is predominantly Low-rise, following the government design guidelines. Rusunami ranges from Low-rise to High-rise buildings. A condominium is mainly characterized as High-rise. Further, building types are then classified into Low-rise and High-rise based on the survey results. In contrast, socio-economic factors are examined separately by grouping respondents into different income levels.

2.1.3. Sampling Strategy and Data Collection Process

As of 2023, there are 60,511 subsidized apartment units in Indonesia, comprising both Rusunawa and Rusunami [31]. The total number of housing units was treated as the finite population size (N) for the purpose of sample size determination. The adequacy of this sample size was evaluated by calculating the margin of error (MoE) at a 95% confidence level ( M o E 95 ), incorporating a finite population correction to account for the limited population size [32]. The margin of error was calculated as follows:
M o E 95 =   z 0.95   σ p 2 n   N n N 1
where N is the total population size (60,511 housing units), n is the defined sample size, σ p 2 is the variance of the population proportion with a conservative maximum value of 0.25 (p = 0.5), and z 0.95 = 1.96 corresponds to the 95% confidence level. Using this formulation, the margin of error for the present survey was estimated to be ±1.81%, indicating that the survey estimates are expected to fall within ±1.81 percentage points of the true population values for the subsidized apartment housing population. With this method, an initial target sample size of 3000 respondents was defined for the representativeness of residents living in Rusunawa and Rusunami in Indonesia. In addition, 800 respondents living in condominiums were considered as a supplementary sample for comparative purposes; these condominium samples were not included in the finite population used for margin-of-error estimation.
Based on the 2010 national census, Indonesia contained ten metropolitan areas with populations exceeding one million residents. The present study selected five representative cities among these metropolitan areas that capture distinct climatic conditions, urban structures, and housing characteristics. The surveyed cities were Bandung (2.5 million), Jabodetabek (10.6 million), Surabaya (2.9 million), Medan (2.4 million), and Makassar (1.4 million). Taking into account the relative population sizes and the distribution of apartment housing across the selected cities, the total target sample of 3800 respondents was allocated as follows: 1800 for Jakarta, 600 each for Surabaya and Bandung, and 400 each for Medan and Makassar, thereby ensuring sufficient representation of diverse urban contexts [18].
To discuss regional climatic factors on thermally adaptive behaviors, these cities were classified into two groups: the cooler region (i.e., Bandung: highland tropical climate) and hotter regions (i.e., Jabodetabek: Sub-monsoonal, Surabaya: Sub-savanna, Medan: Equatorial, and Makassar: Monsoonal) based on the Indonesian climatic zones for passive cooling by Putra et al. [21] (Table 2). Based on typical meteorological year data by the Meteorology, Climatology, and Geophysical Agency of Indonesia (Badan Meteorologi, Klimatologi, dan Geofisika) [33], outdoor temperatures are cooler in Bandung, with an annual average temperature of 26 °C. Conversely, Jabodetabek, Surabaya, Medan, and Makassar show higher outdoor temperature ranges with annual average temperatures of around 28–29 °C.
Data collection was conducted by the survey company between September and November 2022. A probability-based random sampling approach targeting residents of apartment-type housing, including Rusunawa, Rusunami, and condominiums, was employed to ensure balanced representation across gender, age, and ethnic groups. In total, 3383 apartment residents in the selected cities completed the questionnaire. The sample distribution included Rusunawa (48%), Rusunami (41%), and condominiums (11%). Building height or floor-level distribution was not employed as a sampling criterion during data collection. Instead, information on the total number of floors was recorded during the survey and subsequently used as an analytical variable. Consequently, for analytical purposes, the sample was classified into Low-rise (63%) and High-rise (37%). No post-survey weighting was applied, as the primary objective of the sampling design was to ensure representativeness of apartment housing residents as a whole, rather than representativeness by building height information. During data processing, several responses contained missing information regarding the unit floor level. Therefore, after excluding these cases, 3131 valid samples were retained for the final analysis. Household participation included 24% single-member, 44% two-member, 19% three-member, and 13% multi-member (four or more) households, with all respondents aged 18 years or older. A detailed demographic distribution is presented in Table A1 (Appendix A).

2.1.4. Estimation of Annual Household Electricity Consumption

Annual household electricity consumption was quantified in units of gigajoules per year (GJ/year) based on monthly energy use data collected through a structured questionnaire survey. Respondents were primarily asked to report on their household electricity consumption using official utility billing records, covering at least the preceding 12 months, where available. When billing records were unavailable, respondents were requested to provide monthly electricity consumption values or payment amounts based on their recollection. Monthly electricity consumption values originally reported in kilowatt-hours (kWh) were converted into energy units using a standard conversion factor (1 kWh = 3.6 MJ) and subsequently aggregated to annual electricity consumption in gigajoules per year (GJ/year). The reported electricity consumption represents total household electricity use, including but not limited to AC, lighting, appliances, and other electrical loads. AC-specific electricity consumption was not isolated in this study. The detailed procedure for this estimation is shown in Appendix B, Table A2, Table A3 and Table A4.

2.1.5. Statistical Analysis

To ensure data reliability for the annual electricity consumption, outliers were screened using standardized Z scores, and only observations with absolute Z scores of 3 or less were retained for the final analysis (n = 2932). To check the statistical differences in the questionnaire results between regional climates and building types, a statistical test was conducted. Comparative variables were classified into two or three categories: AC usage vs. Non-AC in thermal adaptation, Floor-sitting vs. Non-floor-sitting in main posture, Cool-side vs. Neutral vs. Warm-side sensations in daytime and nighttime thermal sensation, and Comfortable-side vs. Uncomfortable-side sensations in daytime and nighttime thermal comfort. Due to unequal sample sizes and small expected counts in some categories, the Fisher–Freeman–Halton exact test was applied instead of the chi-square test. Fisher–Freeman–Halton tests with Monte Carlo simulation (B = 100,000) were conducted to perform pairwise comparisons of occupant behaviors and thermal responses between high-rise and low-rise buildings in both hotter and cooler regions (seed = 123). To account for multiple comparisons, the Benjamini–Hochberg adjustment (BH-adjusted) was applied in addition to raw p-values. This approach allowed us to identify statistically significant differences in behavioral and thermal adaptation patterns across building types and climatic contexts. The stats package (ver. 4.5.0) of R version 4.5.0 was employed for all of the statistics.

2.2. In-Depth Measurement

2.2.1. Details of the Measurement and Questionnaire

The second part of this study comprises indoor climate measurements and a questionnaire survey to explore the relationship between building types, indoor climates, floor-usage behavior, thermal adaptations, and thermal comfort experienced during respondents’ daily activities. Our sample size was limited; however, these relationships can be discussed through detailed on-site measurement and a point-in-time questionnaire. The survey was conducted in Surabaya, selected as a sample location in a hotter region, from late July to mid-September 2023.
Data collection was carried out using two complementary approaches. First, on-site measurements were conducted to capture indoor climate conditions within the respondents’ dwellings, including indoor temperature and floor temperature. Second, point-in-time questionnaire surveys were administered online to capture respondents’ floor-usage behaviors, postures, thermal adaptations, thermal comfort, thermal sensation, and temperature demand during floor contact.
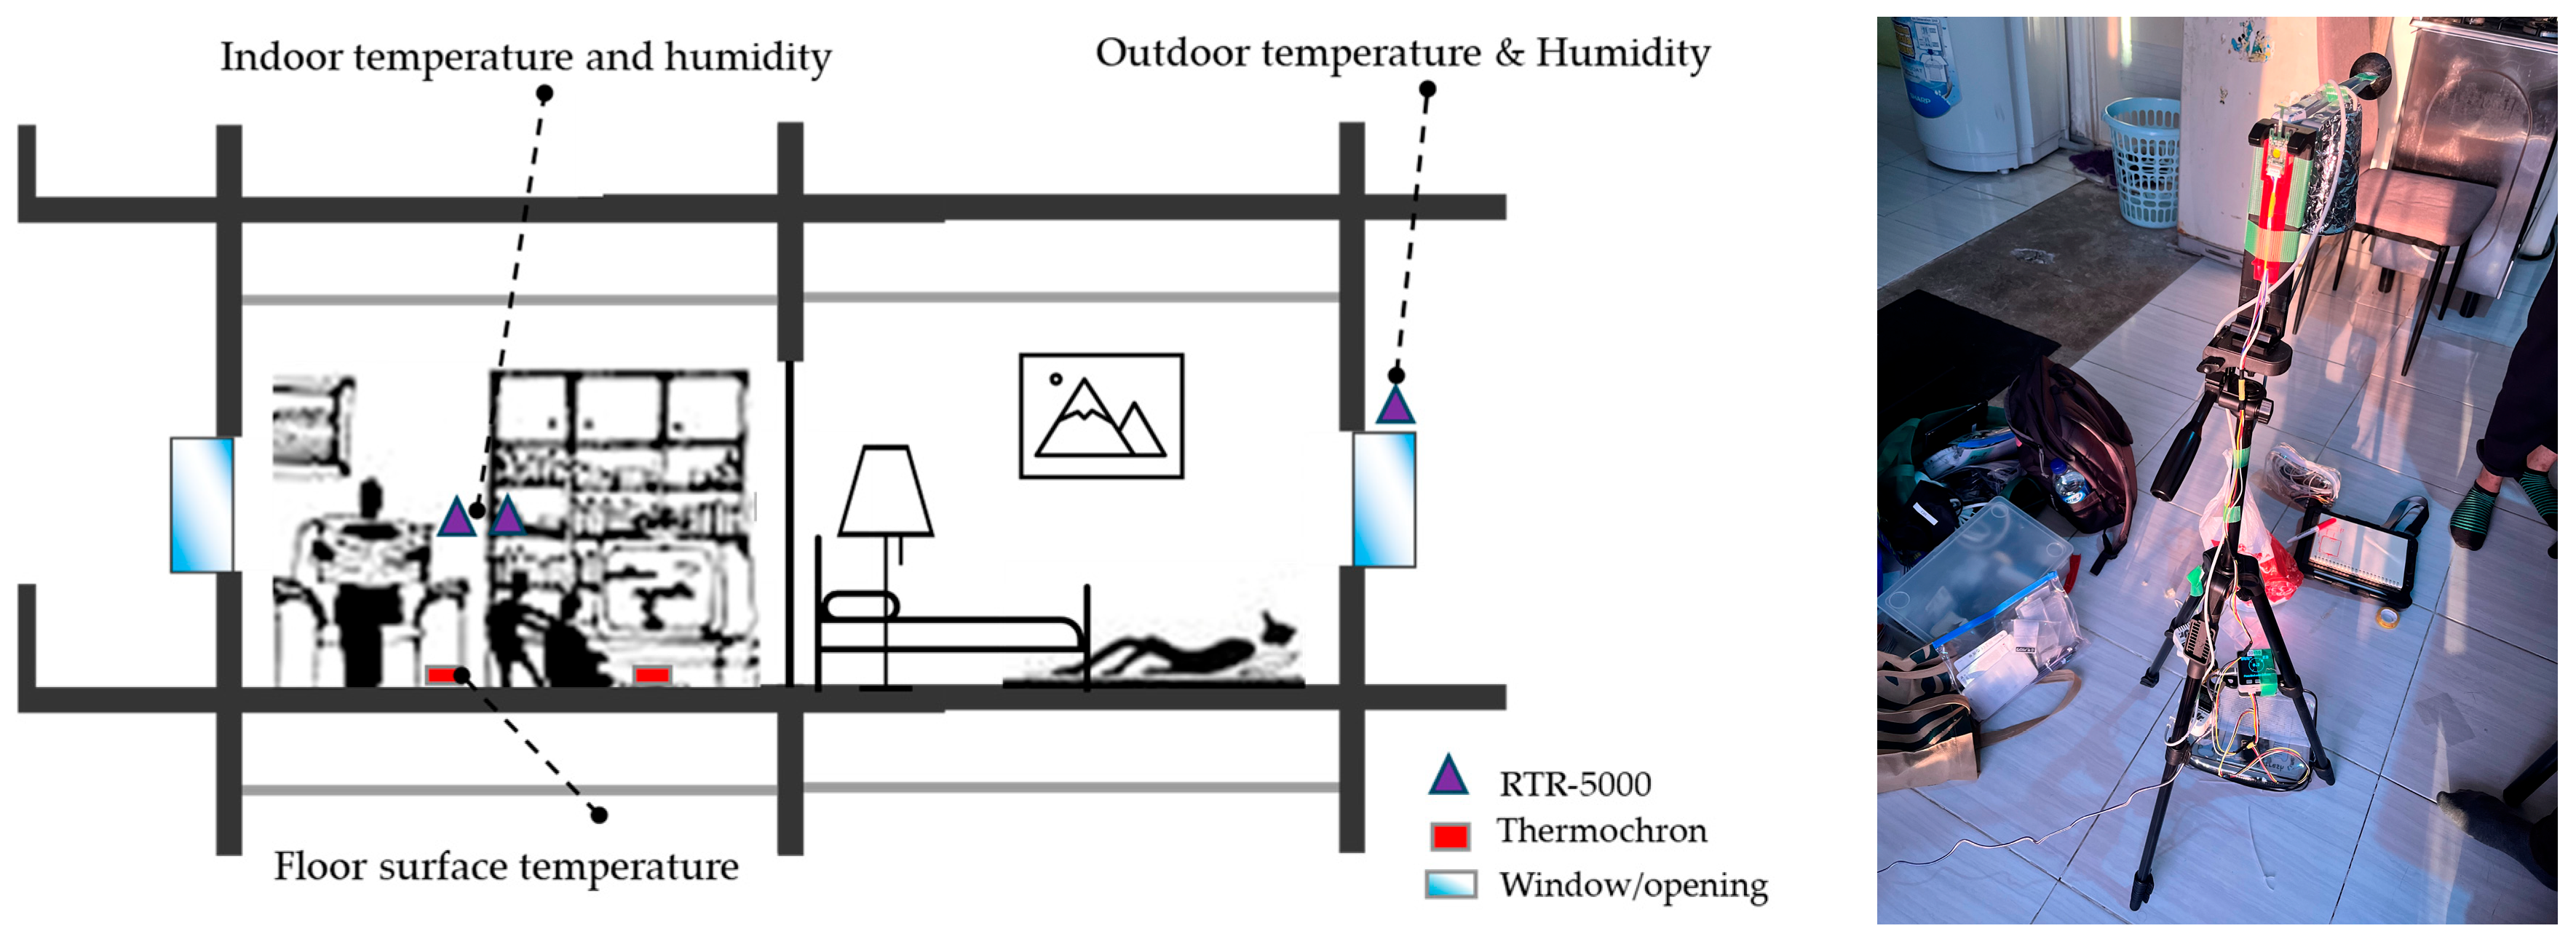
For indoor climates, air temperature and floor surface temperature were monitored using thermistor sensors with data loggers (RTR-503B, T&D Corporation, Matsumoto, Japan) and button-type temperature sensors (iButton, Maxim Integrated, San Jose, CA, USA), respectively. Prior to field deployment, all sensors were cross-checked during pilot measurement under controlled indoor conditions to verify consistency and to minimize inter-sensor bias. Air temperature sensors were installed at a height of 110 cm above the floor, corresponding approximately to the breathing zone for seated occupants, which is commonly adopted in thermal comfort field studies (Table 3). The sensors were suspended using a non-conductive holder (camera tripod with non-conductive covering) and positioned away from direct solar radiation, electrical appliances, and immediate airflow sources like fans (Figure 1). Radiation shields were used for measuring indoor air temperature, and care was taken to avoid exposure to direct sunlight through windows.
Floor surface temperature was measured using iButton sensors. It was selected as the sensor due to its very small size (thickness < 0.01 m) and wireless operation, allowing it to be installed discreetly. Covered with aluminum tape, the sensors were placed in direct contact with the finished floor surface at locations frequently used for sitting by the residents.
All sensors recorded data at 5-min intervals, which provides sufficient temporal resolution to capture short-term indoor thermal fluctuations and occupant adaptive actions. Sensor clocks were synchronized prior to installation to ensure temporal alignment across datasets. Data collection was continuous throughout the measurement period. During data processing, missing data were neglected for the analysis. Because outlier values were minimal, they were included in the analysis.
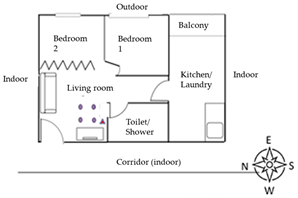
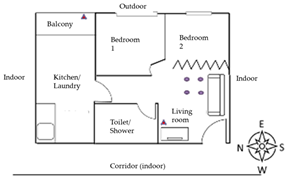
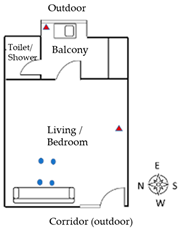
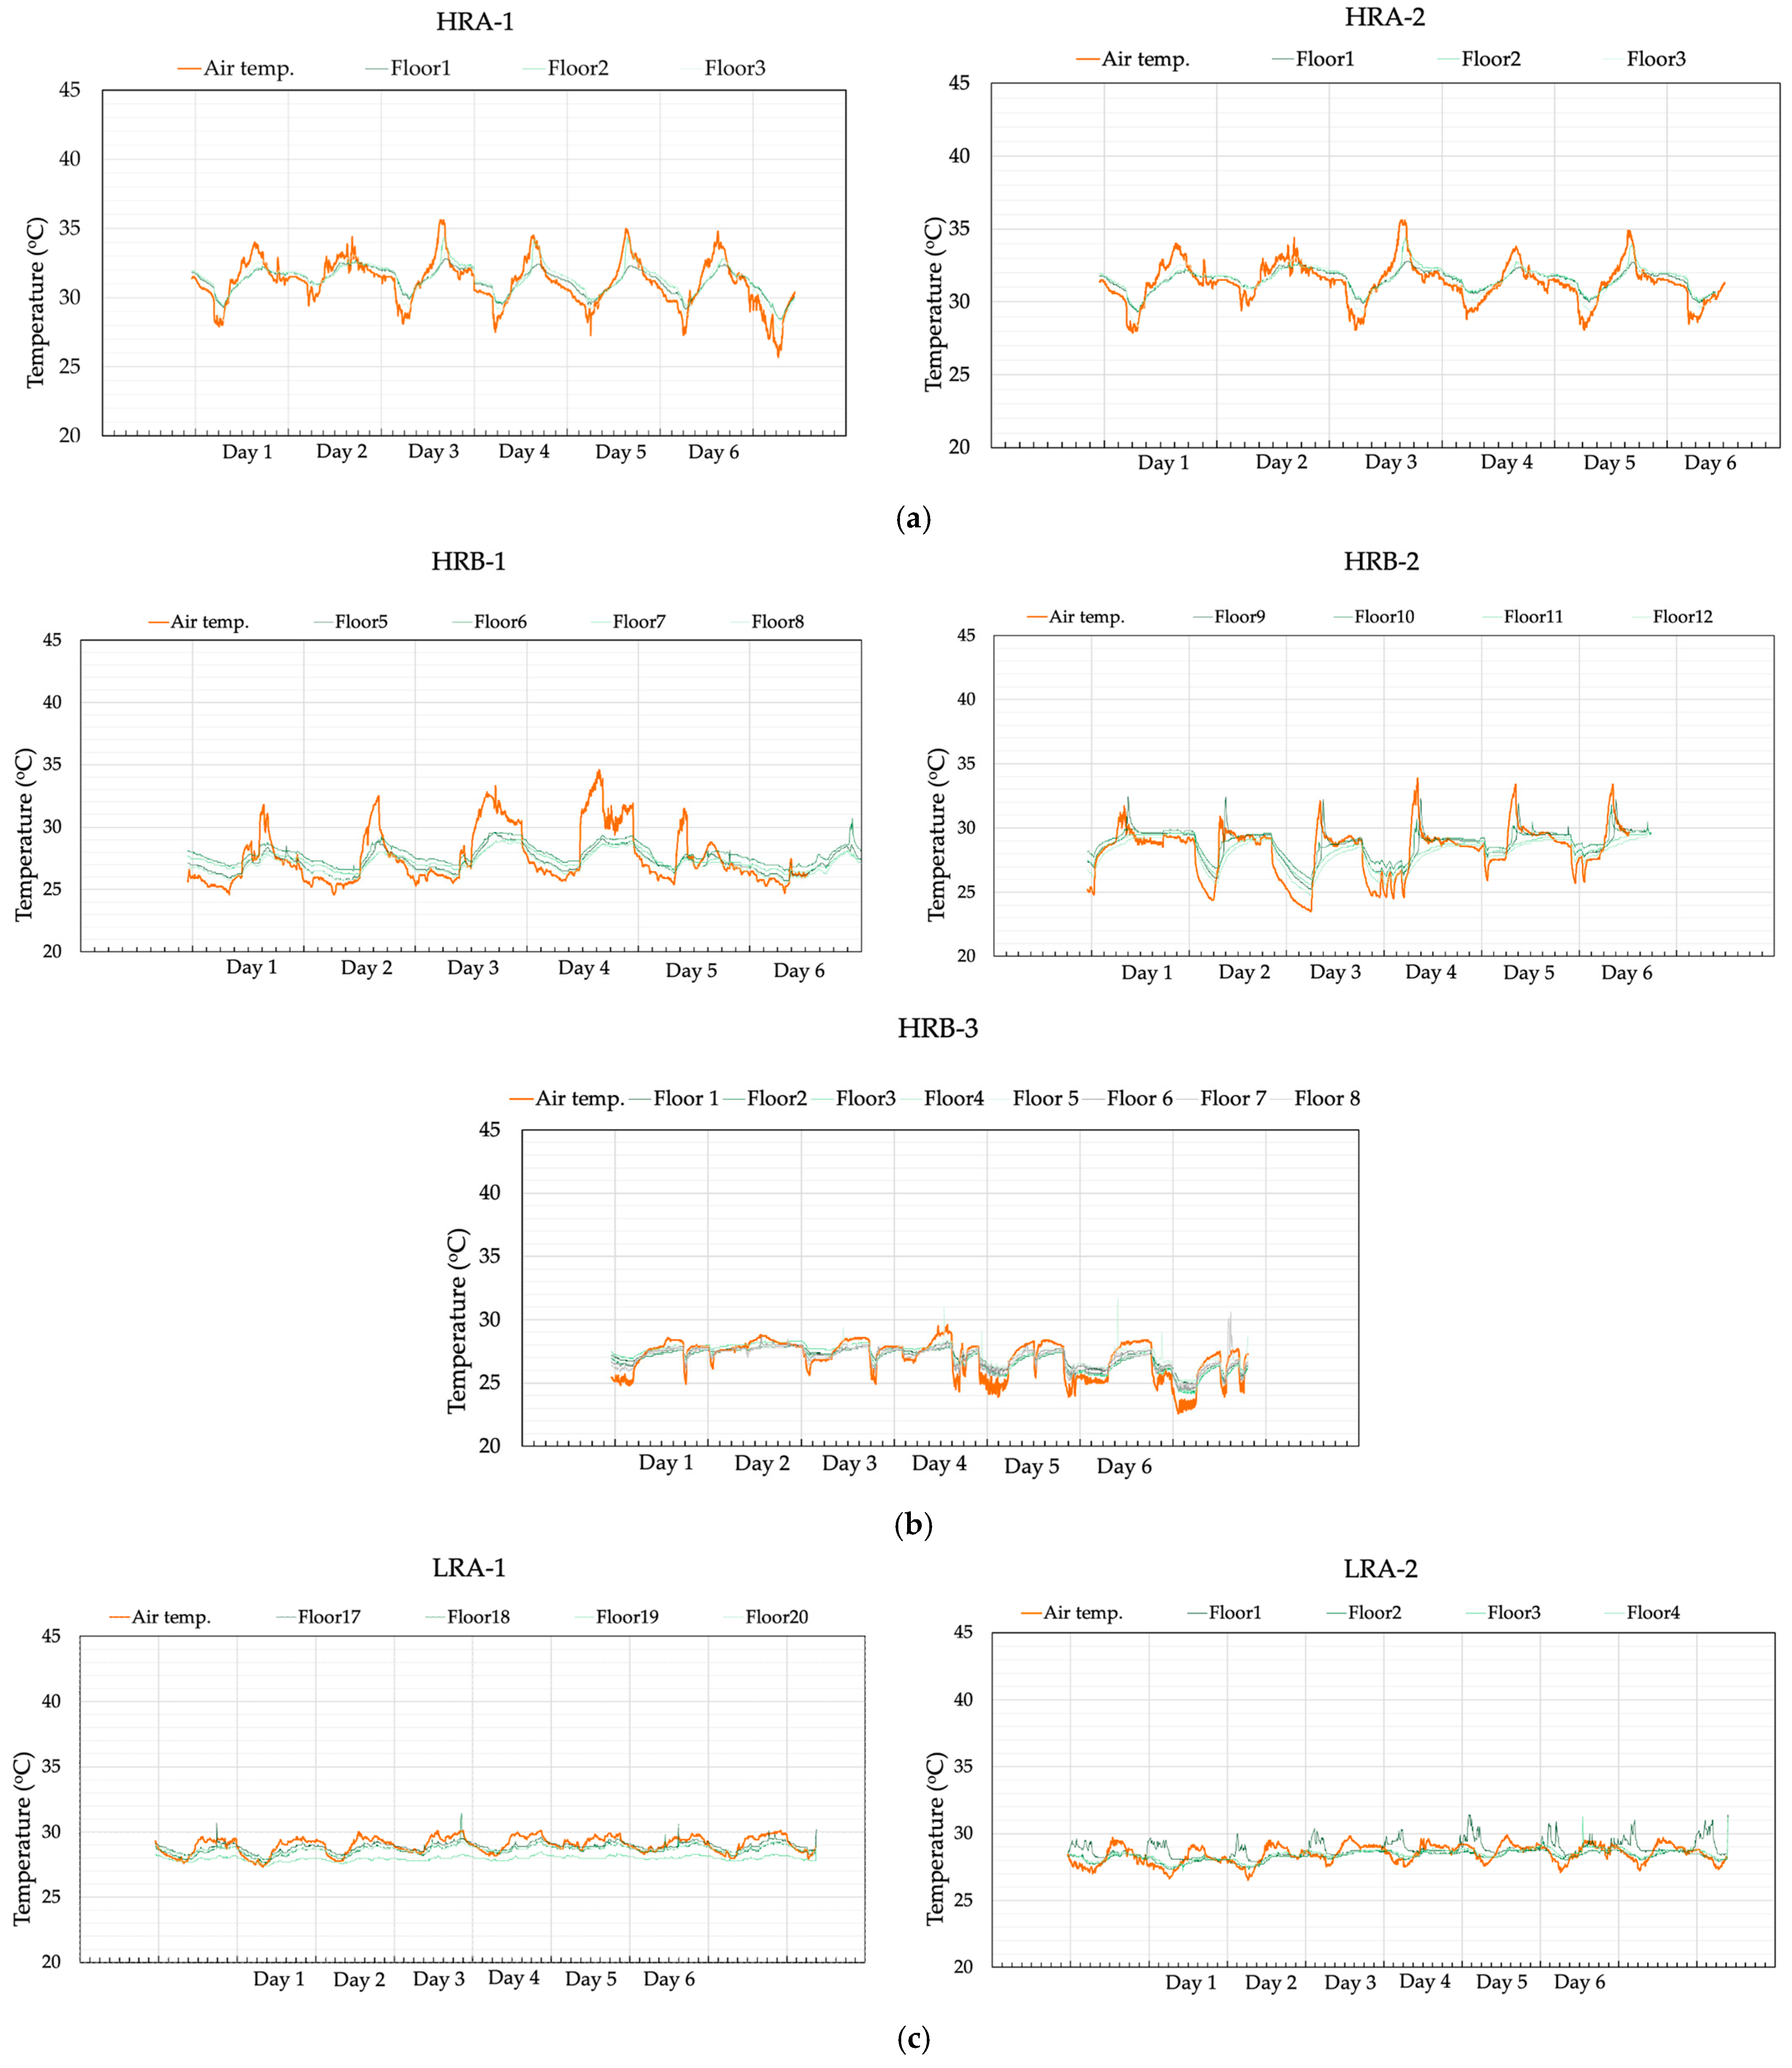
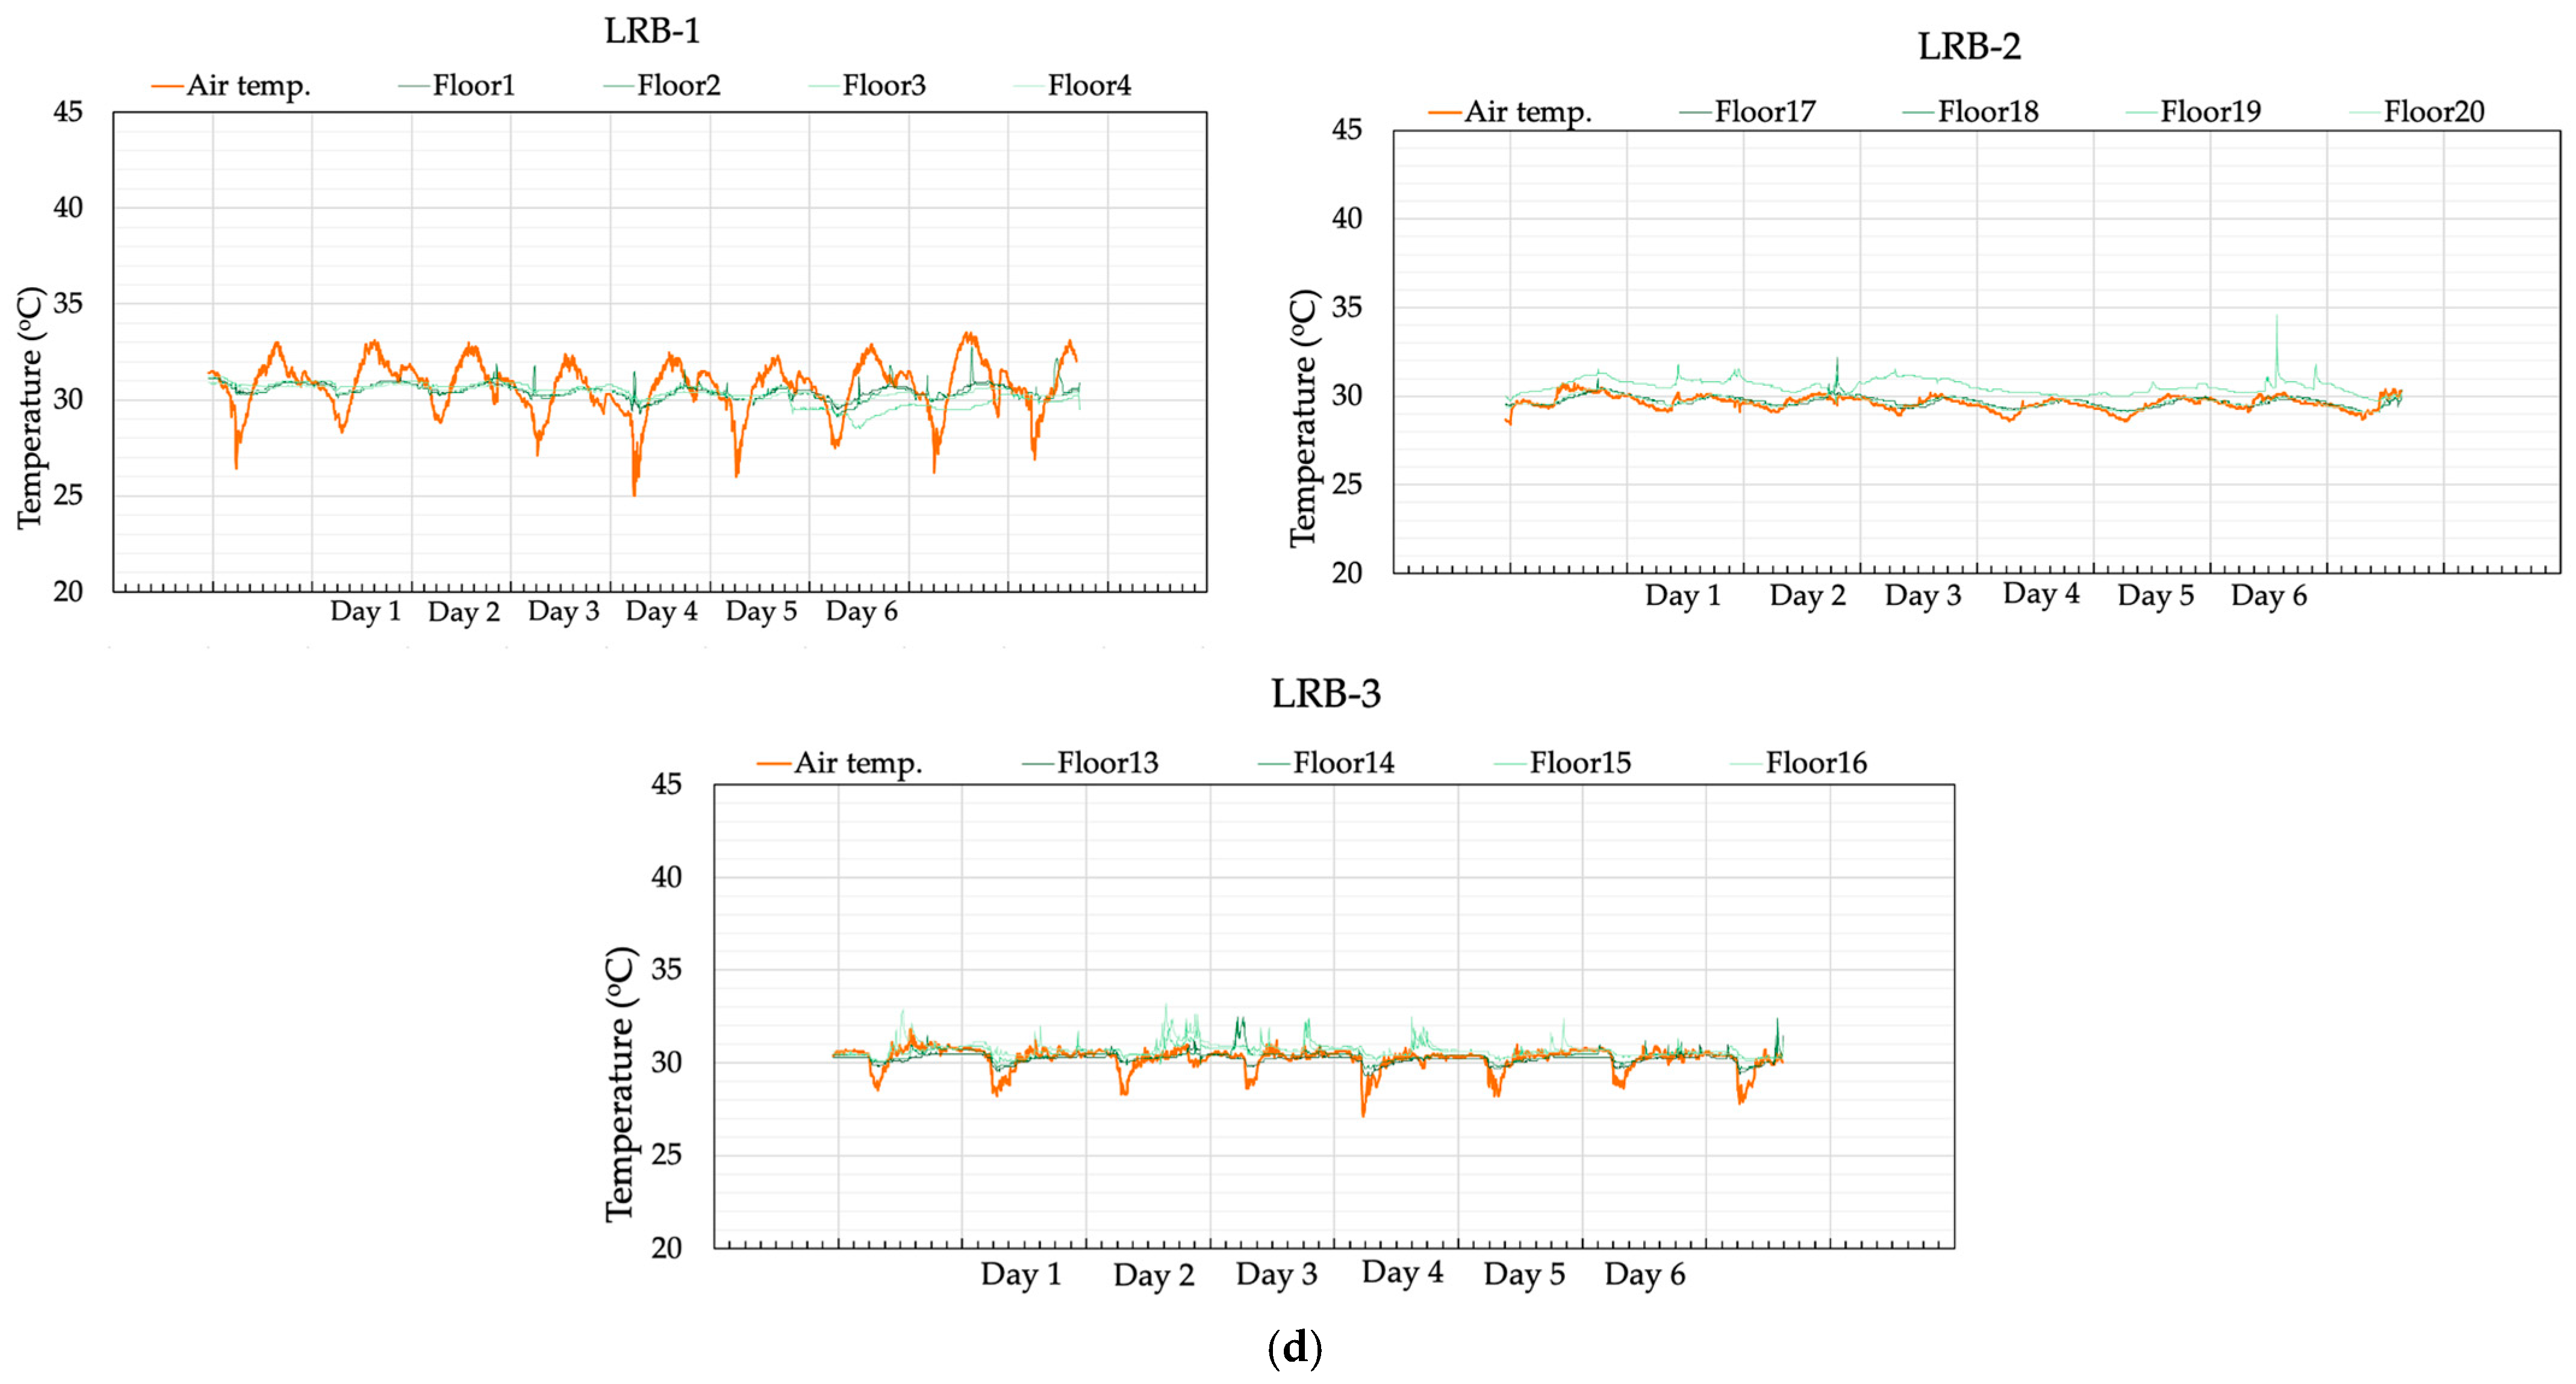
Measurement locations within each dwelling were selected to represent typical living zones rather than boundary conditions. Sensors were generally placed in the main living area, avoiding immediate proximity to windows, exterior walls, or cooling devices unless these features characterized the primary occupied zone. (Appendix C, Table A5). This setup ensured minimal intrusion, enabling continuous temperature recording without interrupting the daily activities of residents inside the unit (Figure 1).
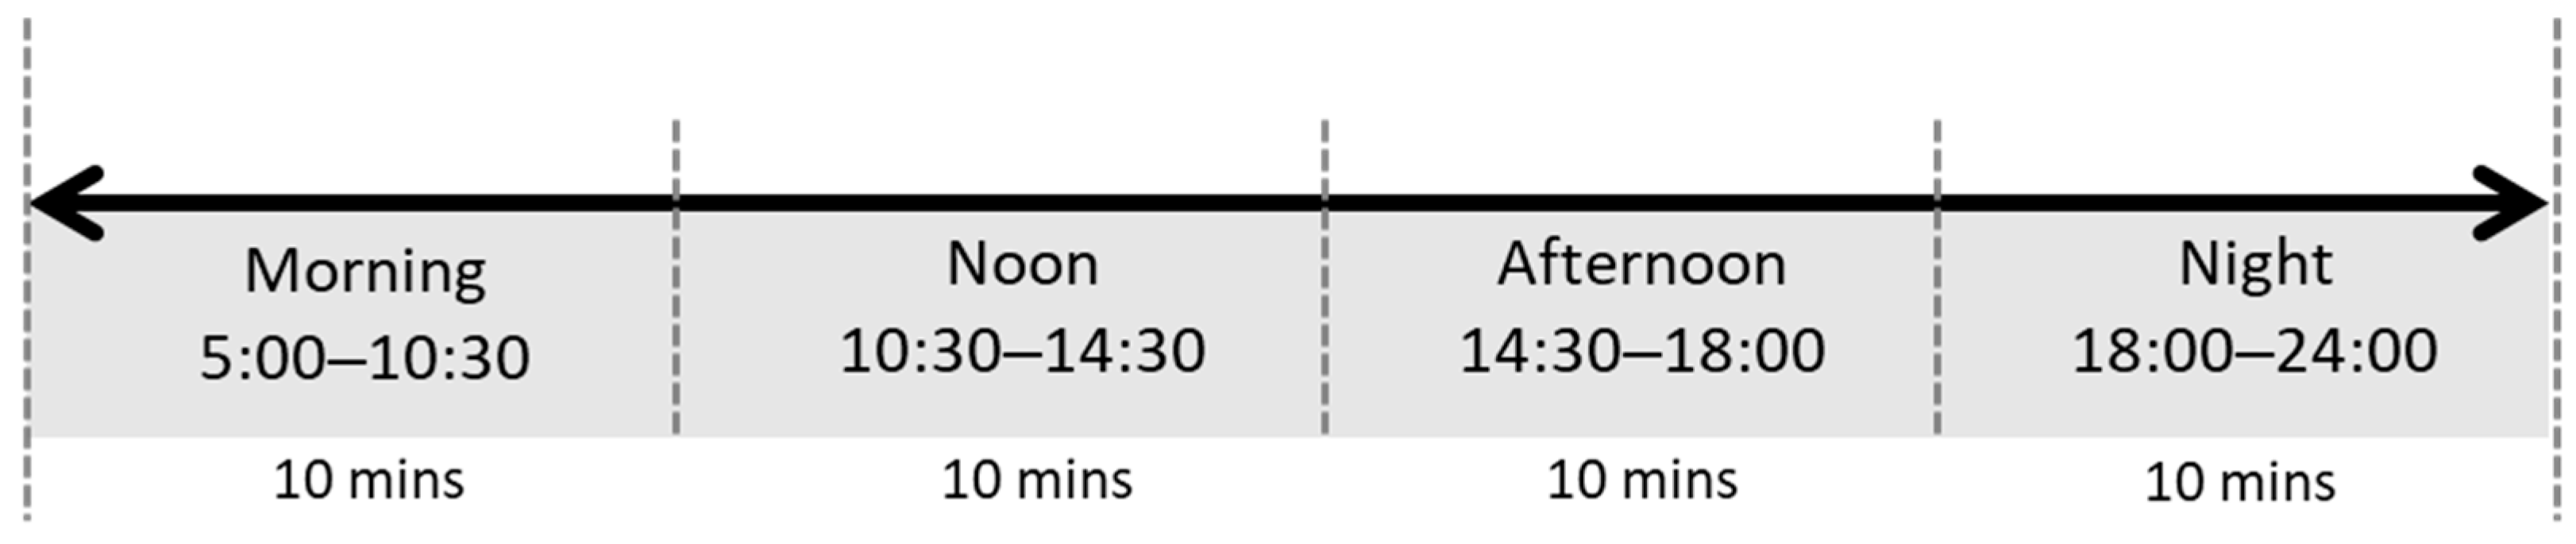
To capture variations throughout the day, the questionnaire survey was divided into four time periods: morning (05:00–10:30), noon (10:30–14:30), afternoon (14:30–18:00), and night (18:00–24:00) (see Figure 2). This allowed for the assessment of daily thermal adaptation patterns in relation to floor usage. For each respondent, the survey was conducted for six days with continuous indoor climate measurements. The respondents were asked to conduct daily behaviors and postures (e.g., sitting on a floor, sitting on a chair/sofa, and standing) at their selected location in the unit during the four time periods while answering the questions. As shown in Table 4, the respondents were asked to answer 24 questions in 10 categories. The 10 categories include general questions, clothing condition, foot sole and floor cover condition, thermal adaptation, activity and place, posture and preference, body parts in contact with the floor, thermal comfort (whole body and body parts that contact with the floor), thermal sensation (whole body and body parts that contact with the floor), and thermal control. Each questionnaire required approximately 10 min to complete across time periods.
In this stage of the study, respondents were selected based on their housing type (High-rise and Low-rise) and AC-usage behaviors (AC usage and Non-AC) to maintain consistency with the large-scale questionnaire, which denotes actual AC operation during specific daily activities as reported. The survey was designed to record thermal adaptation methods, including AC usage and main sitting posture, separately for five daily activities: sleeping, studying or working, resting and relaxing, mealtime, and gathering. Based on these responses, AC usage during gathering was defined as a binary variable indicating whether AC was operated during shared living activities. The gathering activity was selected for focused analysis, similar to the large-scale questionnaire analysis, because it occurred in common sharing spaces where posture-related behaviors and thermal adaptation strategies were most clearly expressed across households.
Consistent with this activity-based definition and with the categorization applied in the large-scale questionnaire, a total of ten respondents for the in-depth measurements were selected, representing contrasting building and adaptation conditions: (i) High-rise Non-AC (Rusunami units without AC ownership or usage, n = 2), (ii) High-rise AC (Rusunami units with AC ownership and usage, n = 3), and (iii) Low-rise Non-AC (Rusunawa units without AC ownership or usage, n = 5) (Table 5).
Information on the units and respondents is shown in Table 4. All four surfaces were finished with ceramic tiles.

2.2.2. Summary of Units and Respondents’ Characteristics

Table 5 summarizes the characteristics of the residential units and respondents included in the in-depth measurement stage. The information is grouped by building height into the High-rise and Low-rise types to reflect differences in architectural configuration and indoor environmental exposure. For each point, the table reports the thermal adaptation condition of the unit (AC or Non-AC), along with a unique unit ID used to anonymize participants and ensure traceability across analyses.
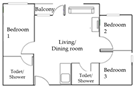
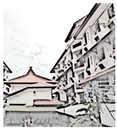
Building- and unit-level attributes are presented to document the physical context of the measurements, including floor level, building structure, external wall material, floor material, floor covering, corridor type, presence of window shading, and window-to-wall ratio (WWR, Appendix D, Figure A1). These parameters are reported because they influence solar exposure, heat storage, ventilation potential, and surface thermal conditions, which are particularly relevant for posture-related thermal adaptation. In addition, the table includes key respondent characteristics, namely age, gender, and household composition. Spatial information is further complemented by unit plans and photographs of the building.

3. Results

3.1. Questionnaire-Based Analysis of Regional Climate and Adaptive Behaviors

3.1.1. Overall Characteristics for Regional Climates and Building Types

Table 6 shows the overall characteristics of the questionnaire results between regional climates and building types. The table also presents pairwise comparison test results using Fisher–Freeman–Halton tests between the groups that combine regional climates and building types (e.g., comparison between the Hotter High-rise group and the Cooler Low-rise group).
In the results of thermal adaptation, the proportion of AC usage was larger in the Hotter High-rise than in other groups. In the statistical tests, all comparisons showed statistical differences (<0.1%). The results for the main posture showed a similar pattern: the proportion of floor-sitting was lower (30%) in Hotter High-rise, while it became the majority in other groups. All comparisons also showed statistical differences. For daytime thermal sensation, the proportion of cool-side sensations was larger in Hotter High-rise, Cooler High-rise, and Cooler Low-rise. In Hotter High-rise, AC use was considered the main contributing factor. The statistical tests indicated no statistical difference between Cooler High-rise and Cooler Low-rise, or between Hooter High-rise and Cooler High-rise. Nighttime thermal sensation also showed a similar tendency, but the proportion of cool-side sensation was larger for all groups compared to the daytime results. Thermal comfort showed a large proportion for all groups in both daytime and nighttime; nighttime results were even larger. Average electricity consumption was larger in Hotter High-rise (12.4 GJ/year), due to AC usage. Electricity consumption in the other groups was less than half that of Hotter High-rise, with statistically significant differences among all pairwise comparisons, except for Hotter Low-rise vs. Cooler High-rise.

3.1.2. Thermal Adaptations and Main Posture

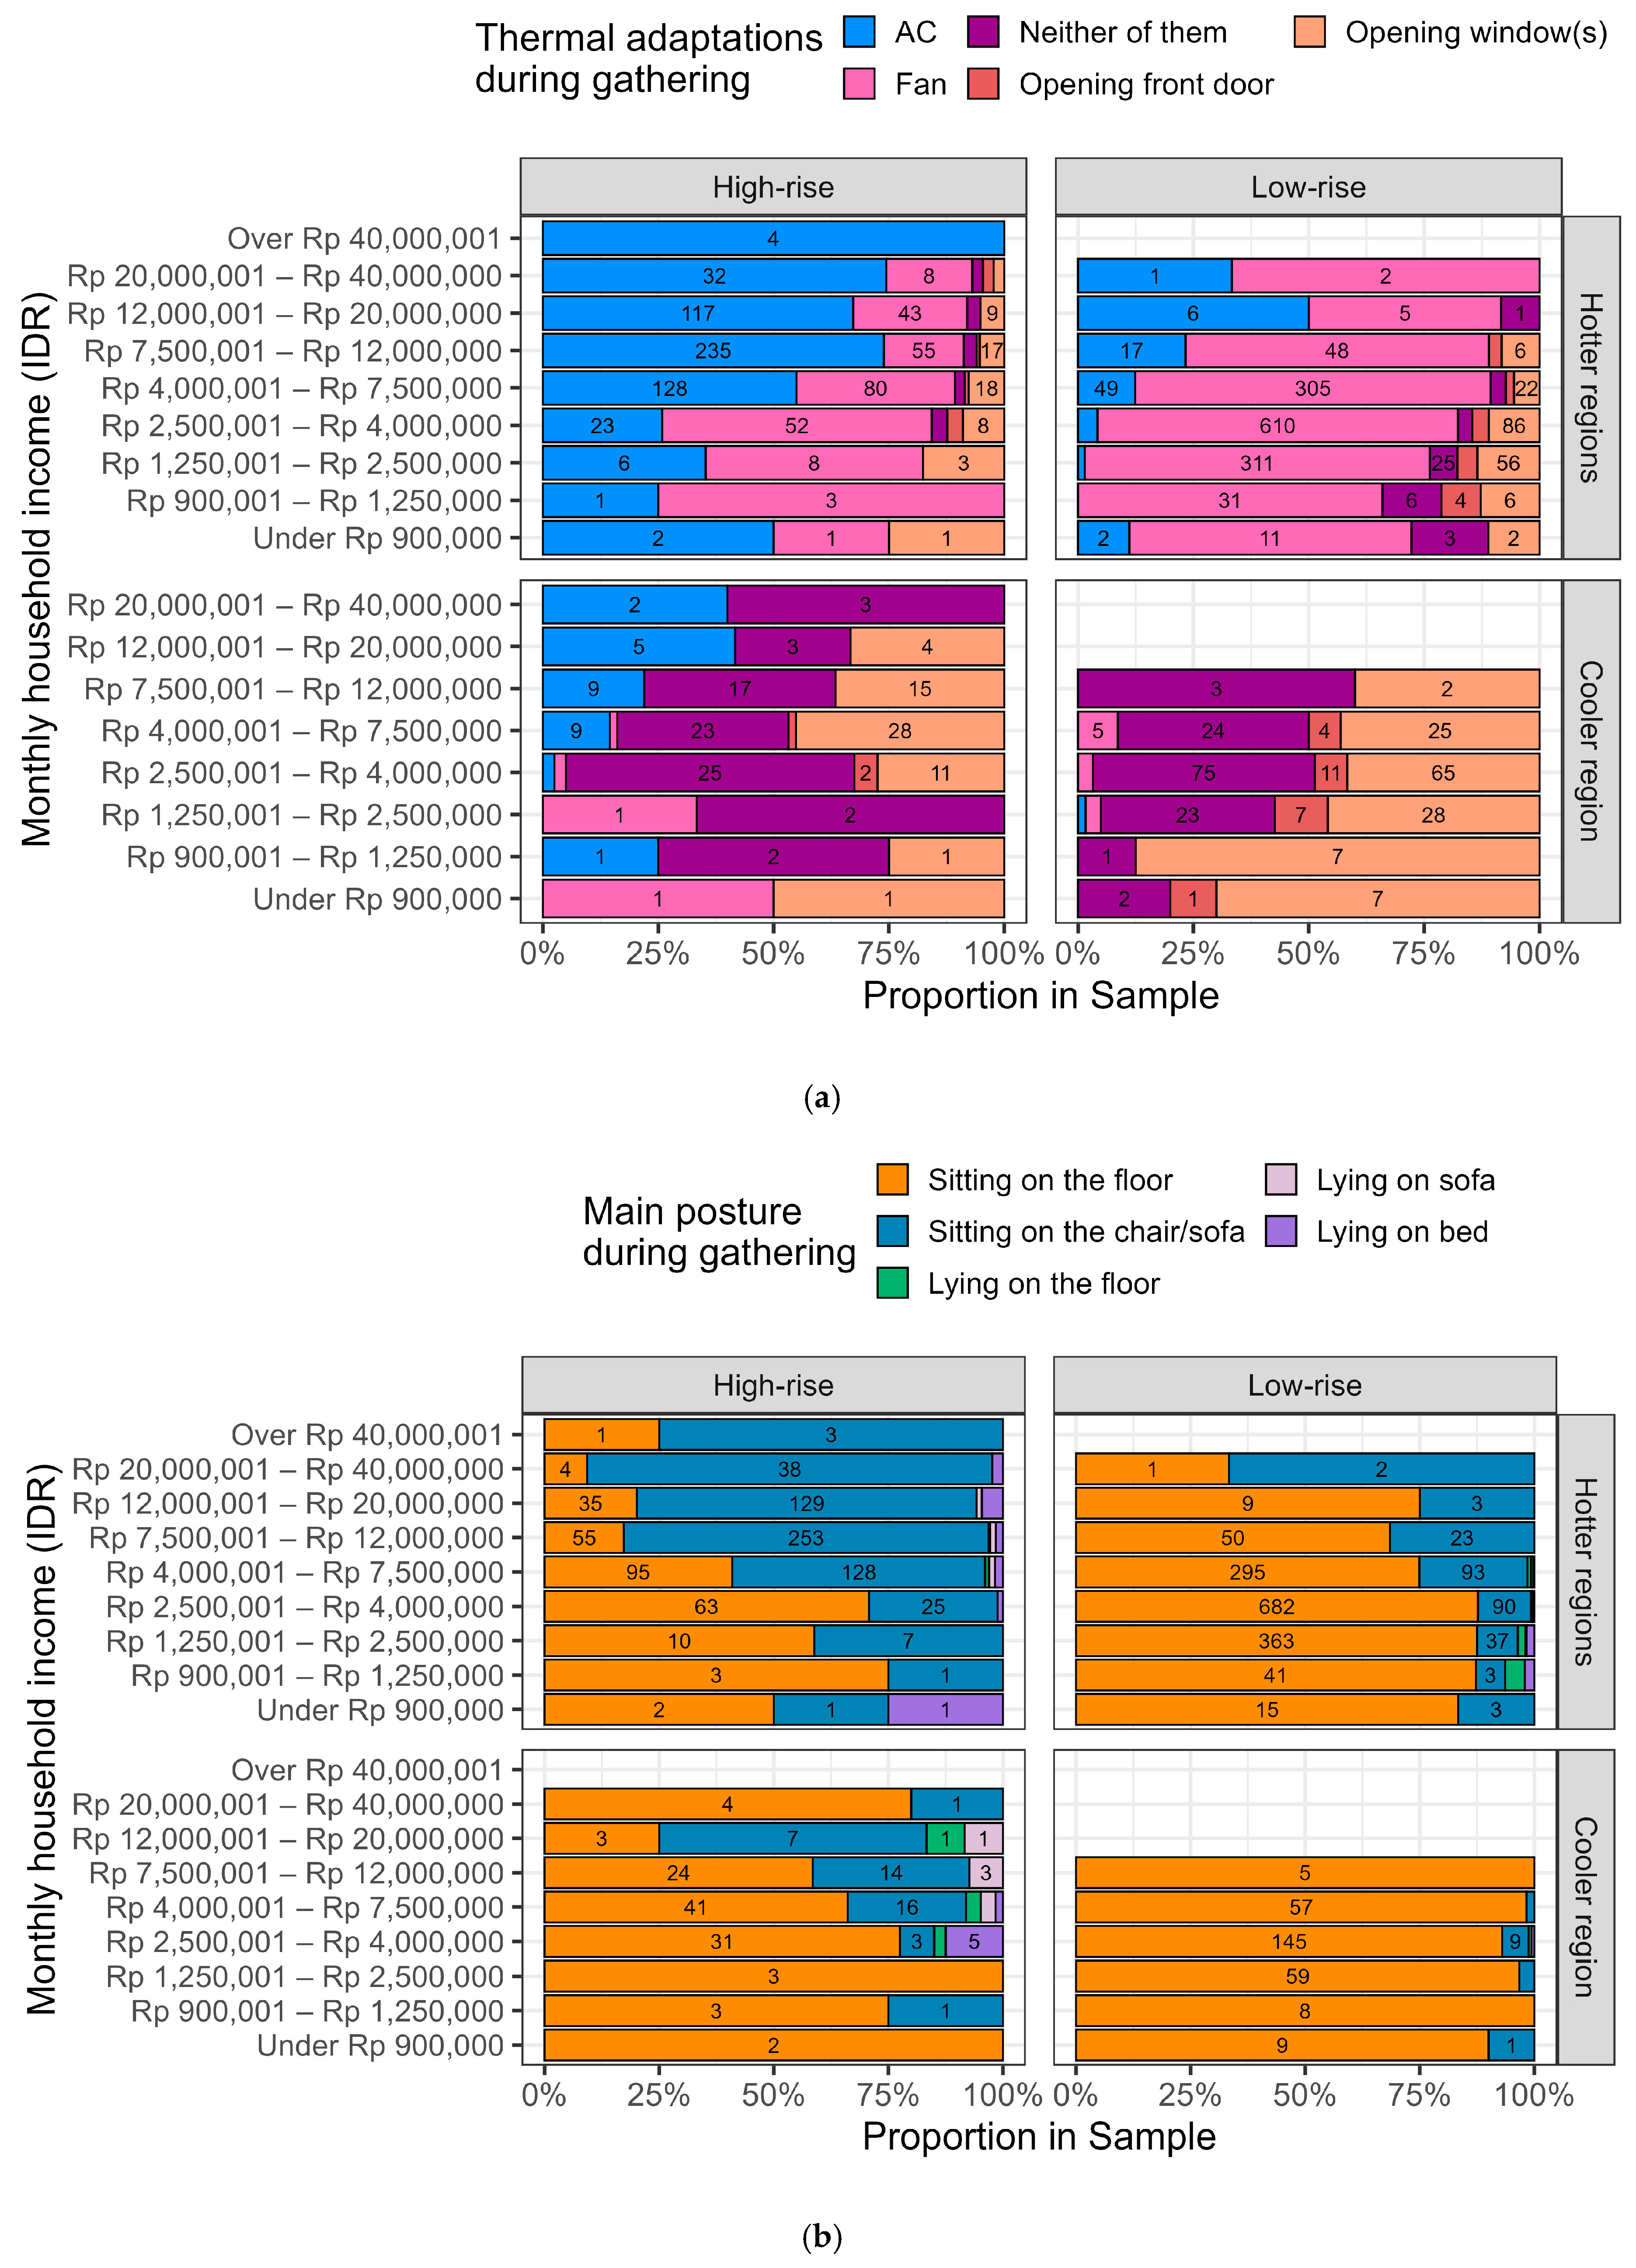
Figure 3 shows the proportions of thermal adaptations and main postures during gathering activities. Household income is an important socio-economic indicator of residents and one of the factors influencing their lifestyle [34]; therefore, the results are classified into each monthly household income level. Indonesians view gatherings as an essential aspect of their lifestyle, reflecting the importance of maintaining social connections [35]. Herein, gathering activities were selected as the primary focus within residential units for the activity analysis.
Focusing on the hotter regions, there is a clear tendency that AC usage accounted for a larger proportion in High-rise than in Low-rise. AC usage proportion also increased with monthly household income. In High-rise buildings, AC usage exceeded 70% in the income group of Rp. 7500 K–Rp. 12,000 K, whereas in Low-rise buildings, it remained below 25% for the same income group. In Low-rise, fan usage was dominant for all income ranges. The proportions of “Neither of them” (i.e., not using any thermal adaptation method) were negligible for both building types. This indicates that thermal adaptations using active cooling methods, such as AC and fans, were necessary in the hotter regions.
In the cooler region, both High-rise and Low-rise showed a higher proportion of “opening windows” and “neither of them.” AC usage appeared only in the higher income range of High-rise; however, these proportions were smaller than those of High-rise in the hotter regions. These results indicate that thermal adaptation using active cooling methods, like AC and fans, was not necessarily needed in the cooler region.
Regarding the main posture during gathering activities (Figure 3b), the proportion of chair/sofa-sitting was larger for High-rise in the hotter regions. As for AC usage patterns (Figure 3a), the proportion of chair/sofa-sitting increased along with monthly household income. There was a higher correlation between AC usage and chair-sitting posture with income levels. In High-rise buildings of the cooler region, floor-sitting was also the majority, and this tendency was different from the hotter regions. In Low-rise, floor-sitting was the main posture for both climatic regions. Considering thermal adaptations (Figure 3a), respondents in Low-rise in the hotter regions primarily used fans for cooling while sitting on the floor. Similarly, respondents in the cooler region mainly relied on opening windows and sitting on the floor. This indicates that the combination of airflow (fan and natural ventilation through opening windows) and floor-sitting is necessary for Low-rise residents.

3.1.3. Floor-Sitting Preferences

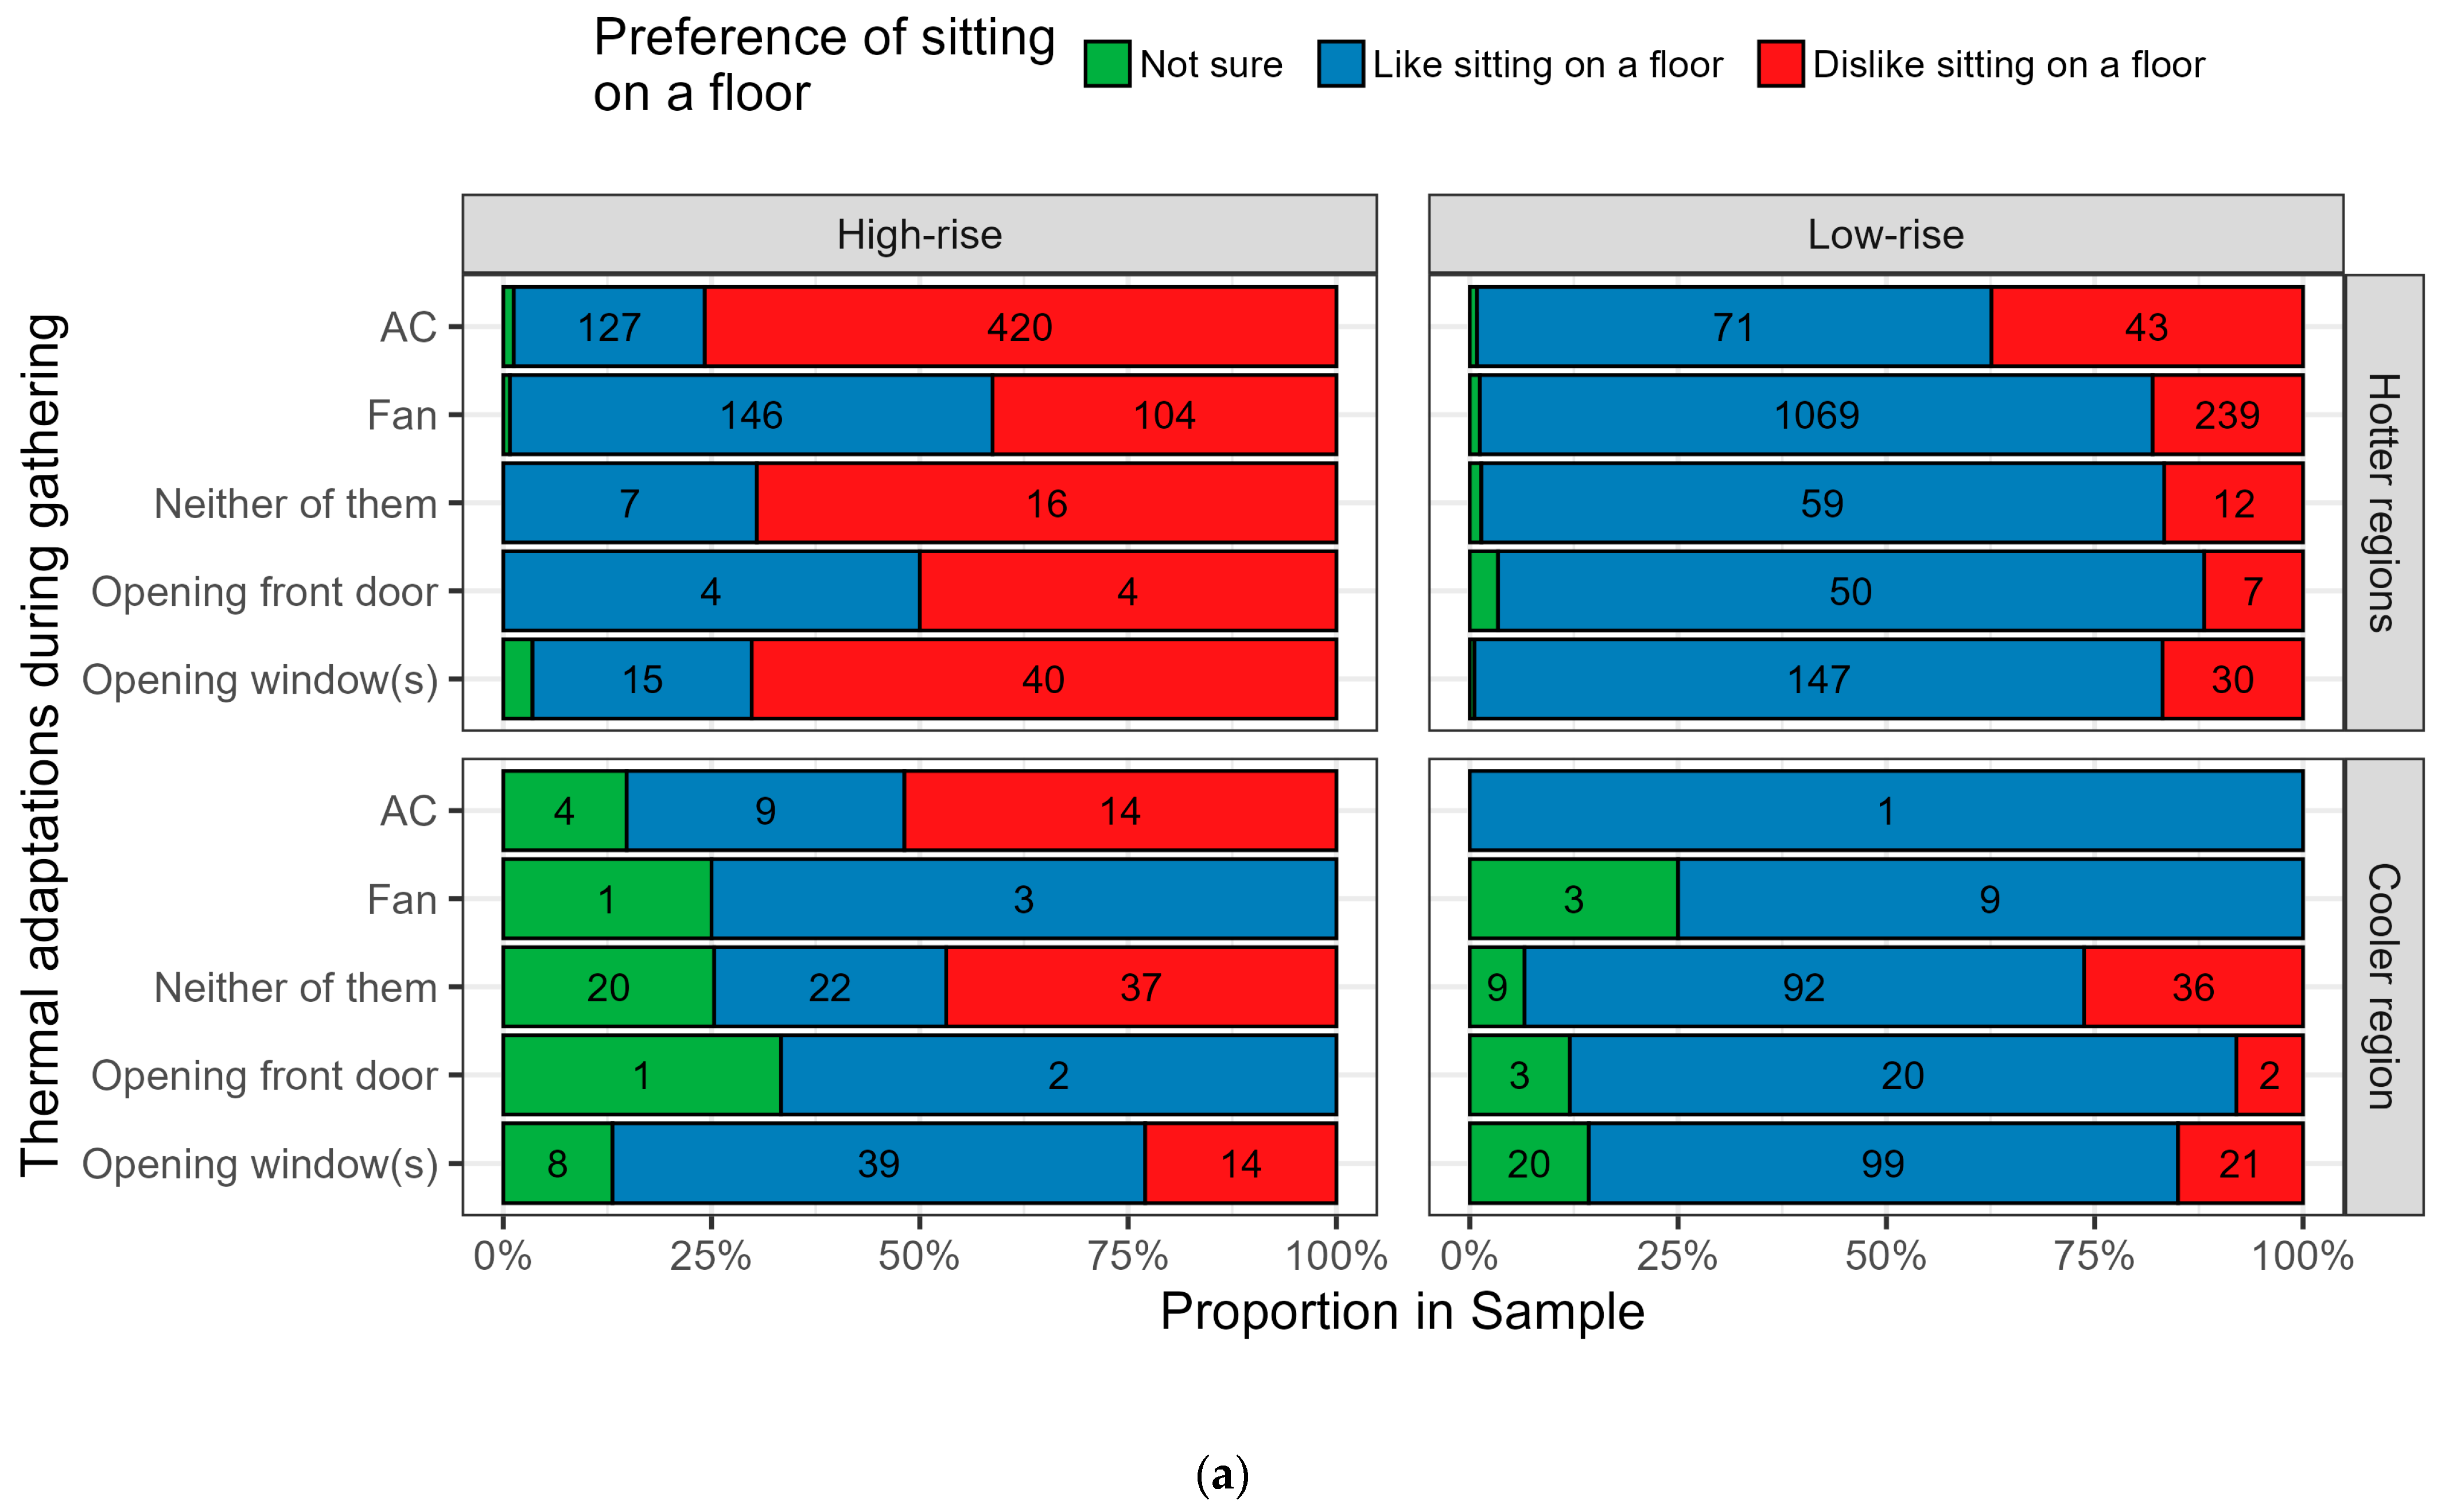
Figure 4a shows the proportion of preference for sitting on the floor based on thermal adaptation methods. “Like sitting on a floor” was mainly dominant in Low-rise for both climatic regions. In High-rise in the hotter regions, “Dislike sitting on a floor” was the majority. This corresponds to the actual postures where chair/sofa-sitting was obvious, as shown in Figure 3b. However, respondents who selected “Fan” and “Opening front door” showed a higher proportion of “Like sitting on a floor”. In the High-rise in the cooler region, “Not sure” was also obvious.
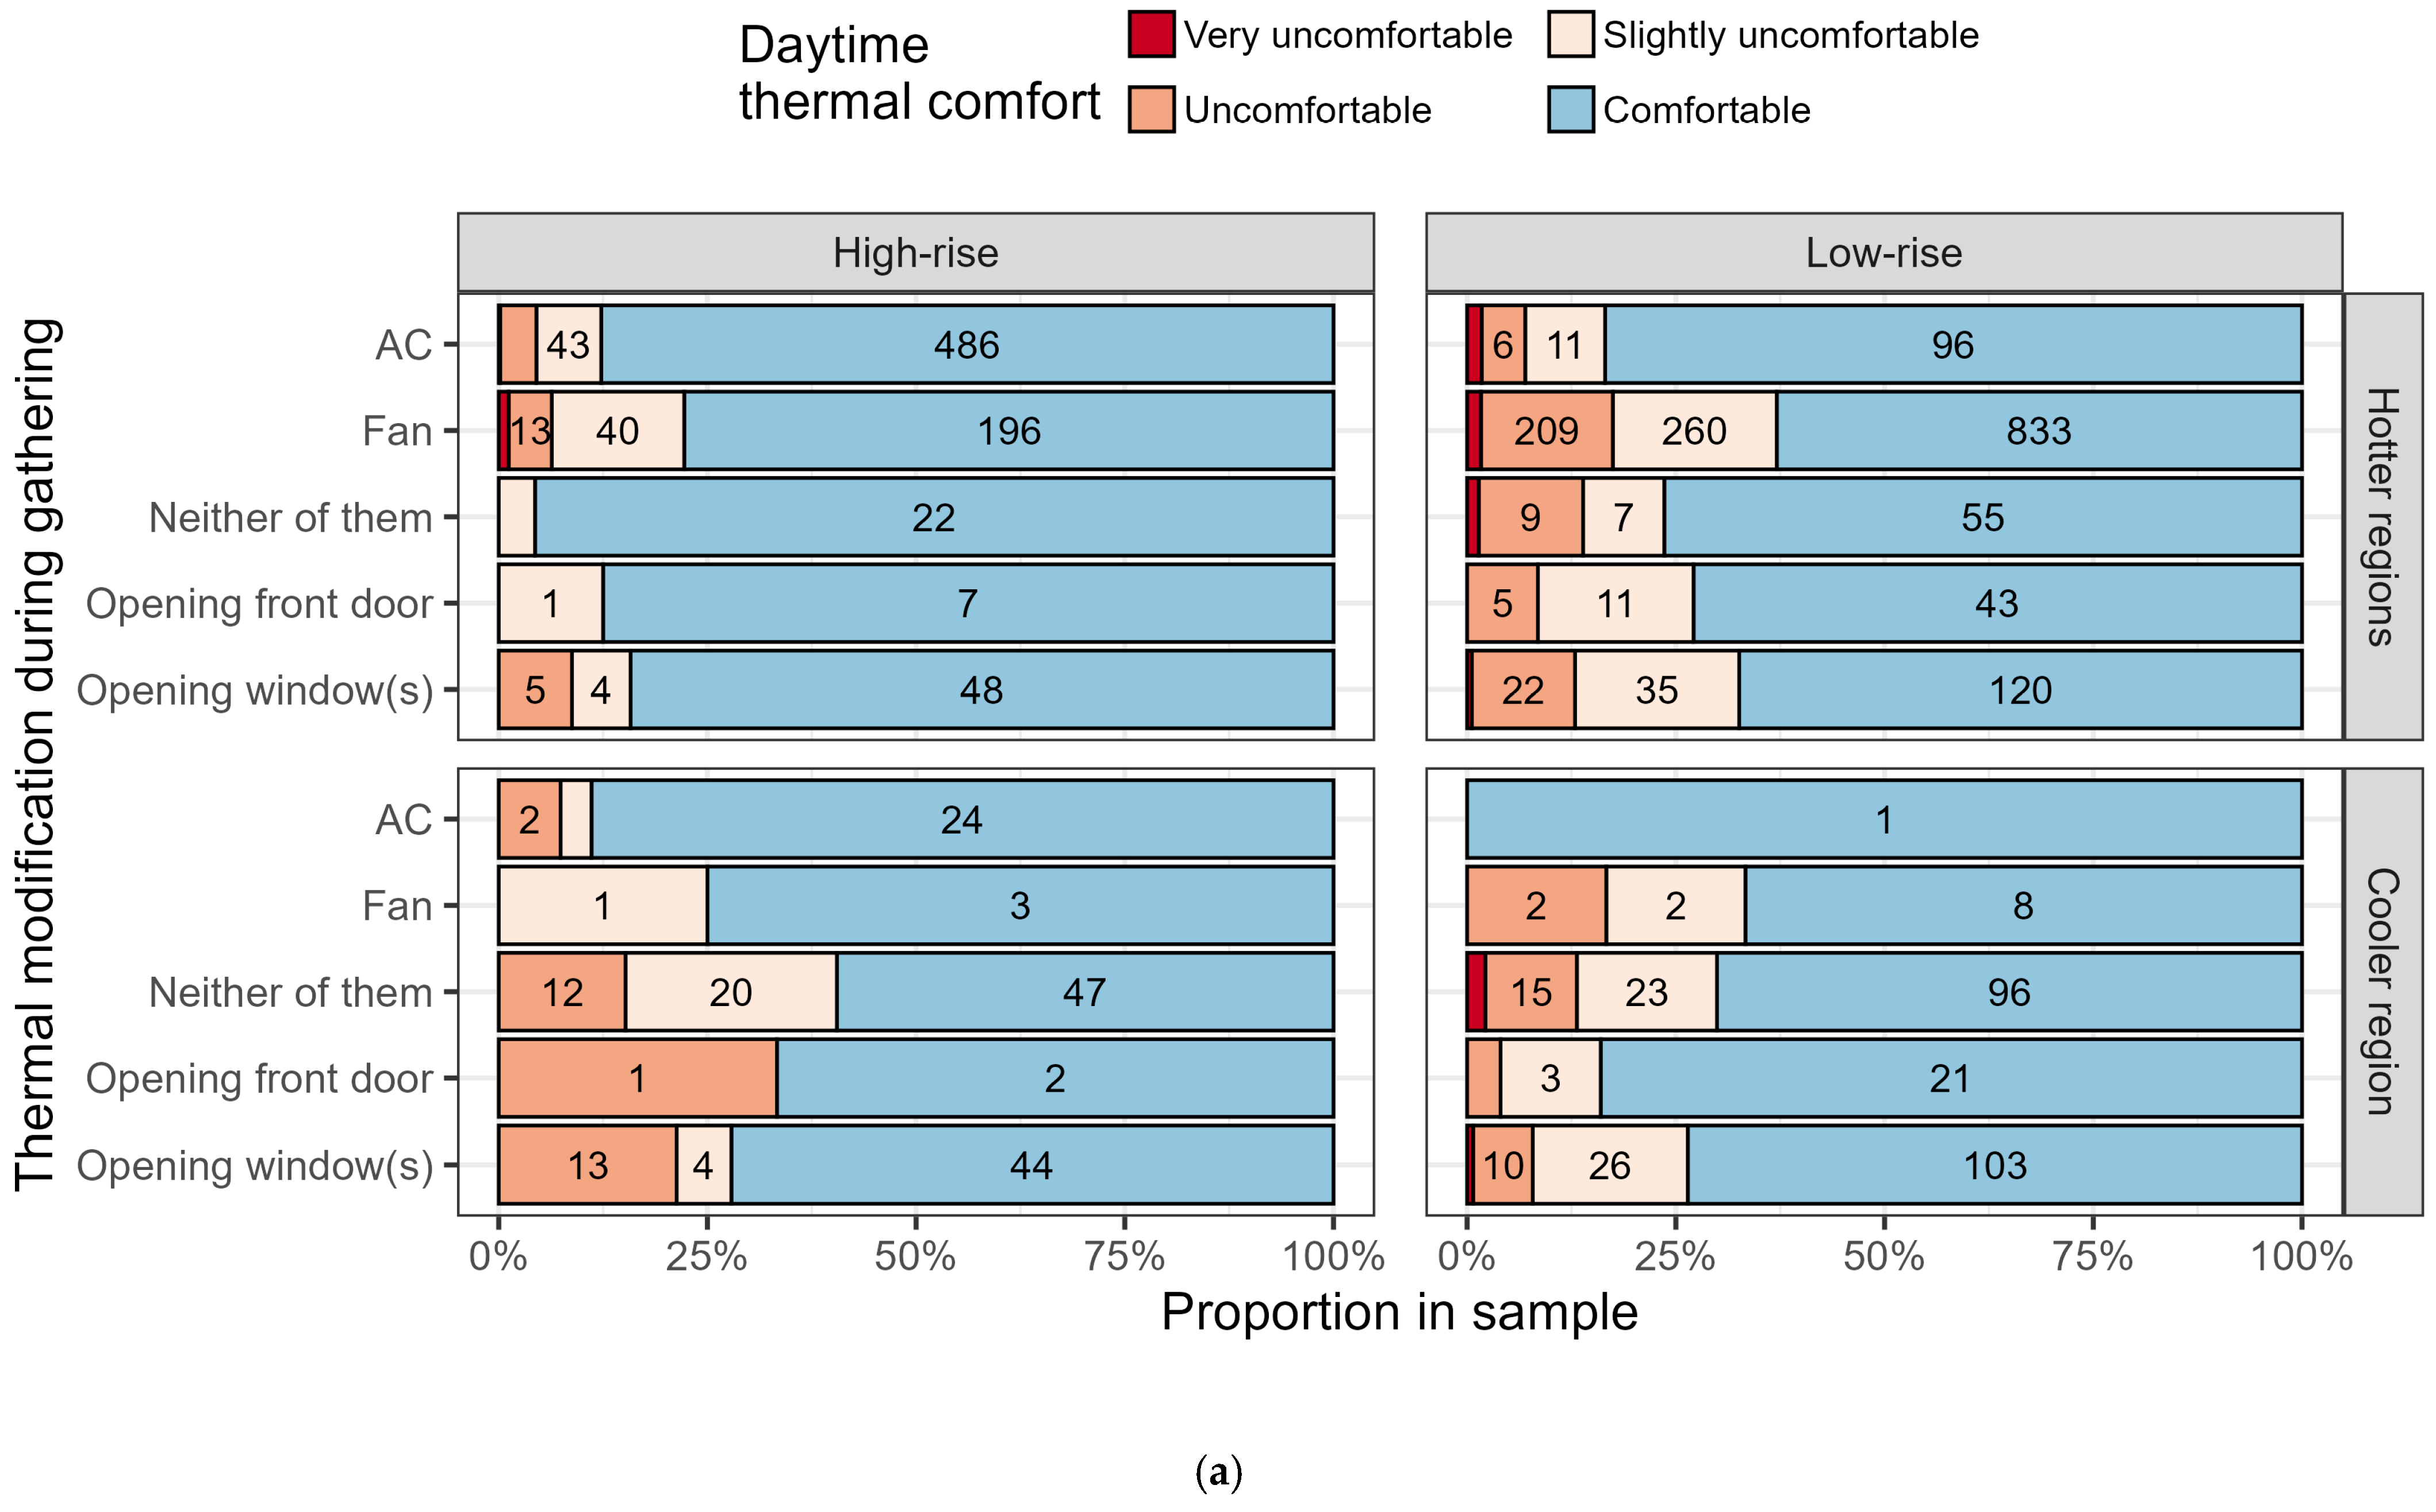
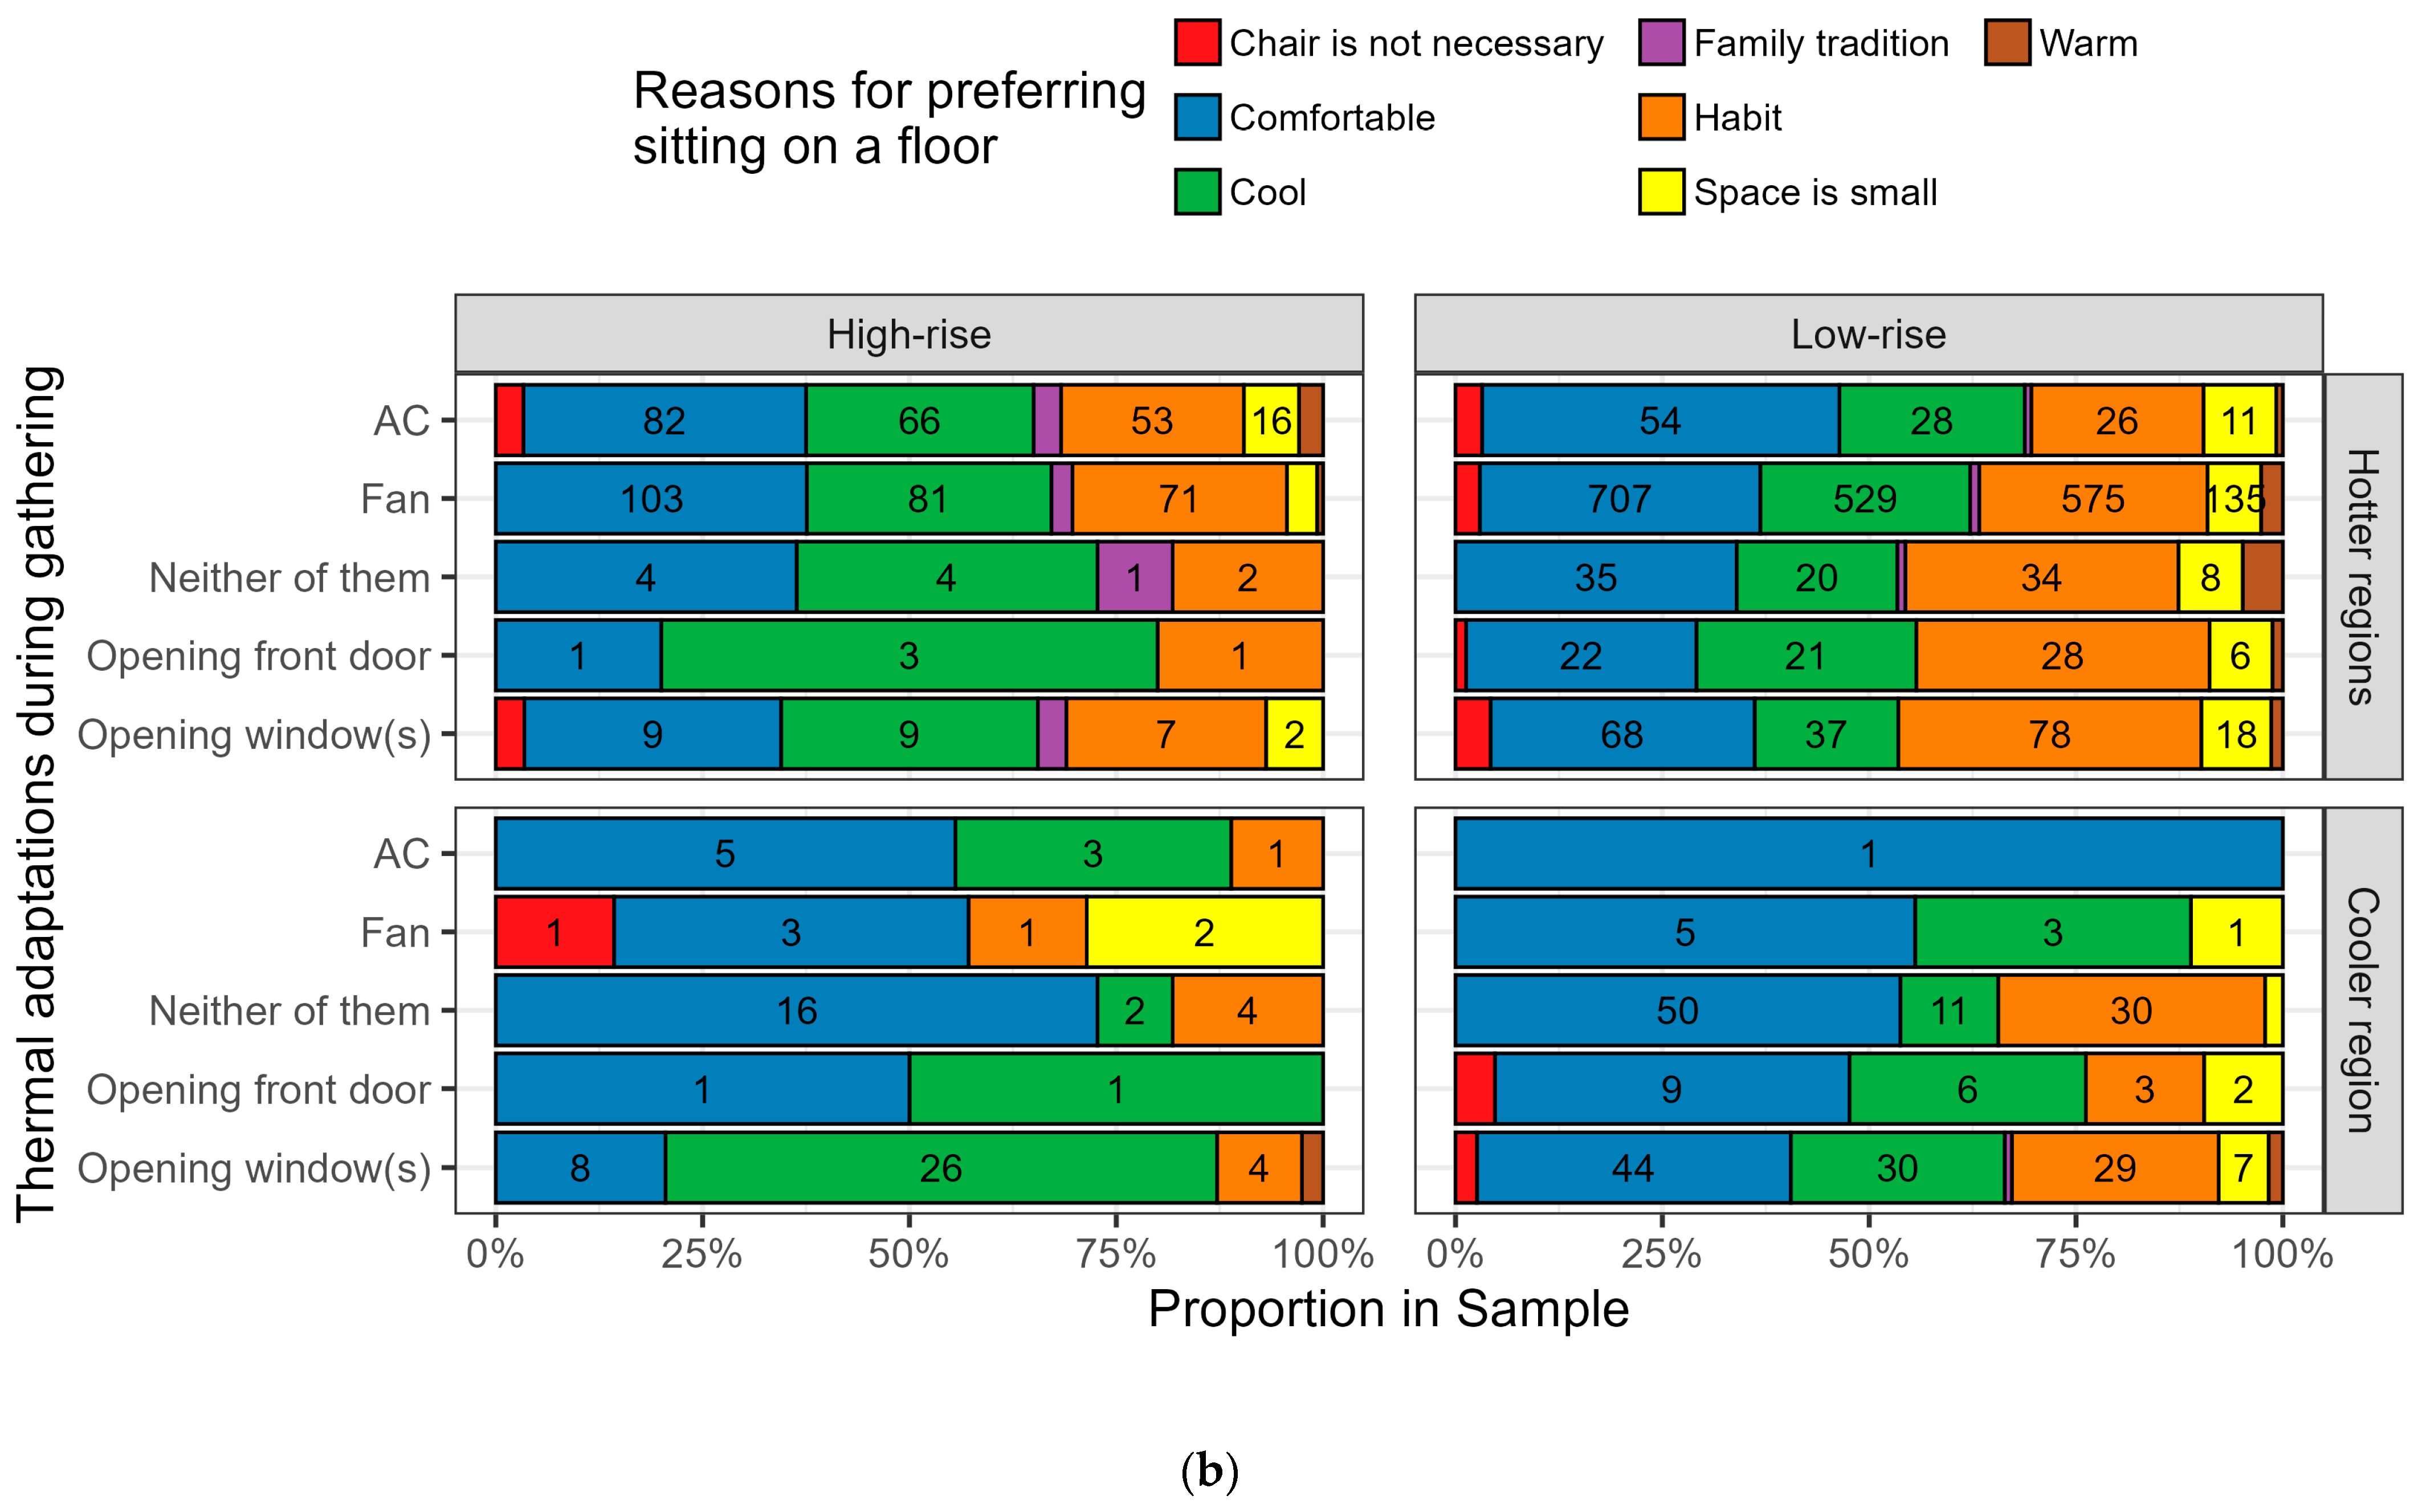
Figure 4b shows the proportion of reasons for preferring sitting on a floor based on thermal adaptation methods. “Habit,” “Cool,” and “Comfortable” were major reasons for floor-sitting in both regions. In particular, the proportion of “Habit” was larger in Low-rise, and that of “Cool” was larger in High-rise. This shows that residents sat on the floor to enhance coolness even in High-rise in the hotter regions. “Comfortable” appeared in both High-rise and Low-rise. No clear differences in the reported reasons were observed between thermal adaptation methods. However, the proportion of “Cool” was largely shown in the High-rise in the cooler region under window-opening conditions. This indicates that thermal relief could be obtained through floor contact under window-opening conditions.

3.1.4. Thermal Sensation and Comfort

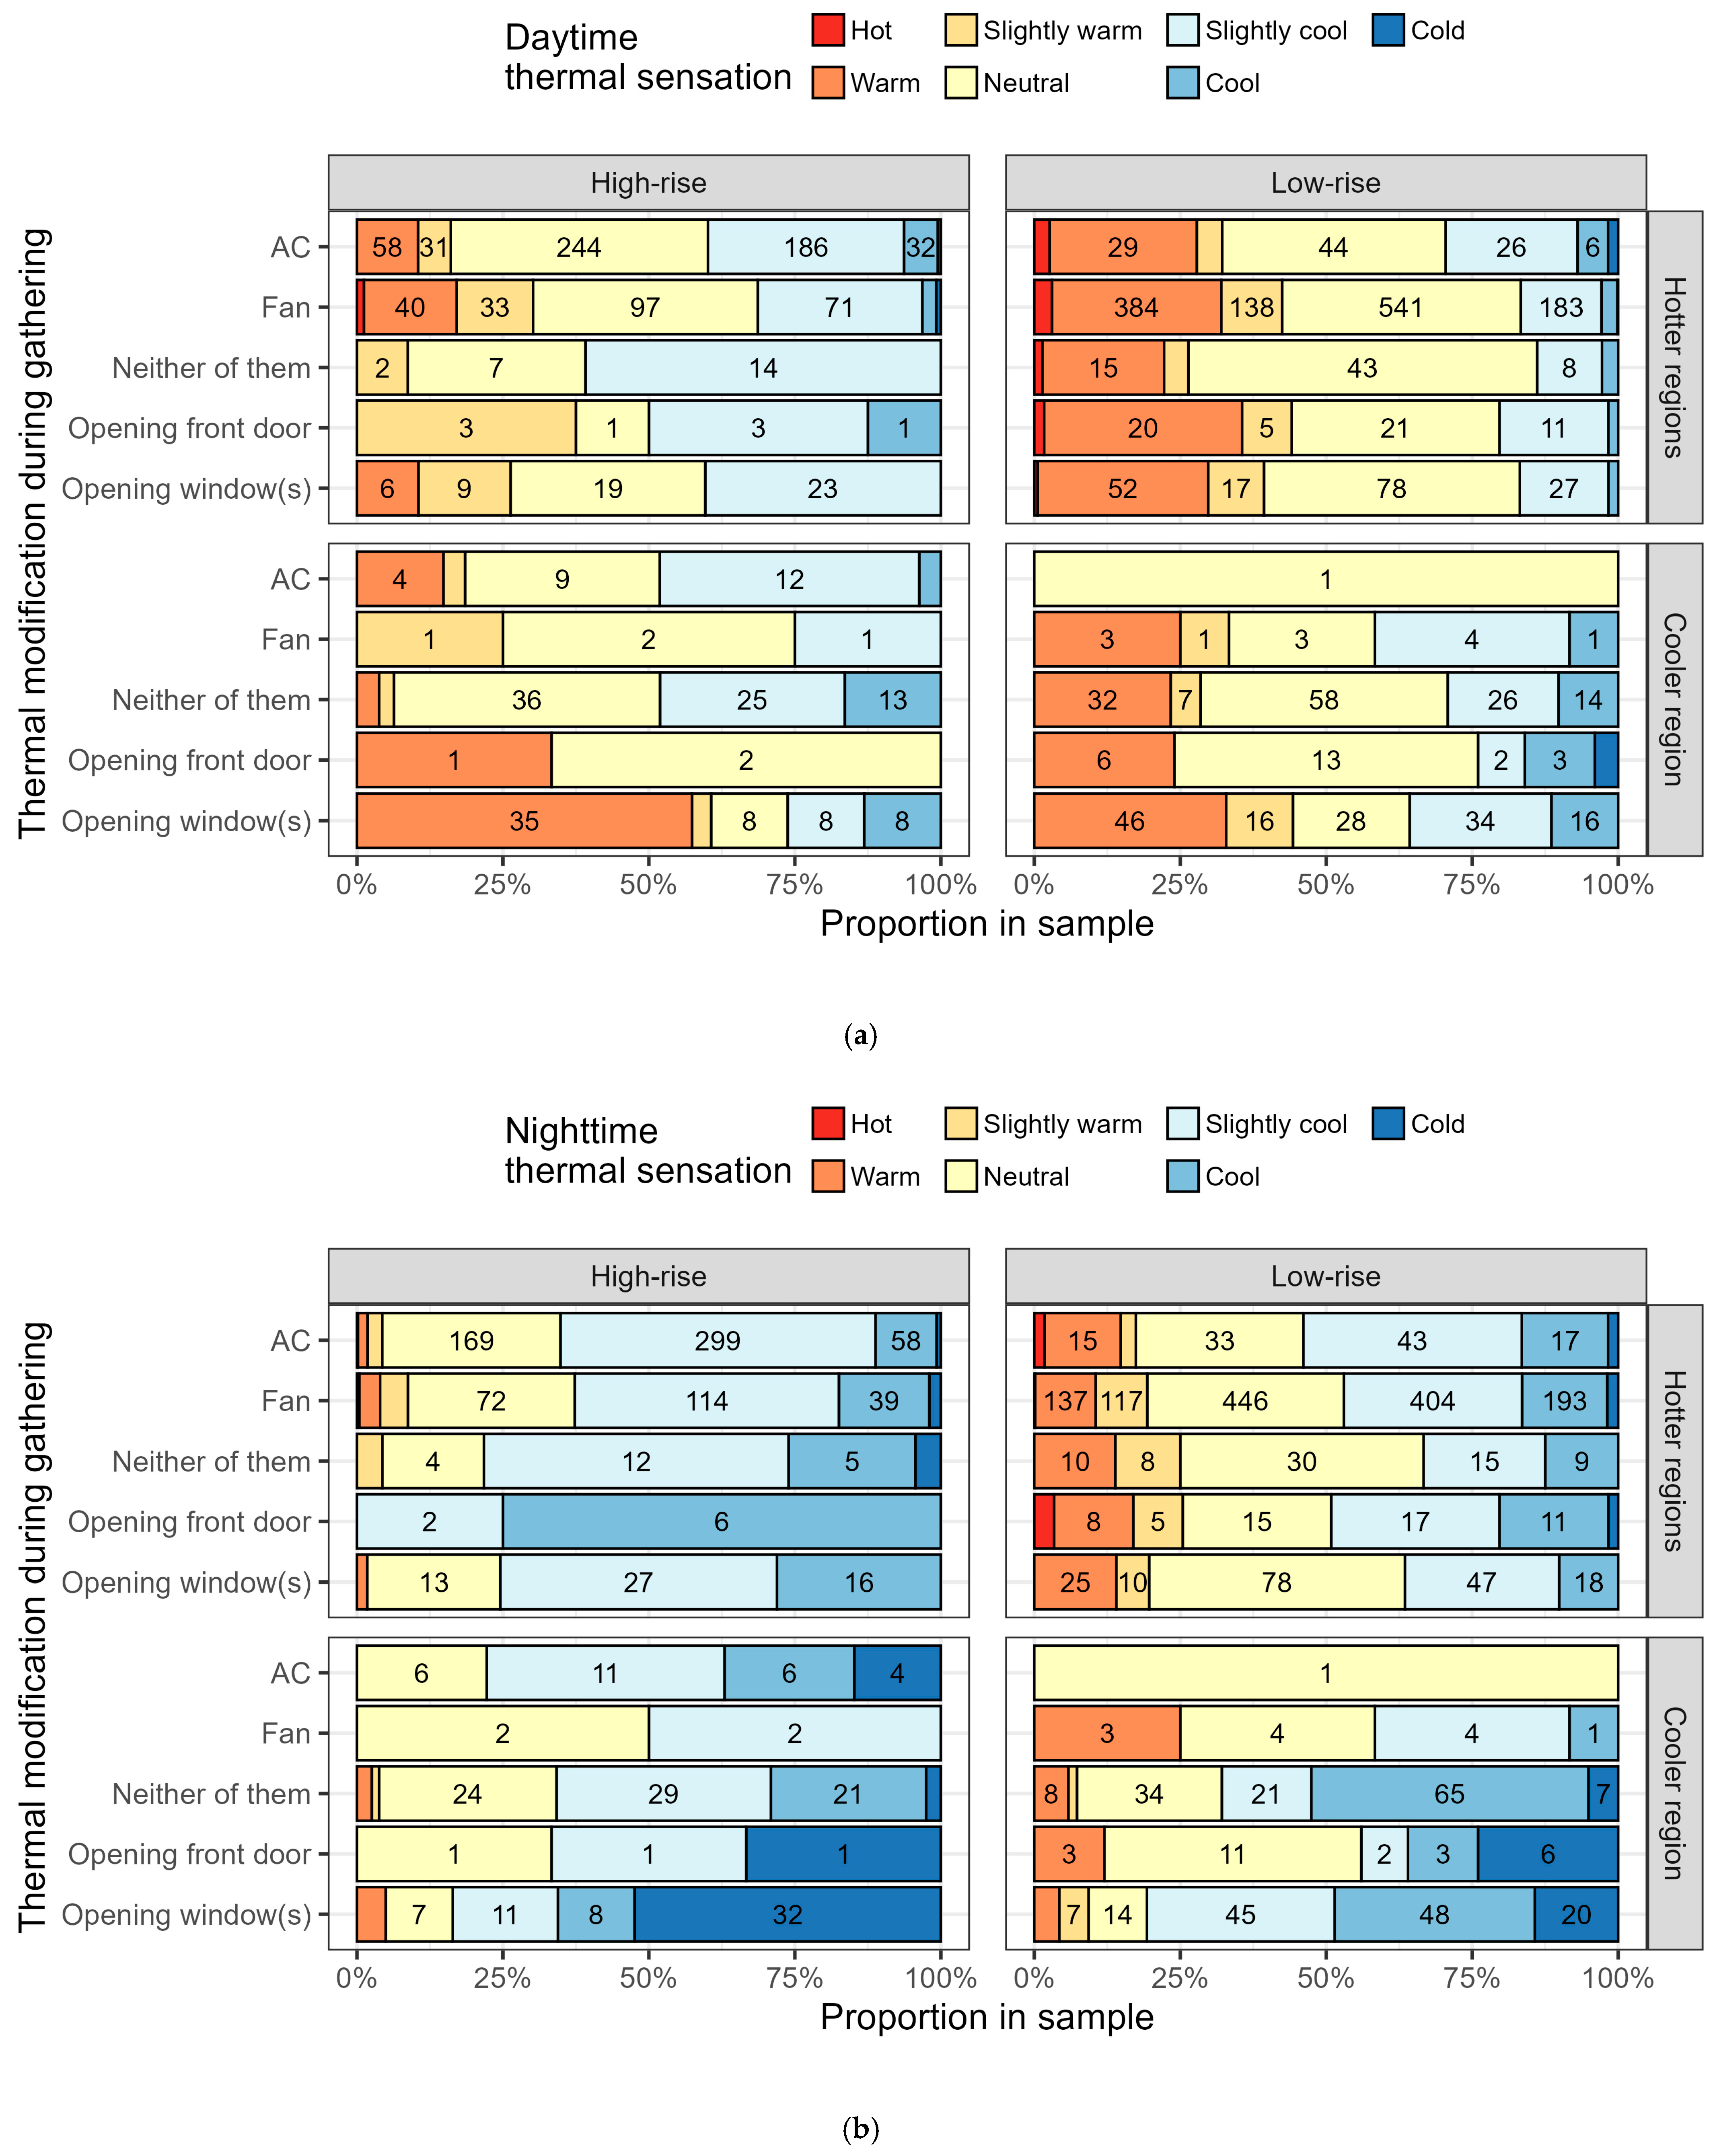
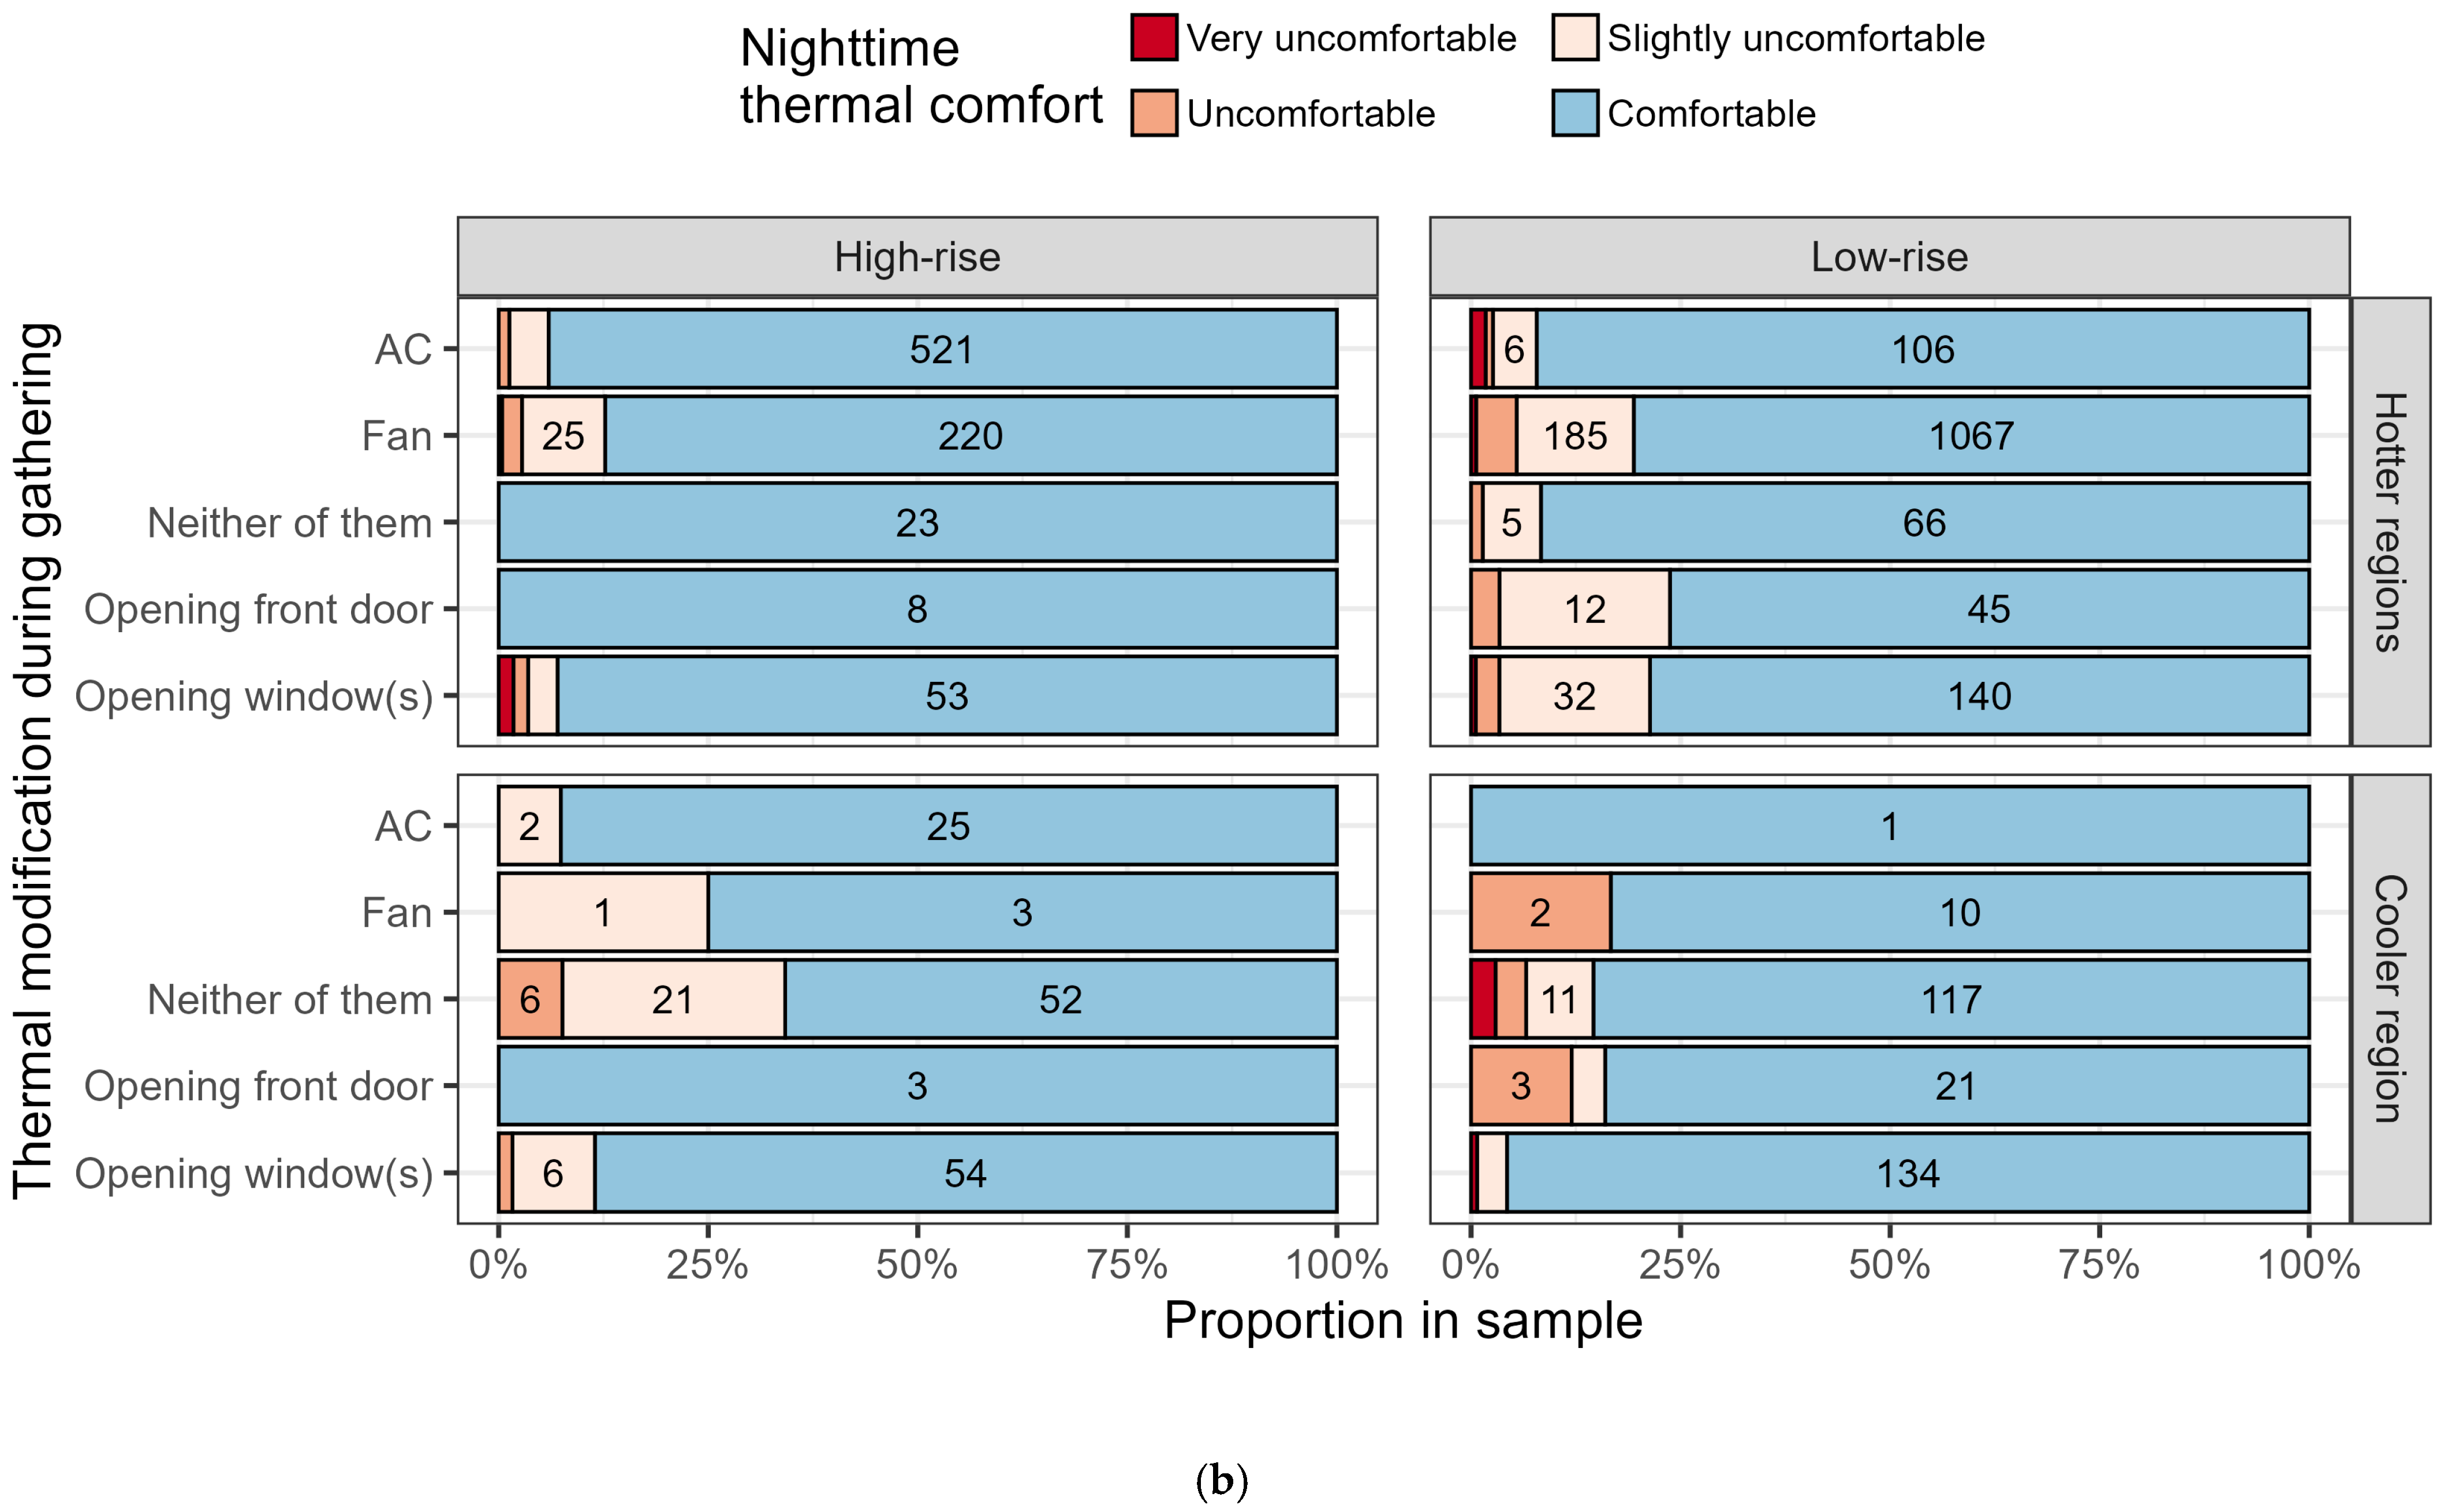
Figure 5 shows the proportion of thermal sensation and comfort with thermal adaptation methods during gathering activities. During daytime (Figure 5a), warm-side sensations mainly appeared in the Low-rise in both the hotter and cooler regions. During nighttime (Figure 5b), cool-side sensations became a larger proportion compared to daytime. A clear difference was shown in the High-rise in the cooler region, where larger proportions of warm sensation occurred during daytime and cold sensation during nighttime for the “Opening window(s)/door” conditions. In the cooler region, window opening resulted in distinct indoor thermal conditions, being warm during daytime and cold during nighttime. This is considered characteristic of the highland tropical climate with a large diurnal temperature range.
Figure 6 shows the proportion of thermal comfort with thermal adaptation methods during gathering activities. During daytime (Figure 6a) in the hotter region, a comfortable sensation was the majority for both High-rise and Low-rise. The proportion of comfortable sensation was slightly larger in High-rise than in Low-rise. This tendency corresponds to the thermal sensation results, with a relatively higher proportion of warm-side sensation in Low-rise. In the High-rise buildings of the cooler region, uncomfortable-side sensations were slightly larger for “Opening window(s)/door.” This corresponds to the thermal sensation, where the warm sensation was higher for “Opening window(s).” It can also be mentioned that the residents who answered “Opening window(s)” for thermal adaptations showed a higher proportion of “Cool” as the reason for floor-sitting (Figure 4b). This indicates that residents could obtain contact cooling effects during floor-sitting postures while opening windows. During nighttime (Figure 6b), most answers were comfortable for both building types and climatic conditions.

3.1.5. Electricity Consumption Patterns

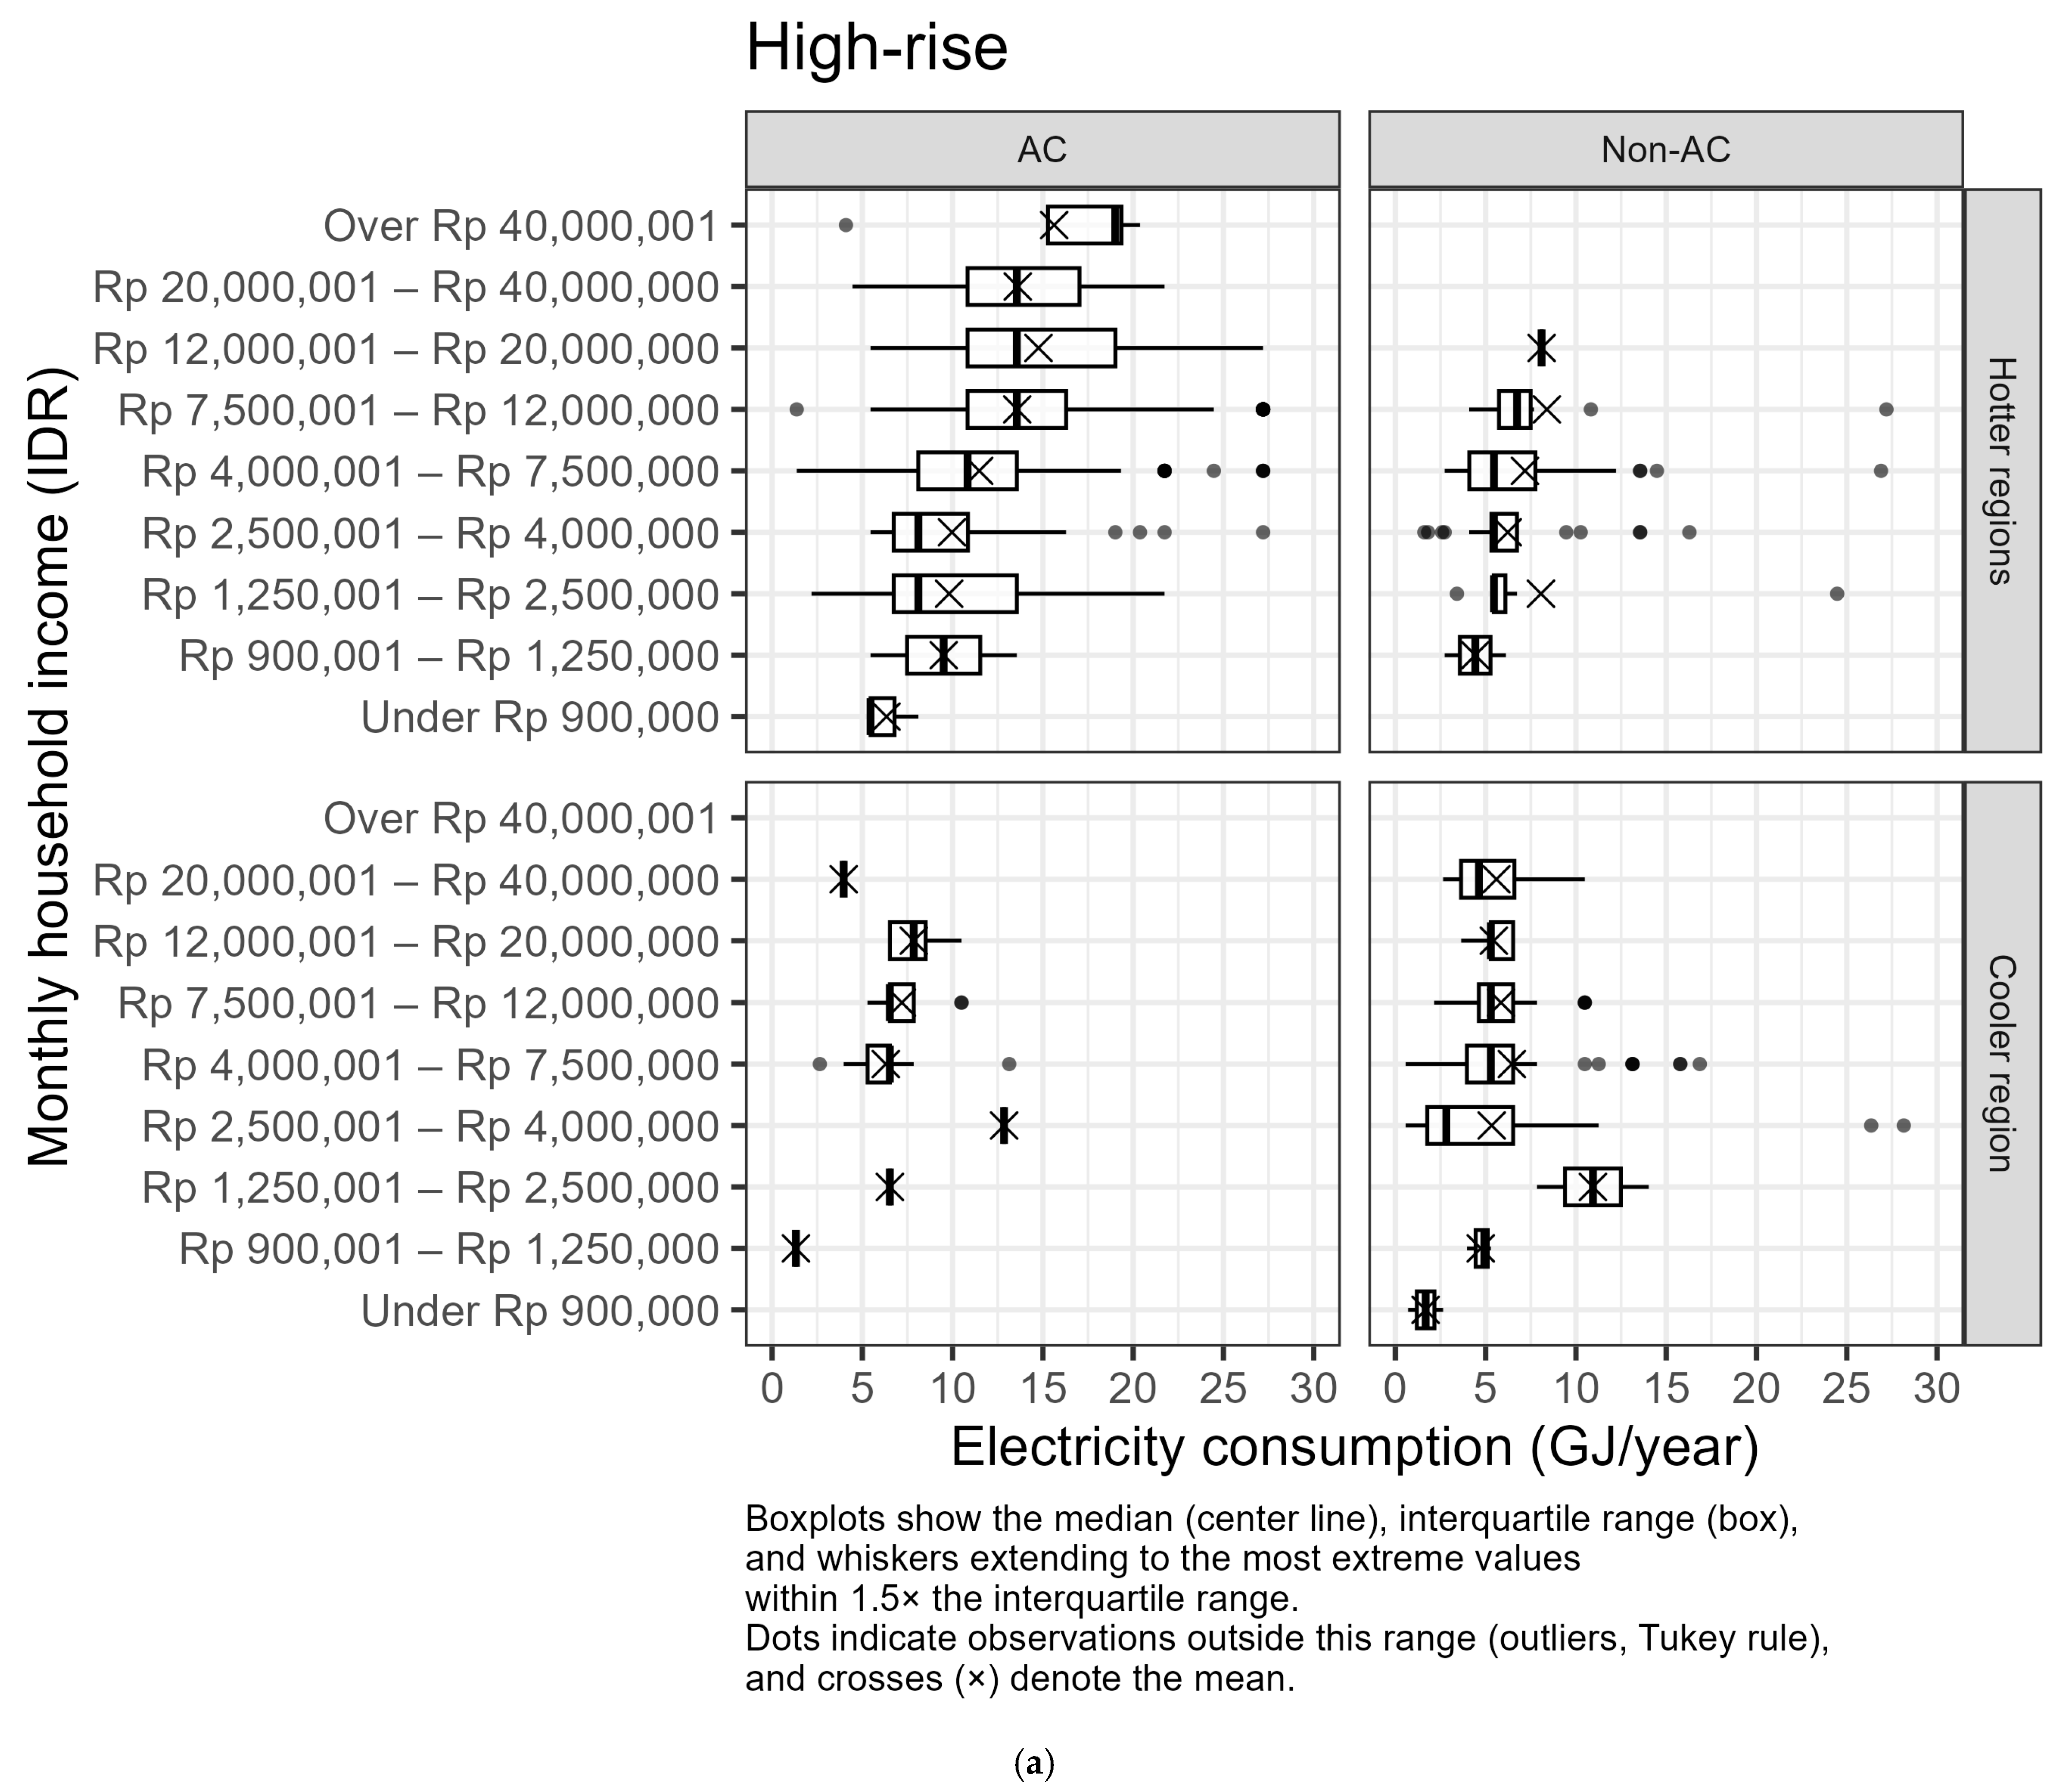
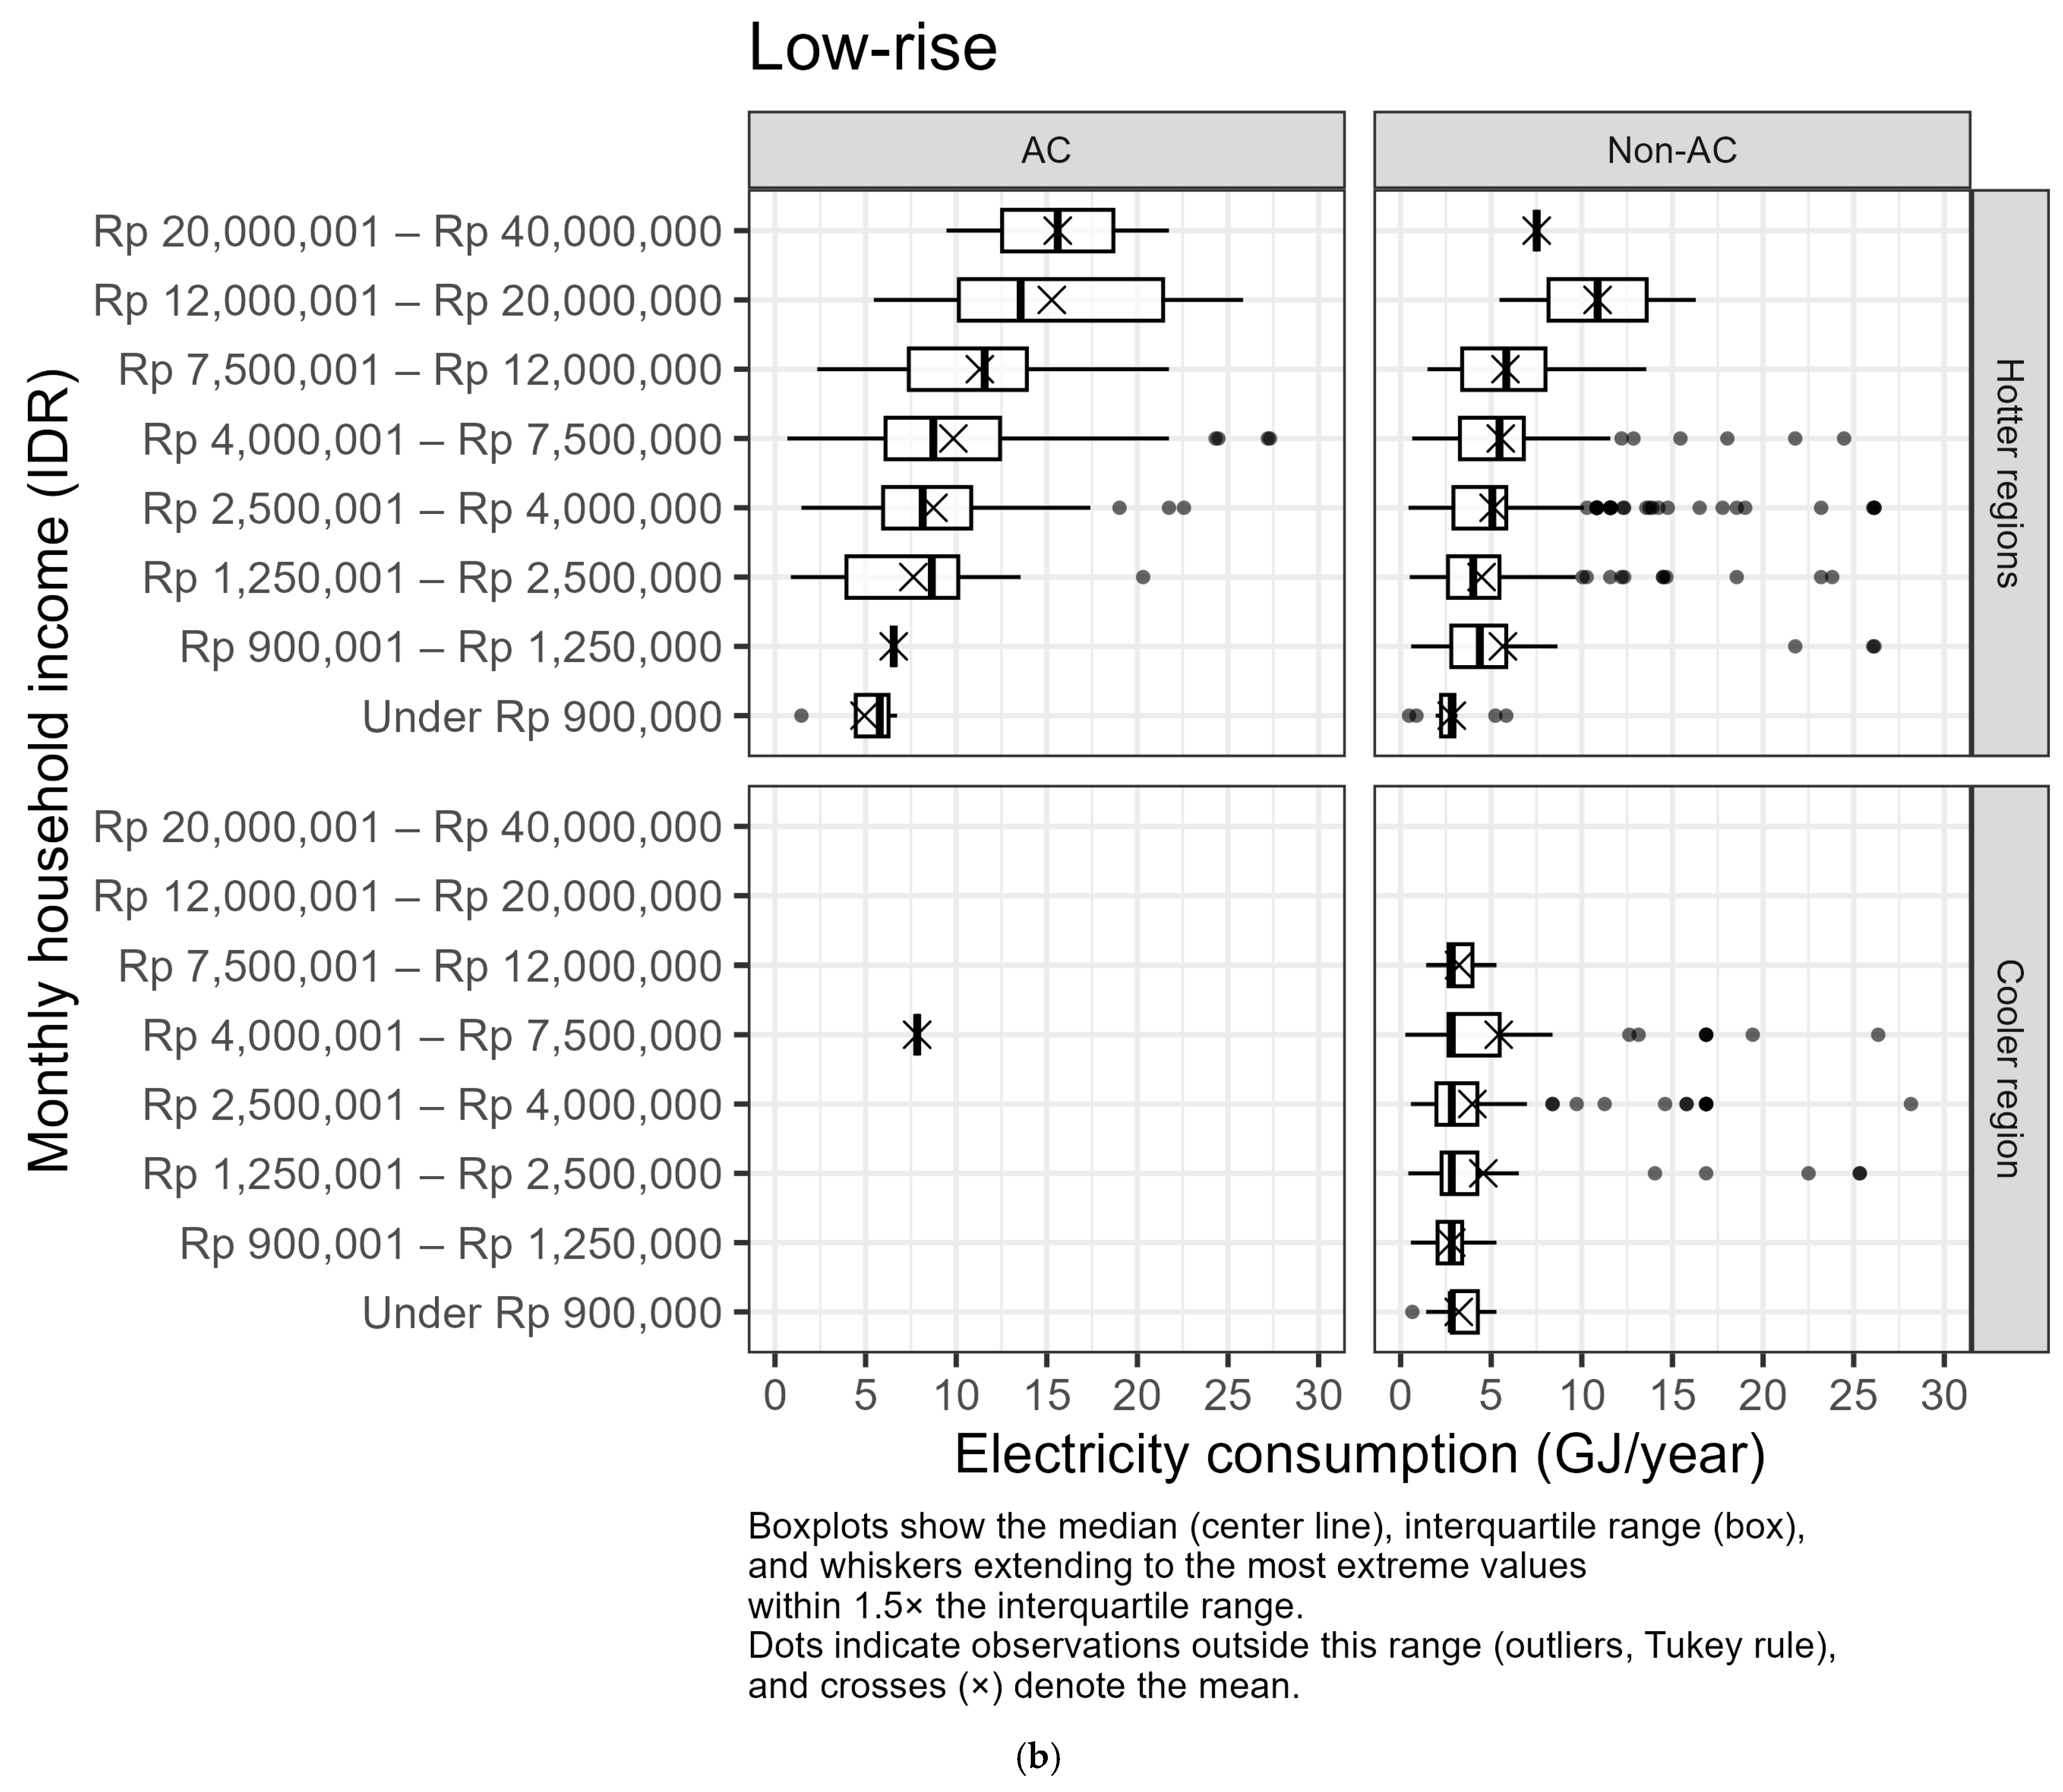
Figure 7 shows annual electricity consumption for the AC usage group and the Non-AC group, based on the monthly household income level. In the hotter regions, there were clear trends that electricity consumption increased with income level in the AC usage group for both High-rise and Low-rise groups. In contrast, the trend was not obvious for the Non-AC group. In the cooler region, even for the AC usage group, electricity consumption did not change with income levels. This result indicates that AC usage was a dominant factor in electricity consumption across income levels in the hotter regions. The results of the Non-AC group support this finding, showing that income levels did not largely affect electricity consumption even in the hotter regions.

3.2. In-Depth Measurement Analysis of Indoor Climate and Adaptive Behaviors

3.2.1. Thermal Adaptation and Main Posture

This section focuses on indoor climatic factors and analyzes the relationship between building type, indoor climate, main posture, thermal adaptation, and thermal comfort using the in-depth measurement and point-in-time questionnaire data obtained in the apartments of Surabaya (i.e., High-rise (Non-AC), High-rise (AC), and Low-rise (Non-AC)).
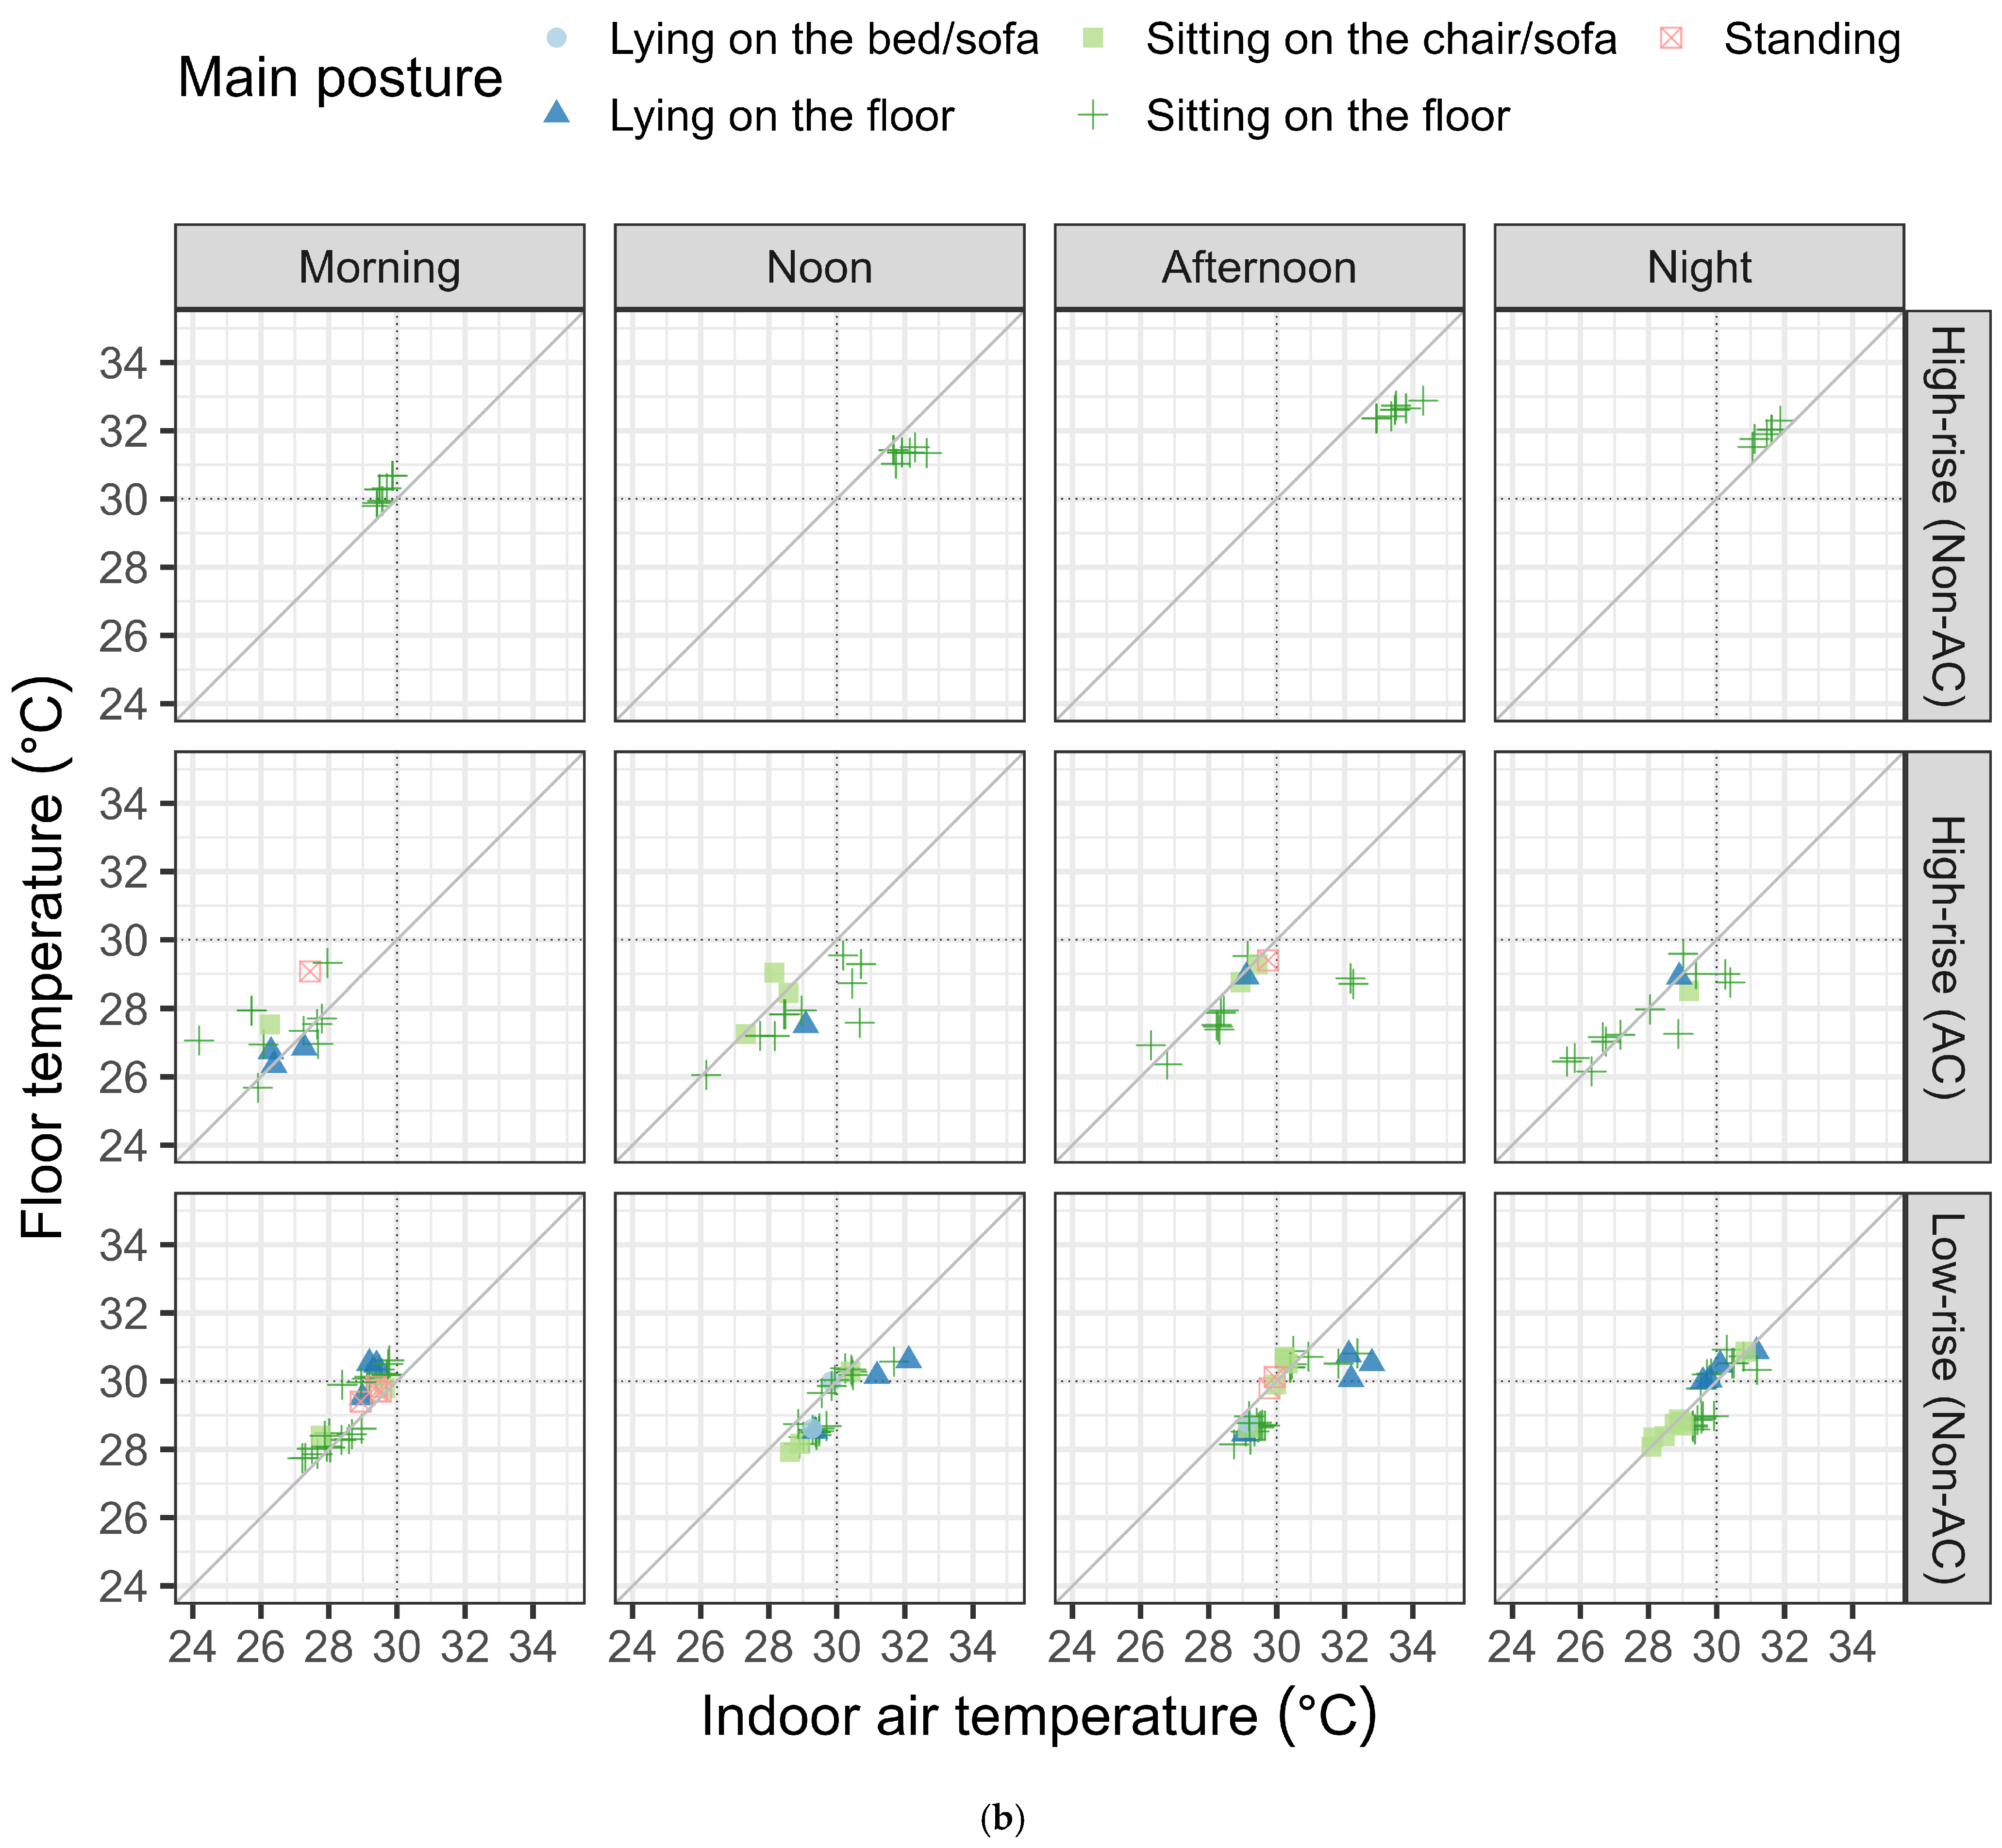
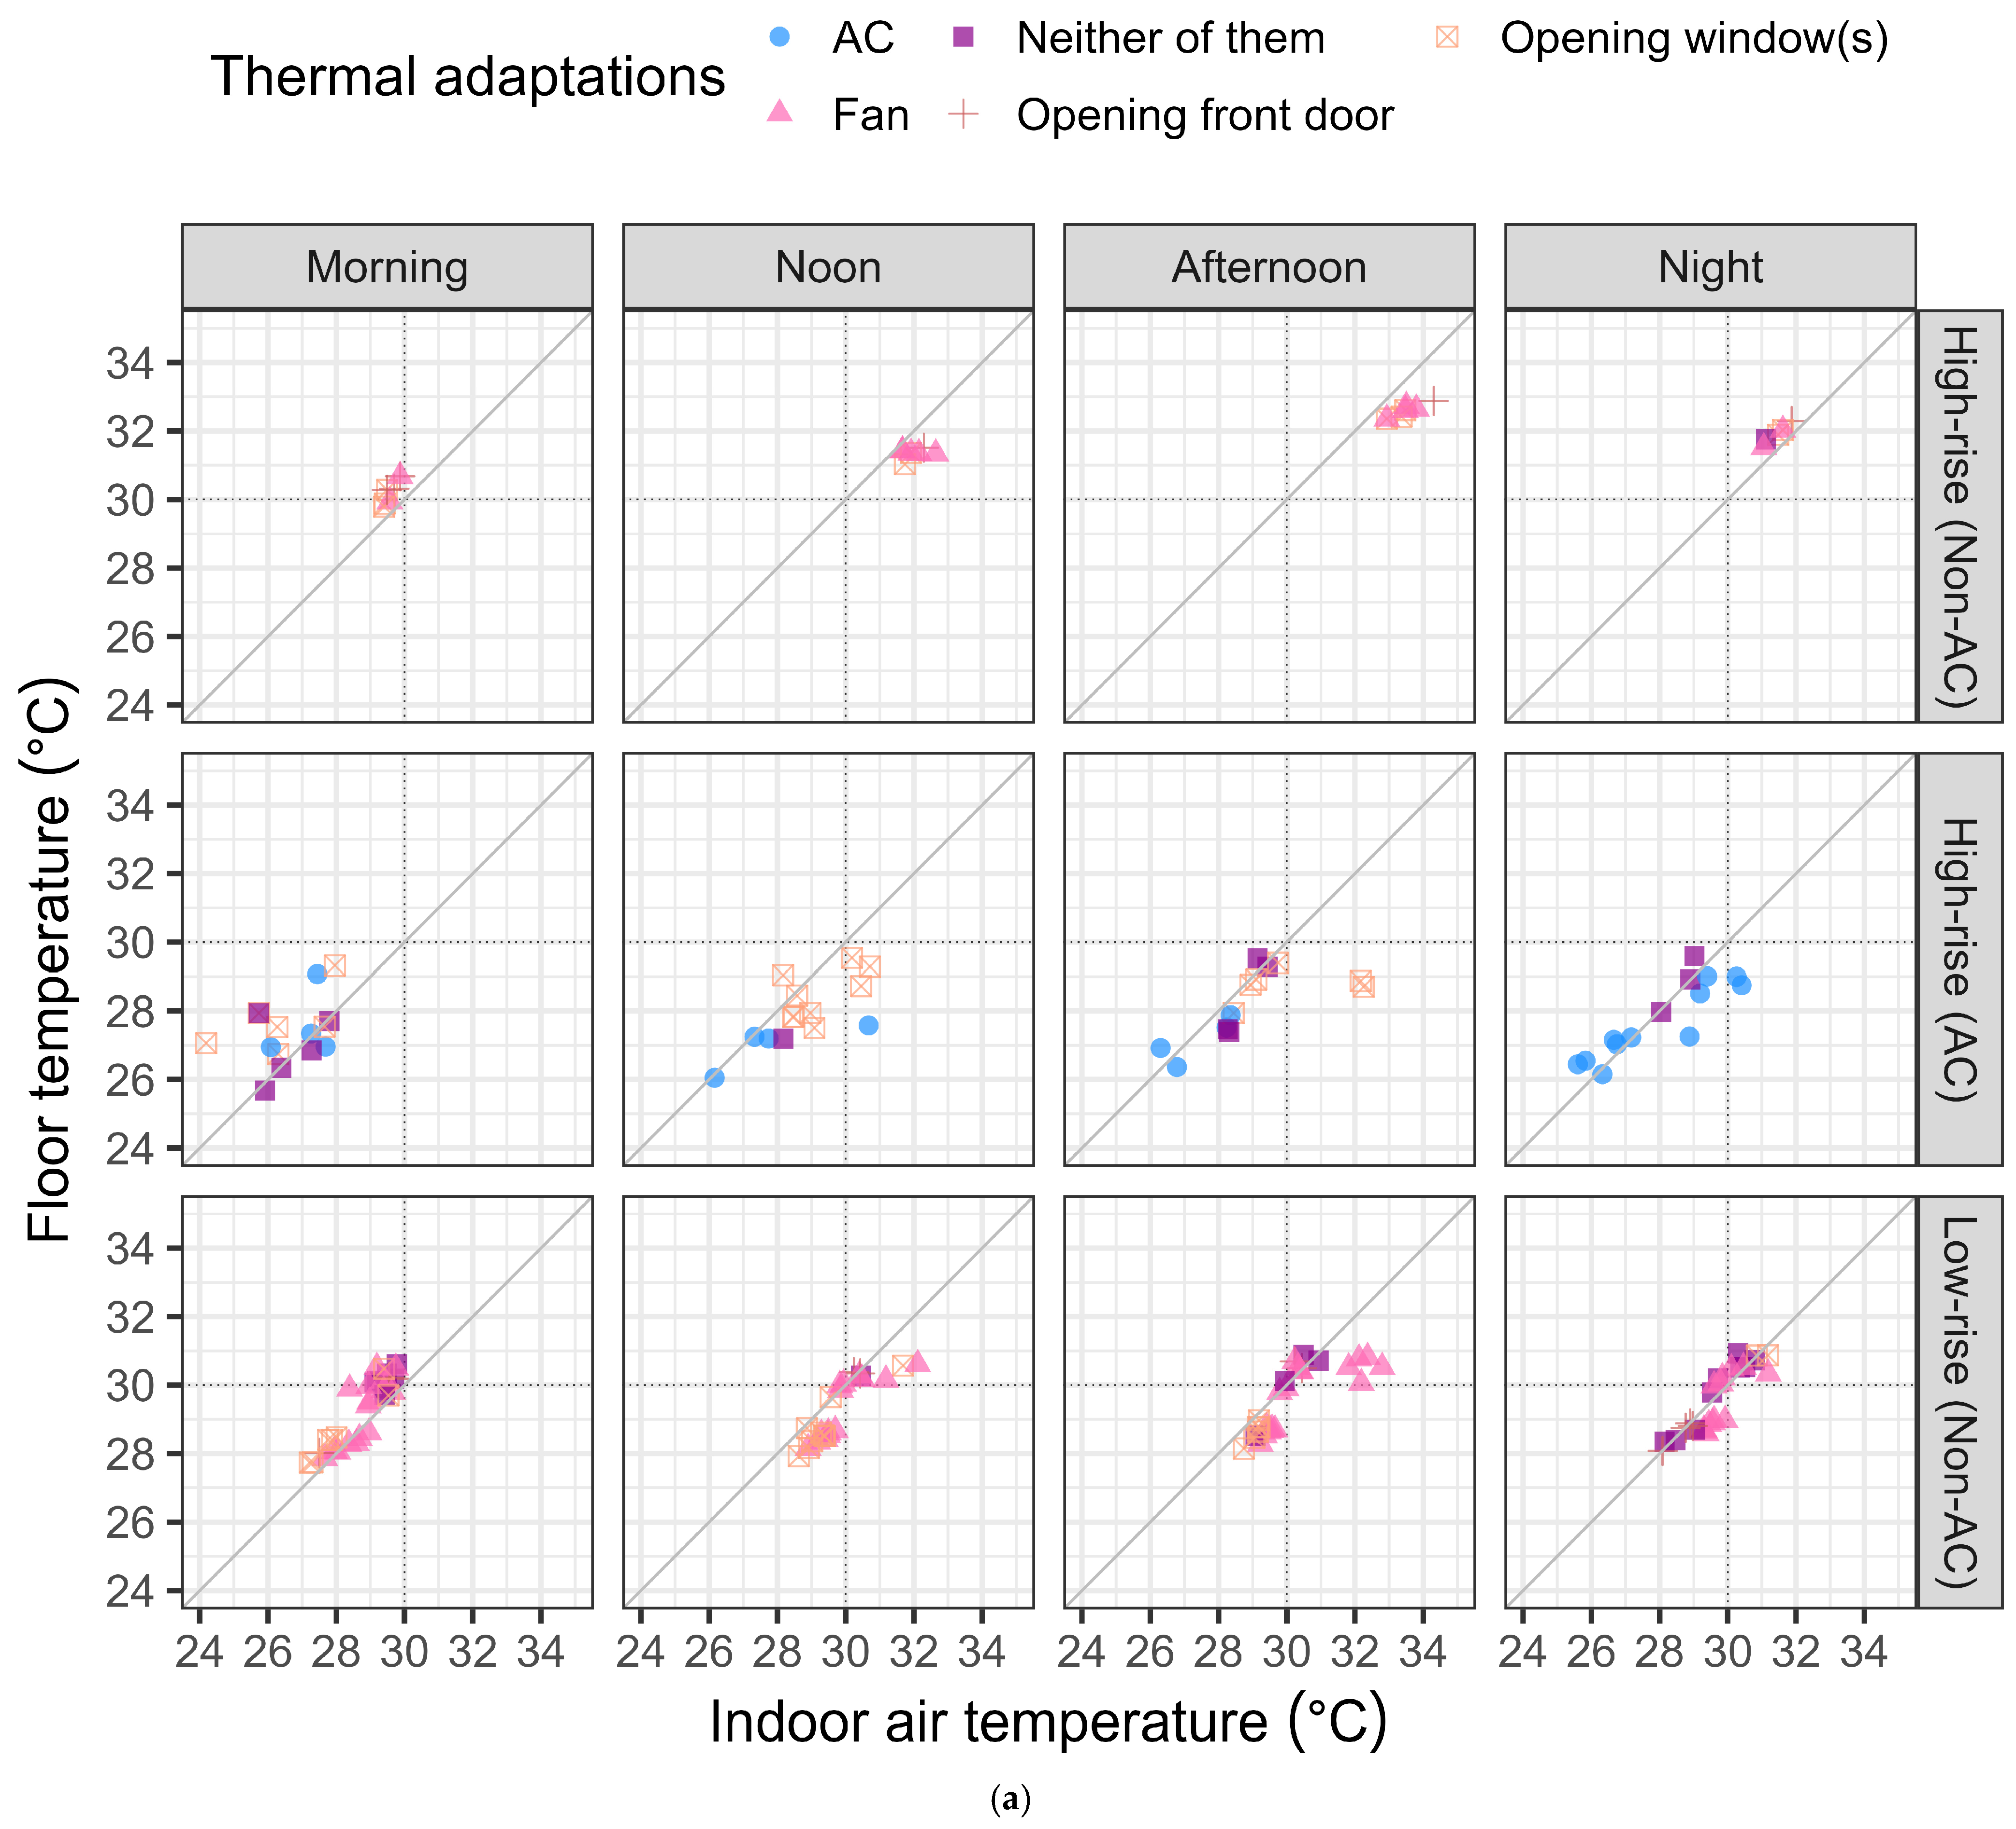
Figure 8a shows the relationship between thermal adaptation, indoor air temperature, and floor temperature across time periods and building types. The detailed characteristic data and time-series data of indoor air and floor temperatures are shown in Appendix E and Appendix F, respectively. In High-rise (Non-AC), fan usage was reported for all time periods. In High-rise (AC), opening window(s) were reported in addition to AC usage except for nighttime. In Low-rise (Non-AC), fan usage and opening window(s) were reported for all time periods. There are characteristic trends of indoor and floor temperatures among these building types. In High-rise (Non-AC), indoor and floor temperatures were both higher from noon until night. During the afternoon, these temperatures were both higher than 32 °C. In contrast, in High-rise (AC), air and floor temperatures were both lower for all time periods, mostly less than 30 °C, owing to AC usage. In Low-rise (Non-AC), air and floor temperatures were within the ranges between High-rise (Non-AC) and High-rise (AC), showing intermediate characteristics in these temperature conditions. In particular, the floor temperature was more stable than the air temperature.
Figure 8b shows the results of the main posture during the gathering activities with the same format. For all time periods and building types, “Sitting on a floor” was the main posture. “Sitting on chair/sofa” and “Lying on the floor” were also reported in High-rise (AC) and Low-rise (Non-AC). Floor-sitting posture was reported regardless of thermal adaptation methods and building types in the obtained samples. Floor covers were not used in High-rise (Non-AC) and Low-rise (Non-AC), while in High-rise (AC), one respondent utilized a carpet during floor-sitting (see Table 5). Footwear was not used, and all respondents were barefoot in their units.

3.2.2. Thermal Sensation and Comfort

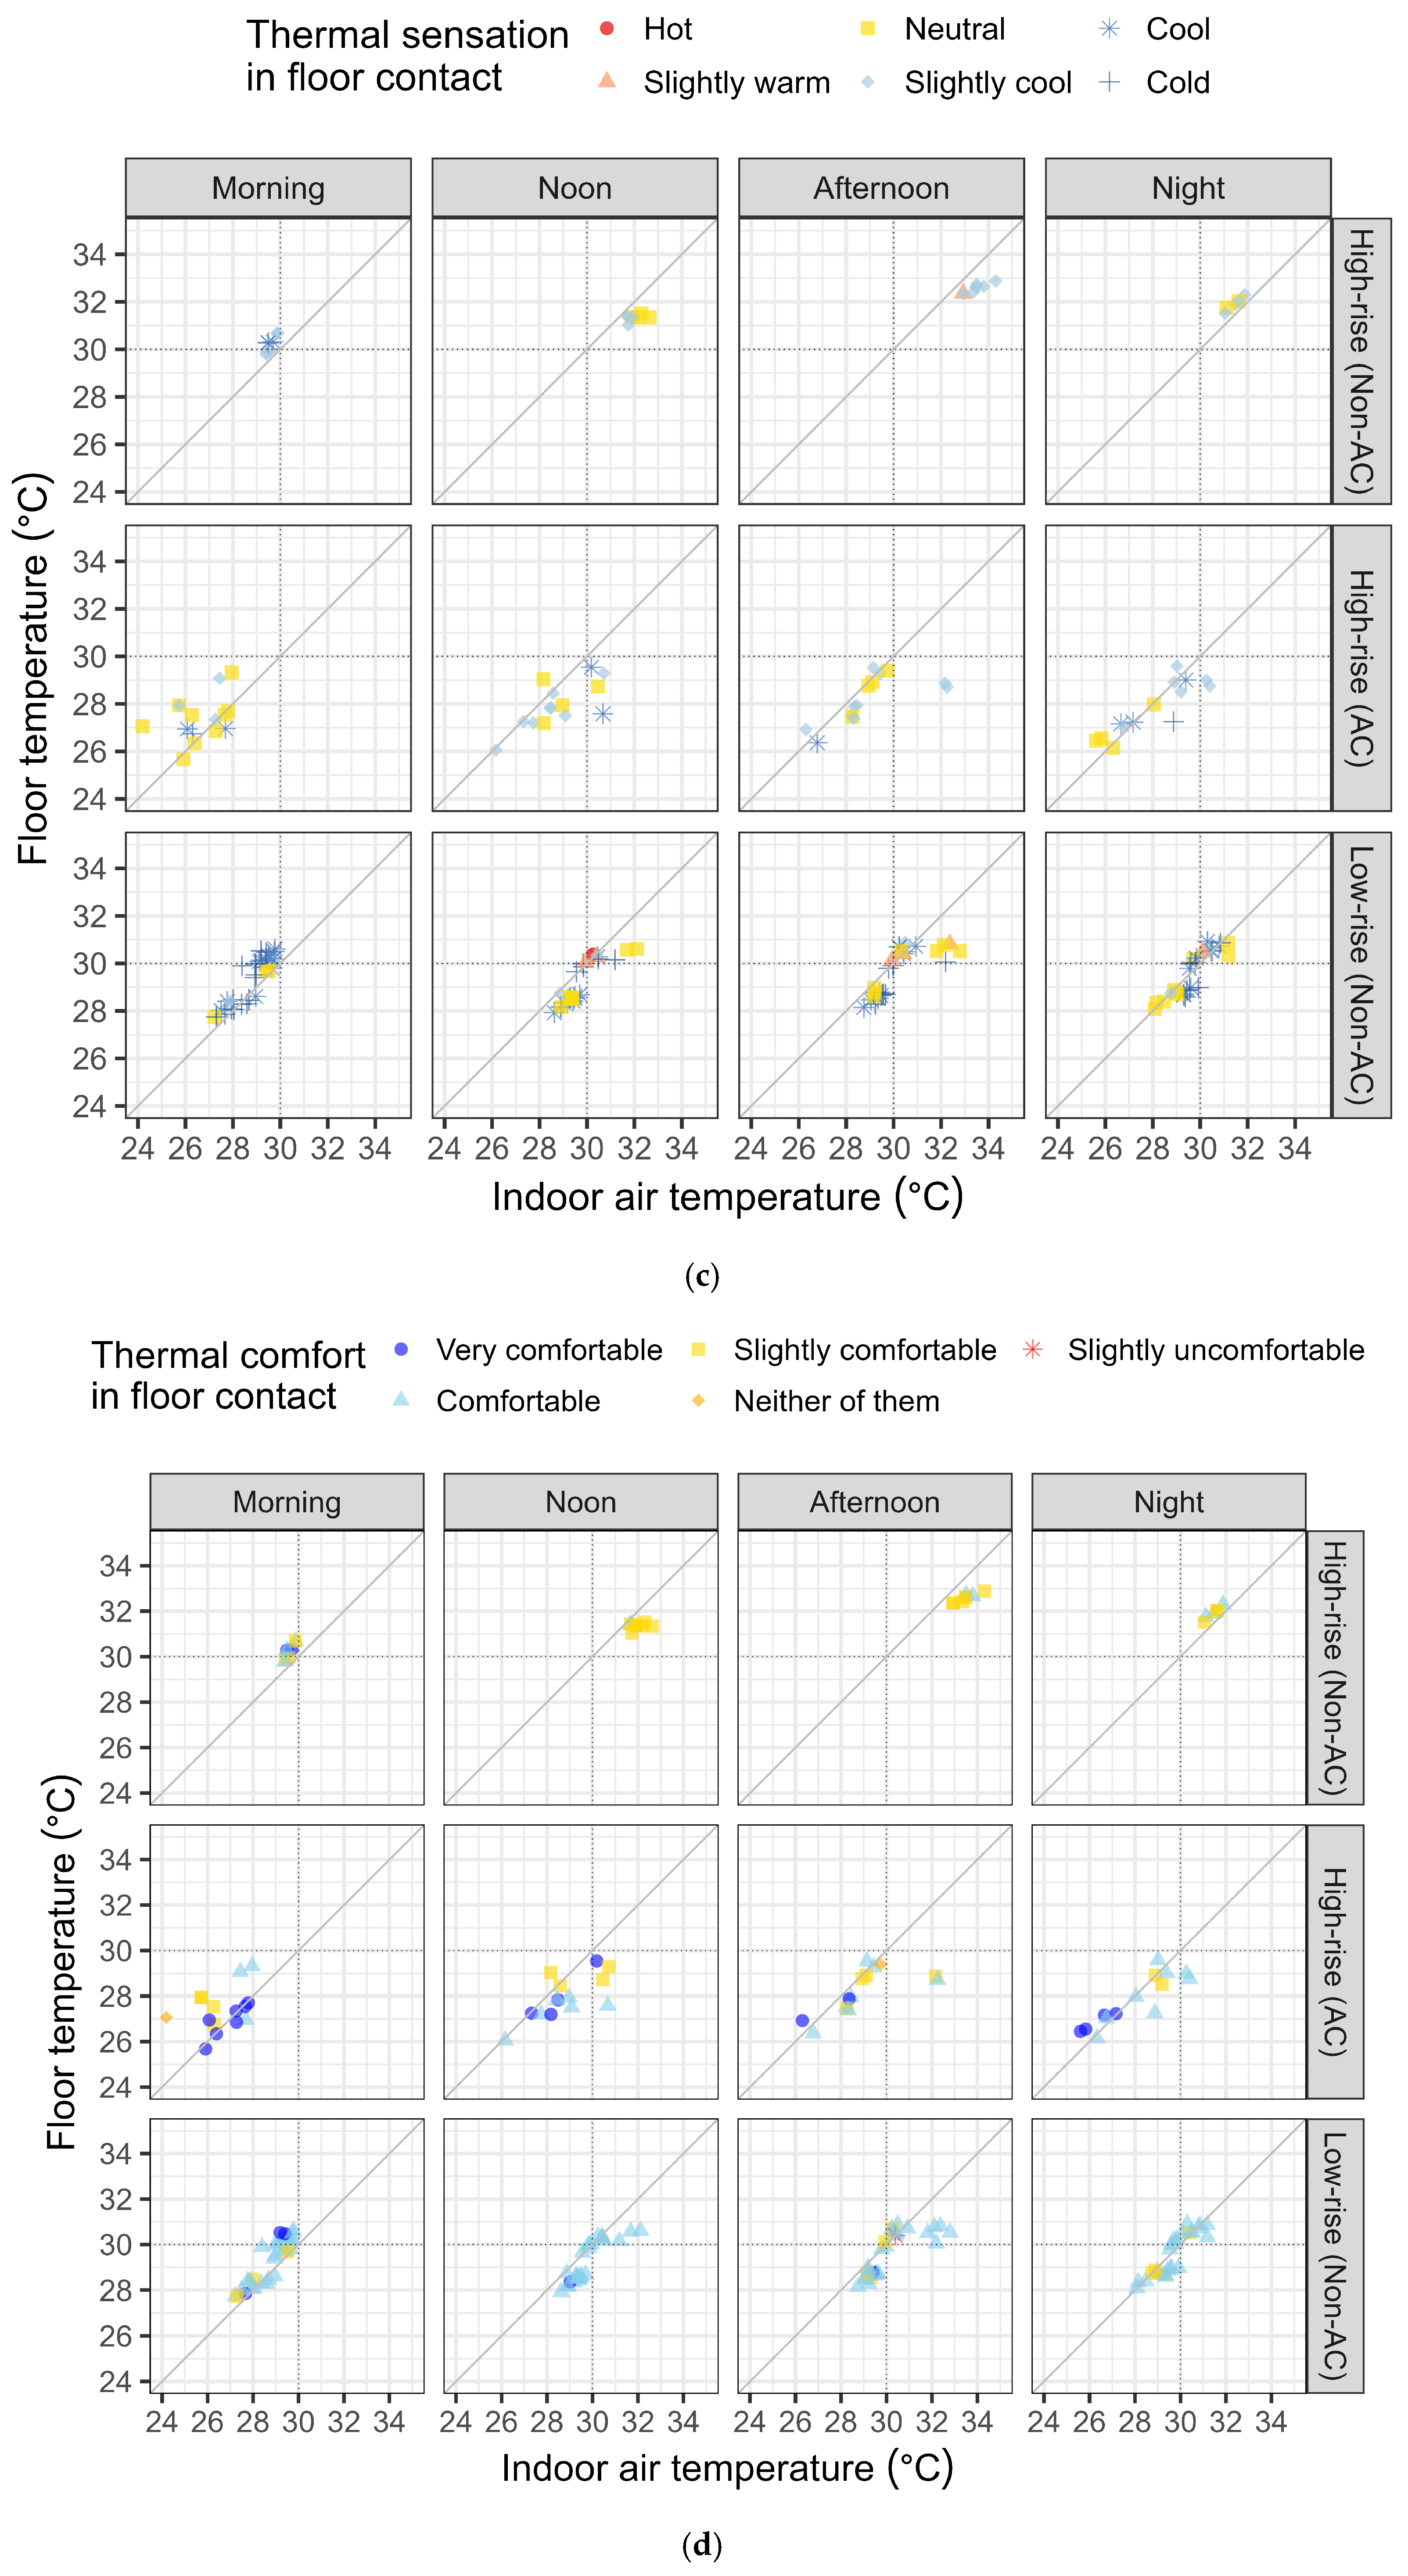
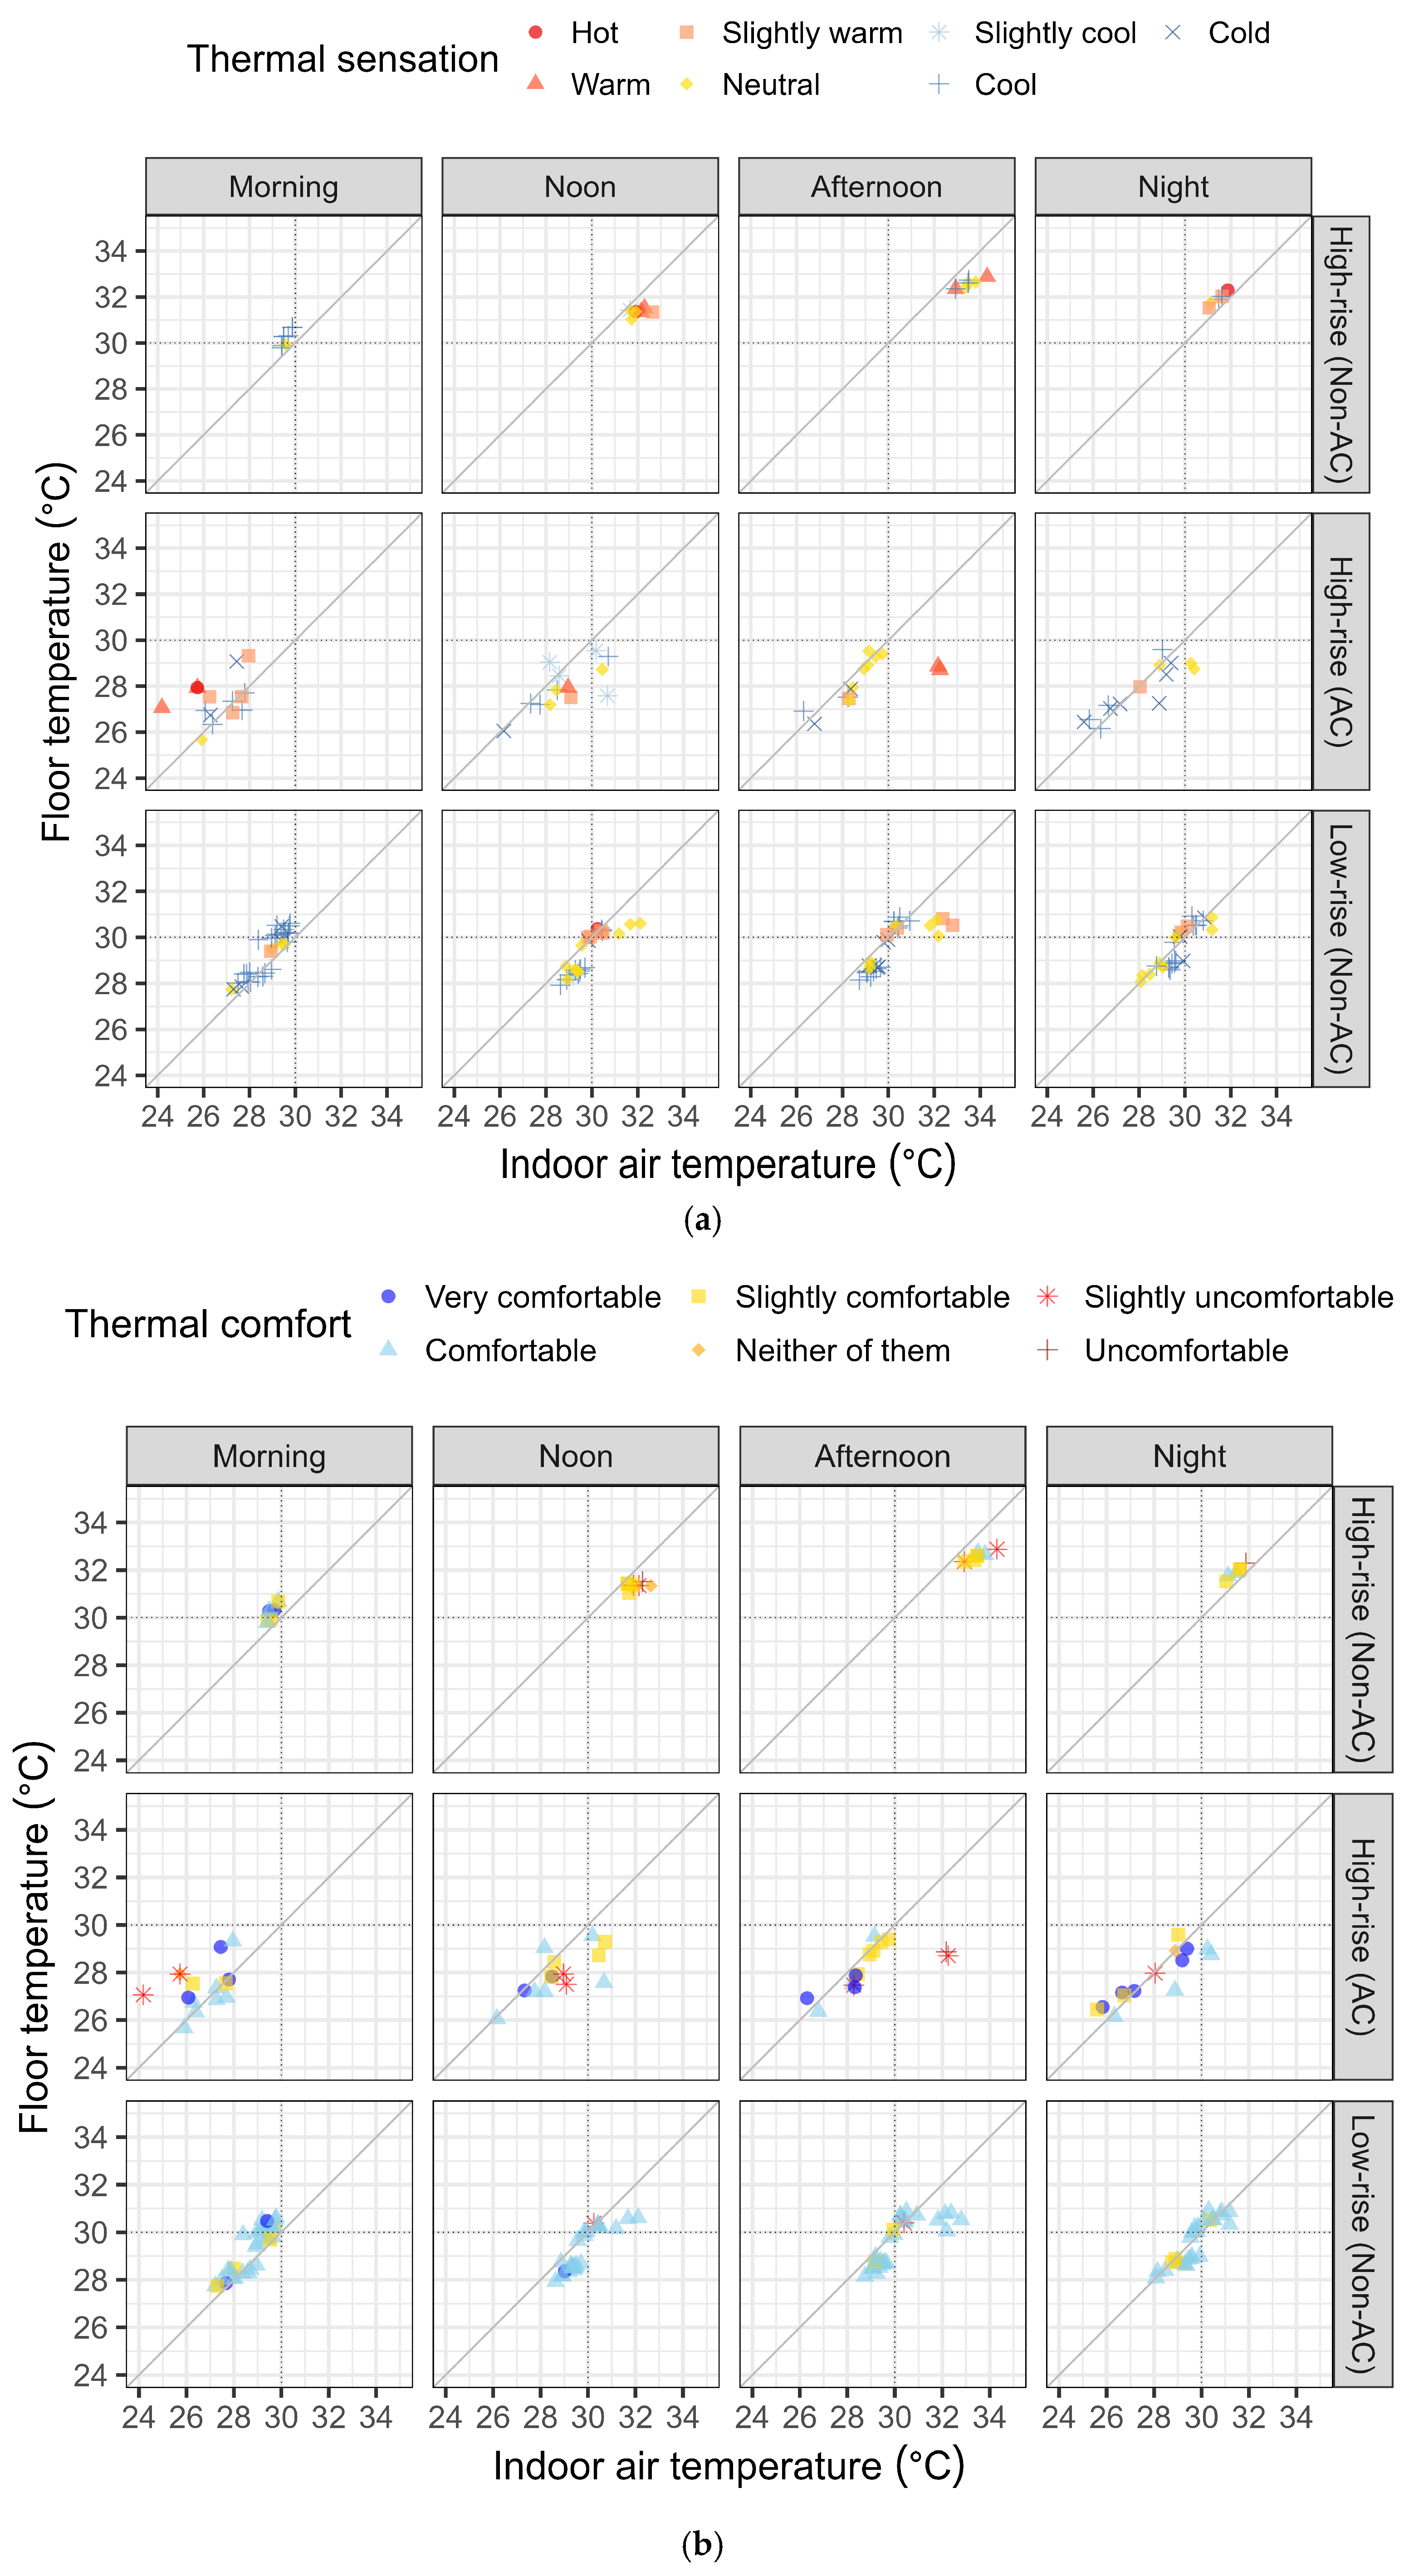
Figure 9 shows the results of thermal sensation and thermal comfort in relation to indoor air temperature and floor temperature across time periods and building types. Figure 9a,b presents the results of whole-body thermal sensation and comfort. Figure 9c,d shows thermal sensation and comfort for the body parts contacting the floor. In High-rise (Non-AC), “Hot/Warm” and “Uncomfortable” sensations for the whole body appeared from noon until night, when indoor and floor temperatures were both higher (over 31 °C), indicating that fan usage alone was not enough to obtain coolness and comfort. In High-rise (AC), “Hot/Warm” and “Slightly uncomfortable” sensations also appeared, especially when the respondents opened the windows. When they used AC, “Cool” and “Comfortable/Very comfortable” sensations were dominant. This result demonstrated a clear relationship between AC usage and thermal sensation and comfort. In Low-rise (Non-AC), thermal sensations remained on the cooler side, especially when air and floor temperatures were both lower (less than 30 °C), and a comfortable sensation was consistently reported throughout the day. “Slightly warm” sensations emerged during the afternoon as indoor air temperatures increased; however, thermal comfort remained predominantly “Comfortable”.
Regarding thermal sensation and comfort for the body parts in contact with the floors (Figure 9d), “Neutral/Slightly cool” and “Neutral/Slightly comfortable” were the majority for thermal sensation and comfort in High-rise (Non-AC). In High-rise (AC), “Neutral” and “Cool” were reported for thermal sensation, and “Slightly comfortable” and “Very comfortable” were reported for thermal comfort. These variations in floor-contact sensations correspond to those in whole-body sensations. This indicates the differences between window opening and AC usage; specifically, lower temperatures during AC usage periods provided cooler and very comfortable sensations. In Low-rise (Non-AC), “Cool/Cold” was dominant for thermal sensation, and “Comfortable” was dominant for thermal comfort. Thermal sensation in floor contact was mostly on the cooler/colder side compared to that of the whole body. This can be attributed to the thermal mass of the normal concrete floor with ceramic tile used in Low-rise, which maintained a lower surface temperature than the indoor air. The cooler floor surfaces, together with occupants’ adaptive behaviors and familiarity with floor-sitting, likely helped sustain coolness and comfort despite relatively higher air temperatures. This is further discussed in Section 4.2.

4. Discussion

4.1. Questionnaire-Based Analysis of Regional Climate and Adaptive Behaviors

Table 7 shows the summary of the main findings from the large-scale questionnaire. Regarding thermal adaptations, the current study revealed that AC usage was dominant for higher-income residents in High-rise buildings of the hotter regions. In contrast, fan usage was predominant among lower-income residents of High-rise buildings and across all income ranges in Low-rise buildings in the regions. Although window opening was also reported in these regions, the proportions were small. Mori et al. (2020) clarified that window opening and fan usage were frequently reported in public rental apartments (Rusunawa) for low- and middle-income earners in hot-humid regions, including Surabaya [22]. Feriadi and Wong (2004) also revealed that occupants in naturally ventilated buildings in hot and humid regions tended to modify the living environments by creating air movement (fans and opening windows) [36]. These findings suggest the importance of airflow without using AC in the hotter regions. In the cooler region, the current study revealed that AC usage and window opening were both reported in High-rise, and this was consistent with the findings obtained for the same region (Bandung) by Mori et al. (2020) [22].
In addition to thermal adaptation strategies, clear differences were observed in main posture and floor-sitting preferences across these building types and regions. The hotter regional residents in High-rise more frequently chose chair-sitting while using AC, especially for the higher income brackets. Floor-sitting preference results among these residents showed that although the preference for floor-sitting was lower, obtaining “Cool” was a major reason for floor-sitting. The hotter regional residents in Low-rise chose floor-sitting while using fans. The cooler region was also highlighted for its high prevalence of floor-sitting in both High- and Low-rise buildings, despite minimal AC or fan usage, often paired with window opening as a thermal adaptation. High-rise residents in the cooler region reported a strong preference for floor-sitting, often citing “Cool” as the reason, especially while keeping windows open. Although the cooler climate imposes lower thermal stress, residents still selected floor-sitting to stay cool, indicating a moderate form of thermal adaptation. Interestingly, even higher-income High-rise residents in the cooler region, who faced no economic constraints, selected floor-sitting for cooling. For the Low-rise residents in both the hotter and cooler regions, “Habit”, “Cool”, and “Comfortable” were the main reasons for floor-sitting. This indicates that floor-sitting is a habitual and adaptive behavior to obtain coolness and comfort for Low-rise residents.
Thermal sensation and comfort results revealed further layers of insight. In the High-rise buildings of the hotter regions, cooler-side sensations were more frequent, reflecting AC usage. In High-rise buildings of the cooler region, hot-side sensations were reported during daytime—when window opening was common—indicating that residents relied on floor-sitting and natural ventilation for cooling. At night, cooler-side sensations increased, likely due to the temperature drop (see Table 2), suggesting incomplete adaptation to daytime warmth. In Low-rise apartments of the hotter regions, although neutral and warmer-side sensations were the majority during daytime, residents mostly felt thermally comfortable with floor-sitting and fan usage.

4.2. In-Depth Measurements of Indoor Climate and Adaptive Behaviors

Table 8 summarizes the findings from in-depth measurements. Indoor air and floor temperatures were influenced by the building types and AC usage patterns. In High-rise (Non-AC), both air and floor temperatures were relatively high. This can be attributed to its lightweight wall construction with low thermal mass and without shading devices (Table 5). The unit faced northwest and easily received solar radiation during the afternoon owing to the sun’s position in the measurement period (late July to mid-September). Alfata et al. (2015) indicated that modern high-rise apartments in Indonesia are poorly designed in terms of thermal insulation and solar shading, and most apartments are constructed of aerated light concrete walls with relatively low thermal mass [24]. By contrast, High-rise (AC) maintained lower air and floor temperatures. The building has a similar design, WWR, and materials to High-rise (Non-AC). However, the units faced south and east, receiving less solar radiation. Furthermore, lower air and floor temperatures were maintained through AC operation from morning until night. One respondent utilized a carpet during floor-sitting; this might be due to the lower air and floor temperatures using AC.
Low-rise (Non-AC) recorded lower air and floor temperatures than High-rise (Non-AC). The WWRs of the two Low-rise buildings were different (i.e., 32% for LRA and 14% for LRB). However, the two Low-rise buildings shared design features—such as shaded window eaves and normal concrete walls with higher thermal mass—that helped stabilize indoor thermal conditions. In addition, differences emerged between the two. One (i.e., LRB) exhibited relatively higher air and floor temperatures, likely because its living room (the primary occupied space during daytime and the measurement site) was located in a perimeter zone, making it more vulnerable to outdoor thermal fluctuations. These units faced different orientations (i.e., east, south, and west). In the other building (i.e., LRA), the living room faced an internal corridor, with bedrooms along the external wall facing west, helping maintain more stable indoor conditions.
These indoor climate differences were reflected in thermal adaptations, thermal sensation, and thermal comfort responses. High-rise (Non-AC) residents who utilized fans reported hotter and less comfortable sensations during afternoons when both air and floor temperatures peaked. High-rise (AC) showed similar hot-side and slightly uncomfortable sensations during periods of opening windows without AC operation. During the time using AC, a cool and comfortable sensation was obtained. As Alfata et al. (2015) indicated, it was difficult to achieve thermal comfort without relying on AC in new private apartments [24]. Thermal sensation and comfort were also on the cool and comfortable side in Low-rise buildings (Non-AC), where fan usage and window opening often appeared. These units consistently maintained cooler and more comfortable sensations for the residents, especially when air and floor temperatures were both less than 31 °C. The 80% upper comfort limit of the operative temperature (OT) can be estimated according to a previous study on naturally ventilated buildings in hot-humid climates [37]. The resultant OT was 30.3 °C, and the obtained air and floor temperatures in the conditions (31 °C) were slightly higher than this value. Among these conditions, thermal sensation and comfort in floor contact were cool/cold and comfortable. Notably, floor-contact thermal sensations were cooler/colder than those of the whole body. For Indonesians, the closest thermal descriptors of a feeling of thermal comfort were the cool and cold sides [38]. This was also shown in tropical residents, where comfort was associated with verbal anchors on the cold side [39]. Across all cases, floor-sitting remained the dominant posture. Contact cooling effects [19] might be obtained through floor-sitting postures; however, they were solely assumed from subjective reports combined with observed air and floor temperatures. Therefore, the mechanisms of contact cooling effects should be clarified through laboratory experiments with physical (floor temperatures and heat flux), physiological (skin temperatures), and psychological (thermal and comfort sensations) measurements in future studies.

4.3. Thermal Adaptation, Lifestyle, and Comfort in Tropical Residential Contexts

As discussed above, the obtained results suggest the importance of building design and materials (i.e., adequate shading and thermal mass). Li (2025) synthesized recent evidence showing that building design, envelope performance, and interior configurations jointly influence indoor thermal conditions and occupant comfort [40]. Architectural characteristics, such as window-to-wall ratio (WWR) and shading conditions, will influence solar heat gains, ventilation potential, and radiant temperature distribution, shaping indoor thermal exposure and adaptive behaviors [41,42,43]. Other previous studies have also shown that building design features regulating solar access and airflow can significantly modify perceived comfort and adaptive behavior, especially in naturally ventilated dwellings [44]. The high thermal mass of houses in a hot-humid climate showed that the air temperature in the spaces maintained relatively low values [45]. Behavioral studies indicate that occupants dynamically adjust posture, window opening, and fan use in response to these micro-environmental conditions rather than relying solely on AC systems [42]. These findings provide a design-based context for the observed differences between low-rise and high-rise buildings in this study, particularly the role of thermal mass and floor temperature stability in supporting floor-sitting as a viable adaptive strategy.
However, over recent decades, a marked shift has occurred toward active thermal adaptation, most notably the widespread adoption of AC. Rising household incomes, intensifying urban heat stress [46], and growing expectations for stable indoor environments have accelerated this trend [47]. While AC delivers immediate comfort, it also elevates residential electricity demand [48], straining both household budgets and national energy systems. Miyamoto et al. (2024) indicated that the use of AC had a significant impact on energy consumption in Indonesia [49]. In the current study, AC usage was a dominant factor for electricity consumption across income levels in the hotter regions (See Figure 7).
In contrast, other active methods, such as electric fans, consume less energy but are often perceived as inadequate in extreme heat. As AC use becomes more prevalent in high-rise housing, it displaces culturally rooted practices that historically enabled residents to adapt to local climatic conditions with minimal energy input [30,50]. Studies indicate that thermal adaptation in tropical climates cannot be explained purely in physiological terms, as it is also mediated by cultural traditions and lifestyle-related behaviors [51,52]. Furthermore, psychological dimensions of comfort play a critical role: residents in tropical regions often accept warmer indoor conditions than international benchmarks (e.g., ASHRAE 55), provided they retain adaptive opportunities such as posture adjustment, ventilation control, or cultural practices [26,53].
Socio-demographic and lifestyle variables, including household composition, occupation, and duration of spending time at home, also affect posture flexibility and cumulative thermal exposure. Empirical evidence suggests that time spent at home significantly influences thermal control behaviors and comfort expectations, reinforcing the role of daily occupancy patterns in shaping adaptive practices [54]. The current study could only discuss regional and indoor climatic factors influencing adaptive behaviors; therefore, lifestyle variables should be analyzed in further studies.

4.4. Posture-Based Thermal Adaptation in Relation to Recent Comfort Studies

Floor-sitting posture has historically been embedded in social and cultural practices across many Asian societies [16,17], where activities such as dining, gathering, or relaxing are often conducted on floor mats, carpets, or directly on the floor. Beyond its cultural importance, floor-sitting can also serve as a passive cooling strategy. Physical contact with the floor can enhance heat dissipation from the body [19], particularly when the floor is cooler than the ambient air. In tropical housing without AC, this simple adaptation can provide localized thermal relief. For instance, Erwindi et al. (2025) found that while floor-sitting persists among lower-income residents in publicly subsidized housing (Rusunawa), its prevalence declines among higher-income and High-rise dwellers who favor AC and standard furniture usage [18]. The current study revealed that floor-sitting behavior was also reported among higher-income and High-rise dwellers of the cooler regions. This divergence is closely tied to the climatic conditions, apartment design, cooling availability, and occupant socioeconomic status. In addition, this study indicated the importance of the combination of indoor air and floor temperatures to maintain cooler thermal sensation and comfort while conducting floor-sitting behavior without using AC in the hotter regions.
Occupant posture was increasingly recognized in recent thermal comfort research as not merely a neutral background condition, but as an active component of behavioral thermal adaptation, particularly in warm and humid environments. Systematic reviews demonstrated that adaptive behaviors—such as changes in sitting posture, use of floor surfaces, fan operation, and window opening—play a critical role in mediating comfort when indoor temperatures exceed conventional comfort ranges [55]. Further insights into thermal comfort optimization and heat resilience indicate that adaptive capacity at the occupant level mitigates thermal stress when mechanical cooling is limited or absent. Kajjoba et al. (2025) reported that in low-income tropical housing, thermal comfort is frequently maintained through passive means and behavioral flexibility rather than continuous AC use [56]. Jain et al. (2024) highlighted that resilient indoor environments emerge not only from advanced technologies but also from occupants’ ability to interact with building features and microclimatic conditions [57]. Furthermore, Apriliyanthi et al. (2025) identified patterns of occupants’ thermal adaptation, including fan and window use, clothing adjustment, and also AC set point, through cluster and regression analysis in hot-humid conditions of Indonesia, highlighting behavioral diversity across residential types [58]. Similarly, in 2024, a field study in naturally ventilated buildings demonstrated that acceptable thermal comfort can be achieved through adaptive behaviors under fluctuating indoor conditions, even with short monitoring periods [59]. These perspectives provide an important interpretive framework for the present findings, in which floor-sitting emerged as a prevalent strategy for achieving acceptable thermal comfort, and aligns with where residents in low-rise, non-air-conditioned (Non-AC) units achieved thermal comfort through floor contact, fan use, and window operation rather than reliance on air-conditioning (AC).
However, this study has several limitations. First, although the sampling design ensured representativeness of apartment housing residents in the large-scale questionnaire, building height was not used as a stratification variable at the sampling stage. Therefore, analyses by building height should be interpreted as comparative and exploratory within the sampled apartment population, rather than as population-weighted estimates. Second, while the consistency between observed posture choices, indoor climate conditions, and contemporary thermal comfort research strengthens the validity of the conclusions obtained from the in-depth measurement, the limited number of measured cases constrains generalization. Therefore, further studies with an increased number of samples for the measurements are important.

5. Conclusions

This study analyzed the influence of regional and indoor climatic factors on floor-sitting as an adaptive behavior and thermal comfort in Indonesian apartments. First, a large-scale questionnaire was employed to clarify the relationship between regional climates, floor-sitting behavior, thermal adaptations, household electricity consumption, and thermal comfort. Next, in-depth measurement was conducted to examine the influence of building type and indoor climate on thermal adaptations and thermal comfort with floor-sitting behavior in the hotter region (Surabaya).
Collectively, the evidence suggests that thermal comfort in tropical housing is shaped through the dynamic interaction of climatic conditions, building types, cultural practices, and technological interventions. The ongoing shift from passive, culturally embedded practices (floor-sitting with lifestyle adjustments) to energy-intensive solutions (AC) represents a redefinition of comfort expectations. Recognizing and integrating such adaptive behaviors as floor-sitting is critical for developing sustainable housing strategies that respect cultural practices while reducing energy demand in rapidly urbanizing tropical regions.
As a conclusion, this study reveals several key findings on floor-sitting as an adaptive behavior in Indonesian climates and building types:
  • Climate-driven adaptation: In the hotter regions like Jabodetabek and Surabaya, floor-sitting was primarily conducted without the use of AC and often alongside the use of electric fans in Low-rise housing. In contrast, in High-rise housing of these hotter regions, AC usage and chair/sofa sitting were common adaptive behaviors. In the cooler region of Bandung, however, floor-sitting remained a frequent adaptive behavior in both Low-rise and High-rise housing and was often accompanied by window openings for both building types. Climatic conditions shaped thermal adaptations and floor-usage behaviors. In addition, floor-sitting consistently emerged as a habitual and adaptive behavior to obtain coolness and comfort for Low-rise residents in both climatic regions.
  • Socio-cultural resilience: Even among higher-income individuals living in High-rise residences in Bandung, floor-sitting and window opening remained preferred over AC use, indicating non-economic motivations for this practice in the cooler region.
  • Building performance matters: In the hotter region of Surabaya, the Low-rise apartment units consistently maintained cooler and comfortable sensations for the residents without using AC, especially when air and floor temperatures were both less than 31 °C, which was lower than those in the High-rise apartment unit without AC usage. The indoor climatic conditions in the Low-rise apartments were supported by building materials with high thermal mass and building design with adequate solar shading. Furthermore, thermal sensation in floor contact was cooler/colder than that of the whole body, and the residents could feel comfortable, suggesting the importance of a cooler floor for thermal comfort.
These findings indicated that cooler climates could provide cool and thermally comfortable living environments with floor-sitting in dwellings; however, even in hotter climates, creating stable indoor climates with adequate consideration for building design and materials might serve similar environments where residents could continue the culturally embedded adaptive behavior of floor-sitting. Overall, this study demonstrated that floor-sitting is a vital behavior that adapts to regional and indoor climatic conditions in the tropics while achieving thermal comfort and relying less on AC devices.

Author Contributions

Conceptualization, C.E. and T.A.; methodology, C.E., T.A. and T.K.; software, C.E. and K.K.; validation, C.E. and K.K.; formal analysis, C.E. and K.K.; investigation, C.E., S.N.N.E. and T.A.; resources, T.A.; data curation, C.E.; writing—original draft preparation, C.E.; writing—review and editing, K.K., T.A., S.N.N.E. and T.K.; visualization, C.E. and K.K.; supervision, T.A.; project administration, T.A. and T.K.; funding acquisition, T.A. and T.K. All authors have read and agreed to the published version of the manuscript.

Funding

This research was supported by the Science and Technology Research Partnership for Sustainable Development (SATREPS) in collaboration between the Japan Science and Technology Agency (JST, JPMJSA1904) and the Japan International Cooperation Agency (JICA). This work was also supported by JSPS KAKENHI Grant Numbers 24KK0092 and 25H00766.

Institutional Review Board Statement

The study was conducted according to the guidelines of the Declaration of Helsinki and approved by the Institutional Ethics Committee of Hiroshima University (Approval number: ASE-2022-0809(2), approved date: 9 August 2022).

Informed Consent Statement

Informed consent was obtained from all respondents involved in the study.

Data Availability Statement

The data presented in this study are available on request from the corresponding author (the data are not publicly available due to privacy or ethical restrictions.).

Acknowledgments

This research was conducted by the Building Research Group as part of the Development of Low-Carbon Affordable Apartments in the Hot-Humid Climate of Indonesia Project toward the Paris Agreement 2030, Science and Technology Research Partnership for Sustainable Development (SATREPS), collaboratively supported by the Japan Science and Technology Agency (JST) and the Japan International Cooperation Agency (JICA). The questionnaire survey was collaboratively conducted by the Institute of Science Tokyo, Hiroshima University, and Waseda University with support from Institut Teknologi Sepuluh Nopember and the Ministry of Public Works and Housing (PUPR) of Indonesia. This work was also supported by JSPS KAKENHI (Grant number: 24KK0092 and 25H00766).

Conflicts of Interest

The authors declare no conflicts of interest.

Appendix A

Table A1. Description of building categories.
VariableOverallHigh-riseLow-rise
N = 3131 1N = 1068 1N = 2063 1
Age38 (10)36 (11)38 (10)
Age category
   +55199, (6.4%)57, (5.3%)142, (6.9%)
   10s76, (2.4%)33, (3.1%)43, (2.1%)
   20–24294, (9.4%)143, (13%)151, (7.3%)
   25–29436, (14%)163, (15%)273, (13%)
   30–34444, (14%)141, (13%)303, (15%)
   35–39488, (16%)148, (14%)340, (16%)
   40–44452, (14%)145, (14%)307, (15%)
   45–49381, (12%)113, (11%)268, (13%)
   50–54361, (12%)125, (12%)236, (11%)
Gender
   Female2258, (72%)676, (63%)1582, (77%)
   Male873, (28%)392, (37%)481, (23%)
Number of family members living together
   1740, (24%)427, (40%)313, (15%)
   21384, (44%)437, (41%)947, (46%)
   3588, (19%)127, (12%)461, (22%)
   4288, (9.2%)54, (5.1%)234, (11%)
   594, (3.0%)16, (1.5%)78, (3.8%)
   632, (1.0%)7, (0.7%)25, (1.2%)
   75, (0.2%)0, (0%)5, (0.2%)
Occupation category
   Army/police9, (0.3%)6, (0.6%)3, (0.1%)
   Business owner/Executive level or above32, (1.0%)31, (2.9%)1, (<0.1%)
   Educator47, (1.5%)16, (1.5%)31, (1.5%)
   Entrepreneur/Store owner613, (20%)332, (31%)281, (14%)
   Housewife with a side job258, (8.2%)52, (4.9%)206, (10.0%)
   Housewife without a side job968, (31%)150, (14%)818, (40%)
   Laborer (farmer, stone mason, maid)90, (2.9%)5, (0.5%)85, (4.1%)
   Laborer with a license (driver, mechanic, carpenter)138, (4.4%)16, (1.5%)122, (5.9%)
   Normal employee766, (24%)371, (35%)395, (19%)
   Not working/unable to search for work26, (0.8%)2, (0.2%)24, (1.2%)
   Professional39, (1.2%)28, (2.6%)11, (0.5%)
   Retiree32, (1.0%)8, (0.7%)24, (1.2%)
   Student83, (2.7%)44, (4.1%)39, (1.9%)
   Unable to work6, (0.2%)1, (<0.1%)5, (0.2%)
   Workers with a license (nurse)24, (0.8%)6, (0.6%)18, (0.9%)
Building structure
   Ceramic1, (<0.1%)1, (<0.1%)0, (0%)
   Concrete brick6, (0.2%)0, (0%)6, (0.3%)
   Galvalume19, (0.6%)0, (0%)19, (0.9%)
   Reinforced concrete frame2859, (91%)887, (83%)1972, (96%)
   Steel frame240, (7.7%)180, (17%)60, (2.9%)
   Wall1, (<0.1%)0, (0%)1, (<0.1%)
   Wood5, (0.2%)0, (0%)5, (0.2%)
Level of the unit5.0 (5.1)9.7 (6.4)2.6 (1.3)
Level of the building9.9 (8.1)20.5 (5.2)4.5 (0.6)
Unit type
   Family 1 bedroom (1BR)876, (28%)158, (15%)718, (35%)
   Family 2 bedrooms (2BR)1488, (48%)736, (69%)752, (36%)
   Family 3 bedrooms (3BR)11, (0.4%)4, (0.4%)7, (0.3%)
   Studio756, (24%)170, (16%)586, (28%)
Area for gathering
   Bed room59, (1.9%)40, (3.8%)19, (0.9%)
   Corridor/Hallway1, (<0.1%)0, (0%)1, (<0.1%)
   Dining room21, (0.7%)11, (1.0%)10, (0.5%)
   Dining room; Corridor/Hallway1, (<0.1%)0, (0%)1, (<0.1%)
   Kitchen/Pantry1, (<0.1%)1, (<0.1%)0, (0%)
   Kitchen/Pantry; Bedroom3, (<0.1%)3, (0.3%)0, (0%)
   Living room2860, (92%)947, (89%)1913, (93%)
   Living room; Bedroom42, (1.3%)14, (1.3%)28, (1.4%)
   Living room; Corridor/Hallway3, (<0.1%)0, (0%)3, (0.1%)
   Living room; Corridor/Hallway; Outdoor area1, (<0.1%)0, (0%)1, (<0.1%)
   Living room; Dining room13, (0.4%)9, (0.8%)4, (0.2%)
   Living room; Dining room; Bedroom1, (<0.1%)1, (<0.1%)0, (0%)
   Living room; Dining room; Corridor/Hallway; Kitchen/Pantry; Bed room1, (<0.1%)1, (<0.1%)0, (0%)
   Living room; Kitchen/Pantry2, (<0.1%)2, (0.2%)0, (0%)
   Living room; Outdoor area28, (0.9%)21, (2.0%)7, (0.3%)
   Living room; Outdoor area; Bedroom1, (<0.1%)1, (<0.1%)0, (0%)
   Living room; Terrace/Veranda/Balcony20, (0.6%)1, (<0.1%)19, (0.9%)
   Living room; Terrace/Veranda/Balcony; Bed room3, (<0.1%)0, (0%)3, (0.1%)
   Living room; Terrace/Veranda/Balcony; Corridor/Hallway2, (<0.1%)0, (0%)2, (<0.1%)
   Living room; Terrace/Veranda/Balcony; Corridor/Hallway; Outdoor area1, (<0.1%)0, (0%)1, (<0.1%)
   Living room; Terrace/Veranda/ Balcony; Outdoor area2, (<0.1%)0, (0%)2, (<0.1%)
   Outdoor area9, (0.3%)8, (0.8%)1, (<0.1%)
   Outdoor area; Bedroom2, (<0.1%)2, (0.2%)0, (0%)
   Terrace/Veranda/Balcony45, (1.4%)3, (0.3%)42, (2.0%)
   Terrace/Veranda/Balcony; Corridor/Hallway1, (<0.1%)0, (0%)1, (<0.1%)
Total energy consumption [GJ/year]12 (7)16 (7)9 (5)
Electricity energy consumption [GJ/year]7.6 (5.5)11.3 (5.8)5.7 (4.1)
Gas energy consumption [GJ/year]4.29 (2.70)4.96 (3.22)3.92 (2.29)
House type
   Condominium341, (11%)314, (29%)27, (1.3%)
   Rusunami1278, (41%)625, (59%)653, (32%)
   Rusunawa1512, (48%)129, (12%)1383, (67%)
Income
   Under Rp.900,00034, (1.1%)6, (0.6%)28, (1.4%)
   Rp.900,001–Rp.1,250,00063, (2.0%)8, (0.8%)55, (2.7%)
   Rp.1,250,001–Rp.2,500,000497, (16%)20, (1.9%)477, (23%)
   Rp.2,500,001–Rp.4,000,0001066, (34%)129, (12%)937, (46%)
   Rp.4,000,001–Rp.7,500,000749, (24%)295, (28%)454, (22%)
   Rp.7,500,001–Rp.12,000,000437, (14%)359, (34%)78, (3.8%)
   Rp.12,000,001–Rp.20,000,000198, (6.4%)186, (18%)12, (0.6%)
   Rp.20,000,001–Rp.40,000,00051, (1.6%)48, (4.5%)3, (0.1%)
   Over Rp.40,000,0014, (0.1%)4, (0.4%)0, (0%)
Preference for sitting on the floor
   Dislike sitting on the floor1039, (33%)649, (61%)390, (19%)
   Like sitting on a floor1991, (64%)374, (35%)1617, (78%)
   Not sure101, (3.2%)45, (4.2%)56, (2.7%)
Thermal sensation in the daytime
   Hot49, (1.6%)3, (0.3%)46, (2.2%)
   Warm734, (23%)147, (14%)587, (28%)
   Slightly warm276, (8.8%)84, (7.9%)192, (9.3%)
   Neutral1255, (40%)425, (40%)830, (40%)
   Slightly cool664, (21%)343, (32%)321, (16%)
   Cool143, (4.6%)61, (5.7%)82, (4.0%)
   Cold10, (0.3%)5, (0.5%)5, (0.2%)
Thermal sensation at nighttime
   Hot8, (0.3%)2, (0.2%)6, (0.3%)
   Warm239, (7.6%)24, (2.2%)215, (10%)
   Slightly warm180, (5.7%)28, (2.6%)152, (7.4%)
   Neutral964, (31%)298, (28%)666, (32%)
   Slightly cool1106, (35%)508, (48%)598, (29%)
   Cool524, (17%)159, (15%)365, (18%)
   Cold110, (3.5%)49, (4.6%)61, (3.0%)
Thermal comfort in the daytime
   Very uncomfortable34, (1.1%)4, (0.4%)30, (1.5%)
   Uncomfortable349, (11%)70, (6.6%)279, (14%)
   Slightly uncomfortable493, (16%)115, (11%)378, (18%)
   Comfortable2255, (72%)879, (82%)1376, (67%)
Thermal comfort at nighttime
   Very uncomfortable18, (0.6%)2, (0.2%)16, (0.8%)
   Uncomfortable104, (3.3%)21, (2.0%)83, (4.0%)
   Slightly uncomfortable340, (11%)83, (7.8%)257, (12%)
   Comfortable2669, (85%)962, (90%)1707, (83%)
Thermal satisfaction in the daytime
   Very unsatisfied45, (1.4%)8, (0.7%)37, (1.8%)
   Unsatisfied153, (4.9%)20, (1.9%)133, (6.4%)
   Slightly unsatisfied234, (7.5%)36, (3.4%)198, (9.6%)
   Neither of them154, (4.9%)36, (3.4%)118, (5.7%)
   Slightly satisfied505, (16%)193, (18%)312, (15%)
   Satisfied1952, (62%)725, (68%)1227, (59%)
   Very satisfied88, (2.8%)50, (4.7%)38, (1.8%)
Thermal satisfaction at nighttime
   Very unsatisfied92, (2.9%)21, (2.0%)71, (3.4%)
   Unsatisfied56, (1.8%)12, (1.1%)44, (2.1%)
   Slightly unsatisfied140, (4.5%)36, (3.4%)104, (5.0%)
   Neither of them113, (3.6%)32, (3.0%)81, (3.9%)
   Slightly satisfied374, (12%)83, (7.8%)291, (14%)
   Satisfied2227, (71%)832, (78%)1395, (68%)
   Very satisfied129, (4.1%)52, (4.9%)77, (3.7%)
1 Mean (SD); N, (%).

Appendix B

Electricity consumption was estimated following the methodology adopted in a previous study [49]. Because electricity billing schemes differ between post-payment and pre-payment systems, separate calculation formulas were applied, as presented in Equations (A1) and (A2), respectively.
MECH = x U C      
MECH = x × 1 P P J S C U C
In these equations, MECH denotes the monthly household electricity consumption kWh / month hh , x represents the reported monthly electricity expenditure IDR / month , U C is the electricity usage charge IDR / kWh , P P J refers to the public street lighting tax rate; and S C indicates the applicable stamp fee IDR . Information on contract power levels, public street lighting tax rates, and stamp fees is provided in Table A2, Table A3 and Table A4, respectively.
Table A2. Electricity using charge for each contract power in 2022 [60].
Contract Power [VA]Usage Charge [IDR/kWh]
9001352.00
1300, 22001444.70
3500–5500, 6500~1699.53
Table A3. Tax rates of public street light by city [49].
CityPublic Street Light Tax Rates [%]
Jakarta3
Surabaya8
Bandung6
Makassar10
Medan7
Table A4. Stamp fee by electricity bill [49].
Electricity Bill [IDR]Stamp Cost [IDR]
x ≤ 200,0000
200,000 < x ≤ 1,000,0003000
1,000,000 < x6000

Appendix C

Table A5. Details of the in-depth measurement unit plan and equipment settings.
BuildingUnitUnit Plans and Equipment Settings
HRAHRA-1Sustainability 18 00865 i009
HRBHRB-1Sustainability 18 00865 i010
HRB-2Sustainability 18 00865 i011
HRB-3Sustainability 18 00865 i012
LRALRA-1Sustainability 18 00865 i013
LRA-2Sustainability 18 00865 i014
LRBLRB-1Sustainability 18 00865 i015
LRB-2Sustainability 18 00865 i016
LRB-3Sustainability 18 00865 i017
Legend: Sustainability 18 00865 i018 Temperature and Humidity; Sustainability 18 00865 i019Floor temperature.

Appendix D

The Window-to-Wall Ratio (WWR) is defined as the ratio of the total glazing area to the gross exterior wall area of a specific façade or building envelope [61]. It is calculated using the following formula:
W W R =   A w i n d o w A w a l l × 100 %
where
  • A w i n d o w is the area of the window opening (including frames).
  • A w a l l is the gross area of the exterior wall (including the window area)
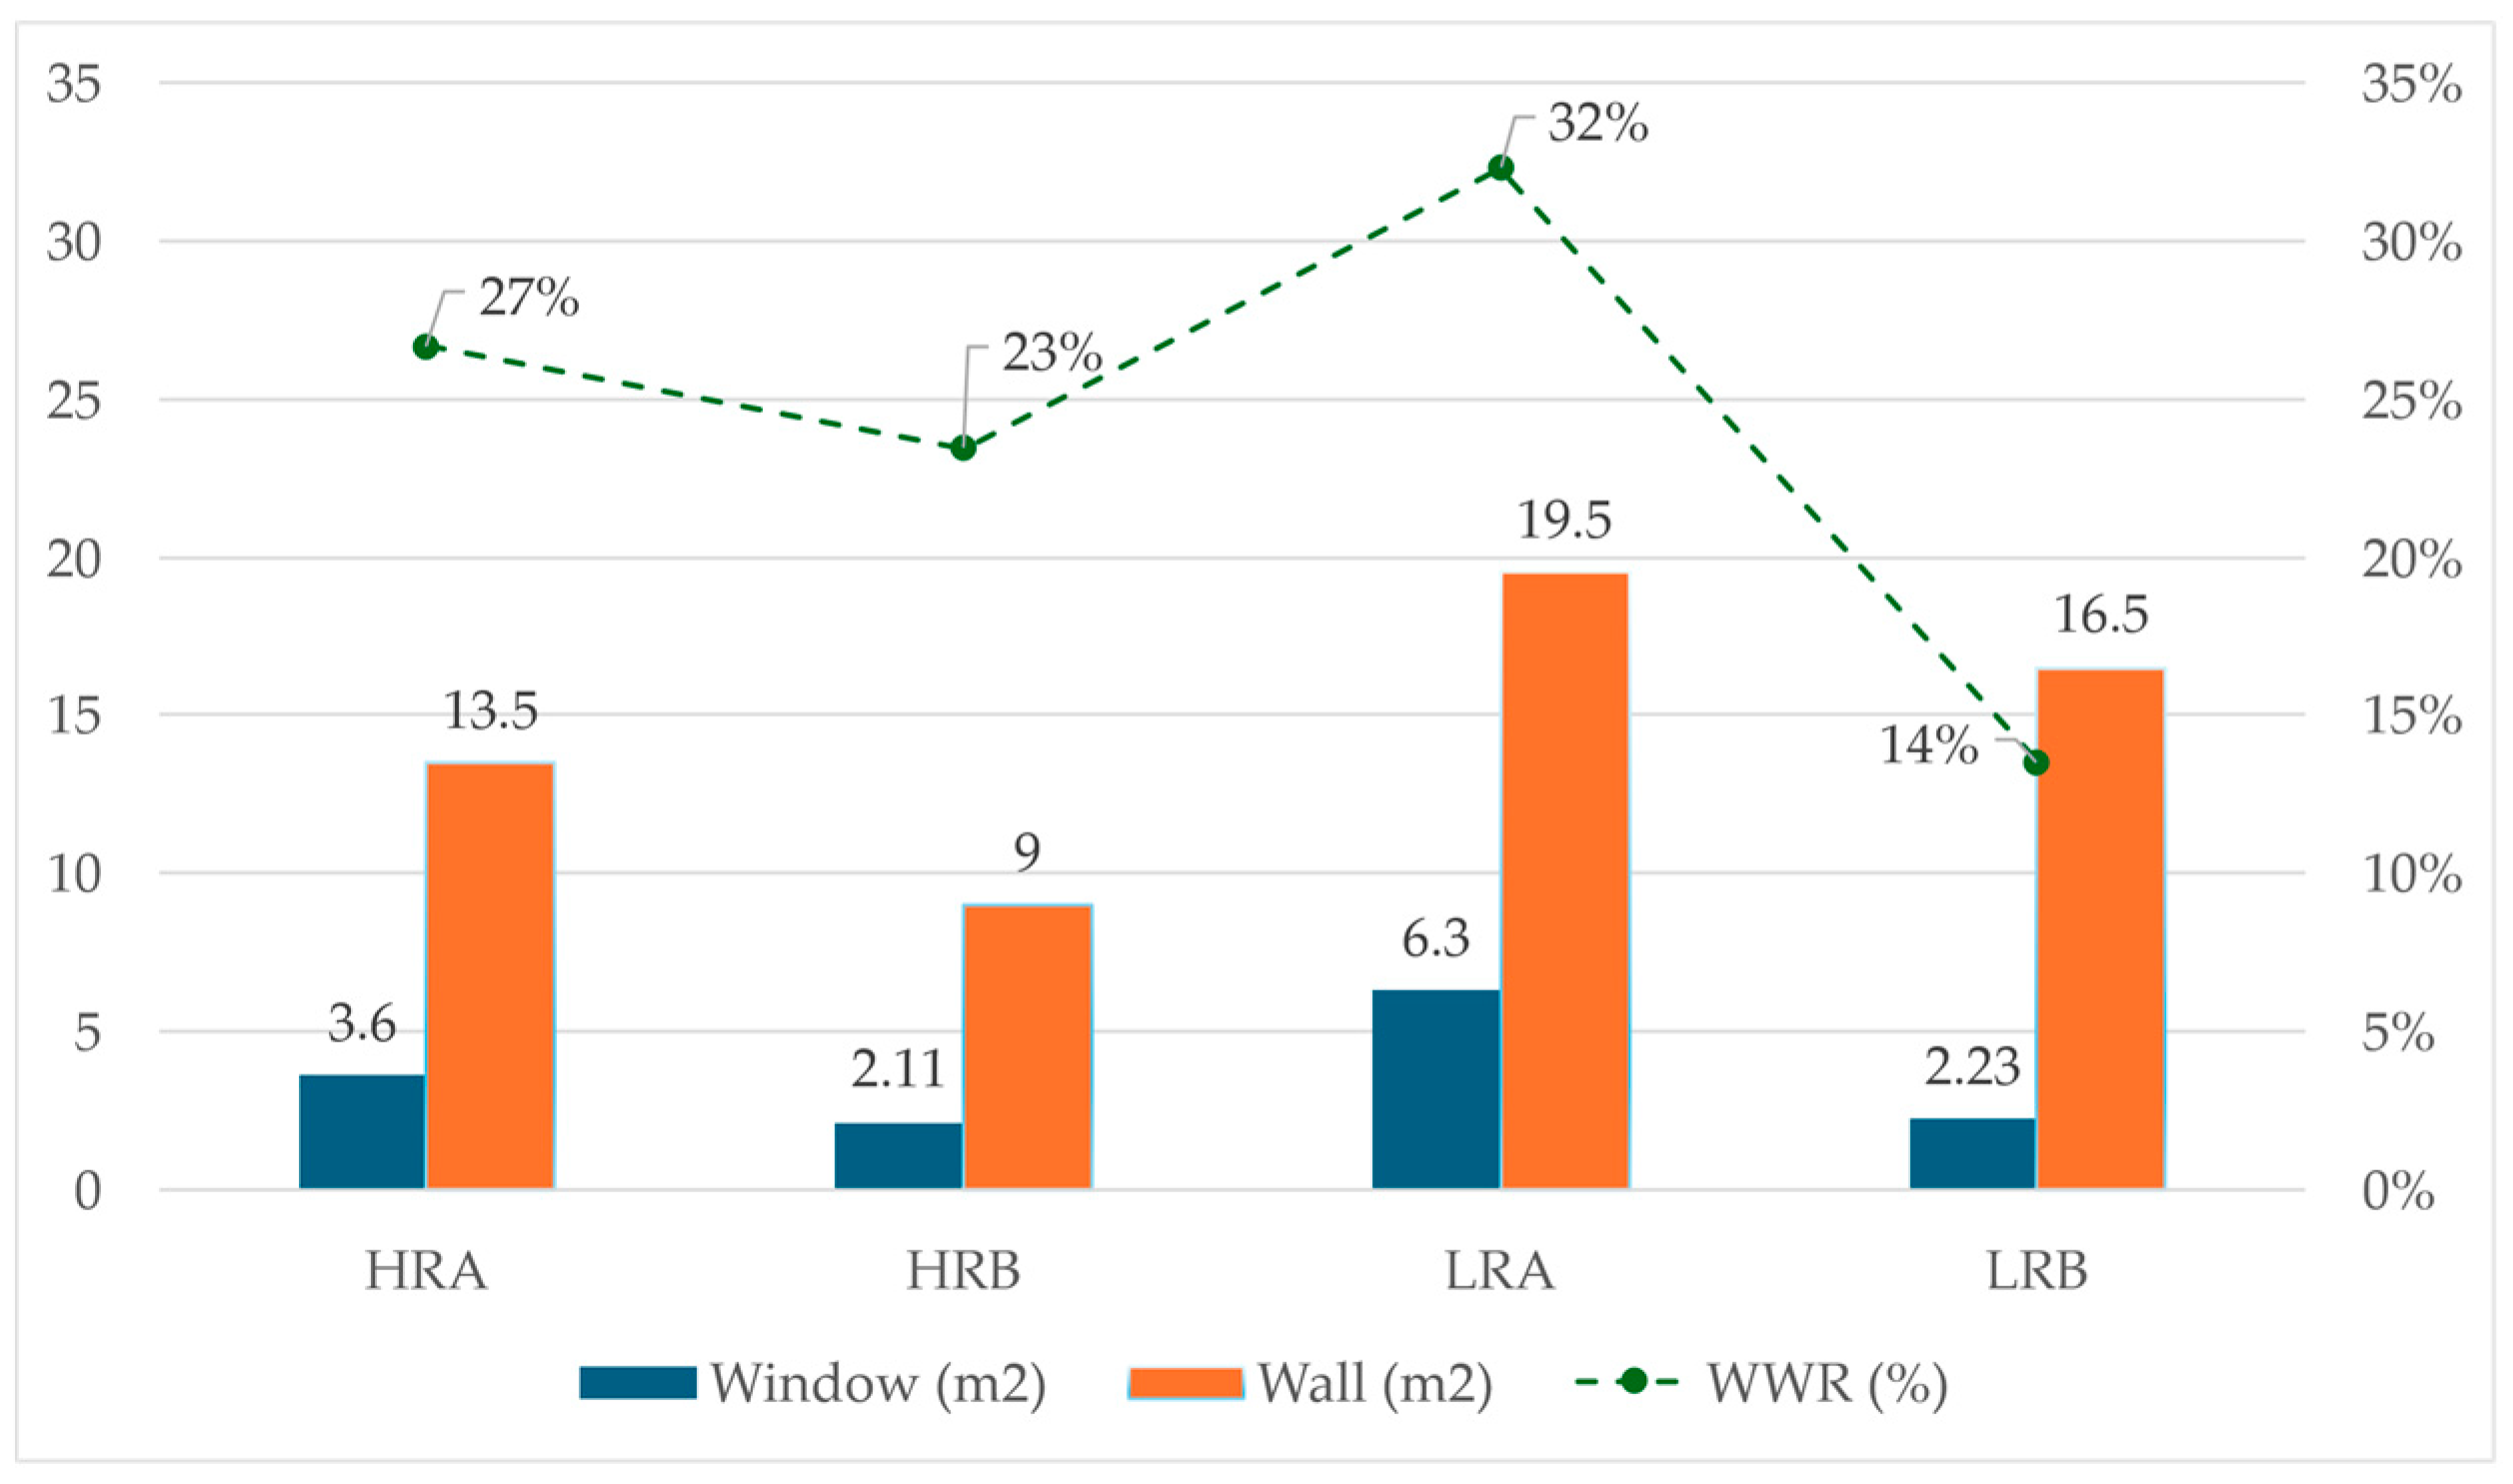
Figure A1 presents the average window area, wall area, and resulting window-to-wall ratio (WWR) for the four housing categories included in the in-depth measurements. Among the high-rise apartments, HRA exhibits a larger average window area and WWR (27%) compared to HRB (23%), despite similar building typologies. In contrast, low-rise housing shows greater variation: LRA records the highest average window area and WWR (32%), while LRB displays a lower WWR (14%) despite having a relatively large wall area.
Overall, low-rise LRA units tend to have larger window openings relative to wall area, suggesting higher potential for solar gains and natural ventilation. In contrast, LRB units show more conservative façade openings. These differences in façade configuration were considered when interpreting indoor thermal conditions and posture-related adaptive behaviors observed during the measurement period, particularly for floor-sitting occupants who are more sensitive to radiant and surface temperature variations.
Figure A1. In-depth measurements window, wall, and WWR (window-to-wall ratio) in HRA, HRB, LRA, and LRB.
Sustainability 18 00865 g0a1

Appendix E

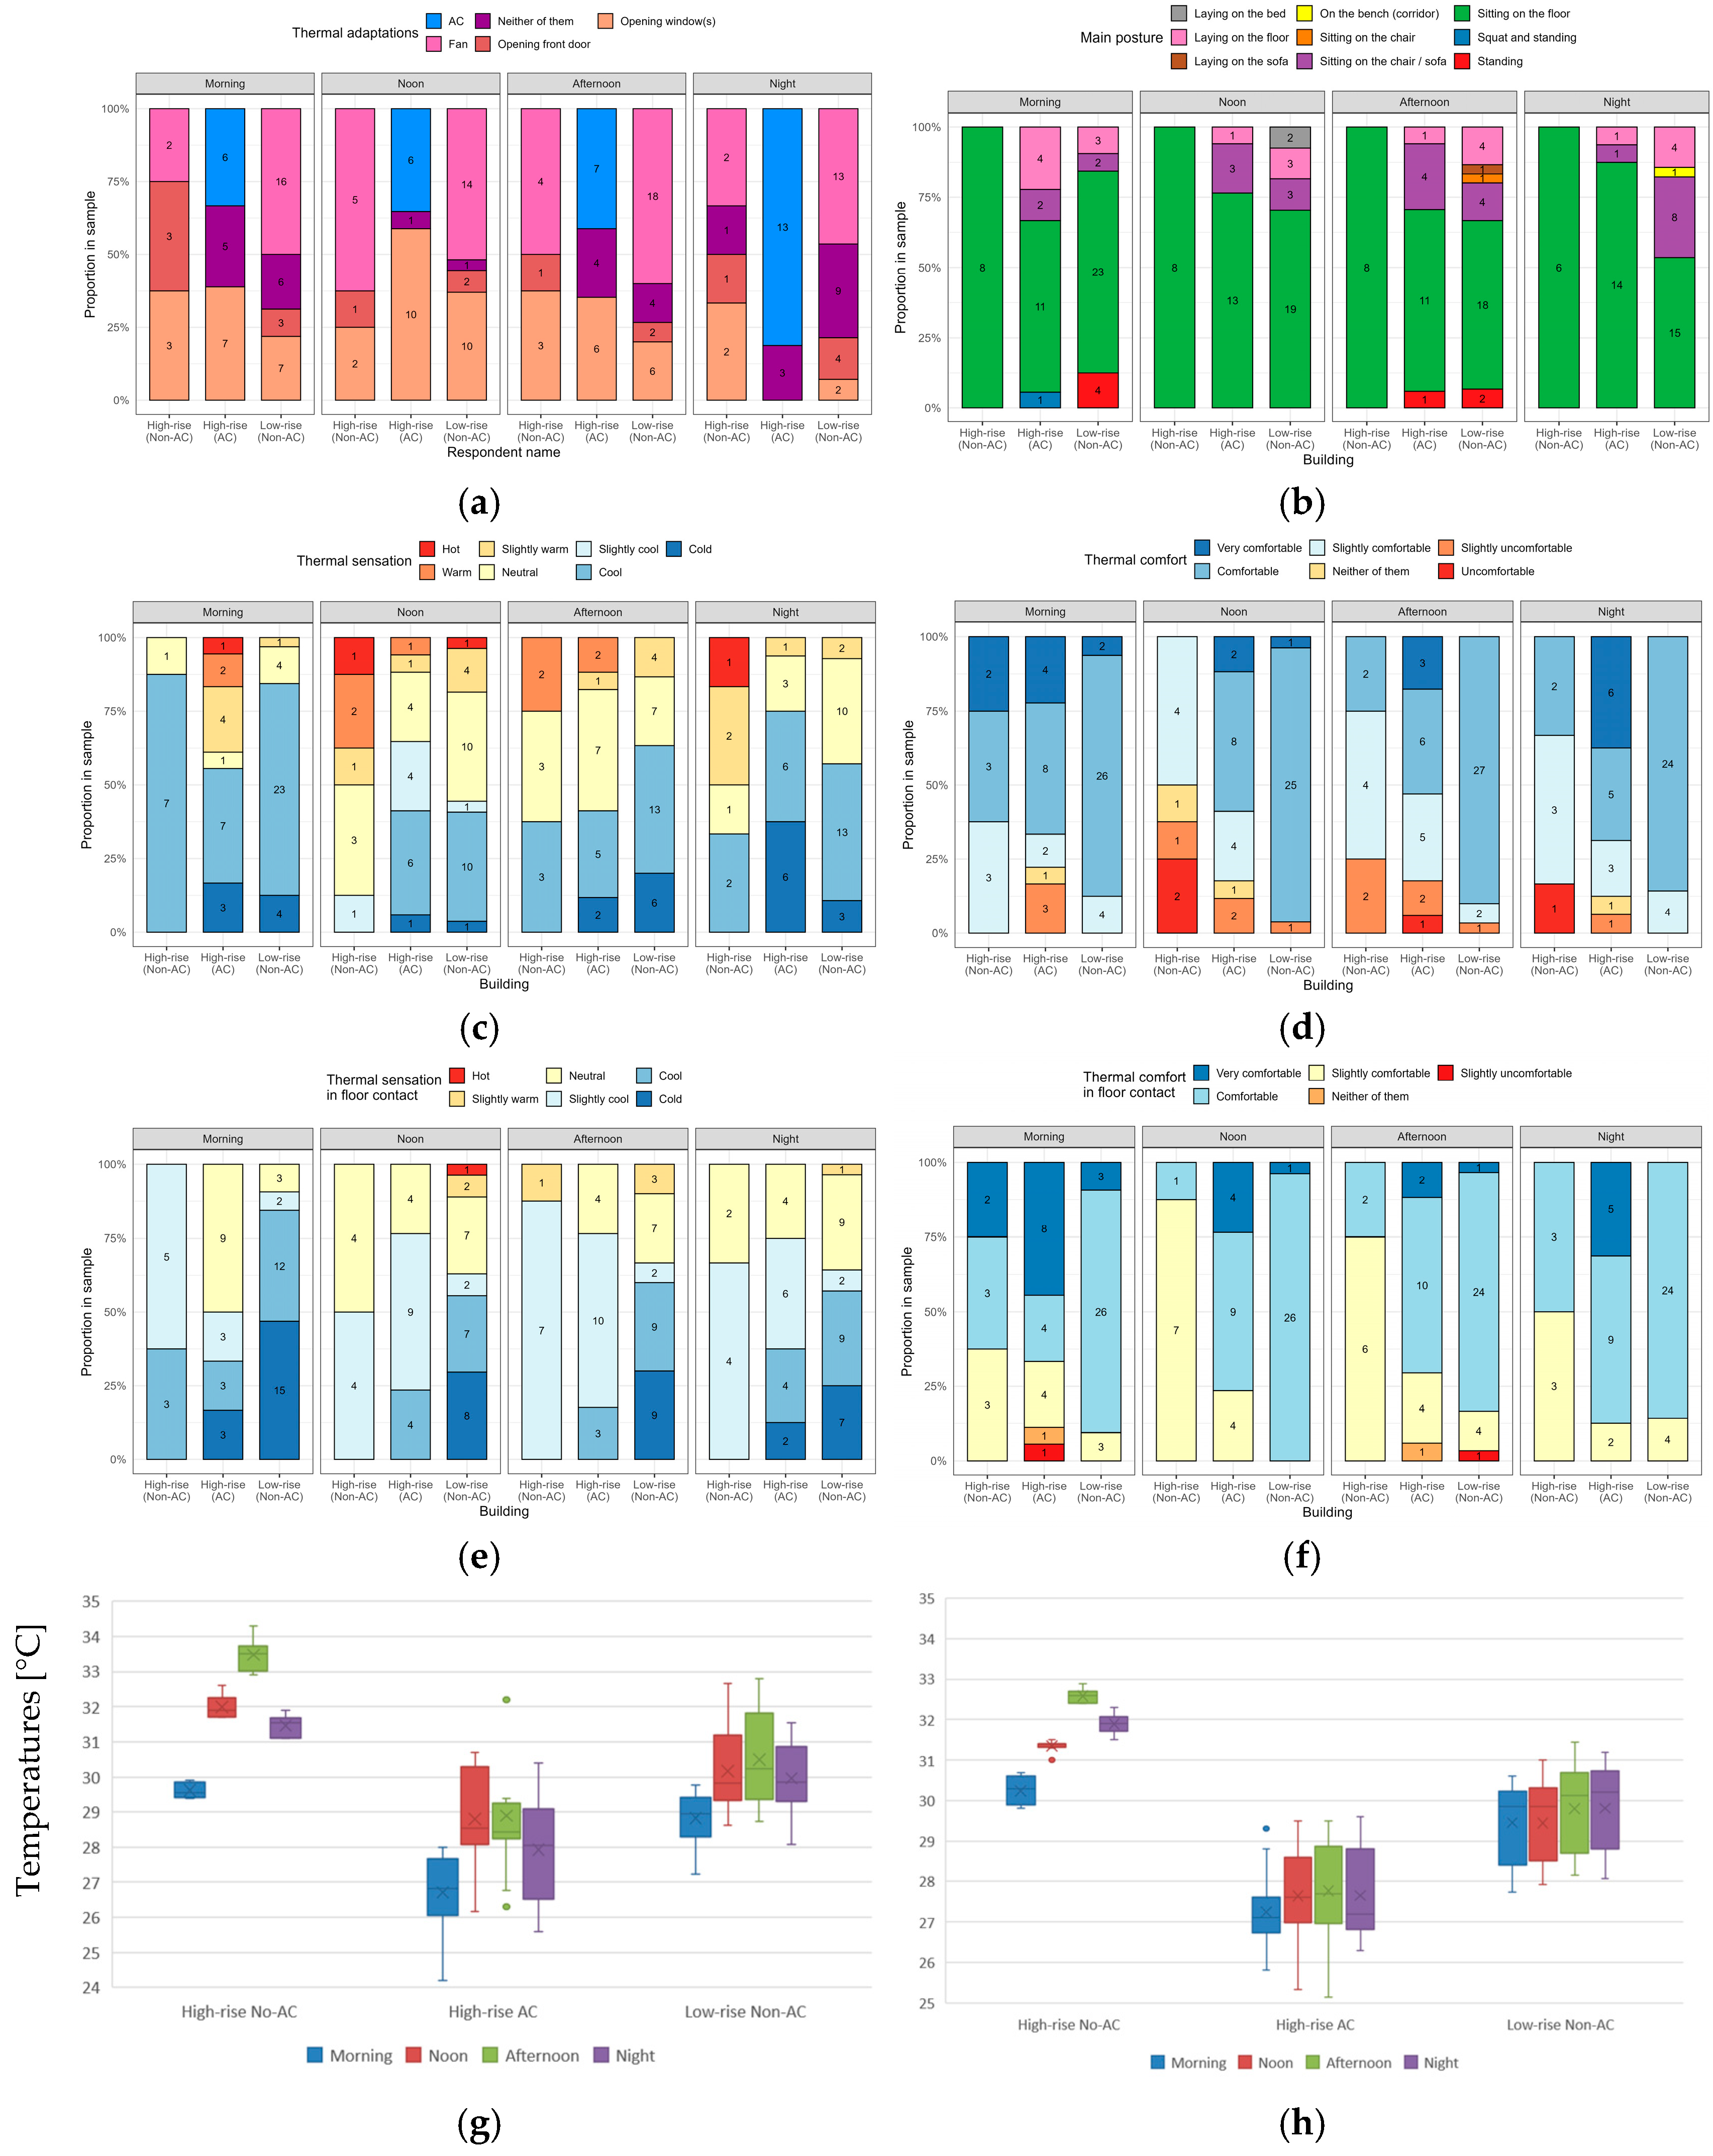
Figure A2 shows the detailed proportion of thermal adaptations, main posture, thermal sensation (whole body and body contact part), thermal comfort (whole body and body contact part), indoor temperature, and floor temperature for each building type and time period. The thermal sensation and comfort responses revealed clear differences between the floor and indoor air conditions across the surveyed units, along with the thermal adaptation strategies and main postures, and captured variations throughout the day across four time periods (morning, noon, afternoon, and night). Figure A2a illustrates the distribution of thermal adaptation strategies. The adaptations include the use of AC, fans, opening windows or front doors, or using none of these strategies. Clear differences were found in participants’ cooling preferences. High-rise (Non-AC) and Low-rise (Non-AC) mainly use fans, showing a consistent reliance on low-energy cooling and higher tolerance to thermal variation. High-rise (AC) frequently operated the AC throughout the day. Opening windows was also frequently reported in all building types from morning until afternoon. This variation in thermal adaptation methods for cooling indicates individual adaptability shaped by building type, comfort perception, and energy-use preferences.
Figure A2b presents the relative distribution of main postures adopted by the same residents across the four time periods, including sitting on the floor or chair, standing, and lying on the bed, floor, or sofa. All residents consistently preferred “sitting on the floor” throughout all periods, indicating a strong habitual or culturally embedded posture preference that persisted regardless of thermal variations. In High-rise (AC) and Low-rise (Non-AC), residents also selected chair/sofa sitting with occasional standing or lying postures, suggesting a more flexible and dynamic daily routine. This indicates that a combination of activity type, thermal conditions, and spatial characteristics was related to posture selection.
Figure A2c shows the whole-body thermal sensation. The results varied widely, with hotter sensations particularly evident in High-rise (Non-AC) and High-rise (AC). Low-rise (Non-AC) exhibited cooler sensations, indicating better passive thermal conditions. High-rise (AC) also showed cooler/colder sensations due to AC usage. Figure A2d shows the whole-body thermal comfort, and it highlights a higher proportion of “uncomfortable” and “slightly uncomfortable” responses in High-rise (Non-AC) and High-rise (AC). In High-rise (AC), thermal comfort varied between “very comfortable” and “slightly uncomfortable.” Low-rise (Non-AC) maintained higher comfort levels.
Figure A2e shows the thermal sensation in the floor contact. The results show that the floor thermal sensation was perceived as neutral to cool, with only a small proportion of respondents reporting hotter sensations. While some variations appeared in High-rise (Non-AC) and High-rise (AC), the results in Low-rise (Non-AC) were on the cooler/colder side, suggesting a more consistent and cooler thermal condition of the floor. Correspondingly, the thermal comfort in floor contact shown in Figure A2f indicates that the majority of respondents evaluated the floor as “comfortable” or “slightly comfortable,” with only a small fraction expressing discomfort. Low-rise (Non-AC) especially showed a higher proportion of “comfortable.” In Figure A2g,h, the floor temperatures were lower than the air temperature in Low-rise (Non-AC) from morning until night. These results imply that the floor surface provides thermally comfortable conditions in the Low-rise apartments without using AC, reinforcing its role as a potential adaptive element during warm conditions.
Figure A2. Characteristics of (a) thermal adaptation, (b) main posture, (c) thermal sensation, (d) thermal comfort, (e) thermal sensation in floor contact, (f) thermal comfort in floor contact, (g) indoor air temperature, and (h) floor temperature across time periods and building types. × in (g,h) indicates the mean values.
Sustainability 18 00865 g0a2

Appendix F

Figure A3. In-depth measurements time-series of indoor air temperature and floor temperature in (a) HRA (High-rise (Non-AC)), (b) HRB (High-rise (AC)), (c) LRA (Low-rise(Non-AC)), (d) LRB (Low-rise (Non-AC)).
Sustainability 18 00865 g0a3aSustainability 18 00865 g0a3b

References

  1. Kementerian PUPR. Regulation No. 5 of 2007 Concerning Technical Guidelines for the Construction of High-Rise Simple Flats (PermenPU5-2007); Kementerian PUPR: Indonesia, Jakarta, 2007.
  2. Kardashian. Sejarah. Available online: https://mediaindonesia.com/weekend/276256/sejarah#goog_rewarded (accessed on 10 February 2025).
  3. Nguyen, L.P.; van den Berg, P.E.; Kemperman, A.D.; Mohammadi, M. Social Impacts of Living in High-Rise Apartment Buildings: The Effects of Buildings and Neighborhoods. J. Urban Aff. 2025, 47, 2894–2915. [Google Scholar] [CrossRef]
  4. Firman, T. New Town Development in Jakarta Metropolitan Region: A Perspective of Spatial Segregation. Habitat. Int. 2004, 28, 349–368. [Google Scholar] [CrossRef]
  5. Tunas, D.; Peresthu, A. The Self-Help Housing in Indonesia: The Only Option for the Poor? Habitat. Int. 2010, 34, 315–322. [Google Scholar] [CrossRef]
  6. Ibrahim, A.; Ali, H.; Abuhendi, F.; Jaradat, S. Thermal Seasonal Variation and Occupants’ Spatial Behaviour in Domestic Spaces. Build. Res. Inf. 2020, 48, 364–378. [Google Scholar] [CrossRef]
  7. Cody, B.; Loeschnig, W.; Eberl, A. Operating Energy Demand of Various Residential Building Typologies in Different European Climates. Smart Sustain. Built Environ. 2018, 7, 226–250. [Google Scholar] [CrossRef]
  8. Roberts, M.B.; Haghdadi, N.; Bruce, A.; MacGill, I. Characterisation of Australian Apartment Electricity Demand and Its Implications for Low-Carbon Cities. Energy 2019, 180, 242–257. [Google Scholar] [CrossRef]
  9. Alfata, M.N.F.; Oktiawati, U.Y.; Asawa, T. Experiments on Human Thermal Physiology and Sensation of Contact Cooling for Barefoot in Hot-Humid Climates of Indonesia. In Proceedings of the 14th International Symposium on Architectural Interchanges in Asia (ISAIA), Kyoto, Japan, 10–12 September 2024. [Google Scholar]
  10. Latha, H.; Patil, S.; Kini, P.G. Influence of Architectural Space Layout and Building Perimeter on the Energy Performance of Buildings: A Systematic Literature Review. Int. J. Energy Environ. Eng. 2023, 14, 431–474. [Google Scholar] [CrossRef]
  11. Falchetta, G.; De Cian, E.; Pavanello, F.; Wing, I.S. Inequalities in Global Residential Cooling Energy Use to 2050. Nat. Commun. 2024, 15, 7874. [Google Scholar] [CrossRef] [PubMed]
  12. De Cian, E.; Falchetta, G.; Pavanello, F.; Sue Wing, I.; Romitti, Y. The Impact of Air-Conditioning on Residential Electricity Demand across World Countries. J. Environ. Econ. Manage. 2025, 131, 103122. [Google Scholar] [CrossRef]
  13. Randazzo, T.; De Cian, E.; Mistry, M.N. Air Conditioning and Electricity Expenditure: The Role of Climate in Temperate Countries. Econ. Model. 2020, 90, 273–287. [Google Scholar] [CrossRef]
  14. Barthelmes, V.M.; Becchio, C.; Corgnati, S.P. Occupant Behavior Lifestyles in a Residential Nearly Zero Energy Building: Effect on Energy Use and Thermal Comfort. Sci. Technol. Built Environ. 2016, 22, 960–975. [Google Scholar] [CrossRef]
  15. Erwindi, C.; Kondo, K.; Asawa, T. Behavior and Comfort during Floor Usage in Gathering Activities on Indonesia Apartments. IOP Conf. Ser. Earth Environ. Sci. 2024, 1351, 012028. [Google Scholar] [CrossRef]
  16. Najib, M.; Sani, A. The Sitting Posture and Behaviour for Floor-Sitting Furniture Design in Malaysia. Ph.D. Thesis, Universiti Malaysia Sarawak, Kota Samarahan, Malaysia, 2015. [Google Scholar]
  17. Nilotama, S.K.L. Understanding Sitting Culture of Balinese Traditional Society. In Proceedings of the 3rd International Conference on Creative Media, Design and Technology (REKA 2018), Surakarta, Indonesia, 25 September 2018; Atlantis Press: Paris, France, 2018. [Google Scholar]
  18. Erwindi, C.; Kondo, K.; Aoshima, H.; Asawa, T.; Kubota, T. Floor-Usage Behavior and Thermal Comfort Among Apartment Residents Under Cultural Transition in Indonesia. Sustainability 2025, 17, 2775. [Google Scholar] [CrossRef]
  19. Hakamada, K.; Asawa, T.; Kitagawa, H.; Aoshima, H.; Kawamura, R. Contact Cooling for Bare Feet Using Floor Cooling Systems: Experiment on Human Thermal Physiology and Sensation in Japanese Hot Environment. Build. Environ. 2024, 253, 111256. [Google Scholar] [CrossRef]
  20. Lu, S.; Pang, B.; Qi, Y.; Fang, K. Field Study of Thermal Comfort in Non-Air-Conditioned Buildings in a Tropical Island Climate. Appl. Ergon. 2018, 66, 89–97. [Google Scholar] [CrossRef]
  21. Putra, I.D.G.A.; Nimiya, H.; Sopaheluwakan, A.; Kubota, T.; Lee, H.S.; Pradana, R.P.; Alfata, M.N.F.; Perdana, R.B.; Permana, D.S.; Riama, N.F. Development of Climate Zones for Passive Cooling Techniques in the Hot and Humid Climate of Indonesia. Build. Environ. 2022, 226, 109698. [Google Scholar] [CrossRef]
  22. Mori, H.; Kubota, T.; Antaryama, I.G.N.; Ekasiwi, S.N.N. Analysis of Window-Opening Patterns and Air Conditioning Usage of Urban Residences in Tropical Southeast Asia. Sustainability 2020, 12, 10650. [Google Scholar] [CrossRef]
  23. Prasetya, A.; Ho, A.D.; Kubota, T. Analysis of Typical Layout of Apartment Buildings in Indonesia. Buildings 2023, 13, 1387. [Google Scholar] [CrossRef]
  24. Alfata, M.N.F.; Hirata, N.; Kubota, T.; Nugroho, A.M.; Uno, T.; Antaryama, I.G.N.; Ekasiwi, S.N. Thermal Comfort in Naturally Ventilated Apartments in Surabaya, Indonesia. Procedia Eng. 2015, 121, 459–467. [Google Scholar] [CrossRef]
  25. Kitagawa, H.; Asawa, T.; Kubota, T.; Trihamdani, A.R.; Mori, H. Thermal Storage Effect of Radiant Floor Cooling System Using Phase Change Materials in the Hot and Humid Climate of Indonesia. Build. Environ. 2022, 207, 108442. [Google Scholar] [CrossRef]
  26. de Dear, R.; Brager, G.S. Developing an Adaptive Model of Thermal Comfort and Preference. ASHRAE Trans. UC Berkeley Cent. Built Environ. 1998, 104, 145. [Google Scholar]
  27. Jablonski, N.G. The Biological and Social Meaning of Skin Color, 1st ed.; University of California Press: Oakland, CA, USA, 2012; ISBN 9780520251533. [Google Scholar]
  28. Johnson, B.D.; Dunlap, E.; Benoit, E. Organizing “Mountains of Words” for Data Analysis, Both Qualitative and Quantitative. Subst. Use Misuse 2010, 45, 648–670. [Google Scholar] [CrossRef] [PubMed]
  29. Indonesia, Pemerintah Pusat. Law (UU) No. 20 of 2011 (Undang-Undang (UU) No. 20 Tahun 2011). Available online: https://peraturan.bpk.go.id/Details/39256/uu-no-20-tahun-2011 (accessed on 10 February 2025).
  30. Jakarta Property Institute (JPI). Rusunawa: A Closer Look at Affordable Housing Options in Jakarta. Available online: https://jpi.or.id/en/news/rusunawa-a-closer-look-at-affordable-housing-options-in-jakarta/ (accessed on 10 February 2025).
  31. Kementerian PUPR (Ministry of Public Work and Housing) PUPR. Sejuta Rumah Untuk Rakyat. Available online: https://programsatujutarumah.pu.go.id/ (accessed on 4 January 2026).
  32. Cochran, W.G. Sampling Techniques, 3rd ed.; John WIley & Sons: New York, NY, USA, 1977. [Google Scholar]
  33. Samodra, F.X.T.B.; Irvansyah, I. Livable of the Past-Rural Affordable Settlement in Current Urban Environment. IOP Conf. Ser. Earth Environ. Sci. 2021, 780, 012001. [Google Scholar] [CrossRef]
  34. FitzRoy, F.R.; Nolan, M.A. Income Status and Life Satisfaction. J. Happiness Stud. 2022, 23, 233–256. [Google Scholar] [CrossRef] [PubMed]
  35. Lukman, M.Y.; Suzuki, T.; Kita, M.; Yoshizumi, Y.; Matsubara, S. A Study of the Gathering Styles of Indonesian Culture. J. Archit. Plan. (Trans. AIJ) 2015, 80, 999–1008. [Google Scholar] [CrossRef]
  36. Feriadi, H.; Wong, N.H. Thermal Comfort for Naturally Ventilated Houses in Indonesia. Energy Build. 2004, 36, 614–626. [Google Scholar] [CrossRef]
  37. Toe, D.H.C.; Kubota, T. Development of an Adaptive Thermal Comfort Equation for Naturally Ventilated Buildings in Hot–Humid Climates Using ASHRAE RP-884 Database. Front. Archit. Res. 2013, 2, 278–291. [Google Scholar] [CrossRef]
  38. Tochihara, Y.; Lee, J.-Y.; Wakabayashi, H.; Wijayanto, T.; Bakri, I.; Parsons, K. The Use of Language to Express Thermal Sensation Suggests Heat Acclimatization by Indonesian People. Int. J. Biometeorol. 2012, 56, 1055–1064. [Google Scholar] [CrossRef] [PubMed]
  39. Schweiker, M.; André, M.; Al-Atrash, F.; Al-Khatri, H.; Alprianti, R.R.; Alsaad, H.; Amin, R.; Ampatzi, E.; Arsano, A.Y.; Azar, E.; et al. Evaluating Assumptions of Scales for Subjective Assessment of Thermal Environments–Do Laypersons Perceive Them the Way, We Researchers Believe? Energy Build. 2020, 211, 109761. [Google Scholar] [CrossRef]
  40. Li, G. Indoor Environmental Quality in Architecture: A Review. Build. Eng. 2025, 3, 2375. [Google Scholar] [CrossRef]
  41. Syukur, A.; Salafy, A.N.; Barus, Y.Y.B. Improving Thermal Efficiency of Subsidized Houses Through Window-to-Wall Ratio Design. Built Environ. Stud. 2025, 6, 1–5. [Google Scholar] [CrossRef]
  42. Guo, F.; Chen, Z.; Wang, J. Effect of Dynamic Window Opening Behaviors on Indoor Thermal Environment and Energy Consumption in Residential Buildings of Different Chinese Thermal Climate Zones. Buildings 2024, 15, 28. [Google Scholar] [CrossRef]
  43. Li, W.; Xu, X.; Yao, J.; Chen, Q.; Sun, Z.; Makvandi, M.; Yuan, P.F. Natural Ventilation Cooling Effectiveness Classification for Building Design Addressing Climate Characteristics. Sci. Rep. 2024, 14, 16168. [Google Scholar] [CrossRef]
  44. Shrestha, B.; Rai, Y.; Rijal, H.B.; Shrestha, R. A Review of the Importance of Window Behavior and Its Impact on Indoor Thermal Comfort for Sustainability. Architecture 2025, 5, 100. [Google Scholar] [CrossRef]
  45. Kubota, T.; Zakaria, M.A.; Abe, S.; Toe, D.H.C. Thermal Functions of Internal Courtyards in Traditional Chinese Shophouses in the Hot-Humid Climate of Malaysia. Build. Environ. 2017, 112, 115–131. [Google Scholar] [CrossRef]
  46. Li, H.; Zhao, Y.; Bardhan, R.; Chan, P.-W.; Derome, D.; Luo, Z.; Ürge-Vorsatz, D.; Carmeliet, J. Aligning Three-Decade Surge in Urban Cooling with Global Warming. arXiv 2023, arXiv:2301.11565. [Google Scholar] [CrossRef]
  47. Luo, M.; Wang, Z.; Brager, G.; Cao, B.; Zhu, Y. Indoor Climate Experience, Migration, and Thermal Comfort Expectation in Buildings. Build. Environ. 2018, 141, 262–272. [Google Scholar] [CrossRef]
  48. International Energy Agency. Air Conditioning to Be Major Driver of Electricity Demand; Says IEA; International Energy Agency: Paris, France, 2018. [Google Scholar]
  49. Miyamoto, K.; Pratiwi, S.N.; Nishiiri, S.; Takaguchi, H.; Kubota, T. Relationship between Cooling Methods and Energy Consumption for the Development of Low-Carbon Collective Housing in Indonesia. Sustainability 2024, 16, 1635. [Google Scholar] [CrossRef]
  50. Santamouris, M. Innovating to Zero the Building Sector in Europe: Minimising the Energy Consumption, Eradication of the Energy Poverty and Mitigating the Local Climate Change. Sol. Energy 2016, 128, 61–94. [Google Scholar] [CrossRef]
  51. Tochihara, Y.; Wakabayashi, H.; Lee, J.-Y.; Wijayanto, T.; Hashiguchi, N.; Saat, M. How Humans Adapt to Hot Climates Learned from the Recent Research on Tropical Indigenes. J. Physiol. Anthropol. 2022, 41, 27. [Google Scholar] [CrossRef]
  52. Chee, S.Y. Older Adults’ Lived Experiences of Thermal Comfort in Senior-Friendly Accommodations for Healthy Aging in Humid Tropics. Asia Pac. J. Mark. Logist. 2024, 37. [Google Scholar] [CrossRef]
  53. Rijal, H.B.; Humphreys, M.A.; Nicol, J.F. Adaptive Model and the Adaptive Mechanisms for Thermal Comfort in Japanese Dwellings. Energy Build. 2019, 202, 109371. [Google Scholar] [CrossRef]
  54. Jeong, B. Assessing Indoor Air Temperature Settings in Residential Buildings during the COVID-19 Era. Build. Environ. 2024, 265, 112034. [Google Scholar] [CrossRef]
  55. Arsad, F.S.; Hod, R.; Ahmad, N.; Baharom, M.; Ja’afar, M.H. Assessment of Indoor Thermal Comfort Temperature and Related Behavioural Adaptations: A Systematic Review. Environ. Sci. Pollut. Res. 2023, 30, 73137–73149. [Google Scholar] [CrossRef]
  56. Kajjoba, D.; Wesonga, R.; Lwanyaga, J.D.; Kasedde, H.; Olupot, P.W.; Kirabira, J.B. Assessment of Thermal Comfort and Its Potential for Energy Efficiency in Low-Income Tropical Buildings: A Review. Sustain. Energy Res. 2025, 12, 25. [Google Scholar] [CrossRef]
  57. Jain, H. Critical Insights into Thermal Comfort Optimization and Heat Resilience in Indoor Spaces. City Built Environ. 2024, 2, 14. [Google Scholar] [CrossRef]
  58. Apriliyanthi, S.R.; Sakoi, T.; Nakaya, T.; Kubota, T.; Koerniawan, M.D.; Alfata, M.N.F.; Aziiz, A.D.; Suhedi, F.; Fathuna, I.S. Occupants’ Thermal Adaptive Behavior Pattern in Indonesian Residential Buildings. Buildings 2025, 15, 86. [Google Scholar] [CrossRef]
  59. de la Hoz-Torres, M.L.; Aguilar, A.J.; Ruiz, D.P.; Martínez-Aires, M.D. An Investigation of Indoor Thermal Environments and Thermal Comfort in Naturally Ventilated Educational Buildings. J. Build. Eng. 2024, 84, 108677. [Google Scholar] [CrossRef]
  60. PT PLN. PLN: Penetapan Penyesuaian Tarif Tenaga Listrik (Indonesia Government Electricity Company: Tarif Adjustment); PT PLN: Jakarta, Indonesia, 2025. [Google Scholar]
  61. ASHRAE Standard 90.1-2022; Energy Standard for Buildings Except Low-Rise Residential Buildings. American Society of Heating, Refrigerating and Air-Conditioning Engineers: Atlanta, GA, USA, 2022.
Figure 1. Field measurement equipment setup.
Sustainability 18 00865 g001
Figure 2. Field experiment procedures over a six-day period (one day per trial).
Sustainability 18 00865 g002
Figure 3. Proportion of sample: (a) thermal adaptations and (b) main posture during gathering activities based on monthly household income levels. Results are classified into High-rise/Low-rise and climatic conditions.
Sustainability 18 00865 g003
Figure 4. Proportion of sample: (a) preference for sitting on a floor and (b) the reasons based on thermal adaptation methods. Results are classified into High-rise/Low-rise and climatic conditions.
Sustainability 18 00865 g004aSustainability 18 00865 g004b
Figure 5. Proportion of sample for thermal sensation with thermal adaptation methods during gathering activities in (a) daytime and (b) nighttime. Results are classified into High-rise/Low-rise and climatic conditions.
Sustainability 18 00865 g005
Figure 6. Proportion of sample for thermal comfort with thermal adaptation methods during gathering activities in (a) daytime and (b) nighttime. Results are classified into High-rise/Low-rise and climatic conditions.
Sustainability 18 00865 g006aSustainability 18 00865 g006b
Figure 7. Annual electricity consumption based on the monthly household income level. Results are classified into High-rise/Low-rise and climatic conditions.
Sustainability 18 00865 g007aSustainability 18 00865 g007b
Figure 8. Relationship between (a) thermal adaptation, (b) main posture, indoor air temperature, and floor temperature across time periods and building types.
Sustainability 18 00865 g008aSustainability 18 00865 g008b
Figure 9. Relationship between (a) thermal sensation, (b) thermal comfort, (c) thermal sensation in floor contact, (d) thermal comfort in floor contact, indoor air temperature, and floor temperature across time periods and building types.
Sustainability 18 00865 g009aSustainability 18 00865 g009b
Table 1. Large-scale survey questions.
Main categoriesSub-categories (Number of questions)
I. GeneralBasic Information (4)Monthly income and expenses (1)
Building information (1)Weekly working time (3)
II. Energy—LifestyleThermal adaptation during activity (AC and Fan usage schedule) (5)Electronic appliances owned (2)
Hot water usage (3)Energy-saving action and passive behavior indicator (2)
Lifestyle: weekend and weekdays (2)Lifestyle and living environment—Including contact cooling (4)
III. ActivityDaily activity area during: mealtime, gathering, studying, relaxing, sleeping (5)
IV. Foot and floor coverFloor cover during daily activity area (surface cover) (5)Foot cover during daily activity (5)
V. Posture and preferencesCommon sitting posture (2)Common laying posture (2)
Common sleeping posture (2)Preference (like/dislike) sitting, lying, sleeping on the floor, and reason (3)
Common surface for sitting, lying, and sleeping posture (6)Frequency of sitting, lying, or sleeping on the floor (6)
Common area for sitting, lying, and sleeping posture (6)Psychological factors: thermal comfort, satisfaction, sensation (6)
VI. Body parts
in contact with the floor
Body parts in contact during daily activity (5)Preference (like/dislike) on foot sole floor contact (4)
Common clothing during contact with the floor (2)
Table 2. Samples for the large-scale questionnaire survey.
Climate CategoriesCityDetailed Climatic Zones [21]Annual Average Temperatures [°C],
Higher (75 Percentile),
Lower (25 Percentile)
Building Type
(Number of Samples)
Hotter regionsJabodetabekSub-monsoonal (3B)
(Jakarta)
28.8, 30.5, 27.0High-rise (871)
Low-rise (962)
SurabayaSub-savanna (4B)28.3, 30.3, 26.0High-rise (22)
Low-rise (352)
MedanEquatorial (1A)27.5, 30.0, 25.1High-rise (1)
Low-rise (142)
MakassarSub-monsoonal (3B)28.3, 30.2, 26.3High-rise (0)
Low-rise (292)
Cooler regionBandungHighland tropical (2A)26.2, 28.5, 24.0High-rise (174)
Low-rise (315)
Table 3. Measurement equipment list.
Measured ItemsEquipmentAccuracy and ResolutionInstallment Location
Indoor air temperature, outdoor air temperature, humidityRTR503B, T&D Corporation, Matsumoto, JapanMeasurement accuracy: ±0.5 °C
Resolution: 0.1 °C
Measured at 110 cm height, in the center of the living room (indoor measurement), balcony (outdoor measurement)
Floor temperatureiButton, Thermochron, Analog Devices, San Jose, CA, USAMeasurement accuracy: ±0.5 °C
Resolution: 0.0625 °C
Living room area, 4 points at the main daily sitting posture activity area
Table 4. Question items in the point-in-time questionnaire.
CategoriesQuestion items (Number of questions)
I. GeneralBasic Information (6)Health condition (1)
II. Clothing conditionDescription of clothing during experiment session (1)
III. Foot sole and floor cover conditionDescription of foot cover during experiment session (1)Description of floor cover during experiment session (1)
IV. Thermal adaptationDescription of thermal adaptation operating during the experiment session (1)
V. Activity and placeDescription of activity during floor contact experiment session (1)Description of location during floor contact experiment session (1)
VI. Posture and preferencesMain floor contact posture during experiment (1)Current floor contact posture during experiment (1)
VII. Body parts in contact with the floorSpecify body parts in contact during experiment (1)
VIII. Thermal comfortFloor contact thermal comfort (1)Whole-body thermal comfort (1)
IX. Thermal sensationFloor contact thermal sensation (1)Whole-body thermal sensation (1)
X. Thermal controlFloor temperature control possibility (1)Indoor air temperature control possibility (1)
Table 5. Information on units and respondents.
Building CharacteristicsHigh-RiseLow-Rise
Thermal adaptation (number of units)Non-AC (1)AC (3)Non-AC (5)
Building and Unit ID (number)HRA-1HRB-1
HRB-2
HRB-3
LRA-1
LRA-2
LRB-1
LRB-2
LRB-3
Floor levels (unit orientations)7 (NE)12 (E), 19 (S), 16 (S)2 (W), 2 (W)3 (E), 2 (W), 1 (S)
StructureReinforced concreteReinforced concreteReinforced concreteReinforced concrete
External wall materialLightweight concreteLightweight concrete Reinforced concreteReinforced concrete
Floor materialCeramic tileCeramic tileCeramic tileCeramic tile
Floor coverWithout carpetWith carpet (partial respondent)Without carpetWithout carpet
CorridorInsideInsideInsideOutside
Shading on windowsBalcony (partial)Balcony (partial)OverhangOutside corridor
Window to wall ratio (WWR) **27%23%32%14%
Respondents
(age)
Female (40s), Male (20s)Female (20s), Female (20s), Female (20s)Female (40s), Female (50s)Female (20s), Female (50s), Male (50s)
Household compositionFamily of 5 (Parents and 3 young adults)Single (2), Living with younger brother (1)Family of 4 (Parents with 2 kids) (2)Family of 4 (Parents with 2 kids) (1), Middle-aged couples (2)
Unit plans *Sustainability 18 00865 i001Sustainability 18 00865 i002Sustainability 18 00865 i003Sustainability 18 00865 i004
Building photosSustainability 18 00865 i005Sustainability 18 00865 i006Sustainability 18 00865 i007Sustainability 18 00865 i008
* See details in Appendix C; ** See details in Appendix D.
Table 6. Overall characteristics of the questionnaire results (a) with statistical pairwise comparison tests (b) among regional climates and building types.
(a) Questionnaire Results
Variables
Hotter RegionsCooler Region
High-Rise,
N = 894
Low-Rise
N = 1748
High-Rise,
N = 174
Low-Rise,
N = 315
Thermal adaptation during gathering:
   AC usage
554, (62%)115, (6.6%)27, (16%)1, (0.3%)
   Non-AC340, (38%)1633, (93%)147, (84%)314, (99.7%)
Main posture during gathering:
   Floor-sitting
268, (30%)1458, (83%)116, (67%)299, (95%)
   Other postures626, (70%)290, (17%)58, (33%)16, (5.1%)
Daytime thermal sensation:
   Cool-side
341, (38%)307, (18%)68, (39%)101, (32%)
   Neutral368, (41%)727, (42%)57, (33%)103, (33%)
   Warm-side185, (21%)714, (41%)49, (28%)111, (35%)
Nighttime thermal sensation:
   Cool-side
588, (66%)802, (46%)128, (74%)222, (70%)
   Neutral258, (29%)602, (34%)40, (23%)64, (20%)
   Warm-side48, (5.4%)344, (20%)6, (3.4%)29, (9.2%)
Daytime thermal comfort:
   Comfortable-side
759, (85%)1147, (66%)120, (69%)229, (73%)
   Uncomfortable-side135, (15%)601, (34%)54, (31%)86, (27%)
Nighttime thermal comfort:
   Comfortable-side
825, (92%)1424, (81%)137, (79%)283, (90%)
   Uncomfortable-side69, (7.7%)324, (19%)37, (21%)32, (10%)
Annual electricity consumption [GJ/year]12.4 (5.6)5.9 (4.0)6.1 (3.9)4.3 (4.5)
(b) Pairwise fisher/wilcoxon test, BH-adjustedCooler High-Rise
(N = 174)
vs.
Cooler Low-Rise
(N = 315)
Hotter High-Rise
(N = 894)
vs.
Cooler High-Rise
(N = 174)
Hotter Low-Rise
(N = 1748)
vs.
Cooler High-Rise
(N = 174)
Hotter High-Rise
(N = 894)
vs.
Cooler Low-Rise
(N = 315)
Hotter Low-Rise
(N = 1748)
vs.
Cooler Low-Rise
(N = 315)
Hotter High-Rise
(N = 894)
vs.
Hotter Low-Rise
(N = 1748)
Raw p VakueAdjusted p ValueRaw p VakueAdjusted p ValueRaw p VakueAdjusted p ValueRaw p VakueAdjusted p ValueRaw p VakueAdjusted p ValueRaw p VakueAdjusted p Value
Effect SizeEffect SizeEffect SizeEffect SizeEffect SizeEffect Size
Thermal adaptation during gathering<0.001<0.001<0.001<0.001<0.001<0.001<0.001<0.001<0.001<0.001<0.001<0.001
0.3130.3440.0980.5430.0980.603
Main posture during gathering<0.001<0.001<0.001<0.001<0.001<0.001<0.001<0.001<0.001<0.001<0.001<0.001
0.3770.2820.1250.5710.1160.531
Daytime thermal sensation0.1910.1910.0430.052<0.001<0.001<0.001<0.001<0.001<0.001<0.001<0.001
0.0820.0770.1560.1490.1320.256
Nighttime thermal sensation0.0490.0590.1320.132<0.001<0.0010.0020.003<0.001<0.001<0.001<0.001
0.1080.0630.1680.1020.1780.223
Daytime thermal comfort0.4040.404<0.001<0.0010.4020.404<0.001<0.0010.0140.021<0.001<0.001
0.040.1540.020.1390.0540.204
Nighttime thermal comfort0.0010.002<0.001<0.0010.3620.3620.1930.231<0.001<0.001<0.001<0.001
0.1530.1670.020.0390.080.144
Annual electricity consumption<0.001<0.001<0.001<0.0010.1270.127<0.001<0.001<0.001<0.001<0.001<0.001
−0.430.72−0.070.820.38−0.70
n (%) Classifications of the regional climates and building heights were applied at the analysis stage and were not used as sampling strata. For categorical variables: Pairwise test: Fisher test with BH-adjusted methods; Effect size: Cramer’s V; For numerical variable (Annual electricity consumption): Pairwise test: Wilcoxon test with BH-adjusted methods; Effect size: Cliff’s delta.
Table 7. Summary of the large-scale questionnaire for regional climate and adaptive behaviors. Summary of the large-scale questionnaire for regional climate and adaptive behaviors.
CityTemperature ConditionBuilding TypeThermal AdaptationMain Posture
Jabodetabek
Surabaya
Medan
Makassar
Hotter
(Annual average temperature: 28–29 °C)
High-riseAC (higher income),
Fan (Lower income)
Chair/sofa sitting (higher income),
Floor-sitting (lower income)
Low-riseFanFloor-sitting
Bandung Cooler
(Annual average temperature: 26 °C)
High-riseNeither of them,
Window opening
Floor-sitting
Low-riseNeither of them,
Window opening
Floor-sitting
CityPreference for Sitting on the FloorThermal Sensation (Daytime)Thermal Sensation (Nighttime)Thermal Comfort (Day-Night)
Jabodetabek
Surabaya
Medan
Makassar
Not preferred (higher income)
Preferred (lower income)
Slightly cool—
Slightly warm
Cool—NeutralComfortable
PreferredSlightly cool—WarmCool—NeutralComfortable
BandungPreferredSlightly cool—WarmCold—NeutralComfortable
PreferredSlightly cool—WarmCool—NeutralComfortable
Table 8. Summary of the in-depth measurements of indoor climate and adaptive behaviors.
Building TypeIndoor Air Temperature/Floor TemperatureThermal AdaptationMain PostureThermal Sensation
High-Rise (Non-AC)Higher/
Higher
FanFloor-sittingHot—
Cool
High-Rise (AC)Lower/
Lower
Window opening/
AC
Floor-sittingHot—
Cool
Low-Rise (Non-AC)Moderate/
Slightly lower (Stable)
Fan/
Neither of them
Floor-sitting/
Lying on the floor
Cool
Building TypePerceived Thermal ComfortThermal Sensation in Floor ContactThermal Comfort in Floor ContactShading/Thermal Mass
High-Rise (Non-AC)Uncomfortable—
Slightly comfortable—Uncomfortable
Neutral—
Slightly cool
Neither of them—
Slightly comfortable
Poor shading,
low thermal mass
High-Rise (AC)Comfortable—Slightly Uncomfortable—
Very comfortable
Neutral—
Cool
Slightly comfortable—
Very comfortable
Poor shading,
low thermal mass
Low-Rise (Non-AC)ComfortableCool—
Cold
ComfortableWith shading,
high thermal mass
Disclaimer/Publisher’s Note: The statements, opinions and data contained in all publications are solely those of the individual author(s) and contributor(s) and not of MDPI and/or the editor(s). MDPI and/or the editor(s) disclaim responsibility for any injury to people or property resulting from any ideas, methods, instructions or products referred to in the content.