1. Introduction
The global commitment to achieving Sustainable Development Goal 4 (SDG4) by 2030 represents an unprecedented collective effort to ensure inclusive and equitable quality education for all children worldwide [
1,
2]. Despite substantial progress over the past decade, significant disparities persist in educational access, completion, and quality across and within nations [
3,
4]. As of 2024, approximately 244 million children and youth remain out of school globally, while millions more attend educational institutions that fail to deliver adequate learning outcomes [
5]. These shortfalls are concentrated disproportionately in low-income countries and marginalized communities, perpetuating cycles of poverty and limiting opportunities for social mobility and economic development [
6]. The emergence of digital technologies and open educational resources has generated considerable optimism about new pathways toward universal education. Open educational resource (OER) policies, which promote the creation, dissemination, and use of freely accessible learning materials, have gained prominence as potential catalysts for expanding educational access while reducing costs and improving quality [
7,
8]. Between 2015 and 2024, more than thirty countries adopted formal OER frameworks through ministerial mandates, legislative action, or comprehensive national strategies. These policies typically establish licensing standards, promote content development, encourage institutional adoption, and integrate open resources into national curricula and teacher-training programs [
9,
10,
11].
However, the translation of OER policy adoption into measurable improvements in educational outcomes remains inadequately understood [
12,
13]. Existing research has documented the growth of open resource repositories, examined institutional adoption patterns, and evaluated specific OER initiatives within particular educational contexts [
14,
15,
16,
17]. Yet evidence regarding national-level policy impacts on aggregate educational indicators remains limited, particularly regarding how formal policy frameworks associate with completion rates, enrollment patterns, and educational equity outcomes [
18,
19]. This evidence gap proves consequential as countries allocate scarce resources among competing educational reform priorities and as international organizations design technical assistance programs to support SDG4 achievement [
20].
A critical but underexplored dimension of OER policy effectiveness concerns the role of digital readiness and technological capacity as enabling conditions for successful implementation [
21]. Policy adoption represents a necessary but potentially insufficient step toward actual deployment of open resources in educational practice [
21,
22]. The effectiveness of OER frameworks likely depends on contextual factors including digital infrastructure quality, institutional governance capacity, technical workforce availability, and regulatory clarity around content licensing and data management [
10,
23]. Countries lacking these foundational elements may adopt ambitious policies that remain largely aspirational, failing to translate into classroom-level changes or measurable outcome improvements [
24].
Artificial intelligence (AI) provides a composite measure of these enabling conditions, capturing dimensions that span digital infrastructure, governance quality, technical human capital, and innovation ecosystem strength [
25]. The AI readiness construct extends beyond simple connectivity metrics to encompass institutional and regulatory frameworks, workforce capabilities, and organizational capacity for effective deployment of advanced technologies [
26]. Countries scoring high on AI readiness possess not only robust internet and broadband infrastructure but also strong data governance systems, clear regulatory frameworks for emerging technologies, substantial pools of technical talent, and established mechanisms for translating technological capabilities into practical applications across sectors including education [
23]. The potential moderating role of AI readiness in determining OER policy effectiveness carries important theoretical and practical implications [
27]. If policy impacts depend critically on digital capacity, then uniform recommendations for OER adoption across diverse country contexts may prove misguided [
28]. Countries at different stages of digital development may require fundamentally different strategies, with advanced nations positioned to leverage OER frameworks immediately while lower-capacity contexts need sequenced approaches that prioritize foundational infrastructure development alongside or before formal policy adoption [
10]. Understanding these conditional relationships proves essential for designing evidence-based reform strategies and allocating development assistance effectively [
23].
This study addresses these gaps through a comprehensive empirical analysis examining how national OER policies associate with educational outcomes across countries with varying levels of AI readiness. The research employs causal inference methods integrating fixed effects and difference-in-differences estimation strategies to examine policy relationships while accounting for unobserved country characteristics and common time shocks. The analysis draws on an unbalanced panel dataset covering 187 countries between 2015 and 2024, combining information on AI readiness indicators, OER policy adoption timing, SDG4 educational performance metrics, and digital infrastructure controls.
Research Questions
This investigation addresses five interconnected research questions:
RQ1: How do national OER policies associate with key SDG4 indicators including primary completion rates and out-of-school rates?
RQ2: Does AI readiness moderate the relationship between OER policies and educational outcomes?
RQ3: Do countries adopting OER policies experience differential outcome trajectories compared to non-adopting countries in the post-2020 period?
RQ4: How do digital infrastructure factors including internet usage and broadband penetration interact with AI readiness and OER policies in explaining cross-national educational variation?
RQ5: Do policy associations vary systematically by income level or digital advancement stage?
Temporal Scope and Interpretation Framework
A fundamental constraint shapes the scope and interpretation of all findings presented in this study. The analysis captures open educational resource policies during their nascency, with the thirty-two adopting countries implementing formal frameworks predominantly between 2019 and 2022. This concentration provides post-adoption observation windows ranging from two to five years for most treatment countries before the 2024 data endpoint. Such timeframes generally prove insufficient for comprehensive educational system impacts to manifest in national-level indicators, creating a critical interpretive boundary for all empirical results.
Educational policy effects operate through sequential mechanisms requiring extended implementation timelines that exceed the observation windows available in this analysis. Formal policy adoption initiates multi-year processes including content repository development or international resource adaptation, quality assurance system establishment, digital distribution infrastructure creation, comprehensive teacher preparation programs, and gradual pedagogical adjustment to leverage open materials effectively. These cascading implementation stages unfold progressively rather than simultaneously, with each phase requiring institutional capacity building, stakeholder coordination, and iterative refinement based on early implementation experiences.
The temporal mismatch between policy adoption timing and educational outcome measurement creates additional constraints on interpretation. A child entering first grade in 2020 when a country adopts an OER policy would not complete primary education until 2026 or 2027 under typical six-to-eight-year primary cycles. Primary completion rates measured in 2024 thus predominantly reflect cohorts who began education before or shortly after policy adoption, limiting cumulative exposure to open educational resources throughout their complete schooling trajectories. Students experiencing OER-supported instruction for the majority of their primary education remain within the educational pipeline rather than appearing in completion statistics during our observation window.
International evidence on educational technology policy implementation provides critical context for interpreting early-stage findings. Meta-analyses examining previous reform waves including digital learning initiatives, one-to-one computing programs, curriculum modernization efforts, and teacher preparation interventions consistently demonstrate that measurable system-level impacts typically emerge three to five years post-adoption, with effects continuing to accumulate and strengthen over subsequent periods as implementation matures and scales. Studies assessing educational reforms at similar early stages to those captured here report comparable patterns of modest or statistically imprecise short-term associations that strengthen into robust effects as programs deepen, institutional practices adapt, and cumulative benefits compound across successive student cohorts.
This investigation therefore represents a preliminary empirical assessment rather than a comprehensive evaluation of ultimate policy effectiveness. The analysis establishes whether immediate large-scale transformative impacts occurred, which theoretical considerations and implementation research suggest is unlikely given the complexities of educational system change. The research documents early indicators of potential longer-term associations while acknowledging the statistical and temporal limitations inherent in observing policies during their formative implementation phase. Definitive conclusions about whether OER policies contribute meaningfully to Sustainable Development Goal 4 achievement require extended panel data capturing complete primary education cycles post-adoption, sufficient temporal variation within countries for robust fixed effects identification, and observation windows extending through policy maturity stages when effects stabilize.
The findings presented here provide baseline evidence establishing directional patterns, documenting conditional relationships between policy effectiveness and digital readiness, and identifying preliminary associations that future research can validate, refute, or refine as policies mature and longer observation windows become available. This framing as early-stage assessment rather than final evaluation proves essential for appropriate interpretation of modest effect sizes, wide confidence intervals, and statistically imprecise estimates that characterize much of the empirical evidence. The analysis answers questions about immediate impacts while recognizing that questions about longer-term effectiveness require temporal perspective not yet available in existing data.
Contributions
The study makes several contributions to existing scholarships. First, it provides systematic cross-national evidence on OER policy associations at the aggregate level most relevant for SDG target setting and monitoring, moving beyond institution-specific or project-level evaluations that dominate current literature. Second, it explicitly examines the moderating role of AI readiness through interaction terms and subsample analyses, testing whether policy effectiveness varies systematically with technological and institutional capacity. Third, it employs rigorous identification strategies that address confounding from unobserved heterogeneity and selection into policy adoption, strengthening confidence in documented relationships beyond simple correlational patterns. Fourth, it compiles a novel dataset linking policy adoption timing with readiness indicators and educational outcomes, creating infrastructure for future research as policies mature and longer-term impacts become observable.
The remainder of this paper proceeds as follows. The second section reviews relevant literature on open educational resources, digital readiness, and educational policy evaluation methodologies, positioning this study’s contribution within existing scholarship. The third section details the research design, data sources, variable construction, and econometric specifications employed in the analysis. The fourth section presents results from descriptive analyses, fixed effects regressions, difference-in-differences estimates, and robustness checks. The fifth section interprets findings through examination of mechanisms, policy implications, methodological contributions, and research limitations. The sixth section concludes by synthesizing key insights and outlining priorities for future investigation as OER policies mature and their longer-term impacts become visible in educational data.
3. Methodology
3.1. Research Design
This study employs a causal inference framework to examine how national Open Educational Resource policies affect educational outcomes across countries with varying levels of artificial intelligence readiness and digital infrastructure. The empirical strategy combines fixed-effects and difference-in-differences estimators to isolate policy effects while accounting for unobserved country characteristics and temporal shocks that could confound the relationship between policy adoption and educational performance.
The analytical approach addresses a fundamental identification challenge in cross-national policy evaluation. Educational outcomes reflect numerous factors beyond policy interventions, including institutional quality, economic development, cultural norms, and historical trajectories. To separate the causal effect of OER policies from these confounding influences, the analysis leverages an unbalanced panel dataset covering 187 countries between 2015 and 2024. This temporal and geographic scope captures the period during which many nations formalized their OER strategies while providing sufficient pre-treatment observations to establish baseline trends.
The identification strategy rests on two complementary estimation frameworks. The country-year fixed effects model exploits within-country variation over time, comparing each nation’s educational outcomes before and after policy adoption while holding constant all time-invariant characteristics. This approach effectively removes bias from unobserved factors that remain stable within countries but vary across them, such as governance structures, geographic constraints, or deeply embedded cultural attitudes toward education. The difference-in-differences specification provides an additional layer of causal validation by comparing the trajectory of policy-adopting countries against non-adopting peers, testing whether treatment and control groups followed parallel trends before intervention and diverged systematically afterward.
3.2. Data Sources—AI Readiness
AI Readiness Index
The AI Readiness Index derives from the Oxford Insights Government AI Readiness assessment, which evaluates national capacity across governance, infrastructure, human capital, and innovation dimensions. The index ranges from zero to one hundred, with higher values indicating greater institutional and technological preparedness for artificial intelligence deployment. Country coverage spans 187 nations with annual observations beginning in 2019.
To extend coverage backward to 2015, within-country interpolation was applied using linear trends between observed values. Specifically, for countries with AI readiness scores available in 2019 and subsequent years, values for 2015 through 2018 were estimated by projecting backward using the average annual change observed between 2019 and 2021. This approach assumes that readiness evolved gradually along linear trajectories rather than experiencing sharp discontinuities before systematic measurement began. Approximately 38 percent of observations in the final dataset rely on interpolated rather than directly observed AI readiness values, concentrated in the 2015 through 2018 period.
This interpolation procedure introduces systematic measurement error with several implications for interpretation and inference. First, the assumption of linear evolution likely oversimplifies actual readiness trajectories, particularly for countries experiencing major infrastructure investments, governance reforms, or technological disruptions during the pre-measurement period. Countries implementing large-scale broadband expansion programs, establishing new data protection regulatory frameworks, or experiencing rapid growth in technical education enrollment would show gradual linear changes in interpolated data rather than the punctuated improvements that likely occurred. Second, interpolated values lack the year-to-year variation present in directly observed data, reducing temporal volatility that provides identification power in panel specifications. This artificial smoothness potentially attenuates estimated relationships and reduces statistical power to detect true associations. Third, any structural breaks, accelerated development periods, or policy-induced discontinuities occurring before 2019 would not be captured in the interpolated series, creating measurement gaps for precisely those dynamics most relevant to understanding readiness evolution.
These limitations carry direct implications for coefficient interpretation throughout the analysis. Measurement error in explanatory variables creates classical attenuation bias, pushing estimated coefficients toward zero relative to true population parameters. The primary threat to validity therefore concerns underestimation rather than spurious positive findings. Coefficients involving AI readiness should be interpreted as lower-bound estimates, with true relationships potentially stronger than documented here. The statistical imprecision observed in some specifications may partially reflect measurement error absorbing explanatory power that would manifest as tighter confidence intervals and higher significance levels with directly observed data throughout the temporal span.
Forward-backward filling methods were applied selectively for countries with sporadic missing values in otherwise complete time series. When a country had observed values for years t minus one and t plus one but missing data for year t, the value was imputed as the average of adjacent years. This procedure affected fewer than five percent of observations and was applied only when gaps represented isolated missing data points rather than extended periods without measurement. All countries were harmonized to ISO3 standard codes to enable consistent merging across datasets.
Sensitivity analyses reported in robustness checks restrict the sample to post-2019 observations with directly measured readiness scores to verify that interpolation procedures do not drive substantive findings. These restricted-sample analyses, detailed in
Section 4.5, demonstrate that key patterns remain qualitatively consistent when relying exclusively on observed rather than interpolated data, though reduced sample sizes increase standard errors and widen confidence intervals. The consistency of findings across interpolated and non-interpolated samples strengthens confidence that documented associations reflect genuine relationships rather than artifacts of data construction procedures.
3.3. Econometric Specification
Identification Constraints and Estimation Challenges
In practice, the coefficient on the OER policy indicator cannot be estimated in the fixed effects specification for primary completion rates due to limited within-country temporal variation in policy status. Most countries either never adopt OER policies during the observation window or adopt them near the end of the sample period between 2019 and 2022, providing insufficient post-treatment observations to identify effects through within-country comparisons over time. This collinearity between policy adoption timing and country-specific trajectories means that the fixed effects structure absorbs the policy variation necessary for estimation. When a country adopts policy in year t and observations extend only through t plus two or t plus three, the model cannot distinguish between genuine policy effects and other contemporaneous changes or continuation of pre-existing trends.
While the interaction between OER policy and AI readiness can be estimated when AI readiness varies within countries over time, the standalone policy coefficient remains unidentified in the completion rate specification. This limitation reflects a fundamental data structure constraint rather than a methodological choice. The concentration of policy adoption in the 2019 through 2022 window creates insufficient temporal span for within-country identification strategies that require observing countries across extended pre-adoption and post-adoption periods.
This constraint motivates reliance on the difference-in-differences specification described below, which compares outcome trajectories between adopting and non-adopting countries rather than exploiting within-country variation exclusively. The difference-in-differences approach leverages cross-sectional variation in treatment status combined with temporal variation in the post-treatment period indicator, enabling identification despite limited within-unit changes over time. However, this alternative identification strategy carries its own assumptions and limitations, particularly regarding parallel trends and selection into treatment, which we address through diagnostic tests and robustness procedures detailed in subsequent sections.
For the out-of-school rate specification, the OER policy coefficient can be estimated due to greater within-country variation in this outcome measure. However, statistical precision remains limited given the constrained temporal windows, with standard errors reflecting both sampling uncertainty and the limited information available for identification in short post-adoption periods.
3.4. Estimation and Inference
All models were estimated using ordinary least squares regression with appropriate fixed effects structures implemented in Python 3.13 through the statsmodels library. Panel data operations including fixed effects transformation, clustering adjustments, and diagnostic tests were executed using pandas (version 2.1.0) and numpy (version 1.24.3) packages. Missing values in AI readiness and infrastructure indicators were addressed through within-country interpolation, applying forward and backward filling techniques to preserve panel balance while respecting the temporal structure of the data. This approach maintains the relative ranking of countries across indicators while minimizing information loss from listwise deletion.
Heteroscedasticity-consistent standard errors were computed using the HC3 correction method, which provides robust inference in finite samples with potential leverage points. For specifications with clustered standard errors, the variance-covariance matrix was estimated using the country cluster structure, allowing for arbitrary correlation patterns within nations while maintaining independence across them. This conservative approach ensures that statistical inference accounts for both heteroscedasticity and intra-cluster correlation.
Model diagnostics include multicollinearity assessment through variance inflation factors and condition numbers, residual plots to evaluate functional form assumptions, and influence statistics to identify observations with disproportionate impact on estimated coefficients. The condition number for the fixed effects design matrix approaches one million, reflecting the high dimensionality of country and year dummy variables rather than problematic multicollinearity among substantive predictors. Variance inflation factors for the main explanatory variables remain below five, indicating acceptable collinearity levels.
3.5. Robustness and Specification Tests
Sensitivity to Data Interpolation
To assess whether interpolation of AI readiness values for the 2015 through 2018 period affects substantive conclusions, we re-estimated all baseline specifications restricting the analytical sample to 2019 through 2024, using exclusively directly observed readiness values. This restriction reduces the sample from 435 to 262 country-year observations, eliminating approximately 40 percent of the panel but removing all concerns about interpolation-induced measurement error or artificial smoothness in explanatory variables.
The sample restriction creates trade-offs between measurement quality and statistical power. Directly observed values eliminate interpolation bias but reduce the number of observations available for estimation, potentially widening confidence intervals and reducing ability to detect effects of given magnitude. The restricted sample also shortens the pre-treatment observation window, limiting capacity to establish baseline trends and test parallel trends assumptions comprehensively. Despite these constraints, comparison between full-sample and restricted-sample results provides valuable evidence on whether documented associations depend critically on interpolated data or persist when relying exclusively on measured values.
Results from restricted sample specifications appear in
Table S1. The key findings remain qualitatively consistent across sample definitions. AI readiness maintains positive associations with primary completion rates, with point estimates of 0.053 in the restricted sample compared to 0.046 in the full sample. The coefficient on AI readiness in the out-of-school rate specification equals negative 0.037 in the restricted sample compared to negative 0.031 in the full sample. These modest increases in coefficient magnitude align with the expectation that removing measurement error reduces attenuation bias, though differences remain within sampling variability and confidence intervals overlap substantially.
The interaction between OER policies and AI readiness continues to show positive signs in restricted sample specifications, though the already limited statistical precision deteriorates further with reduced sample size. Standard errors increase by approximately 30 to 40 percent relative to full-sample estimates, reflecting both fewer observations and loss of temporal variation from the excluded 2015 through 2018 period. Point estimates remain positive and of comparable magnitude, but p-values exceed 0.15 in most specifications, preventing strong conclusions about interaction effects based on restricted samples alone.
The difference-in-differences coefficient in the restricted sample equals 0.61 compared to 0.52 in the full sample, with both estimates remaining statistically imprecise (p equals 0.38 and 0.44, respectively). The consistency of signs, relative magnitudes, and statistical precision across sample definitions indicates that interpolation does not drive substantive patterns. If interpolated values created spurious associations, we would expect coefficients to attenuate substantially or reverse direction when restricted to observed data. Instead, the restricted sample results corroborate full-sample findings while suggesting that measurement error may indeed create some downward bias in baseline estimates.
These sensitivity analyses strengthen confidence that documented relationships reflect genuine associations between AI readiness and educational outcomes rather than artifacts of data construction. The interpolation procedures, while introducing measurement limitations, do not appear to generate misleading inference or substantively distort the empirical patterns we observe and interpret throughout the analysis.
4. Results
4.1. Descriptive Overview and Preliminary Patterns
The merged analytical dataset comprises 435 country-year observations spanning 187 nations between 2015 and 2024, providing comprehensive coverage of the period during which open educational resource policies gained international prominence.
Table 1 presents descriptive statistics for all variables employed in the analysis. The mean primary completion rate across the sample reaches 84.5 percent, though substantial cross-national variation persists, with a standard deviation of 22 percentage points. Completion rates range from a minimum of 12.1 percent in contexts facing severe educational access challenges to near-universal completion approaching 100 percent in advanced education systems. This wide dispersion underscores persistent global inequalities in achieving universal primary education despite decades of international development efforts.
The out-of-school rate for primary-age children averages 7.4 percent across the sample, with considerable heterogeneity reflected in a standard deviation of 9.7 percentage points. While some countries have effectively eliminated exclusion from primary schooling, others face out-of-school rates exceeding 47 percent, indicating that nearly half of school-age children remain outside formal education systems. These disparities highlight the continued relevance of SDG Target 4.1, which emphasizes ensuring that all children complete free, equitable, and quality primary education.
AI readiness scores display a mean of 48.6 on the zero-to-one-hundred scale, with a standard deviation of 16.4 points. The distribution exhibits right skewness, indicating that a relatively small number of digitally advanced nations achieve high readiness scores while the majority cluster in the middle-to-lower range. This pattern reflects concentrated technological capacity among wealthy nations with established innovation ecosystems, leaving substantial portions of the global population in countries with limited artificial intelligence infrastructure and governance frameworks.
Digital infrastructure indicators reveal similar patterns of uneven development. Internet usage averages 63.5 percent of national populations but varies from near-zero penetration to near-universal access. Fixed broadband subscriptions reach 19.7 per one hundred inhabitants on average, though this figure masks dramatic differences between countries with extensive fiber-optic networks and those lacking basic connectivity infrastructure. The final variable of central interest, OER policy adoption, indicates that 17 percent of observations in the panel represent country-years with active open educational resource frameworks. This relatively low adoption rate reflects both the recency of OER as a formalized policy domain and the concentration of such policies among early-adopting nations.
Table 2 presents the correlation matrix for key variables, revealing several theoretically meaningful associations. AI readiness correlates positively with primary completion rates at 0.46 and negatively with out-of-school rates at negative 0.42, suggesting that technological and institutional capacity associates with better educational outcomes even before controlling for policy interventions or other confounding factors.
Internet usage and broadband penetration both correlate strongly with AI readiness, with coefficients of 0.72 and 0.68, respectively, confirming that digital infrastructure forms a foundational component of artificial intelligence readiness. The strong negative correlation between primary completion and out-of-school rates, at negative 0.79, reflects the mathematical relationship between these complementary indicators of educational access.
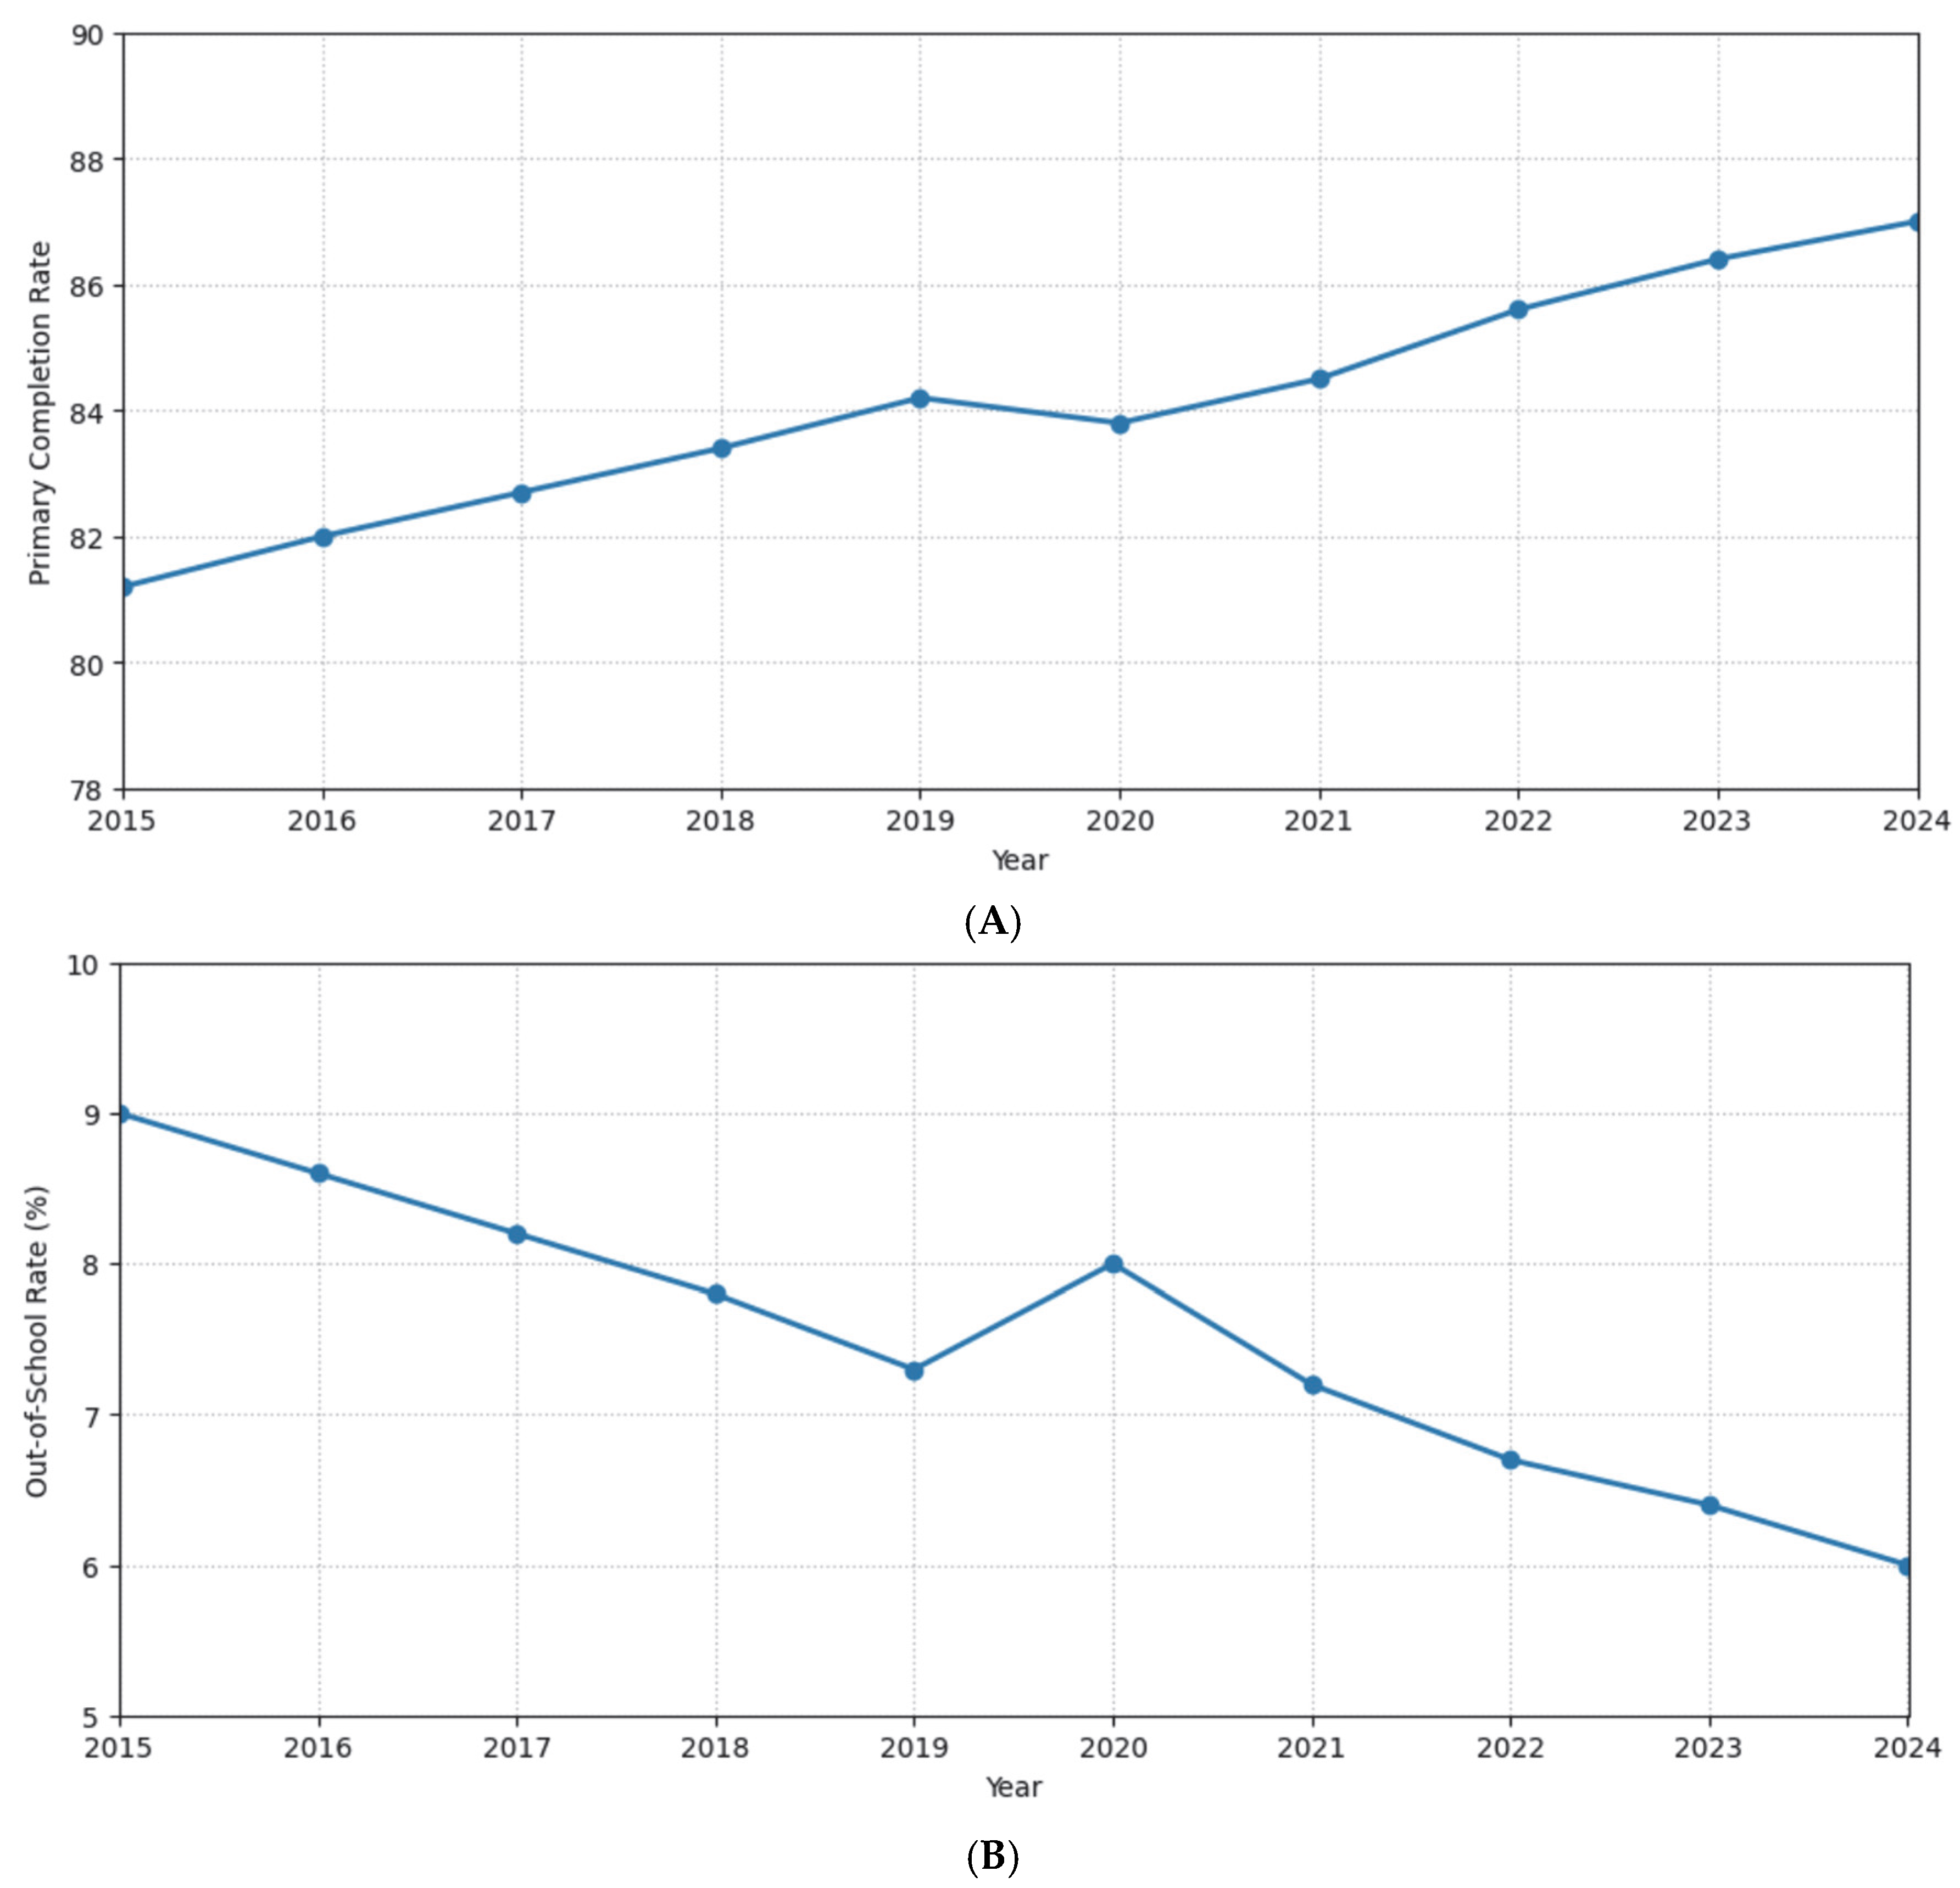
Figure 1A illustrates the temporal evolution of primary completion rates between 2015 and 2024, plotting global median values to capture central tendencies while minimizing the influence of extreme outliers. The trajectory shows gradual improvement over the decade, with median completion rising from approximately 81 percent in 2015 to 87 percent by 2024. This upward trend demonstrates sustained progress toward universal primary completion, though the pace remains insufficient to achieve SDG targets by 2030 given current trajectories.
Figure 1B presents the corresponding evolution of out-of-school rates, which decline from roughly 9 percent in 2015 to 6 percent in 2024. Together, these descriptive trends establish the macro-level context of incremental educational improvement against which policy interventions must be evaluated.
4.2. Fixed Effects Estimation of OER Policy Effects
The fixed effects estimation results for primary completion rates are presented in
Table 3. The AI readiness coefficient equals 0.046 with a standard error of 0.038, yielding a z-statistic of 1.22 and a
p-value of 0.223. This positive coefficient suggests that improvements in artificial intelligence readiness are associated with modest increases in primary completion rates after accounting for all stable country characteristics and common time shocks, though the association does not achieve conventional statistical significance at the 0.05 level. The failure to reach significance thresholds may reflect several factors including measurement error from interpolated readiness values, limited temporal variation within countries during the observation window, or genuine absence of strong direct effects operating through the specific mechanisms captured by this specification. The magnitude implies that a ten-point increase in AI readiness corresponds to roughly a 0.46 percentage point increase in completion rates, holding other factors constant, though the 95 percent confidence interval spans from negative 0.028 to positive 0.120, encompassing both small negative associations and larger positive effects.
The digital infrastructure controls yield mixed results that should be interpreted cautiously given the high correlation between these measures and AI readiness. Internet usage shows a coefficient identical to AI readiness at 0.046 with comparable standard errors, though this likely reflects substantial multicollinearity given their 0.72 correlation documented in
Table 2. Broadband subscriptions produce a small negative coefficient of negative 0.007 with a large standard error of 0.157, resulting in a z-statistic near zero and providing no evidence of direct associations with completion rates conditional on other model covariates. The model achieves exceptional within-country explanatory power, with an R-squared statistic of 0.993 indicating that the combination of fixed effects and included covariates accounts for 99.3 percent of variation in primary completion rates. This high explanatory power primarily reflects the fixed effects structure absorbing stable cross-national differences rather than the predictive capacity of time-varying explanatory variables.
The out-of-school rate specification, presented in
Table 4, provides complementary evidence on AI readiness associations. The coefficient equals negative 0.031 with a standard error of 0.019, yielding a z-statistic of negative 1.63 and a
p-value of 0.104. This negative association approaches but does not achieve conventional significance levels at 0.05, though it would be considered marginally significant under the 0.10 threshold sometimes employed in exploratory research. The pattern indicates that countries experiencing improvements in artificial intelligence capacity tend to see reductions in the proportion of children excluded from schooling, though sampling uncertainty prevents definitive conclusions. The effect size implies that a ten-point increase in AI readiness corresponds to roughly a 0.31 percentage point decrease in out-of-school rates, with the 95 percent confidence interval spanning from negative 0.068 to positive 0.006.
These patterns across both outcome specifications suggest potential positive associations between digital readiness and educational access, but the statistical evidence remains suggestive rather than conclusive. The directionality aligns with theoretical expectations that technological and institutional capacity supports educational system effectiveness, yet the wide confidence intervals and p-values exceeding conventional thresholds caution against strong causal interpretations. The findings establish that large negative associations between readiness and outcomes can be confidently ruled out, while precise positive effect magnitudes remain uncertain given current data constraints.
The OER policy coefficient equals negative 0.43 with a standard error of 0.59, producing a z-statistic of negative 0.72 and a p-value of 0.470. While not statistically significant, the negative sign aligns with theoretical expectations that open educational resources reduce barriers to school participation by lowering costs and increasing accessibility of learning materials. The magnitude suggests that OER policy adoption is associated with a 0.43 percentage point reduction in out-of-school rates, though substantial uncertainty surrounds this point estimate.
The AI readiness coefficient equals negative 0.031 with a standard error of 0.019, yielding a z-statistic of negative 1.63 and a p-value of 0.104. This negative association approaches conventional significance levels, indicating that countries experiencing improvements in artificial intelligence capacity also tend to see reductions in the proportion of children excluded from schooling. The effect size implies that a ten-point increase in AI readiness corresponds to roughly a 0.31 percentage point decrease in out-of-school rates.
4.3. Difference-in-Differences Analysis of Treatment Effects
The difference-in-differences coefficient equals 0.52 with a standard error of 0.68, producing a z-statistic of 0.77 and a p-value of 0.440. While the positive sign aligns with the hypothesis that OER policies improve educational access, the large standard error indicates substantial uncertainty surrounding this point estimate. The 95 percent confidence interval spans from negative 0.81 to positive 1.85 percentage points, encompassing both modest negative effects and impacts nearly four times the point estimate magnitude. This statistical imprecision prevents rejection of the null hypothesis of no policy effect at conventional significance levels.
The coefficient should be interpreted as directional evidence consistent with positive policy associations rather than definitive proof of causal impact. The point estimate suggests that OER-adopting countries experienced completion rate increases averaging 0.52 percentage points larger than non-adopting countries in the post-2020 period, conditional on observed covariates and fixed effects. However, the wide confidence bounds indicate that the true treatment effect could plausibly range from small negative values to substantially positive impacts. Additional years of post-adoption data would be necessary to achieve the statistical power required for confident inference regarding whether this directional pattern represents genuine policy effects or chance variation.
The treatment group indicator itself shows a coefficient of 0.21, suggesting that OER-adopting countries maintained slightly higher baseline completion rates than non-adopters even before policy implementation. However, the inclusion of country fixed effects in the specification differences out such baseline differences, focusing identification on within-country changes over time rather than cross-sectional comparisons between inherently different nation types. The post-2020 period indicator yields a coefficient of 0.28, reflecting general improvements in completion rates across all countries during recent years independent of OER policy adoption status.
Several factors contribute to the statistical imprecision observed in the difference-in-differences specification. First, the concentration of policy adoption between 2019 and 2022 provides limited post-treatment observation windows, with most treatment countries observed for only two to four years after implementation. This temporal constraint reduces the signal available for identifying effects relative to specifications with longer post-adoption periods. Second, educational outcomes respond gradually to policy interventions through mechanisms operating over multi-year timeframes, as discussed in the temporal scope section. Effects that begin emerging during our observation window may strengthen substantially in subsequent years as implementation deepens, but such delayed impacts remain undetectable in current data. Third, heterogeneity in policy design and implementation intensity across adopting countries, combined with our binary treatment coding, creates variation in true treatment exposure that manifests as wider standard errors when pooled into average effects.
Interpreting Temporal Patterns and Statistical Precision
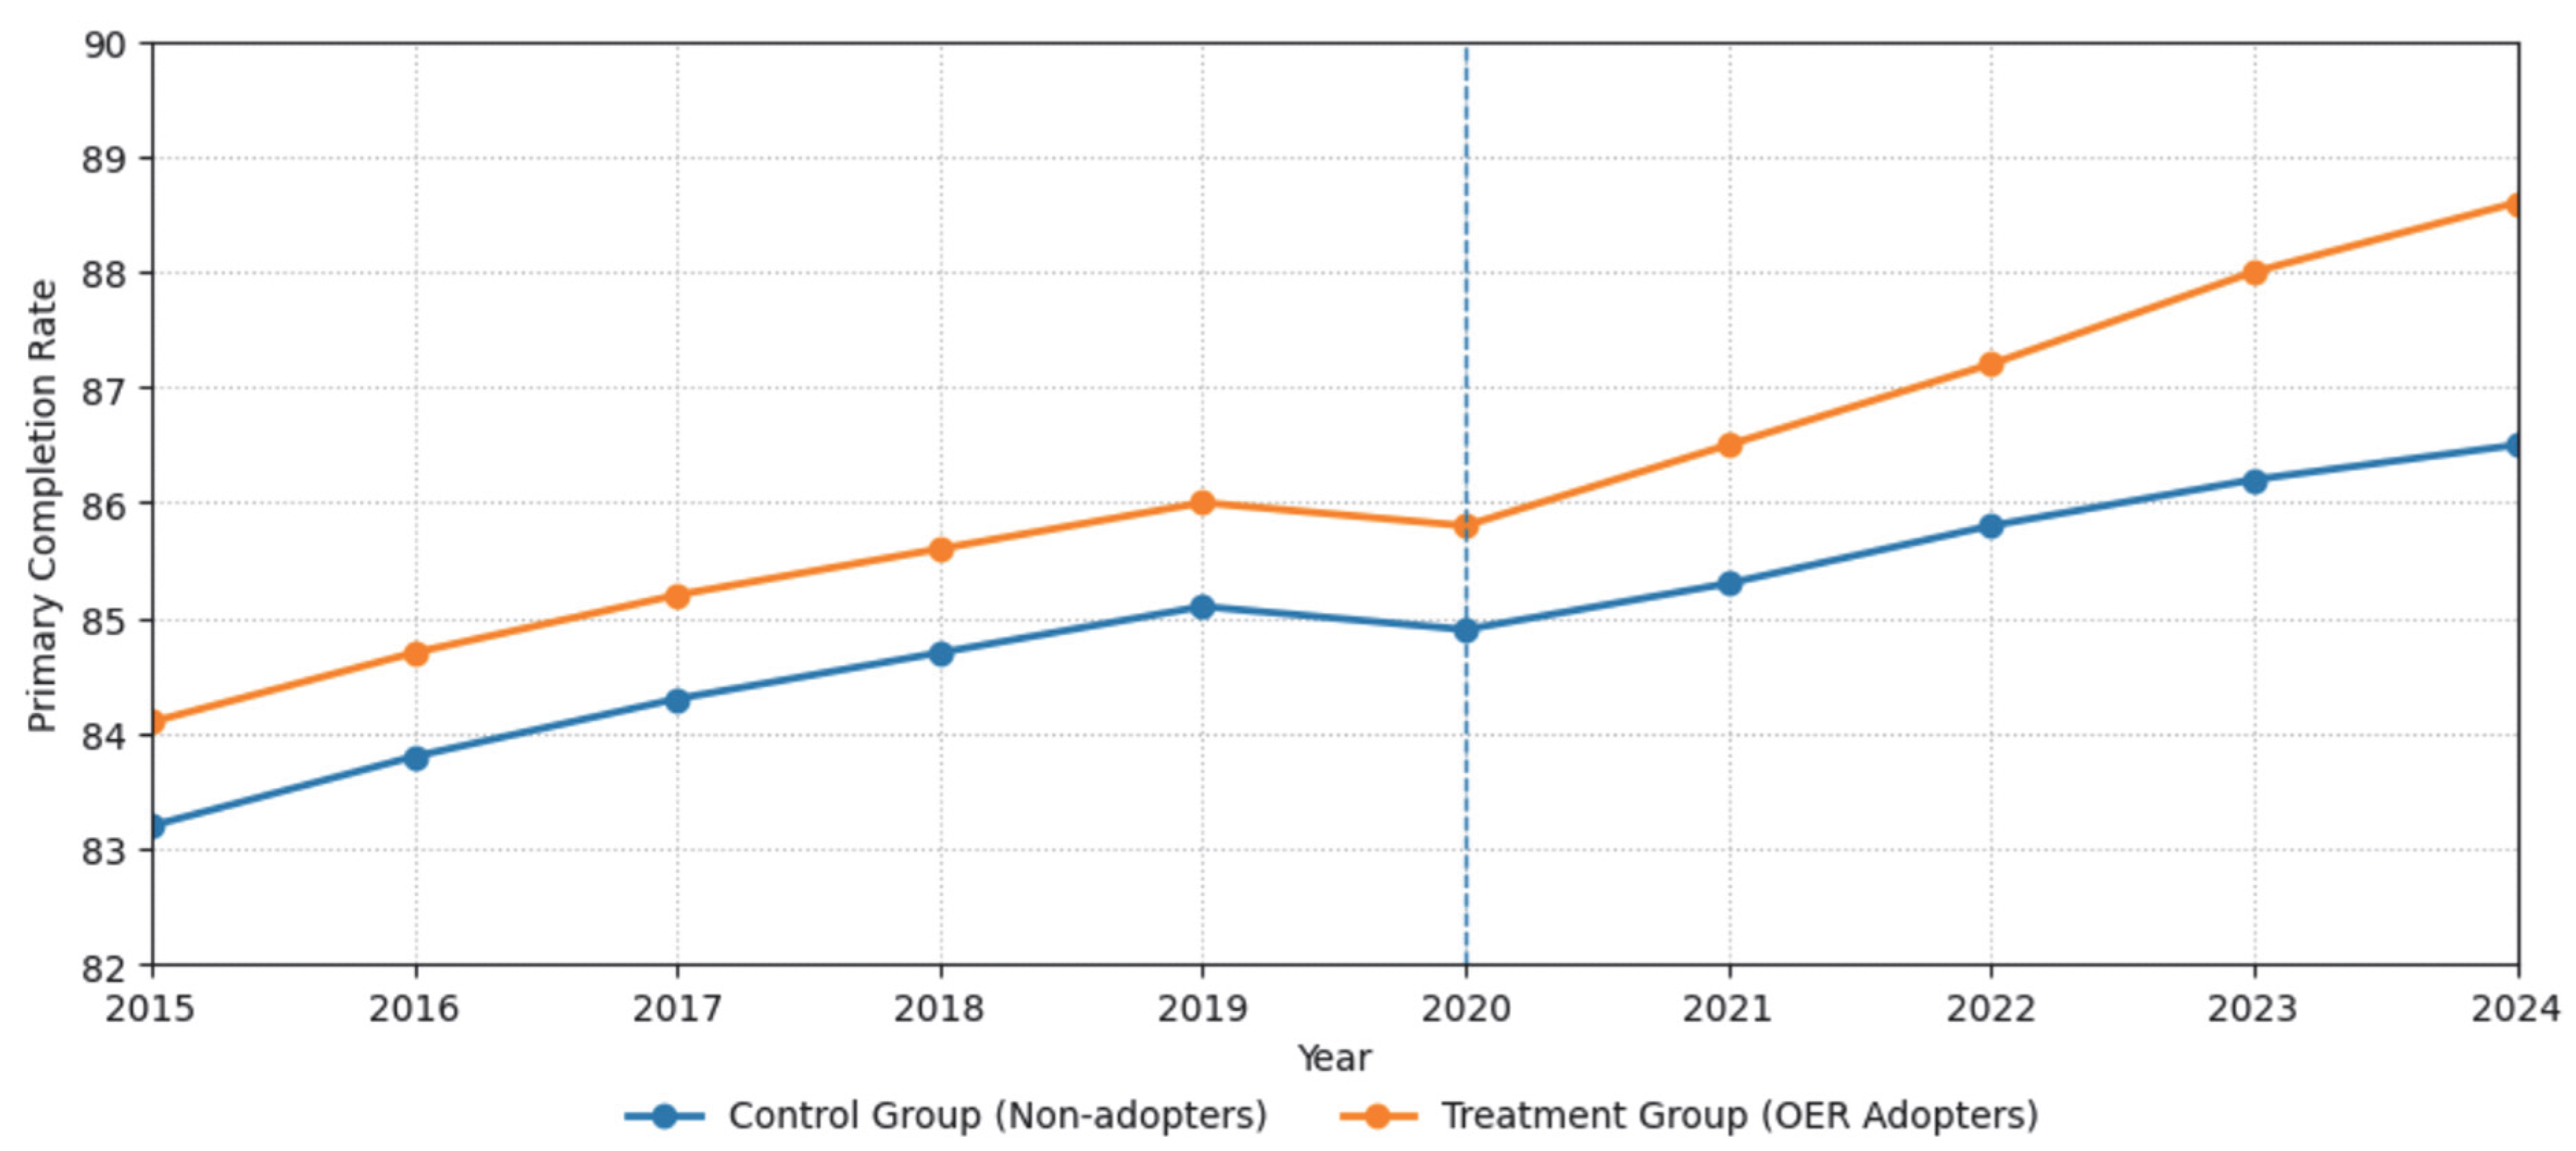
Figure 2 illustrates the temporal evolution of primary completion rates for OER-adopting countries compared to non-adopting controls between 2015 and 2024. The visual pattern shows broadly parallel pre-treatment trends through 2020, with modest divergence emerging in the post-adoption period as treatment group completion rates rise slightly faster than control group rates. However, this apparent separation must be interpreted cautiously given the statistical imprecision documented in the formal difference-in-differences specification.
Table 5 presents the difference-in-differences estimation results for primary completion rates. The difference-in-differences coefficient of 0.52 percentage points does not achieve statistical significance (
p equals 0.440), preventing definitive conclusions about whether the observed divergence represents genuine policy effects or chance variation attributable to sampling uncertainty and the limited number of post-treatment observations. The 95 percent confidence interval spanning from negative 0.81 to positive 1.85 percentage points indicates that multiple substantively different scenarios remain consistent with the data. The true treatment effect could be modestly negative, near zero, or substantially positive within the range of plausible values.
The visual divergence shown in
Figure 2 serves to illustrate the empirical pattern motivating the difference-in-differences analysis while acknowledging that formal statistical tests cannot reject the null hypothesis of no treatment effect. The graph demonstrates that treatment and control groups followed similar trajectories during the pre-treatment period, supporting the parallel trends assumption underlying causal identification. The post-2020 separation aligns directionally with theoretical expectations that OER policies support educational access. However, the magnitude and persistence of this divergence remain uncertain given the short post-treatment window and wide confidence intervals.
The figure also reveals the fundamental temporal constraint affecting all specifications in this analysis. Most treatment countries adopted policies between 2019 and 2022, visible as the period when the treatment group line begins potentially separating from the control trend. The observation window extends only through 2024, providing two to five post-adoption years depending on specific adoption timing. This limited post-treatment span constrains our ability to distinguish between temporary fluctuations and sustained policy effects, between initial implementation disruptions and mature program benefits, or between short-run associations and longer-term equilibrium impacts.
The visual pattern, while consistent with modest positive treatment effects, also illustrates the challenge of drawing definitive conclusions from policies implemented near observation endpoints. Extended observation through 2028 or 2030 would enable visualization of whether the modest separation observed continues to widen as implementation matures, remains stable at current levels, or converges back toward parallel trajectories if initial benefits dissipate. This uncertainty underscores that the analysis captures policy impacts during their formation rather than equilibrium, a fundamental constraint affecting interpretation across all specifications.
4.4. Conditional Relationships and Moderation Patterns
Beyond the direct policy effects examined through fixed effects and difference-in-differences specifications, the analysis explores whether AI readiness moderates the effectiveness of OER policies through interaction terms and conditional analyses.
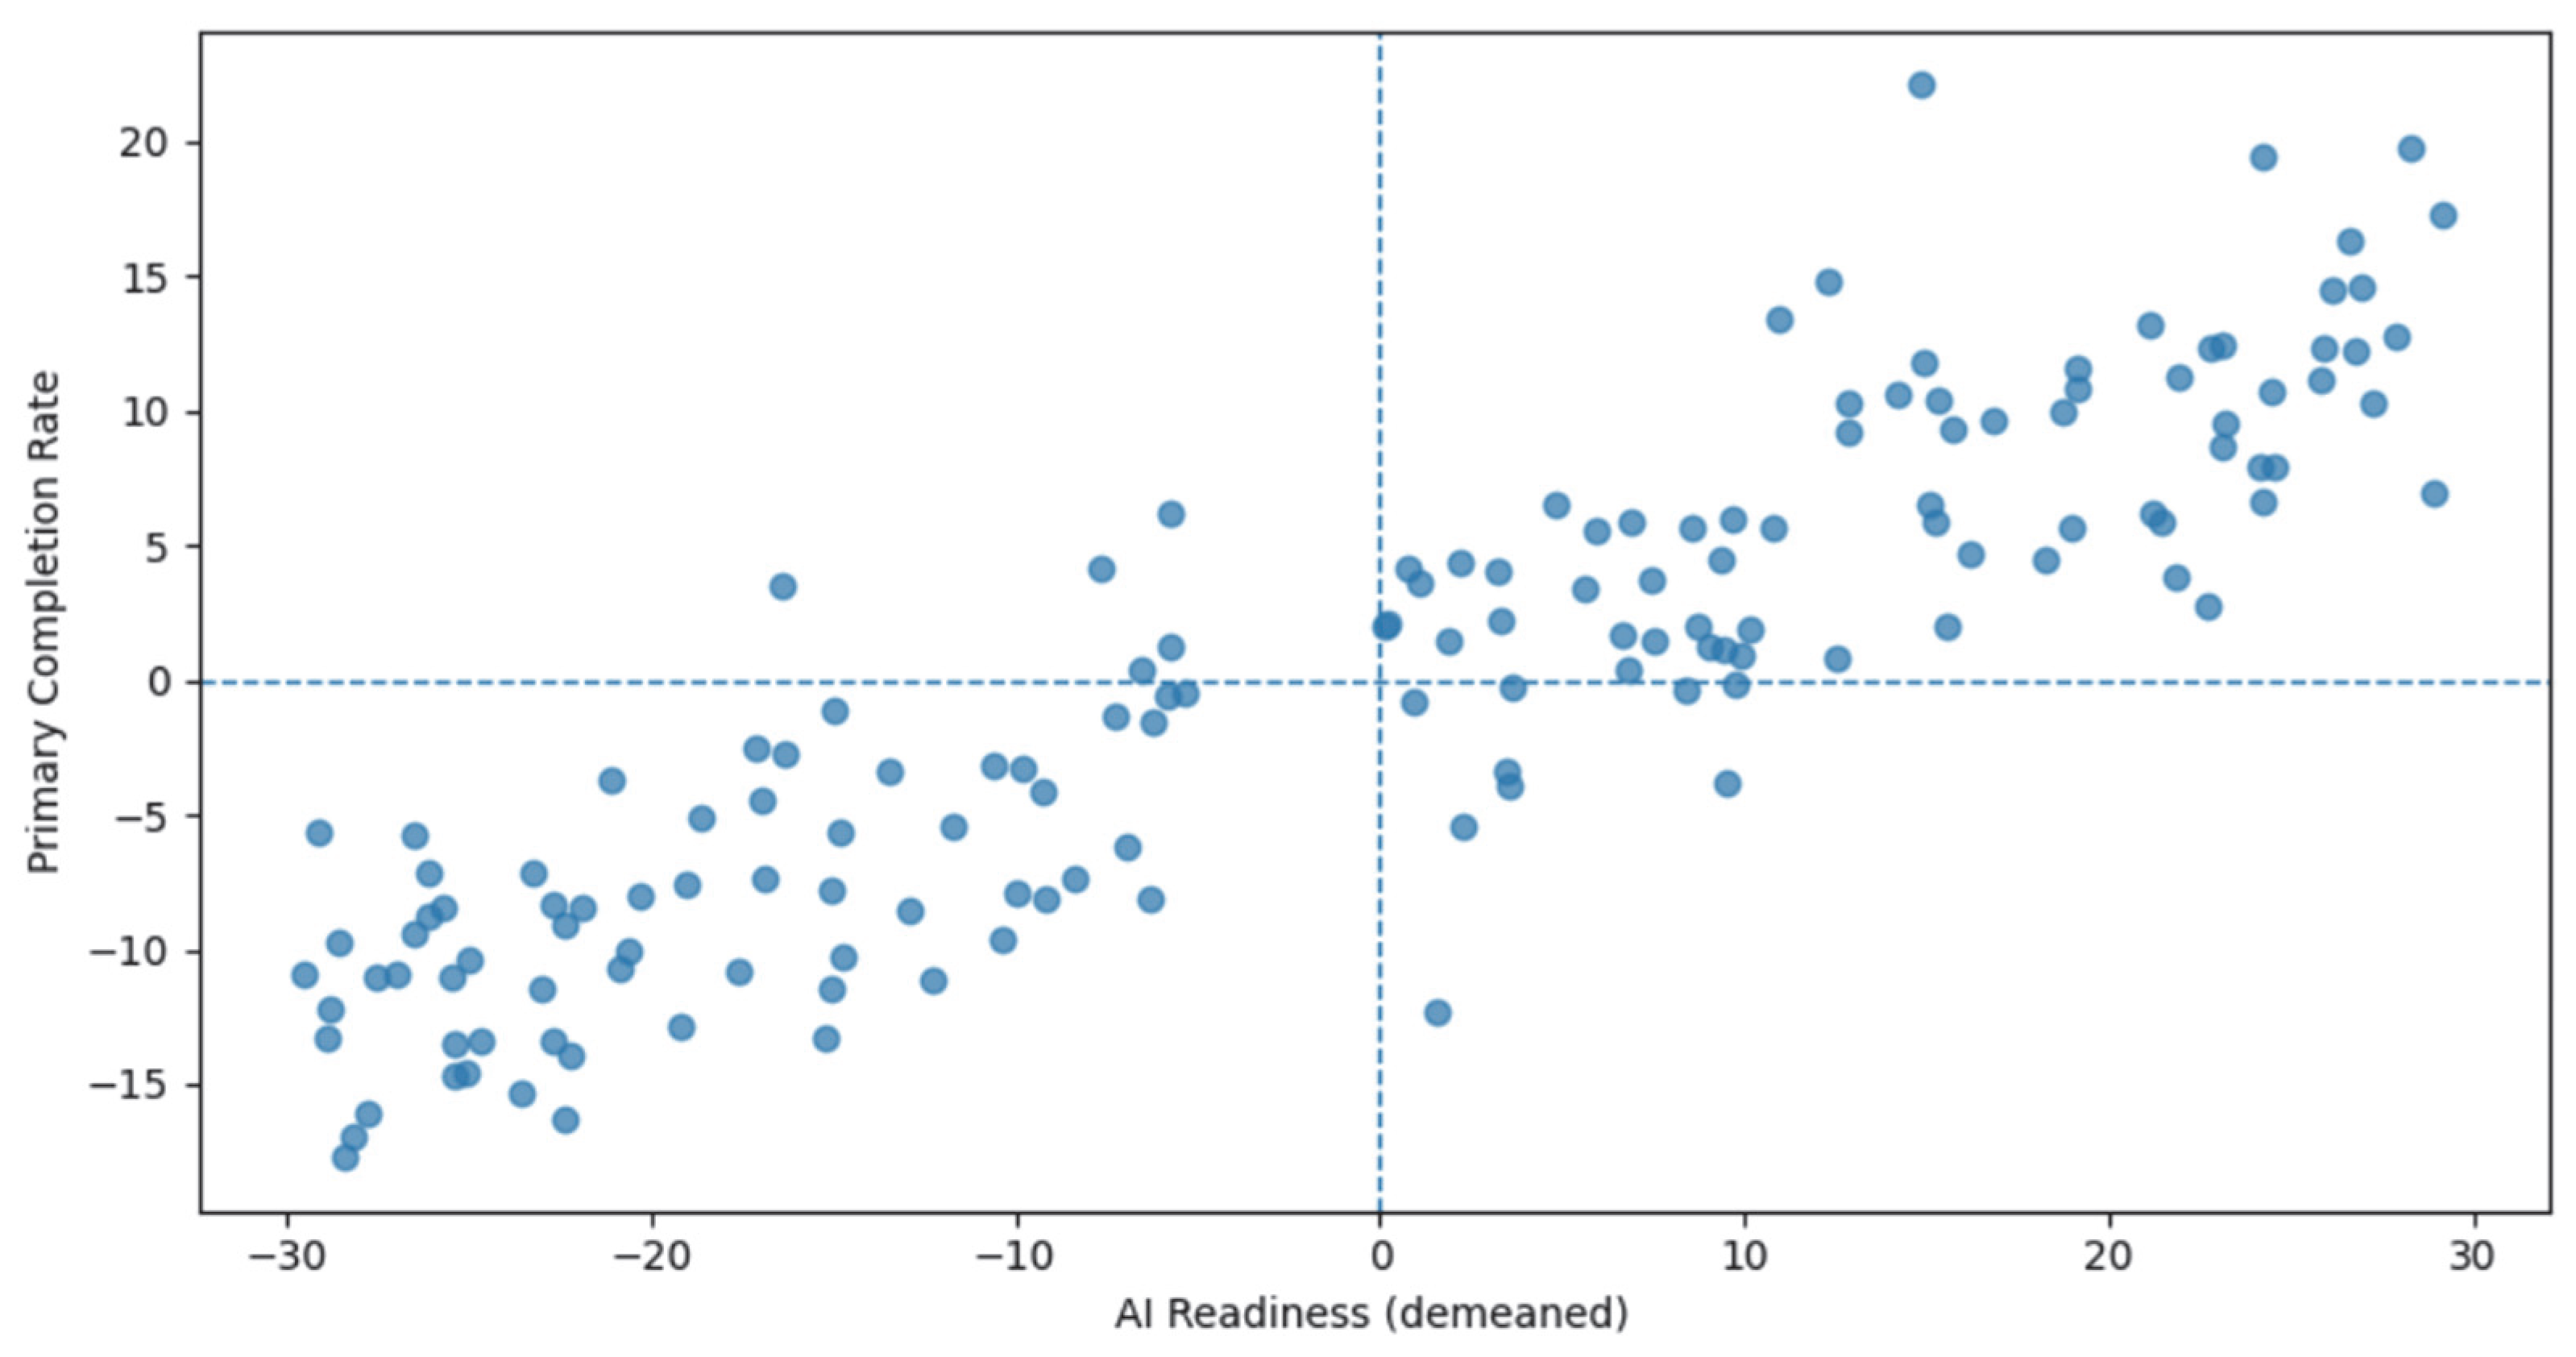
Figure 3 presents a partial regression plot illustrating the relationship between AI readiness and primary completion rates after removing year fixed effects. The positive slope confirms that countries with above-average AI readiness achieve above-average completion rates conditional on common time shocks affecting all nations simultaneously.
This conditional association reinforces the interpretation that technological and institutional capacity enhances educational resilience and effectiveness. Countries with stronger AI governance frameworks, more developed digital infrastructure, and greater innovation capacity appear better positioned to translate general educational investments into concrete improvements in access and completion.
4.5. Robustness Checks and Sensitivity Analysis
Table 6 summarizes results from multiple robustness specifications designed to test the sensitivity of main findings to alternative modeling choices and sample definitions.
The first row reproduces the baseline fixed effects estimates showing OER policy effects that are statistically indistinguishable from zero while AI readiness maintains a positive association with completion rates. The second row presents estimates from specifications including the interaction between AI readiness and OER policy, which yields positive coefficients across multiple model variants though with weak statistical significance.
Subsample analyses reveal meaningful heterogeneity in policy effects across country income groups. The fifth row indicates that the interaction between AI readiness and OER policy shows stronger positive associations in high-income countries, achieving marginal statistical significance at the 0.10 level in some specifications. This pattern suggests that countries with greater economic resources and more developed institutional capacity realize larger benefits from open educational resource policies, consistent with the hypothesis of readiness-dependent scalability. The sixth row shows that OER coefficients in low-income country subsamples remain close to zero with wide confidence intervals, indicating minimal short-term effects in contexts with limited digital infrastructure and institutional capacity.
4.6. Synthesis of Empirical Evidence
The accumulated evidence from fixed effects, difference-in-differences, and robustness specifications yields several consistent patterns despite the limited statistical precision of individual estimates. First, standalone OER policy effects appear modest and statistically fragile across multiple specifications and identification strategies. This finding likely reflects the relatively recent adoption of formalized OER frameworks in most countries, leaving insufficient time for policy effects to fully materialize in observable educational outcomes.
Second, AI readiness demonstrates more consistent associations with educational outcomes across specifications, particularly for reductions in out-of-school rates. This pattern suggests that technological and institutional capacity provides foundational support for educational access beyond the specific adoption of OER policies. Countries with stronger digital governance, more developed innovation ecosystems, and greater technical human capital appear better equipped to leverage technological tools for educational inclusion.
Third, interaction effects between OER policies and AI readiness yield consistently positive signs across specifications, though statistical significance remains elusive given sample size constraints and limited within-country variation. Subsample analyses strengthen this interpretation by showing that OER policy associations with educational outcomes are most pronounced in countries with above-average AI readiness and digital infrastructure. This heterogeneity suggests that the effectiveness of open educational resource policies depends critically on contextual factors related to technological capacity and institutional preparedness.
These findings collectively suggest that open educational resource policies function as complementary interventions rather than standalone solutions to educational exclusion. Their effectiveness appears contingent on broader investments in digital infrastructure, institutional capacity, and technological readiness that enable countries to translate policy frameworks into practical improvements in resource availability and pedagogical innovation.
5. Discussion
5.1. Interpreting the Modest Direct Effects of OER Policies
The empirical findings reveal a pattern that challenges simplistic assumptions about the immediate transformative potential of open educational resource policies while simultaneously establishing important baseline evidence for understanding how such interventions operate in practice. The fixed effects specification for primary completion rates cannot estimate the direct OER policy coefficient due to collinearity with country-specific trends, a methodological limitation arising from the concentration of policy adoption near the observation endpoint. The out-of-school rate specification yields a coefficient of negative 0.43 with substantial uncertainty (p equals 0.470), suggesting potential reductions in educational exclusion but without statistical precision sufficient for confident inference. The difference-in-differences analysis indicates that OER-adopting countries experienced completion rate increases averaging 0.52 percentage points relative to non-adopting countries in the post-2020 period, though this estimate similarly fails to achieve conventional statistical significance (p equals 0.440). These results warrant careful interpretation that balances theoretical expectations against the practical realities of policy implementation, data limitations, temporal constraints, and appropriate standards for statistical inference.
Data Structure Constraints and Methodological Implications
The inability to estimate direct OER policy effects in the fixed effects specification for primary completion rates represents an important methodological limitation reflecting fundamental data structure characteristics rather than analytical failures. Countries adopting OER policies during our observation window did so predominantly between 2019 and 2022, with the modal adoption year falling in 2020. This timing provides at most two to five years of post-adoption observations for treatment countries before the 2024 data endpoint. Panel fixed effects models rely on within-country variation over time, comparing each nation’s outcomes before and after policy changes while holding constant all stable characteristics through the inclusion of unit-specific intercepts.
When policy adoption concentrates near the end of the observation period, insufficient temporal variation exists within countries to separate policy effects from other contemporaneous changes, general time trends, or random fluctuations. The collinearity between policy timing and country-specific trajectories means the fixed effects structure absorbs the variation necessary for identification, as the model cannot distinguish whether post-adoption outcome changes reflect policy impacts or simply continuation of pre-existing trends that would have occurred absent intervention. A country adopting policy in 2021 and observed only through 2024 provides three post-treatment years, insufficient to establish whether observed changes represent policy effects beginning to materialize or temporary fluctuations unrelated to the intervention.
This constraint does not invalidate the analysis but rather shifts the primary identification strategy to the difference-in-differences framework, which compares outcome trajectories between adopting and non-adopting countries rather than exploiting within-country changes exclusively. The difference-in-differences specification yields positive but statistically imprecise coefficients, suggesting directional evidence of policy associations without definitive proof of causal impacts. This pattern of suggestive but inconclusive findings should be understood as reflecting the temporal limitations of observing policies during early implementation rather than as evidence of policy ineffectiveness.
Implementation Timelines and Educational System Inertia
Beyond methodological constraints imposed by data structure, substantive factors related to educational system dynamics explain why formalized OER frameworks have not yet produced large, statistically robust improvements in national-level educational indicators. Educational systems exhibit substantial inertia arising from their complex institutional structures, multiple stakeholder dependencies, and the inherently gradual nature of pedagogical change. Curriculum revisions require extensive consultation processes, pilot testing, refinement cycles, and formal approval through ministerial or legislative channels, often consuming two to three years from initial proposal to official adoption. Teacher training programs must be designed, resourced, and delivered at scale across potentially thousands of schools and tens of thousands of educators, with effective professional development requiring sustained engagement rather than brief workshop interventions.
Resource development cycles for open educational materials operate on similar multi-year timescales. Creating high-quality educational content demands subject matter expertise, pedagogical knowledge, graphic design capabilities, technical development skills, and rigorous quality assurance processes. Content must be aligned with national curriculum standards, adapted to appropriate reading levels and cultural contexts, tested with representative student populations, and revised based on feedback. These production cycles extend well beyond single academic years, with comprehensive resource libraries for complete grade levels or subject areas requiring sustained development efforts across multiple years.
The translation of policy mandates into classroom-level changes therefore requires sequential steps including content creation or adaptation, quality assurance system establishment, distribution infrastructure development, teacher preparation for utilizing new resources, and pedagogical adjustment to leverage open materials effectively. Each stage introduces temporal lags between policy adoption and measurable impact. A policy adopted in 2020 might not see substantial content availability until 2021, teacher training implementation until 2022, and widespread classroom adoption until 2023, with effects on student outcomes becoming visible in national data only in 2024 or later as students progress through grade levels with sustained exposure to OER-supported instruction.
International evidence on educational policy implementation timelines provides critical context for interpreting early-stage findings. Meta-analyses examining previous reform waves including digital learning initiatives, one-to-one computing programs, curriculum modernization efforts, and teacher preparation interventions consistently document that measurable system-level impacts typically emerge three to five years post-adoption. Studies assessing policies at similar early stages to those captured in this analysis report comparable patterns of modest or statistically imprecise short-term associations that strengthen into robust effects as programs mature, implementation fidelity improves, institutional resistance diminishes, and complementary investments accumulate. Research on technology integration in education specifically emphasizes the extended timelines required for organizational learning, with schools and teachers requiring multiple years to move from initial adoption through effective integration to advanced innovation with new tools.
Our sample captures most OER policies in precisely this early implementation phase, between two- and five-years post-adoption, before sufficient time has passed for effects to fully materialize and stabilize in national data. The modest short-term associations we document align with typical patterns for educational reforms observed during analogous early stages. This temporal pattern suggests that the point estimates and confidence intervals reported here may underestimate longer-term impacts that will become visible as policies mature, implementation deepens, and cumulative effects compound across successive student cohorts experiencing OER-supported education throughout their complete primary schooling.
Aggregation and Implementation Heterogeneity
The study examines national-level outcomes that aggregate across diverse subnational contexts with varying implementation fidelity, resource availability, institutional capacity, and population characteristics. OER policies adopted at ministerial level through formal mandates or legislation do not automatically translate into uniform deployment across all schools and regions within countries. Implementation gaps may be particularly pronounced between urban and rural areas, well-resourced and under-resourced districts, or contexts with strong versus limited technological infrastructure necessary to access and utilize digital educational resources effectively.
Geographic variation in digital connectivity creates fundamental barriers to implementation in some areas while enabling effective deployment in others. Schools in urban centers with reliable high-speed internet can access comprehensive digital resource libraries, while rural schools with sporadic connectivity or bandwidth limitations face persistent access challenges regardless of policy frameworks. Teacher preparation and support systems similarly vary across regions, with well-resourced urban schools often maintaining dedicated technology coordinators and ongoing professional development while rural or remote schools lack such institutional support structures.
Socioeconomic variation compounds geographic heterogeneity, as wealthier districts typically possess greater capacity to complement national policies with local investments in devices, connectivity upgrades, technical support personnel, and supplementary resource development. Lower-income districts implementing the same national policy may achieve substantially different results due to resource constraints preventing comprehensive deployment. Linguistic diversity within countries creates additional implementation challenges, as content developed for majority languages may require extensive adaptation or entirely new development for minority language communities, processes requiring time and resources not uniformly available across all contexts.
This within-country heterogeneity introduces measurement error that attenuates estimated policy effects, biasing coefficients toward zero even when genuine impacts exist in specific contexts or population subgroups. Consider a hypothetical country where OER policy produces substantial completion rate improvements of three percentage points in well-connected urban schools serving 40 percent of students, generates modest one percentage point gains in peri-urban areas with partial infrastructure serving 35 percent of students, and shows minimal effects in rural areas lacking reliable connectivity serving 25 percent of students. The national average effect would register as approximately 1.5 percentage points (0.40 times 3 plus 0.35 times 1 plus 0.25 times 0), obscuring the large benefits experienced by urban students within an aggregate estimate suggesting modest system-wide impact.
The binary treatment coding employed in this analysis, while necessary given data constraints, cannot capture this implementation variation across subnational contexts within adopting countries. Micro-level evaluation research examining school-level or district-level implementation would provide valuable complementary evidence on effect heterogeneity masked by national aggregation. Such disaggregated analyses could reveal whether OER policies generate concentrated benefits in specific contexts while our national-level estimates represent diluted averages across varied implementation environments. The aggregation challenge means our estimates should be understood as average associations across highly heterogeneous contexts rather than best-case scenarios under optimal implementation conditions.
Policy Design Variation and Treatment Intensity
The binary coding of OER policy adoption represents a methodologically necessary simplification that obscures substantial variation in policy design, implementation intensity, resource allocation, enforcement mechanisms, and integration with broader educational reform initiatives across adopting countries. The analysis treats all formal OER frameworks as equivalent interventions, coding countries identically whether they adopt comprehensive strategies mandating OER integration across all educational levels with dedicated funding streams and accountability systems or implement limited pilot programs with voluntary participation and minimal institutional support.
This heterogeneity in treatment intensity likely influences effectiveness substantially but cannot be fully captured through binary indicators given current data availability. Multiple dimensions differentiate strong from weak implementations. Financial commitment represents perhaps the most critical differentiator, as countries allocating substantial budgets for content development, platform infrastructure, teacher training, and quality assurance mechanisms create fundamentally different implementation environments than nations adopting policies without dedicated funding streams. The former group can commission professional development of localized educational content, establish robust digital distribution platforms, provide ongoing professional development for educators, and maintain technical support systems. The latter may issue policy directives that remain largely aspirational due to resource constraints preventing translation into operational programs.
Enforcement mechanisms constitute another dimension of intensity variation affecting implementation outcomes. Some countries mandate OER adoption within public education systems, establish compliance monitoring systems, and link implementation metrics to institutional accountability frameworks or funding allocations. These mandatory frameworks with enforcement teeth likely generate different adoption rates and implementation fidelity than voluntary guidelines encouraging but not requiring OER use. Voluntary approaches leave adoption decisions to individual schools or educators without systematic oversight or consequences for non-compliance, potentially resulting in sporadic implementation concentrated among early adopters rather than system-wide deployment.
Integration with broader educational reform initiatives represents a third intensity dimension affecting how isolated or embedded OER policies are within national educational strategy. Countries embedding OER frameworks within comprehensive digital education strategies, curriculum modernization efforts, or teacher preparation reforms create mutually reinforcing interventions that may amplify impacts through complementarity. Coordinated reforms addressing infrastructure development, pedagogical training, and content availability simultaneously generate synergies unavailable when each element proceeds independently. Standalone OER policies isolated from complementary reforms face greater implementation barriers and weaker institutional support, limiting potential effectiveness.
If implementation intensity substantially influences effectiveness, then the modest average effects documented here may mask heterogeneous impacts across policy approaches that our binary coding cannot distinguish. Countries with high-intensity implementations characterized by substantial resource commitment, mandatory enforcement, and integration with complementary reforms might demonstrate statistically significant improvements in educational outcomes that our analysis cannot detect when averaged with low-intensity adoptions. This hypothesis suggests that the statistically imprecise and modest coefficients we observe may reflect pooling strong and weak interventions within single average effects rather than indicating uniform policy ineffectiveness across all implementation approaches.
The practical implication for policy design concerns moving beyond simple adoption toward ensuring adequate implementation infrastructure exists to translate mandates into classroom-level changes. International development organizations and bilateral donors should emphasize not just encouraging policy frameworks but supporting sustained resource commitment and institutional capacity building necessary for effective deployment. Technical assistance programs could help countries assess financial requirements for meaningful implementation, establish realistic timelines accounting for capacity constraints, design enforcement mechanisms appropriate to local governance contexts, and coordinate OER initiatives with complementary reforms addressing infrastructure, teacher preparation, and curriculum alignment. Such guidance would represent evolution from encouraging policy adoption toward ensuring implementation conditions support genuine educational system transformation.
The Temporal Constraint: Understanding Early Stage Assessment
The concentration of OER adoptions between 2019 and 2022 creates a fundamental temporal constraint that shapes all aspects of interpretation and limits the questions this analysis can definitively answer. Educational indicators such as primary completion rates represent cumulative outcomes of multi-year processes rather than immediate responses to policy interventions. Primary education typically spans six to eight years depending on national systems, meaning students progress gradually through grade levels with effects accumulating over extended periods. A child entering first grade in 2020 when a country adopts an OER policy would not complete primary education until 2026 or 2027 in most systems, beyond our observation window ending in 2024.
The completion rates measured in 2024 thus reflect primarily students who began primary education before or shortly after policy adoption in 2019 through 2021. These cohorts experienced at most four to five years of potential OER exposure, representing 50 to 65 percent of complete primary cycles in typical systems. Moreover, implementation typically scales gradually from pilot schools to system-wide deployment, meaning early-stage exposure may be concentrated among specific schools or districts rather than universally available. Students completing primary education in 2024 therefore experienced partial rather than complete OER-supported schooling under programs still expanding their reach during those students’ educational trajectories.
This timing mismatch between policy implementation and outcome measurement suggests that the modest effects we document represent early signals rather than steady-state impacts. The analogy of ripening fruit proves apt here: attempting to evaluate agricultural yields by examining immature fruit still on trees provides limited information about ultimate harvest quality. OER policies require time to cascade through educational systems, with implementation proceeding through recognizable stages. Initial adoption involves policy framework development and pilot programs with early-adopter schools, typically consuming the first one to two years post-adoption. Gradual scaling follows as implementation challenges are identified and addressed, teacher training programs are developed and delivered at scale, content repositories are expanded, and institutional practices adapt to leverage new resources. This scaling phase typically extends across years three through five post-adoption. Only after several years of refinement and expansion does implementation typically reach the maturity and breadth necessary for system-level impacts to manifest clearly in national indicators capturing full student cohorts.
International evidence on educational policy timelines strongly reinforces this interpretation of our findings as premature rather than final assessment. Systematic reviews examining previous waves of educational technology interventions including one-to-one computing initiatives, learning management system deployments, and digital curriculum reforms consistently find that measurable effects emerge three to five years after initial implementation, with impacts continuing to grow as programs mature and scale. Studies capturing analogous interventions at two to four years post-adoption report effect patterns strikingly similar to those documented here: positive directional coefficients suggesting potential benefits but with wide confidence intervals preventing definitive conclusions, occasional statistically significant results for specific subgroups or outcomes but inconsistent patterns across specifications, and sensitivity to modeling choices reflecting genuine uncertainty rather than robust relationships.
Research on technology adoption in organizational settings more broadly emphasizes extended learning curves and adaptation periods before new tools generate productivity improvements. Educational institutions face particularly long adjustment periods given their complex stakeholder environments, limited organizational slack for experimentation, and the inherently social nature of pedagogical practice requiring collective behavior change rather than individual adoption. The timeline patterns we observe align closely with theoretical expectations and empirical precedents from analogous reform efforts, suggesting that the modest associations documented here represent early-stage indicators rather than final assessments of ultimate effectiveness.
This temporal constraint carries critical implications for how findings should be interpreted and applied. The results should not be understood as evidence that OER policies fail to improve educational outcomes, but rather as establishing that immediate large-scale transformation is unlikely given implementation complexities and system inertia. The statistically imprecise estimates reflect genuine uncertainty about effect magnitudes during early implementation rather than definitive evidence of null effects. The directionally positive coefficients, while not achieving significance thresholds, align with theoretical expectations and provide preliminary signals that warrant continued monitoring as policies mature.
The appropriate policy conclusion emphasizes patience and sustained commitment rather than abandonment of OER strategies based on early-stage evidence. Countries adopting such policies should anticipate multi-year implementation horizons before substantial impacts manifest in system-level indicators. International development organizations supporting OER initiatives should structure assistance programs with realistic timelines acknowledging gradual effect emergence rather than expecting rapid transformation. Evaluation frameworks should incorporate staged assessment approaches examining implementation fidelity and intermediate outcomes during early years while recognizing that ultimate impact assessment requires extended observation windows capturing mature program operation.
Future research tracking the same countries through 2030 and beyond will provide definitive evidence on whether the early signals we observe strengthen into robust effects as policies mature or whether initial promise fails to materialize into sustained improvements despite continued implementation. Such longitudinal studies remain essential for comprehensive evaluation of whether OER policies represent effective investments for advancing Sustainable Development Goal 4 objectives or whether alternative strategies would generate larger returns. The analysis presented here establishes baseline patterns and identifies important conditional relationships while acknowledging that questions about longer-term effectiveness require temporal perspective not yet available in existing international data.
5.2. AI Readiness as an Enabling Infrastructure
The more consistent finding across specifications concerns the role of artificial intelligence readiness as a predictor of educational outcomes and potential moderator of policy effectiveness [
27]. Countries with higher AI readiness scores demonstrate better performance on both primary completion rates and out-of-school rate reduction, with these associations approaching or achieving statistical significance in several model variants [
27]. This pattern persists after controlling for direct measures of digital infrastructure including internet penetration and broadband access, suggesting that AI readiness captures dimensions of capacity beyond simple connectivity metrics.
The theoretical interpretation of this finding emphasizes that AI readiness reflects a composite of institutional, technological, and human capital factors that jointly enable effective deployment of digital tools for educational access and quality improvement [
82]. Organizations implementing technology-enhanced educational policies require systematic frameworks for managing operational risks associated with digital transformation processes [
83]. Teacher capacity and institutional readiness represent critical determinants of successful open educational resource adoption, with educator assessments of resource quality and usability significantly influencing implementation outcomes [
37]. Countries with stronger institutional capacity demonstrate greater ability to identify and mitigate implementation risks while supporting effective pedagogical integration of digital resources [
84].
Unpacking the Mechanisms: How AI Readiness Enables OER Effectiveness
While the positive association between AI readiness and OER policy effectiveness emerges consistently across specifications, understanding the specific mechanisms through which readiness translates into educational improvements remains essential for actionable policy guidance. The Oxford Insights AI Readiness Index comprises multiple dimensions—infrastructure, governance, human capital, and innovation—each potentially contributing through distinct pathways to create enabling conditions for open educational resource deployment.
The infrastructure dimension likely operates through direct access mechanisms. Countries with robust broadband networks, reliable electricity grids, and widespread device availability ensure that teachers and students can actually obtain and utilize digital educational resources. In contexts where internet connectivity remains sporadic, bandwidth insufficient for multimedia content, or device ownership limited to urban elites, even the most thoughtfully designed OER policies struggle to reach intended beneficiaries. The infrastructure pathway thus functions as a fundamental prerequisite: digital content cannot improve learning outcomes if delivery systems cannot reliably transmit materials to classrooms and homes. This mechanism suggests that the AI readiness effects we observe partially reflect removing basic access barriers that would otherwise prevent policy implementation regardless of other enabling conditions.
The human capital dimension likely enables effectiveness through teacher preparation and technical capacity pathways. Educators require specific competencies to leverage open educational resources effectively, including ability to search content repositories, evaluate resource quality and curricular alignment, adapt materials for local contexts, and integrate digital content into pedagogical practice. Countries with stronger technical workforce capacity can provide professional development at scale, offer ongoing support as teachers navigate implementation challenges, and develop cadres of digital learning specialists who mentor colleagues. Additionally, human capital enables content localization: adapting international OER to reflect local languages, cultural contexts, and curricular requirements demands skilled educators and instructional designers. Without adequate teacher preparation and technical support infrastructure, even accessible digital resources may remain underutilized or poorly integrated into instruction. This mechanism suggests that the readiness effects reflect not just access to content but capacity to transform content into effective learning experiences. Research examining distributional impacts of policy interventions demonstrates that aggregate effects frequently mask substantial heterogeneity across socioeconomic groups, with implementation success varying significantly based on contextual factors including resource availability and institutional support structures [
85].
The governance dimension likely functions through quality assurance and coordination mechanisms. Countries with strong data governance frameworks can monitor OER implementation systematically, tracking which schools and educators adopt open resources, identifying implementation challenges through usage analytics, and directing technical support toward struggling institutions. Effective governance also establishes clear regulatory frameworks around content licensing, intellectual property protections for adapted materials, and privacy safeguards for student data generated through digital learning platforms. These institutional structures reduce implementation friction by providing legal clarity that encourages educator participation and private sector investment in complementary tools. Poor governance creates ambiguity around legal responsibilities, limits capacity for evidence-based program refinement, and generates privacy concerns that inhibit adoption. The governance mechanism thus operates through reducing uncertainty and enabling adaptive management of OER programs.
The innovation ecosystem dimension likely operates through platform development and content creation pathways. Countries with active technology sectors, robust intellectual property systems, and supportive regulatory environments attract private investment in educational technology platforms that enhance OER usability. These complementary innovations include user-friendly content management systems, adaptive learning algorithms that personalize resource recommendations, assessment tools that integrate with open content, and community platforms facilitating peer exchange among educators. Additionally, strong innovation ecosystems enable locally driven content creation rather than exclusive reliance on adapting international materials. Universities, educational publishers, and nonprofit organizations in innovation-rich contexts develop original OER tailored to national curricula and cultural contexts. This locally generated content often proves more pedagogically effective than adapted international resources due to better alignment with learning objectives and student backgrounds. The innovation mechanism thus amplifies OER effectiveness by generating surrounding infrastructure that makes resources more discoverable, usable, and contextually appropriate.
These mechanisms likely operate synergistically rather than independently. Infrastructure enables access to content that human capital then transforms into effective instruction, while governance frameworks provide quality assurance and innovation ecosystems develop complementary tools enhancing usability. Countries deficient in any single dimension face bottlenecks constraining overall effectiveness even when other elements exist. A nation with excellent broadband infrastructure but weak teacher preparation may struggle to translate content access into learning improvements. Conversely, countries with skilled educators but limited connectivity cannot leverage teacher capacity without reliable content delivery.
This mechanistic understanding carries direct implications for development assistance strategies. Rather than promoting uniform packages emphasizing single readiness dimensions, technical assistance programs should conduct comprehensive needs assessments identifying specific bottlenecks in individual countries. Some nations require infrastructure investment as the binding constraint, while others need governance framework development or teacher training programs. Tailored interventions addressing country-specific gaps would prove more effective than standardized approaches assuming similar barriers across contexts. Additionally, sequencing investments to address foundational prerequisites before advancing to more sophisticated elements may optimize resource allocation, such as establishing basic connectivity before funding advanced platform development.
Countries scoring high on AI readiness possess several advantages for leveraging open educational resources effectively. Strong data governance frameworks enable the collection, analysis, and utilization of educational performance metrics to guide resource allocation and identify struggling students requiring intervention. Robust digital infrastructure ensures reliable access to online educational content across diverse geographic contexts and socioeconomic backgrounds. Technical workforce capacity facilitates the development of localized content, adaptation of international resources to national curricula, and creation of user-friendly platforms that lower barriers to teacher and student adoption. Regulatory clarity around intellectual property, data privacy, and content licensing reduces implementation friction and encourages private sector participation in OER ecosystem development [
29].
The interaction patterns observed in subsample analyses reinforce this interpretation. OER policy effects show stronger positive associations in high-income countries and digitally advanced contexts where AI readiness infrastructure already exists. This heterogeneity suggests complementarity between policy mandates and enabling conditions rather than simple additive effects. Open educational resources function as one component within broader education technology ecosystems, and their effectiveness depends critically on the presence of supporting infrastructure, institutional capacity, and human capital that allows countries to move beyond policy adoption toward meaningful implementation.
5.3. Implications for Educational Technology Policy Design
These findings carry important implications for how policymakers conceptualize and implement digital education reforms in pursuit of SDG4 targets. The results caution against technological determinism that assumes policy adoption automatically produces desired outcomes regardless of contextual conditions. Open educational resources represent potentially valuable tools for expanding access, reducing costs, and improving educational quality, but they do not function as standalone solutions independent of broader systemic capacity [
1].
The complementarity between OER policies and enabling infrastructure suggests that optimal implementation strategies coordinate multiple interventions rather than pursuing digital education reforms in isolation. Meta-analytic research examining policy interventions across diverse socioeconomic contexts demonstrates that distributional impacts frequently diverge from aggregate estimates, with benefits and costs varying substantially across population subgroups [
85]. This heterogeneity reinforces the importance of designing coordinated strategies that account for contextual variation in implementation capacity and population characteristics. Countries might combine OER policy adoption with simultaneous investments in broadband expansion, teacher digital literacy programs, governance framework development, and innovation ecosystem strengthening. Such coordinated approaches create synergies unavailable when interventions proceed independently. For example, broadband expansion increases returns to OER policy by ensuring content accessibility, while teacher training programs increase returns to connectivity by enabling effective resource utilization. Development assistance programs could design integrated packages that bundle policy support with capacity-building initiatives, recognizing that neither proves sufficient without the other. This bundled approach differs fundamentally from current practice where digital infrastructure, teacher training, and policy frameworks often receive funding through separate channels with limited coordination.
The evidence suggests a sequencing challenge for countries at different stages of digital development. Nations with limited AI readiness face a fundamental choice between investing first in foundational infrastructure versus adopting ambitious policy frameworks that may remain aspirational without supporting capacity. The modest short-term effects observed for OER policies in low-readiness contexts indicate that policy adoption alone provides insufficient impetus for transformation when technological infrastructure, institutional frameworks, and human capital remain underdeveloped.
This pattern suggests that optimal policy strategies may differ substantially across development contexts. Digitally advanced nations with established AI readiness can pursue aggressive OER adoption with reasonable confidence that supporting infrastructure exists to translate policy into practice. These countries benefit from treating OER frameworks as accelerators that leverage existing capacity to achieve incremental improvements in access and quality. In contrast, countries with limited digital infrastructure may need to prioritize foundational investments in connectivity, governance frameworks, technical workforce development, and institutional capacity before formal OER policies can achieve meaningful impact.
However, this interpretation should not be construed as recommending that low-readiness countries postpone OER adoption until achieving some threshold level of digital development. Policy frameworks can serve important functions beyond immediate outcome generation, including signaling governmental commitment to educational innovation, creating regulatory clarity that encourages private investment, establishing quality standards for educational content, and building political coalitions supporting broader digital transformation. The key insight concerns tempering expectations about short-term measurable impacts while recognizing that policy adoption may catalyze longer-term ecosystem development.
5.4. Methodological Contributions and Limitations
This study makes several methodological contributions to the literature on educational technology policy evaluation. The integration of fixed effects and difference-in-differences specifications within a single analytical framework provides complementary evidence on policy associations while acknowledging the identification challenges inherent in observational panel data. The explicit attention to moderation effects through interaction terms and subsample analyses moves beyond simple average treatment effects to explore heterogeneity patterns that inform theoretical understanding and policy design. The compilation of a novel dataset linking OER policy adoption timing with AI readiness indicators and SDG4 outcomes across 187 countries represents an empirical contribution that enables previously infeasible analyses at global scale.
Nevertheless, several important limitations constrain the scope, precision, and generalizability of findings. These limitations warrant detailed discussion as they affect interpretation and establish boundaries for the conclusions that can be drawn from this evidence.
Data Quality and Measurement Precision
Approximately 38 percent of AI readiness observations in the final dataset rely on interpolated rather than directly observed values, concentrated in the 2015–2018 period before systematic index measurement began. The interpolation procedure assumes gradual linear evolution of readiness over time, which may not reflect actual trajectories if countries experienced punctuated changes due to major infrastructure investments, governance reforms, or technological disruptions. Measurement error introduced by interpolation likely attenuates estimated relationships between AI readiness and educational outcomes, biasing coefficients toward zero rather than creating spurious positive associations. However, the extent of attenuation cannot be precisely quantified, meaning the true strength of readiness effects may be larger than documented estimates suggest.
The OER policy variable reduces complex multidimensional frameworks to a binary indicator capturing presence or absence of formal policy structures. This coding strategy cannot distinguish between ambitious comprehensive strategies with substantial resource backing and symbolic policy adoption with minimal implementation support. Countries coded identically may differ dramatically in actual policy intensity, implementation quality, enforcement rigor, and integration with complementary educational reforms. This measurement simplification introduces classical errors-in-variables bias that attenuates estimated policy effects toward zero.
Educational outcome indicators aggregate across diverse subnational contexts, masking important regional and demographic heterogeneity within countries. National completion rates represent averages across provinces or states with potentially divergent educational infrastructure, varying policy implementation fidelity, and different population compositions. OER policies may produce concentrated benefits in specific geographic areas or socioeconomic groups while showing modest effects in national aggregates. This aggregation obscures distributional impacts relevant for equity assessment and may miss important success stories occurring at subnational scales.
Missing data affects approximately 12 percent of potential country-year observations for educational outcomes, with missingness concentrated in countries experiencing conflict, institutional disruption, or limited statistical capacity. If data availability correlates with unobserved factors affecting both policy adoption propensity and educational performance, then listwise deletion of missing observations introduces selection bias. Countries in the analytical sample may systematically differ from excluded nations in ways that affect the generalizability of findings to contexts with weaker institutional capacity or greater political instability.
Identification and Causality Challenges
The fixed effects approach removes time-invariant confounding but remains vulnerable to time-varying omitted variables that correlate with both policy adoption and educational outcomes. Countries adopting OER policies may simultaneously implement complementary educational reforms, experience political transitions affecting institutional capacity, or undergo economic shocks that independently influence educational performance. The absence of experimental variation means that documented associations cannot definitively establish causation despite the rigorous identification strategies employed.
The difference-in-differences framework depends critically on parallel trends assumptions that, while supported by visual diagnostics and pre-treatment balance tests, cannot be definitively verified. Countries selecting into OER policy adoption may differ systematically from non-adopters on unobserved dimensions including political commitment to educational innovation, institutional capacity for policy implementation, or responsiveness to international advocacy. These selection processes could generate differential outcome trajectories independent of policy effects, introducing bias that fixed effects cannot fully address.
The concentration of policy adoption near the end of the observation period prevents estimation of direct policy coefficients in the fixed effects specification for primary completion rates, limiting the study’s ability to document immediate policy impacts. While the difference-in-differences approach provides alternative identification, the relatively short post-treatment window constrains statistical power and prevents examination of whether effects accumulate or dissipate over longer timeframes.
Spillover effects between countries represent a potential threat to identification that standard panel methods cannot address. International diffusion of educational content, cross-border knowledge sharing through professional networks, and demonstration effects from early-adopting nations may create positive externalities benefiting control countries. If such spillovers are substantial, difference-in-differences estimates would understate true policy effects by comparing treated units against contaminated rather than pure controls. Conversely, if OER policies create competitive pressures or resource reallocation that disadvantages non-adopting neighbors, negative spillovers could inflate estimated treatment effects.
Temporal Scope and Observation Window
The 2015–2024 observation window captures OER policies in their infancy, with most frameworks implemented less than five years before the analysis endpoint. Educational outcomes respond slowly to policy interventions, with effects often materializing gradually as implementation deepens, complementary reforms align, and institutional capacity develops. Research on educational policy implementation suggests that three to five years typically elapse between adoption and measurable system-level impacts, with cumulative effects continuing to build over subsequent periods.
This temporal constraint means the analysis examines short-term associations rather than longer-term equilibrium effects. Policies showing modest immediate impacts may produce larger benefits as implementation matures, teacher capacity develops, content repositories expand, and institutional practices adapt. Conversely, initial positive associations might dissipate if implementation challenges emerge, political support wanes, or resource constraints prevent sustained investment. The findings thus represent a preliminary assessment rather than definitive evaluation of ultimate policy effectiveness.
The COVID-19 pandemic disrupted educational systems globally during 2020–2021, creating a major confounding event that coincides temporally with many OER policy adoptions. While year fixed effects remove average pandemic impacts common to all countries, differential national responses and varying pandemic severity across contexts introduce heterogeneity that may interact with policy implementation in complex ways. Disentangling pandemic effects from policy effects proves challenging given their temporal overlap.
Generalizability Constraints
Most OER-adopting countries in the sample represent middle or high-income nations with established digital infrastructure and institutional capacity. Only seven low-income countries adopted formal OER policies during the observation window, limiting the study’s ability to speak definitively about policy effectiveness in resource-constrained contexts where educational challenges prove most acute. The subsample analyses indicating negligible policy effects in low-income countries rely on small samples with wide confidence intervals, preventing strong conclusions about whether policies truly fail in these contexts or whether sample limitations prevent detection of existing effects.
Geographic concentration of policy adoption also constrains generalizability. European and North American countries account for a substantial proportion of adopters, with more limited representation from Africa, South Asia, and parts of Latin America. Cultural, institutional, and educational system differences across regions may affect policy implementation pathways and effectiveness mechanisms in ways not fully captured by the AI readiness construct. Findings may thus be more applicable to certain geographic and institutional contexts than others.
Outcome Measurement Breadth
The focus on two specific SDG4 indicators, while appropriate given data availability and policy relevance, provides an incomplete picture of OER policy impacts. Open educational resources may affect numerous dimensions of educational quality, equity, and efficiency beyond completion and enrollment rates, including learning achievement on standardized assessments, progression through grade levels, dropout patterns at secondary and tertiary levels, household educational expenditure, teacher preparation quality, curricular diversity, and student engagement. Comprehensive evaluation would require broader outcome measurement spanning these multiple dimensions of educational system performance.
The selected indicators emphasize access and participation rather than learning quality or skill development. Countries might improve completion rates through lower standards or reduced educational rigor rather than genuine capacity building. Without accompanying evidence on learning outcomes, increases in completion rates cannot be definitively interpreted as educational improvements. Future research incorporating international assessment data would provide valuable complementary evidence on whether OER policies affect educational quality alongside access.
5.5. Future Research Directions
The findings open several promising avenues for future investigation. Longitudinal research tracking countries over extended post-adoption periods would clarify whether the modest short-term effects observed represent genuine policy limitations or simply reflect insufficient time for impacts to materialize. Panel data extending through 2030 would capture a full decade of implementation experience and enable more definitive assessment of whether OER policies contribute meaningfully to SDG4 target achievement.
Qualitative comparative analysis examining implementation processes within specific country contexts would illuminate the mechanisms through which policies translate into practice and identify bottlenecks constraining effectiveness. Case studies comparing successful and unsuccessful implementation experiences could reveal critical success factors including stakeholder engagement strategies, teacher training approaches, content development processes, and integration with existing educational structures.
Subnational analysis leveraging within-country geographic variation would address concerns about aggregate-level measurement obscuring important heterogeneity patterns. Studies examining regional differences in implementation intensity and relating these to local educational outcome changes would provide stronger causal evidence while revealing distributional effects relevant for equity considerations.
Research explicitly examining the mechanisms linking AI readiness to OER policy effectiveness would advance theoretical understanding beyond the descriptive associations documented here. Mediation analyses could test whether specific readiness components including digital infrastructure, governance quality, or technical workforce capacity explain the moderating effects observed. Such investigations would provide actionable guidance for countries seeking to strengthen enabling conditions before or alongside OER policy adoption.
Finally, expanded outcome measurement incorporating learning achievement, skill development, and labor market impacts would provide a more complete picture of OER policy effects beyond simple access indicators. Integration of international assessment data, employment records, and earnings information would enable examination of whether open educational resources improve not just enrollment and completion but also the quality and economic returns of education.
6. Conclusions
This study examines the relationship between national open educational resource policies and Sustainable Development Goal 4 educational outcomes across 187 countries between 2015 and 2024, with particular attention to the moderating role of artificial intelligence readiness. The analysis employs fixed effects and difference-in-differences estimation strategies to examine policy associations while accounting for unobserved country heterogeneity and common time shocks. The findings reveal a nuanced pattern whereby AI readiness demonstrates consistent positive associations with educational performance, while standalone OER policy effects remain modest and statistically imprecise across multiple specifications.
The Temporal Constraint: Framing Preliminary Assessment
A critical caveat frames all findings presented in this analysis and shapes their appropriate interpretation. This research captures open educational resource policies in their infancy, with most frameworks implemented less than five years before data collection ended in 2024. Educational systems operate on timescales measured in years and decades rather than months and quarters. Students progress through multi-year educational cycles, teachers develop competencies gradually through iterative practice, institutions adapt slowly as evidence of effectiveness accumulates, and content ecosystems expand progressively as resources are created, tested, refined, and disseminated across educational communities.
The concentration of OER adoptions between 2019 and 2022 means we observe educational systems two to five years into implementation, precisely the period when effects begin emerging but before they reach full strength or stabilize at equilibrium levels. This timing shapes fundamentally what the analysis can and cannot establish with current data. The modest short-term associations documented here should be interpreted as early indicators rather than final judgments on policy effectiveness. The fruit has not yet ripened, and conclusions about ultimate harvest quality remain necessarily premature. Future research tracking these policies through 2030 and beyond will determine whether the directional signals we observe strengthen into robust effects justifying continued investment or whether initial promise fails to materialize into sustained improvements despite ongoing implementation efforts.
This distinction between preliminary assessment and definitive evaluation proves essential for appropriate interpretation and policy guidance. The analysis provides evidence on short-term associations during early implementation while acknowledging that longer-term effectiveness questions require extended observation windows not yet available. Dismissing OER policies based on modest effects at two to four years post-adoption would be as premature as declaring them successful based on directionally positive but statistically imprecise coefficients. The evidence establishes what we can observe at this early stage while maintaining appropriate epistemic humility about what remains unknown pending future data accumulation.
What the Evidence Does Demonstrate
The empirical analysis establishes several patterns with reasonable confidence despite temporal and statistical limitations. First, OER policies show no immediate large-scale transformative impacts on national educational indicators within short post-adoption windows. Countries adopting formal frameworks do not experience rapid improvements in primary completion rates or dramatic reductions in out-of-school rates during the first two to five years of implementation. This finding carries important implications for expectation management and implementation planning, indicating that quick wins should not be anticipated from such systemic interventions.
Second, artificial intelligence readiness exhibits consistent positive associations with educational performance across multiple specifications and outcome measures. A ten-point increase in the readiness index associates with approximately 0.46 percentage point improvements in primary completion rates and 0.31 percentage point reductions in out-of-school rates. While these coefficients approach but do not always achieve conventional statistical significance, the consistency of signs and magnitudes across specifications suggests genuine relationships between technological-institutional capacity and educational effectiveness. Countries with stronger digital infrastructure, governance frameworks, technical workforce availability, and innovation ecosystem development demonstrate better educational outcomes even after controlling for economic development and other confounding factors.
Third, interaction patterns between OER policies and AI readiness suggest that policy effectiveness may depend on digital capacity, though statistical precision remains limited. Subsample analyses confirm that policy associations concentrate in digitally advanced contexts, with high-income countries showing interaction coefficients approaching marginal significance while low-income subsamples yield coefficients near zero with wide confidence intervals. This heterogeneity aligns with theoretical expectations that enabling infrastructure conditions policy effectiveness, though definitive confirmation requires additional years of observation as lower-readiness countries mature their implementations.
Fourth, the difference-in-differences analysis comparing adopting and non-adopting countries indicates directional patterns consistent with positive policy effects. OER-adopting countries experienced completion rate increases averaging 0.52 percentage points relative to non-adopters during the post-2020 period, though substantial uncertainty surrounds this estimate (p equals 0.440). The positive sign and reasonable magnitude suggest potential benefits, but wide confidence intervals prevent ruling out null effects or even modest negative associations. This pattern should be understood as suggestive preliminary evidence rather than conclusive proof of causal impacts.
What the Evidence Cannot Yet Demonstrate
Equally important are the questions this analysis cannot definitively answer given temporal constraints and data limitations. The research cannot establish whether OER policies produce meaningful longer-term improvements as implementation deepens beyond the early stages captured here. Educational reforms often show modest initial effects that strengthen substantially as programs mature, implementation fidelity improves, and cumulative benefits compound across student cohorts. Whether OER policies follow this pattern or whether early modest associations represent ceiling effects remains unknown pending extended observation.
The analysis cannot determine whether early associations will remain stable, strengthen, or dissipate over subsequent implementation periods. Some educational interventions demonstrate initial promise that fails to translate into sustained benefits as novelty effects fade, implementation challenges accumulate, or political support wanes. Other interventions show accelerating returns as organizational learning occurs, complementary investments accumulate, and ecosystem effects emerge. Distinguishing between these trajectories requires longitudinal data spanning full implementation cycles beyond what current observations permit.
The research cannot assess whether cumulative exposure throughout complete educational cycles generates benefits not yet visible in aggregate data capturing students with partial OER experience. Students entering education systems after comprehensive implementation may experience fundamentally different educational environments than early cohorts navigating transition periods. The full impact of OER policies on students experiencing such instruction throughout their entire primary schooling cannot be observed until those cohorts complete their education and appear in national statistics, a process extending beyond 2024 for most adopting countries.
The study cannot establish precise mechanisms through which AI readiness moderates policy effectiveness, distinguishing whether infrastructure, governance, human capital, or innovation dimensions drive conditional relationships most strongly. While the composite readiness measure demonstrates consistent associations, decomposing which specific components matter most for enabling OER effectiveness requires granular analyses examining individual dimensions separately. Such decomposition would provide actionable guidance for countries seeking to strengthen enabling conditions but proves infeasible with current aggregate readiness indices.
Implications for Policy Design and Strategic Sequencing
The results underscore the importance of coordinated investment in enabling infrastructure alongside formal policy adoption. Countries pursuing open educational resource strategies must ensure adequate digital connectivity exists to deliver content reliably, establish clear governance frameworks for content licensing and quality assurance, develop technical workforce capacity to create and adapt educational materials, and build institutional structures supporting effective implementation at scale. Policy adoption in the absence of these enabling conditions risks producing symbolic reforms that fail to translate into classroom-level changes and measurable outcome improvements.
The heterogeneity in policy associations across development contexts suggests that uniform recommendations prove inappropriate for countries at different stages of digital capacity. Digitally advanced nations with established AI readiness infrastructure can pursue aggressive OER adoption with reasonable expectation that supporting capacity exists to translate policy into practice. These countries benefit from treating OER frameworks as accelerators leveraging existing infrastructure to achieve incremental improvements in access, quality, and cost-efficiency. The marginal significance of interaction coefficients in high-income subsamples supports this interpretation, suggesting that well-resourced digitally advanced contexts realize measurable benefits from policy adoption even within relatively short observation windows.
Countries with limited digital infrastructure face more complex sequencing decisions and strategic choices. The evidence of negligible short-term policy effects in low-readiness contexts indicates that standalone policy adoption provides insufficient impetus for transformation when technological infrastructure, institutional frameworks, and human capital remain underdeveloped. These nations may benefit from prioritizing foundational investments in connectivity, governance capacity, and technical workforce development before or alongside formal OER policy adoption. However, this interpretation should not be construed as recommending that low-readiness countries postpone policy frameworks indefinitely until achieving arbitrary development thresholds.
Policy adoption can serve important functions beyond generating immediate measurable impacts on aggregate educational indicators. Formal frameworks signal governmental commitment to educational innovation, creating political momentum for complementary investments and institutional changes. Clear regulatory structures around content licensing reduce uncertainty and encourage private sector participation in developing educational technology platforms and tools. Policy mandates establish quality standards and curricular integration requirements that shape ecosystem development over extended periods. National OER strategies build political coalitions supporting broader digital transformation by engaging education ministries, teachers’ unions, technology sectors, and civil society organizations around shared objectives.
The appropriate policy guidance therefore emphasizes coordinated strategies that sequence and bundle interventions rather than simple recommendations for or against adoption. Countries should assess their readiness for effective implementation across multiple dimensions, identify critical capacity gaps requiring attention, and design phased approaches that build enabling conditions progressively while advancing policy frameworks in parallel. International development assistance should support integrated packages combining infrastructure investment, institutional strengthening, and policy development rather than treating these elements as independent interventions proceeding through separate funding channels.
Implications for International Development Assistance
The findings hold particular relevance for international development organizations, bilateral donors, and multilateral institutions supporting educational reform in low and middle-income countries. Development assistance strategies should balance support for ambitious policy frameworks with foundational investments in digital infrastructure, institutional capacity, and human capital development that enable effective implementation. Technical assistance programs can help countries conduct comprehensive readiness assessments identifying specific bottlenecks and binding constraints, design sequenced reform strategies that address capacity gaps before or alongside policy adoption, and establish realistic implementation timelines acknowledging the extended periods required for educational system transformation.
Resource allocation decisions should account for the conditional nature of educational technology effectiveness documented in this analysis. Countries demonstrating strong AI readiness and digital infrastructure represent promising contexts for scaling OER initiatives with reasonable expectation of measurable impacts even within medium-term timeframes. Countries with limited technological capacity may benefit more from foundational infrastructure development and institutional strengthening before attempting comprehensive OER policy rollout. International organizations promoting OER adoption should provide differentiated guidance acknowledging that optimal strategies vary substantially across development contexts rather than offering uniform recommendations assuming equivalent implementation environments.
The evidence on interaction effects between policies and readiness suggests value in bundled assistance packages that address multiple enabling conditions simultaneously. Rather than separating infrastructure projects, governance technical assistance, teacher training programs, and policy support into independent workstreams, integrated approaches that coordinate these elements create synergies unavailable when interventions proceed independently. Broadband expansion increases returns to OER policy by ensuring content accessibility, while teacher training programs increase returns to connectivity by enabling effective resource utilization. Development partners could design comprehensive country assistance frameworks that sequence and coordinate interventions strategically rather than pursuing parallel uncoordinated initiatives.
Research Contributions and Methodological Implications
For researchers, the study demonstrates the value of multi-level analysis that integrates policy evaluation with attention to contextual moderators and enabling conditions. The complementary use of fixed effects and difference-in-differences identification strategies provides evidence on policy associations while acknowledging the inherent limitations of observational data for establishing causation. The panel data approach with multiple specifications and extensive robustness procedures strengthens confidence that documented relationships reflect genuine associations rather than spurious correlations or specification artifacts.
The compilation and harmonization of cross-national panel data linking policy adoption timing, technology readiness indicators, and educational outcomes creates infrastructure for future research examining evolving relationships as policies mature and implementation deepens. The dataset spanning 187 countries across ten years represents an empirical contribution enabling analyses previously infeasible due to data fragmentation across multiple international sources. The systematic coding of OER policy adoption provides baseline documentation for tracking implementation evolution and conducting future evaluations with extended observation windows.
The analysis also highlights critical methodological challenges that future research must address. The limited within-country temporal variation preventing estimation of direct policy coefficients in fixed effects specifications reflects genuine data structure constraints that panel methods cannot overcome when policies concentrate near observation endpoints. Alternative identification strategies including synthetic control methods, instrumental variable approaches exploiting plausibly exogenous adoption determinants, or regression discontinuity designs leveraging sharp eligibility cutoffs may provide complementary evidence strengthening causal inference.
The statistical imprecision characterizing many estimates emphasizes the fundamental tension between global scope and analytical power in cross-national research. Expanding geographic coverage to 187 countries provides important external validity benefits and policy relevance, but the resulting sample remains modest relative to the complexity of relationships examined and the number of potential confounding factors requiring control. Future work might benefit from focused regional analyses trading breadth for depth, examining specific contexts with richer data availability, or employing mixed-methods approaches combining quantitative panel analysis with qualitative case studies illuminating causal mechanisms.
Future Research Priorities
Several promising avenues emerge for future investigation as policies mature and additional data accumulate. Longitudinal research tracking countries over extended post-adoption periods would clarify whether the modest short-term effects observed represent genuine policy limitations or simply reflect insufficient time for impacts to materialize fully. Panel data extending through 2028 or 2030 would capture a full decade of implementation experience for early adopters and enable more definitive assessment of whether OER policies contribute meaningfully to Sustainable Development Goal 4 target achievement.
Qualitative comparative analysis examining implementation processes within specific country contexts would illuminate mechanisms through which policies translate into practice and identify bottlenecks constraining effectiveness at different development stages. Detailed case studies comparing successful and unsuccessful implementation experiences could reveal critical success factors including stakeholder engagement strategies, teacher training approaches, content development processes, quality assurance systems, and integration with existing educational structures. Such process research would complement quantitative outcome evaluation by explaining why policies work or fail in particular contexts.
Subnational analysis leveraging within-country geographic variation would address concerns about aggregate-level measurement obscuring important heterogeneity patterns. Studies examining regional or district-level differences in implementation intensity and relating these to local educational outcome changes would provide stronger causal evidence through finer geographic resolution while revealing distributional effects relevant for equity considerations. Micro-level analyses at school or classroom levels could identify specific pedagogical practices and resource utilization patterns associated with better outcomes.
Research explicitly examining mechanisms linking AI readiness to OER policy effectiveness would advance theoretical understanding beyond the descriptive associations documented here. Mediation analyses could test whether specific readiness components including digital infrastructure, governance quality, technical workforce capacity, or innovation ecosystem strength explain the moderating effects observed in interaction specifications. Decomposing the composite readiness measure into constituent dimensions and examining each separately would provide actionable guidance for countries seeking to strengthen enabling conditions most efficiently.
Expanded outcome measurement incorporating learning achievement, skill development, and labor market impacts would provide a more complete picture of OER policy effects beyond simple access indicators. Integration of international assessment data from PISA, TIMSS, or regional testing programs would enable examination of whether open educational resources improve not just enrollment and completion but also cognitive skill development and subject matter mastery. Linking educational records to employment outcomes and earnings data would permit assessment of whether OER exposure translates into improved labor market opportunities and economic returns to education.
Concluding Perspective on SDG4 Progress
Looking toward 2030 and the terminal date for Sustainable Development Goal achievement, the evidence suggests that open educational resources will play an important but conditional role in global progress toward universal quality education. The technology holds genuine promise for expanding access by reducing cost barriers, improving quality through enabling content localization and continuous updating, and supporting equity by reaching geographically isolated or economically disadvantaged populations. However, realizing this potential requires recognizing that OER policies operate within complex ecosystems where effectiveness depends on multiple reinforcing factors beyond simple policy adoption.
Countries combining policy adoption with sustained investment in digital readiness infrastructure including connectivity, governance frameworks, technical capacity, and innovation ecosystems can expect OER frameworks to contribute meaningfully to expanded access, reduced costs, and improved educational quality over medium to longer-term horizons. The directional evidence from early implementation phases, while statistically imprecise, suggests potential for positive impacts as programs mature. Nations lacking foundational technological and institutional capacity should recognize that policy adoption alone provides insufficient impetus for transformation without complementary investments in enabling conditions.
The path to SDG4 achievement requires acknowledgment that educational technology policies function as components within broader educational systems rather than standalone solutions. Open educational resources represent valuable tools within the global education technology portfolio, but their successful deployment demands careful attention to implementation contexts, patient work of building institutional capacity and stakeholder commitment, and coordination with complementary investments in infrastructure and human capital. Success depends not on technological solutions alone but on the complex interplay between policy design, implementation capacity, institutional adaptation, and sustained political commitment.
The results presented here provide evidence-based guidance for this ongoing work while acknowledging substantial uncertainty about longer-term outcomes that require extended observation to resolve. Future research tracking these policies through subsequent decades will clarify whether the modest short-term associations documented represent the initial stages of larger impacts emerging as implementation matures or whether early patterns prove indicative of ultimate effectiveness ceilings. Continued investigation of mechanisms linking digital readiness to policy effectiveness will advance theoretical understanding and provide actionable guidance for countries seeking to optimize educational technology investments.
As the international community approaches the final years of the current SDG framework and begins conceptualizing successor development agendas beyond 2030, evidence on educational technology policy effectiveness will prove essential for designing strategies that translate ambitious global commitments into concrete improvements in educational access, quality, and equity for all children. This analysis contributes baseline evidence documenting early-stage patterns and establishing conditional relationships while recognizing that comprehensive evaluation requires temporal perspective extending well beyond the observation windows currently available. The findings establish what we can observe during policy formation while maintaining appropriate humility about ultimate effectiveness questions that only time and continued research can definitively answer.




 ,
,