Article

Green Supply Chain Management, Green Innovation, and Carbon-Neutral Performance: A Meta-Analytic Examination of the Moderating Role of Sustainability Metrics


by
Resul Öztürk
1,
Mehtap Öztürk
2,
Zeynep Kızılkan
1,
Constantin Dumitrașcu
3,
Daniela Cîrțînă
4,*,
Stefan Sorinel Ghimiși
5,
Cătălina Aurora Ianăși
5 and
Alin Nioață
5
1
Department of International Trade and Finance, Selçuk University, Konya 42250, Turkey
2
Department of Business Administration, Selçuk University, Konya 42250, Turkey
3
Department of Quality Engineering and Industrial Technologies, National University of Science and Technology Politehnica Bucharest, RO-060042 Bucharest, Romania
4
Department of Health and Motricity, Constantin Brancusi University of Targu Jiu (UCB), RO-210185 Targu Jiu, Romania
5
Department of Industrial and Automation Engineering, Constantin Brancusi University of Targu Jiu (UCB), RO-210185 Targu Jiu, Romania
*
Author to whom correspondence should be addressed.
Sustainability 2026, 18(2), 681; https://doi.org/10.3390/su18020681
Submission received: 10 November 2025 / Revised: 16 December 2025 / Accepted: 29 December 2025 / Published: 9 January 2026

Abstract

The accelerating global transition toward low-carbon production and sustainable value chains has intensified interest in practices that enhance environmental performance, particularly green supply chain management (GSCM) and green innovation (GI). Although these practices are widely promoted, empirical findings regarding how GSCM influences GI and carbon-neutral supply chain performance (CNSCP) remain dispersed and context-dependent. This study aims to synthesize and clarify these relationships by conducting a systematic meta-analysis grounded in the Resource-Based View (RBV) and Natural Resource-Based View (NRBV). Analyzing 24 studies published between 2017 and 2025, the research investigates the direct effects of GSCM on GI and CNSCP and examines the moderating roles of key sustainability metrics—CO2 emissions, renewable energy use, carbon tax, Frontier Technologies Index (FTI), and Global Sustainable Competitiveness Index (GSCI)—across low- and high-income countries. The findings reveal that GSCM significantly enhances both GI and CNSCP. Furthermore, strong sustainability infrastructures and stringent regulatory environments in high-income countries amplify these relationships, whereas infrastructure deficiencies and weaker regulatory systems in low-income countries limit their strength. These results demonstrate that sustainability metrics meaningfully condition the effectiveness of GSCM practices. Overall, this study highlights the strategic importance of GSCM in fostering CNSCP and provides theoretical insights and practical recommendations for policymakers, managers, and governments seeking to achieve long-term carbon neutrality goals.

1. Introduction

The increasing concern about environmental issues globally has led individuals, consumers, communities, and governments to demand more eco-friendly products [1]. As awareness of these issues grows, businesses realize the importance of adopting diverse environmental strategies. One practical solution to address these concerns is GSCM [2]. Society’s increasing awareness of environmental issues has led to specific supply chain management practices that encompass the design, procurement, production, distribution, usage, reuse, and disposal of goods and services [3]. This approach, especially favored by manufacturing companies, aims to reduce negative environmental impacts, such as pollution, resource waste, and improper product disposal [4,5]. In the literature, GSCM activities are grouped into several categories, including Internal Environmental Management (IEM), eco-design (ED), green purchasing (GP), environmental cooperation (EC), and reverse logistics (RL). These activities help businesses reduce packaging and waste, create more eco-friendly products, and decrease CO2 emissions during production and distribution [6,7]. Moreover, GSCM allows companies to lessen environmental harm during manufacturing and avoid harmful emissions [8]. As a result, many manufacturing firms are adopting GSCM practices to lower pollution, conserve natural resources, and reduce CO2 emissions [3]. This approach has been developed in response to the increasing demand for environmental regulations [8].
GI has recently emerged as a key environmental management strategy for addressing pollution and responding to increasing environmental pressures [5,9,10]. GI refers to the development of new ideas, services, processes, or managerial practices aimed at solving environmental problems [7,11]. It influences both the design of green products and the redesign of existing ones, reducing negative environmental impacts across all stages of the product life cycle [9]. In manufacturing contexts, GI enables firms to lower energy consumption, reuse materials, and optimize production processes by integrating environmentally friendly practices. These improvements not only reduce production costs and enhance economic efficiency but also strengthen business performance, corporate reputation, and competitive advantage [12].
The product life cycle plays a crucial role in the strategic interdependence between GSCM and GI, with product lifecycle management forming a key link between the two [5,13,14]. The primary goal of GI is to embed environmentally conscious principles across supply chain activities to minimize environmental impacts throughout the product life cycle, making GI both a key driver of sustainability and a foundational element of GSCM [5,15]. Accordingly, businesses can gain competitive advantage and mitigate environmental problems in the manufacturing sector by integrating GSCM practices that are aligned with the GI concept into their operations, thereby enhancing environmental performance [5]. In recent years, growing concerns about economic development, environmental pollution, climate change, and global warming have brought carbon neutrality to the forefront of global agendas [16,17]. Climate change has made achieving carbon neutrality one of the most urgent priorities worldwide, prompting governments to introduce carbon-reduction and sustainability policies, such as the European Union’s corporate sustainability reporting framework and China’s carbon summit action plan targeting pre-2030 goals [18,19,20]. Rising environmental awareness has also increased consumer demand for green products, leading researchers and businesses to emphasize the integration of GSCM and carbon-neutrality capabilities (CNCs) as critical elements of sustainable transformation [18,21]. By striving for carbon neutrality, companies can reduce their carbon footprint and greenhouse gas emissions while improving overall sustainability performance [22]. Consequently, the literature has begun to move beyond the traditional focus on the impact of GSCM on corporate performance to highlight the central role of carbon neutrality within supply chains, and leading global companies are already incorporating carbon-neutral strategies into their operations and supply networks [23,24,25].
In this study, the NRBV is adopted as the central theoretical lens because it explains why environmentally oriented capabilities—particularly those embedded in GSCM and GI—shape firms’ competitive and sustainability outcomes. Extending the resource and capability perspective, NRBV builds on Barney’s view that valuable, rare, inimitable, and non-substitutable resources underpin competitive advantage [26] by arguing that environmental pressures, resource constraints, and ecological risks require firms to develop new environmental capabilities. Hart’s contribution reinforces this logic by showing that integrating environmental considerations into corporate strategy enhances long-term performance and extends the RBV toward natural resource dependence and ecological responsiveness [27,28].
Within this framework, NRBV clarifies why GI is essential: firms need to innovate through renewable energy solutions, sustainable materials, carbon-reducing technologies, and low-impact processes to protect natural resources and respond to environmental challenges [29]. Likewise, GSCM represents the operational extension of NRBV across the value chain, as reducing environmental impacts from raw material extraction to final delivery requires resource-efficient procurement, eco-design, cleaner production, and sustainable logistics. NRBV therefore conceptually justifies the complementary relationship between GSCM and GI—where GSCM provides the structural and process-based conditions for environmental improvement and GI supplies the technological and capability-based mechanisms for pollution prevention, ecological balance, and progress toward carbon neutrality. In turn, this alignment supports the expectation that both GSCM and GI contribute meaningfully to environmental sustainability and carbon-neutral performance [30].
Numerous previous studies have examined the complex relationship between GI and GSCM. These studies demonstrate that GI is not a static concept but can be significantly influenced by the dynamic nature of various stakeholders and environmental conditions [31,32,33,34,35,36,37]. Although previous studies have examined the relationships between GSCM, GI, and CNSCP in isolation, this study is the first to integrate these fragmented findings and provide a more generalizable, cross-context assessment using a meta-analytic approach. In doing so, it advances the literature in two key ways: first, by offering a comprehensive, evidence-based evaluation of how GSCM relates to both GI and CNSCP across different methodological and contextual settings; and second, by unpacking GI into its core subcomponents and analysing each separately. This fine-grained perspective deepens our understanding of how distinct dimensions of GI differentially interact with GSCM, thereby sharpening both the theoretical articulation and the practical implications of GSCM–GI linkages.
Furthermore, this study systematically examines how GSCM influences GI and CNSCP, and analyzes how these relationships vary across contextual, methodological, and economic conditions. Building on the comprehensive life cycle framework developed by [5], which spans raw material sourcing to end-of-life processes, this study extends the framework to the CNSCP context and contributes meaningfully to the existing literature. Accordingly, this research is structured around four central questions.
RQ1. This study aims to examine the relationships between GSCM and GI through a meta-analytic approach.
RQ2. The relationships between GSCM and CNSCP will be investigated using the meta-analysis method.
RQ3. The study intends to analyze the relationships between GSCM and the sub-components of GI separately.
RQ4. The influence of methodological, economic, and contextual factors on the strength of the GSCM–GI and GSCM–CNSCP relationships will be assessed.
The study is organized into six comprehensive sections. The first introduces the topic and summarizes the research objectives. The second provides a detailed definition of the theoretical framework, establishing a clear conceptual foundation. The third offers a thorough literature review, defines key terms, develops research hypotheses, and summarizes the conceptual model guiding the research. The fourth explains the research methodology, including specific measurement techniques, tools, and data-collection procedures, along with relevant case study information. In Section 5, we present the analysis results and interpret them in line with existing literature. Finally, the sixth concludes the study by presenting key findings, discussing theoretical and managerial implications, addressing limitations, and offering thoughtful suggestions for future research.

2. Conceptual Framework

2.1. Green Supply Chain Management (GSCM)

Environmental protection movements emerged in the mid-1960s, prompting society to recognize its responsibility towards various environmental issues [7,38,39]. Alongside growing individual awareness of environmental significance, several managers began to advocate for a similar commitment from businesses, urging them to prioritize environmental protection [40,41]. Addressing environmental concerns is imperative to promote sustainable management practices that reduce greenhouse gas emissions and environmental pollution amid escalating global environmental change. This shift is supported by both international environmental conventions and national regulations [33,42,43]. As consumer awareness and environmental concerns have heightened, numerous businesses have taken proactive measures to eliminate environmentally harmful operations, recognizing the importance of meeting customer expectations [3]. To effectively address these increasing demands, organizations have begun developing sustainable or environmentally responsible practices and integrating them into their operational frameworks. These green practices encompass various aspects, including procurement, design, manufacturing, packaging, marketing, and product and service distribution [44]. Consequently, these activities have been incorporated into GSCM strategies by manufacturing entities seeking sustainable production methods [45]. Many researchers and entrepreneurs advocate for GSCM as a robust solution to enhance and sustain environmental integrity [3].
Initially proposed in the late 1980s, GSCM gained significant traction around 2000, as evidenced by a marked increase in scholarly publications [3]. In the 1990s, GSCM focused primarily on the supplier dimension, with the concept of green purchasing dominating discussions. By the late 1990s, the emphasis broadened to encompass environmental issues related to supply chains, including RL, IEM, eco-design, and customer collaboration [15,46,47,48,49].
GSCM has recently become an increasingly prominent focus of interest both academically and in practice. Research conducted in recent years (see [33,39,41]) has demonstrated that GSCM applications have consistent and positive effects on the three components of sustainable performance: environmental, economic and social performance. Furthermore, in terms of environmental performance, significant progress has been made, with critical outcomes such as reduced greenhouse gas emissions, improved waste management, and optimised use of natural resources. GSCM has gained strategic importance as organizations increasingly seek to reduce environmental harm and enhance interactions between suppliers and customers of green products [3]. Positioned at the intersection of complex environmental and operational issues, GSCM has become a fundamental sustainability approach in response to global ecological pressures and climate change [50]. It is widely recognized as one of the most effective environmental management practices in the professional industry [3]. GSCM integrates environmental practices into supply chain processes, encompassing activities such as waste reduction, pollution prevention, ED, GP, IEM, and RL [51,52]. Components of GSCM:
  • GP involves the procurement of environmentally friendly products, as noted by Younis, Sundarakani and Vel [53] and Zhang, Liang [54].
  • IEM is crucial in organizations’ strategic planning. It encompasses internal political arrangements, action plans, objectives, and environmental strategies to manage the environmental impact of business operations [55,56].
  • The objective of ED is to incorporate environmental considerations into product packaging, design, or redesign processes [45].
  • CEC refers to internal and external cooperation within each department of the company and among different stakeholders to adopt green supply chain practices [53].
  • RL involves the planning and management of returning products from their point of consumption back into the supply chain for purposes such as recycling, refurbishment, remanufacturing, or proper disposal, thereby recovering value through activities such as reuse [57,58,59].
Aligning the various components of GSCM is crucial for achieving sustainability and maintaining competitive advantage. This alignment covers sourcing, manufacturing, product design, distribution, logistics, marketing, delivery, and end-of-life management, which should be integrated into a cohesive, environmentally oriented supply chain strategy. Emphasizing eco-friendly product characteristics throughout the supply chain is particularly important for driving sustainability [8]. By embedding sustainable practices at every stage—from raw material selection to eco-conscious delivery—organizations can meet regulatory requirements, respond to increasing consumer demand for responsible production and consumption, and strengthen both their supply chain and brand reputation in a competitive marketplace [8].

2.2. Green Innovation (GI)

As public concern for environmental issues has escalated, GI and Environmental Innovation (EI) have emerged as significant business opportunities [60,61]. GI has evolved into a strategic approach through which organizations can mitigate direct and indirect environmental impacts [5]. This strategy minimizes negative environmental consequences and enhances product differentiation across various ideas, products, processes, services, and competing entities [5]. GI refers to managing environmental concerns and effectively addressing pollution caused by industrial activities and households, encompassing waste generation, urban sprawl, and unsustainable resource consumption [62]. Furthermore, GI alleviates adverse environmental effects and bolsters firms’ economic and social performance through reduced waste and costs. Thus, it represents a distinctive capability that minimizes the environmental footprint of all organizational activities [63]. GI embodies improvements in products or processes that either lessen the ecological burden associated with business operations or fulfill sustainability objectives [7]. It is a method that enhances the life cycle of new products and services, systematically integrating these strategies into the supply chain. This integration is anticipated to provide ongoing alternatives and innovative pathways at each supply stage, offering manufacturers fresh ideas, methodologies, or technologies to develop their products [5]. In academic literature, numerous researchers have classified GI into two primary categories: “Green Product Innovation (GPDI)” and “Green Process Innovation (GPCI)” [64]. Some scholars have expanded this categorization to include “Green Management Innovation (GMI)” as a third component [1,7,9,65], while others have delineated four segments, incorporating “Green Marketing Innovation (GMRKI)” [5]:
  • GPDI involves the formulation of products that generate lower pollution levels and utilize environmentally friendly materials, characterized by less toxic substances, designs for recyclability or biodegradability, and eco-labeling practices [1,65,66].
  • GPCI is characterized by implementing innovative techniques to mitigate the environmental impacts stemming from detrimental production processes [14,65].
  • GMI pertains to developing new management strategies that enhance green practices [67].
  • GMRKI encompasses the integration of environmental criteria into product marketing alongside voluntary eco-labeling initiatives such as franchising, licensing, and pricing strategies [15]. Contemporary businesses must prioritize GMRKI as part of their comprehensive approach to sustainable development. GMRKI necessitates that companies merge their unique attributes with the marketing environment, thus representing an elevated level of engagement [5,66].
GI is a valuable business asset that fosters a competitive image and significantly contributes to sustainable development. In essence, GI addresses the ongoing challenge of resource consumption while preserving current resources for future generations [68]. Consequently, GI is an essential strategy for organizations seeking a competitive advantage while safeguarding the environment. It assures efficiency and effective resource utilization, ultimately enhancing overall business performance [69].

2.3. Carbon-Neutral Supply Chain Performance (CNSCP)

In light of the ongoing acceleration of global warming, particularly following the Paris Agreement [70,71], governments have initiated the development of carbon-neutral policies to encourage businesses to engage in carbon-reduction initiatives to fulfill sustainable development objectives [72,73,74]. The institutional theory posits that carbon neutrality policies are significant drivers of pressure and specific behaviors among corporate governance, compelling businesses to adapt [73]. Consequently, the increasing imposition of carbon taxes and coercive pressures from governmental authorities has prompted organizations to implement new strategic plans that incorporate environmental regulations and integrate carbon emissions considerations into supply chain management [18,71]. The growing awareness among governments, consumers, and the public about corporate environmental responsibility has propelled businesses toward pursuing CNSC, making it a multifaceted imperative for many organizations. GSCM practices underscore this imperative as a crucial first step in achieving CNSC [18,75]. Numerous studies have indicated that logistics performance in supply chain management significantly influences carbon emissions [73]. Thus, adopting sustainable practices within GSCM, including sustainable manufacturing, eco-design, and RL, is viewed as an effective strategy to optimize corporate carbon emissions [76]. Globally, carbon neutrality is recognized as one of the most pressing tasks for mitigating the adverse impacts of climate change and global warming [77]. Given the urgency of this situation, carbon neutrality has emerged as a critical goal for organizations, governments, and individuals worldwide [22,25]. In response to growing calls for action against climate change, nations are striving to achieve carbon neutrality between 2050 and 2070 [78]. It is widely acknowledged that carbon neutrality is intricately linked to the dynamics of rapid international trade and global supply chain management, with numerous scholars emphasizing the impact of global supply chains on carbon footprints [79]. This heightened focus on carbon neutrality has increased scrutiny of corporate practices, particularly within supply chain processes with a substantial environmental footprint, notably in manufacturing and logistics [80].
Furthermore, the supply chain is responsible for a significant portion of carbon dioxide emissions due to the transportation of goods [25]. Therefore, the pursuit of CNSC has emerged as an essential approach for enhancing supply chain and logistics practices [22,80,81]. In this context, carbon neutrality is recognized as a universally acknowledged mandate for businesses to mitigate the detrimental environmental effects of their operations. It has been suggested that the consumption of resources and energy be minimized through innovative methodologies that contribute to attaining carbon neutrality goals [19]. Thus, CNSC represents a strategic priority for sustainable business practices and adaptation to the evolving global environment [23]. Achieving carbon neutrality is imperative today to mitigate the consequences of climate change and global warming [22].

3. Literature and Hypothesis Development

3.1. GSCM and GI Relationship

The international literature consistently demonstrates a strong and positive relationship between GSCM and GI. Purwanto [82] found that GSCM practices significantly enhance GI and environmental performance (EP), with GI mediating the GSCM–EP relationship. Similarly, Rasheed and Rashid [35] reported that waste management and GI act as key mediators strengthening the link between GSCM and EP, emphasizing that adopting green practices improves environmental outcomes, reduces waste, enhances stakeholder relations, lowers costs, and strengthens brand reputation. Karim and Kawser [34] showed that in the healthcare sector, GSCM significantly influences GI and EP, with Green Technology Innovation (GTI) and Green Management Innovation (GMI) mediating this relationship. Novitasari and Agustia [83] confirmed that GSCM positively impacts both GI and firm performance (FP), with GI serving as a mediator. Darwish, Shah, and Ahmed [84] reported that Green Practices (GP), Integrated Environmental Management (IEM), and Clean Energy Consumption (CEC) positively affect EP, with GI moderating the effects of GP and IEM. Shafique, Asghar, and Rahman [85] highlighted that GSCM and GI together enhance economic sustainability and EP. Likewise, Liu, Yousaf, and Rosak-Szyrocka [86] demonstrated significant interrelationships among GSCM, GI, zero waste management, and EP, identifying GI as a key mediating mechanism. CSR-oriented studies by Le, Vo, and Venkatesh [87] and Le, Nhu [33] further showed that GI and GSCM strengthen the links among corporate responsibility, digital innovation (DI), and sustainable company performance (SCP).
These findings align with the NRBV perspective, which argues that firms must develop environmental capabilities—such as pollution prevention, sustainable process design, and clean technologies—to achieve competitive advantage under environmental constraints. GI, through its components such as green product development innovation (GPDI), green process innovation (GPCI), and green management innovation (GMI), constitutes the core of these capabilities [1,5,7,12,15,62,64,65], while GSCM operationalizes them across the supply chain [5,12,88]. Therefore, the positive effect of GSCM on GI is not only empirically supported but also theoretically expected: firms must innovate to reduce resource dependency, increase energy efficiency, and minimize ecological impacts [88]. A substantial body of literature confirms that such green initiatives strengthen GI, which in turn enhances environmental and economic performance, contributing directly to competitive advantage and corporate reputation [89,90,91,92]. Building on this extensive body of literature, the following hypothesis is proposed.
H1. 
There is a positive and significant relationship between GSCM and GI.

3.2. GSCM and CNSCP Relationship

A review of the international literature demonstrates strong and consistent evidence supporting the relationships among GSCM, GI, and CNSCP. Naz and Samadhiya [24] found that the subcomponents of GSCM—Green Management (GM), ED, GP, and Industrial Recycling (IR)—significantly enhance CNSCP, with Logistics Eco-centers (LEs) acting as a positive mediator. Similarly, Tetteh, Mensah and Owusu Kwateng [80] reported that Green Logistics Performance (GLP) and its five dimensions—transportation, warehousing, packaging and distribution, logistics information sharing, and sustainable waste management—contribute substantially to CNSCP, emphasizing the strategic value of GLP for sustainable supply chain management. Koh and Jia [22] highlighted that carbon neutrality plays a critical role in reducing greenhouse gas emissions, noting that supply chain practices grounded in GSCM can strengthen brand reputation and improve organizational competitiveness. Chen and Guo [20] further demonstrated that GSCM enhances Carbon Neutral Capability (CNC), and through CNC and Digital Transformation (DT), firms can improve overall performance. Lee and Hussain [93] argued that achieving carbon neutrality requires closing operational gaps across the supply chain, particularly through the adoption of GP. Liu and Wu [72] likewise stressed that carbon neutrality should be pursued through collective actions at the supply chain level.
Evidence from various countries reinforces these findings. Liu, G. and Liu, J. [94] and Patil, Shardeo [18] emphasized that rapid industrialization and global supply chains intensify environmental degradation, advocating for carbon footprint reductions across supply chain networks. Chen and Jang [78], Qin, Kirikkaleli [79], and Zeng, Li [70] stressed that carbon neutrality requires not only green products but also the redesign of production processes. Liu, Gao [73] found that GLP significantly reduces carbon emissions in Asian economies, while GI has a statistically significant negative effect on CO2 emissions. Qin, Kirikkaleli [79] also revealed that environmental policy (EP), GI, renewable energy, and the Composite Risk Index (CRI) jointly contribute to carbon-neutrality outcomes. In China, Zeng, Li [70] showed that Green Technology Innovation (GTI) reduces carbon emissions both locally and through spatial spillover effects.
These findings align closely with the Natural Resource-Based View (NRBV), which posits that firms must develop environmental capabilities—such as pollution prevention, energy efficiency, sustainable process design, and clean technologies—to achieve competitive advantage under environmental constraints. GI, through components such as green product development innovation (GPDI), green process innovation (GPCI), and green management innovation (GMI), represents the core of these capabilities [1,5,7,12,15,62,64,65], while GSCM operationalizes them across the supply chain, enabling firms to reduce ecological impacts and progress toward carbon neutrality [5,12,88]. Thus, the positive relationships observed between GSCM–GI and GSCM–CNSCP are not only empirically validated but also theoretically expected under NRBV, as firms must innovate to reduce resource dependence, enhance environmental efficiency, and mitigate ecological risks [88]. Building on this extensive body of literature, the following hypothesis is proposed.
H2. 
There is a positive and significant relationship between GSCM and CNSCP.

3.3. Moderator Effect

Moderator variables in meta-analysis, unlike standard moderators, are often derived from control variables in empirical studies. Therefore, moderator variables in a correlational analysis are third variables that influence the zero-order correlation between the independent and dependent variables [95,96]. Similarly, Koeske [97] defined them as “third variables” that affect the magnitude or nature of the relationship between the independent and dependent variables. A review of the relevant literature indicates that moderator variables were added to ensure reliability and to help uncover the underlying relationship between the main variables.
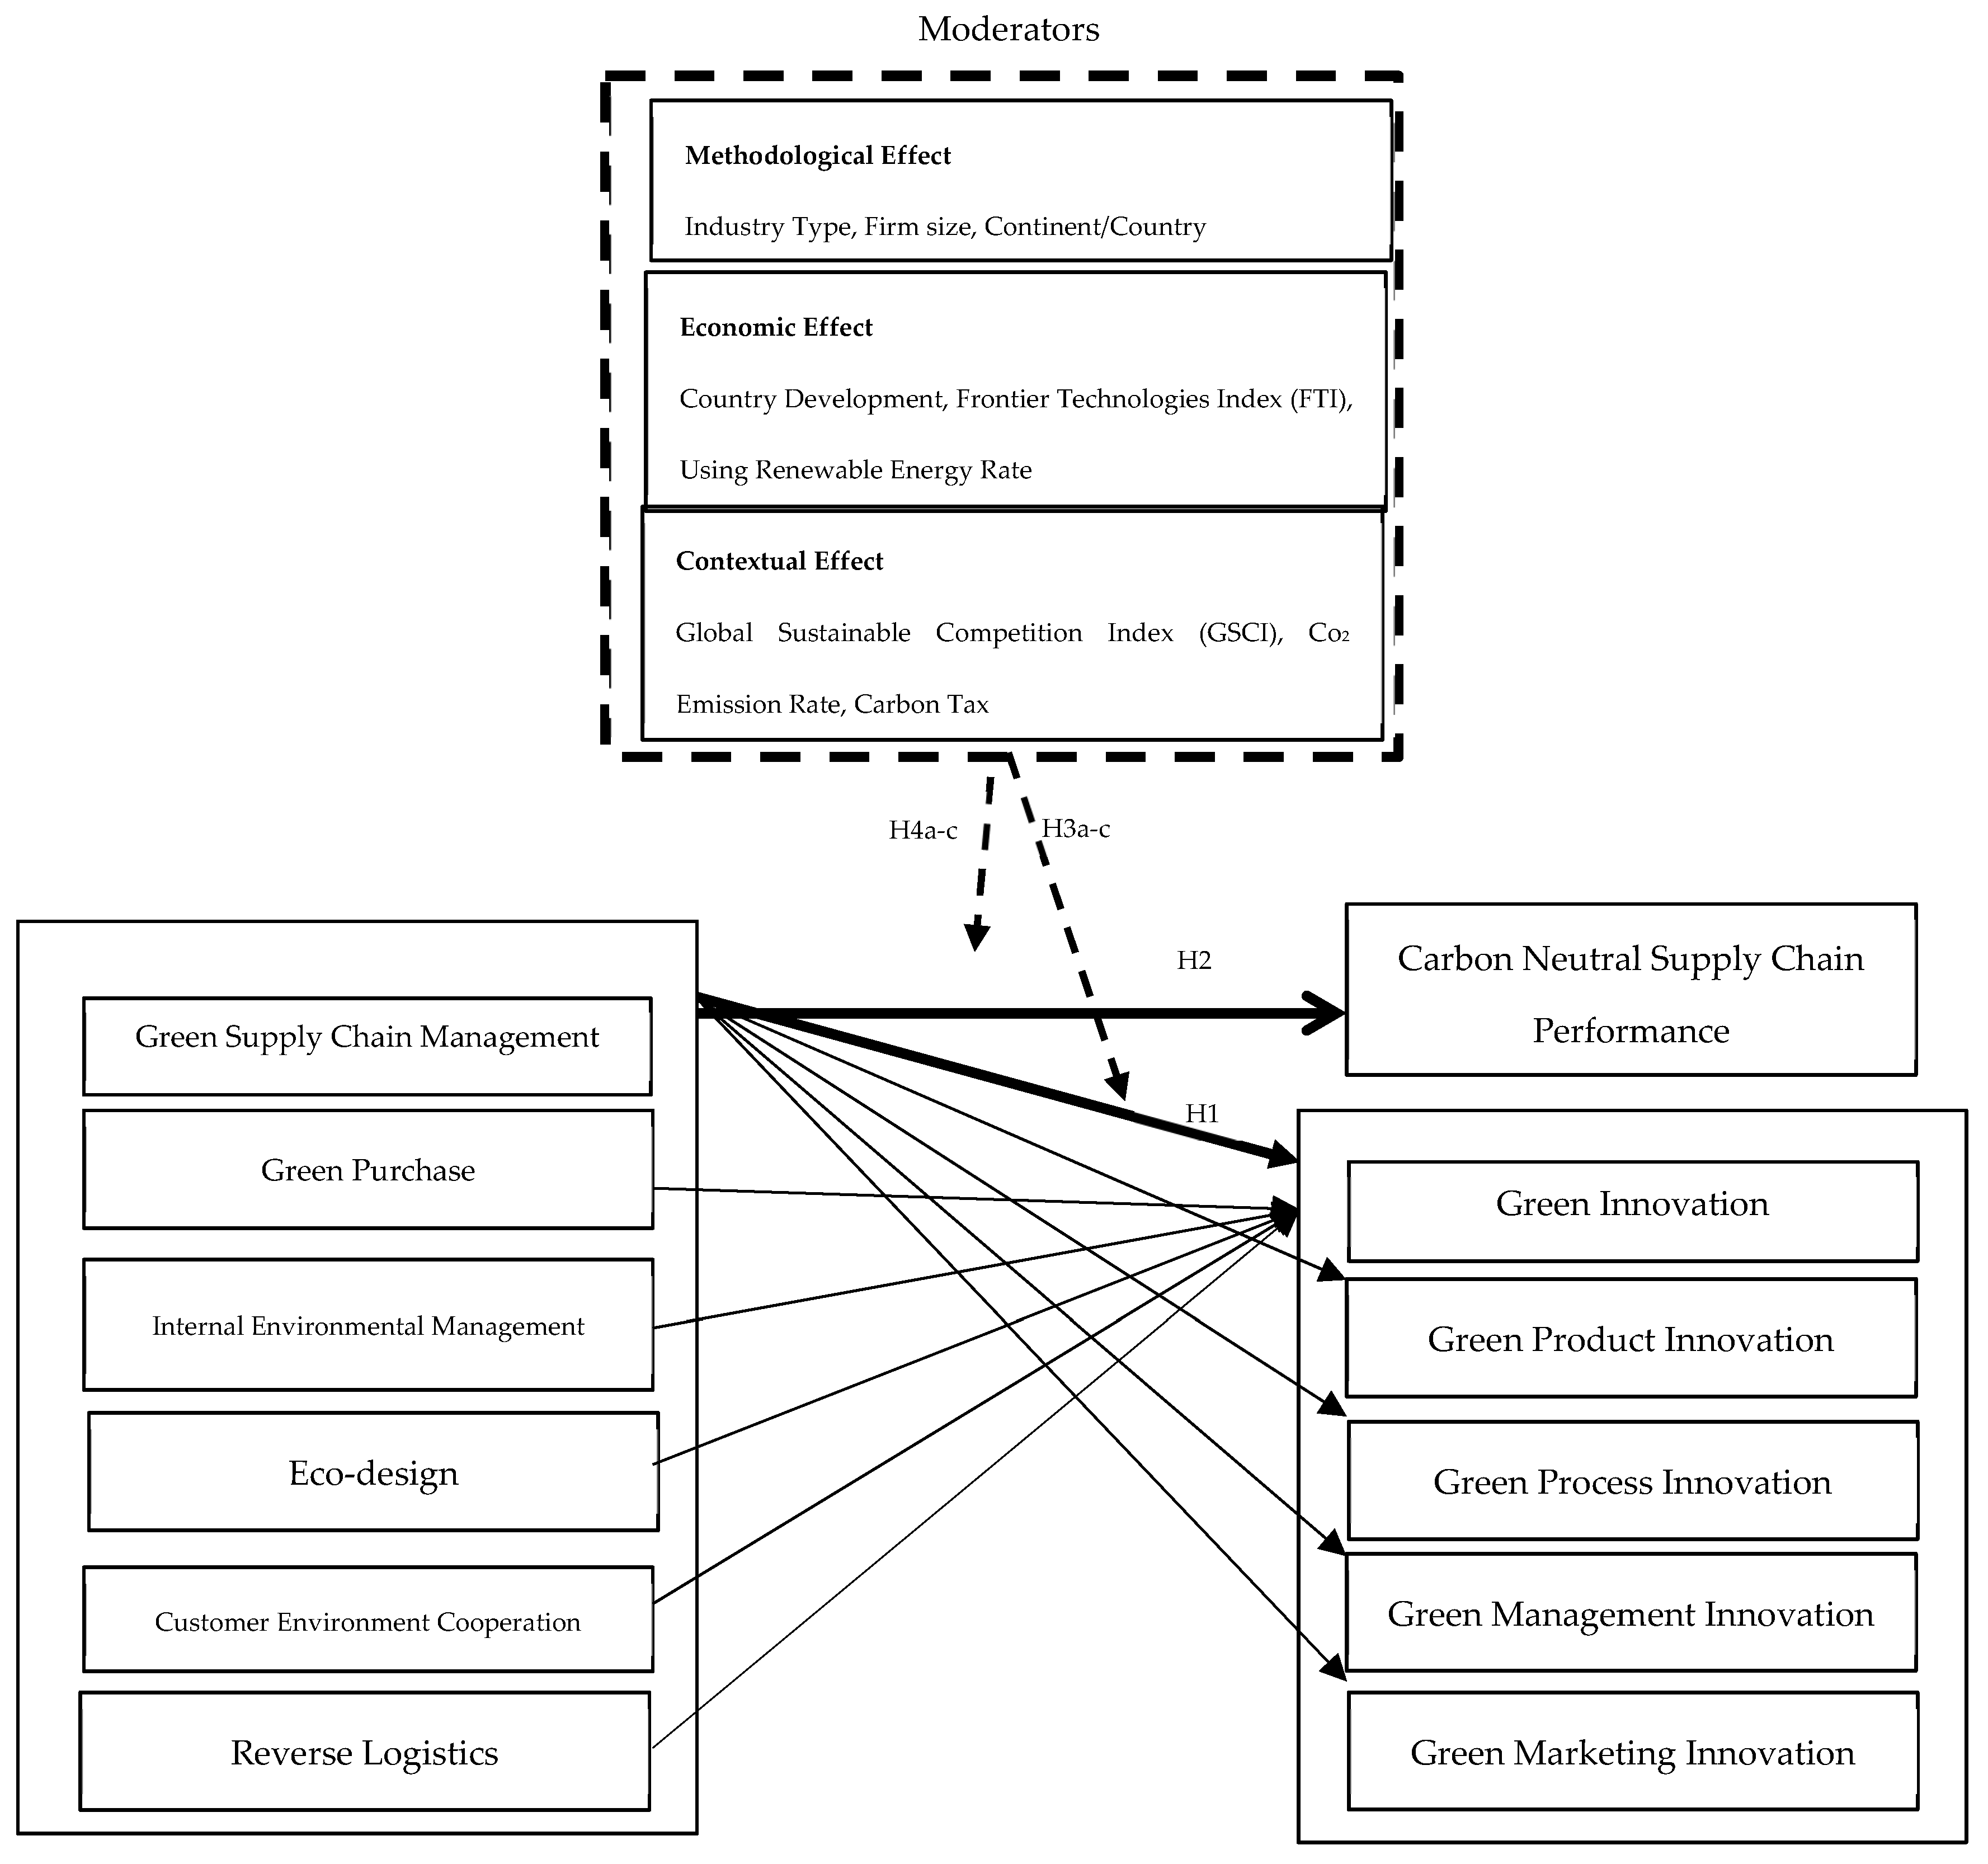
In this study, moderator variables were examined under three categories: methodological effect (industry type, continent/country, firm size), economic effect (Country Development, Frontier Technologies Index (FTI), Renewable Energy Use Rate), and contextual effect (Global Sustainable Competition Index, CO2 emission rate, carbon tax). In the relevant literature, researchers have shown that, in addition to methodological effects, sustainability metrics may also moderate the impact of GSCM applications on green innovation, sustainable performance, and CNSC performance [98,99]. Furthermore, these macro-level sustainability indicators were used as moderators for firm-level relationships. Consequently, this approach carries the potential risk of ecological fallacy; therefore, the analyses were conducted not for the purpose of causal inference but to assess how firm-level effect sizes vary under different contextual conditions. Country-based pairings of firms in the multinational sample were taken into account, and cross-level constraints were addressed methodologically. This arrangement enhances methodological transparency in the selection of sustainability metrics and allows for the presentation of analysis results in a manner sensitive to contextual differences. Therefore, this study examines the methodological, economic, and contextual variables that may influence the relationships between GSCM-GI and GSCM-CNSCP and seeks to identify the critical antecedents affecting these relationships.
Methodological Effect Wang and Chen [100] noted in their study that industry type influences supply chain implementation and business performance. Similarly, Refs. [101,102] have supported this view. In their studies, Refs. [42,95] have argued that industry type and continent affect supply chain and operational performance. Additionally, Refs. [14,103] have noted that the demographic characteristics of businesses may vary in terms of the magnitude of their effects.
Economic Effect Country Development (Low income, High income) has been addressed [98]. Thus, it has been stated that the relevant countries differ in terms of institutional infrastructure, culture, and education, which shape the context of low- and high-income countries [104]. These differences across economic regions also have a critical impact on supply chains, technological innovation, and carbon emissions [100,105]. Therefore, Country Development has been added as another moderator to the study. The relevant data were obtained from the [106]. The Frontier Technologies Index covers technologies such as IoT, Concentrated Solar Power, Blockchain, Nanotechnology, Big Data, 5G, Biofuels, Electric Vehicles, Gene Editing, Robotics, Drone Technology, 3D Printing, Wind Energy, Biogas and Biomass, Green Hydrogen, Solar PV, and AI [107]. Furthermore, this frontier technology index, which includes performance indicators for countries competing to catch this wave of sustainable technological change, classifies countries as high, upper-middle, lower-middle, and low. Therefore, the inclusion of countries with high “FT indices” in the meta-analysis was considered because it facilitates GSCM and GI implementation, effectively reduces CO2 emissions, and plays a critical role in helping businesses achieve their sustainability goals. Furthermore, countries’ use of renewable energy and the reduction in traditional energy methods also stand out as essential factors in reducing CO2 emissions and promoting sustainability. Therefore, countries’ renewable energy usage rates were also added to the study as a moderator, and the necessary data were obtained from [108].
Contextual Effect: The authors of [18,109] emphasize that carbon emissions increase the effectiveness of carbon neutrality metrics in supply chain management. Furthermore, given that countries with high CO2 emissions will implement reduction policies, CO2 emissions could serve as an intermediary variable in these dual relationships. Relevant data [110]. Furthermore, the Global Sustainability Competitiveness Index (GSCI) measures countries’ global sustainable competitiveness using metrics [111], which are divided into six key indicators: (1) resource efficiency and intensity; (2) natural capital; (3) governance efficiency; (4) intellectual capital; (5) economic sustainability; (6) social cohesion [111]. Therefore, countries can increase their national competitive strength by offering innovative environmentally friendly technologies using their natural capital, governance efficiency, intellectual capital, and resources, which can influence the environmental behavior of businesses [99]. Similarly, Bitencourt, de Oliveira Santini [98] suggested that a country’s GSCI can affect business performance. This is because a high GSCI implies a high propensity for sustainable and environmental development [111]. By adopting the median GSCI for each country [98,99], the studies were divided into two groups: low and high GSCI levels. The carbon tax was considered an important criterion based on whether it was implemented in a country. This is because the implementation of this tax is thought to necessitate the implementation of carbon emission reduction policies, and attempts were made to identify differences between countries that implement it and those that do not. The relevant data was obtained from the [110]. Thus, this study examined whether these parameters are important precursors or merely assumptions in the relationships between GSCM and GI/CNSCP.
From the perspective of the NRBV, the moderator variables used in this study provide essential contextual mechanisms that explain how GSCM translates into GI and CNSCP. NRBV argues that firms must develop environmental capabilities—such as pollution prevention, resource efficiency, and clean technology innovation—to achieve competitive advantage. In this regard, methodological moderators (industry type, country/continent, firm size) influence the extent to which firms can deploy these capabilities; economic moderators (Country Development, FTI, renewable energy use) reflect technological readiness and resource-based advantages that facilitate environmental innovation; and contextual moderators (GSCI, CO2 emissions, carbon tax) capture the level of environmental pressures and incentives shaping firms’ adoption of low-carbon strategies. Accordingly, the moderating effects observed in this study are consistent with NRBV, as firms operating in resource-efficient, technologically advanced, and environmentally regulated contexts are more likely to transform GSCM practices into meaningful GI and carbon-neutral outcomes. Therefore, the relevant hypotheses are as follows:
H3a. 
Methodological effects have a moderating effect on the relationship between GSCM and GI.
H3b. 
Economic effects have a moderating effect on the relationship between GSCM and GI.
H3c. 
Contextual effects have a moderating effect on the relationship between GSCM and GI.
H4a. 
Methodological effects have a moderating effect on the relationship between GSCM and CNSCP.
H4b. 
Economic effects have a moderating effect on the relationship between GSCM and CNSCP.
H4c. 
Contextual effects have a moderating effect on the relationship between GSCM and CNSCP.
This study examines the relationship between GSCM-GI, GSCM-CNSCP, and their subcomponents. Additionally, moderator analyses are conducted to identify potential moderator effects of methodological, economic and contextual metrics. In line with this objective, the study aims to contribute more comprehensive results to the existing literature through meta-analysis. In line with the relevant literature, the study’s conceptual model is presented as follows (Figure 1).

4. Methodology

This study aims to investigate the relationship between GSCM-GI, and GSCM-CNSCP while also evaluating the moderating effect of sustainability metrics on this relationship through meta-analysis. The meta-analysis method serves as the primary analytical approach for this investigation. Meta-analysis is a quantitative technique employed to synthesize the results of multiple studies into a single cohesive result [112]. This method allows for integrating findings from previous quantitative research, thereby yielding a more accurate conclusion by consolidating the results of all studies related to the subject matter [113]. Consequently, the process entails a systematic review and re-examination of individual studies that have been conducted. A critical aspect of meta-analysis is to present the relationships among the examined variables with the most accurate effect size values possible, underscoring the effectiveness of this analytical approach [114]. The objective is to harness this power by aggregating the results of numerous individual studies focusing on the relationships between GSCM and GI/CNSCP, thereby determining the effect size produced by these studies.

4.1. Inclusion Criteria

This analysis includes quantitative studies that address the relationships among GSCM, GI, and CNSCP. The selected studies comprise articles published in international peer-reviewed journals that contain the keywords “green supply chain management” AND “green innovation” OR “green supply chain management” AND “carbon-neutral supply chain performance” in databases such as Web of Science, EBSCO Host, Scopus, and Google Scholar. Additionally, synonymous expressions for the CNSCP concept were systematically evaluated in this study. Within this scope, studies addressing the relationship between GSCM and ‘low-carbon supply chain performance’ were examined in detail; however, no empirical findings were found in the literature that directly measure this relationship, use a valid and repeatable scale, or meet the methodological criteria (sample size, effect size reporting, statistical comparability) required for meta-analysis. It was determined that some of the existing studies remained at a conceptual level, while others did not fully align with the CNSCP framework in terms of measurement tools. Therefore, these studies were not included in the meta-analysis.
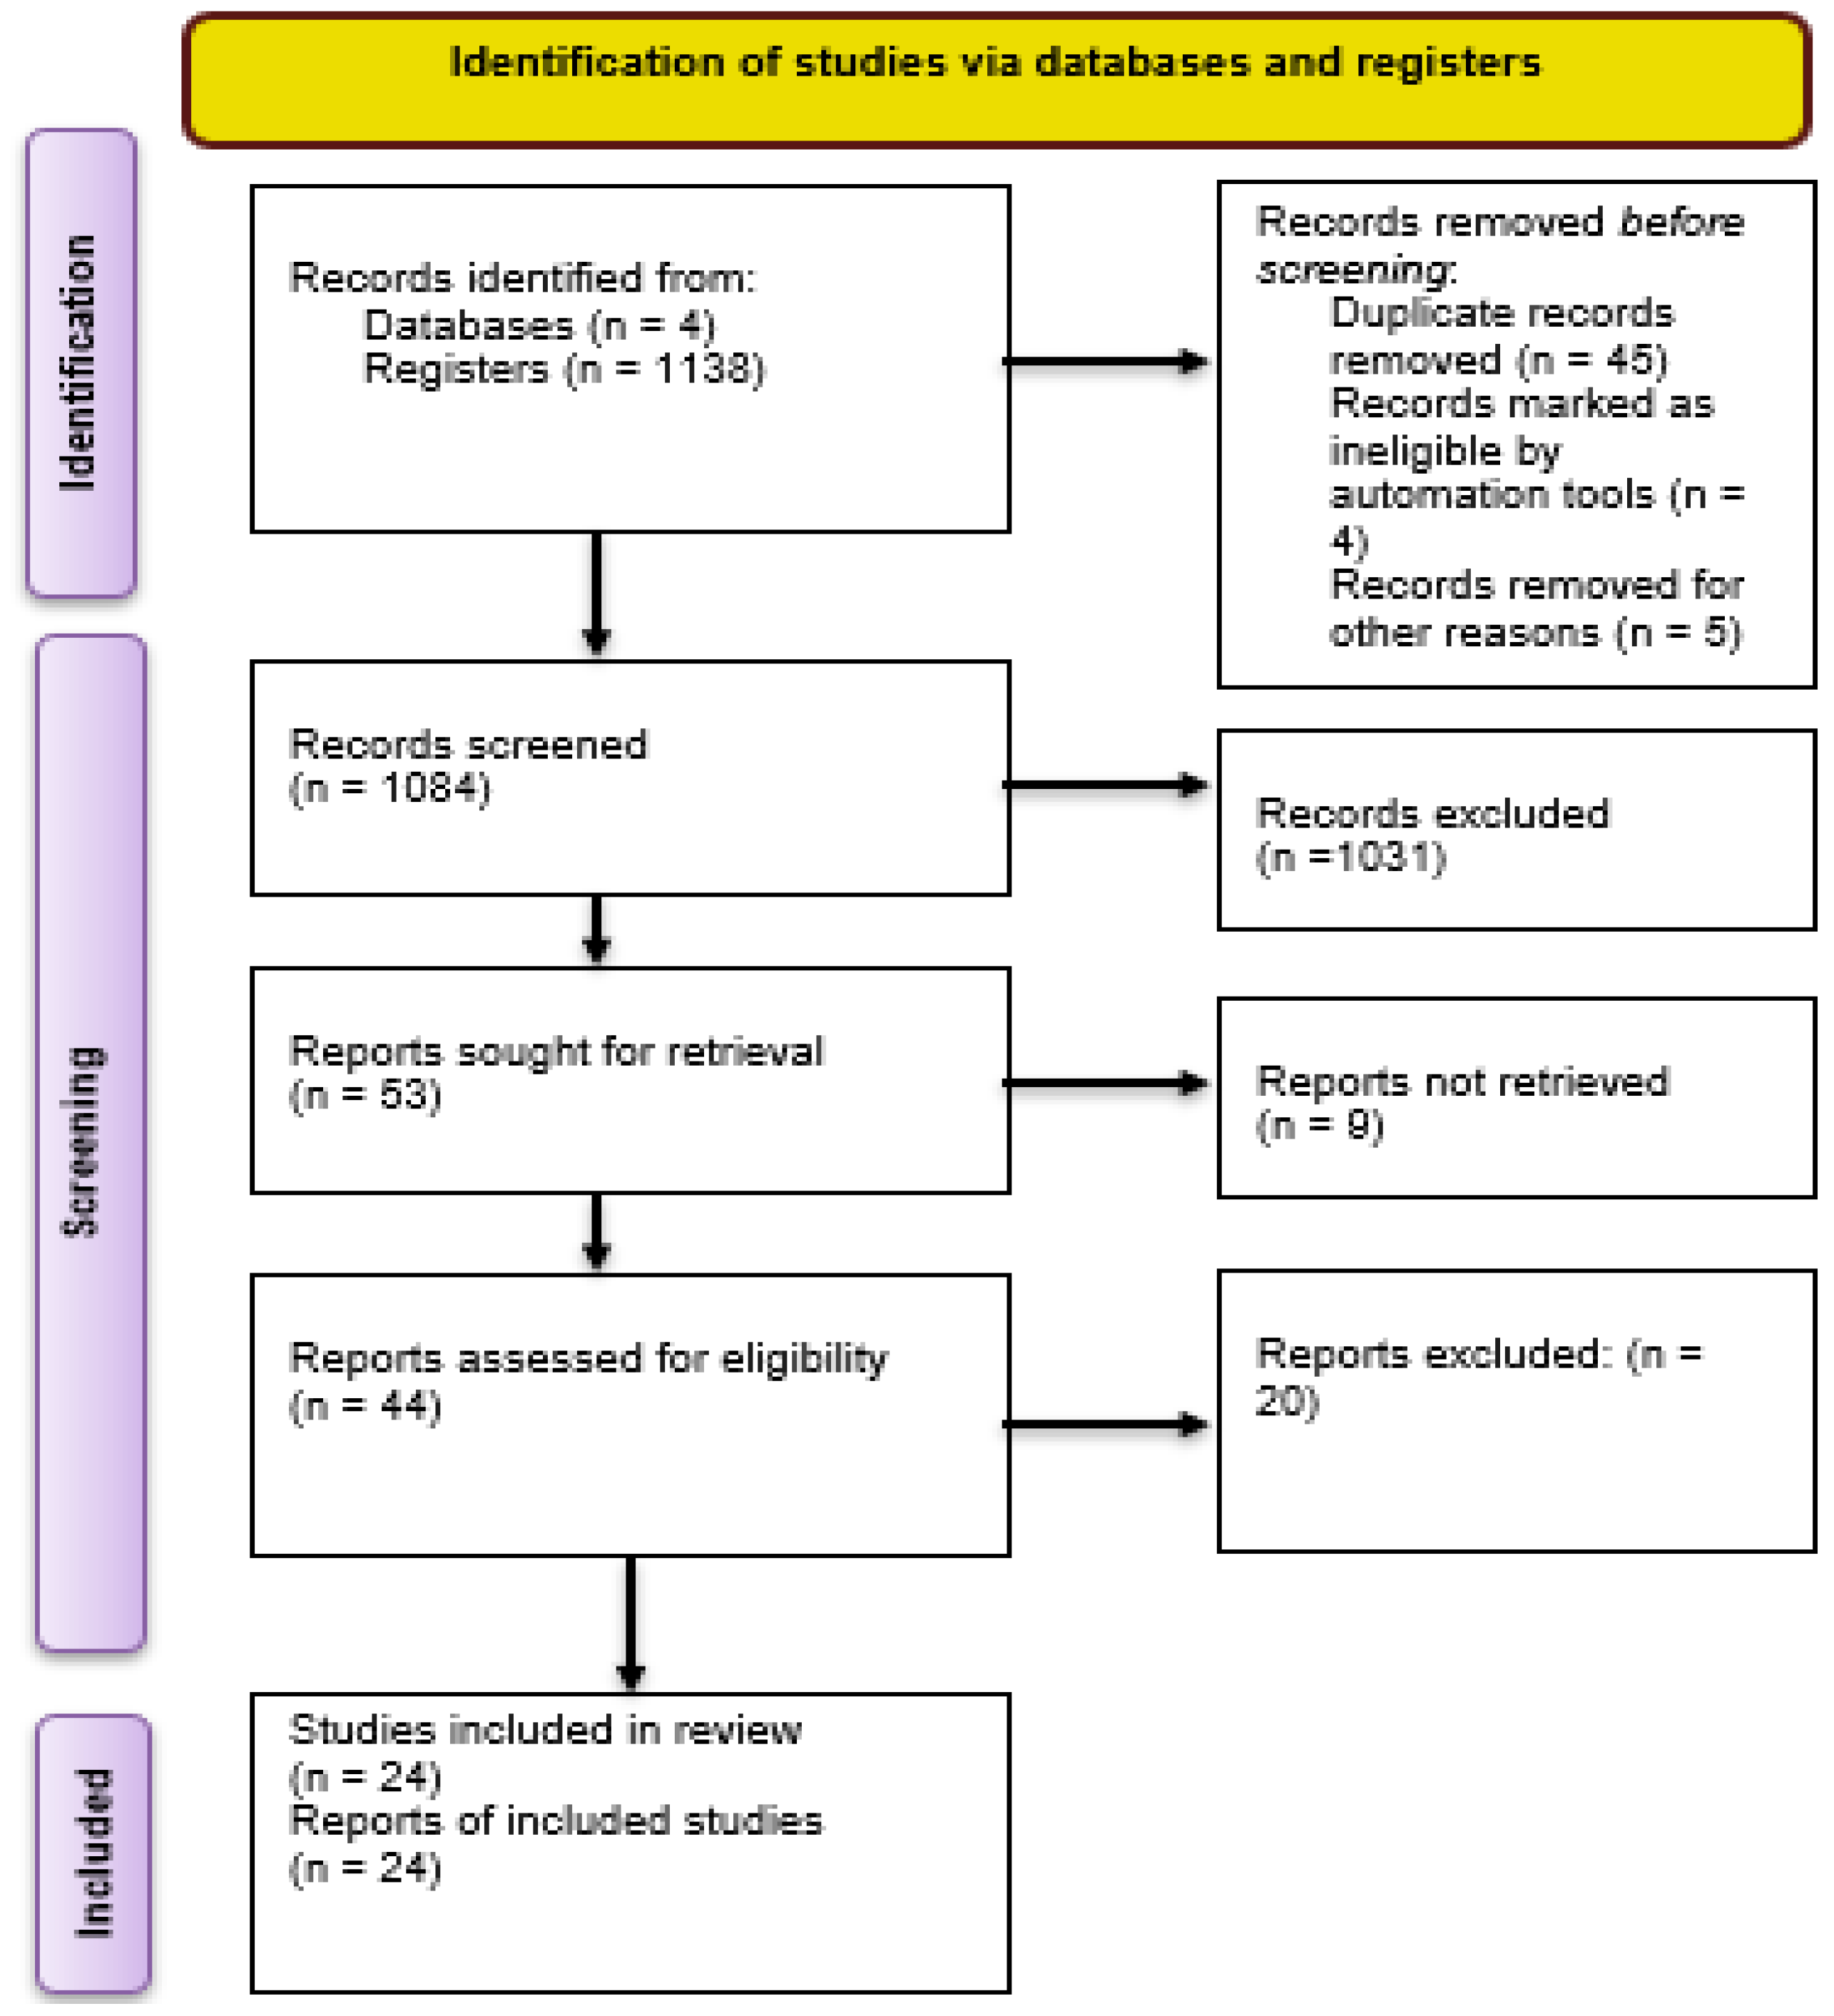
As the CNSCP concept has a relatively established structure in the literature, both conceptually and in terms of measurement, this indicator was used in the analyses. In contrast, variables such as environmental performance, carbon intensity, or carbon capacity represent different conceptual structures and cannot be considered directly equivalent to CNSCP. Including such indicators in the meta-analysis would increase measurement heterogeneity, thereby weakening the validity and comparability of the findings. Therefore, the study was conducted with a focus on CNSCP in order to maintain methodological consistency and analytical integrity. In the initial search, which was conducted without year restrictions, 1138 studies were identified. The inclusion criteria for the studies retrieved for the meta-analysis are outlined by the PRISMA framework proposed by [115] (see Figure 2).
The PRISMA flowchart was used to construct the research dataset. An initial search across four databases and registers yielded 1138 records on GSCM, GI, and CNSC. In line with standard meta-analytic procedures, we limited the dataset to peer-reviewed research articles, excluding books, book chapters, book reviews, and editorials, as these did not allow for the examination of the relationships between the variables. We further restricted the sample to publications in English and excluded studies that did not match the specified keywords or lacked essential statistical information, such as sample size, correlation coefficients (r), or regression coefficients (β) relevant to the relationships among the research variables. After removing 45 duplicate records, 4 records marked as ineligible by automation tools, and 5 records removed for other reasons, 1084 records remained for title and abstract screening. Of these, 1031 were excluded, and 53 reports were sought for retrieval. Nine reports could not be retrieved, leaving 44 full-text reports assessed for eligibility. At this stage, 20 reports were excluded, and 24 empirical studies met all the inclusion criteria and were finally included in the review and meta-analysis.

4.2. Data Coding

A coding form was developed using Microsoft Excel to systematically record the pertinent information from the studies incorporated in the meta-analysis. The coding process was conducted meticulously on forms that the authors thoughtfully prepared to ensure inclusivity. To validate the effect size calculations, it is imperative to assess the reliability of the values derived from the coding forms. Cooper, Hedges and Valentine [116] indicated that studies with relatively low publication quality may justifiably be excluded to accurately ascertain the effect size. Furthermore, Rosenthal [117] underscored the importance of including published and unpublished studies in the analysis. However, a clear definition of quality publications remains unresolved. Consequently, publication quality must adhere to specified criteria, ensuring that the scales employed in the research exhibit adequate psychometric properties, including validity and reliability in individual studies [112]. This analysis evaluated reliability using the Cohen’s Kappa coefficient [118]. A Cohen’s Kappa coefficient exceeding 0.60 is indicative of good agreement [112]. The calculated Cohen’s Kappa coefficient between coders in this study was 0.95, signifying perfect agreement. The coding form includes the title of the study, authors, year of publication, sample size (n), correlation coefficient (r) or regression coefficient (β), and Cronbach’s alpha (α) information. Additionally, moderator variables that may influence the relationships between GSCM, GI and CNSCP have been included in the coding form. Since secondary data were used in the studies included in the meta-analysis, no ethical committee approval was obtained. The studies included in the meta-analysis are listed in Table 1.
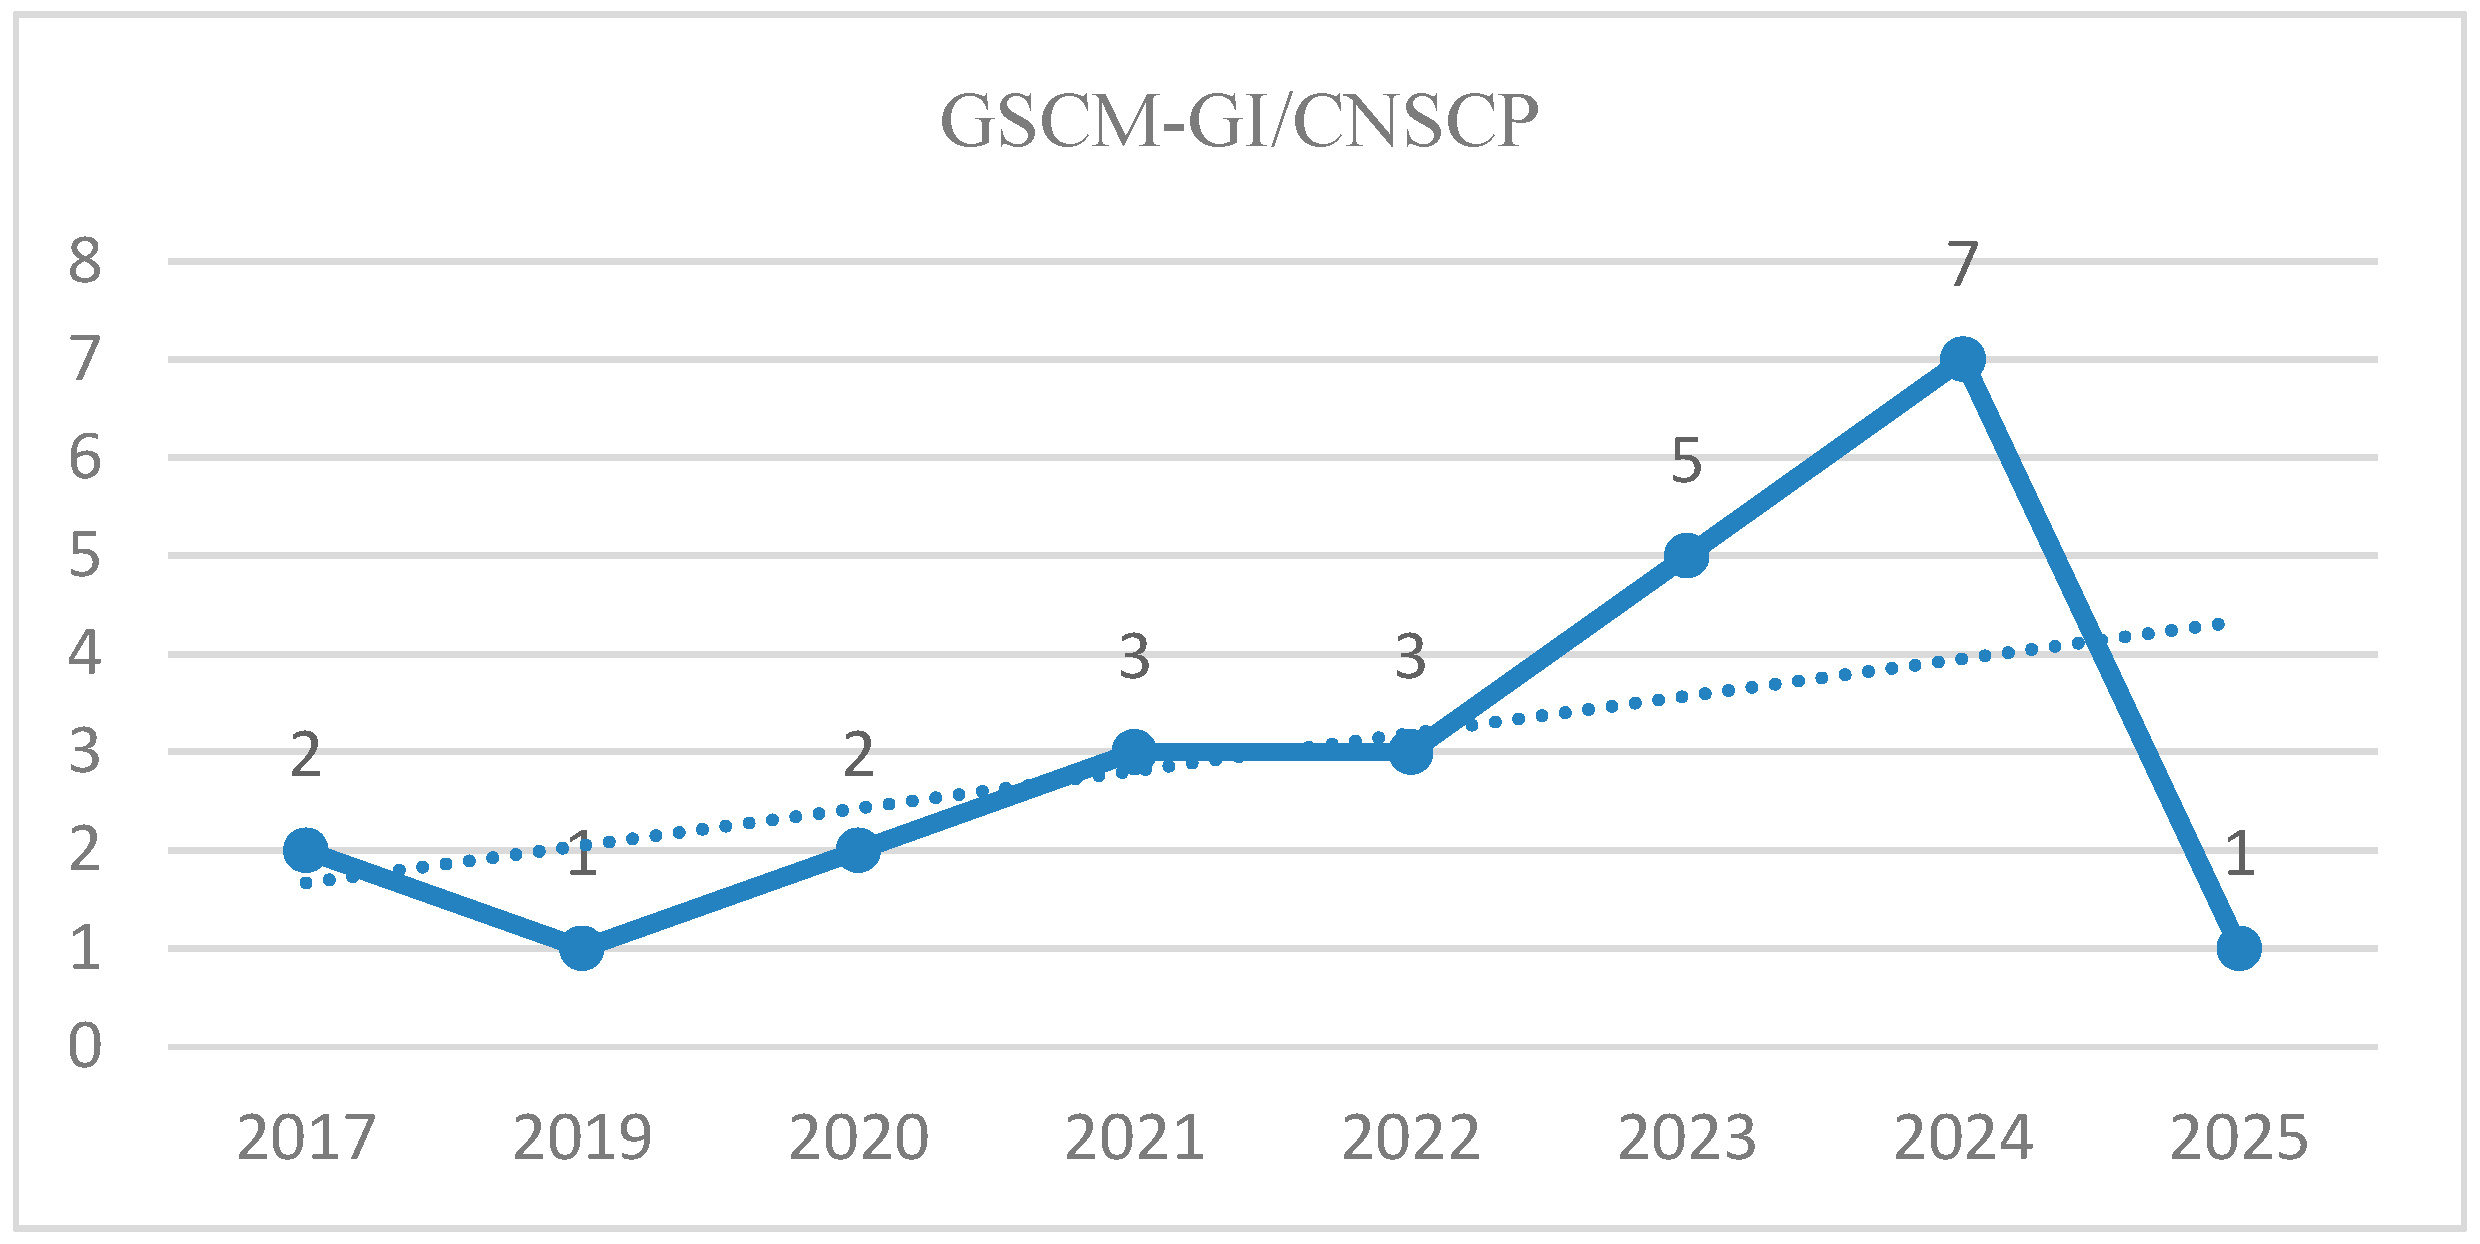
Figure 3 illustrates the distribution of the 24 studies incorporated in the meta-analysis, organized by year, in greater detail.
Figure 3 shows that studies examining the relationship between GSCM, GI, and CNSCP have increased. However, these data belong only to the studies in the meta-analysis, and qualitative studies are not included in the graph. As the graph shows, it is clear that the related topics are attracting more attention today. It is seen that the studies within the scope of the study were primarily published in 2023 (5) and 2024 (7).
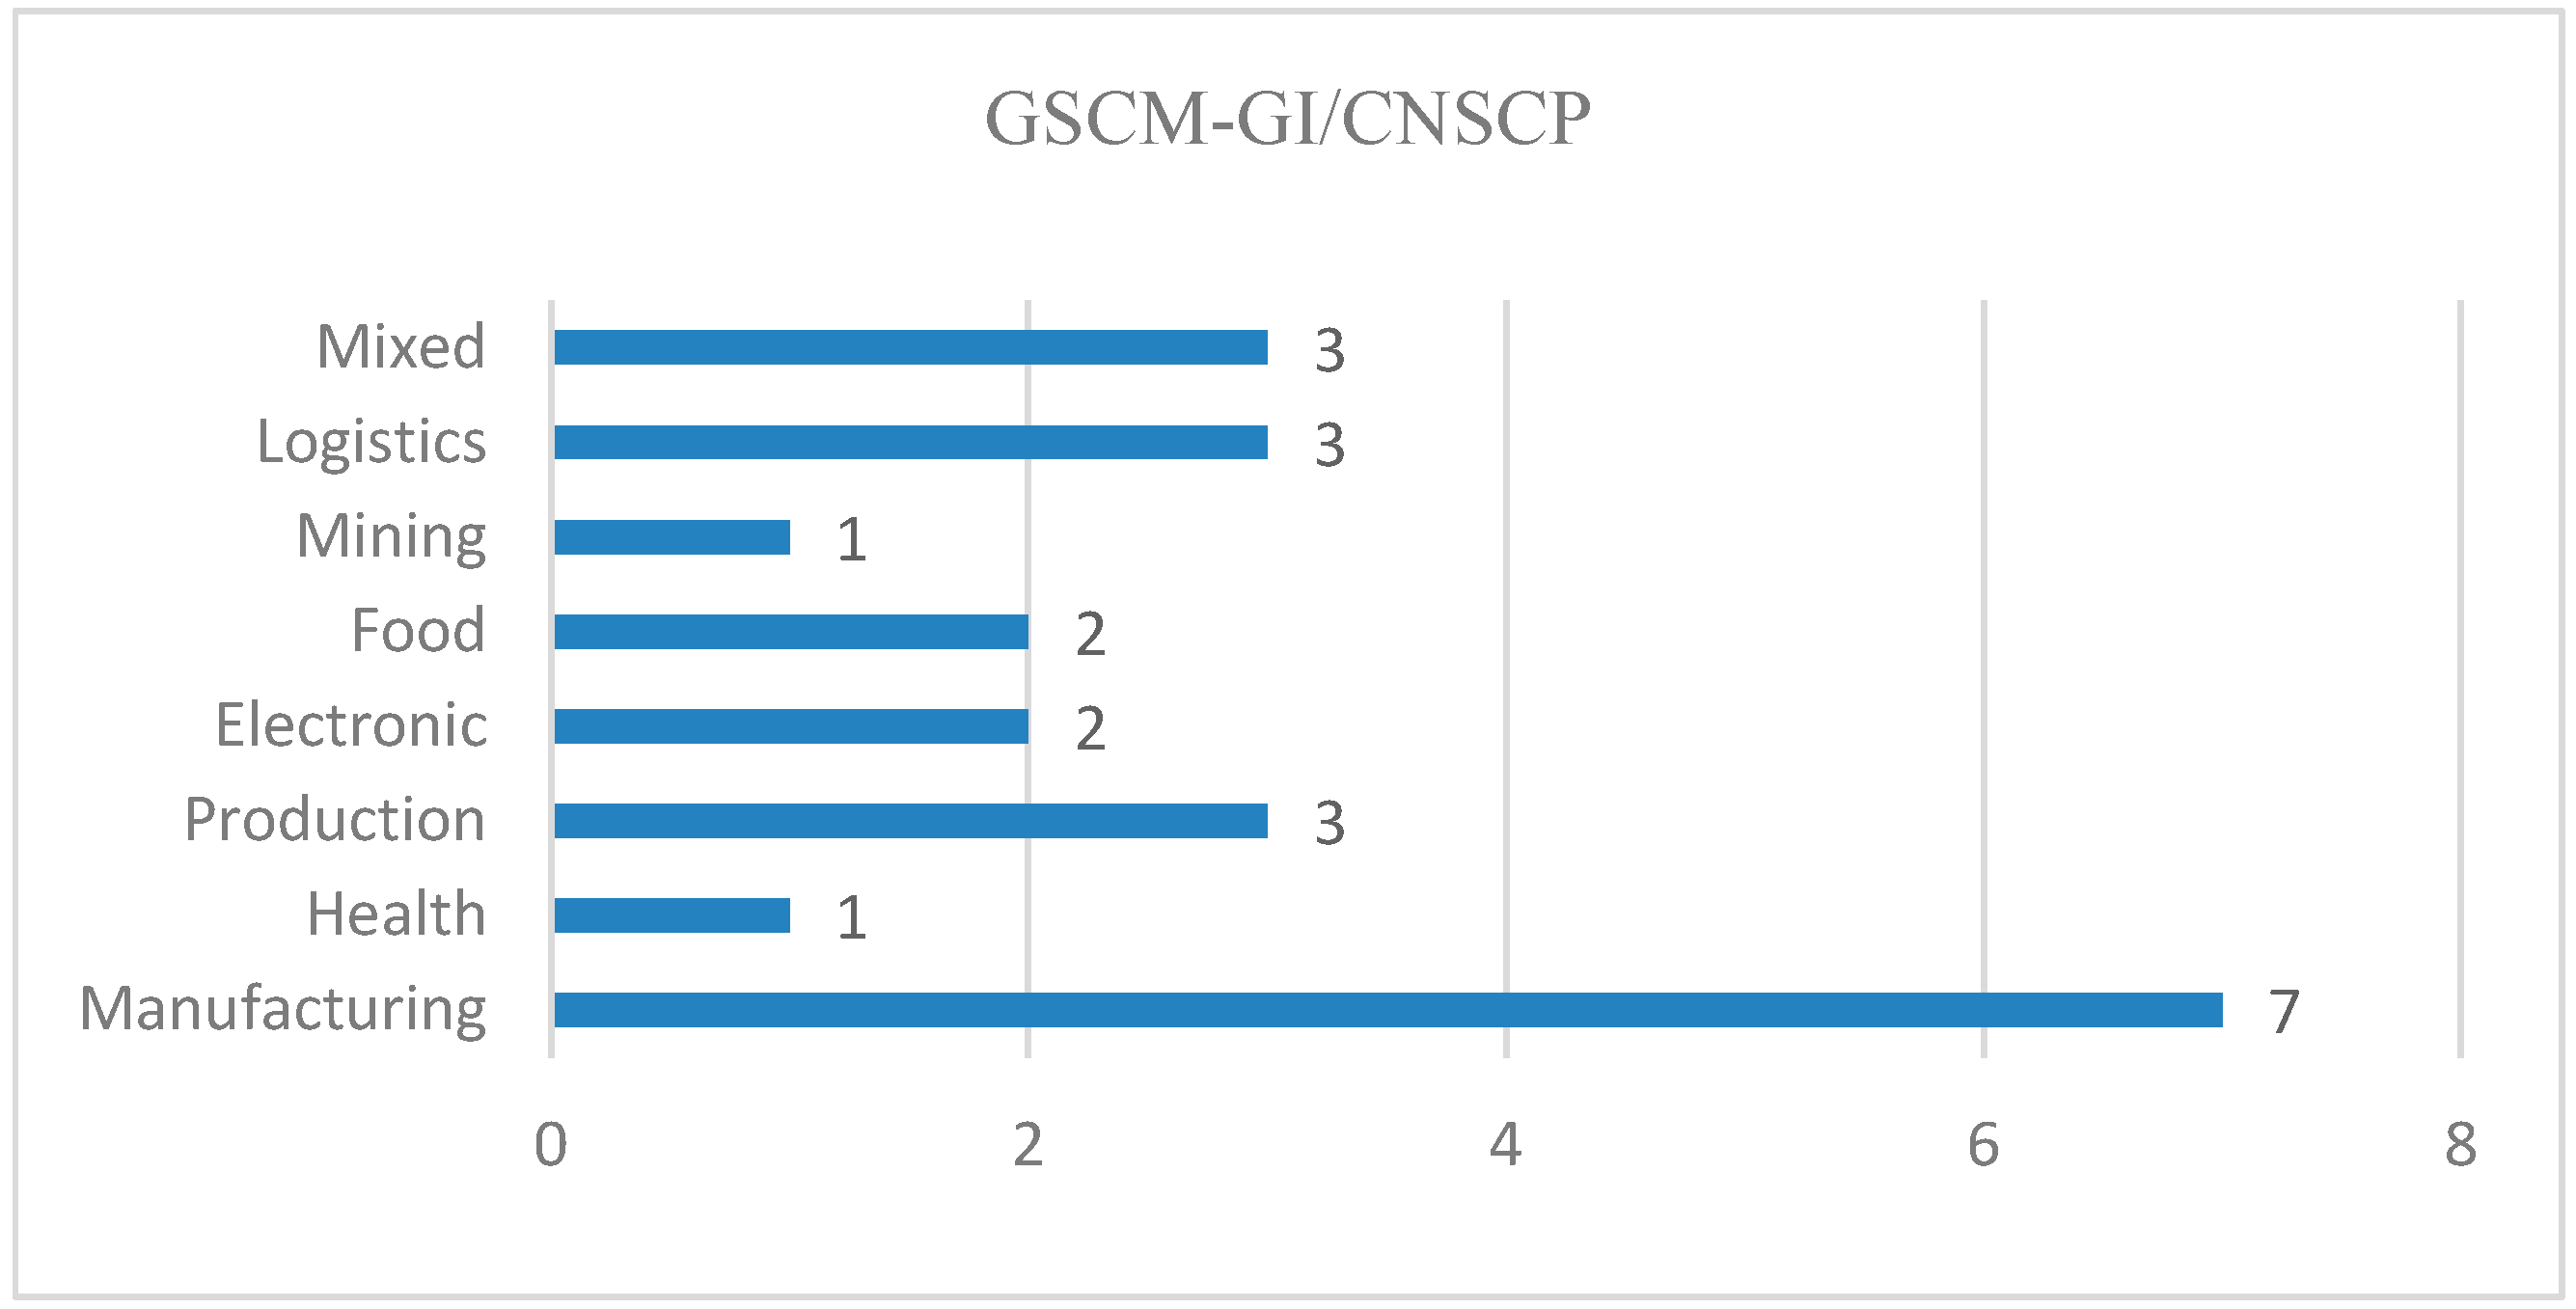
Figure 4 illustrates that most studies incorporated in the meta-analysis were conducted within the manufacturing, production, and logistics sectors. Given the pronounced environmental impacts associated with these sectors, it is reasonable to conclude that research efforts are particularly concentrated in these areas. In light of the severity and urgency of climate-related issues, which have emerged as the most pressing global challenge, governments worldwide are committing to achieving carbon neutrality by 2050 [25]. Consequently, numerous countries have established targets to reduce their carbon dioxide emissions in alignment with this commitment [24,78,126]. Table 2 presents a comparative analysis of the CO2 emission rates for the years 2018 and 2023 in the countries where the studies included in the meta-analysis were conducted.
Upon examining Table 2, it becomes evident that the carbon dioxide emission rates for 2023 in Bangladesh, Malaysia, Vietnam, Ghana, Pakistan, France, Taiwan, and India, as well as for the global aggregate, remain significantly higher than those recorded in 2018. This indicates that these nations have not yet achieved their designated targets. Despite governmental pledges to address these emissions, full compliance has yet to be realized. Conversely, a comparative analysis of the 2023 data for Jordan, the United States, China, and Indonesia against the 2018 figures reveals a commitment to progress, suggesting these countries are on a stable path toward attaining their carbon neutrality objectives.
In the context of the mid-21st century, the pursuit of carbon neutrality has increasingly constituted a global priority. Recent studies have underscored the mounting pressure on organizations to incorporate CNSC strategies into their GSCM frameworks, particularly in the aftermath of the Paris Agreement. Consequently, CNSC has emerged as a critical capability for organizations in responding to external pressures and uncertainties [18]. The realization of carbon neutrality is posited to stem from the successful integration of CNSC methodologies within GSCM practices [18,109]. Numerous scholars advocate for enhancing the effectiveness of carbon neutrality metrics within supply chain management systems [24]. Therefore, businesses should prioritize strategies to reduce carbon emissions within their supply chain management efforts.

4.3. Meta-Analysis Procedures

Hunter and Schmidt’s psychometric meta-analysis method was used in this study, and interpretations were made based on correlation values [96,127]. By the nature of correlation-based studies, an implicit assumption of causality is present in the relationship tests examined in this study. In determining the statistical significance of the relationships between the study variables, the criteria of the lower and upper limits of the confidence intervals for effect size, not including the value zero, were considered. In interpreting the power of effect sizes [112], the values corresponding to the correlation proposed by Cohen were used in meta-analysis studies where the correlation was used as the effect size. Cohen classified effect sizes based on correlation coefficients: 0.10 as a small effect, 0.30 as a medium effect, and 0.50 as a significant effect. This study also examined effect sizes based on these values [118,128,129].
The analyses in this study were conducted based on sample size and correlation values. In addition, the Pearson correlation coefficients were converted to Fisher’s z values for analysis. The findings were then converted to correlation coefficients for interpretation [130]. Therefore, Fisher’s Z value, the lower and upper limits of the correlation value for the 95% confidence interval, Cochran’s Q test, which is frequently used in the literature related to heterogeneity tests, Q test, Tau squared (T2), and I2 value were taken into consideration [116,130].
The Q test evaluates whether a statistically significant difference exists between the effect sizes obtained from individual studies. A Q test (p < 0.05) indicates significant differences between the studies. The I2 value represents the percentage of variation due to fundamental differences rather than chance. If the Q test has a statistically insignificant p-value and a low I2 value (usually below 25%), it indicates that the included studies are relatively consistent; a moderate level of heterogeneity (i.e., an I2 value between 25% and 75%) suggests that there may be some fundamental differences between the studies, A high level of heterogeneity (i.e., an I2 value greater than 75%) indicates that the studies are highly heterogeneous. I2 value between 25% and 75% suggests that there may be some fundamental differences between the studies, and a high heterogeneity (i.e., I2 value greater than 75%) indicates significant differences between the studies. T2 has also been used to estimate the variance in the actual effect sizes across individual studies [131]. Assessing heterogeneity in meta-analyses is crucial because high heterogeneity may arise from the presence of two or more subgroup studies with different actual effects [112]. Based on this test, a choice must be made between a fixed-effects or a random-effects model. However, as noted by previous scholars [114,132,133,134], “in the social sciences, real-world data often arise from populations with different parameters, so effect sizes tend to be heterogeneous; therefore, the use of the random-effects model allows for more accurate and generalisable estimates by accounting for this heterogeneity.” In line with these meta-analytic recommendations, all results in the present study were estimated and reported using the random-effects model. Additionally, the meta-analytic approach used in this study was structured as a two-level random-effects model, which is appropriate for the data set’s structure. Although three-level models are generally recommended for multiple effect sizes, the majority of studies in the current data set reported a single effect size, indicating that effect dependency did not significantly influence the overall results. The potential effects of the limited number of studies reporting multiple effects on the results were also tested using sensitivity analyses, and no change in the direction or magnitude of the main findings was observed. Therefore, the use of a two-level model was deemed methodologically appropriate and prevented the analysis workflow from becoming unnecessarily complex. In this study, the average effect size was calculated separately for each variable and dimension, and both heterogeneity and publication bias analyses were applied.
The Analog ANOVA method was chosen to identify potential sources of heterogeneity in the studies included in this meta-analysis. To apply meta-regression, at least 10 studies are generally required, whereas at least three are needed for Analog ANOVA [130]. However, the current dataset also contains variables with three effects. Furthermore, most of the variables used as moderators are categorical and discrete. Therefore, given the data structure and the scope of the study, the Analog ANOVA method is a suitable, reliable, and methodologically valid approach for categorical moderator analyses. Moderator analyses were conducted with variables meeting these criteria. Potential categorical moderators were addressed in three categories: Methodological, Economic, and Contextual effects. A coding scheme was developed to define the operationalization of variables (see Table A1 in the Appendix A).
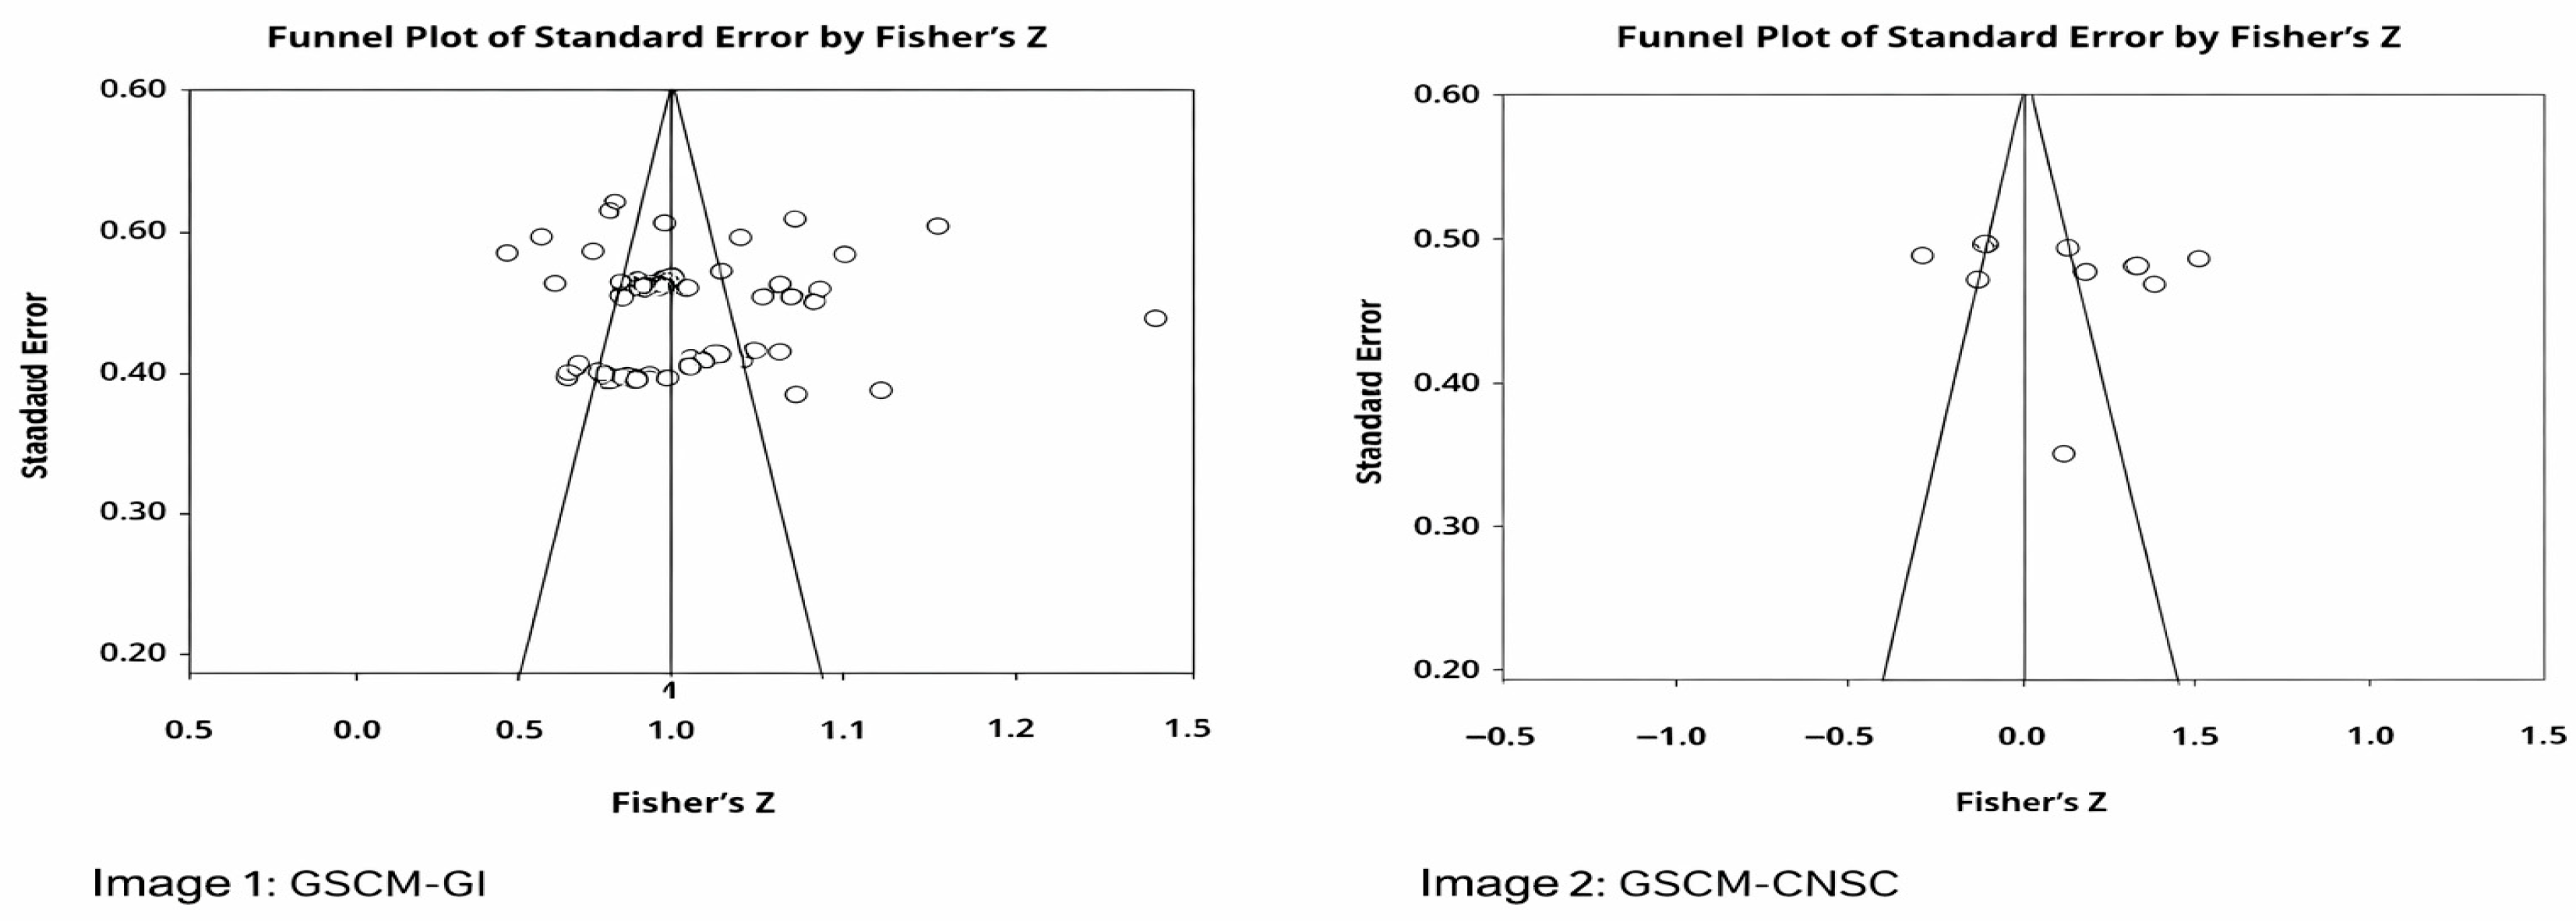
To test for publication bias in the studies included in the meta-analysis, the funnel plot and more quantitative data were used, along with the Egger [135] test (one-tailed p) and the Begg and Mazumdar [136] ranked correlation (Kendall Tau coefficient) test. The results of both tests being non-significant (p > 0.05) indicate the absence of publication bias. Additionally, the analyses were conducted using a random effects model. The studies included in the analysis were tested using the CMA 4.0 program.

5. Results

5.1. Publication Bias

Figure 5 shows the funnel plot showing the distribution of effect sizes of individual studies included in the analysis and the potential for publication bias associated with this for GSCM-GI (Image 1) and GSCM-CNSCP (Image 2).
When Figure 5 is examined, it is concluded that individual study values are symmetrically distributed within the funnel framework, and therefore, there is no publication bias. However, the funnel graph alone is insufficient to explain publication bias. Thus, to demonstrate publication bias, the Egger Regression Test and Begg & Mazumdar ranked correlation tests were applied, and more quantitative data were presented. These results are expressed in Table 3.
The Egger regression test (p > 0.05) and Begg & Mazumdar’s rank correlation test result (Kendall Tau b = 0.001, p > 0.05) for GSCM-GI were found to be insignificant. The Egger regression test (p > 0.05) and Begg & Mazumdar’s rank correlation test result (Kendall Tau b = 0.288, p > 0.05) for GSCM-CNSCP were found to be insignificant. Publication bias tests conducted at the subcomponent level indicate that p-values are borderline or significant, particularly for the GSCM and GPDI relationship (Egger p = 0.051; Begg & Mazumdar Kendall Tau b = −0.491, p = 0.035). This finding points to a possible risk of publication bias due to the limited number of studies and small ‘k’. Furthermore, the low statistical power of the Egger and Begg-Mazumdar tests in meta-analyses with small sample sizes suggests that the observed signal of bias may stem from statistical sensitivity caused by the limited number of studies rather than actual publication bias. Therefore, this finding should be interpreted cautiously within the context of methodological limitations.
When other subcomponents were examined; for GP-GI (Egger, p > 0.05; Begg & Mazumdar, Kendall Tau b = 0.106, p > 0.05), for IEM-GI (Egger, p > 0.05; Begg & Mazumdar, Kendall Tau b = −0.277, p > 0.05), ED-GI (Egger, p > 0.05; Begg & Mazumdar, Kendall Tau b = −0.000, p > 0.05), and CEC-GI (Egger, p > 0.05; Begg & Mazumdar, Kendall Tau b = −0.109, p > 0.05), RL-GI (Egger, p > 0.05; Begg & Mazumdar, Kendall Tau b = −0.066, p > 0.05), GSCM-GPCI (Egger, p > 0.05; Begg & Mazumdar, Kendall Tau b = −0.31818, p > 0.05), for IEM-GMI (Egger, p > 0.05; Begg & Mazumdar, Kendall Tau b = −0.25000, p > 0.05), for IEM-GMRKI (Egger, p > 0.05; Begg & Mazumdar, Kendall Tau b = −0.11111, p > 0.05) were found to be insignificant. Therefore, these results indicate that there is no possibility of publication bias.

5.2. Meta-Analysis Findings

This study used the Q test, Tau squared (T2), and I2 values to assess heterogeneity among the studies. Heterogeneity statistics (Q, T2, and I2) and effect size (ESr) are presented in Table 3. The studies included in the current study to determine the relationships between GL-SP and other independent variables (financial, environmental, and social) were found to have a high level of heterogeneity. Additionally, T2 indicated low variance in the actual effect sizes. Under the random effects model, the average effect size (ESr) and the estimates of heterogeneity statistics (Q, T2, and I2) are summarized in Table 4.
When examining Table 4, the relationships between GSCM, GI, and CNSCP, along with those of the subcomponents analyzed separately, reveal that 60 effect sizes were analyzed between GSCM and GI. The findings were interpreted within the framework of Cohen’s suggested correlation values. The analysis showed a significant and high-level relationship (r = 0.499, p = 0.000) between GSCM and GI. These findings are consistent with the relevant literature and suggest that business green practices improve environmental outcomes, reduce waste, support stakeholder relationships, lead to cost savings, and enhance brand reputation. Furthermore, it can be stated that businesses adopting GSCM and GI will experience improved economic, environmental, and sustainable corporate performance, thereby gaining a competitive advantage [33,34,35,82,83,84,85,86,87]. Therefore, the H1 hypothesis proposed in this study is accepted.
There were significant correlations between GP and GI (r = 0.445, p = 0.000), IEM and GI (r = 0.445, p = 0.000), ED and GI (r = 0.445, p = 0.000), CEC and GI (r = 0.445, p = 0.000), and RL and GI (r = 0.445, p = 0.000). These findings are consistent with previous studies [5,7,62,64,67]. GSCM and GPDI (r = 0.445, p = 0.000), GSCM and GPCI (r = 0.455, p = 0.000), GSCM and GMI (r = 0.488, p = 0.000), and GSCM and GMRKI (r = 0.383, p = 0.000), and these results are consistent with the relevant literature. These results indicate that when businesses integrate green innovation and its components into their supply chains, environmental performance, corporate competitive advantage, and green corporate reputation [1,12,44,65,89,90,91,92]. Additionally, a high-level (r = 0.395, p = 0.000) and significant relationship has been observed between GSCM and CNSCP. Consistent with the findings in the literature, the adoption of CNSCP in GSCM activities is expected to play a critical role in reducing the carbon footprint of businesses, effectively mitigating the impacts of climate change and global warming, and thereby enhancing brand reputation and increasing sales and revenue [24,70,73,79,125]. Therefore, the H2 hypothesis is accepted.
Furthermore, the high level of heterogeneity in the relationships between GSCM–GI and GSCM–CNSCP reveals that studies in this field differ significantly in terms of context, sector, and methodology. This situation may be a natural consequence of the studies in the literature being conducted in different country groups, at various sustainability maturity levels, and using variable measurement tools. Such a high level of heterogeneity limits the direct generalization of the combined effect to all contexts, indicating that the relationships are sensitive to macro sustainability conditions, sector structures, and methodological preferences. Therefore, a random effects model was used in the study, and the average effects obtained were evaluated as high-level trends representing cross-contextual diversity. Furthermore, categorical and macro-level moderator analyses were conducted to clarify this heterogeneity and determine under which conditions the relationships strengthened or weakened (see Section 5.3); thus, it can be said that the interpretability and contextual integrity of the findings have been strengthened.

5.3. Moderator Analyses

In this study, moderator analyses were conducted to determine the presence of a third variable that could influence the relationship between the dependent and independent variables. The main findings indicated that the relationships between GSCM-GI and GSCM-CNSCP and other independent variables were heterogeneous (see Table 3). Therefore, subgroup analyses were conducted using the criteria Borenstein, Hedges [130] proposed. Analog-ANOVA analyses were performed to determine the differences between the subcategories of each moderator, and the analysis results are presented in Table 5 and Table 6.
Moderator analyses revealed that in the relationship between GSCM and GI, the methodological moderator group included industry type (QB = 98.981, p < 0.001), firm size (QB = 15.736, p < 0.001), and continent/country (QB = 177.984, p < 0.001), which were found to be statistically significant and can thus be said to play a moderating role in this relationship. Therefore, H3a proposed in the study was accepted. Country Development (QB = 62.481, p < 0.001) was also found to be significant, indicating that these factors act as moderators in this relationship. However, the Renewable Energy Index (QB = 4.072, p > 0.05) was found to be insignificant and does not act as a moderator in this relationship. Consequently, H3b was partially accepted. As contextual moderators, CO2 Emission Rates (QB = 5.582, p < 0.05) and the Global Sustainable Competition Index (QB = 7.080, p < 0.001) were identified as moderators, while Carbon tax (QB = 0.503, p > 0.05) was not. Based on these results, H3c was partially accepted.
Table 6 shows that, in the relationship between GSCM and CNSCP, industry type (QB = 0.000, p > 0.05) and firm size (QB = 0.000, p < 0.05) are insignificant. However, continent/country (QB = 89.166, p < 0.001) is statistically significant and plays a moderating role. Therefore, H4a is accepted. As economic moderators, Renewable Energy Use Rate (QB = 89.166, p > 0.001) and Frontier Technologies Index (QB = 89.166, p < 0.001) produced significant results, indicating they serve as moderators. Conversely, Country Development (QB = 0.000, p > 0.05) was not a moderator, so H4b is accepted. Regarding contextual moderators, CO2 Emission Rates (QB = 89.166, p < 0.001) and Global Sustainable Competition Index (QB= 89.166, p < 0.001) are moderators, while Carbon tax (QB = 0.000, p > 0.05) is not. Based on these findings, H4c was partially accepted.
The absence of some rows in the table related to the GSCM-CNSCP moderator analysis stems from the limited number of studies in the relevant moderator categories. In established approaches to meta-analysis methods, it is stated that at least three studies must be present in each category for categorical moderator analyses (analog ANOVA) to be conducted reliably (see Section 4.3). The inability to reach this number in some categories in the current data structure has resulted in certain cells appearing empty. However, considering the multidimensional nature of the sustainability context and the fact that the CNSCP field is a relatively new area of research, the findings are still considered to make meaningful contributions to the literature in their current form. In particular, the trends that emerge despite the limited number of observations provide important clues as to how macro sustainability indicators may affect relationships at the firm level in the field. Therefore, it can be said that reporting the analysis results in their current form is valuable for the literature.

6. Discussion

This study is intended to examine the relationships among GSCM, GI, and CNSCP using a meta-analysis. Moreover, these relationships, examined from the perspectives of RBV, and NRBV theories, have been revealed with more comprehensive findings through the moderating effects of sustainability metrics. Therefore, quantitative study findings addressing the relationship between GSCM, GI, and CNSCP in the international literature were included in the meta-analysis to obtain a more general result. In addition, the subcomponents of GSCM and GI were included in the meta-analysis separately to examine their relationships with GSCM and GI in detail. Similar findings to those in the relevant literature were obtained from these analyses. Within the scope of the research, the necessary analyses were performed with 68 effect sizes and a sample size of 16,740 individuals from 24 studies included in the meta-analysis. Within the scope of the analysis, publication bias of the included studies was examined separately using the Funnel Plot, Egger Regression Test, and Begg and Mazumdar ranked correlation test, and no publication bias was found. A heterogeneity test was used to determine which method to use in the meta-analysis, and the data were found to exhibit a high level of heterogeneity. Therefore, the meta-analysis continued using the random-effects model. When examining the analysis results corresponding to the research questions formulated in the introduction section, findings regarding the relationship between GSCM and GI under RQ1, the relationship between GSCM and CNSCP under RQ2, and the sub-components of GSCM and GI under RQ3 are presented. GSCM and GI was highly significant (r = 0.499, p = 0.000), consistent with the relevant literature (e.g., [33,34,35,82,83,84,85,86,87]). The relationship between GSCM and GPDI (r = 0.445, p = 0.000), between GSCM and GPCI (r = 0.455, p = 0.000), between GSCM and GMI (r = 0.488, p = 0.000), and between GSCM and GMRKI (r = 0.383, p = 0.000). These findings are consistent with the results reported in the relevant literature. Additionally, it was found that there are highly significant relationships between IEM and GI (r = 0.445, p = 0.000), ED and GI (r = 0.445, p = 0.000), CEC and GI (r = 0.445, p = 0.000), and RL and GI (r = 0.445, p = 0.000). These findings are consistent with the relevant literature (e.g., [5,7,62,64,67]). Additionally, a high level (r = 395, p = 0.000) and significant relationship was observed between GSCM and CNSCP.
When examining the results of the methodological, economic and contextual moderator analyses conducted in line with RQ4; industry type, firm size, and continent/country were statistically significant methodological moderators in the relationship between GSCM and GI. Among the economic moderators, Country Development and the Frontier Technologies Index yielded significant effects, whereas the Renewable Energy Use Index did not; similarly, CO2 Emission Rates and the Global Sustainable Competition Index emerged as significant contextual moderators, whereas Carbon Tax did not. In the relationship between GSCM and CNSCP, industry type and firm size were not significant, but continent/country showed a significant moderating effect. Economic moderators such as the Renewable Energy Use Rate and the Frontier Technologies Index were significant, while Country Development was not; among contextual moderators, CO2 Emission Rates and the Global Sustainable Competition Index again demonstrated moderating roles. These findings indicate that sustainability metrics meaningfully shape the strength of both the GSCM–GI and GSCM–CNSCP relationships [95,96,97,98,99,100]. Importantly, the literature provides clear explanations for why these moderating effects emerge [64,98,99,100,102,103,104,105,109]. From an RBV perspective, firms in higher-income or more institutionally developed countries possess superior resource configurations, more advanced technological infrastructures, and greater absorptive capacities, which allow them to implement and integrate environmental practices more effectively [137]. In line with NRBV, firms in such contexts also exhibit stronger pollution-prevention capabilities, cleaner production technologies, and enhanced environmental innovation capacities—factors that naturally reinforce both the GSCM–GI and GSCM–CNSCP relationships [27,138]. Therefore, the observed moderator effects are not merely descriptive patterns but are theoretically consistent with the mechanisms proposed by RBV and NRBV, offering a coherent explanation for why differences in economic and environmental capacity across countries and regions amplify the strength of these relationships. Furthermore, considering these macro-level sustainability indicators as moderators of firm-level relationships carries the risk of ecological fallacy (see Section 3.3); therefore, the findings should be interpreted as a descriptive assessment of how macro indicators may affect the magnitude of effects at the firm level, and it should be noted that the interactions were attempted to be presented in different contextual conditions.

6.1. Theoretical Implications

The current study’s findings offer practical significance with respect to theoretical contributions. Firstly, they support the environmental management literature by establishing GSCM as a crucial precursor to GI [32,33,34,35,36,37,109]. Secondly, this research extends the existing literature by addressing the association between GSCM and CNSCP [24,70,73,79,80,125,139]. Finally, potential moderators influencing the relationships between GSCM-GI and GSCM-CNSCP were identified, and the underlying reasons for these strong effects were revealed, thereby providing new contributions to the sustainability and environmental management literature. Furthermore, the study combines RBV and NRBV theories to provide a comprehensive framework for explaining the relationships between GSCM, GI, and CNSCP. Thus, the study ensures theoretical consistency by integrating fragmented theoretical approaches in the literature. Therefore, by applying RBV to supply chain management, the current research explains how sustainability metrics (CO2 emissions, renewable energy usage rate, global sustainable competitiveness, carbon tax, sustainable technologies, etc.) increase the value of companies’ strategic resources, thereby strengthening the limited applications of RBV in the context of environmental sustainability. It also emphasizes how sustainability metrics strengthen the strategic use of environmental resources by integrating NRBV into the context of carbon neutrality. Thus, these theories provide a robust framework for explaining the relationships between GSCM, GI, and CNSCP. Moreover, the moderating effect of sustainability metrics is explained more comprehensively through these theoretical lenses, increasing their applicability in different country contexts [98,99].
The meta-analytic method utilized in this study is particularly valuable as it provides a comprehensive perspective on the relationships among GSCM, GI, and CNSCP. A more substantial and realistic impact was achieved by consolidating findings and samples from multiple studies. Consequently, this study offers elucidative insights into GSCM, GI, and CNSCP dynamics. It enhances the clarity of results for the relevant literature by analyzing the separate effects or relationships of its subcomponents with a robust effect size. In addition, this research represents an effort to provide new evidence by producing critical findings on the possible moderating effects of sustainability metrics on the relationship between GSCM and GI/CNSCP.

6.2. Managerial Implications

This study not only contributes to the existing literature but also offers significant insights for managers and decision-makers within companies, organizations, and institutions, particularly in the manufacturing and logistics sectors, which are commonly used as proxy indicators for CO2 emissions [139,140,141,142]. The findings suggest that adopting GSCM and GI can yield a competitive advantage, enhance green corporate reputation, and improve environmental performance for enterprises across industries and governmental bodies [12,44,65,89,90,91,92]. Furthermore, businesses can reduce production costs while simultaneously increasing economic efficiency. Improvements in corporate environmental performance, achieved through implementing environmental initiatives and complying with environmental regulations, can significantly contribute to business competitiveness. The integration of GSCM with both internal and external environmental management is essential for enhancing corporate effectiveness and sustainability [1,3,45,143].
Previous studies have highlighted the significant environmental benefits of GSCM and GI strategies, as well as their positive influence on business performance [88]. However, this study shows that GSCM and GI applications achieve carbon neutrality and have a notable impact on the CNSCP. It highlights that the company not only improves its social reputation and potentially gains new market opportunities, but also achieves cost savings and enhanced operational performance, thereby positively impacting both financial and environmental outcomes. Therefore, enterprises must pursue economic goals while striving to improve environmental performance and move toward carbon neutrality [144]. Additionally, incorporating CNSC into GSCM activities is crucial to achieving lower carbon-emission targets and effectively combating climate change and global warming. This strategic approach can also boost sales and revenue through better brand reputation. As a result, increasing GSCM and GI applications to cut CO2 emissions is essential. Carbon neutrality is increasingly viewed as a core element of sustainability across the entire product life cycle. Both the relevant literature and this study’s findings support this view, indicating that businesses should integrate CNSC practices into their product or service development processes [22,24,79,145,146]. In conclusion, businesses, governments, policymakers, managers, manufacturers, and retailers should take proactive steps to reduce emissions by adopting strategies to achieve carbon neutrality. This paper aims to provide new evidence [62]. Notably, carbon-neutral vehicles play a vital role in reducing carbon emissions [93,147,148]. Therefore, businesses are encouraged to optimize the efficiency of their supply chains to further lower carbon emissions [23].

6.3. Limitations and Recommendations for Future Research

Although this study provides a comprehensive synthesis of the relationships among GSCM, GI, and CNSCP, several important limitations should be acknowledged. First, the number of studies included in the meta-analysis is relatively limited, which may reduce the generalizability of the findings across different sectors and country contexts. Additionally, the analysis drew on only four databases (Web of Science, EBSCOhost, Scopus, and Google Scholar), potentially missing relevant studies indexed elsewhere. Another limitation lies in the exclusive focus on international, English-language publications, which may have led to the omission of valuable insights from national or non-English-language studies. Furthermore, the analysis is limited to the carbon neutral supply chain performance (CNSCP) indicator in order to maintain conceptual and measurement consistency. Although the literature highlights that narrowly defining search terms may pose a potential risk of bias, examining alternative terms that align with the CNSCP concept has not yielded any additional empirical findings (see Section 4.1). This indicates that carbon-neutral supply chain performance is a relatively new performance dimension that has been addressed only to a limited extent in the GSCM literature. Future research should therefore broaden the scope by incorporating additional databases and including studies from diverse linguistic and national contexts. Moreover, qualitative research methods—such as case studies, interviews, or grounded theory—could provide richer insights into the organizational, cultural, and institutional dynamics that shape the interplay among GSCM, GI, and CNSCP. Finally, future studies should employ RBV and NRBV frameworks to examine in greater depth how country-level economic and environmental differences moderate effects, thereby deepening the theoretical contributions of sustainability research.

7. Conclusions

This meta-analysis provides integrated evidence on the relationships among GSCM, GI, and CNSCP and confirms that GSCM is strongly associated with both GI and carbon-neutral supply chain performance (see [1,12,24,33,34,35,44,65,70,73,79,82,83,84,85,86,87,89,90,91,92,125]). By disaggregating GSCM and GI into subcomponents and incorporating macro-level sustainability metrics as moderators, the study offers a more nuanced, context-sensitive understanding of how environmental capabilities translate into improved sustainability outcomes. Moreover, incorporating these macro-level sustainability indicators as moderators indicates that the relationships examined are highly sensitive to contextual conditions. While the contributions of GSCM and GI to carbon neutrality appear to be stronger in countries characterized by higher levels of economic development, technological readiness, and environmental performance, these effects tend to be more limited in contexts where institutional and technological infrastructures remain relatively weak.
Overall, the findings reveal that firm-level practices—particularly GSCM and GI—interact with country-level structural conditions (economic development, technological readiness, and environmental performance) to jointly shape both the direction and the strength of these relationships [32,95,98,99,100]. In this sense, the effects of GSCM and GI do not yield context-independent or universally applicable outcomes; rather, they emerge in a manner that is contingent upon the institutional, technological, and economic environments in which firms operate. By integrating fragmented and occasionally contradictory empirical evidence into a coherent analytical framework, the study provides a clearer account of the mechanisms through which environmental capabilities are translated into sustainable performance outcomes. Furthermore, by synthesizing the RBV and NRBV perspectives, the study demonstrates that GSCM and GI should be conceptualized not merely as operational tools, but as context-sensitive, dynamic, and strategic capabilities that contribute most effectively to progress toward environmental sustainability and carbon neutrality under specific conditions.

Author Contributions

Conceptualization, R.Ö., M.Ö. and Z.K.; methodology, M.Ö. and Z.K.; software, R.Ö., M.Ö., A.N. and Z.K.; validation, Z.K. and A.N.; formal analysis, R.Ö., M.Ö. and Z.K.; investigation, R.Ö., S.S.G., M.Ö. and Z.K.; resources, S.S.G., M.Ö. and Z.K.; data curation, R.Ö., M.Ö., C.D. and Z.K.; writing—original draft preparation, D.C., R.Ö., M.Ö. and Z.K.; writing—review and editing C.A.I., R.Ö. and M.Ö.; visualization, C.D. and Z.K.; supervision, C.A.I., D.C. and R.Ö. All authors have read and agreed to the published version of the manuscript.

Funding

This work was supported by the grant “GNAC ARUT 2023” contract no. 164/4.12.2023 financed by the National University of Science and Technology Politehnica Bucharest.

Institutional Review Board Statement

Not applicable.

Informed Consent Statement

Not applicable.

Data Availability Statement

The data presented in this study are available upon request from the corresponding author. References [3,24,33,34,35,67,80,82,83,84,85,86,87,89,90,91,92,119,120,121,122,123,124,125] are included in the meta-analysis.

Conflicts of Interest

The authors declare no conflicts of interest.

Appendix A

Table A1. Coding Scheme.
No. VariablesCodesDefinition & Examples
1.Methodological EffectContinentAsiaThe article was coded as mentioned.
AfricaThe article was coded as mentioned.
Country10 categoriesIn 10 different categories; Bangladesh, China, Indonesia, France, India, Jordan, Malaysia, Pakistan, Taiwan, Vietnam coded (see Table 1).
Firm sizeSMEFour categories for the size of the company SME, Large, mixed and N.S. coding was made (see for mixture. Table 1; N.S. was coded for uncertain work).
Large
Mixed
N.S.
Industry Type9 categoriesAs mentioned in the article, it was coded in 9 different categories: logistics, manufacturing, electronics, minerals, food, production, health, mixed, and NS (studies applied to multiple sectors for mixture; NS was coded for uncertain studies (see Table 1)).
2.Economic EffectCountry DevelopmentLow Income
High Income
NS
A country’s level of economic development is coded as Low Income or High Income; to clarify the economic divide, World Bank data are used to separate countries as high income or low income [106]. NS is coded for unattainable data.
Frontier Technologies Index (FTI)High
Um
Lm
Low
NS
The Frontier Technology Index was calculated using the methodology presented in the Technology and Innovation Report 2021. The index provided results for 166 economies. Country rankings are arranged in four 25-point scales: low, lower-middle, upper-middle and high [107]. N.S. is coded for unattainable data.
Renewable Energy Use RateLow
High
NS
The use of renewable energy in the activities of countries has been determined as a critical factor in reducing CO2 emissions. Therefore, the renewable energy use rates of countries are obtained from [108] source. As in the studies by [98,100], values above the median = High; values below = Low. N.S. is coded for unattainable data.
3.Contextual EffectGlobal Sustainable Competition Index (GSCI)Low
High
NS
The Global Sustainable Competitiveness Index (GACI) from SolAbility measures the competitiveness of countries in an integrated way, with 111 indicators grouped into five sub-indices: natural capital, resource efficiency and intensity, intellectual capital, governance efficiency, and social cohesion. We adopted the median of the GSCI for each country to identify the two groups: low and high GSCI level [111]. As in the studies by [98,100], 0 = LOW, 1 = HIGH. N.S. is coded for unattainable data.
CO2 emissionLow
High
NS
The aim is to determine the differences between countries with high or low CO2 emissions. Ref. [106] related data were extracted. (As in the studies by [98,100], values above the median = High; values below = Low. N.S. is coded for unattainable data.
Carbon TaxNo
Yes
Carbon tax is considered as an important criterion whether it is implemented in a country or not [110]. Necessary data is provided from the source. Countries implementing tax = Yes; those not implementing tax = No.
4. Carbon Neutral Supply Chain PerformanceCNSCPThis approach is considered as the basic output of GSCM activities in literature. It also states that CO2 emission rates are minimized in GSCM processes.
5. Green Supply Chain ManagementGSCMEnvironmental applications for green healing; It combines both internal and external activities such as cooperation and investment with supply chain actors such as elimination of solid wastes, reducing pollution, eco-design, green purchase, internal environmental management and reverse logistics.
Green PurchaseGP
  • It is expressed as the purchase of environmental products
Internal Environmental ManagementIEM
  • As an important factor in the strategic planning of enterprises, it is expressed as domestic political regulations, action plans, targets and environmental approaches and aims to manage the impact of business characteristics on the environment
Eco-DesignED
  • It aims to integrate environmental criteria into the packaging, design, or re -design processes of the product.
Customer Environment CooperationCEC
  • It refers to the internal and external cooperation in every department of the enterprise and among different stakeholders for the adoption of green supply chain applications.
Reverse LogisticsRL
  • It is the process of planning and returning to the supply chain for recycling, renewal, reproduction or appropriate disposal for the recovery of value through the exhaustion points of the products and re -use.
6. Green InnovationGIThis approach, which is interested in minimizing the negative environmental impact, can create the differentiation of advanced product between ideas, products, processes, service and also competitors.
Green Product InnovationGPDI
  • Developing less pollutants and environmentally friendly materials using less toxic substances; designing recyclable or differentiated products includces eco-citations and applications to products.
Green Process InnovationGPCI
  • It is expressed as the use of innovative ways of reducing environmental impacts caused by negative production processes.
Green Management InnovationGMI
  • It is related to new management strategies that increase green applications.
Green Marketing InnovationGMRKI
  • Includes the inclusion of environmental criteria in product promotion, voluntary eco-citation activities such as franchising, licensing and pricing.

References

  1. Chiou, T.-Y.; Chan, H.K.; Lettice, F.; Chung, S.H. The influence of greening the suppliers and green innovation on environmental performance and competitive advantage in Taiwan. Transp. Res. Part E Logist. Transp. Rev. 2011, 47, 822–836. [Google Scholar] [CrossRef] [Scilit]
  2. Zhu, Q.; Sarkis, J.; Lai, K.-H. Green supply chain management implications for “closing the loop”. Transp. Res. Part E Logist. Transp. Rev. 2008, 44, 1–18. [Google Scholar] [CrossRef] [Scilit]
  3. Khan, M.T.; Idrees, M.D.; Rauf, M.; Sami, A.; Ansari, A.; Jamil, A. Green supply chain management practices’ impact on operational performance with the mediation of technological innovation. Sustainability 2022, 14, 3362. [Google Scholar] [CrossRef] [Scilit]
  4. Hervani, A.A.; Helms, M.M.; Sarkis, J. Performance measurement for green supply chain management. Benchmarking Int. J. 2005, 12, 330–353. [Google Scholar] [CrossRef] [Scilit]
  5. Seman, N.A.A.; Zakuan, N.; Jusoh, A.; Arif, M.S.M.; Saman, M.Z.M. The relationship of green supply chain management and green innovation concept. Procedia-Soc. Behav. Sci. 2012, 57, 453–457. [Google Scholar] [CrossRef] [Scilit]
  6. Caniato, F.; Caridi, M.; Crippa, L.; Moretto, A. Environmental sustainability in fashion supply chains: An exploratory case based research. Int. J. Prod. Econ. 2012, 135, 659–670. [Google Scholar] [CrossRef] [Scilit]
  7. Jo, D.; Kwon, C. Structure of green supply chain management for sustainability of small and medium enterprises. Sustainability 2021, 14, 50. [Google Scholar] [CrossRef] [Scilit]
  8. Vijayvargy, L.; Sahoo, S. Assessment of Green Supply Chain Practices for Sustainable Organizational Performance for the Automotive Sector. In Proceedings of the IOP Conference Series: Earth and Environmental Science 2021, Jaipur, India, 5–6 March 2021. [Google Scholar] [CrossRef] [Scilit]
  9. Chen, Y.-S. The driver of green innovation and green image–green core competence. J. Bus. Ethics 2008, 81, 531–543. [Google Scholar] [CrossRef] [Scilit]
  10. Chen, Y.-S.; Chang, C.-H. Enhance environmental commitments and green intangible assets toward green competitive advantages: An analysis of structural equation modeling (SEM). Qual. Quant. 2013, 47, 529–543. [Google Scholar] [CrossRef] [Scilit]
  11. Saunila, M.; Ukko, J.; Rantala, T. Sustainability as a driver of green innovation investment and exploitation. J. Clean. Prod. 2018, 179, 631–641. [Google Scholar] [CrossRef] [Scilit]
  12. Huang, J.-W.; Li, Y.-H. Green innovation and performance: The view of organizational capability and social reciprocity. J. Bus. Ethics 2017, 145, 309–324. [Google Scholar] [CrossRef] [Scilit]
  13. Lee, K.H.; Kim, J.W. Integrating suppliers into green product innovation development: An empirical case study in the semiconductor industry. Bus. Strategy Environ. 2011, 20, 527–538. [Google Scholar] [CrossRef] [Scilit]
  14. Wu, G.C. The influence of green supply chain integration and environmental uncertainty on green innovation in Taiwan’s IT industry. Supply Chain Manag. Int. J. 2013, 18, 539–552. [Google Scholar] [CrossRef] [Scilit]
  15. Zhu, Q.; Sarkis, J.; Lai, K.-H. Green supply chain management innovation diffusion and its relationship to organizational improvement: An ecological modernization perspective. J. Eng. Technol. Manag. 2012, 29, 168–185. [Google Scholar] [CrossRef] [Scilit]
  16. Agyabeng-Mensah, Y.; Baah, C.; Afum, E. Do the roles of green supply chain learning, green employee creativity, and green organizational citizenship behavior really matter in circular supply chain performance? J. Environ. Plan. Manag. 2024, 67, 609–631. [Google Scholar] [CrossRef] [Scilit]
  17. Baah, C.; Agyabeng-Mensah, Y.; Afum, E.; Kumi, C.A. Do circular economy practices accelerate CSR participation of SMEs in a stakeholder-pressured era? A network theory perspective. J. Clean. Prod. 2023, 394, 136348. [Google Scholar] [CrossRef] [Scilit]
  18. Patil, A.; Shardeo, V.; Dwivedi, A.; Moktadir, M.A.; Bag, S. Examining the interactions among smart supply chains and carbon reduction strategies: To attain carbon neutrality. Bus. Strategy Environ. 2024, 33, 1227–1246. [Google Scholar] [CrossRef] [Scilit]
  19. Zhang, J.; Xu, Z.; Ci, F. Spatio–Temporal Evolutionary Features and Drivers of Green Competitiveness of Cities Surrounding the Yellow River. Sustainability 2023, 15, 14127. [Google Scholar] [CrossRef] [Scilit]
  20. Chen, Y.; Guo, H. Corporate performance: Green supply chain management, digital transformation and carbon neutrality. Manag. Decis. 2024, 63, 2432–2451. [Google Scholar] [CrossRef] [Scilit]
  21. Zhu, H.; Fang, H.; Hua, F.; Shao, W.; Cai, P. The impact of environmental regulations on the upgrading of the industrial structure: Evidence from China. Heliyon 2024, 10, e27091. [Google Scholar] [CrossRef] [Scilit]
  22. Koh, S.L.; Jia, F.; Gong, Y.; Zheng, X.; Dolgui, A. Achieving carbon neutrality via supply chain management: Position paper and editorial for IJPR special issue. Int. J. Prod. Res. 2023, 61, 6081–6092. [Google Scholar] [CrossRef] [Scilit]
  23. Belhadi, A.; Mani, V.; Kamble, S.S.; Khan, S.A.R.; Verma, S. Artificial intelligence-driven innovation for enhancing supply chain resilience and performance under the effect of supply chain dynamism: An empirical investigation. Ann. Oper. Res. 2024, 333, 627–652. [Google Scholar] [CrossRef] [Scilit] [PubMed]
  24. Naz, F.; Samadhiya, A.; Kumar, A.; Garza-Reyes, J.A.; Kazancoglu, Y.; Kumar, V.; Upadhyay, A. The effect of green supply chain management practices on carbon-neutral supply chain performance: The mediating role of logistics eco-centricity. J. Manuf. Technol. Manag. 2024, 35, 1375–1396. [Google Scholar] [CrossRef] [Scilit]
  25. Zhang, T.; Zho, J.-Y.; Hussain, R.Y.; Wang, M.; Ren, K. Research on the cultivation of green competitiveness among chinese heavily polluting enterprises under country/district environmental regulations. Front. Environ. Sci. 2022, 10, 955744. [Google Scholar] [CrossRef] [Scilit]
  26. Barney, J. Firm resources and sustained competitive advantage. J. Manag. 1991, 17, 99–120. [Google Scholar] [CrossRef] [Scilit]
  27. Hart, S.L. A natural-resource-based view of the firm. Acad. Manag. Rev. 1995, 20, 986–1014. [Google Scholar] [CrossRef] [Scilit]
  28. Junejo, I.; Sohu, J.M.; Alwadi, B.M.; Ejaz, F.; Nasir, A.; Hossain, M.B. Green supply chain management and SMEs sustainable performance in developing country: Role of green knowledge sharing, green innovation and big data-driven supply chain. Discov. Sustain. 2025, 6, 342. [Google Scholar] [CrossRef] [Scilit]
  29. Martínez-Falcó, J.; Sánchez-García, E.; Marco-Lajara, B.; Andreu, R. Green supply chain management and sustainable performance: Exploring the role of circular economy capability and green ambidexterity innovation. Br. Food J. 2024, 126, 3985–4011. [Google Scholar] [CrossRef] [Scilit]
  30. Abbas, J. Green supply chain management and firm sustainable performance: Unlocking the role of transactional and transformational leadership in firm sustainable operations. Environ. Dev. Sustain. 2024, 1–20. [Google Scholar] [CrossRef] [Scilit]
  31. Huang, Y.-C.; Ding, H.-B.; Kao, M.-R. Salient stakeholder voices: Family business and green innovation adoption. J. Manag. Organ. 2009, 15, 309–326. [Google Scholar] [CrossRef] [Scilit]
  32. Li, L.; Shan, S.; Dai, J.; Che, W.; Shou, Y. The impact of green supply chain management on green innovation: A meta-analysis from the inter-organizational learning perspective. Int. J. Prod. Econ. 2022, 250, 108622. [Google Scholar] [CrossRef] [Scilit]
  33. Le, T.T.; Nhu, Q.P.V.; Bao, T.B.N.; Thao, L.V.N.; Pereira, V. Digitalisation driving sustainable corporate performance: The mediation of green innovation and green supply chain management. J. Clean. Prod. 2024, 446, 141290. [Google Scholar] [CrossRef] [Scilit]
  34. Karim, R.A.; Kawser, S.; Rabiul, M.K.; Chowdhury, T.; Murtaza, F.N.Y. Green supply chain management practices and environmental performance in the healthcare sector: The mediating role of green innovation. Glob. Knowl. Mem. Commun. 2024, 74, 2872–2889. [Google Scholar] [CrossRef] [Scilit]
  35. Rasheed, R.; Rashid, A.; Amirah, N.A.; Hashmi, R. Integrating environmental and entrepreneurship advocacy into enviropreneurship through green supply chain management, waste management, and green innovation: A study on SMEs of US. Clean. Eng. Technol. 2024, 21, 100768. [Google Scholar] [CrossRef] [Scilit]
  36. Bai, X.; Coelho, A.; Lopes Cancela, B. The relationship between green supply chain and green innovation based on the push of green strategic alliances. Corp. Soc. Responsib. Environ. Manag. 2024, 31, 1026–1041. [Google Scholar] [CrossRef] [Scilit]
  37. Wang, S.; Zhang, H. Inter-organizational cooperation in digital green supply chains: A catalyst for eco-innovations and sustainable business practices. J. Clean. Prod. 2024, 472, 143383. [Google Scholar] [CrossRef] [Scilit]
  38. Haden, S.S.P.; Oyler, J.D.; Humphreys, J.H. Historical, practical, and theoretical perspectives on green management: An exploratory analysis. Manag. Decis. 2009, 47, 1041–1055. [Google Scholar] [CrossRef] [Scilit]
  39. Wang, M.; Zhang, G. What motivates firms to adopt a green supply chain and how much does it matter? Front. Environ. Sci. 2023, 11, 1227008. [Google Scholar] [CrossRef] [Scilit]
  40. Klassen, R.D.; McLaughlin, C.P. The impact of environmental management on firm performance. Manag. Sci. 1996, 42, 1199–1214. [Google Scholar] [CrossRef] [Scilit]
  41. Keskin, H.; Tatoglu, E.; Akgün, A.E.; Esen, E. Linking green supply chain management and blockchain technology to green marketing and environmental performance: The mediating role of green technology innovation. Int. Mark. Rev. 2025, 1–40, ahead-of-print. [Google Scholar] [CrossRef] [Scilit]
  42. Sarkis, J.; Zhu, Q.; Lai, K.-H. An organizational theoretic review of green supply chain management literature. Int. J. Prod. Econ. 2011, 130, 1–15. [Google Scholar] [CrossRef] [Scilit]
  43. Woo, C.; Kim, M.G.; Chung, Y.; Rho, J.J. Suppliers’ communication capability and external green integration for green and financial performance in Korean construction industry. J. Clean. Prod. 2016, 112, 483–493. [Google Scholar] [CrossRef] [Scilit]
  44. Basit, A. The Influence of Green Supply Chain Management on Sustainable Performance: Green Supply Chain Management. S. Asian Manag. Rev. 2022, 1, 49–66. [Google Scholar] [CrossRef] [Scilit]
  45. Trujillo-Gallego, M.; Sarache, W.; Sellitto, M.A. Identification of practices that facilitate manufacturing companies’ environmental collaboration and their influence on sustainable production. Sustain. Prod. Consum. 2021, 27, 1372–1391. [Google Scholar] [CrossRef] [Scilit]
  46. Shang, K.-C.; Lu, C.-S.; Li, S. A taxonomy of green supply chain management capability among electronics-related manufacturing firms in Taiwan. J. Environ. Manag. 2010, 91, 1218–1226. [Google Scholar] [CrossRef] [Scilit]
  47. Sheu, J.-B. Green supply chain management, reverse logistics and nuclear power generation. Transp. Res. Part E Logist. Transp. Rev. 2008, 44, 19–46. [Google Scholar] [CrossRef] [Scilit]
  48. Zhu, Q.; Feng, Y.; Choi, S.-B. The role of customer relational governance in environmental and economic performance improvement through green supply chain management. J. Clean. Prod. 2017, 155, 46–53. [Google Scholar] [CrossRef] [Scilit]
  49. Zhu, Q.; Sarkis, J. Relationships between operational practices and performance among early adopters of green supply chain management practices in Chinese manufacturing enterprises. J. Oper. Manag. 2004, 22, 265–289. [Google Scholar] [CrossRef]
  50. Hassan, M. Impact of green supply chain management on the sustainability: A study on textile industry. S. Asian J. Oper. Logist. 2024, 3, 25–38. [Google Scholar] [CrossRef] [Scilit]
  51. Chin, T.A.; Tat, H.H.; Sulaiman, Z. Green supply chain management, environmental collaboration and sustainability performance. Procedia Cirp 2015, 26, 695–699. [Google Scholar] [CrossRef] [Scilit]
  52. Agyabeng-Mensah, Y.; Ahenkorah, E.; Afum, E.; Nana Agyemang, A.; Agnikpe, C.; Rogers, F. Examining the influence of internal green supply chain practices, green human resource management and supply chain environmental cooperation on firm performance. Supply Chain Manag. Int. J. 2020, 25, 585–599. [Google Scholar] [CrossRef] [Scilit]
  53. Younis, H.; Sundarakani, B.; Vel, P. The impact of implementing green supply chain management practices on corporate performance. Compet. Rev. 2016, 26, 216–245. [Google Scholar] [CrossRef] [Scilit]
  54. Zhang, J.; Liang, G.; Feng, T.; Yuan, C.; Jiang, W. Green innovation to respond to environmental regulation: How external knowledge adoption and green absorptive capacity matter? Bus. Strategy Environ. 2020, 29, 39–53. [Google Scholar] [CrossRef] [Scilit]
  55. Jabbour, C.J.C. Environmental training and environmental management maturity of Brazilian companies with ISO14001: Empirical evidence. J. Clean. Prod. 2015, 96, 331–338. [Google Scholar] [CrossRef] [Scilit]
  56. Jabbour, C.J.C.; de Sousa Jabbour, A.B.L. Green human resource management and green supply chain management: Linking two emerging agendas. J. Clean. Prod. 2016, 112, 1824–1833. [Google Scholar] [CrossRef] [Scilit]
  57. Mafini, C.; Loury-Okoumba, W.V. Extending green supply chain management activities to manufacturing small and medium enterprises in a developing economy. S. Afr. J. Econ. Manag. Sci. 2018, 21, 1–12. [Google Scholar] [CrossRef] [Scilit]
  58. Mafini, C.; Muposhi, A. The impact of green supply chain management in small to medium enterprises: Cross-sectional evidence. J. Transp. Supply Chain Manag. 2017, 11, 11. [Google Scholar] [CrossRef] [Scilit]
  59. Sellitto, M.A.; Camfield, C.G.; Buzuku, S. Green innovation and competitive advantages in a furniture industrial cluster: A survey and structural model. Sustain. Prod. Consum. 2020, 23, 94–104. [Google Scholar] [CrossRef] [Scilit]
  60. Chu, S.H.; Yang, H.; Lee, M.; Park, S. The impact of institutional pressures on green supply chain management and firm performance: Top management roles and social capital. Sustainability 2017, 9, 764. [Google Scholar] [CrossRef] [Scilit]
  61. Lee, S.-Y.; Klassen, R.D.; Furlan, A.; Vinelli, A. The green bullwhip effect: Transferring environmental requirements along a supply chain. Int. J. Prod. Econ. 2014, 156, 39–51. [Google Scholar] [CrossRef] [Scilit]
  62. Pal, B.; Sarkar, A.; Sarkar, B. Optimal decisions in a dual-channel competitive green supply chain management under promotional effort. Expert Syst. Appl. 2023, 211, 118315. [Google Scholar] [CrossRef] [Scilit]
  63. Li, Y. Environmental innovation practices and performance: Moderating effect of resource commitment. J. Clean. Prod. 2014, 66, 450–458. [Google Scholar] [CrossRef] [Scilit]
  64. Oduro, S.; Maccario, G.; De Nisco, A. Green innovation: A multidomain systematic review. Eur. J. Innov. Manag. 2022, 25, 567–591. [Google Scholar] [CrossRef] [Scilit]
  65. Chen, Y.-S.; Lai, S.-B.; Wen, C.-T. The influence of green innovation performance on corporate advantage in Taiwan. J. Bus. Ethics 2006, 67, 331–339. [Google Scholar] [CrossRef] [Scilit]
  66. Tseng, M.-L.; Lin, R.-J.; Lin, Y.-H.; Chen, R.-H.; Tan, K. Close-loop or open hierarchical structures in green supply chain management under uncertainty. Expert Syst. Appl. 2014, 41, 3250–3260. [Google Scholar] [CrossRef] [Scilit]
  67. Abdallah, A.B.; Al-Ghwayeen, W.S.; Al-Amayreh, E.A.M.; Sweis, R.J. The Impact of Green Supply Chain Management on Circular Economy Performance: The Mediating Roles of Green Innovations. Logistics 2024, 8, 20. [Google Scholar] [CrossRef] [Scilit]
  68. Khanra, S.; Kaur, P.; Joseph, R.P.; Malik, A.; Dhir, A. A resource-based view of green innovation as a strategic firm resource: Present status and future directions. Bus. Strategy Environ. 2022, 31, 1395–1413. [Google Scholar] [CrossRef] [Scilit]
  69. Nasir, A.; Zakaria, N.; Do, N.; Velasquez, S. The impact of knowledge management on sustainable performance with mediation effect of green innovation in Malaysian SMEs. VINE J. Inf. Knowl. Manag. Syst. 2024. [Google Scholar] [CrossRef] [Scilit]
  70. Zeng, S.; Li, G.; Wu, S.; Dong, Z. The impact of green technology innovation on carbon emissions in the context of carbon neutrality in China: Evidence from spatial spillover and nonlinear effect analysis. Int. J. Environ. Res. Public Health 2022, 19, 730. [Google Scholar] [CrossRef] [Scilit]
  71. Zhang, A.; Tay, H.L.; Alvi, M.F.; Wang, J.X.; Gong, Y. Carbon neutrality drivers and implications for firm performance and supply chain management. Bus. Strategy Environ. 2023, 32, 1966–1980. [Google Scholar] [CrossRef] [Scilit]
  72. Liu, L.; Wu, H.; Hafeez, M.; Abubaker Albaity, M.S.; Ullah, S. Carbon neutrality through supply chain performance: Does green innovation matter in Asia? Econ. Res.-Ekon. Istraživanja 2023, 36, 2149588. [Google Scholar] [CrossRef] [Scilit]
  73. Liu, W.; Gao, Y.; Yuan, C.; Wang, D.; Tang, O. The impact of carbon neutrality policies on the stock market from a supply chain perspective. Ind. Manag. Data Syst. 2023, 123, 2631–2658. [Google Scholar] [CrossRef] [Scilit]
  74. Wang, H.; Xu, Z.; Pedrycz, W. An overview on the roles of fuzzy set techniques in big data processing: Trends, challenges and opportunities. Knowl.-Based Syst. 2017, 118, 15–30. [Google Scholar] [CrossRef] [Scilit]
  75. Lee, H.; Wu, X. Green supplier selection and environmental performance of firms in the Chinese manufacturing industry: The roles of behavior and outcome controls. J. Manuf. Technol. Manag. 2023, 34, 1141–1161. [Google Scholar] [CrossRef] [Scilit]
  76. Riaz, A.; Santoro, G.; Ashfaq, K.; Ali, F.H.; Rehman, S.U. Green competitive advantage and SMEs: Is big data the missing link? J. Compet. 2023, 15, 73. [Google Scholar] [CrossRef] [Scilit]
  77. Zhai, W.; Zhang, S.; Zhang, Y.; Zhang, X.; Yang, H. The actions for carbon neutrality in the social network of supply chains. Carbon Manag. 2025, 16, 2451851. [Google Scholar] [CrossRef] [Scilit]
  78. Chen, X.; Jang, E. A Sustainable Supply Chain Network Model Considering Carbon Neutrality and Personalization. Sustainability 2022, 14, 4803. [Google Scholar] [CrossRef] [Scilit]
  79. Qin, L.; Kirikkaleli, D.; Hou, Y.; Miao, X.; Tufail, M. Carbon neutrality target for G7 economies: Examining the role of environmental policy, green innovation and composite risk index. J. Environ. Manag. 2021, 295, 113119. [Google Scholar] [CrossRef] [Scilit]
  80. Tetteh, F.K.; Mensah, J.; Owusu Kwateng, K. Understanding what, how and when green logistics practices influence carbon-neutral supply chain performance. Int. J. Product. Perform. Manag. 2024, 74, 2211–2244. [Google Scholar] [CrossRef] [Scilit]
  81. Shehzad, M.U.; Jianhua, Z.; Naveed, K.; Zia, U.; Sherani, M. Sustainable transformation: An interaction of green entrepreneurship, green innovation, and green absorptive capacity to redefine green competitive advantage. Bus. Strategy Environ. 2024, 33, 7041–7059. [Google Scholar] [CrossRef] [Scilit]
  82. Purwanto, A. The role of green innovation and green supply chain management on the sustainability of the performance of SMEs. J. Future Sustain. 2022, 2, 49–52. [Google Scholar] [CrossRef] [Scilit]
  83. Novitasari, M.; Agustia, D. Green supply chain management and firm performance: The mediating effect of green innovation. J. Ind. Eng. Manag. 2021, 14, 391–403. [Google Scholar] [CrossRef] [Scilit]
  84. Darwish, S.; Shah, S.; Ahmed, U. The role of green supply chain management practices on environmental performance in the hydrocarbon industry of Bahrain: Testing the moderation of green innovation. Uncertain Supply Chain. Manag. 2021, 9, 265–276. [Google Scholar] [CrossRef] [Scilit]
  85. Shafique, M.; Asghar, M.; Rahman, H. The impact of green supply chain management practices on performance: Moderating role of institutional pressure with mediating effect of green innovation. Bus. Manag. Econ. Eng. 2017, 15, 91–108. [Google Scholar] [CrossRef] [Scilit]
  86. Liu, D.; Yousaf, Z.; Rosak-Szyrocka, J. Environmental Performance Through Green Supply Chain Management Practices, Green Innovation, and Zero Waste Management. Sustainability 2024, 16, 11173. [Google Scholar] [CrossRef] [Scilit]
  87. Le, T.T.; Vo, X.V.; Venkatesh, V. Role of green innovation and supply chain management in driving sustainable corporate performance. J. Clean. Prod. 2022, 374, 133875. [Google Scholar] [CrossRef] [Scilit]
  88. Huang, J.-W.; Li, Y.-H. How resource alignment moderates the relationship between environmental innovation strategy and green innovation performance. J. Bus. Ind. Mark. 2018, 33, 316–324. [Google Scholar] [CrossRef] [Scilit]
  89. Hu, S.; Chen, A. Unlocking the potential of sustainability: The influence of green innovation and supply chain management on corporate performance. Environ. Sci. Pollut. Res. 2023, 30, 99774–99788. [Google Scholar] [CrossRef] [Scilit]
  90. Makhlouf, H.; Chatti, N.; Lakhal, L. The impact of TQM and green innovation on corporate sustainability: The mediating role of green supply chain management. Int. J. Qual. Reliab. Manag. 2023, 40, 2592–2611. [Google Scholar] [CrossRef] [Scilit]
  91. Suki, N.M.; Suki, N.M.; Sharif, A.; Afshan, S.; Rexhepi, G. Importance of green innovation for business sustainability: Identifying the key role of green intellectual capital and green SCM. Bus. Strategy Environ. 2023, 32, 1542–1558. [Google Scholar] [CrossRef] [Scilit]
  92. Wen, X.; Cheah, J.-H.; Lim, X.-J.; Ramachandran, S. Why does “green” matter in supply chain management? Exploring institutional pressures, green practices, green innovation, and economic performance in the Chinese chemical sector. J. Clean. Prod. 2023, 427, 139182. [Google Scholar] [CrossRef] [Scilit]
  93. Lee, C.-C.; Hussain, J. A carbon neutral supply chain management by considering emission-risk minimization and green purchasing through optimal decision-making. Environ. Res. 2024, 251, 118662. [Google Scholar] [CrossRef] [Scilit] [PubMed]
  94. Liu, G.; Liu, J.; Zhao, J.; Qiu, J.; Mao, Y.; Wu, Z.; Wen, F. Real-time corporate carbon footprint estimation methodology based on appliance identification. IEEE Trans. Ind. Inform. 2022, 19, 1401–1412. [Google Scholar] [CrossRef] [Scilit]
  95. Geng, R.; Mansouri, S.A.; Aktas, E. The relationship between green supply chain management and performance: A meta-analysis of empirical evidences in Asian emerging economies. Int. J. Prod. Econ. 2017, 183, 245–258. [Google Scholar] [CrossRef] [Scilit]
  96. Hunter, J.E.; Schmidt, F.L. Methods of Meta-Analysis: Correcting Error and Bias in Research Findings, 2nd ed.; Sage: Thousand Oaks, CA, USA, 2004. [Google Scholar]
  97. Koeske, G.F. Moderator variables in social work research. J. Soc. Serv. Res. 1992, 16, 159–178. [Google Scholar] [CrossRef] [Scilit]
  98. Bitencourt, C.C.; de Oliveira Santini, F.; Zanandrea, G.; Froehlich, C.; Ladeira, W.J. Empirical generalizations in eco-innovation: A meta-analytic approach. J. Clean. Prod. 2020, 245, 118721. [Google Scholar] [CrossRef] [Scilit]
  99. Oduro, S. Eco-innovation and SMEs’ sustainable performance: A meta-analysis. Eur. J. Innov. Manag. 2024, 27, 248–279. [Google Scholar] [CrossRef] [Scilit]
  100. Wang, Q.; Chen, L.; Jia, F.; Luo, Y.; Zhang, Z. The relationship between supply chain integration and sustainability performance: A meta-analysis. Int. J. Logist. Res. Appl. 2024, 27, 1388–1409. [Google Scholar] [CrossRef] [Scilit]
  101. Devaraj, S.; Krajewski, L.; Wei, J.C. Impact of eBusiness technologies on operational performance: The role of production information integration in the supply chain. J. Oper. Manag. 2007, 25, 1199–1216. [Google Scholar] [CrossRef] [Scilit]
  102. Wook Kim, S. Effects of supply chain management practices, integration and competition capability on performance. Supply Chain. Manag. Int. J. 2006, 11, 241–248. [Google Scholar] [CrossRef] [Scilit]
  103. Wu, G.-C.; Ding, J.-H.; Chen, P.-S. The effects of GSCM drivers and institutional pressures on GSCM practices in Taiwan’s textile and apparel industry. Int. J. Prod. Econ. 2012, 135, 618–636. [Google Scholar] [CrossRef] [Scilit]
  104. Wiengarten, F.; Li, H.; Singh, P.J.; Fynes, B. Re-evaluating supply chain integration and firm performance: Linking operations strategy to supply chain strategy. Supply Chain. Manag. Int. J. 2019, 24, 540–559. [Google Scholar] [CrossRef] [Scilit]
  105. Yang, C.-L.; Lin, S.-P.; Chan, Y.-H.; Sheu, C. Mediated effect of environmental management on manufacturing competitiveness: An empirical study. Int. J. Prod. Econ. 2010, 123, 210–220. [Google Scholar] [CrossRef] [Scilit]
  106. WorldBank. World Development Indicators. 2025. Available online: https://databank.worldbank.org/source/world-development-indicators?l=en# (accessed on 1 June 2025).
  107. UNCTAD. Technology and Innovation Report 2023 (Overview). 2023. Available online: https://unctad.org/publication/technology-and-innovation-report-2023 (accessed on 1 June 2025).
  108. Our World in Data. Renewable Energy. 2025. Available online: https://ourworldindata.org/renewable-energy (accessed on 1 June 2025).
  109. Zhang, S.; Chen, M.; Tang, G. How green human resource management can promote green competitive advantage: The role of green innovation. Bus. Strategy Environ. 2024, 33, 4613–4625. [Google Scholar] [CrossRef] [Scilit]
  110. WorldBank. State and Trends of Carbon Pricing Dashboard. 2025. Available online: https://carbonpricingdashboard.worldbank.org/compliance/price (accessed on 1 June 2025).
  111. SolAbility’s. The Global Sustainable Competitiveness Index 2024. 2024. Available online: https://solability.com/the-global-sustainable-competitiveness-index/global-sustainability-index-downloads (accessed on 1 June 2025).
  112. Şen, S.; Yıldırım, İ. Meta-Analysis Applications with CMA; Nobel Publishing: Ankara, Türkiye, 2020. [Google Scholar]
  113. Borenstein, M.; Hedges, L.V.; Higgins, J.P.; Rothstein, H.R. Meta-Analize Giriş; Dinçer, S., Translator; Anı Yayıncılık: Ankara, Türkiye, 2013. [Google Scholar]
  114. Hedges, L.V. Modeling publication selection effects in meta-analysis. Stat. Sci. 1992, 7, 246–255. [Google Scholar] [CrossRef] [Scilit]
  115. PRISMA. 2020. Available online: https://www.prisma-statement.org/prisma-2020-flow-diagram (accessed on 28 December 2025).
  116. Cooper, H.; Hedges, L.V.; Valentine, J.C. The Handbook of Research Synthesis and Meta-Analysi; Russell Sage Foundation: New York, NY, USA, 2019. [Google Scholar]
  117. Rosenthal, R. The file drawer problem and tolerance for null results. Psychol. Bull. 1979, 86, 638. [Google Scholar] [CrossRef]
  118. Cohen, J. A coefficient of agreement for nominal scales. Educ. Psychol. Meas. 1960, 20, 37–46. [Google Scholar] [CrossRef] [Scilit]
  119. Sharabati, A.-A.A. Green supply chain management and competitive advantage of Jordanian pharmaceutical industry. Sustainability 2021, 13, 13315. [Google Scholar] [CrossRef] [Scilit]
  120. Seman, N.A.A.; Govindan, K.; Mardani, A.; Zakuan, N.; Saman, M.Z.M.; Hooker, R.E.; Ozkul, S. The mediating effect of green innovation on the relationship between green supply chain management and environmental performance. J. Clean. Prod. 2019, 229, 115–127. [Google Scholar] [CrossRef] [Scilit]
  121. Yusr, M.M.; Salimon, M.G.; Mokhtar, S.S.M.; Abaid, W.M.A.W.; Shaari, H.; Perumal, S.; Saoula, O. Green innovation performance! How to be achieved? A study applied on Malaysian manufacturing sector. Sustain. Futures 2020, 2, 100040. [Google Scholar] [CrossRef] [Scilit]
  122. Nureen, N.; Liu, D.; Irfan, M.; Malik, M.; Awan, U. Nexuses among green supply chain management, green human capital, managerial environmental knowledge, and firm performance: Evidence from a developing country. Sustainability 2023, 15, 5597. [Google Scholar] [CrossRef] [Scilit]
  123. Li, Y.-H.; Huang, J.-W. The moderating role of relational bonding in green supply chain practices and performance. J. Purch. Supply Manag. 2017, 23, 290–299. [Google Scholar] [CrossRef] [Scilit]
  124. Muduli, K.K.; Luthra, S.; Kumar Mangla, S.; Jabbour, C.J.C.; Aich, S.; de Guimarães, J.C.F. Environmental management and the “soft side” of organisations: Discovering the most relevant behavioural factors in green supply chains. Bus. Strategy Environ. 2020, 29, 1647–1665. [Google Scholar] [CrossRef] [Scilit]
  125. Tetteh, F.K.; Owusu Kwateng, K.; Mensah, J. Enhancing carbon neutral supply chain performance: Can green logistics and pressure from supply chain stakeholders make any differences? Sustain. Account. Manag. Policy J. 2025, 16, 521–551. [Google Scholar] [CrossRef] [Scilit]
  126. Chen, J.M. Carbon neutrality: Toward a sustainable future. Innovation 2021, 2, 100127. [Google Scholar] [CrossRef] [Scilit]
  127. Hunter, J.E.; Schmidt, F.L. Meta-analysis. In Advances in Educational and Psychological Testing: Theory and Applications; Springer: Berlin/Heidelberg, Germany, 1982; pp. 157–183. [Google Scholar] [CrossRef] [Scilit]
  128. Cohen, J. Statistical power analysis. Curr. Dir. Psychol. Sci. 1992, 1, 98–101. [Google Scholar] [CrossRef] [Scilit]
  129. Cohen, J. Statistical Power Analysis for the Behavioral Sciences; Routledge: Abingdon, UK, 2013. [Google Scholar] [CrossRef] [Scilit]
  130. Borenstein, M.; Hedges, L.V.; Higgins, J.P.; Rothstein, H.R. Introduction to Meta-Analysis; John Wiley and Sons: Hoboken, NJ, USA, 2021. [Google Scholar]
  131. Erbiçer, E.S.; Boranlı, E.N.; Metin, A.; Erbiçer, S.; Şen, S.; Demirtaş, E.T.; Espelage, D.L. Cyber Dating Violence Among Youth and Adolescents: A Systematic Review and Meta-Analysis. J. Youth Adolesc. 2024, 54, 625–648. [Google Scholar] [CrossRef] [Scilit]
  132. Field, A.P.; Gillett, R. How to do a meta-analysis. Br. J. Math. Stat. Psychol. 2010, 63, 665–694. [Google Scholar] [CrossRef] [Scilit]
  133. Milesan, M.; Girdu, C.C.; Cirtina, L.M.; Radulescu, C. Mathematical Modelling Study of Hardox400 Steel Parts’ Roughness and Hardness, Cut with CO2 Laser. J. Mech. Eng./Stroj. Vestn. 2020, 66, 127–141. [Google Scholar] [CrossRef] [Scilit]
  134. Bica, I.; Anitas, E.M.; Chirigiu, L.; Cirtina, D.; Chirigiu, L.M.E. Hybrid magnetorheological suspension: Effects of magnetic field on the relative dielectric permittivity and viscosity. Colloid Polym. Sci. 2018, 296, 1373–1378. [Google Scholar] [CrossRef] [Scilit]
  135. Egger, M.; Smith, G.D.; Schneider, M.; Minder, C. Bias in meta-analysis detected by a simple, graphical test. BMJ 1997, 315, 629–634. [Google Scholar] [CrossRef] [Scilit] [PubMed]
  136. Begg, C.B.; Mazumdar, M. Operating characteristics of a rank correlation test for publication bias. Biometrics 1994, 1088–1101. [Google Scholar] [CrossRef] [Scilit]
  137. Zhou, L.; Li, Q.; Li, F.; Jin, C. Research on green technology path of cold-chain distribution of fresh products based on sustainable development goals. Sustainability 2022, 14, 16659. [Google Scholar] [CrossRef] [Scilit]
  138. Klassen, R.D.; Whybark, D.C. Whybark, The impact of environmental technologies on manufacturing performance. Acad. Manag. J. 1999, 42, 599–615. [Google Scholar] [CrossRef] [Scilit]
  139. Luu, T.V.; Chromjaková, F.; Nguyen, H.Q. A model of industry 4.0 and a circular economy for green logistics and a sustainable supply chain. Bus. Strategy Dev. 2023, 6, 897–920. [Google Scholar] [CrossRef] [Scilit]
  140. Karia, N. Green logistics practices and sustainable business model. In Handbook of Research on the Applications of International Transportation and Logistics for World Trade; IGI Global: Hershey, PA, USA, 2020; pp. 354–366. [Google Scholar] [CrossRef] [Scilit]
  141. Khayyat, M.; Balfaqih, M.; Balfaqih, H.; Ismail, M. Challenges and Factors Influencing the Implementation of Green Logistics: A Case Study of Saudi Arabia. Sustainability 2024, 16, 5617. [Google Scholar] [CrossRef] [Scilit]
  142. Noorliza, K. Determinants of an environmentally sustainable model for competitiveness. Sustainability 2023, 15, 1444. [Google Scholar] [CrossRef] [Scilit]
  143. Choudhary, K.; Sangwan, K.S. Benchmarking Indian ceramic enterprises based on green supply chain management pressures, practices and performance. Benchmarking Int. J. 2018, 25, 3628–3653. [Google Scholar] [CrossRef] [Scilit]
  144. Baah, C.; Jin, Z.; Tang, L. Organizational and regulatory stakeholder pressures friends or foes to green logistics practices and financial performance: Investigating corporate reputation as a missing link. J. Clean. Prod. 2020, 247, 119125. [Google Scholar] [CrossRef] [Scilit]
  145. Belhadi, A.; Venkatesh, M.; Kamble, S.; Abedin, M.Z. Data-driven digital transformation for supply chain carbon neutrality: Insights from cross-sector supply chain. Int. J. Prod. Econ. 2024, 270, 109178. [Google Scholar] [CrossRef] [Scilit]
  146. Zhang, Q.; Gao, B.; Luqman, A. Linking green supply chain management practices with competitiveness during covid 19: The role of big data analytics. Technol. Soc. 2022, 70, 102021. [Google Scholar] [CrossRef] [Scilit]
  147. Chen, Y.; Lee, C.-C.; Zhu, S. China’s sustainable carbon neutral supply chain management: A reference to global emission reduction. Environ. Sci. Pollut. Res. 2023, 30, 118495–118509. [Google Scholar] [CrossRef] [Scilit]
  148. Hussain, J.; Lee, C.-C.; Chen, Y. Optimal green technology investment and emission reduction in emissions generating companies under the support of green bond and subsidy. Technol. Forecast. Soc. Change 2022, 183, 121952. [Google Scholar] [CrossRef] [Scilit]
Figure 1. Conceptual Model.
Sustainability 18 00681 g001
Figure 2. PRISMA flowchart Reference [115].
Sustainability 18 00681 g002
Figure 3. Distribution of Studies Included in Meta-Analysis by Year.
Sustainability 18 00681 g003
Figure 4. Distribution of Studies Included in the Meta-Analysis by Sectors.
Sustainability 18 00681 g004
Figure 5. Funnel Pilot for Standard Error by Fisher’s Z.
Sustainability 18 00681 g005
Table 1. Information About the Study Included in the Analysis.
GSCM-GI/CNSCP Relationship
S.N.StudiesNIndustryContinent/
Country
Firm SizeIndependent VariablesDependent Variables
1Abdallah, Al-Ghwayeen [67]278MixedAsia/JordanMixedGreen Purchasing/Internal Environment Management/Eco Design/Customer Environment CooperationGreen Product
Green Process
Green Management
2Khan, Idrees [3]225ManufacturingAsia/PakistanSMEGreen Purchasing/Eco DesignGreen Innovation
3Karim, Kawser [34]375HealthAsiaN.S.GSC ManagementGreen Innovation
4Darwish, Shah and Ahmed [84]290ManufacturingAsia/BangladeshMixedGreen Purchasing/Internal Environment Management/Eco Design/Customer Environment Cooperation/Reverse LogisticsGreen Innovation
5Suki, Suki [91]243ManufacturingAsia/MalaysiaN.S.Green Purchasing/Eco Design/Customer Environment Cooperation/Green LogisticsGreen Product
Green Process
6Sharabati [119]137ProductionAsia/JordanN.S.Green Purchasing/Internal Environment Management/Customer Environment CooperationGreen Innovation
7Seman, Govindan [120]123ManufacturingAsia/MalaysiaLargeGreen Purchasing/Internal Environment Management/Customer Environment Cooperation/Reverse LogisticsGreen Product
Green Process
Green Management
Green Marketing
8Purwanto [82]190N.S.Asia/IndonesiaSMEGSC ManagementGreen Innovation
9Hu and Chen [89]486ProductionAsia/ChinaSMEGSC ManagementGreen Innovation
10Rasheed, Rashid [35]835ElectronicAmericaSMEGSC ManagementGreen Innovation
11Makhlouf, Chatti and Lakhal [90]97ManufacturingEurope/FranceMixedGSC ManagementGreen Innovation
12Yusr, Salimon [121]143MixedAsia/MalaysiaMixedGSC ManagementGreen Innovation
13Wen, Cheah [92]414ProductionAsia/ChinaMixedGSC ManagementGreen Innovation
14Liu, Yousaf and Rosak-Szyrocka [86]389ManufacturingAsia/ChinaMixedGSC ManagementGreen Innovation
15Nureen, Liu [122]736MixedAsia/ChinaMixedGSC ManagementGreen Innovation
16Le, Nhu [33]405FoodAsia/VietnamSMEGSC ManagementGreen Innovation
17Li and Huang [123]251ManufacturingAsia/TaiwanMixedGSC ManagementGreen Innovation
18Le, Vo and Venkatesh [87]486FoodAsia/VietnamSMEGSC ManagementGreen Innovation
19Novitasari and Agustia [83]488N.S.Asia/IndonesiaN.S.GSC ManagementGreen Innovation
20Muduli, Luthra [124]101MiningAsia/IndiaN.S.GSC ManagementGreen Innovation
21Shafique, Asghar and Rahman [85]500ElectronicAsia/PakistanN.S.GSC ManagementGreen Innovation
22Tetteh, Owusu Kwateng and Mensah [125]208LogisticsAsia/GhanaMixedGreen transportation/Green warehousing/Green packaging and distribution/Reverse logistics information sharing/Sustainable waste managementCNSC Performance
23Naz, Samadhiya [24]224LogisticsAsia/IndiaMixedGreen manufacturing/Eco Design/Green Purchasing/Reverse RecoveryCNSC Performance
24Tetteh, Mensah and Owusu Kwateng [80]208LogisticsAsia/GhanaMixedGreen LogisticsCNSC Performance
Note: N = Sample size; N.S. = Not specified; Mixed Industry: Food and Beverage, Computer and Electrical Products and Components, Textile, Chemical Product, Machine Optical Equipment, Paper and Paper Product, Rubber production, Food, Drink, Industries such as textile, automotive, clothes, steel, pharmaceutical and paper, Machinery and Hardware, Electrical and Electronics, Chemical, Food, Textile and clothes, Rubber and plastic, Medicine, Paper and packaging; Mixed firm size: 1–49, 50–99, 100–199, 200–299, 300–500, 501–1000, 1000 over employee.
Table 2. CO2 Emissions of Countries Included in the Meta-Analysis for 2018 and 2023 (Unit: Million Metric Tons).
NoCountry20182023NoCountry20182023
1.Bangladesh105,485124,7938.Pakistan105,485124,793
2.Jordan25,25623,5799.France33,82437,425
3.Malaysia254,361283,32310.China25,25623,579
4.Vietnam283,860372,94811.Taiwan254.3612283,323
5.United States5118.1144682.03912.India283.8603372,948
6.Ghana19,13224,16313.Indonesia51,18146,820
7.World Total37,974.5538939,023.94
Source: [106].
Table 3. Results of Publication Bias.
Egger TestBegg and Mazumdar
One-Tailed pKendall Tau bTwo-Tailed p
GSCM-GI0.4130.0010.989
GP-GI0.3380.1060.631
IEM-GI0.217−0.2770.297
ED-GI0.4850.0001.000
CEC-GI0.198−0.1090.640
RL-GI0.138−0.0660.850
GSCM-GPDI0.051−0.490910.035
GSCM-GPCI0.079−0.318180.149
GSCM-GMI0.108−0.250000.386
GSCM-GMRKI0.284−0.111110.806
GSCM-CNSCP0.4340.2880.242
Table 4. Meta-Analysis Results.
95% CI of r
Random ModelkTotal EffectSample SizeESrSELLULZ-ValueQ-StatisticI2 (%)T2
GSCM->GI216015,0120.4990.0370.4430.55114.928 ***1159.811 ***94.9130.076
GP->GI61224640.4550.0390.3920.51312.644 ***38.845 ***71.6820.013
IEM->GI4917530.4680.0490.3900.53910.376 ***31.613 ***74.6940.016
ED->GI3615450.5640.0810.4470.6627.903 ***49.862 ***89.9720.035
CEC->GI51122390.4310.0490.3500.5059.444 ***50.948 ***80.3720.021
RL->GI269780.3730.0320.3180.42712.191 ***1.407 ***0.0000.000
GSCM->GPDI31122980.4450.0510.3610.5219.368 ***58.402 ***82.8770.023
GSCM->GPCI31225790.4550.0390.3920.51312.604 ***41.171 ***73.2820.013
GSCM->GMI2816040.4880.0320.4390.53516.471 ***11.106 ***36.9710.003
GSCM->GMRKI144920.3830.0460.3040.4578.859 ***2.404 ***0.0000.000
GSCM->CNSCP3817280.3950.1020.2140.5504.092 ***124.650 ***94.3840.079
Note: *** p < 0.001; k number of work; Cochran’s Q tests of heterogeneity; SE Standard error; LL Lower Limit; UL Upper Limit; T2 tau squared; CI confidence interval.
Table 5. Moderator Analysis Results (for GSCM-GI).
Moderators/Categories
kSample SizeESr95% CIrQ-Between
Methodological Effect
Industry Type
Manufacturing3258930.432 ***0.3850.47898.981 ***
Electronic213350.680 *0.0170.932
Food28910.639 ***0.5680.700
Mining11010.786 ***0.6970.850
Production614480.427 ***0.2270.592
Health13750.737 ***0.6870.781
Mixed1442150.500 ***0.4430.553
NS26780.8360.1410.988
Firm size
SME728520.665 ***0.4390.81215.736 ***
Mixed2162360.458 ***0.3950.517
Large1619680.385 ***0.3460.422
NS1639560.566 ***0.4560.658
Continent/Country
Asia12250.737 ***0.6870.781177.984 ***
America18350.378 ***0.3180.434
Bangladesh412450.333 ***0.1670.481
Chinese420250.258 ***0.1440.366
Indonesia26780.836 ***0.1410.988
France1970.697 ***0.5790.787
India11010.786 ***0.6970.850
Jordan1638840.516 ***0.4630.565
Malaysia2539120.424 ***0.3850.462
Pakistan27250.745 ***0.5580.860
Taiwan12510.390 ***0.2790.489
Vietnam28910.639 ***0.5680.700
Economic Effect
Country Development
Low Income3685890.449 ***0.3890.5016.374 *
High Income2255490.493 ***0.4180.553
NS27370.289 **0.1120.433
Using Renewable Energy Rate
LOW829500.571 ***0.4490.647
HIGH3372580.431 ***0.3600.4924.072
NS1948040.453 ***0.4060.495
Frontier Technologies Index
HIGH3171210.425 ***0.3530.486
LM1743720.473 ***0.4340.507
LOW13750.627 ***0.5960.65362.481 ***
LW39500.632 ***0.5060.696
NS27370.289 **0.1120.433
UM618620.489 ***0.3420.588
Contextual Effect
Carbon tax
No5412,6980.453 ***0.4120.4900.503
Yes623140.532 ***0.2650.661
CO2 Emission Rates
LOW2051020.461 ***0.4140.5025.582 *
HIGH3894230.468 ***0.4010.524
NS27370.289 **0.1120.433
Global Sustainable Competition Index
LOW2360790.496 ***0.4310.5497.080 *
HIGH3581960.445 ***0.3820.499
NS27370.289 **0.1120.433
Note: * p < 0.05; ** p < 0.01; *** p < 0.001; k number of effect sizes; Cochran’s Q tests of heterogeneity; CI confidence interval.
Table 6. Moderator Analysis Results (for GSCM-CNSCP).
Moderators/Categories
kSample SizeESr95% CIrQ-Between
Methodological Effect
Industry Type
Logistics817280.395 ***0.2140.55040.000
Firm size
Mixed817280.395 ***0.2140.5500.000
Country
Ghana48320.594 ***0.5340.64789.166 ***
India48960.152 ***0.0870.216
Economic Effect
Country Development
Low Income817280.151 ***0.0870.2130.000
High Income-----
Renewable Energy Use Rate
LOW48960.151 ***0.0870.21389.166 ***
HIGH48320.532 ***0.4880.570
Frontier Technologies Index
LM48320.532 ***0.4880.57089.166 ***
UM48960.151 ***0.0870.213
Contextual Effect
Carbon Tax
NO817280.376 ***0.2110.5000.000
YES- ---
CO2Emission Rates
LOW48320.532 ***0.4880.57089.166 ***
HIGH48960.151 ***0.0870.213
Global Sustainable Competition Index
LOW48320.532 ***0.4880.57089.166 ***
HIGH48960.151 ***0.0870.213
Notes: *** p < 0.001; k number of effect sizes; Cochran’s Q tests of heterogeneity; CI confidence interval.
Disclaimer/Publisher’s Note: The statements, opinions and data contained in all publications are solely those of the individual author(s) and contributor(s) and not of MDPI and/or the editor(s). MDPI and/or the editor(s) disclaim responsibility for any injury to people or property resulting from any ideas, methods, instructions or products referred to in the content.