1. Introduction
Under the strong drivers of “carbon peak and neutrality” goals, China’s future automotive industry policy should feature energy saving and emission reduction as the main goals [
1].
The automotive industry is undergoing a transformative shift toward electrification, driven by stringent emission regulations. By March 2025, the retail penetration rate of new energy vehicles (NEVs) in China reached 51.1% [
2]. Sales of NEVs have grown rapidly with plug-in hybrid electric vehicles (PHEVs) and range-extended electric vehicles (REVs) driving recent growth. While battery electric vehicles (BEVs) dominated early electrification efforts in 2020, the market share of PHEV and REV continues to increase and reached 42.1% by 2024 [
3]. This reversal reflects policy incentives favoring hybrid technologies [
4] and consumer demand for flexible powertrains that eliminate range anxiety.
A diversified landscape of powertrain options has emerged in the current passenger vehicle market, including the encompassing Internal Combustion Engine Vehicles (ICEVs), Hybrid Electric Vehicles (HEVs), PHEVs, REVs, and BEVs [
5]. This diversification is increasingly recognized as a significant development trend by industry, academia, and government bodies [
6]. Looking ahead, these diverse powertrain technologies are expected to coexist for an extended period [
7,
8]. It is important to note that in this era of powertrain diversification, each technology possesses distinct advantages and disadvantages. They exhibit unique characteristics and complement each other across various dimensions, including economic viability, energy efficiency, environmental friendliness, and safety [
9,
10]. Therefore, the relationship between these various powertrain technology pathways is not one of mutually exclusive alternatives, but rather one of competition coexisting with mutual prosperity and synergistic promotion, tailored to local conditions [
11,
12].
The shift in automotive powertrain technologies is primarily driven by consumer demand [
13]. Lifecycle economy and vehicle dynamics are the bridges connecting consumers’ needs with the characteristics of automobile products, which directly affect consumers’ purchasing decisions [
14,
15]. Currently, with the rapid development of various automotive powertrain technologies and the continuous decline in costs, consumers have more choices when making vehicle purchasing decisions, and products that can satisfy the needs of both whole-life economy and vehicle dynamics will be favored by consumers [
16,
17,
18]. However, there is a clear trade-off between vehicle dynamics and whole-life economics [
19,
20]. The better the dynamics of a vehicle, the more manufacturing costs it requires, which in turn reduces the whole-life economics of the vehicle. In addition, due to differences in operating principles, different powertrain vehicles have different advantages and disadvantages in balancing power and economy [
21,
22]. The above problems will undoubtedly increase the complexity of consumers’ vehicle purchase decisions and will also cause some trouble for automobile companies in choosing vehicle technology routes.
Therefore, on the basis of the research on vehicle technology combination, Total Cost of Ownership (TCO) and vehicle dynamics of vehicle multi-power source coupling technology combination, this study carries out the research on multi-objective evaluation and selection of vehicle multi-power source coupling technology schemes oriented to consumers’ needs with the objectives of TCO and vehicle dynamics, with the aim of assisting consumers to make the correct choices when purchasing a vehicle. At the same time, the balance between the power and cost of different powertrains is also an important basis for automobile companies to choose powertrain technology routes and parameter design.
Considerable research efforts have been devoted to the techno-economic performance evaluation of vehicle powertrains. Smallbon et al. conducted a comparative study examining the impact of various disruptive powertrain technologies on energy consumption and carbon dioxide emissions in heavy-duty vehicles [
23]. Liu et al. [
24] compared the energy-saving potential of different powertrain technologies in passenger vehicles. The study found that as electrification levels increase, vehicle curb weight and direct manufacturing costs rise, while overall fuel consumption gradually decreases [
24]. Argonne National Laboratory has continuously conducted comparative studies on the direct manufacturing costs of different powertrain technologies since 2011, analyzing the potential for cost reduction and efficiency gains in future advanced powertrain technologies [
25]. Palmer et al. analyzed the relationship between the total cost of ownership (TCO) of hybrid vehicles and their market share by comparing the TCO of internal combustion engine vehicles, hybrid vehicles, plug-in hybrid vehicles, and pure electric vehicles in the US, UK, and Japanese markets.
Existing research still exhibits certain gaps and limitations: First, existing studies only compare and evaluate two or three powertrain types, failing to conduct simultaneous assessments of multiple powertrain options. Second, when conducting evaluations, current research predominantly uses parameters from commercially available vehicles for comparison, overlooking technical differences stemming from varying corporate capabilities and vehicle positioning. This approach neglects the standardization of technical parameters across all powertrains. Third, comprehensive studies integrating direct manufacturing costs, energy consumption, and powertrain performance remain scarce.
This study is divided into three parts: first, to clarify the interaction between vehicle dynamics and consumer TCO. Second, we compare and contrast the effects of vehicle dynamics on the TCO of different vehicle multiple power source coupling technology combinations and carry out a comprehensive evaluation and selection of MPSC technology combinations that satisfy the objectives of vehicle dynamics and consumer TCO. Finally, according to the characteristics of different vehicle multiple power source coupling technology combination schemes, the parameter comparison analysis of vehicle multiple power source coupling technology combination schemes for vehicle dynamics and TCO is carried out. Recommendations for selecting automotive powertrain technology routes are proposed, with conclusions supporting corporate technology route decisions and sustainable industrial development.
2. Materials and Methods
To achieve the aforementioned three objectives, this study necessitates the establishment of a research methodology. This methodology must be capable of establishing the relationship between vehicle dynamic performance and hardware configuration for each type of passenger car powertrain system. Furthermore, it must enable the quantitative analysis of the relationships between vehicle dynamic performance and both hardware costs and operational costs. The research can be divided into two main components.
Firstly, it is imperative to clarify the interaction mechanisms during the coupling of multiple vehicle power sources and establish a comprehensive and systematic evaluation model for multi-power-source coupling technology schemes. During the transition from traditional engines to electrified powertrains, the engine will form a complex multi-power-source coupling system with power modules such as electric motors and traction batteries, involving numerous elements and variables. The mutual influence and interaction among these different power modules fundamentally alters their operational efficiency, matching configurations, and development paradigms. Consequently, this leads to changes in the efficiency, weight, and cost of the multi-power-source coupling system, thereby affecting the overall vehicle’s fuel economy and dynamic performance. Therefore, clarifying the interaction mechanisms during multi-power-source coupling becomes critical for the matching design of vehicle powertrain systems and their technological evaluation. This challenge is particularly pronounced during the current period of rapid powertrain transformation, where the structures, efficiencies, and costs of key power components are evolving rapidly, and novel multi-power-source coupling technology configurations are continually emerging. These factors undoubtedly increase the complexity of evaluating multi-power-source coupling technology solutions.
Secondly, the selection strategy for multi-power-source coupling technology schemes, addressing diverse requirements, requires further refinement. When automotive manufacturers select such schemes, they must concurrently consider regulatory constraints on per-vehicle fuel consumption limits and targets, consumer demands for vehicle performance like fuel economy and dynamic performance, the needs to achieve corporate profitability objectives through minimal direct manufacturing cost investment. In essence, selecting a multi-power-source coupling technology scheme necessitates balancing multiple, often conflicting objectives, including the powertrain system’s direct manufacturing cost, comprehensive energy consumption, consumer Total Cost of Ownership (TCO), and overall vehicle driving performance, which exhibit complex trade-off relationships. Furthermore, the selection process extends beyond choosing the overall powertrain architecture; it must also encompass the determination of optimal design parameters for individual power components within the finalized scheme. For instance, this includes selecting the optimal engine efficiency parameters for Plug-in Hybrid Electric Vehicles (PHEVs).
This study employs the “Technology Evaluation Model of Powertrains (TEMP)”, which was previously developed by our research team. A detailed description of the model has been published by Liu et al. [
24]. This paper presents its overall framework, selected methodologies, core parameters, and key assumptions. This paper elaborates on TEMP’s modeling methodology, core parameters, and underlying data assumptions. Then, we analyze the hardware architecture, component parameters, and direct manufacturing costs associated with various powertrain technologies under different dynamic performance specifications. Finally, the study assesses and comparatively analyzes the cost implications of enhancing dynamic performance across current mainstream powertrain technologies, concluding with pertinent policy recommendations.
2.1. Research Model
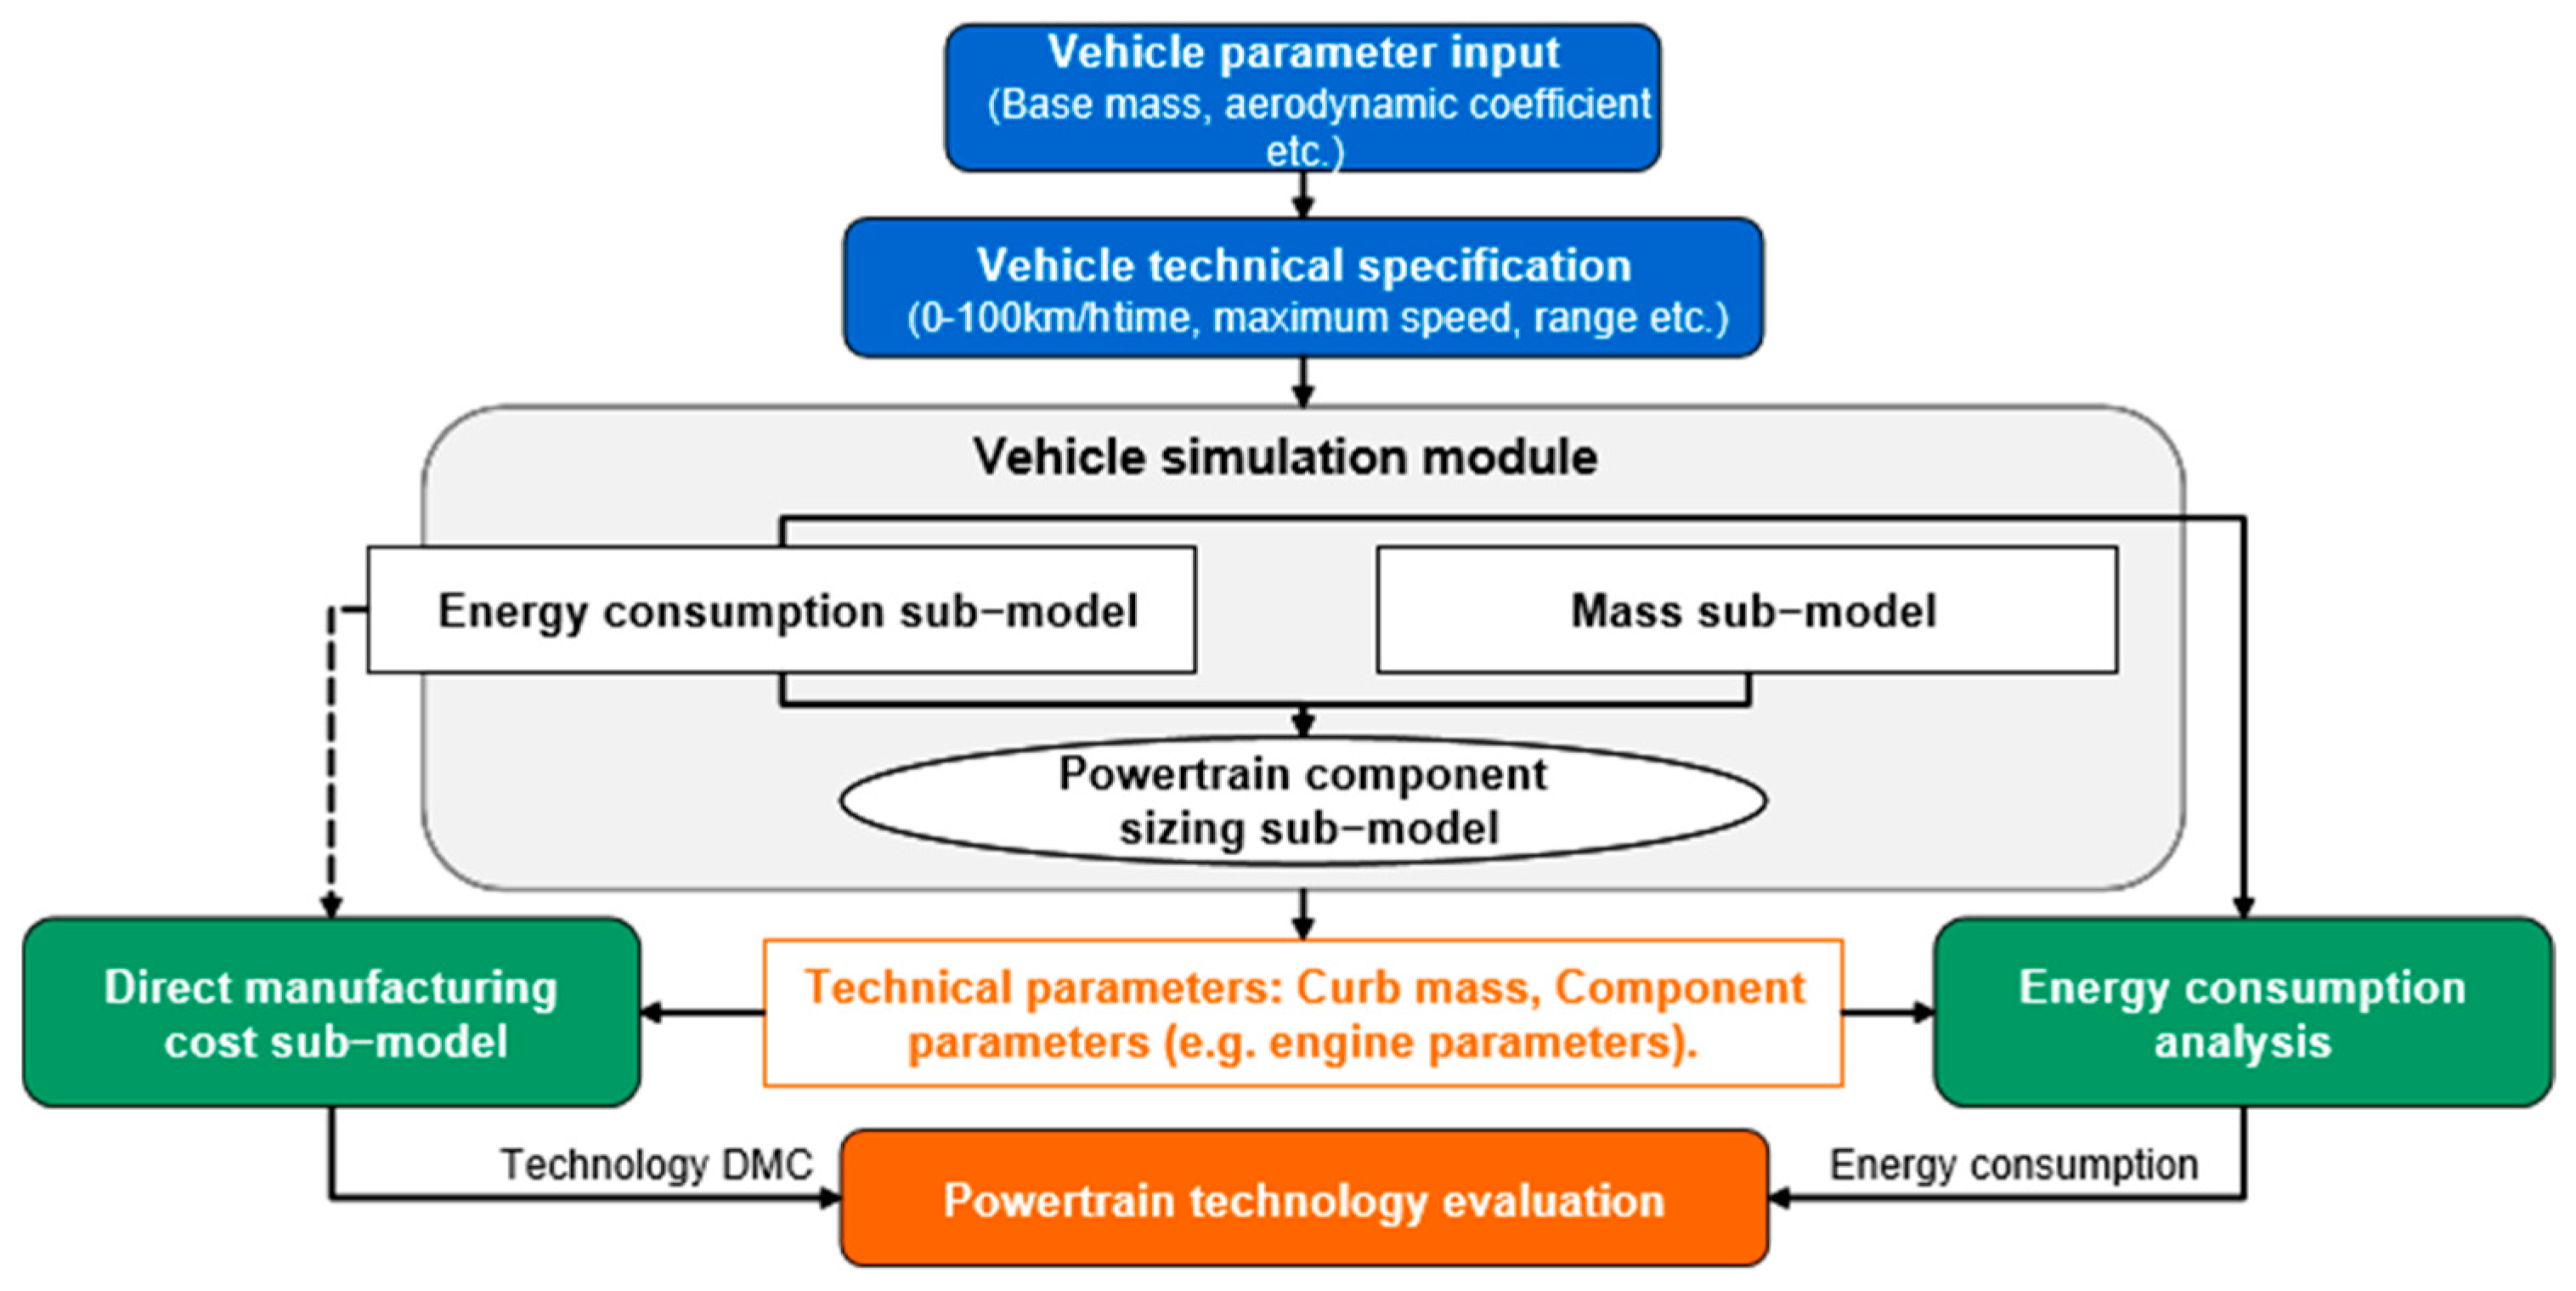
The Technology Evaluation Model of Powertrains can be divided into five sub-models: energy consumption model, weight model, full system parameter calculation model, cost model, and technology evaluation and selection model, as shown in
Figure 1. The calculation steps are as follows: first, determine the basic parameters of the vehicle model, such as vehicle class, glider weight (the portion of the vehicle without the powertrain), frontal area, aerodynamic drag coefficient, rolling resistance coefficient, and rotational mass conversion coefficient. Second, determine the performance metrics of the vehicle, such as 0–100 km/h acceleration time, maximum speed, and pure electric range for new energy vehicles. The corresponding parameters are input into a vehicle simulation model based on multi-power source coupling theory, which includes an energy consumption model, a vehicle component weight model, and a full-system parameter calculation model, thereby determining the vehicle’s energy consumption and vehicle parameters, such as curb weight, engine parameters (power, weight), motor parameters (power, weight), battery parameters (capacity, weight), and transmission parameters (power, weight), etc. The calculated vehicle parameters are then substituted into the cost model to derive the direct manufacturing costs and TCO of the corresponding powertrain. Finally, various powertrains are evaluated and selected based on the energy consumption, cost, and cost-effectiveness of the multi-power source coupling technology solutions, thereby studying the differences between different powertrains and the impact of various key components on the vehicle powertrain.
It is well known that enhancing vehicle dynamics will worsen the energy consumption of the whole vehicle and increase the direct manufacturing cost of the vehicle. Based on the calculating model, this study investigates the influence mechanism of dynamics on vehicle multi-power source coupling technology combinations. Based on the analysis of the mainstream powertrains in the Chinese market, PHEVs, as the most complex multi-power source coupling technology combination scheme with both internal combusion engine and electric motor drive systems, are more representative of the impact mechanism of dynamics change on PHEVs’ overall vehicle energy consumption and cost. Therefore, this section takes a 50 km range PHEV (PHEV50 for short) as the research object, and explores the changes in the overall mass, power loss fuel consumption, electric power consumption, direct manufacturing cost, and corresponding parameters of key components of PHEV50 when the dynamics are changed (the acceleration time from 0 to 100 km/s is improved from 9 s to 5 s).
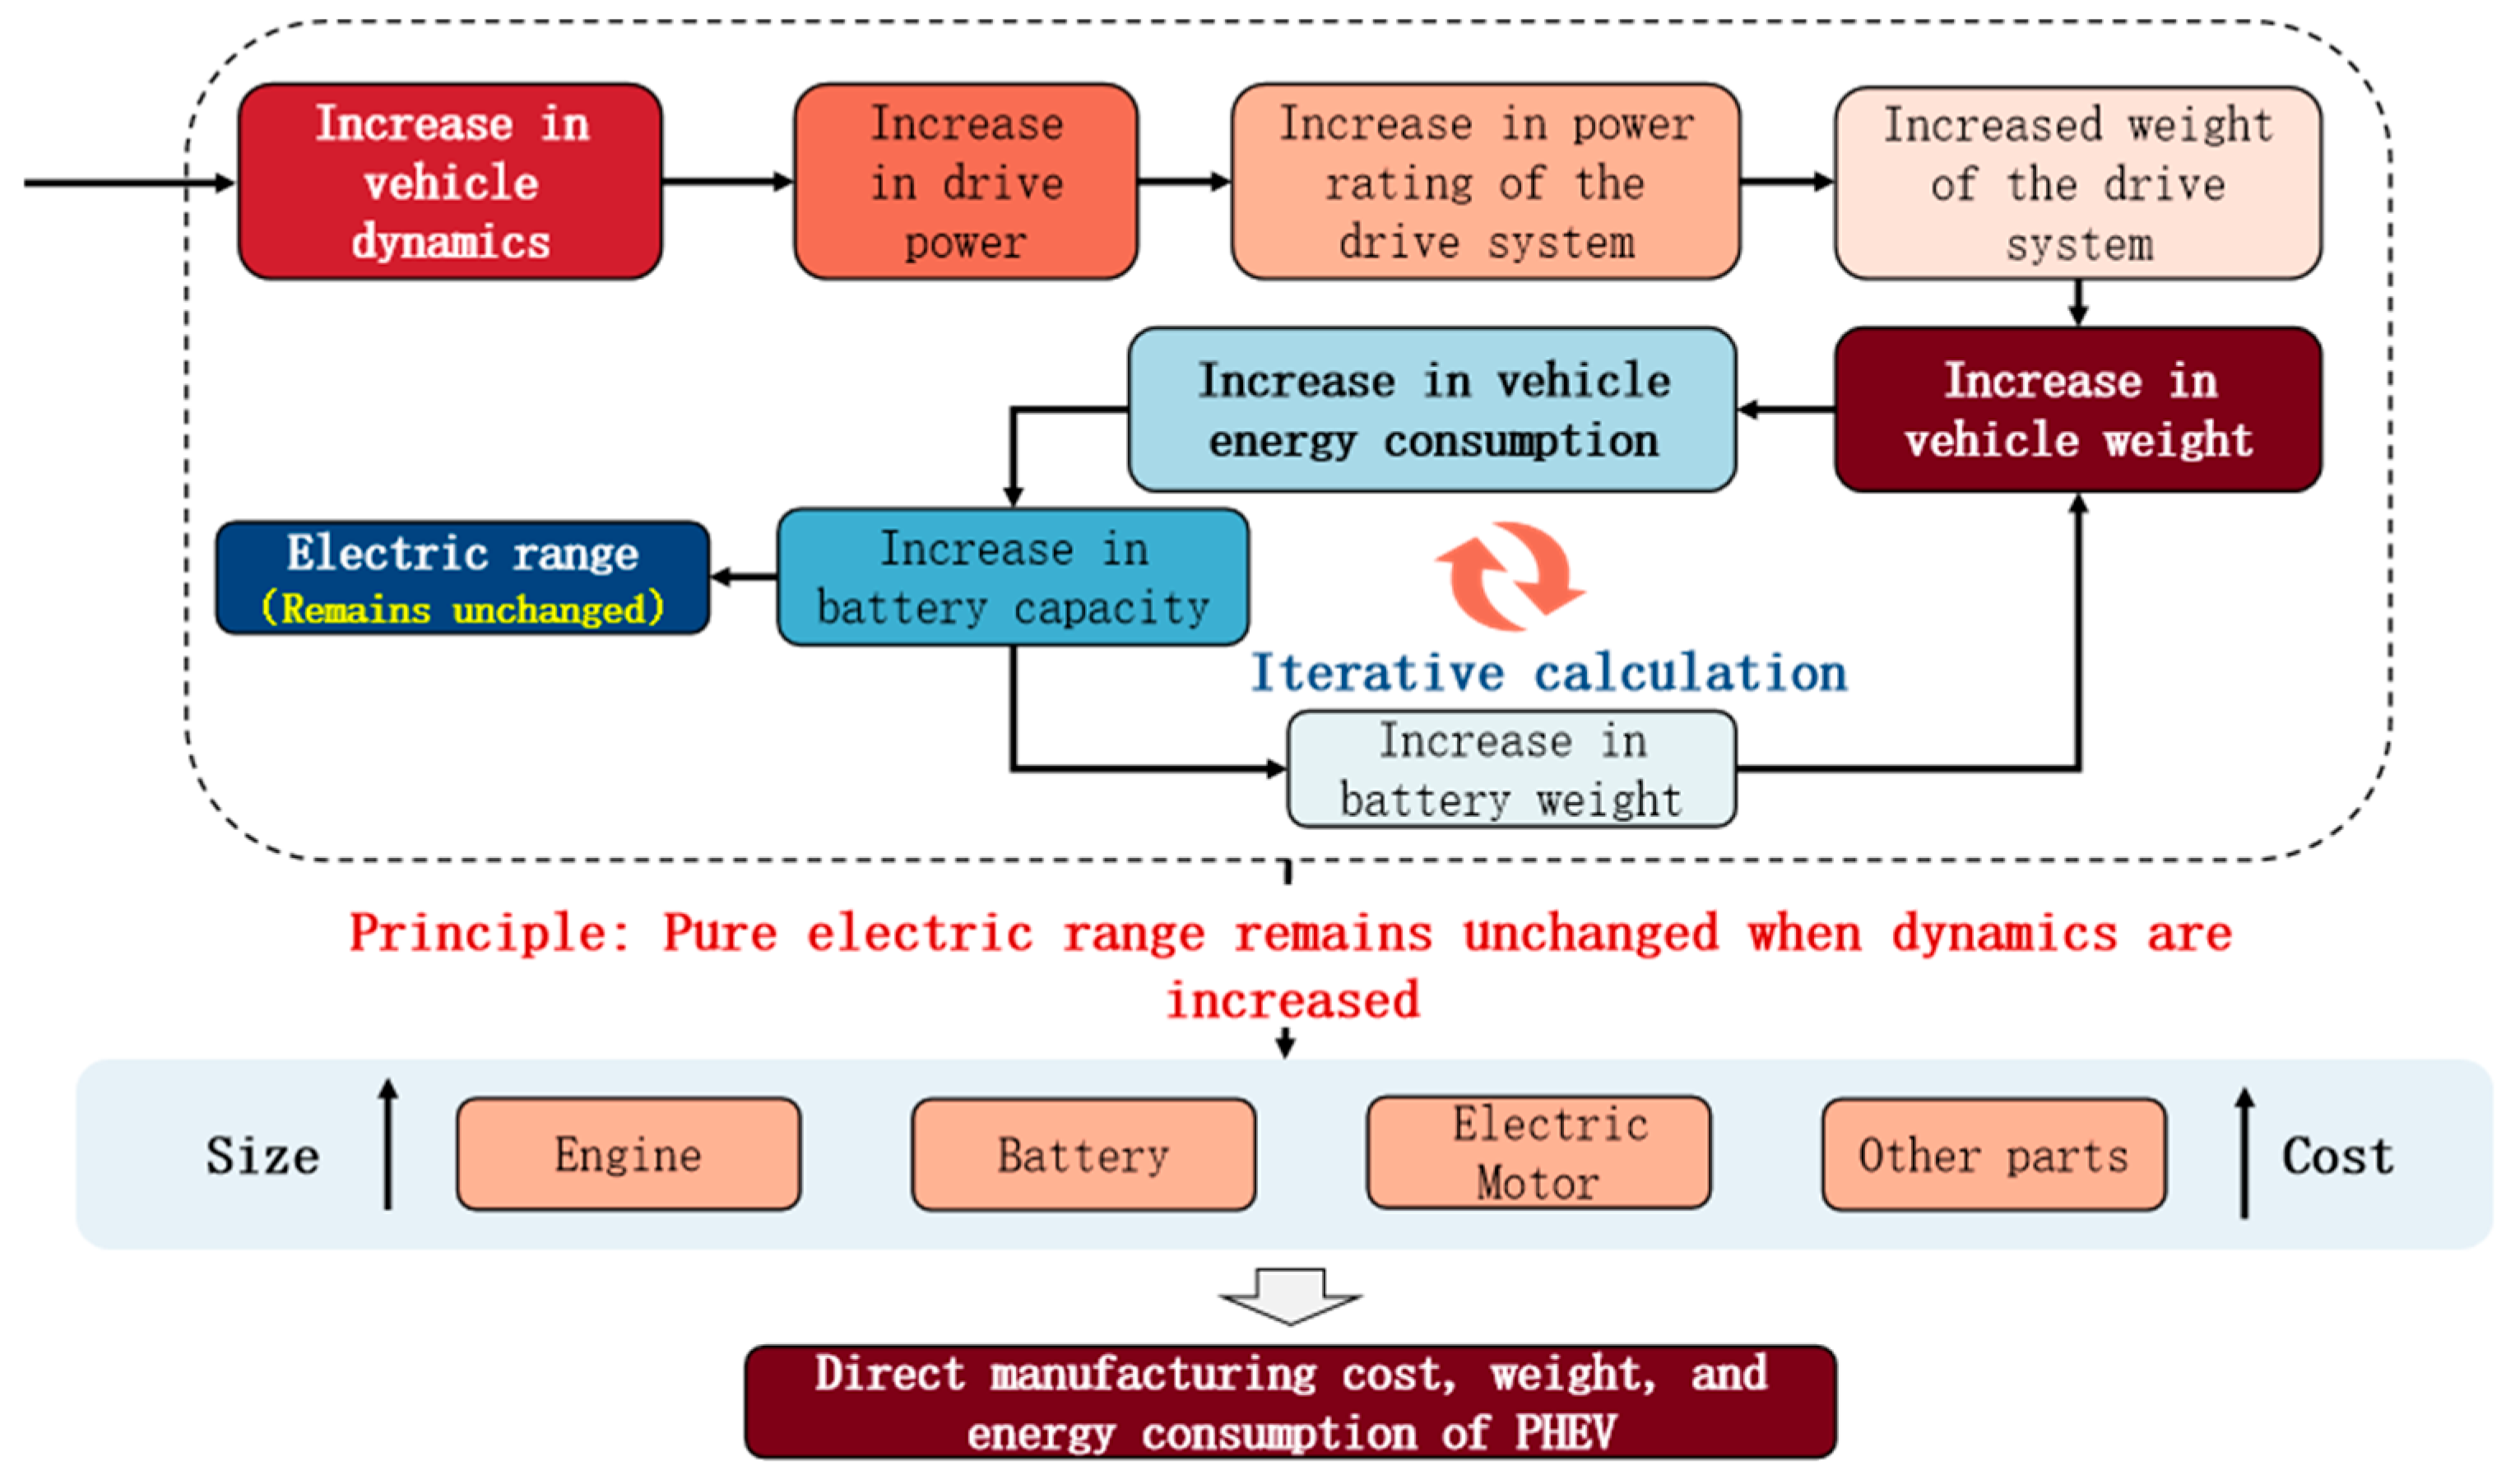
Figure 2 depicts the logical relationship between the changes in the parameters of each component of the PHEV50 when the dynamics are changed.
It is essential in this study to establish a costing model and an energy consumption calculation model to analyze the changes in hardware parameters, weight, cost and energy consumption of different powertrain technology routes during the power upgrade process.
2.2. Cost Calculation Model
Direct manufacturing cost is vital in this study, and its accurate modeling is of great significance for power source coupling technology selection when designing passenger vehicles. In this study, a bottom-up direct manufacturing cost model is established by analyzing the components that make up the vehicle multiple power source coupling technology scheme. That is, the cost of each key component is solved accurately first, and then the cost of each component is integrated to obtain the direct manufacturing cost of the vehicle multi-power source coupling technology program, which is calculated as shown in Equation (1):
is the direct manufacturing cost for multi-power source structure , yuan; is the cost of key component in vehicle type , yuan. For example, the direct manufacturing cost of an ICEV is composed of the engine cost , the drivetrain system cost , the fuel tank cost , and the Glider cost ; The direct manufacturing cost of a BEV is composed of the electric motor system , the drivetrain system cost , regenerative brake system , the battery system cost , electronic controller cost , on board charger cost , glider cost ; the cost of PHEV and REV are essentially the same as the BEV, with the addition of engine and fuel tank components.
By linearly fitting the relationship between glider cost and glider mass for B-segment vehicles, a regression equation for the glider cost of the vehicle’s multiple power source coupling technology scheme.
By linearly fitting the relationship between glider mass and their costs for B-class vehicles, a regression equation for the glider cost of the vehicle’s multi-power source coupling technology type [
4,
26] is shown in Equation (2).
is the cost of vehicles without a power system, which is the glider, yuan. is the mass of the glider, kg.
Engine power is closely related to engine cost. This study sets the reference engine parameter cost and calculates the cost of engines for different vehicle models through power increments and their corresponding cost increments. Therefore, the direct manufacturing cost curves for traditional ICEV, HEV, PHEV, and REV engines are shown in Equation (3):
represents the peak power of the reference engine, assumed to be 110 kW in this study; is the functional relationship between the direct manufacturing cost and its peak thermal efficiency of an ICEV engine with 110 kW. represents the functional relationship between the direct manufacturing cost and its peak thermal efficiency of a hybrid engine with 110 kW power. It should be noted that the engine cost function is obtained through data fitting, so the accuracy of the cost function is higher within the range of peak thermal efficiency from 37% to 50%.
As national regulations on pollutant emissions from light-duty vehicles become increasingly tightened, it is essential to implement exhaust after treatment systems for vehicles equipped with engines. According to research conducted by ANL, engine emissions after treatment technology are closely related to engine power [
27]. To meet the increasingly stringent emissions regulations, engines must be upgraded, which requires significant cost increases. By combining ANL’s cost data on engine after treatment technology with the current “China VI vehicle emission standards”, a method for calculating after treatment costs based on peak power can be derived, as shown in Equation (4):
represents the cost of engine exhaust aftertreatment, in yuan;
refers to the cost of when upgrading emissions control to meet stringent emissions regulations, yuan. According to calculations by the CITICS and Human Settlements and Environment Commission of Shenzhen Municipality, to meet the “China VI” emission regulations, passenger vehicle engines require the installation of a particulate matter filter (600 yuan), an upgrade to a three-way catalytic converter (300 yuan), and improvements to the onboard fuel vaporization system (400 yuan), totaling 1300 yuan [
28]. Considering future upgrades to emission regulations, assuming a 30% increase in the costs of the three emission reduction technologies, the cost increments for future “China VII” and “China VIII” emission regulations are calculated.
The transmission system includes the transmission, reducer, and electromechanical coupling system (used in hybrid systems). When calculating the cost of the transmission system, this study established a cost evaluation formula based on a 5-speed transmission [
29]. This formula introduces the transmission cost coefficient E, which can be used to calculate the costs of other transmissions of different sizes. The transmission cost formula is shown in Equation (5):
where
is the maximum transmission ratio;
is the input torque of the transmission, shown as transmission power in this study, kW;
is the number of gears in the transmission;
is the cost of the transmission;
refers to the base transmission cost, which is set at 7000 yuan in this study based on industry research;
represents the cost coefficient of the transmission being solved for;
represents the cost coefficient of the base transmission. Since reducers do not have electronic control or actuator components, their costs are relatively low. When calculating the cost of reducers in traditional powertrains, a correction factor is typically multiplied by the result of Equation (5), set to 0.2 in this study [
30]. The reducers for REV and BEV require coordination with high-speed motors, and some REV or BEV models have adopted multi-stage reducers, whose costs cannot be simply calculated using the above model. The cost data for REV and BEV reducers is primarily sourced from the Ricardo-AEA research report [
31].
The coupling system is the core component enabling the engine and motor to work in tandem in HEVs and PHEVs, and primarily functions as an intermediary for power transmission between the engine and motor. This study identifies engine power and motor power as the primary cost drivers of the mechatronic coupling system. Based on product teardown data for P2 and PS-type hybrid structures from the EPA (U.S. Environmental Protection Agency), this study derives a cost analysis model for HEVs and PHEVs power coupling system [
32], as shown in Equation (6):
is the cost of the coupling system in HEVs and PHEVs, yuan. This cost is the total cost of the transmission, reducer, and electromechanical coupling system combined.
The braking energy recovery system is an important energy-saving technology for electrified powertrains such as HEVs, PHEVs, REV, and BEVs. Limpan et al. [
33] found that the design of braking energy recovery systems is related to the weight of the vehicle. Therefore, in this study, curb weight is considered the main cost driver when calculating the cost of regenerative braking systems [
33]. Based on EPA disassembly data, a cost model for the regenerative brake system was fitted, as shown in Equation (7):
where
is the weight of the braking energy recovery system.
2.3. Energy Consumption Calculation Model
The paper builds a physics-based energy consumption calculation sub-model. It can simulate the energy flow of the powertrain technology under different test-driving cycles and then calculate the energy consumption. The detailed calculation process can be found in our previous study which calculated the energy consumption of PHEVs [
34].
3. Results
This study is based on several sub-models to analyze the parameters of major vehicle components and total weight, as well as direct manufacturing costs, under different dynamic parameters.
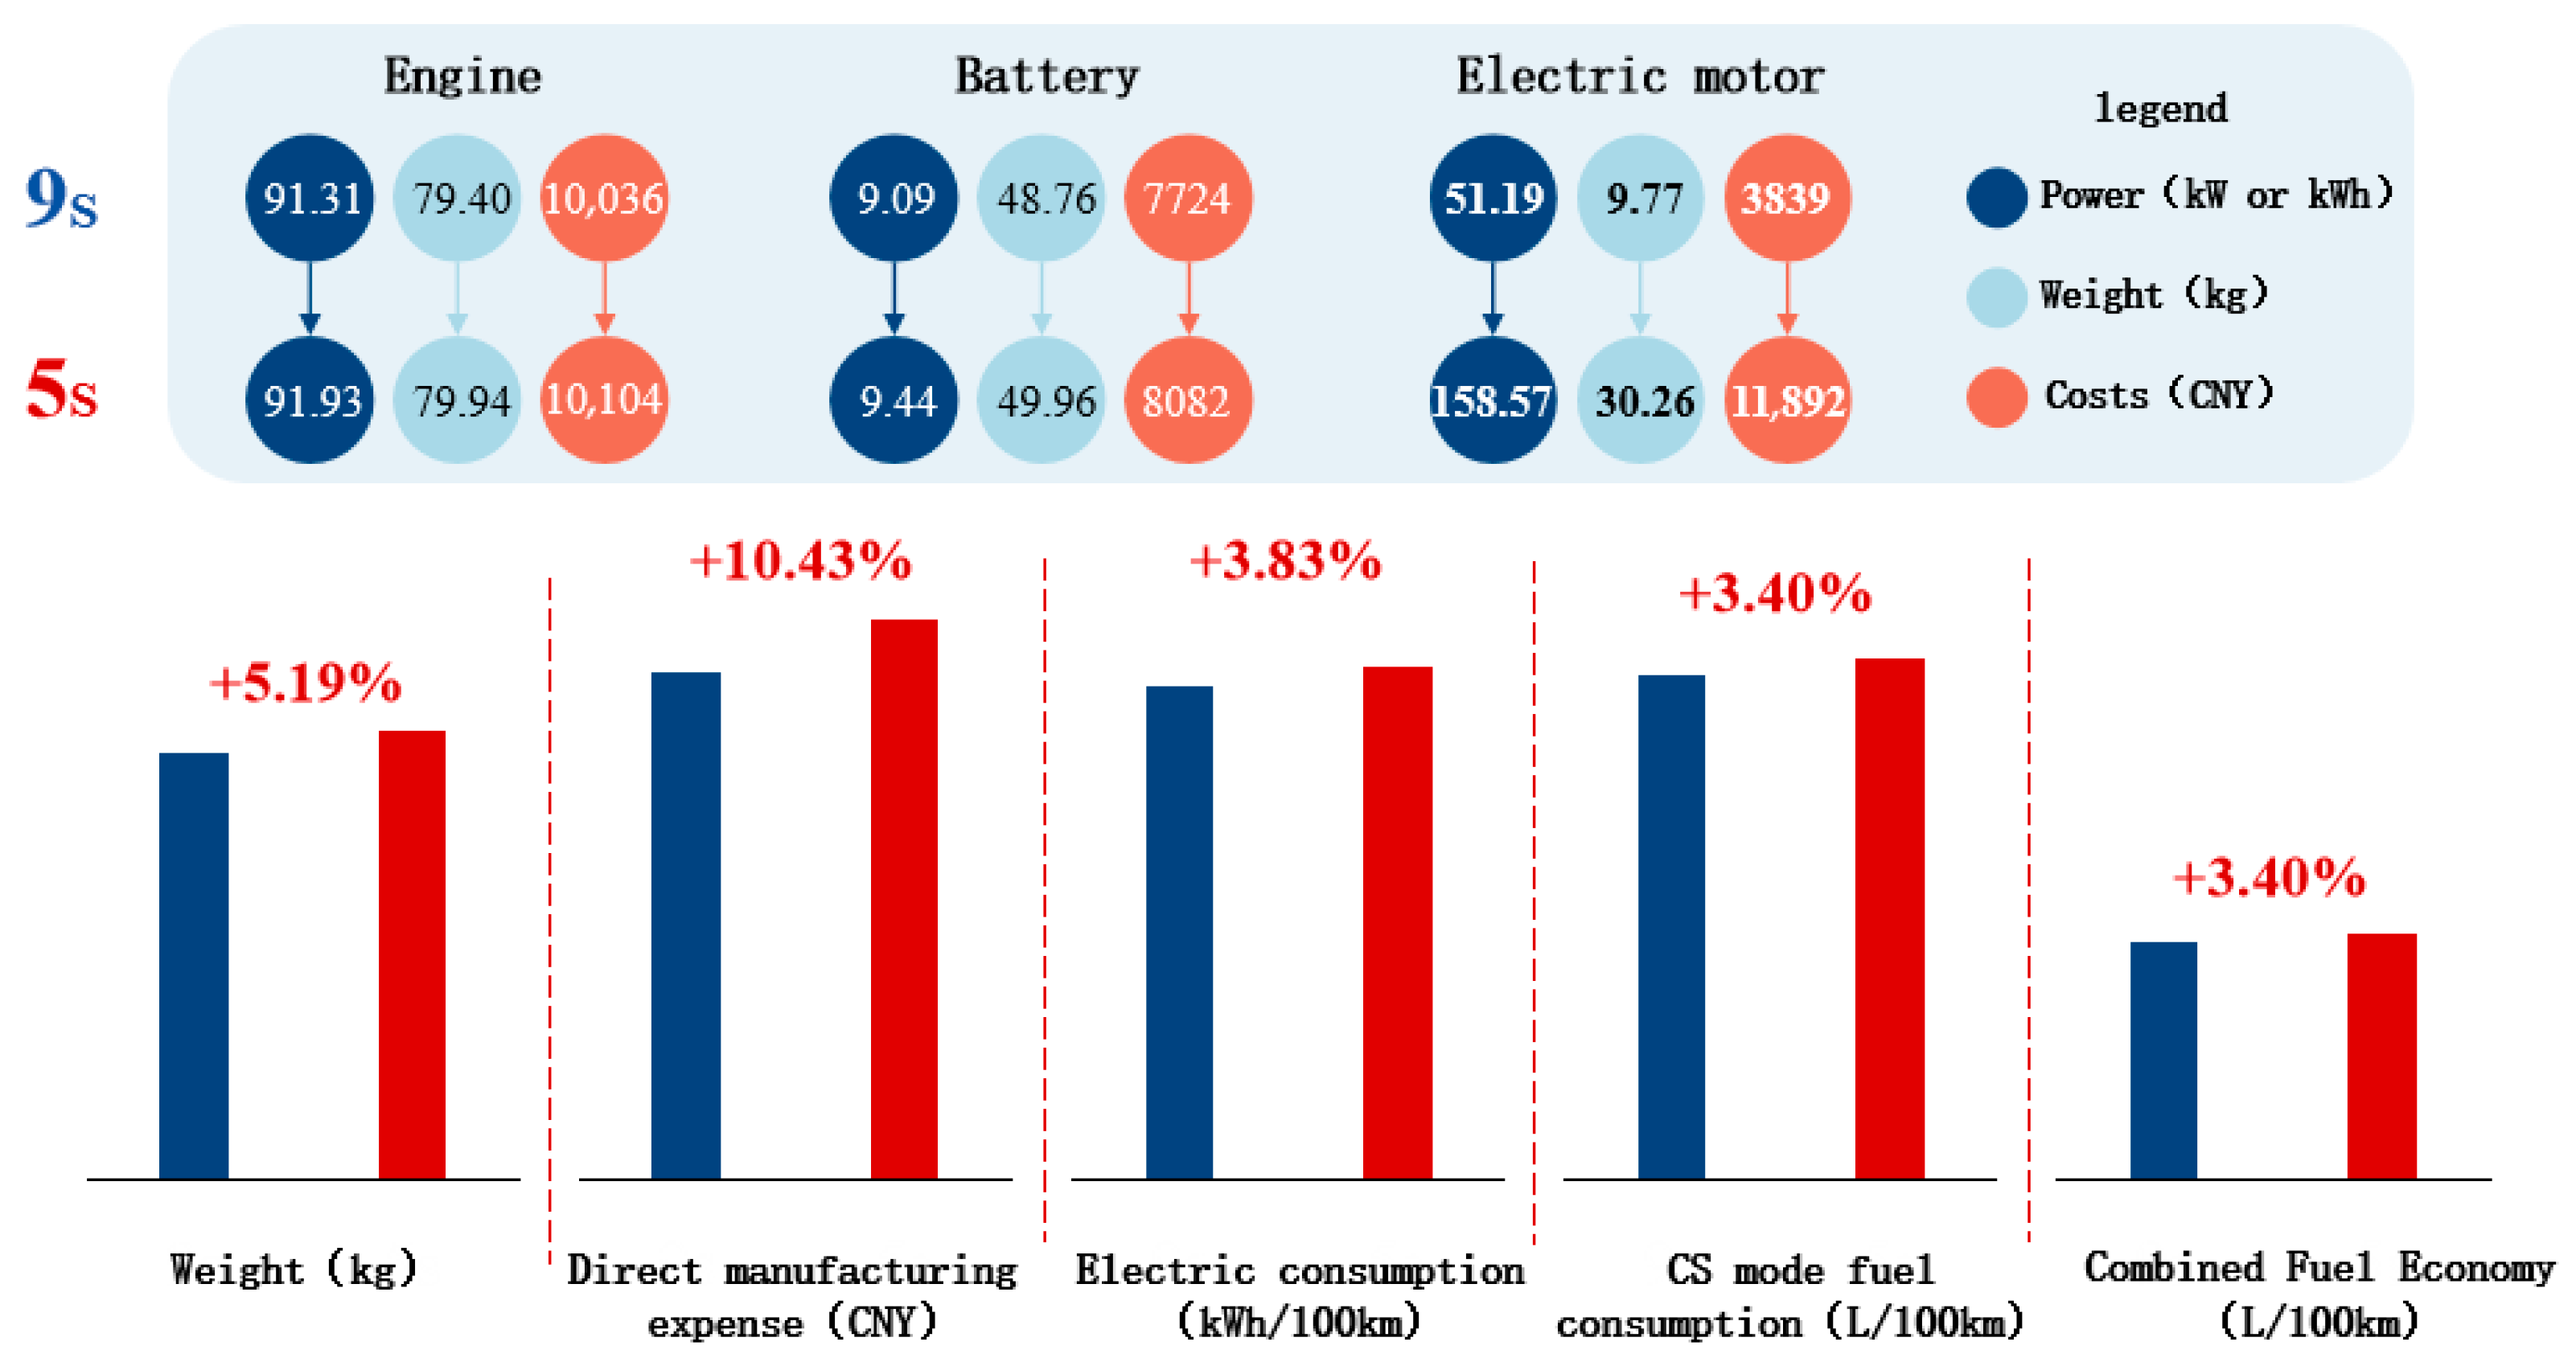
Figure 3 illustrates the relationship between changes in the parameters of various components of the PHEV50 when its dynamic performance is altered. When the power performance of the PHEV50 is enhanced, the required drive power increases accordingly, leading to corresponding increases in the size and weight of components such as the engine, motor, and transmission system that provide power output. This ultimately results in increased vehicle weight and energy consumption. To ensure the PHEV achieves a pure electric range of 50 km, the battery pack capacity must be increased, further raising the vehicle’s weight. Through iterative optimization, a technical solution can be obtained where both the power performance metrics and pure electric range requirements are met. In this logical relationship, it can be observed that when the dynamic performance of the PHEV50 changes, the size and cost of components such as the engine, motor, battery pack, and other systems (power coupling systems, transmissions, reducers, etc.) also change, thereby affecting parameters such as the vehicle’s curb weight, energy consumption, and direct manufacturing costs.
The results show that when the acceleration time of PHEV50 from 0 to 100 km/h is improved from 9 s to 5 s, the engine power, weight, and direct manufacturing cost increase by 0.63 kW, 0.54 kg, and 68 yuan, respectively; the power, weight, and direct manufacturing cost of the electric motor increase by 107.38 kW, 20.49 kg, and 8053 yuan, respectively, an increase of 209.76%. The difference in the corresponding parameter changes between the engine and the motor lies in the fact that current PHEVs mainly improve their dynamic characteristics by increasing the power of the electric motor, which is consistent with the way automobile companies currently improve the dynamic characteristics of PHEVs and is also the logic of the modeling in this study. At the same time, when the dynamic characteristics change, the battery capacity of PHEV50 also increases from the original 9.09 kW·h to 9.44 kW·h, and the weight and cost of the power battery also increase by 3.85% accordingly. Taking into account the changes in the size and cost of the corresponding components, the curb weight and direct manufacturing cost of PHEV50 increase by 5.19% and 10.43%, respectively. Among these factors, the most significant contributors are the direct manufacturing costs and weight of the motor system, which are closely related to the type of powertrain. For example, in the case of ICEVs and 48 V systems, when improving powertrain performance, the primary contribution comes from the engine that provides the driving power. Additionally, an increase in curb weight will result in a respective increase of 3.83%, 3.40%, and 3.40% in the electric consumption, fuel consumption when the battery is depleted, and overall fuel consumption of the PHEV50. In general, when the dynamic characteristics of a vehicle change, the size and cost of the powertrain components that provide driving power will increase accordingly, leading to an increase in vehicle weight, direct manufacturing costs, and energy consumption. Among these, which key components contribute the most to weight and cost is highly correlated with which component in the powertrain provides power output. Since different power modules (engine, battery, and motor) show significant differences in mass power density, direct manufacturing costs, and energy conversion efficiency, the corresponding costs and energy consumption incurred when increasing power performance also vary significantly across different powertrains. Therefore, the next section will investigate the impact of changes in power performance on different vehicle multi-power source coupling technology combinations.
3.1. Comparison of Weight and Energy Consumption Based on Dynamic Performance
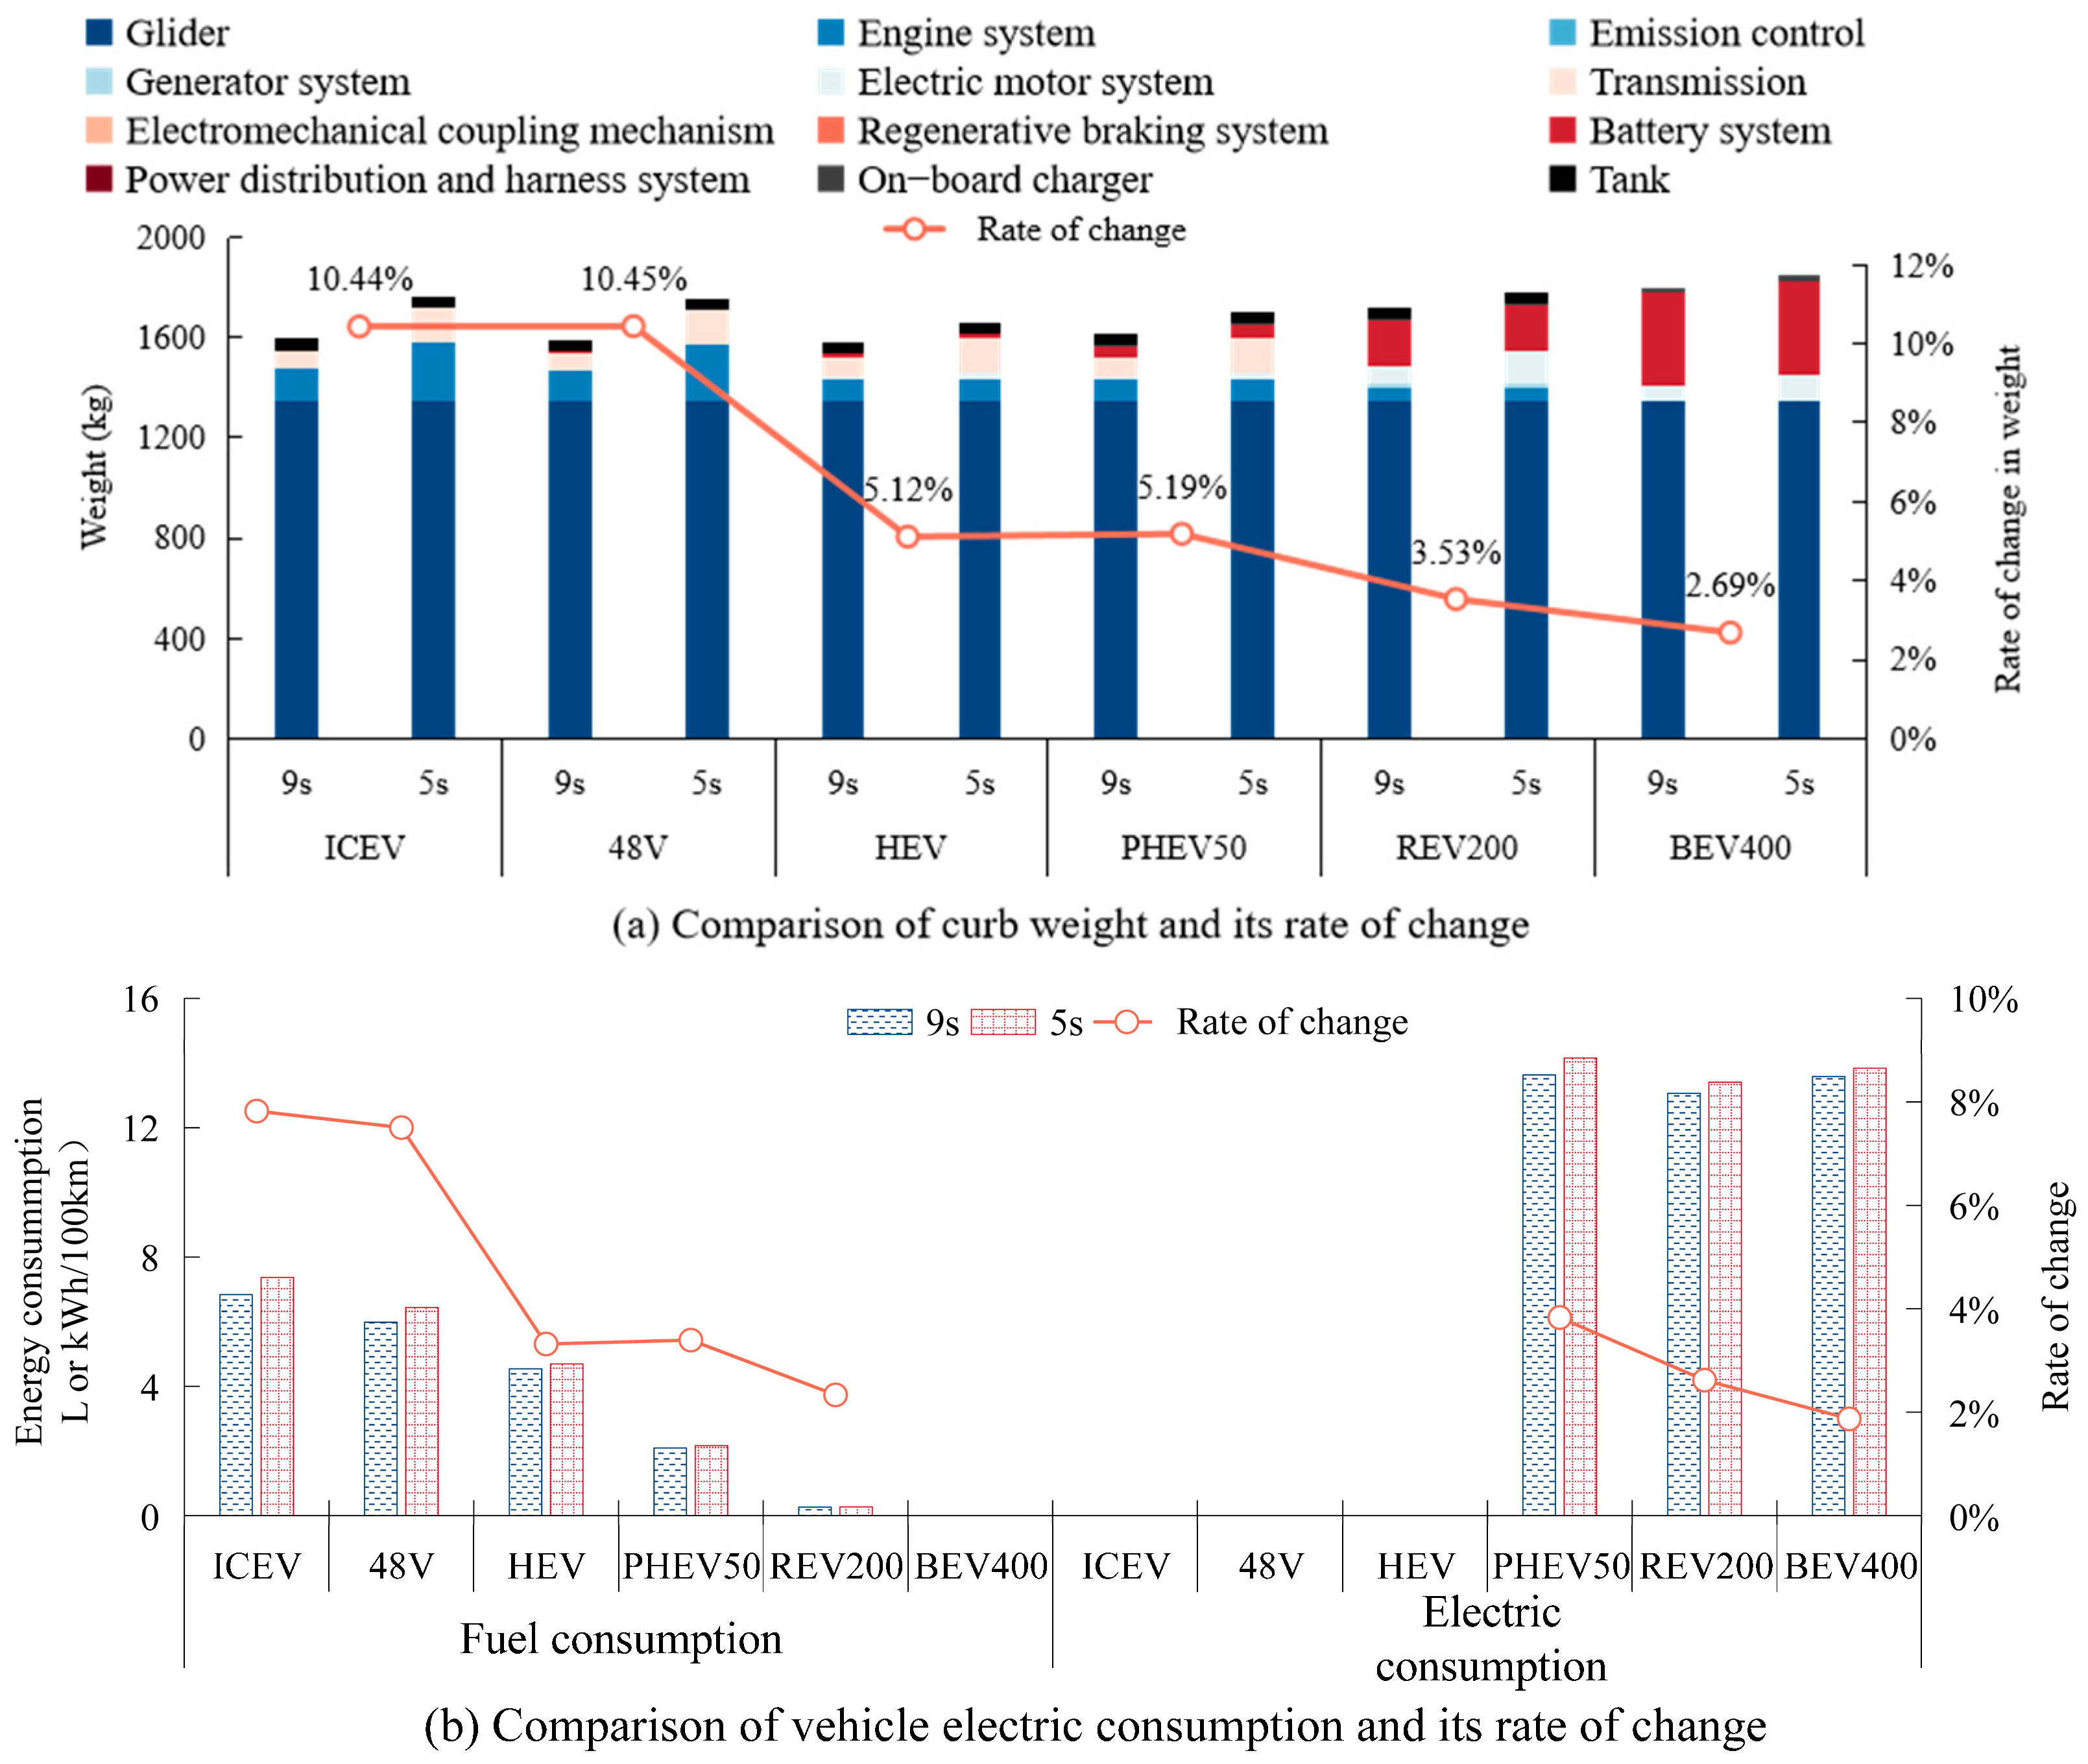
Figure 4a illustrates the impact of changes in dynamic performance on the vehicle weight and key component weights of different powertrain combinations. When the 0–100 km/h acceleration time changes from 9 s to 5 s, the vehicle weights of ICEV, 48 V, HEV, PHEV50, REV200, and BEV400 increase by 10.44%, 10.45%, 5.12%, 5.19%, 3.53%, and 2.69%, respectively. The results indicate that vehicles with powertrains primarily driven by electricity make smaller changes in vehicle weight when improving performance compared to those primarily driven by engines. This is because electric motors have a higher weight-to-power density than engines, enabling higher power increases with smaller weight increments. It can also be found that when dynamic performance increases, the change rate in weight of the 48 V power system is similar to that of the ICEV but slightly higher. This is because the 48 V mild hybrid system still primarily relies on engine-driven power and includes additional systems such as motors and batteries compared to the ICEV; when dynamic performance changes, the weight increase from these additional systems causes the weight change rate of the 48 V system to be higher than that of the ICEV. Meanwhile, the weight change rate of PHEV50 is higher than that of HEV. This is because it was assumed that PHEV50 and HEV share the same technical architecture in the research model. When improving the dynamic performance of PHEV50 and HEV, it is necessary to increase the motor power. Since the total weight of PHEV50 is greater than that of HEV, achieving the same dynamic performance requires much higher output power. By comparing the weight of each component, it can be found that when dynamic performance changes, the components with the largest weight changes for ICEV and 48 V are the engine and transmission system; for HEV it is the motor system; and for PHEV50, REV200, and BEV400 it is the motor system and battery system.
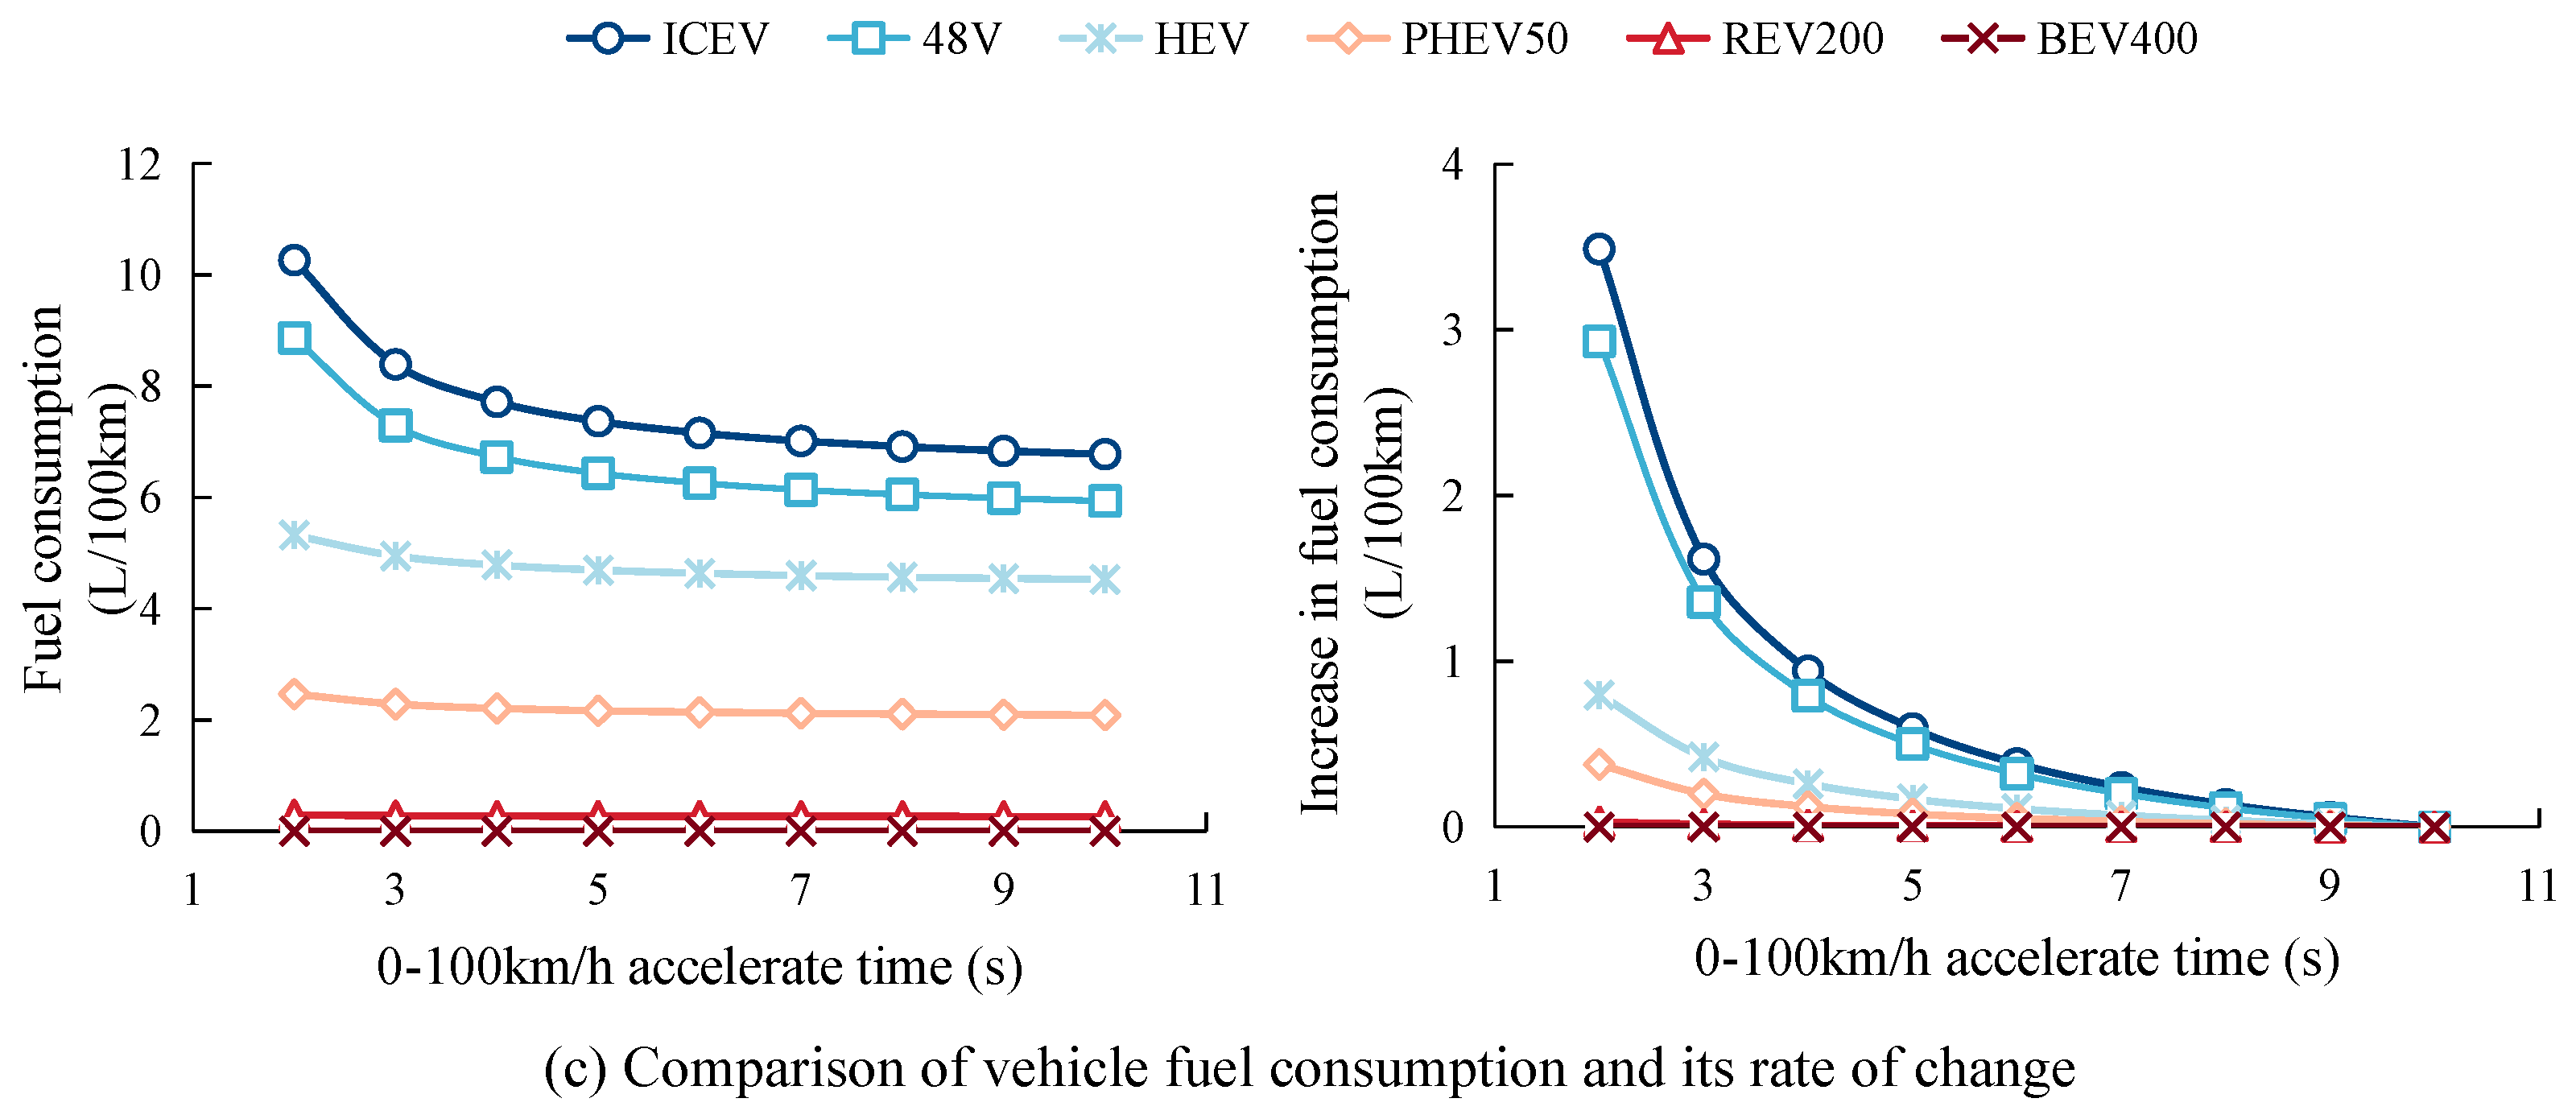
Figure 4b shows the changes in fuel consumption for different powertrains when the dynamic performance is altered. When the 0–100 km/h acceleration time changes from 9 s to 5 s, the fuel consumption of ICEV, 48 V, HEV, PHEV50, and REV200 increases by 7.82%, 7.50%, 3.32%, 3.40%, and 2.33%, respectively. There are two primary factors influencing fuel consumption: vehicle weight and overall system energy conversion efficiency. When dynamic performance changes, the rate of vehicle weight change for ICEV, 48 V, HEV, PHEV50, and REV200 decreases, and their system energy conversion efficiency gradually increases, resulting in a gradual decrease in fuel consumption. The abnormal changes in vehicle energy consumption for HEV and PHEV50 are due to the same reasons as the differences in vehicle weight mentioned above. Additionally, the electricity consumption of PHEV50, REV200, and BEV400 also decreases gradually with changes in power performance. This indicates that BEV400 has a greater energy-saving advantage compared to PHEV and REV when meeting the demand for improved dynamic performance.
Figure 4c show the relationship between fuel consumption and dynamic performance for different powertrains. For vehicles with engine systems such as ICEV, 48 V, HEV, PHEV50, and REV200, fuel consumption tends to increase gradually as dynamic performance increases. Among them, ICEV, 48 V, and HEV have higher fuel consumption, and as dynamic performance changes, the change in fuel consumption is significantly higher than that of PHEV50 and REV200. For example, when the acceleration time per 100 km is 3 s, the fuel consumption of ICEV, 48 V, and HEV is 8.39 L/100 km, 7.29 L/100 km, and 4.94 L/100 km, respectively, while the fuel consumption of PHEV50 and REV200 is only 2.29 L/100 km and 0.28 L/100 km, respectively. This shows that NEVs, which are mainly powered by electricity, have obvious energy-saving advantages in terms of improving the dynamic performance of the vehicle compared with ICEVs, which are mainly powered by engines. There are two main reasons for this difference. First, there is a difference in the working characteristics of the drive system. The drive system of NEVs directly converts the energy from the battery into motor drive energy, and the power transmission is direct and rapid, while traditional internal combustion engine vehicles need to transfer energy through a complex transmission system, which makes the acceleration process relatively inefficient. Second, the power density of electric motors is higher than that of engines, enabling greater power to be achieved with smaller volume and mass, without significantly changing the weight of the vehicle, thereby reducing the energy required for driving. Therefore, if the dynamic performance of traditional internal combustion engine vehicles is to be improved, the price of excessive fuel consumption (and of course, increased emissions) must be paid. This result is qualitatively corroborated by the findings of Graba et al. [
35]. Their study, which investigated the impact of acceleration intensity on energy consumption and drive efficiency in real-world tests, reported that for every 0.1 m/s
2 increase in acceleration, the vehicle’s total energy consumption per unit increases by approximately 0.15 J/(kg·m). This established relationship provides external validation for the trends observed in our simulation results. In order to meet the corresponding fuel consumption and emission regulations, automobile companies must restrict dynamic performance. In contrast, fuel consumption of NEVs varies little with dynamic performance; even if dynamic performance is greatly improved, fuel consumption and emissions will not exceed regulatory limits. Therefore, when designing the dynamic performance of NEVs, automobile companies can relax fuel consumption and emission constraints and create products with better dynamic performance. Therefore, from the perspective of dynamic performance and fuel consumption, NEVs will gradually become the main choice for consumers in the future.
3.2. Cost Comparison Based on Dynamic Performance
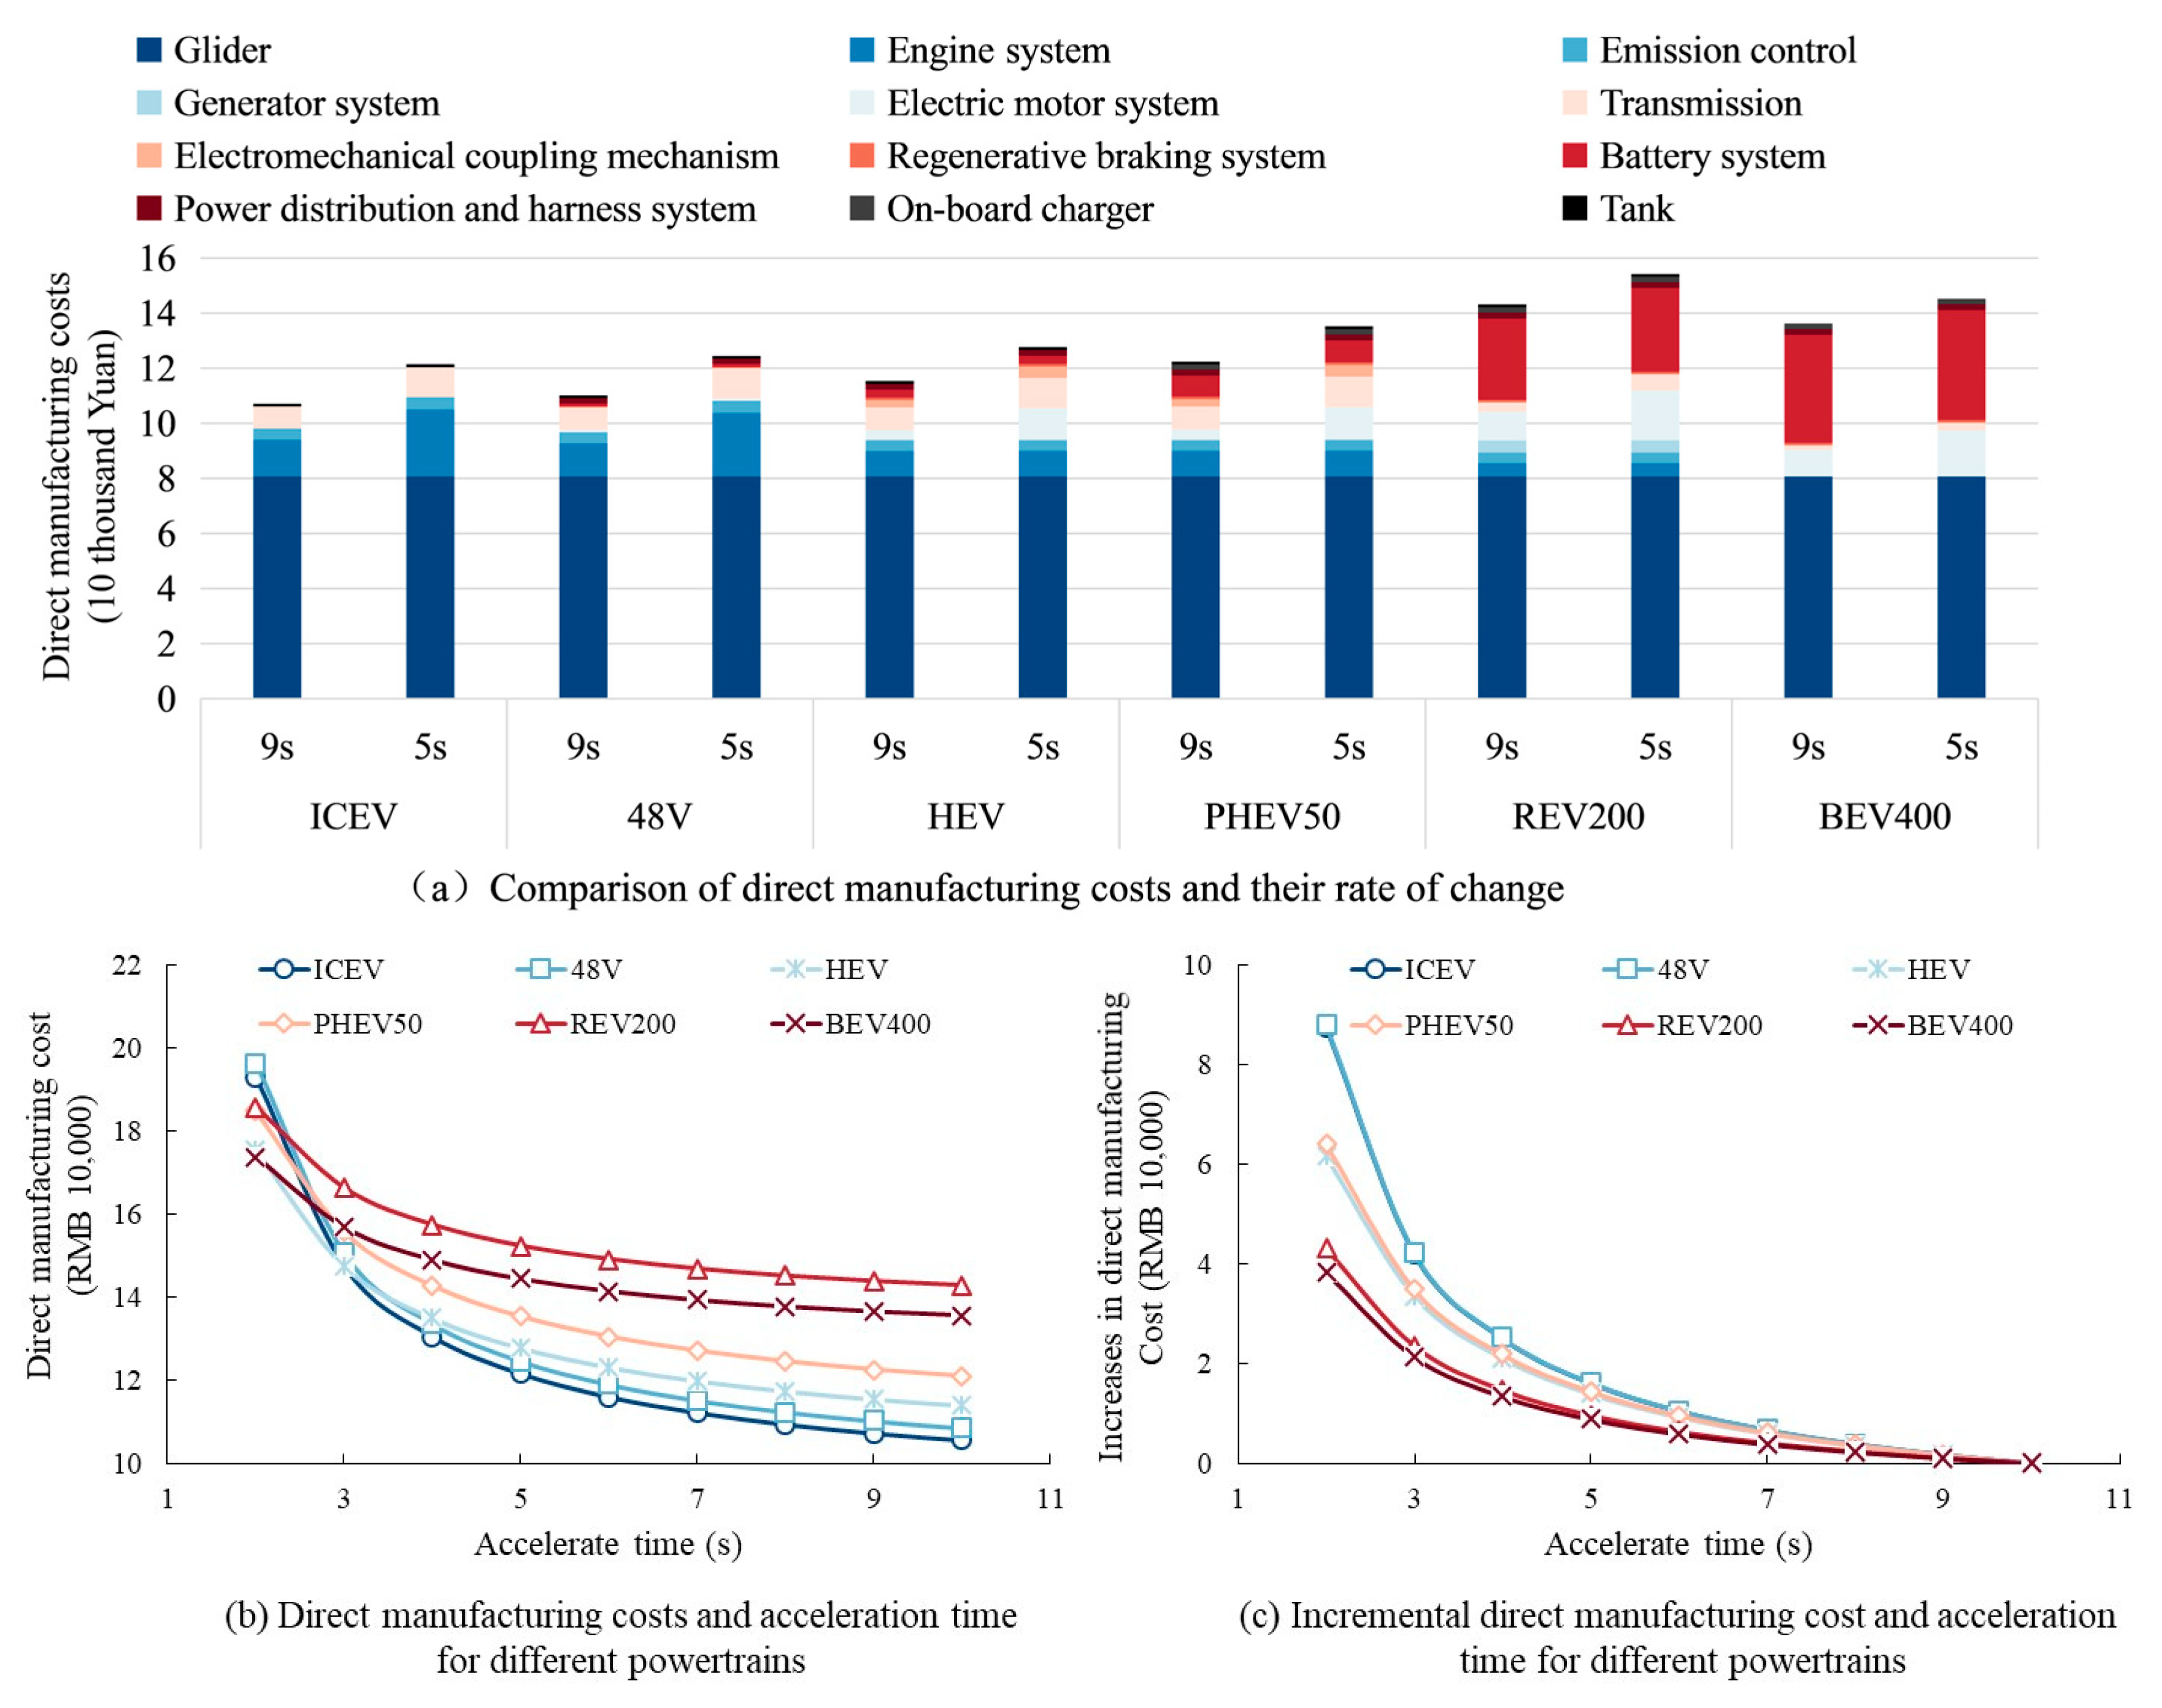
Figure 5a illustrates the impact of the change in dynamics on the direct manufacturing cost of the whole vehicle and key components of different powertrain assemblies. The direct manufacturing cost of each powertrain is increased by 13.38%, 13.06%, 10.69%, 10.43%, 5.95%, and 5.72% when the 100 km accelerate time is changed from 9 s to 5 s, respectively. The results show that the electric drive-based powertrain vehicle has less change in direct manufacturing cost when improving dynamic characteristics compared to the engine drive-based powertrain vehicle. From the comparison of the component weight, it can be found that when the dynamic parameter is changed, the components with the largest change in direct manufacturing cost are the engine and drive train for ICEV and 48 V, the component with the largest change is the electric motor system for HEV, and are the electric motor system and the battery system for PHEV50, REV200, and BEV400. This is mainly due to the fact that the motor system has a smaller cost per unit of power than the engine and is able to achieve higher power gains at a lower cost. This suggests that new energy powertrain vehicles are more cost-effective than conventional powertrain vehicles in terms of enhancing dynamics, especially BEVs. This is one of the reasons why most of the new energy vehicles have significantly better dynamic characteristics than conventional powertrain vehicles.
Figure 5b,c reflect the relationship between the direct manufacturing costs of different powertrain components and the acceleration time. With the increase in dynamic characteristics, the direct manufacturing costs of different powertrains all show an increasing trend, and the cost increase in traditional powertrain vehicles is significantly higher than that of new energy vehicles. However, traditional powertrain vehicles have a certain cost advantage over new energy vehicles when the 100 km acceleration time is longer due to the lower initial direct manufacturing cost. In addition, the direct manufacturing cost of 48 V is higher than that of traditional ICEV, mainly because 48 V still belongs to the category of engine-driven vehicles, for it only has one more set of the 48 V system (battery, motor, etc.) and this motor only plays the role of a booster. BEV400 benefits from the lower unit cost of the motor system, and with only a slight change in the motor system and a slight increase in the battery capacity in case of a change in dynamics, its direct manufacturing cost has a clear cost-effectiveness advantage over other powertrains with relatively high unit cost engines like ICEVs or two-power systems like PHEVs or REVs. In addition, the increase in direct manufacturing cost of the powertrain increases significantly with the increase in power, especially for the ICEV and the 48 V. When the 100 km acceleration time of the ICEV is shortened from 10 to 9 s, the direct manufacturing cost of the ICEV increases by RMB 1686 yuan, while when the acceleration time of the ICEV is shortened from 3 to 2 s, the direct manufacturing cost of the ICEV increases to RMB 45,508 yuan. For the BEV400, the corresponding cost increases are USD 949 and USD 16,953, respectively. This shows that improving the dynamic characteristics of automobiles is exponentially difficult, but new energy vehicles have obvious economic advantages over traditional vehicles. As there is consumer preference for better dynamic characteristics, the cost advantage of traditional powertrains will gradually decrease, while the advantages of new energy vehicles will gradually become more obvious, and will make them more popular with consumers in the future.
4. Discussion
In summary, new energy vehicles (PHEV, REV, BEV) have obvious energy-saving and economic advantages in terms of improving the dynamic characteristics compared with traditional powertrain vehicles (ICEV, 48 V, HEV). In the future, as living standards improve, consumers will pay more attention to the driving experience of the vehicle, and the dynamic characteristics of new energy vehicles will become even more prominent. Considering the fuel consumption and direct manufacturing costs of different powertrain vehicles and the trend of changes in dynamic characteristics, PHEV50 have a characteristic of balancing fuel consumption and direct manufacturing costs: with the same acceleration time of 0 to 100 km/h, PHEV50 has lower fuel consumption than traditional powertrains, lower direct manufacturing costs than REV200 and BEV400, and no range anxiety or environmental adaptability issues. This would appear to be the best choice for consumers when considering overall power, economic use, and economic purchase. Additionally, it should be noted that the advantages of new energy vehicles in acceleration performance extend beyond lower fuel consumption and direct manufacturing costs: first, the operational characteristics of electric motors ensure that new energy vehicles outperform traditional internal combustion engine vehicles in acceleration performance. Electric motors deliver greater torque than engines and can produce peak torque at zero RPM with the same motor power output, enabling new energy vehicles to achieve significantly higher power during the initial acceleration period compared to ICEVs. Second, this study only considers the direct manufacturing costs of powertrains with different dynamic characteristics, without considering the tax on engine displacement. When the dynamic performance is improved, the engine power needs to be increased, which in turn requires a larger engine displacement and produces higher emissions. In fact, consumers who purchase vehicles with traditional powertrains will have to pay a hefty displacement tax. For example, in China, the displacement tax for a 3.5 L traditional internal combustion engine vehicle is about 2.8 times that of a 2.5 L vehicle. This further proves the advantage of NEVs over ICEVs, and this advantage will become even greater as consumer preference for dynamic characteristics increases.
5. Conclusions
NEVs can significantly improve the dynamic characteristics of passenger cars at a lower cost. Consumers’ preference for high dynamic characteristics can be well met by all types of NEV power systems, especially pure electric vehicles. Under the current trend of passenger car electrification, BEVs are the best choice for consumers who want high dynamic characteristics. Therefore, NEVs show excellent characteristics in meeting the demand for low prices and strong dynamic characteristics, while promoting the Chinese automotive industry to achieve its carbon peak and carbon neutrality goals. In terms of energy consumption, the electric drive systems used in NEVs are more energy efficient and can maintain high energy efficiency at different speeds and loads. However, the situation is more complicated in terms of cost. Currently, within the dynamic performance range of general level passenger cars, the direct production costs of various new energy power systems (3–9 s) are generally higher than those of ICEVs. In the process of hybrid performance enhancing, energy consumption and direct manufacturing cost increments are higher (ICEV, 48 V, HEV), resulting in higher power performance (acceleration time of less than 3 s). The direct manufacturing costs of NEVs, especially BEVs, will be lower than those of ICEV, 48 V, and HEV power systems.
Therefore, when designing models with extremely high dynamic characteristics (acceleration time of less than 3 s), NEVs have obvious advantages in terms of energy consumption and cost, so models with a higher degree of electrification, such as BEVs, can be selected as a priority. However, when the acceleration time is more than 3 s, a trade-off between energy consumption and cost must be made when selecting the type of power system. Selecting the system with a higher proportion of electrical power within the power system will achieve both lower costs and reduced energy consumption.
In the process of rapid development of the automotive industry, in order to balance industrial development and energy conservation and emission reduction goals, it may be necessary to provide more detailed guidance on vehicle power systems in the future, with the goal of reducing vehicle carbon emissions while meeting consumers’ higher demands for vehicle power. The government can help achieve this goal by establishing mechanisms in fiscal policies such as purchase tax subsidies. For example, different subsidies can be set for different types of vehicles with different power systems under different power conditions. No special subsidies need to be set for ultra-high-performance vehicles, as companies will naturally choose NEVs due to their technological advantages. However, for more general-performance vehicles, policies should be used to guide automakers to consider the balance between vehicle energy consumption and cost when choosing technology routes, and to encourage companies to favor NEVs with lower energy consumption and emissions as much as possible. For example, traditional fuel vehicles have a cost advantage over low-dynamic models. In this case, relatively higher subsidies can be given to low-dynamic performance NEVs rather than ICEVs to promote the transition of this market segment to new energy power system. This approach will help promote the industry’s sustainable development.
This study has several limitations that point to valuable future research directions. Firstly, the model focuses on incremental technological pathways and does not account for disruptive technologies, requiring future updates as new technologies emerge. Secondly, the total cost of ownership (TCO) assessment assumes constant electricity prices, maintenance, and insurance costs to simplify the calculation. However, these factors are likely to change with the growth of renewable energy, evolving EV maintenance technologies, and developments in auto finance. Future studies should refine these cost assumptions to ensure TCO evaluations more accurately reflect real-world conditions.