Article

Linking the Deployment of Renewable Energy Technologies with Multidimensional Societal Welfare: A Panel Data Analysis

by
Svetlana Kunskaja
1,*,
Aušra Pažėraitė
1,
Artur Budzyński
2,* and
Maria Cieśla
2
1
Laboratory of Energy Systems Research, Lithuanian Energy Institute, 44403 Kaunas, Lithuania
2
Department of Transport Systems, Traffic Engineering and Logistics, Silesian University of Technology, 44-100 Gliwice, Poland
*
Authors to whom correspondence should be addressed.
Sustainability 2026, 18(2), 1111; https://doi.org/10.3390/su18021111
Submission received: 20 November 2025 / Revised: 13 January 2026 / Accepted: 19 January 2026 / Published: 21 January 2026
(This article belongs to the Special Issue Sustainable Electrical Engineering and PV Microgrids)

Abstract

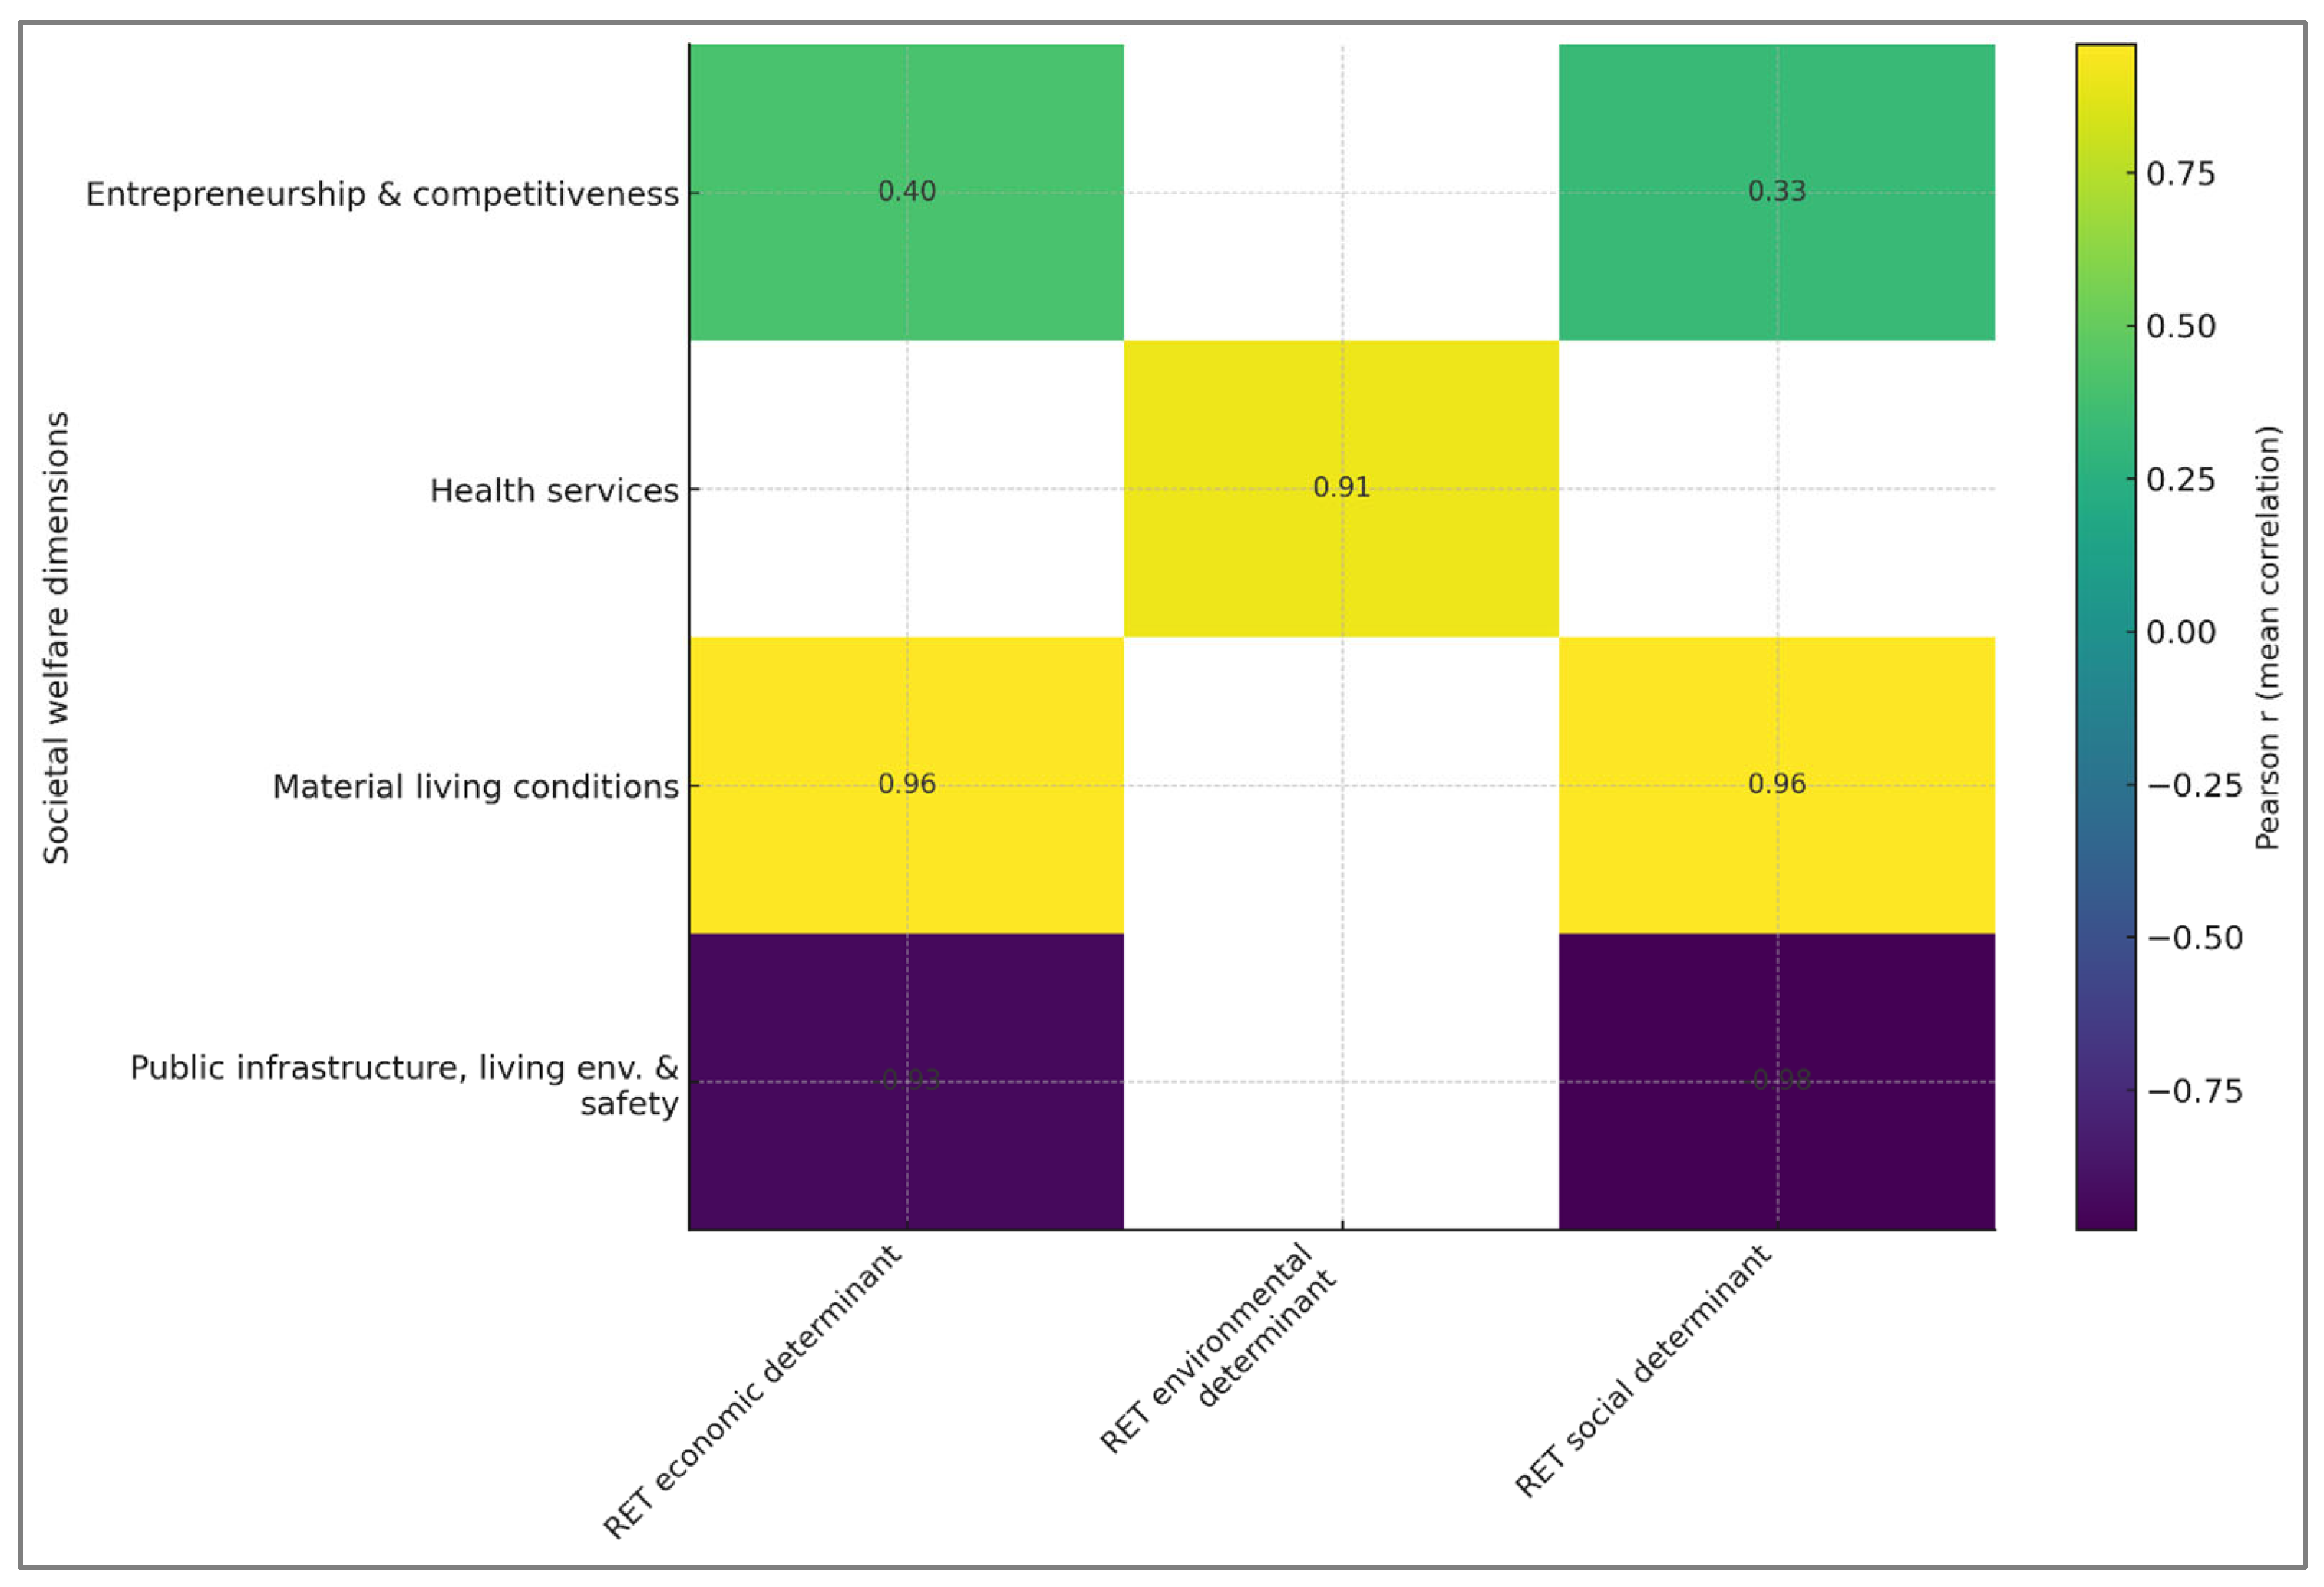
Given global efforts to promote sustainable energy transitions, this study investigates how the deployment of renewable energy technologies (RETs) relates to multidimensional societal welfare and provides empirical evidence on these linkages in Lithuania. The purpose of the study is to provide an integrated, Lithuania-specific assessment of how economic, social, and environmental determinants associated with RET deployment are related to multiple dimensions of societal welfare. Drawing on scientific literature, an integrated indicator framework is developed that links the economic, social, and environmental determinants of renewable energy technology (RET) deployment to six societal welfare dimensions, as defined by the Lithuanian Quality of Life Index. Using official Lithuanian statistics for 2020–2024, a standardized panel dataset is constructed and Pearson correlation analysis and multiple linear regression are applied using aggregated determinant categories, with model assumptions verified using the Breusch–Pagan and Durbin–Watson tests. Correlation results show very strong positive links between RET intensity indicators and key economic welfare measures (for example, wages, GDP per capita, foreign direct investment, disposable income), with absolute correlation coefficients typically between 0.90 and 0.99 (p < 0.05), and strong negative correlations between air-pollution indicators and GDP, income, FDI, and education (correlation coefficients between −0.96 and −0.90; p < 0.05). The results indicate that RET-related economic determinants have a statistically significant positive effect on the societal welfare dimensions of material living conditions; entrepreneurship/business competitiveness; and public infrastructure, living-environment quality/safety. Social factors also significantly support the societal welfare dimensions of entrepreneurship/business competitiveness and public infrastructure, living-environment quality/safety. In the retained regression models, explanatory power is very high (R2 between 0.91 and 0.999), with positive and statistically significant coefficients for the economic determinant (regression coefficients between 0.43 and 0.96; p < 0.05) and negative, statistically significant coefficients for the environmental determinant in the entrepreneurship and public-infrastructure dimensions (regression coefficients between −1.13 and −1.51; p < 0.05). Environmental determinants are associated with lower air pollution but show negative effects on the societal welfare dimensions of entrepreneurship/business competitiveness and public infrastructure, living-environment quality/safety. Overall, the findings suggest that RET deployment is an important correlate of the economic aspects of societal welfare, while environmental and social dimensions display more complex, domain-specific impacts.

1. Introduction

Renewable energy technologies (RETs) have become central to modern energy and climate policy, reflecting climate-neutrality and sustainable-development goals [1,2,3,4,5,6]. Expanding renewables is widely linked to emissions reduction and energy-system transformation [7,8,9,10,11,12,13,14]. At the same time, the transition has socio-economic implications, shaping income and employment, business dynamics and innovation, and public finances [15,16,17,18,19]. This has intensified interest in welfare outcomes—equity, access to services, demographic and civic patterns, and living conditions—associated with RET deployment [20,21,22,23,24,25,26,27,28,29].
Societal welfare is a multidimensional concept that combines objective living conditions (e.g., income, employment, health, education, housing, safety, and environmental quality) with, where possible, subjective perceptions of well-being and life satisfaction [30,31,32,33]. Quality-of-life research emphasizes that welfare cannot be fully assessed through income or GDP alone; instead, it requires combining indicators related to material living standards, entrepreneurship and labor markets, health and education services, civic participation, safety, and environmental quality [34,35,36,37,38,39,40,41,42,43]. This conceptualization is operationalized in various international frameworks, including the Human Development Index, the OECD Better Life Index, the Social Progress Index, and quality-of-life models developed by the World Health Organization and others. In the European context, Eurostat’s 8+1 dimensions of quality of life have become a widely used reference, integrating material living conditions; productive/main activity; health; education; leisure and social interactions; economic security and physical safety; governance and basic rights; and the natural and living environment, complemented by an overall life-satisfaction dimension. In Lithuania, the Lithuanian Quality of Life Index (LQLI) adapts these principles to national conditions by structuring societal welfare into six dimensions: material living conditions; entrepreneurship and business competitiveness; health services; educational services; demography, civic and social engagement; and public infrastructure, living environment, and safety [30,31,32,33,34,35,36,37]. This nationally developed index provides a context-specific and empirically grounded lens through which to assess the welfare implications of energy transition to renewable energy (RET).
The deployment of RETs is driven by a constellation of economic, social, and environmental determinants that also constitute the main channels through which RETs affect welfare outcomes. Economic determinants include macroeconomic performance (e.g., GDP and GDP per capita) strengthens a country’s capacity to finance clean energy infrastructure, support innovation, and sustainable policy implementation [1,2,3,4,5,6,7,8]. Household disposable income affects affordability and diffusion of renewables, while inequality and limited purchasing power can restrict participation in clean energy transitions [3,5,6,44,45]. Empirical evidence further indicates that economic expansion is associated with higher renewable energy consumption and co-benefits such as productivity gains, employment effects, and welfare improvements [1,2,4,7,8,9,10,46]. Sustained public and private investment, together with foreign direct investment (FDI), supports capacity expansion, innovation, and technology transfer in renewable sectors [47,48,49,50,51,52]. In parallel, targeted policy instruments (e.g., subsidies, tax incentives, and feed-in tariffs) remain among the most effective levers for accelerating deployment when aligned with long-term sustainability goals [53,54,55,56,57]. Finally, energy prices condition adoption by shaping the relative competitiveness of renewables and incentives for substitution and innovation [58,59,60]. Higher income levels, more favorable investment conditions, and supportive policy frameworks are typically associated with greater capacity to finance renewable projects, absorb risk, and upgrade infrastructure [5,6,7,8,9,10,47,48,49,61,62,63]. Social determinants capture education and human capital, labor-market conditions, poverty and energy-poverty risks, and perceptions of energy security and health co-benefits. These factors shape public acceptance and the ability of households and firms to adopt renewable technologies, and the political legitimacy of ambitious transition strategies. Education and human capital strengthen awareness, technical capacity, and willingness to adopt renewables, especially where training supports innovation and institutional readiness [64,65,66,67,68,69]. Labor-market conditions matter because renewable expansion can create jobs but also requires reskilling and workforce adjustment during technological change [70,71,72]. Perceived health co-benefits (e.g., cleaner air and reduced emissions) further reinforce public acceptance of renewables [73,74,75,76,77]. Poverty and energy-poverty risks condition whether households can participate in the transition and whether renewables improve access to affordable, reliable energy in disadvantaged communities [78,79]. Finally, perceived energy-security gains, such as greater resilience to price volatility and supply disruptions, also strengthen societal support for renewable deployment [80,81,82,83]. Environmental determinants arise from climate-policy commitments and environmental regulation, including air-quality standards, water-resource constraints, and waste-management obligations, which increase the costs of fossil-intensive pathways and incentivize low-carbon alternatives [11,12,13,14,15,16,17,18,19,20,21,22,84,85,86,87,88,89,90,91,92,93,94,95]. Empirical and model-based studies show that stricter regulatory frameworks and clean-energy policies are associated with lower emissions and improved air quality, reinforcing the uptake of renewables such as wind and solar [84,85,86,87]. Beyond emissions, the energy–water nexus highlights that renewables can reduce cooling-water requirements and improve resource efficiency relative to conventional generation, which becomes increasingly relevant under water-stress constraints [88,89,90]. Similarly, waste-management and circular-economy policies, through recycling, recovery, and waste-to-energy pathways, support renewable integration and contribute to emissions mitigation across EU and other contexts [91,92,93,94,95]. Together, these three determinant groups both enable RET deployment and mediate its impacts on employment, income, health, infrastructure, and the quality of the living environment.
A substantial body of research suggests that renewable energy technology (RET) deployment has generally positive effects on societal welfare, with higher renewable shares and clean-energy investment often associated with higher GDP per capita, employment growth, increased foreign direct investment, and stronger innovation and competitiveness [1,5,11,15,19,22,70,71,72,96,97,98]. Renewable energy deployment is consistently linked to environmental and health co-benefits. Studies show lower greenhouse-gas and pollutant emissions with higher renewable shares [98,99,100,101,102,103], followed by improved air quality and reduced exposure to harmful pollutants [104,105,106,107,108,109,110]. These changes are associated with lower morbidity and mortality and broader long-term welfare gains [111,112,113,114,115,116,117]. Based on this, it is often argued that renewable energy deployment can generate mutually beneficial outcomes, as it simultaneously increases environmental sustainability and social and economic welfare.
However, the literature also highlights several controversial and diverging perspectives. First, the relationship between renewable energy deployment and economic growth is not uniformly positive. Some studies identify weak, non-linear, or context-dependent effects, suggesting that the benefits of renewables may depend on institutional quality, technological maturity, or the timing and design of support policies [6,49,52,57,79]. Second, evidence on the distributional and equity implications of RET deployment is mixed. While RET deployment can stimulate new employment and business opportunities, it can also impose higher energy costs, create regional imbalances in investment, and reinforce inequalities if the benefits are unevenly distributed or if vulnerable groups face higher transition costs [11,49,57,73,74,75,76,77,78,96,118]. Third, environmental and climate policies that support renewables may generate short-term competitiveness pressures and fiscal burdens, particularly in capital-intensive sectors and infrastructure upgrades, even if they improve health and environmental quality over the longer term [88,89,90,96,118]. These debates underscore that the welfare implications of energy transitions are complex, potentially involving trade-offs between short-term adjustment costs and long-term gains.
Methodologically, researchers have used diverse approaches to study the relationships between energy transitions and welfare. Many contributions develop indicator systems that integrate economic, social, and environmental dimensions and then employ time-series or panel-data techniques to estimate the impact of energy indicators on composite welfare indices, such as the Sustainable Energy Development Index (SEDI), the Human Development Index (HDI), or various quality-of-life indices [23,24,25,26,27]. Linear regression and its variants (including fixed-effects and random-effects models) are common, while some studies adopt more complex econometric frameworks or modelling platforms (e.g., Panta Rhei) to capture dynamic feedbacks and scenarios [26,119,120,121,122,123,124]. Comparative analyses for EU member states indicate that countries with stronger institutional frameworks, higher income levels, and more comprehensive welfare systems tend to achieve both higher renewable energy integration and more pronounced welfare co-benefits, whereas many Central and Eastern European economies still face structural and fiscal constraints that limit similar outcomes. Despite this rich methodological and comparative landscape, relatively few studies focus explicitly on the renewable energy–welfare nexus within a single national context using a detailed, nationally constructed quality-of-life index.
For Lithuania, existing research has primarily examined energy transition issues from the perspectives of energy security, macroeconomic performance, or environmental compliance, leaving the broader, multidimensional welfare implications of RET deployment underexplored. In particular, the linkages between renewable energy determinants and the six dimensions of the Lithuanian Quality of Life Index (LQLI) have not yet been systematically quantified within a unified empirical framework. This creates a gap in understanding how changes in the energy system are statistically associated with specific welfare outcomes in a small, open economy undergoing rapid transition.
Against this background, the present study aims to provide an integrated, Lithuania-specific assessment of how economic, social, and environmental determinants associated with renewable energy technology deployment relate to different dimensions of societal welfare in Lithuania. Lithuania is a particularly suitable case for a broader energy–welfare analysis for several reasons. First, it is a small, open economy that has experienced a rapid expansion of renewable energy technologies in electricity, heating, and transport in line with ambitious national and EU decarbonization targets. Second, for many years the Lithuanian power system operated within the Russian-dominated BRELL ring, which created a structural dependence on the Russian and Belarusian electricity systems. In 2025, Lithuania and the other Baltic States disconnected from the BRELL system and synchronized their grids with the continental European network, marking a major step towards full energy independence and greater resilience to external shocks. This transition from long-term external dependence to increasing energy autonomy makes Lithuania an informative laboratory for examining how changes in the energy system are statistically associated with multidimensional welfare outcomes. Third, Lithuania is one of the few countries that has developed an official, multidimensional Lithuanian Quality of Life Index (LQLI), which provides a harmonized, nationally validated measure of societal welfare that can be directly linked to energy-transition indicators. Fourth, high-quality, annually consistent official statistics on both renewable energy deployment and LQLI dimensions are available for 2020–2024, enabling an integrated analysis of the energy–welfare nexus using comparable indicators. While the empirical findings are context-specific, Lithuania’s profile is broadly similar to that of other small EU economies pursuing rapid renewable expansion, so the results offer insights that are informative beyond the national case.
In line with these considerations, the study has the following purpose: to empirically examine how aggregated economic, social, and environmental determinants associated with renewable energy technology deployment are statistically related to six LQLI-based dimensions of societal welfare in Lithuania over the period 2020–2024. Using official Lithuanian statistics, a standardized macro-level dataset is constructed that combines indicators describing RET deployment and its key determinants with the six welfare dimensions. Pearson correlation analysis is applied to map the bivariate relationships between groups of RET-related indicators and welfare dimensions, followed by multiple linear regression models in which aggregated economic, social, and environmental factor indices are used as explanatory variables. Diagnostic tests (Breusch–Pagan and Durbin–Watson) are employed to assess model adequacy. In this way, the article contributes to the literature by (i) linking a nationally developed quality-of-life framework (LQLI) to renewable energy deployment determinants in a single-country setting, (ii) providing a multidimensional empirical map of the energy–welfare nexus in a small, rapidly transitioning EU economy, and (iii) highlighting the relative roles of economic, social, and environmental factors in shaping different aspects of societal welfare.

2. Materials and Methods

2.1. Research Methodology and Structure

The first stage of this study comprised a comprehensive review of scientific literature aimed at identifying scholars’ perspectives on the factors determining the deployment of renewable energy technologies and their associated indicators, as well as the dimensions of societal welfare and their corresponding indicators. Based on this literature review, a consolidated set of indicators was developed to represent both the determinants of renewable energy technology deployment and the dimensions of societal welfare. Data analysis was performed using IBM SPSS Statistics for Windows, Version 22.0.
The second stage of this research employs a correlation analysis to determine the relationship and strength of interaction between the indicators of renewable energy technology deployment and the indicators of societal welfare. The use of correlation analysis is motivated by the need to identify connections among the selected indicators, define their qualitative characteristics, and verify whether the observed relationships are statistically significant. To assess the degree of association between variables, Pearson’s linear correlation coefficient is applied, while the statistical significance of the correlation strength is evaluated using Student’s t-test (see Table 1) [125].
It is considered that the correlation coefficient does not depend on the measurement units of the variables. Correlation coefficients range from −1 to +1, with special points at −1, 0, and +1. The results depend on whether the coefficient is negative or positive. A positive coefficient indicates a direct relationship, i.e., as X increases, Y is likely to increase as well; conversely, a negative coefficient indicates an inverse relationship, i.e., as X increases, Y is likely to decrease. Correlation is statistically significant when p < α and statistically non-significant when p ≥ α, where α is the chosen significance level [126].
In the third stage of the research, the data series was processed and its suitability for panel data analysis was evaluated. The regression coefficients were estimated using the least squares method applied to differenced variables, thereby eliminating time-invariant unobserved effects. Diagnostic tests were performed to verify the assumptions of regression analysis, and where violations were detected, appropriate corrective measures were implemented. The analysis was carried out using three model specifications (the pooled model, the fixed-effects model, and the random-effects model) with the final model selection guided by assumption-specific statistical tests. Particular attention was paid to the structure and composition of indicators representing both renewable energy technology implementation and societal welfare.
The fourth stage of the research entails a direct assessment of the impact of renewable energy technology deployment on societal welfare. This assessment is carried out in the following sequence: (1) evaluating the impact on overall material welfare and its specific indicators; (2) examining the effects on societal entrepreneurship and business competitiveness and related assessment metrics; (3) assessing the implications for societal health and its component indicators; (4) analyzing the influence on education and associated measures; (5) investigating demography, civic and social engagement, together with their respective indicators; and (6) evaluating the impact on public infrastructure, quality of the living environment and safety, and corresponding assessment indicators.
In assessing the impact of renewable energy technology deployment on societal welfare, the key conditions influencing how such implementation affects changes in Lithuanian welfare are identified. The findings of this stage are then synthesized and summarized, providing the basis for the study’s final conclusions.

2.2. Theoretical Background

2.2.1. Key Determinants of Renewable Energy Technology Deployment

Although a wide range of determinants influence the deployment of renewable energy technologies, the most common and consistently cited in the literature are the economic, social and environmental dimensions [28,29,127,128,129]. This tripartite structure serves as a widely adopted analytical lens for understanding both the enabling conditions and the persistent barriers to renewable energy adoption. In this framework, economic determinants reflect financial capacity, investment climate, and market incentives; social determinants encompass public acceptance, institutional capability, and perceived co-benefits; and environmental determinants capture regulatory and ecological pressures arising from climate concerns, pollution control, resource constraints, and waste management. Each of these dimensions is typically represented through measurable indicators that enable empirical assessment. Collectively, these factors shape not only the pace and effectiveness of renewable energy deployment but also exert a profound influence on societal welfare, affecting employment, energy accessibility, public health, and overall quality of life. Empirical studies carried out in Lithuania point to a very similar configuration of drivers, highlighting the role of income levels, EU and national support schemes, energy prices, and environmental regulation in the expansion of wind, solar and bioenergy capacity at national and municipal levels [130,131,132,133]. Accordingly, this study will focus on reviewing and applying these three dimensions to analyze their broader implications for societal welfare.
RET Economic Determinants
Economic determinants capture the financial capacity, affordability conditions, and investment structures that enable or constrain renewable energy technology (RET) deployment and its welfare effects. They are commonly operationalized through GDP/GDP per capita, household disposable income, energy prices, investment (public/private), foreign direct investment (FDI), and policy-support instruments (e.g., subsidies, tax incentives, feed-in tariffs). Across countries, higher GDP and GDP per capita are generally associated with higher renewable shares and stronger implementation capacity, while also correlating with lower emissions intensity and reduced transition risk [1,2,3,4]. EU evidence likewise shows a positive, though typically moderate, relationship between GDP per capita and renewable penetration in electricity and final energy consumption [5,6], suggesting that economic development facilitates both feasibility and stability of renewable deployment strategies [7,8,9,10]. At the household level, disposable income and inequality condition affordability and participation in clean-energy transitions. Evidence from South Africa shows that disparities in income, education, and infrastructure access can limit renewable uptake in rural and disadvantaged communities [44]. In the United States, long-run relationships between disposable income and renewable consumption have been documented, and forecasting models indicate that rising income supports further uptake [45,46]. Financing conditions and investment structures remain decisive. FDI can accelerate deployment by bringing capital, know-how, and managerial capacity, although effects vary by context and may not always translate into proportional renewable expansion [47,48,49]. Targeted policy instruments reduce upfront costs and perceived risk and are widely identified as key levers for scaling renewables, though their effectiveness depends on design and institutional capacity [50,51,52,53,54,55,56,57]. Energy prices also operate as behavioral signals: higher electricity and fossil-fuel prices can improve renewable competitiveness, while dynamic pricing can support system integration [58,59,60]. In parallel, R&D investment improves firm performance and innovation incentives, but policy uncertainty can still elevate risk–making de-risking tools and co-financing important [61,62,63].
In Lithuania, empirical evaluations emphasize predictable regulation, access to EU co-financing, and low capital costs as central enablers of wind/solar deployment and support-scheme performance [130]. Household studies similarly indicate that higher-income groups more often adopt modern renewables (e.g., heat pumps, rooftop solar), while lower-income groups face higher energy-poverty exposure [131,134,135,136]. More broadly, the literature highlights project viability, financing access, and policy stability as recurring implementation conditions [137,138,139,140,141,142,143], reflected in Lithuanian assessments of auctions, support schemes, and the distributional reach of grants and preferential loans [144,145,146,147]. Recent national evidence also suggests that price spikes, combined with support programs, can strengthen incentives for rooftop solar and electrification investments [148,149]. Finally, sectoral renewable shares (overall and in electricity, heating/cooling, and transport) function as both progress indicators and policy drivers in the EU and Lithuania, with especially distinct challenges in transport compared to heating/cooling [150,151,152,153,154,155,156].
RET Social Determinants
Social determinants capture the societal conditions that shape acceptance, willingness, and practical capacity to adopt renewable energy technologies (RETs). The literature most often emphasizes human capital and awareness, labor-market conditions, poverty and energy-poverty risks, and perceived co-benefits related to health and energy security. Higher education and skills are repeatedly linked to stronger support for renewables and greater household-level adoption capacity, particularly in emerging and developing contexts [64,65,66,67,68,69]. Labor-market expectations also matter: anticipated job creation and industrial opportunities can strengthen public and political support for deployment, while reskilling needs condition the feasibility of workforce transitions [70,71,72]. In parallel, energy poverty and affordability constraints influence whether households can participate in the transition and whether renewables are perceived as socially inclusive [78]. Finally, perceived co-benefits, especially cleaner air and lower health burdens, as well as reduced exposure to geopolitical and price risks, reinforce acceptance and legitimacy of more ambitious renewable strategies [73,74,75,76,77,79,80,81,82,83,99,100,101,102,103,104,105,106,107,108,109,110,111,112,113,114,115,116,117].
Lithuanian evidence points to the same channels. Research on air pollution and related health impacts, linked to solid-fuel heating and transport, supports framing energy efficiency and renewables as public-health and quality-of-life measures [134]. Energy-security considerations are also central in Lithuania’s case, where reducing import dependence and strengthening resilience is a recurrent rationale in policy and academic analyses [144,145]. Studies further stress that awareness, trust in institutions, and perceived fairness of support schemes shape acceptance of renewables and energy-efficiency measures [157]. More detailed local and comparative work indicates that human capital, social status, and organizational capacity are associated with participation in renovation and prosumer initiatives, and that renewable-related expansion can support employment opportunities beyond major urban centers [158,159,160].
RET Environmental Determinants
Environmental determinants arise from climate-policy commitments, air-quality standards, water-resource constraints, and waste-management obligations that increase the political and regulatory costs of fossil-intensive pathways and incentivize low-carbon alternatives. In empirical work, these pressures are typically captured through emissions targets and observed pollutant levels, water use in the energy sector, and compliance requirements related to waste reduction, recycling, and recovery. A large body of evidence links higher renewable energy consumption to lower CO2 and other greenhouse-gas emissions, making renewables central instruments for meeting decarbonization targets rather than discretionary options [11,12,13,14,15,16,17,18,19,20,21,22]. This linkage is typically stronger in high-income contexts where institutional capacity and technological maturity support faster implementation [79]. Air-quality regulation reinforces this incentive: country and global studies show that expanding PV and wind can displace fossil generation and reduce CO2 and local pollutants (e.g., NOx, SOx, particulates), increasingly using emissions datasets and regulatory benchmarks to track performance [85,86,87]. Water constraints provide an additional driver through the energy–water nexus. Because conventional thermal generation is highly water-intensive (mainly for cooling), shifting toward wind and solar can reduce withdrawals and consumption and align energy transition strategies with water-security objectives, especially under water stress [88,89,90]. Waste-management and circular-economy commitments further encourage renewable deployment via waste-to-energy and recovery pathways (e.g., anaerobic digestion, landfill gas capture, energy recovery), which can reduce landfill dependence while producing energy [91,92]. EU evidence suggests that coupling recycling progress with renewable-oriented recovery can contribute to lower CO2 emissions, although outcomes depend on policy design [93]. Industrial studies also indicate that, under strict controls, hazardous waste streams can be integrated into energy recovery while meeting safety and environmental thresholds [94,95].
Lithuanian literature mirrors these mechanisms, highlighting how EU integration and national transition priorities shape renewable deployment [133]. National work also points to the relevance of the water–energy nexus for long-term resource management [135,161], alongside energy-security and resilience considerations that strengthen the political case for renewables [144,145]. In addition, Lithuania’s emissions-reduction commitments and growing urban air-quality focus reinforce regulatory incentives to expand RES, particularly in sectors such as residential heating [156]. Progress in municipal recycling and the development of waste-to-energy facilities is likewise discussed as contributing both to landfill reduction and renewable-based heat and power generation [162,163].
Together, these determinants interact to drive renewable deployment and to condition the welfare channels through which the transition affects society.

2.2.2. Societal Welfare

Societal welfare refers to the overall quality of life and well-being of a society’s members and is inherently multidimensional. It combines objective living conditions (e.g., material resources, employment and economic security, access to education and health services, safety, governance and rights protection, and environmental quality) with subjective well-being (e.g., life satisfaction, work–life balance, and social connectedness) [30,31,32,33,34,35,36]. Accordingly, welfare spans both individual outcomes (health, security, satisfaction) and collective conditions (social capital, institutional trust, political stability), including how fairly these conditions are distributed across social groups [30,31,36]. Quality of life (QoL) frameworks operationalize this concept by integrating objective and subjective, material and non-material dimensions at both individual and societal levels [38,39,40,41,42,43]. In empirical applications, these dimensions are typically captured through domains such as the economy, social relations and community, health, education and care, and the local environment, which together structure measurable living conditions and experienced well-being [37]. In empirical research, societal welfare is typically operationalized through domains such as the economy, social relationships and community, health, education and care, the local environment, and personal characteristics, which together capture both objective living conditions and subjective experiences [37]. These domains emphasize that welfare depends not only on economic security and access to services, but also on social cohesion, environmental quality, and effective governance.
Composite frameworks for assessing societal welfare are commonly operationalized through quality-of-life (QoL) approaches (e.g., HDI, OECD Better Life Index, Social Progress Index, WHOQOL), which combine multidimensional objective indicators (material conditions, services, safety, environment) and, where available, subjective measures (e.g., life satisfaction, social trust). In Europe, welfare measurement is frequently structured around Eurostat’s 8+1 QoL dimensions, which provide a widely used reference for comparative policy analysis. For Lithuania, this study relies on the Lithuanian Quality of Life Index (LQLI), an official, context-specific composite indicator aligned with Eurostat’s architecture. The LQLI aggregates welfare into six dimensions—material living conditions; entrepreneurship and business competitiveness; health services; educational services; demography, civic and social engagement; and public infrastructure, living environment, and safety—covering the core Eurostat domains. Because the LQLI is primarily objective, Eurostat’s ninth (life-satisfaction) dimension is typically captured through complementary survey indicators. Empirical applications of the LQLI reveal substantial regional disparities across welfare dimensions, shaped by economic structure, demography, and public investment, providing a baseline for linking energy-system changes to welfare outcomes [164,165,166] (Table 2).
Overall, the literature converges on a multidimensional view of societal welfare that combines objective living conditions with, where possible, subjective evaluations of well-being. In Europe, Eurostat’s 8+1 framework provides a widely used reference, and the Lithuanian Quality of Life Index (LQLI) applies its core principles in a national setting. Because the LQLI does not include a dedicated “overall life experience” dimension, empirical work often complements it with survey-based measures (e.g., life satisfaction or trust) and pays attention to distributional inequalities across regions and social groups. This synthesis supports the use of QoL-type composite indices as structured proxies for societal conditions, while underscoring the value of incorporating subjective and equity-focused indicators.
The evidence also indicates that renewable energy technology deployment has measurable implications for societal welfare. Economic, social, and environmental determinants not only shape where and how renewables expand but also constitute the main channels through which the transition affects welfare outcomes. Accordingly, this study expects observable linkages between renewable deployment and the six LQLI-based welfare dimensions: material living conditions; entrepreneurship and business competitiveness; health services; educational services; demography, civic and social engagement; and public infrastructure, living environment, and safety.
Comparative analyses of EU member states reveal substantial cross-national variation in the renewable energy–welfare nexus. Studies show that Northern and Western European countries tend to achieve higher renewable energy integration and stronger welfare outcomes, supported by well-developed institutional frameworks, higher income levels, and more equitable policy mechanisms, whereas Central and Eastern European countries continue to face structural and fiscal barriers that constrain similar welfare co-benefits. Multivariate assessments across 27 EU countries between 2011 and 2020 demonstrate that Scandinavia, particularly Sweden, Finland, and Denmark, achieved the highest renewable energy adoption rates and corresponding improvements in environmental and social welfare indicators [167]. Similarly, an EU-wide panel evaluation of renewable electricity generation confirms that higher GDP per capita and energy-investment capacity are positively associated with renewable energy uptake, highlighting the economic underpinnings of welfare-enhancing transitions [168]. A decade-long comparative study identifies Sweden, Austria, Finland, and Latvia as consistent leaders in renewable energy development, where institutional capacity and public support mechanisms contribute to broader societal welfare gains [169]. Further comparative work situates renewable deployment within social and environmental policy frameworks, finding that countries with stronger welfare institutions and social-equity mechanisms experience more sustainable and welfare-generating transitions [170,171]. Recent sustainability assessments reinforce this link, showing that high levels of renewable energy adoption are associated with greater environmental quality and overall welfare improvements, particularly in Northern Europe [172]. Cross-national rankings of renewable sustainability similarly identify Sweden, Belgium, and Ireland as the most sustainable countries in the EU, demonstrating that even smaller economies can achieve high welfare returns from renewable energy through effective governance and social-inclusion policies [173]. Together, these comparative reviews highlight that the welfare outcomes of renewable energy transitions in the EU depend not only on economic capacity but also on social equity, institutional quality, and environmental integration within national policy frameworks [174]. Against this background, the Lithuanian case analyzed in this paper adds evidence from a small, rapidly transforming EU member state with a legacy of energy dependence on Russia and accelerated renewable deployment, thereby complementing the existing comparative literature with a detailed, quality-of-life-based assessment at the national level.

2.2.3. Overview of Methodological Approaches in the Literature

Although renewable energy technology (RET) support schemes are now widespread, empirical evidence on how RET deployment correlates with multidimensional societal welfare—and how benefits distribute across groups—remains comparatively limited. Existing studies typically operationalize welfare through comparable indicator systems that combine economic, social, and environmental dimensions and often rely on composite indices (e.g., SEDI, HDI, Quality of Life Index) to standardize measurement across contexts [23,24,25,26,27]. Methodologically, researchers commonly apply time-series and regression-based designs, ranging from standard linear models to more complex econometric frameworks (e.g., Panta Rhei), depending on research objectives and data availability [26,119,120,121,122,123,124]. Because approaches and model specifications vary widely across the literature, country-specific assessments must align methods with the structure and availability of national data. In practice, this often implies selecting a widely used regression-based framework and adapting it to the local context and the attainable time/space coverage of indicators relevant to economic performance, social conditions, environmental quality, and quality of life.
Similar combinations of structured indicator systems and regression-based modelling are also evident in other policy domains. For example, Kicova et al. [175] use a systematic literature review to synthesize heterogeneous national approaches to cryptocurrency taxation and the challenges of harmonizing regulatory frameworks, while Du and Lv [176] apply linear regression models to examine how digital finance affects household consumption structures. Although these studies address different substantive topics, they likewise combine indexed or composite indicators with relatively parsimonious econometric specifications to analyze the links between financial or technological innovations and welfare-related outcomes, which is methodologically consistent with the approach adopted in this paper. The present study follows this logic by integrating Lithuanian data on renewable energy deployment with LQLI-based welfare indicators in a regression framework tailored to the country’s statistical and institutional context.

2.2.4. Indicators for Renewable Energy Technologies Implementation and Societal Welfare

Scientific studies indicate that the deployment of renewable energy technologies is shaped by a set of key determinants, measured through various indicators that can be broadly categorized into economic, social, and environmental groups. These indicators are summarized in Table 3, which presents the economic, social, and environmental variables used to assess renewable energy technology (RET) deployment.
Economic indicators capture financial and structural conditions influencing renewable energy implementation. These include gross domestic product (GDP) per capita [1,2,3,4,5,6,7,8,9,10]; average monthly disposable household income [44,45,46]; foreign direct investment (FDI) [47,48,49]; subsidies and grants [50,51,52,53,54,55,56,57]; electricity prices for household consumers [58,59,60]; share of renewable energy sources (RES) in total final energy consumption [6,151]; share of RES in final energy consumption for heating and cooling [152,153]; and share of RES in final energy consumption in transport [154,155]. Social indicators reflect societal welfare and broader socioeconomic conditions. These include the unemployment rate [70,71,72]; labor force participation [70,71]; employment levels [70,71,72]; poverty risk level [78]; inability to pay bills on time [78]; inability to adequately heat homes [59,78]; healthcare expenditure [73,74,75,76,177]; and education levels [64,65,66,67,68,69]. Environmental indicators focus on ecological sustainability and the environmental consequences of energy systems. These include air pollutants emitted [85,86,87]; greenhouse gas emissions [12,13,14,15,16,17,18,19,20,21,22,84]; water consumption for energy production [88,89,90]; municipal waste recycled [91,92,93]; and hazardous waste generated [94,95].
Next, the analysis shifts from the determinants of renewable energy technology deployment to dimensions of societal welfare. Drawing on insights from the scientific literature [29,30,31,32,33,34,35,36,37,38,39,40,41,42,43], the study adopts the Lithuanian Quality of Life Index (LQLI) as the primary framework for assessing welfare impacts. The LQLI structure captures six key dimensions (material living conditions; entrepreneurship and business competitiveness; health services; educational services; demography, civic and social engagement; and public infrastructure, quality of the living environment, and safety) each measured through a set of quantitative indicators (see Table 4).
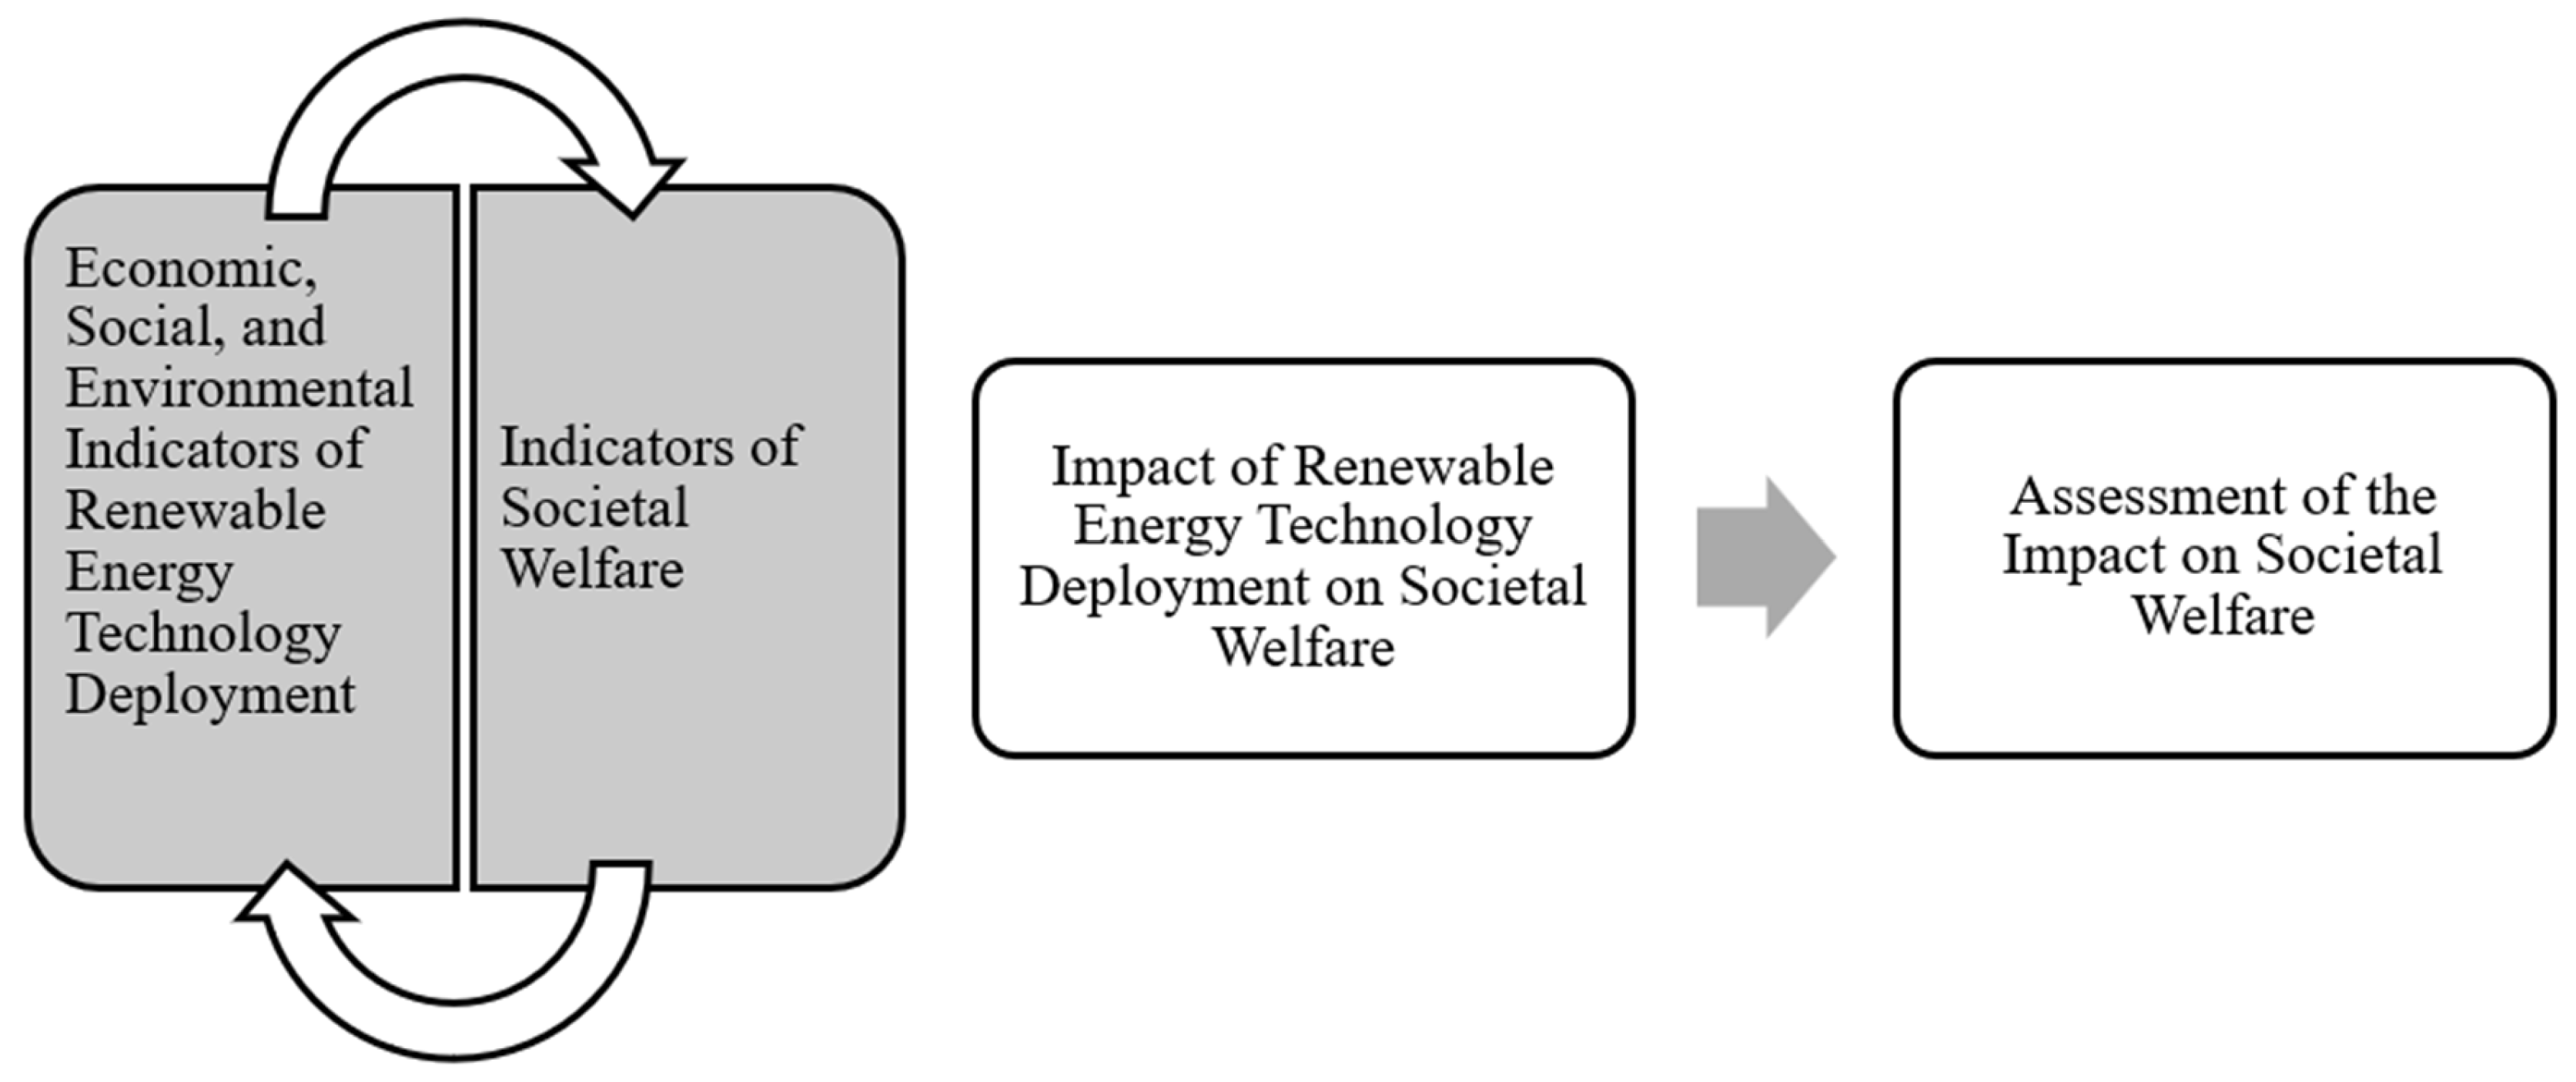
Building on the theoretical and empirical insights discussed above, the study integrates two sets of indicators—those representing the deployment of renewable energy technologies and those defining societal welfare—into a unified analytical framework. The conceptual structure of the research is illustrated in Figure 1.
The framework illustrates the analytical process used to evaluate the relationship between renewable energy technology deployment and societal welfare. Economic, social, and environmental indicators of renewable energy deployment are examined in relation to indicators of societal welfare, with the resulting relationships assessed for their strength and statistical significance. In this way, internationally established determinants of renewable deployment are operationalized through Lithuanian data and linked to a nationally developed quality-of-life index, thereby tightening the connection between the theoretical background and the subsequent empirical analysis.

2.2.5. Summary of the Literature and Research Gap

The previous sections have outlined the relationship between renewable energy technology deployment and societal welfare from four interrelated perspectives: (i) the key economic, social, and environmental determinants of renewable energy technology deployment; (ii) the conceptualization and multidimensional measurement of societal welfare; (iii) the main methodological approaches used to link renewable energy indicators with welfare outcomes; and (iv) the specific indicator systems employed to operationalize both renewable energy deployment and societal welfare in empirical research. Overall, the literature shows that economic capacity, social acceptance, and environmental pressures jointly shape the pace and direction of renewable energy deployment, while societal welfare is increasingly assessed through composite, multidimensional indices that integrate objective and, where possible, subjective indicators.
Despite this progress, several limitations of existing studies can be identified. First, many analyses investigate the determinants of renewable energy deployment without explicitly tracing how these determinants translate into broader welfare outcomes; conversely, studies on quality of life and societal welfare seldom incorporate detailed measures of renewable energy deployment among their explanatory factors. As a result, the channels through which renewable energy technologies affect different dimensions of welfare remain only partially specified. Second, empirical work often relies on aggregate national indicators such as GDP, overall energy use, or general sustainability indices, paying less attention to multidimensional welfare frameworks and to how renewable energy deployment may differentially affect specific domains such as material living conditions, entrepreneurship, health, education, or local environmental quality. Third, evidence for smaller, open economies in Central and Eastern Europe—including Lithuania—is still relatively scarce, and studies rarely exploit context-specific welfare indices that reflect national institutional and socio-economic particularities. Fourth, although a range of econometric techniques has been employed, much of the existing research focuses either on environmental outcomes (e.g., emissions) or on macroeconomic aggregates, while comprehensive models that jointly consider economic, social, and environmental indicators of renewable deployment alongside disaggregated welfare dimensions remain limited.
This study seeks to address these gaps and thereby underscores its innovation and necessity. By integrating economic, social, and environmental indicators of renewable energy technology deployment with a multidimensional measure of societal welfare based on the Lithuanian Quality of Life Index (LQLI), the research establishes an explicit analytical link between the determinants of renewable deployment and six core welfare dimensions: material living conditions; entrepreneurship and business competitiveness; health services; educational services; demography, civic and social engagement; and public infrastructure, living environment, and safety. The use of a nationally grounded quality-of-life framework enables a more nuanced assessment of how renewable energy deployment is associated with specific societal outcomes, rather than with aggregate welfare proxies alone. Furthermore, by applying an indicator-based econometric approach to the Lithuanian context, the study contributes context-specific evidence to the international literature and provides policymakers with a structured, empirically supported framework for evaluating the societal implications of renewable energy transitions.

3. Results

This chapter operationalizes the conceptual framework developed in Section 2.2 (Figure 1) by empirically examining how economic, social, and environmental determinants of renewable energy technology deployment relate to different dimensions of societal welfare in Lithuania.

3.1. Research Motivation and Econometric Framework

Although renewable energy initiatives are increasingly prevalent worldwide, evidence on their distributional and multidimensional welfare impacts remains limited—a gap this study seeks to address. Building on the theoretical framework in Section 2.2 and Figure 1, the empirical analysis focuses on how three groups of renewable energy technology (RET) deployment determinants—economic, social, and environmental—are associated with six dimensions of societal welfare in Lithuania (material living conditions; entrepreneurship and business competitiveness; health services; educational services; demography, civic and social engagement; and public infrastructure, living environment and safety).
To formalizme this relationship, a set of linear regression models of the following form is specified:
Y d , t = β 0 + β 1 X t E C O N + β 2 X t S O C + β 3 X t E N V + ε d , t ,
where Y d , t   denotes the standardized composite indicator for welfare dimension d   in year t , and X t E C O N , X t S O C , and X t E N V are composite measures of the economic, social, and environmental determinants of RET deployment, respectively. The coefficients β 1 , β 2 , and β 3   capture the marginal contribution of each factor group to changes in the corresponding welfare dimension, while ε d , t   is the random error term.
Because the individual indicators within each factor group are highly correlated, they are first standardized (z-scores) and then aggregated into composite indices. In constructing these composite indices, equal weighting of the standardized indicators within each group was applied instead of data-driven weighting schemes (e.g., principal component analysis or factor analysis). This choice reflects three considerations. First, the very short time series (2020–2024) and single-country design provide too few degrees of freedom for stable estimation of PCA or factor loadings; any data-driven weights would likely be highly sample-specific and sensitive to small perturbations. Second, equal weighting preserves transparency and comparability across determinant groups and welfare dimensions, which is important for policy interpretation in a national context. Third, the indicator-level correlation analysis reported in Section 3.3, Section 3.4 and Section 3.5 already exploits the detailed variation in individual variables, while the composite indices serve as parsimonious summaries for the multivariate regressions. For these reasons, equal weighting is viewed as a pragmatic and conservative choice for this exploratory, small-sample setting. This aggregation reduces multicollinearity and allows the regression coefficients to be interpreted as the change in the welfare dimension (in standard deviations) associated with a one-standard-deviation change in the corresponding determinant group, holding the other groups constant. Positive coefficients indicate that higher levels of the determinant group are associated with better welfare outcomes, whereas negative coefficients indicate the opposite.
Before estimating the regression models, a preliminary Pearson correlation analysis is conducted between the composite determinant groups and welfare dimensions, as well as between the individual indicators within each block. Given the standardized data and small-sample setting, the correlations are interpreted using the following thresholds: r < 0.3 —weak relationship; 0.3 r < 0.7 —moderate; r 0.7 —strong. This step provides an initial overview of the direction and strength of associations and helps to identify potential channels through which RET deployment may influence societal welfare.
To ensure that the use of parametric methods is appropriate, the normality of all indicators is first tested using the Shapiro–Wilk test, which is particularly suitable for small samples. The results (p > 0.05 for all variables) indicate no significant deviations from normality, supporting the use of Pearson correlations and ordinary least squares (OLS) regression. For the regression models, key OLS assumptions are additionally assessed: heteroskedasticity is examined using the Breusch–Pagan test (p > 0.05 indicates constant residual variance), autocorrelation is assessed with the Durbin–Watson statistic (values around 2 indicate independent residuals), and multicollinearity is evaluated using tolerance and variance inflation factor (VIF) metrics (Tolerance > 0.10, VIF < 5). The detailed diagnostic results are reported in Section 3.7 and Table 5.

3.2. Data Collection and Analysis

Following the specification of the econometric framework in Section 3.1, this subsection describes the data sources, time coverage and construction of the composite indicators used in the analysis. To investigate these effects, a comprehensive panel dataset spanning Lithuania from 2020 to 2024 was constructed, drawing on official and publicly accessible data from the Lithuanian Department of Statistics, the Environmental Protection Agency, and the Transport Competence Agency. This five-year timeframe emphasizes recent developments in the Lithuanian energy transition while ensuring consistent comparability across indicators and institutions. Data analysis was performed using IBM SPSS Statistics for Windows, Version 22.0. The resulting dataset is an annual, macro-level time-series for a single country, consisting of five yearly observations for Lithuania (2020–2024). Each observation (country–year) is described by a set of aggregated indicators grouped into three RET determinant blocks (economic, social, environmental) and six societal welfare dimensions. Economic determinants include, for example, GDP per capita, average disposable household income, foreign direct investment per capita, material (capital) investments, subsidies and grants for economic development and environmental protection, as well as three indicators capturing the intensity of renewable energy deployment: the share of renewables in gross final energy consumption, the share of renewables in final energy consumption for heating and cooling, and the share of renewables in final energy consumption in transport. Environmental determinants cover indicators such as pollutants emitted into the atmosphere from stationary sources, greenhouse gas emissions, water used for energy purposes, municipal waste recycling, hazardous waste, and ambient air pollution from stationary sources. Social determinants comprise labour-market and human-capital indicators (employment, labour force, unemployment rate, number of educated persons) and social risk measures (risk of poverty, arrears on financial obligations, inability to adequately heat the home). Societal welfare is captured by the six dimensions of the Lithuanian Quality of Life Index (LQLI), including material living conditions, entrepreneurship and business competitiveness, health services, educational services, demography, civic and social engagement, and public infrastructure, living environment and safety. These indicators are compiled from the official databases of the three institutions mentioned above and the national LQLI system.

Renewable Energy Technologies and Their Representation in the Dataset

In the Lithuanian context, renewable energy technologies (RETs) deployed over 2020–2024 are dominated by onshore wind power and solar photovoltaic (PV) in the electricity sector [133,144], solid biomass and biogas (particularly in district heating and individual heating systems) in the heating and cooling sector [134,156], and biofuels and renewable electricity in the transport [132,178,179]. Smaller contributions come from hydropower and other emerging technologies (e.g., heat pumps and waste-to-energy) [180], which are fully integrated into national renewable energy statistics and policy frameworks [162,180,181].
In this study, the term “renewable energy technologies” (RETs) refers to the set of technologies that contribute to Lithuania’s official renewable energy statistics. These include onshore wind and solar photovoltaic (PV) installations, hydropower plants, biomass- and biogas-based electricity and heat generation, renewable energy used in district heating, and renewable fuels in the transport sector. The indicators used in the empirical analysis—such as the shares of renewables in gross final energy consumption, in final energy for heating and cooling, and in final energy consumption for transport—therefore capture the combined deployment of these technologies rather than their individual effects. Due to data and sample-size constraints, the regression models are specified in terms of these aggregate renewable energy indicators, which represent the overall scale and intensity of RET deployment in Lithuania over 2020–2024.
Since the analyzed indicators were measured on different scales (e.g., thousands, millions, percentages), all variables were standardized using z-scores prior to conducting the data analysis. Standardization also facilitates the aggregation of indicators into composite indices and the interpretation of regression coefficients in standard-deviation units. Subsequently, the standardized indicators were aggregated into composite categories corresponding to the factor groups and associated indicators defined in the previous section. Before aggregating variables into composite categories, the normality of all analyzed indicators was assessed using the Shapiro–Wilk test, which is particularly suitable for small samples. The results indicated that none of the variables significantly deviated from normality (p > 0.05), allowing the use of subsequent statistical methods based on parametric tests. Once the composite indicator groups for renewable energy technologies (RET) deployment and society’s welfare were established, the study began with a correlation analysis. Given that normality held (Shapiro–Wilk p > 0.05), Pearson’s correlation coefficient was used to examine links between the categories of factors shaping RET deployment and social welfare. Although Spearman’s rank correlation is often recommended for small samples or non-normal data, all indicators were found to be approximately normally distributed (Shapiro–Wilk p > 0.05), and the very small number of annual observations (T = 5) was expected to substantially reduce the statistical power of non-parametric measures. For this reason, Pearson correlations are used primarily as descriptive indicators of linear association in an exploratory setting and are interpreted in broad bands of strength rather than as precise causal effects. When assessing correlation strength, the following criteria were applied: r < 0.3—weak relationship; r = 0.3–0.6—moderate; r = 0.7–1—strong. These bivariate results serve as a diagnostic step and are complemented by the multivariate regression models discussed in Section 3.7. The regression model was deemed statistically significant when the p-value was less than 0.05, indicating that at least one independent variable included in the model had a statistically reliable effect on the dependent variable—societal welfare. The coefficient of determination (R2) showed the share of variance in societal welfare indicators explained by the variables related to the deployment of renewable energy resources. The higher the R2 value, the more the examined economic, social, and environmental factors contribute to explaining the level of societal welfare in the context of renewable energy.

3.3. Correlations Between Economic RET Indicators and Societal Welfare Indicators

  • Material living conditions
First, a correlation analysis of economic and material indicators was conducted to determine whether statistically significant relationships exist between economic measures and aspects of material living conditions. The strongest and consistently positive links were found between macroeconomic indicators and material living conditions: GDP per capita is very strongly associated with net wages (r = 0.983; p = 0.003; significant), the employment share (r = 0.998; p < 0.001; significant), and residential floor area (r = 0.990; p = 0.001; significant). Similar magnitudes were observed for disposable household income—with wages (r = 0.978; p = 0.004; significant), employment (r = 0.980; p = 0.003; significant), and residential floor area (r = 0.993; p = 0.001; significant)—as well as for foreign direct investment per capita (wages: r = 0.986; p = 0.002; employment: r = 0.997; p < 0.001; residential floor area: r = 0.992; p = 0.001; all significant). Subsidies and grants also correlate positively with material indicators (e.g., employment share: r = 0.899; p = 0.038; significant). The intensity of renewable energy deployment is associated with better material living conditions. The share of renewables in gross final energy consumption correlates with wages (r = 0.982; p = 0.003; significant), employment (r = 0.944; p = 0.016; significant), and residential floor area (r = 0.966; p = 0.008; significant). The renewables share in final energy used for heating and cooling correlates with wages (r = 0.890; p = 0.043; significant) and residential floor area (r = 0.879; p = 0.049; significant). The renewables share in final energy consumption in transport correlates with wages (r = 0.913; p = 0.030; significant), employment (r = 0.966; p = 0.007; significant), and residential floor area (r = 0.942; p = 0.017; significant). Electricity prices for household consumers show positive but non-significant associations with these material indicators (e.g., employment: r = 0.846; p = 0.071; not significant). Overall, these results indicate that both general economic development and the extent of renewable energy deployment are statistically associated with improved material living conditions.
  • Entrepreneurial and business competitiveness
The relationships in this dimension are more mixed. GDP per capita is strongly and significantly positively correlated with foreign direct investment (FDI) per 1000 inhabitants (r = 0.998; p = 0.000) and with material (capital) investments per 1000 inhabitants (r = 0.980; p = 0.003). Its association with enterprise turnover per 1000 inhabitants is positive but not statistically significant (r = 0.840; p = 0.075). A similar pattern is observed for disposable household income, which is positively and significantly correlated with FDI per 1000 inhabitants (r = 0.977; p = 0.004) and material investments per 1000 inhabitants (r = 0.943; p = 0.016), while the relationship with enterprise turnover per 1000 inhabitants is positive but not significant (r = 0.856; p = 0.064). Likewise, FDI per capita shows significant positive correlations with FDI per 1000 inhabitants (r = 1.000; p = 0.000) and material investments per 1000 inhabitants (r = 0.977; p = 0.004), whereas its association with enterprise turnover per 1000 inhabitants is not significant (r = 0.872; p = 0.054). Subsidies and grants exhibit consistently significant relationships with the entrepreneurship/competitiveness indicators (e.g., with enterprise turnover per 1000 inhabitants: r = 0.915; p = 0.029). Renewable energy (RES) indicators are also linked to entrepreneurship: the RES share in gross final energy consumption is positively and significantly associated with FDI per 1000 inhabitants (r = 0.953; p = 0.012), material investments per 1000 inhabitants (r = 0.956; p = 0.011), and enterprise turnover per 1000 inhabitants (r = 0.944; p = 0.016). The RES share in final energy consumption for heating/cooling is significantly associated only with enterprise turnover per 1000 inhabitants (r = 0.880; p = 0.049). The RES share in final energy consumption for transport is positively and significantly associated with FDI per 1000 inhabitants (r = 0.971; p = 0.006) and material investments per 1000 inhabitants (r = 0.903; p = 0.036), while its relationship with enterprise turnover per 1000 inhabitants is not significant (r = 0.807; p = 0.099). Electricity price relationships in this block are not significant. Taken together, the results suggest that RES expansion is statistically associated with increased investment flows and, to a lesser extent, a larger scale of business activity.
  • Health services
No statistically significant relationships were identified for the health indicators. For example, the relationship between subsidies and mortality from non-communicable diseases is strongly negative but only approaches significance (r = −0.876; p = 0.051; not significant). The link between the RES share in final energy consumption for heating/cooling and mortality from non-communicable diseases (per 100,000 inhabitants) is also close to significance (r = −0.873; p = 0.053; not significant). Other relationships with mortality from non-communicable diseases (per 100,000 inhabitants) likewise remain not significant. Overall, this suggests that, over the period examined, associations between economic and RES indicators and health outcomes are not statistically reliable.
  • Educational services
For the education indicator (number of university and college students per 1000 inhabitants), relationships with economic and RES indicators are also not significant. For example: RES share in final energy consumption for transport (r = 0.828; p = 0.083; not significant), GDP per capita (r = 0.678; p = 0.208; not significant), disposable income (r = 0.750; p = 0.144; not significant). This indicates that, at least in the short term, the influence of RES and overall economic development on higher-education participation is not statistically demonstrated.
  • Demography, civic and social engagement
When analyzing overall natural population change and net migration, no statistically significant relationships with the economic RES indicators were found. For example: GDP and natural change (r = 0.614; p = 0.271; not significant); RES share in gross final consumption and net migration (r = 0.050; p = 0.937; not significant). The relationship between electricity prices and net migration is of medium strength (r = 0.760) but not significant (p = 0.136).
  • Public infrastructure, quality of the living environment, and safety
The indicator of pollutants emitted into the atmosphere from stationary sources shows consistently strong and statistically significant negative relationships with key economic and RES indicators: GDP per capita (r = −0.959; p = 0.010; significant), disposable household income (r = −0.936; p = 0.019; significant), FDI per capita (r = −0.942; p = 0.017; significant), subsidies/grants (r = −0.905; p = 0.035; significant), and the RES share in gross final energy consumption (r = −0.906; p = 0.034; significant). Relationships involving electricity prices and the RES shares in final energy consumption for heating/cooling and for transport with this pollution indicator remain not significant. These results can be interpreted to mean that economic progress and the overall scale of RES deployment are statistically associated with lower emissions from stationary sources.

3.4. Correlations Between Social RET Indicators and Societal Welfare Indicators

  • Material living conditions
Strong and statistically significant positive relationships were identified between social indicators of labor-market participation and material living conditions. Total employment is very strongly associated with net wages (r = 0.985; p = 0.002; significant), the employment share among the working-age population (r = 0.999; p = 0.000; significant), and dwelling space per capita (r = 0.995; p = 0.000; significant). The labor force also shows a strong positive association with these material-condition metrics (with net wages: r = 0.933; p = 0.021; significant; with the employment share: r = 0.906; p = 0.034; significant; with dwelling space: r = 0.923; p = 0.025; significant). The number of educated persons correlates strongly and significantly with the same material metrics (e.g., with net wages: r = 0.972; p = 0.006; significant). Meanwhile, the unemployment rate, risk of poverty, arrears on financial obligations, and inability to adequately heat the home often have medium-to-strong negative correlations with material conditions but are not statistically significant (e.g., unemployment rate and net wages: r = −0.491; p = 0.401; not significant).
  • Entrepreneurial and business competitiveness
In this dimension, employment and the labor force are linked to investment and capital flows. Total employment correlates very strongly and significantly with FDI per 1000 inhabitants (r = 0.999; p = 0.000; significant) and with material (capital) investments per 1000 inhabitants (r = 0.975; p = 0.005; significant). The labor force also shows positive and significant associations with FDI per 1000 inhabitants (r = 0.891; p = 0.043; significant) and with material investments per 1000 inhabitants (r = 0.934; p = 0.020; significant). The number of educated persons is strongly and significantly associated with FDI per 1000 inhabitants (r = 0.954; p = 0.012; significant) and with material investments per 1000 inhabitants (r = 0.979; p = 0.004; significant). Enterprise turnover per 1000 inhabitants is statistically significantly related only to arrears on financial obligations, with a strong negative association (r = −0.916; p = 0.029; significant). Other social indicators (e.g., unemployment rate, risk of poverty, inability to adequately heat the home) generally show non-significant correlations with entrepreneurship metrics.
  • Health services
None of the social indicators are statistically significantly associated with health-service metrics. For example, employment correlates moderately negatively with mortality from non-communicable diseases (r = −0.605; p = 0.280; not significant). Health expenditures (% of GDP) also show a strong negative relationship with health-service utilization, but this association only approaches significance (r = −0.854; p = 0.066; not significant).
  • Educational services
The number of university and college students per 1000 inhabitants shows no statistically significant relationships with social indicators. Closest to the significance threshold are a strong negative relationship with the unemployment rate (r = −0.857; p = 0.064; not significant) and a medium positive relationship with health expenditures (% of GDP) (r = 0.775; p = 0.123; not significant). Other links (with employment, labor force, risk of poverty, arrears on financial obligations, inability to adequately heat the home, and population education) are also not significant.
  • Demography, civic and social engagement
No significant correlations were found for natural population change and migration flows. For example, the labor force correlates strongly and positively with natural change but only approaches significance (r = 0.853; p = 0.066; not significant), while other social indicators show weak-to-moderate, but not significant, relationships with both demographic indicators (e.g., employment and the number of arrivals/departures: r = 0.322; p = 0.597; not significant).
  • Public infrastructure, quality of the living environment, and safety
Ambient air pollution from stationary sources decreases statistically significantly as labor-market participation strengthens and the number of educated residents increases. The relationships are very strong and significant: with employment (r = −0.952; p = 0.013; significant), with the labor force (r = −0.990; p = 0.001; significant), and with the number of educated persons (r = −0.995; p = 0.000; significant). Other social indicators (unemployment rate, risk of poverty, arrears on financial obligations, inability to adequately heat the home, health expenditures) were not significantly associated with this pollution indicator.

3.5. Correlations Between Environmental RET Indicators and Societal Welfare Indicators

  • Material Living Conditions
Environmental indicators were mostly not significantly associated with material living conditions metrics. The amount of pollutants emitted into the atmosphere correlates negatively with net wages (r = −0.591; p = 0.294; not significant), with the employment share (r = −0.721; p = 0.169; not significant), and with dwelling space per capita (r = −0.660; p = 0.225; not significant). Similarly for GHG emissions: with net wages (r = −0.571; p = 0.314; not significant), with the employment share (r = −0.443; p = 0.455; not significant), and with dwelling space (r = −0.468; p = 0.427; not significant). Water used for energy purposes shows weak-to-moderate negative but non-significant links (with wages: r = −0.511; p = 0.379; with the employment share: r = −0.383; p = 0.524; with dwelling space: r = −0.430; p = 0.470). The share of municipal waste recycled and hazardous waste show no relationships with material indicators (e.g., recycling and the employment share: r = 0.034; p = 0.956; not significant).
  • Entrepreneurial and business competitiveness
There are also almost no significant relationships in this block. The amount of pollutants emitted into the atmosphere is moderately negatively associated with FDI per 1000 inhabitants (r = −0.732; p = 0.159; not significant), material investments per 1000 inhabitants (r = −0.584; p = 0.301; not significant), and enterprise turnover per 1000 inhabitants (r = −0.498; p = 0.393; not significant). GHG emissions show a strongly negative relationship, close to significance, with enterprise turnover per 1000 inhabitants (r = −0.860; p = 0.062; not significant), while links with other entrepreneurship indicators are not significant (e.g., with material investments per 1000 inhabitants: r = −0.586; p = 0.299). Water use for energy, recycling, and hazardous waste also correlate non-significantly with entrepreneurship metrics (e.g., water used for energy purposes and material investments per 1000 inhabitants: r = −0.549; p = 0.338).
  • Health services
The only statistically significant association in the entire environmental block is between pollutants emitted into the atmosphere and health-service utilization: the relationship is very strong and positive (r = 0.913; p = 0.030; significant), which may indicate a greater need for hospital-based services as air pollution increases. Other links in the health block are not significant (e.g., GHG emissions and mortality from non-communicable diseases: r = 0.721; p = 0.169; not significant; water used for energy purposes and health-service utilization: r = −0.461; p = 0.435; not significant).
  • Educational services
The number of university and college students per 1000 inhabitants is not significantly associated with environmental indicators. Closest to significance is a strong negative relationship with pollutants emitted into the atmosphere (r = −0.872; p = 0.054; not significant). Other links, including with GHG emissions (r = −0.219; p = 0.724) and municipal waste recycling (r = −0.534; p = 0.354), are also not significant.
  • Demography, civic and social engagement
No statistically significant relationships were identified. Natural population change shows a strongly negative relationship, close to significance, with water used for energy (r = −0.866; p = 0.058; not significant). Net migration is strongly negatively associated with pollutants emitted into the atmosphere but not significantly (r = −0.706; p = 0.183), while relationships with other environmental indicators are weak to moderate and not significant (e.g., GHG emissions and net migration: r = 0.225; p = 0.716).
  • Public infrastructure, quality of the living environment, and safety
Ambient air pollution from stationary sources (tons) is not significantly associated with other environmental indicators: with pollutants emitted into the atmosphere (r = 0.516; p = 0.374; not significant), with GHG emissions (r = 0.372; p = 0.537; not significant), with water used for energy (r = 0.615; p = 0.269; not significant), with municipal waste recycling (r = −0.295; p = 0.630; not significant), and with hazardous waste (r = 0.284; p = 0.644; not significant).

3.6. Correlation Analysis Summary

Pearson correlation analysis for 2020–2024 showed that renewable energy (RES) intensity indicators—specifically the RES share in final energy consumption and in transport—are strongly and positively associated with key economic well-being indicators, including wages, GDP per capita, foreign direct investment, and average disposable income (r = 0.90–0.99; p < 0.05) (see Appendix A, Table A1). Positive associations were also recorded with usable dwelling space and employment indicators (r = 0.94–0.999; p < 0.05). In the entrepreneurship and competitiveness group, material (capital) investments, FDI, and enterprise turnover generally correlate positively with RES and income indicators (r = 0.90–0.99; p < 0.05), suggesting that higher RES penetration coincides with stronger investment flows and larger-scale business activity. Social indicators (the number of educated residents aged 25–64, the labor force, and employment) also correlate positively with material economic well-being and investment indicators (r = 0.90–0.99; p < 0.05). From an environmental quality perspective, air-pollution indicators correlate negatively with GDP, income, FDI, and education (r = −0.96 to −0.90; p < 0.05), and higher pollution is associated with worse health outcomes (r = 0.91; p = 0.030) (see Figure 2). However, these patterns are correlational and based on a short macro time series; they should not be interpreted as demonstrating causal relationships, as common trends or omitted factors (such as overall economic development) may jointly influence both RET deployment and welfare indicators.
Heatmap of Pearson r (mean correlation) between RET determinants (columns: RET economic determinant; RET environmental determinant; RET social determinant) and societal welfare dimensions (rows: Material living conditions; Entrepreneurship and competitiveness; Public infrastructure, living environment and safety; Health services) for 2020–2024. Each cell shows the average Pearson r across all RET-indicator and welfare-indicator pairs within that category; higher absolute values indicate stronger associations. Notably, the RET environmental determinant aligns with health services through higher hospital-service utilization when air pollution increases (e.g., pollutants and health-service utilization: r = 0.913, p = 0.030), and the RET economic determinant shows strong negative average correlations with public infrastructure, living environment and safety (Figure 2).

3.7. Linear Regression Analysis

Building on the econometric specification outlined in Section 3.1, multiple linear regression was employed to evaluate how renewable energy technology (RET) deployment determinants relate to societal welfare dimensions. Aggregated factor categories were used instead of individual indicators that were highly correlated with each other (economic, social, and environmental) which reduced multicollinearity and yielded more reliable coefficient estimates. Model assumptions were checked using the Breusch–Pagan test for heteroskedasticity and the Durbin–Watson test for autocorrelation.
  • Regression Models Diagnostics and Exceptions
When evaluating the fit of the regression models assessing the impact of RET deployment determinants on societal welfare, diagnostic tests were applied to verify compliance with the classical linear regression assumptions. Before conducting the regression analysis, the presence of heteroskedasticity (non-constant residual variance) and autocorrelation (dependence among residuals) was assessed. Heteroskedasticity was tested using the Breusch–Pagan test (p > 0.05 indicates no violation of the assumptions), and autocorrelation was tested using the Durbin–Watson statistic (values around 2 indicate independent residuals; an acceptable range is approximately 1.5 < DW < 2.5).
Overall result. Most of the estimated models satisfied the classical OLS assumptions: residual variance was approximately constant (Breusch–Pagan p > 0.05) and residuals were independent (Durbin–Watson values were close to 2, within the acceptable range of about 1.5–2.5).
Exceptions. Significant assumption violations were observed in two models:
(i)
Health services model: heteroskedasticity (Breusch–Pagan p = 0.045 < 0.05) and strong negative autocorrelation (Durbin–Watson DW = 3.919 > 3);
(ii)
Demography, civic and social engagement model: heteroskedasticity (Breusch–Pagan p = 0.031 < 0.05) and very strong negative autocorrelation (Durbin–Watson DW = 4.739 > 3).
Implications and recommendations. These violations do not rule out relationships between variables, but they distort inference: OLS standard errors become unreliable, and the resulting p-values and confidence intervals are misleading. Therefore, coefficient interpretations in these two models should be treated with caution and not emphasized until robust or alternative specifications are applied (e.g., robust standard errors for heteroskedasticity; a more suitable dynamic/transformed model or HAC corrections for dependent residuals). If reliable corrections cannot be implemented, these models should be discarded. In the final version of the study, the health services and demography, civic and social engagement models were excluded due to significant assumption violations (heteroskedasticity and strong negative autocorrelation).
The same regression-model diagnostic tests were conducted for the other dimensions of societal welfare: material living conditions; entrepreneurial and business competitiveness; educational services; public infrastructure, quality of the living environment, and safety (Table 5).
  • Regression Models
The regression analysis, using aggregated economic, social, and environmental factor categories, was used to assess how RET deployment determinants relate to different dimensions of societal welfare. Diagnostic tests confirmed compliance with classical OLS assumptions in four models (material living conditions; entrepreneurial and business competitiveness; educational services; public infrastructure, quality of the living environment and safety). By contrast, the health and demography and civic engagement models were excluded from the final specification due to heteroskedasticity and strong negative autocorrelation.
The regression equations estimated in this study indicate the magnitude and direction (positive or negative) of each factor category’s contribution to changes in the targeted welfare dimension. This enabled the identification of which determinants exerted the greatest statistical impact on different areas of societal welfare and the extent to which they contributed to overall improvements or declines in welfare.
Regression models were formed based on the linear regression formula:
Y = β 0 + β 1 X 1 + β 2 X 2 + + β k X k + ε ,
In this study X 1 , X 2 , X 3 correspond to the aggregated categories of economic ( X E C O N ), social ( X S O C ) and environmental ( X E N V ) determinants, respectively. This aggregation was chosen to reduce multicollinearity and obtain more reliable coefficient estimates.
Multicollinearity was assessed using tolerance and VIF metrics (acceptable thresholds: Tolerance > 0.10, VIF < 5). Given the strong pairwise correlations among individual economic indicators documented in Section 3.3, Section 3.4 and Section 3.5, multicollinearity is treated as a substantive concern and is addressed primarily at the model-specification stage by aggregating highly correlated indicators into three standardized determinant indices (economic, social, environmental). The combination of indicator-level correlation patterns and block-level VIF/tolerance values suggests that the main economic effect is unlikely to be driven solely by multicollinearity; however, given the very small sample size and the strength of correlations within the economic block, multicollinearity cannot be ruled out and remains an important limitation. Consequently, the regression coefficients are interpreted in terms of their sign and relative magnitude rather than as precise point estimates, and more advanced sensitivity analyses (e.g., penalized regression or alternative variable-selection schemes) are regarded as an avenue for future research once longer time series or richer panel data become available. Separate models were estimated for each welfare dimension: material living conditions; entrepreneurial and business competitiveness; educational services; public infrastructure, quality of the living environment and safety.
Variable definitions and interpretation:
  • Y —dependent variable (the specific dimension of societal welfare).
  • X E C O N   , X S O C , X E N V —aggregated economic, social, and environmental factor groups (composite indicators), standardized to z-scores.
  • β 0 constant; the predicted value of Y   when all factors are at their average level (X = 0).
  • β j regression coefficients indicating the direction (sign) and magnitude (strength) of each factor’s effect.
  • ε —random error.
Note on standardization. Because the independent variables X are standardized (z-scores), X = 0 represents the average level of the factors, and each coefficient β j   is interpreted as the predicted change in Y when the corresponding factor increases by one standard deviation, holding the other factors constant. A positive β j   value implies a positive effect; a negative β j   value implies a negative effect. Higher β j values indicate stronger effects.

3.7.1. Results by Welfare Dimension

  • Material living conditions
The results of the regression analysis showed that economic determinants have a statistically significant positive association with material living conditions (B = 0.960; p = 0.038). The coefficient sign is positive and the p-value is less than the 0.05 significance level, so it can be concluded that economic factors have a statistically significant positive association with material living conditions. The coefficient for social determinants is also positive (B = 0.175), but the p-value (p = 0.325) exceeds the 0.05 significance level. This indicates that social factors do not have a statistically significant association with changes in material living conditions. Although the direction of the association is positive, it is not statistically reliable. The coefficient for environmental determinants is positive (B = 0.348), but, as in the case of social factors, their p-value (p = 0.369) is greater than 0.05, so the association between environmental factors and material living conditions is considered statistically insignificant.
Model adequacy. The model shows an exceptionally high coefficient of determination (R2 = 0.999), indicating that it explains 99.9% of the variance in material living conditions. The ANOVA confirms overall model significance (F = 296.280; p = 0.043), implying that the set of independent variables jointly exerts a statistically significant effect on the dependent variable.
Multicollinearity. Indicators are within acceptable limits: VIFs = 2.676; 1.054; 2.760 (all < 5) and tolerance = 0.374; 0.949; 0.362 (all > 0.10). This suggests no strong multicollinearity and only modest interdependence among predictors. Details are provided in Table 6.
Model summary: (R2 = 0.999); ANOVA: (F = 296.280), (p = 0.043). Diagnostics. BP (p = 0.125) indicates that homoskedasticity holds; DW (=1.919) indicates that residual independence holds. Note. BP (p > 0.05) indicates homoskedasticity; DW (approximately 2; acceptable range ~1.5–2.5) indicates independent residuals.
In summary, RET economic factors have a statistically significant positive association with material living conditions, while the associations of social and environmental factors, although positive, are not statistically significant. The model assumptions are essentially satisfied, so the results of the regression analysis can be considered reliable.
  • Entrepreneurial and business competitiveness
The associations of all three factors are statistically significant, but differ in direction. Economic factors have a positive and statistically significant association with entrepreneurial and business competitiveness (B = 0.419; p = 0.045). The positive coefficient indicates that higher economic indicators are associated with increased entrepreneurship and business competitiveness. The coefficient of environmental indicators has a negative, statistically significant coefficient for entrepreneurship and business competitiveness (B = −1.129, p = 0.010), indicating that higher environmental scores are associated with lower values on this welfare dimension.
Model adequacy. (R2 = 0.976), indicating that the model explains 97.6% of the variance in the entrepreneurial and business competitiveness dimension. ANOVA: (F = 26.775), (p = 0.044), confirming overall model significance.
Multicollinearity. Diagnostics are acceptable (VIF < 5, tolerance > 0.10), indicating no serious multicollinearity. Details are provided in Table 7.
Model summary. (R2 = 0.976); ANOVA: (F = 26.775), (p = 0.044). Diagnostics. BP (p = 0.325) indicates that homoskedasticity holds; DW (=1.817) indicates that residual independence holds. Note. BP (p > 0.05) indicates homoskedasticity; DW (approximately 2; acceptable range ~1.5–2.5) indicates independent residuals.
In sum, all analyzed RET factors have a statistically significant association with the entrepreneurship and business competitiveness dimension: the economic and social factors are positive, while the environmental factor is negative.
  • Educational services
The significant positive association with the educational well-being dimension is confirmed by the economic factors coefficient (B = 0.434; p = 0.015). The positive sign indicates that increases in economic indicators are associated with higher educational well-being. Meanwhile, the associations of social (B = −0.411; p = 0.092) and environmental (B = 0.050; p = 0.449) factors are statistically insignificant. Therefore, both social and environmental indicators do not show a statistically significant association with the education dimension.
Model adequacy. The coefficient of determination is very high (R2 = 0.999), indicating the model explains 99.9% of the variance in education dimension. ANOVA: F = 229.500; p = 0.048, confirming overall model significance.
Multicollinearity. Diagnostics indicate no serious multicollinearity: VIFs = 2.636; 1.454; 2.640 (all < 5) and tolerance = 0.371; 0.932; 0.357 (all > 0.10). Details are provided in Table 8.
Model summary. (R2 = 0.999); ANOVA: (F = 229.500), (p = 0.048). Diagnostics. BP (p = 0.155) indicates that homoskedasticity holds; DW (=1.829) indicates that residual independence holds. Note. BP (p > 0.05) indicates homoskedasticity; DW (approximately 2; acceptable range ~1.5–2.5) indicates independent residuals.
In this model, only the economic RET factors have a statistically significant positive association with educational well-being. The associations of the social and environmental factors are not statistically significant.
  • Public infrastructure, quality of the living environment and safety
Economic (B = 0.649, p = 0.015) and social (B = 0.548, p = 0.029) factors have statistically significant positive associations: increases in these factors are associated with improvements in public infrastructure and environmental quality and safety. By contrast, environmental factors have a statistically significant negative association (B = −1.506, p = 0.048); their increase is associated with a decline in public infrastructure and environmental quality and safety.
Model adequacy. The coefficient of determination is high (R2 = 0.908), indicating the model explains 90.8% of the variance. ANOVA: F = 114.562; p = 0.018, confirming overall model significance.
Multicollinearity. No serious issues: VIFs = 2.676; 1.054; 2.760 (all < 5) and tolerance = 0.644; 0.479; 0.562 (all > 0.10). Details are provided in Table 9.
Model summary. (R2 = 0.908); ANOVA: (F = 114.562), (p = 0.018). Diagnostics. BP (p = 0.214) indicates that homoskedasticity holds; DW (=1.623) indicates that residual independence holds. Note. BP (p > 0.05) indicates homoskedasticity; DW (approximately 2; acceptable range ~1.5–2.5) indicates independent residuals.
Overall, all RET factors are significantly associated with public infrastructure, the quality of the living environment, and safety: the economic and social factors are positive; the environmental factor is negative.

3.7.2. Summary of the Regression Models

This section summarizes the key findings obtained from the regression analyses, highlighting the relative contribution of economic, social, and environmental factors to societal welfare in the context of renewable energy technology deployment. The regression analysis assessed how renewable energy technology (RET) deployment determinants affect multiple dimensions of societal welfare: material living conditions, entrepreneurial and business competitiveness, health services, education services, demography, civic and social engagement, as well as infrastructure, quality of the living environment and safety. To reduce multicollinearity, aggregated factor categories (economic, social, environmental) were modeled instead of individual, highly correlated indicators.
Breusch–Pagan and Durbin–Watson tests indicate that most models satisfy homoskedasticity and residual independence. Two models—the health and the demography and civic engagement dimensions—exhibited significant violations (heteroskedasticity and strong negative autocorrelation). Their interpretations should therefore be treated with caution; in the final analysis these two models were excluded.
Economic factors exhibit a statistically significant positive association in most models—specifically for material living conditions, entrepreneurship and business competitiveness, education services and public infrastructure, living-environment quality and safety. Social factors have heterogeneous effects: significantly positive for entrepreneurship and business competitiveness and public infrastructure, living-environment quality and safety, but insignificant for material living conditions and education services. Environmental factors are more often associated with statistically significant negative effects—especially for entrepreneurship and business competitiveness and public infrastructure, living-environment quality and safety—suggesting potential trade-offs or short-run costs in these areas.
The explanatory power of the models is very high (R2 = 0.908–0.999), and ANOVA tests confirm the overall significance of the models (p < 0.05). However, the models are estimated on only five annual observations (2020–2024) with three aggregated determinants (economic, social, environmental), so each specification has only one residual degree of freedom. Given the very short time series and the number of predictors, the resulting R2 values are likely to be inflated, which implies a substantial risk of overfitting; therefore, the reported R2 statistics should be interpreted as within-sample descriptive fit measures rather than evidence of strong out-of-sample predictive power. Overall, the results suggest that economic factors are the main positive drivers of changes in societal welfare dimensions, whereas social and environmental factors, although important, have a more complex and area-specific impact. Based on these findings, further conclusions and recommendations for welfare enhancement policies were formulated, taking into account the specificity of the identified factors and the direction of their influence. Nevertheless, given the observational nature of the data and the short time span, the estimated coefficients should be interpreted as conditional associations rather than definitive causal effects.

3.8. Robustness Analysis

Given the very short time span (2020–2024) and the high explanatory power of the models (R2 between 0.908 and 0.999), particular attention was paid to diagnostic checks and model selection in order to mitigate overfitting risks and assess the robustness of the results within the limits of the available data.
First, a set of classical OLS diagnostics was systematically applied. Normality of the underlying indicators was evaluated using the Shapiro–Wilk test; the results (p > 0.05 for all variables) indicated no significant deviation from normality and supported the use of Pearson correlations and linear regression. For the regression models, heteroskedasticity was tested using the Breusch–Pagan test and autocorrelation was tested using the Durbin–Watson statistic, and multicollinearity was assessed using tolerance and variance inflation factor (VIF) metrics. As reported in Table 5, the material living conditions, entrepreneurial and business competitiveness, educational services, and public infrastructure, living-environment quality and safety models satisfy the assumptions of homoskedastic and independent residuals and show acceptable multicollinearity levels (Tolerance > 0.10, VIF < 5). By contrast, the health and demography/civic engagement models clearly violated these assumptions, and they were therefore excluded from the final specification. This conservative exclusion of misspecified models is itself a robustness decision, as it prevents drawing inferences from statistically unreliable regressions.
Second, patterns of association were compared across two complementary approaches: bivariate Pearson correlations between indicators and composite groups, and multivariate regressions using aggregated economic, social, and environmental determinants. The directions of the coefficients in the retained regression models broadly mirror the patterns observed in the correlation analysis (e.g., strong positive links between economic determinants and material living conditions and entrepreneurship; negative links between environmental pressure and infrastructure/environmental quality). This convergence between simple and multivariate specifications increases confidence that the main findings are not driven by a single indicator or by a particular modelling choice.
Overall, these robustness considerations indicate that the reported associations are internally consistent across different statistical representations and are supported by standard diagnostic tests. At the same time, the small number of observations and the macro-level design mean that the results should be interpreted as indicative, not definitive, and further validation on longer time series or broader samples remains necessary.

4. Discussion

This study examined the relationships between aggregated economic, social, and environmental factors of renewable energy technology deployment and multiple dimensions of societal welfare. Two complementary strategies were used: (i) indicator-level correlations to map simple associations and (ii) regressions using composite indices to reduce multicollinearity. Throughout, these relationships are interpreted as statistical associations rather than causal effects, given the short time span, single-country setting, and the potential influence of unobserved confounders. The findings are consistent across both.

4.1. Economic and Social Dimensions of the RET–Welfare Nexus

Economic factors align positively with societal welfare outcomes across the board—most clearly for material living conditions; entrepreneurship/business competitiveness and for public infrastructure, living-environment quality/safety. The positive and statistically significant relationships observed between macroeconomic indicators (e.g., GDP, disposable income, FDI per capita) and material conditions metrics are consistent with international evidence linking renewable-energy deployment to broad socioeconomic outcomes. Empirical research shows that the expansion of renewable energy stimulates economic growth and employment while supporting industrial diversification and competitiveness. For instance, renewable energy deployment in Germany produced net-positive effects on GDP and employment without sacrificing growth [96], and across the EU-28, renewable consumption rose in tandem with per capita income growth [6]. Proença and Fortes [182] find that a 1% increase in renewable energy capacity is associated with a 0.48% rise in employment, highlighting the social and labour-market benefits of renewable expansion. Consistent results are reported by Li et al. [183], whose comprehensive review concludes that renewable energy deployment fosters economic development, strengthens governance quality, and promotes financial sector growth in emerging economies. Likewise, Le and Sarkodie [184] provide cross-country evidence that renewable and conventional energy use jointly contribute to economic growth in emerging economies, while greater reliance on renewables reduces environmental damage and reinforces long-run welfare improvements. These macroeconomic effects also translate into stronger entrepreneurship and business competitiveness, echoing findings from India and the MENA region where renewable-energy markets have attracted foreign investment and spurred innovation-based enterprise [70,97]. Further evidence from China shows that renewable energy investment creates nearly twice as many jobs per dollar as fossil fuel spending, underscoring its critical role in economic welfare and labor market development [185]. Improvements in infrastructure, environmental quality, and safety observed in the regressions were consistent with evidence that renewable energy deployment reduces pollution and strengthens institutional and physical infrastructure [98,186]. The positive association with educational services also appears in the regression results; however, because the correlations for education were weaker, this finding is regarded as tentative rather than definitive. More broadly, these patterns resonate with findings from other domains where financial and technological innovations are analyzed in relation to welfare outcomes, such as systematic reviews of cryptocurrency taxation regimes [175] and empirical studies of digital finance and household consumption [176] which likewise emphasize the role of regulatory and structural conditions in shaping distributional and welfare effects Overall, integration of these insights confirmed that renewable energy technology deployment was empirically consistent with the macroeconomic dynamics captured in the regressions: stronger economic performance was statistically associated with higher material living standards, greater business vitality, and improved infrastructural quality, thereby advancing multidimensional welfare outcomes.
The analysis reveals that social factors exhibit a heterogeneous relationship with welfare outcomes: they are positively associated with entrepreneurship/business competitiveness and public infrastructure, living-environment quality/safety, but show insignificant effects on material living conditions and education services. This mixed pattern suggests that social conditions may operate through channels, such as civic participation, institutional trust, and community engagement, which primarily influence collective and structural dimensions of welfare rather than household-level material indicators. Empirical research on renewable energy deployment and societal welfare reinforces this interpretation. Studies show that strong social capital, governance quality, and community involvement are essential for successful renewable energy transitions, which in turn bolster local economic activity and infrastructure. For instance, the research [186] demonstrated that regional civic capacity and institutional cooperation enhance renewable deployment and contribute to resilient public infrastructure. Cross-regional analyses further indicate that governance effectiveness, policy stability, and civic trust are major determinants of renewable expansion and its local welfare spillovers [187]. Likewise, political systems and lobbying structures were found to either promote or hinder renewable adoption, depending on institutional quality [188]. Similarly, in the MENA region, social and governance stability were found to significantly amplify the effectiveness of renewable investment and innovation, improving broader welfare outcomes [143]. By contrast, studies focusing on household or individual welfare indicators find weaker or inconsistent effects of social factors. For example, community cohesion and public participation tend to facilitate collective environmental and safety improvements, but their impact on income or educational attainment remains limited [189]. Recent global assessments of green energy transitions highlight that governance, institutional collaboration, and public participation remain crucial enablers of renewable deployment, mediating its welfare impacts across social and regional scales [190]. This aligns with finding that social conditions may not directly translate into better material living standards or education outcomes, but instead operate through relational and institutional channels that underpin the effective functioning of local economies, infrastructure, and public services. In summary, these results highlight that social cohesion and civic capacity are crucial complements to economic and technological drivers of welfare. While they may not directly affect individual material or educational outcomes, they play a pivotal role in shaping the collective conditions, such as infrastructure quality, environmental safety, and local entrepreneurship, that sustain long-term societal welfare.

4.2. Environmental Dimension of the RET–Welfare Nexus

Environmental factors tend to be negative for entrepreneurship/business competitiveness and for public infrastructure, living-environment quality/safety in the regressions, consistent with the correlation evidence linking higher pollution levels with worse local quality-of-life outcomes. In this interpretation, the negative coefficients were taken to reflect potential transition-related trade-offs rather than definitive causal impacts: environmental pressures and compliance costs may coincide with short-run frictions for firms and public infrastructure, even as longer-run benefits (e.g., lower emissions and cleaner air) accrue.
This interpretation is well supported by the literature on renewable energy deployment and environmental quality. Studies consistently find that while environmental degradation hampers welfare and business vitality, renewable energy investment mitigates these effects over time. For example, the study [144] show that renewable energy deployment significantly reduces pollution indicators in major economies (China, the U.S., and Germany), demonstrating that cleaner energy systems eventually enhance both environmental quality and social welfare. Consistent with this, large-scale modeling for the United States finds that renewable deployment yields significant climate and health co-benefits, with long-term gains outweighing short-term costs [191]. Similarly, Atalla et al. [192] found that greater renewable energy penetration contributes to improved consumer welfare by lowering the true cost of living and enhancing long-term well-being.
However, the short-term costs and adjustment dynamics associated with environmental compliance and infrastructure transformation are also well documented. Empirical analyses highlight that transitioning toward cleaner energy systems can temporarily constrain firm competitiveness and strain local public budgets due to the capital intensity of new environmental standards [142]. Similarly, Shadrina [148] notes that developing regions often face infrastructural bottlenecks and financing barriers in scaling renewable deployment, delaying the realization of its welfare benefits.
Taken together, these findings indicate that the negative short-run associations of environmental pressures on entrepreneurship and infrastructure in results likely reflect transition trade-offs. Environmental compliance and pollution mitigation may initially impose costs on firms and local governments, but the long-run payoff is improved welfare through cleaner air and more sustainable urban systems. Thus, results capture a realistic temporal dimension of sustainable development—short-term adjustment costs versus long-term societal outcomes.

4.3. Methodological Considerations and Limitations

Methodologically, aggregating the indicators into standardized, equally weighted economic, social, and environmental indices helped to reduce multicollinearity and provided more stable coefficient estimates at the construct level. The directions of effects in the factor models generally mirror those observed in the simple correlations, which increases confidence that the findings are not driven by any single indicator. In the few cases where correlations and regressions diverge (e.g., for education), the difference can plausibly be attributed to suppression effects that arise when multiple constructs are included simultaneously.
In this study, linear OLS regression models were employed rather than nonlinear or dynamic specifications for several reasons. First, the theoretical framework, as well as the empirical correlation patterns, suggests predominantly monotonic and approximately linear associations between aggregated RET determinants and welfare dimensions at the macro level. Second, the very short time series (2020–2024) and the single-country setting provide too few degrees of freedom to reliably estimate more complex nonlinear or dynamic models (e.g., models with lagged dependent variables or flexible functional forms), which would be highly vulnerable to overfitting and unstable coefficients. Third, the diagnostic tests (Shapiro–Wilk for normality; Breusch–Pagan and Durbin–Watson for homoskedasticity and residual independence; VIF and tolerance for multicollinearity) indicate that the classical OLS assumptions are broadly satisfied for the retained models, supporting the use of a linear specification as a parsimonious first-order approximation. For these reasons, linear OLS regression was considered the most appropriate and transparent choice for this exploratory analysis, while more complex nonlinear or dynamic approaches are left for future research once longer time series or richer panel datasets become available.
The article presents an integrated, factor-level view of how the economic, social, and environmental dimensions of renewable energy technology deployment evolved between 2020 and 2024, providing a concise empirical map of their links to societal welfare. However, this study has several limitations. Inference is constrained by the short time series (2020–2024): with few degrees of freedom, high R2 and nominal p-values can appear impressive but may over-state the strength of the evidence. In this setting, the linear specifications inevitably risk overfitting, so the estimated relationships should be interpreted as summarizing patterns within the observed sample rather than as fully identified structural models suitable for prediction or causal inference. Within these constraints, standard diagnostic tests and internal consistency between correlation and regression results are relied upon to assess robustness; accordingly, statistical significance is treated as indicative rather than conclusive, and the linear models are viewed as exploratory approximations rather than definitive structural representations of the underlying processes. In addition, both the correlation and regression analyses were based on linear specifications; therefore, the results should be interpreted as capturing approximate linear tendencies between RET determinants and welfare dimensions. Potential nonlinear or threshold effects could not be ruled out and were identified as an important direction for future research once longer time series or richer panel data become available.
From a policy perspective, the results point to two broad directions. First, strengthening economic fundamentals, such as the investment climate, income growth, and openness to foreign direct investment, appears consistently associated with improvements in material prosperity and cleaner local environments, likely through technology upgrading and scale effects. Second, effective management of transition-related trade-offs is essential: combining tighter environmental stringency with targeted support for firms (e.g., green investment incentives, innovation grants, and infrastructure upgrades) can help ease short-run competitiveness pressures while maintaining environmental outcomes.

5. Conclusions

This section synthesizes the main empirical insights of the study and highlights key implications and avenues for future research.

5.1. Summary of Main Findings

This study set out to examine how economic, social, and environmental determinants associated with the deployment of renewable energy technologies (RETs) are statistically related to multiple dimensions of societal welfare in Lithuania, operationalized through the Lithuanian Quality of Life Index (LQLI) for 2020–2024. In line with this overarching aim, the main conclusions can be summarized as follows:
(1)
Economic determinants associated with RET deployment are statistically and positively linked to several key welfare dimensions in particular material living conditions, entrepreneurship and business competitiveness, educational services, and public infrastructure, living-environment quality and safety.
(2)
Social determinants show heterogeneous associations: they support entrepreneurship and public infrastructure and safety, but their relationships with material living conditions and education are weaker and statistically insignificant, suggesting that social conditions primarily operate through collective and institutional channels.
(3)
Environmental determinants were associated with lower air pollution in the broader literature and with higher hospital-service utilization when pollution increased in the data; however, in the regression models, negative short-run associations were observed with entrepreneurship and public infrastructure, consistent with transition-related trade-offs rather than straightforward welfare gains.
(4)
Methodologically, the use of standardized, equally weighted composite indices for the economic, social, and environmental determinants, combined with Pearson correlations and linear OLS regressions, provides a coherent and internally consistent picture of the RET–welfare nexus at the national level. The factor-level results broadly mirror the simple correlations, indicating that the findings are not driven by any single indicator but rather by the joint behavior of the underlying determinant groups.
(5)
Taken together, these results indicate that, within the Lithuanian context over 2020–2024, RET deployment is empirically associated with improvements in the economic aspects of societal welfare, while social and environmental dimensions exert more nuanced, domain-specific and sometimes conflicting influences that policymakers must carefully balance.

5.2. Future Research Directions

Building on these conclusions, several directions for future research emerge:
(1)
Extending the temporal and spatial scope of the analysis, for example, by constructing longer national time series, regional panel datasets within Lithuania, or comparative panels across countries, would allow for more robust identification strategies and the use of richer dynamic or nonlinear models.
(2)
Experimenting with alternative methods of constructing factor indices (e.g., principal component analysis-based weights or other data-driven aggregation schemes) could test the sensitivity of the results to the chosen weighting structure and provide deeper insight into the relative importance of individual indicators within each determinant group.
(3)
Incorporating explicit lag structures or dynamic specifications, once longer time series become available, would help to capture delayed effects of RET deployment and environmental improvements on different welfare dimensions and would better distinguish short-term adjustment costs from long-term benefits.
(4)
Finally, future work could explore the distributional aspects of the RET–welfare nexus, examining how the benefits and costs of renewable deployment are shared across regions, income groups, or vulnerable populations, thereby complementing the aggregate national-level perspective adopted in this study.
Overall, the findings suggest that economic factors have a consistent positive effect, social aspects display more mixed patterns, and environmental pressures often generate trade-offs. These patterns are broadly consistent between correlation and regression analyses and provide a structured starting point for more detailed future research on the renewable energy–welfare nexus.

Author Contributions

Conceptualization, S.K. and A.B.; methodology, S.K. and A.B.; software, S.K.; validation, S.K. and A.B. and formal analysis, S.K. and A.B.; investigation, S.K., A.B. and M.C.; resources, S.K. and A.B.; data curation, S.K. and A.B.; writing—original draft preparation, S.K. and A.B.; writing—review and editing, S.K., A.P., A.B. and M.C.; visualization, S.K.; supervision, S.K., A.P., A.B. and M.C.; project administration, S.K. and A.B.; funding acquisition, M.C. All authors have read and agreed to the published version of the manuscript.

Funding

This research received no external funding.

Institutional Review Board Statement

Not applicable.

Informed Consent Statement

Not applicable.

Data Availability Statement

The original contributions presented in this study are included in the article. Further inquiries can be directed to the corresponding authors.

Conflicts of Interest

The authors declare no conflicts of interest.

Abbreviations

The following abbreviations are used in this manuscript:
ARDLAutoregressive Distributed Lag
BPBreusch–Pagan test
CO2Carbon Dioxide
DWDurbin–Watson statistic
EUEuropean Union
EU-2828 Member States of the European Union
FDIForeign Direct Investment
GDPGross Domestic Product
GHGGreenhouse Gas
HDIHuman Development Index
LQLILithuanian Quality of Life Index
OECDOrganization for Economic Co-operation and Development
OLSOrdinary Least Squares
PVPhotovoltaic
QLIQuality of Life Index
QoLQuality of Life
RESRenewable Energy Sources
RET/RETsRenewable Energy Technology/Technologies
SEDISustainable Energy Development Index
VIFVariance Inflation Factor
WtEWaste-to-Energy

Appendix A

Table A1. Significant correlations (p < 0.05) between RET determinants and welfare dimensions (2020–2024).
RET_DetermRET_IndicatorWelfare_DimWelfare_IndicatorrpDirection
Economic Disposable income per month (per household, EUR)Material living conditionsEmployment share, working-age (%)0.980.003Positive
Economic Foreign direct investment per capita (end of period, EUR)Material living conditionsEmployment share, working-age (%)0.9970.000Positive
Economic GDP per capita (EUR)Material living conditionsEmployment share, working-age (%)0.9980.000Positive
Economic Share of RES in final energy consumption in transport (%)Material living conditionsEmployment share, working-age (%)0.9660.007Positive
Economic Share of RES in total final energy consumption (%)Material living conditionsEmployment share, working-age (%)0.9440.016Positive
Economic Subsidies and grants (thousand EUR)Material living conditionsEmployment share, working-age (%)0.8990.038Positive
SocialEducation of population (thousands persons)Material living conditionsEmployment share, working-age (%)0.9610.009Positive
SocialEmployment (thousands of persons)Material living conditionsEmployment share, working-age (%)0.9990.000Positive
SocialLabour force (thousands persons)Material living conditionsEmployment share, working-age (%)0.9060.034Positive
Economic Disposable income per month (per household, EUR)Material living conditionsNet wage (EUR, monthly)0.9780.004Positive
Economic Foreign direct investment per capita (end of period, EUR)Material living conditionsNet wage (EUR, monthly)0.9860.002Positive
Economic GDP per capita (EUR)Material living conditionsNet wage (EUR, monthly)0.9830.003Positive
Economic Share of RES in final energy consumption for heating and cooling (%)Material living conditionsNet wage (EUR, monthly)0.890.043Positive
Economic Share of RES in final energy consumption in transport (%)Material living conditionsNet wage (EUR, monthly)0.9130.030Positive
Economic Share of RES in total final energy consumption (%)Material living conditionsNet wage (EUR, monthly)0.9820.003Positive
Economic Subsidies and grants (thousand EUR)Material living conditionsNet wage (EUR, monthly)0.9620.009Positive
SocialEducation of population (thousands persons)Material living conditionsNet wage (EUR, monthly)0.9720.006Positive
SocialEmployment (thousands of persons)Material living conditionsNet wage (EUR, monthly)0.9850.002Positive
SocialLabour force (thousands persons)Material living conditionsNet wage (EUR, monthly)0.9330.021Positive
Economic Disposable income per month (per household, EUR)Material living conditionsUsable floor space pc (m2/person)0.9930.001Positive
Economic Foreign direct investment per capita (end of period, EUR)Material living conditionsUsable floor space pc (m2/person)0.9920.001Positive
Economic GDP per capita (EUR)Material living conditionsUsable floor space pc (m2/person)0.990.001Positive
Economic Share of RES in final energy consumption for heating and cooling (%)Material living conditionsUsable floor space pc (m2/person)0.8790.049Positive
Economic Share of RES in final energy consumption in transport (%)Material living conditionsUsable floor space pc (m2/person)0.9420.017Positive
Economic Share of RES in total final energy consumption (%)Material living conditionsUsable floor space pc (m2/person)0.9660.008Positive
Economic Subsidies and grants (thousand EUR)Material living conditionsUsable floor space pc (m2/person)0.9370.019Positive
SocialEducation of population (thousands persons)Material living conditionsUsable floor space pc (m2/person)0.9630.008Positive
SocialEmployment (thousands of persons)Material living conditionsUsable floor space pc (m2/person)0.9950.000Positive
SocialLabour force (thousands persons)Material living conditionsUsable floor space pc (m2/person)0.9230.025Positive
Economic Share of RES in final energy consumption for heating and cooling (%)Entrepreneurship and competitivenessCompany turnover per 1k inh. (mn EUR)0.880.049Positive
Economic Share of RES in total final energy consumption (%)Entrepreneurship and competitivenessCompany turnover per 1k inh. (mn EUR)0.9440.016Positive
Economic Subsidies and grants (thousand EUR)Entrepreneurship and competitivenessCompany turnover per 1k inh. (mn EUR)0.9150.029Positive
SocialPeople unable to pay bills on time (%)Entrepreneurship and competitivenessCompany turnover per 1k inh. (mn EUR)−0.9160.029Negative
Economic Disposable income per month (per household, EUR)Entrepreneurship and competitivenessFDI per 1k inh. (eoy, mn EUR)0.9770.004Positive
Economic Foreign direct investment per capita (end of period, EUR)Entrepreneurship and competitivenessFDI per 1k inh. (eoy, mn EUR)10.000Positive
Economic GDP per capita (EUR)Entrepreneurship and competitivenessFDI per 1k inh. (eoy, mn EUR)0.9980.000Positive
Economic Share of RES in final energy consumption in transport (%)Entrepreneurship and competitivenessFDI per 1k inh. (eoy, mn EUR)0.9710.006Positive
Economic Share of RES in total final energy consumption (%)Entrepreneurship and competitivenessFDI per 1k inh. (eoy, mn EUR)0.9530.012Positive
Economic Subsidies and grants (thousand EUR)Entrepreneurship and competitivenessFDI per 1k inh. (eoy, mn EUR)0.9040.035Positive
SocialEducation of population (thousands persons)Entrepreneurship and competitivenessFDI per 1k inh. (eoy, mn EUR)0.9540.012Positive
SocialEmployment (thousands of persons)Entrepreneurship and competitivenessFDI per 1k inh. (eoy, mn EUR)0.9990.000Positive
SocialLabour force (thousands persons)Entrepreneurship and competitivenessFDI per 1k inh. (eoy, mn EUR)0.8910.043Positive
Economic Disposable income per month (per household, EUR)Entrepreneurship and competitivenessMaterial investment per 1k inh. (th EUR)0.9430.016Positive
Economic Foreign direct investment per capita (end of period, EUR)Entrepreneurship and competitivenessMaterial investment per 1k inh. (th EUR)0.9770.004Positive
Economic GDP per capita (EUR)Entrepreneurship and competitivenessMaterial investment per 1k inh. (th EUR)0.980.003Positive
Economic Share of RES in final energy consumption in transport (%)Entrepreneurship and competitivenessMaterial investment per 1k inh. (th EUR)0.9030.036Positive
Economic Share of RES in total final energy consumption (%)Entrepreneurship and competitivenessMaterial investment per 1k inh. (th EUR)0.9560.011Positive
Economic Subsidies and grants (thousand EUR)Entrepreneurship and competitivenessMaterial investment per 1k inh. (th EUR)0.9310.022Positive
SocialEducation of population (thousands persons)Entrepreneurship and competitivenessMaterial investment per 1k inh. (th EUR)0.9790.004Positive
SocialEmployment (thousands of persons)Entrepreneurship and competitivenessMaterial investment per 1k inh. (th EUR)0.9750.005Positive
SocialLabour force (thousands persons)Entrepreneurship and competitivenessMaterial investment per 1k inh. (th EUR)0.9340.020Positive
Economic Disposable income per month (per household, EUR)Public infrastructure, living env. and safetyAir pollutant emissions, stationary sources (t)−0.9360.019Negative
Economic Foreign direct investment per capita (end of period, EUR)Public infrastructure, living env. and safetyAir pollutant emissions, stationary sources (t)−0.9420.017Negative
Economic GDP per capita (EUR)Public infrastructure, living env. and safetyAir pollutant emissions, stationary sources (t)−0.9590.010Negative
Economic Share of RES in total final energy consumption (%)Public infrastructure, living env. and safetyAir pollutant emissions, stationary sources (t)−0.9060.034Negative
Economic Subsidies and grants (thousand EUR)Public infrastructure, living env. and safetyAir pollutant emissions, stationary sources (t)−0.9050.035Negative
SocialEducation of population (thousands persons)Public infrastructure, living env. and safetyAir pollutant emissions, stationary sources (t)−0.9950.000Negative
SocialEmployment (thousands of persons)Public infrastructure, living env. and safetyAir pollutant emissions, stationary sources (t)−0.9520.013Negative
SocialLabour force (thousands persons)Public infrastructure, living env. and safetyAir pollutant emissions, stationary sources (t)−0.990.001Negative

References

  1. Fang, Y. Economic welfare impacts from renewable energy consumption: The China experience. Renew. Sustain. Energy Rev. 2011, 15, 5120–5128. [Google Scholar] [CrossRef]
  2. Kalimeris, P.; Bithas, K.; Richardson, C.; Nijkamp, P. Hidden linkages between resources and economy: A “Beyond-GDP” approach using alternative welfare indicators. Ecol. Econ. 2020, 169, 106508. [Google Scholar] [CrossRef]
  3. Bilan, Y.; Mishchuk, H.; Samoliuk, N.; Yurchyk, H. Impact of income distribution on social and economic well-being of the state. Sustainability 2020, 12, 429. [Google Scholar] [CrossRef]
  4. Aitken, A. Measuring welfare beyond GDP. Natl. Inst. Econ. Rev. 2019, 249, 3–16. [Google Scholar] [CrossRef]
  5. Polcyn, J.; Us, Y.; Lyulyov, O.; Pimonenko, T.; Kwilinski, A. Factors influencing the renewable energy consumption in selected European countries. Energies 2021, 15, 108. [Google Scholar] [CrossRef]
  6. Simionescu, M.; Strielkowski, W.; Tvaronavičienė, M. Renewable energy in final energy consumption and income in the EU-28 countries. Energies 2020, 13, 2280. [Google Scholar] [CrossRef]
  7. Wang, W.; Melnyk, L.; Kubatko, O.; Kovalov, B.; Hens, L. Economic and technological efficiency of renewable energy technologies implementation. Sustainability 2023, 15, 8802. [Google Scholar] [CrossRef]
  8. Yadav, A. Promoting economic stability: The role of renewable energy transition in mitigating global volatility. Int. J. Energy Sect. Manag. 2025, 19, 1163–1185. [Google Scholar] [CrossRef]
  9. Ben Mbarek, M.; Saidi, K.; Amamri, M. The relationship between pollutant emissions, renewable energy, nuclear energy and GDP: Empirical evidence from 18 developed and developing countries. Int. J. Sustain. Energy 2018, 37, 597–615. [Google Scholar] [CrossRef]
  10. Özbay, F.; Pehlivan, C. Relationship between the use of renewable energy, carbon dioxide emission, and economic growth: An empirical application on Turkey. In Handbook of Research on Strategic Management for Current Energy Investments; IGI Global: Hershey, PA, USA, 2021; pp. 339–355. [Google Scholar]
  11. Mirziyoyeva, Z.; Salahodjaev, R. Renewable energy, GDP and CO2 emissions in high-globalized countries. Front. Energy Res. 2023, 11, 1123269. [Google Scholar] [CrossRef]
  12. Aguirre, M.; Ibikunle, G. Determinants of renewable energy growth: A global sample analysis. Energy Policy 2014, 69, 374–384. [Google Scholar] [CrossRef]
  13. Apergis, N.; Payne, J.E. Renewable energy, output, CO2 emissions, and fossil fuel prices in Central America: Evidence from a nonlinear panel smooth transition vector error correction model. Energy Econ. 2014, 42, 226–232. [Google Scholar] [CrossRef]
  14. Apergis, N.; Payne, J.E. The causal dynamics between renewable energy, real GDP, emissions and oil prices: Evidence from OECD countries. Appl. Econ. 2014, 46, 4519–4525. [Google Scholar] [CrossRef]
  15. Omri, A.; Nguyen, D.K. On the determinants of renewable energy consumption: International evidence. Energy 2014, 72, 554–560. [Google Scholar] [CrossRef]
  16. Dogan, E.; Seker, F. Determinants of CO2 emissions in the European Union: The role of renewable and non-renewable energy. Renew. Energy 2016, 94, 429–439. [Google Scholar] [CrossRef]
  17. Bhattacharya, M.; Churchill, S.A.; Paramati, S.R. The dynamic impact of renewable energy and institutions on economic output and CO2 emissions across regions. Renew. Energy 2017, 111, 157–167. [Google Scholar]
  18. Lu, W.C. Renewable energy, carbon emissions, and economic growth in 24 Asian countries: Evidence from panel cointegration analysis. Environ. Sci. Pollut. Res. 2017, 24, 26006–26015. [Google Scholar] [CrossRef]
  19. Dong, K.; Hochman, G.; Zhang, Y.; Sun, R.; Li, H.; Liao, H. CO2 emissions, economic and population growth, and renewable energy: Empirical evidence across regions. Energy Econ. 2018, 75, 180–192. [Google Scholar] [CrossRef]
  20. McGee, J.A.; Greiner, P.T. Renewable energy injustice: The socio-environmental implications of renewable energy consumption. Energy Res. Soc. Sci. 2019, 56, 101214. [Google Scholar] [CrossRef]
  21. Uzar, U. Is income inequality a driver for renewable energy consumption? J. Clean. Prod. 2020, 255, 120287. [Google Scholar] [CrossRef]
  22. Apergis, N.; Kuziboev, B.; Abdullaev, I.; Rajabov, A. Investigating the association among CO2 emissions, renewable and non-renewable energy consumption in Uzbekistan: An ARDL approach. Environ. Sci. Pollut. Res. 2023, 30, 39666–39679. [Google Scholar] [CrossRef]
  23. Jahanshahi, A.; Kamali, M.; Khalaj, M.; Khodaparast, Z. Delphi-based prioritization of economic criteria for development of wave and tidal energy technologies. Energy 2019, 167, 819–827. [Google Scholar] [CrossRef]
  24. Mikulčić, H.; Klemeš, J.J.; Duić, N. Shaping sustainable development to support human welfare. Clean Technol. Environ. Policy 2016, 18, 1633–1639. [Google Scholar] [CrossRef]
  25. Bigerna, S.; Polinori, P. Assessing the determinants of renewable electricity acceptance integrating meta-analysis regression and a local comprehensive survey. Sustainability 2015, 7, 11909–11932. [Google Scholar] [CrossRef]
  26. Lehr, U.; Lutz, C.; Edler, D. Green jobs? Economic impacts of renewable energy in Germany. Energy Policy 2012, 47, 358–364. [Google Scholar] [CrossRef]
  27. Carrera, D.G.; Mack, A. Sustainability assessment of energy technologies via social indicators: Results of a survey among European energy experts. Energy Policy 2010, 38, 1030–1039. [Google Scholar] [CrossRef]
  28. Karasmanaki, E.; Tsantopoulos, G. Factors affecting citizens’ decision to invest in renewable energy. E3S Web Conf. 2023, 436, 6008. [Google Scholar] [CrossRef]
  29. Tu, Y.X.; Kubatko, O.; Piven, V.; Sotnyk, I.; Kurbatova, T. Determinants of renewable energy development: Evidence from the EU countries. Energies 2022, 15, 7093. [Google Scholar] [CrossRef]
  30. Adler, M.D. Measuring Social Welfare: An Introduction; Oxford University Press: Oxford, UK, 2019. [Google Scholar]
  31. Ferranna, M.; Hammitt, J.K.; Robinson, L.A. From Benefit–Cost Analysis to Social Welfare: A Pragmatic Approach. J. Benefit-Cost Anal. 2024, 15, 84–109. [Google Scholar] [CrossRef]
  32. Abebe, R.; Goldner, K. Mechanism design for social good. AI Matters 2018, 4, 27–34. [Google Scholar] [CrossRef]
  33. Tzagkarakis, S.I. Conceptualization and Practical Dimensions of Social Welfare: Fundamental Perspectives and New Challenges. Stud. Srod. I Bałkanistyczne 2023, 32, 185–199. [Google Scholar]
  34. Marciano, A. Retrospectives: James Buchanan: Clubs and alternative welfare economics. J. Econ. Perspect. 2021, 35, 243–256. [Google Scholar] [CrossRef]
  35. Viscusi, W.K. Why Office of Management and Budget’s (OMB) Social Welfare Function Is Not Society’s Social Welfare Function. J. Benefit-Cost Anal. 2024, 15, 252. [Google Scholar]
  36. Lobonț, O.R.; Trip, A.; Țăran, A.M.; Mihiț, L.D.; Moldovan, N.C. Science mapping and country clustering regarding challenges of public governance to ensure societal well-being. BRAIN. Broad Res. Artif. Intell. Neurosci. 2023, 14, 257–284. [Google Scholar] [CrossRef]
  37. Stoll, L.; Michaelson, J.; Seaford, C. Well-Being Evidence for Policy: A Review; New Economics Foundation: London, UK, 2012. [Google Scholar]
  38. Matallana, M.d.M.; López-Martínez, M.; Riquelme-Perea, P.J. Measurement of quality of life in Spanish regions. Appl. Res. Qual. Life 2022, 17, 1–30. [Google Scholar]
  39. Corrado, L.; De Michele, G. Are Governments Matching Citizens’ Demand for Better Lives? A New Approach Comparing Subjective and Objective Welfare Measures; European Stability Mechanism: Luxembourg, 2019. [Google Scholar]
  40. Aroca, P.; Gonzalez, P.A.; Valdebenito, R. The heterogeneous level of life quality across Chilean regions. Habitat Int. 2017, 68, 84–98. [Google Scholar] [CrossRef]
  41. Cambir, A.; Vasile, V. Material dimension of life quality and social inclusion. Procedia Econ. Financ. 2015, 32, 932–939. [Google Scholar] [CrossRef]
  42. Shek, D.T. Quality of life in East Asia: The case of Hong Kong. In Handbook of Social Indicators and Quality of Life Research; Springer: Dordrecht, The Netherlands, 2011; pp. 473–497. [Google Scholar]
  43. Káčerová, M.; Ondačková, J. How seniors live from an economic, health, social and emotional point of view? Multidimensional review of the quality of life of seniors in Europe. Geogr. Pol. 2020, 93, 183–209. [Google Scholar] [CrossRef]
  44. Munien, S.; Bob, U.; Matthews, A.P. A Comparative Assessment of the Socio-Economic and Spatial Factors Impacting the Implementation of Renewable Energy in Marginalised Communities: The Case of Inanda and Bergville. Master’s Thesis, University of KwaZulu-Natal, Durban, South Africa, 2016. [Google Scholar]
  45. Alola, A.A.; Yildirim, H. The renewable energy consumption by sectors and household income growth in the United States. Int. J. Green Energy 2019, 16, 1414–1421. [Google Scholar] [CrossRef]
  46. Naeimi, E.; Askariazad, M.H.; Khalili-Damghani, K. Forecasting the Effect of Renewable Energy Consumption on Economic Welfare: Using Artificial Neural Networks. Int. J. Manag. Account. Econ. 2015, 2, 10–25. [Google Scholar]
  47. Keeley, A.R.; Matsumoto, K.I. Investors’ perspective on determinants of foreign direct investment in wind and solar energy in developing economies–Review and expert opinions. J. Clean. Prod. 2018, 179, 132–142. [Google Scholar] [CrossRef]
  48. Camila, E.M.; Agustin, G.; Sumarsono, H. Economic growth in OPEC nations: The role of renewable energy consumption, CO2 emissions, and foreign direct investment. Soc. Ecol. Econ. Sustain. Dev. Goals J. 2024, 2, 15–29. [Google Scholar] [CrossRef]
  49. Rath, B.N.; Dash, A.K.; Mishra, A.K. The linkage between FDI and energy use in the case of emerging market economies. Environ. Dev. Sustain. 2024, 1–19. [Google Scholar] [CrossRef]
  50. Zhang, D.; Cao, H.; Zou, P. Exuberance in China’s renewable energy investment: Rationality, capital structure and implications with firm level evidence. Energy Policy 2016, 95, 468–478. [Google Scholar] [CrossRef]
  51. Bernini, C.; Pellegrini, G. How are growth and productivity in private firms affected by public subsidy? Evidence from a regional policy. Reg. Sci. Urban Econ. 2011, 41, 253–265. [Google Scholar] [CrossRef]
  52. Buckley, P.J. The impact of the global factory on economic development. J. World Bus. 2009, 44, 131–143. [Google Scholar] [CrossRef]
  53. Werner, L.; Scholtens, B. Firm type, feed-in tariff, and wind energy investment in Germany: An investigation of decision making factors of energy producers regarding investing in wind energy capacity. J. Ind. Ecol. 2017, 21, 402–411. [Google Scholar] [CrossRef]
  54. Paukku, E. How could Finland promote renewable-energy technology innovation and implementation? Clean Energy 2021, 5, 447–463. [Google Scholar] [CrossRef]
  55. Przedworska, K.; Kubiczek, J. Subsidies and business competitiveness in poland’s renewable energy market. Scientific Papers of Silesian University of Technology. Organ. Manag. 2024, 2024, 515–528. [Google Scholar] [CrossRef]
  56. Nicolini, M.; Tavoni, M. Are renewable energy subsidies effective? Evidence from Europe. Renew. Sustain. Energy Rev. 2017, 74, 412–423. [Google Scholar] [CrossRef]
  57. Bhattarai, U.; Maraseni, T.; Apan, A.; Devkota, L.P. Rationalizing donations and subsidies: Energy ecosystem development for sustainable renewable energy transition in Nepal. Energy Policy 2023, 177, 113570. [Google Scholar] [CrossRef]
  58. Sahari, A. Electricity prices and consumers’ long-term technology choices: Evidence from heating investments. Eur. Econ. Rev. 2019, 114, 19–53. [Google Scholar] [CrossRef]
  59. Rokicki, T.; Bórawski, P.; Gradziuk, B.; Gradziuk, P.; Mrówczyńska-Kamińska, A.; Kozak, J.; Guzal-Dec, D.J.; Wojtczuk, K. Differentiation and changes of household electricity prices in EU countries. Energies 2021, 14, 6894. [Google Scholar] [CrossRef]
  60. Thankappan Nair, R.; Sankar, A. Dynamic pricing based on a cloud computing framework to support the integration of renewable energy sources. J. Eng. 2014, 2014, 680–687. [Google Scholar] [CrossRef]
  61. Prokopenko, O.; Kurbatova, T.; Khalilova, M.; Zerkal, A.; Prause, G.; Binda, J.; Berdiyorov, T.; Klapkiv, Y.; Sanetra-Półgrabi, S.; Komarnitskyi, I. Impact of investments and R&D costs in renewable energy technologies on companies’ profitability indicators: Assessment and forecast. Energies 2023, 16, 1021. [Google Scholar] [CrossRef]
  62. Islam, S.; Raihan, A.; Ridwan, M.; Rahman, M.S.; Paul, A.; Karmakar, S.; Paul, P.; Tanchangya, T.; Rahman, J.; Jubayed, A.A. The influences of financial development, economic growth, energy price, and foreign direct investment on renewable energy consumption in the BRICS. J. Environ. Energy Econ. 2023, 2, 17–28. [Google Scholar] [CrossRef]
  63. Kohli, A.; Wadhwa, R.; Tripathi, G.C. Impact of Sustainable Energy Policies on Sustainable Investments in Technology and Flow of Sustainable Finance to Renewable Energy or Green Energy Sector: An Indian Perspective. In Intelligent IT Solutions for Sustainability in Industry 5.0 Paradigm. ICEIL 2023; Springer: Singapore, 2023; pp. 451–466. [Google Scholar]
  64. Sart, G.; Bayar, Y.; Sezgin, F.H.; Danilina, M. Impact of educational attainment on renewable energy use: Evidence from emerging market economies. Energies 2022, 15, 2695. [Google Scholar] [CrossRef]
  65. Jamshid; Villanthenkodath, M.A.; Velan, N. Can educational attainment promote renewable energy consumption? Evidence from heterogeneous panel models. Int. J. Energy Sect. Manag. 2022, 16, 1017–1036. [Google Scholar] [CrossRef]
  66. Sardianou, E.; Genoudi, P. Which factors affect the willingness of consumers to adopt renewable energies? Renew. Energy 2013, 57, 1–4. [Google Scholar] [CrossRef]
  67. Kontogianni, A.; Tourkolias, C.; Skourtos, M. Renewables portfolio, individual preferences and social values towards RES technologies. Energy Policy 2013, 55, 467–476. [Google Scholar] [CrossRef]
  68. Kosenius, A.K.; Ollikainen, M. Valuation of environmental and societal trade-offs of renewable energy sources. Energy Policy 2013, 62, 1148–1156. [Google Scholar] [CrossRef]
  69. Ahmar, M.; Ali, F.; Jiang, Y.; Wang, Y.; Iqbal, K. Determinants of adoption and the type of solar PV technology adopted in rural Pakistan. Front. Environ. Sci. 2022, 10, 895622. [Google Scholar] [CrossRef]
  70. Kumar, J.C.R.; Majid, M.A. Renewable energy for sustainable development in India: Current status, future prospects, challenges, employment, and investment opportunities. Energy Sustain. Soc. 2020, 10, 2. [Google Scholar] [CrossRef]
  71. Dvořák, P.; Martinát, S.; Van der Horst, D.; Frantál, B.; Turečková, K. Renewable energy investment and job creation; a cross-sectoral assessment for the Czech Republic with reference to EU benchmarks. Renew. Sustain. Energy Rev. 2017, 69, 360–368. [Google Scholar] [CrossRef]
  72. Satrianto, A.; Ikhsan, A. Analysis of renewable energy, environment quality and energy consumption on economic growth: Evidence from developing countries. Int. J. Energy Econ. Policy 2024, 14, 57–65. [Google Scholar] [CrossRef]
  73. Apergis, N.; Jebli, M.B.; Youssef, S.B. Does renewable energy consumption and health expenditures decrease carbon dioxide emissions? Evidence for sub-Saharan Africa countries. Renew. Energy 2018, 127, 1011–1016. [Google Scholar] [CrossRef]
  74. Li, F.; Chang, T.; Wang, M.C.; Zhou, J. The relationship between health expenditure, CO2 emissions, and economic growth in the BRICS countries—Based on the Fourier ARDL model. Environ. Sci. Pollut. Res. 2022, 29, 10908–10927. [Google Scholar] [CrossRef]
  75. Khan, S.A.R. The Role of Renewable Energy, Public Health Expenditure, Logistics and Environmental Performance in Economic Growth: An Evidence from Structural Equation Modelling. Preprints 2019. [Google Scholar] [CrossRef]
  76. Khan, A.; Hussain, J.; Bano, S.; Chenggang, Y. The repercussions of foreign direct investment, renewable energy and health expenditure on environmental decay? An econometric analysis of B&RI countries. J. Environ. Plan. Manag. 2019, 63, 1965–1986. [Google Scholar] [CrossRef]
  77. Vatamanu, A.F.; Onofrei, M.; Cigu, E.; Oprea, F. Renewable energy consumption, institutional quality and life expectancy in EU countries: A cointegration analysis. Energy Sustain. Soc. 2025, 15, 2. [Google Scholar] [CrossRef]
  78. Zhao, J.; Dong, K.; Dong, X.; Shahbaz, M. How renewable energy alleviate energy poverty? A global analysis. Renew. Energy 2022, 186, 299–311. [Google Scholar] [CrossRef]
  79. Chu, L.K.; Doğan, B.; Ghosh, S.; Shahbaz, M. The influence of shadow economy, environmental policies and geopolitical risk on renewable energy: A comparison of high-and middle-income countries. J. Environ. Manag. 2023, 342, 118122. [Google Scholar] [CrossRef]
  80. Leuratti, N.; Marangoni, G.; Drouet, L.; Kamp, L.M.; Kwakkel, J. Green hydrogen in the iron and steel industry increases resilience against shocks in energy prices. Environ. Res. Lett. 2025, 20, 024021. [Google Scholar] [CrossRef]
  81. Cergibozan, R. Renewable energy sources as a solution for energy security risk: Empirical evidence from OECD countries. Renew. Energy 2022, 183, 617–626. [Google Scholar] [CrossRef]
  82. Chen, L.; Zhang, T.; Zhang, C.; Liu, F.; Feng, Y. Does Geopolitical Risk Endanger Energy Resilience? Empirical Evidence from Cross-Country Data. Pol. J. Environ. Stud. 2025, 34, 2589–2607. [Google Scholar] [CrossRef]
  83. Nashi, R.; Ouakil, H. Energy price shocks and current account balances: What role for economic structure, energy dependency and renewable energy development? Sustain. Futures 2025, 9, 100402. [Google Scholar] [CrossRef]
  84. Khan, H.; Khan, I.; Binh, T.T. The heterogeneity of renewable energy consumption, carbon emission and financial development in the globe: A panel quantile regression approach. Energy Rep. 2020, 6, 859–867. [Google Scholar] [CrossRef]
  85. Kuo, Y.M.; Fukushima, Y. Greenhouse gas and air pollutant emission reduction potentials of renewable energy—Case Studies on photovoltaic and wind power introduction considering interactions among technologies in Taiwan. J. Air Waste Manag. Assoc. 2009, 59, 360–372. [Google Scholar] [CrossRef] [PubMed]
  86. Oreggioni, G.D.; Monforti-Ferraio, F.; Crippa, M.; Schaaf, E.; Guizzardi, D.; Muntean, M.; Duerr, M.; Vignati, E. EDGAR v5. 0: A tool to evaluate the influence of technology incorporation and regulatory frameworks on global greenhouse gases and air pollutant emissions. In Proceedings of the EGU General Assembly 2020, Online, 4–8 May 2020; p. 20237. [Google Scholar]
  87. Xing, R.; Hanaoka, T.; Kanamori, Y.; Masui, T. Greenhouse gas and air pollutant emissions of China’s residential sector: The importance of considering energy transition. Sustainability 2017, 9, 614. [Google Scholar] [CrossRef]
  88. von Uexküll, O. Energy and water: The ignored link. Refocus 2004, 5, 40–44. [Google Scholar] [CrossRef]
  89. Baker, J.; Strzepek, K.; Farmer, W.; Schlosser, C.A. Quantifying the impact of renewable energy futures on cooling water use. J. Am. Water Resour. Assoc. 2014, 50, 1289–1303. [Google Scholar] [CrossRef]
  90. Liu, J.; Xie, N.; Yu, Z. Analysis of regional water and energy consumption considering economic development. Water 2021, 13, 3582. [Google Scholar] [CrossRef]
  91. Zemite, L.; Stipnieks, E.; Backurs, A.; Laizans, A.; Vonda, K.; Cnubben, P. Optimizing Municipal Waste Recycling for Renewable Energy Production. In Proceedings of the 2024 IEEE 65th International Scientific Conference on Power and Electrical Engineering of Riga Technical University (RTUCON), Riga, Latvia, 10–12 October 2024; IEEE: New York, NY, USA, 2024; pp. 1–6. [Google Scholar]
  92. Yusuf, M.; Kusumah, H. Integration of renewable energy technology in waste recycling utilization. In Proceedings of the 2022 IEEE Creative Communication and Innovative Technology (ICCIT), Tangerang, Indonesia, 22–23 November 2022; IEEE: New York, NY, USA, 2022; pp. 1–7. [Google Scholar]
  93. Bayar, Y.; Gavriletea, M.D.; Sauer, S.; Paun, D. Impact of municipal waste recycling and renewable energy consumption on CO2 emissions across the European Union (EU) member countries. Sustainability 2021, 13, 656. [Google Scholar] [CrossRef]
  94. Kropáč, J.; Bébar, L.; Pavlas, M. Industrial and hazardous waste combustion and energy production. Chem. Eng. 2012, 29, 673–678. [Google Scholar]
  95. Ramadan, A.R.; Sherif, Y. Hazardous waste management in Egypt: Performance indicators for industry. WIT Trans. Ecol. Environ. 2008, 109, 349–359. [Google Scholar][Green Version]
  96. Blazejczak, J.; Braun, F.G.; Edler, D.; Schill, W.P. Economic effects of renewable energy expansion: A model-based analysis for Germany. Renew. Sustain. Energy Rev. 2014, 40, 1070–1080. [Google Scholar] [CrossRef]
  97. Awijen, H.; Belaïd, F.; Zaied, Y.B.; Hussain, N.; Lahouel, B.B. Renewable energy deployment in the MENA region: Does innovation matter? Technol. Forecast. Soc. Change 2022, 179, 121633. [Google Scholar] [CrossRef]
  98. Gharbi, I.; Kammoun, A.; Kefi, M.K. To what extent does renewable energy deployment reduce pollution indicators? The moderating role of research and development expenditure: Evidence from the top three ranked countries. Front. Environ. Sci. 2023, 11, 1096885. [Google Scholar] [CrossRef]
  99. Lelieveld, J.; Klingmüller, K.; Pozzer, A.; Burnett, R.T.; Haines, A.; Ramanathan, V. Effects of fossil fuel and total anthropogenic emission removal on public health and climate. Proc. Natl. Acad. Sci. USA 2019, 116, 7192–7197. [Google Scholar] [CrossRef]
  100. Kutan, A.M.; Paramati, S.R.; Ummalla, M.; Zakari, A. Financing renewable energy projects in major emerging market economies: Evidence in the perspective of sustainable economic development. Emerg. Mark. Financ. Trade 2018, 54, 1761–1777. [Google Scholar] [CrossRef]
  101. Lelieveld, J.; Evans, J.S.; Fnais, M.; Giannadaki, D.; Pozzer, A. The contribution of outdoor air pollution sources to premature mortality on a global scale. Nature 2015, 525, 367–371. [Google Scholar] [CrossRef] [PubMed]
  102. Soeder, D.J. Greenhouse gas sources and mitigation strategies from a geosciences perspective. Adv. Geo-Energy Res. 2021, 5, 274–285. [Google Scholar] [CrossRef]
  103. Brauer, M.; Freedman, G.; Frostad, J.; Van Donkelaar, A.; Martin, R.V.; Dentener, F.; van Dingenen, R.; Estep, K.; Amini, H.; Apte, J.S.; et al. Ambient air pollution exposure estimation for the global burden of disease 2013. Environ. Sci. Technol. 2016, 50, 79–88. [Google Scholar] [CrossRef] [PubMed]
  104. Perera, F. Pollution from fossil-fuel combustion is the leading environmental threat to global pediatric health and equity: Solutions exist. Int. J. Environ. Res. Public Health 2018, 15, 16. [Google Scholar] [CrossRef]
  105. Ogunkunle, O.; Ahmed, N.A. Overview of biodiesel combustion in mitigating the adverse impacts of engine emissions on the sustainable human–environment scenario. Sustainability 2021, 13, 5465. [Google Scholar] [CrossRef]
  106. Cohen, A.J.; Brauer, M.; Burnett, R.; Anderson, H.R.; Frostad, J.; Estep, K.; Balakrishnan, K.; Brunekreef, B.; Dandona, L.; Dandona, R.; et al. Estimates and 25-year trends of the global burden of disease attributable to ambient air pollution: An analysis of data from the Global Burden of Diseases Study 2015. Lancet 2017, 389, 1907–1918. [Google Scholar] [CrossRef]
  107. Adams, S.; Acheampong, A.O. Reducing carbon emissions: The role of renewable energy and democracy. J. Clean. Prod. 2019, 240, 118245. [Google Scholar] [CrossRef]
  108. Li, Y.; Ravi, V.; Heath, G.; Zhang, J.; Vahmani, P.; Lee, S.M.; Zhang, X.; Sanders, K.T.; Ban-Weiss, G.A. Air quality and public health co-benefits of 100% renewable electricity adoption and electrification pathways in Los Angeles. Environ. Res. Lett. 2024, 19, 034015. [Google Scholar] [CrossRef]
  109. Moriarty, P.; Honnery, D. Can renewable energy power the future? Energy Policy 2016, 93, 3–7. [Google Scholar] [CrossRef]
  110. Wang, Z.; Asghar, M.M.; Zaidi, S.A.H.; Wang, B. Dynamic linkages among CO2 emissions, health expenditures, and economic growth: Empirical evidence from Pakistan. Environ. Sci. Pollut. Res. 2019, 26, 15285–15299. [Google Scholar] [CrossRef]
  111. Koengkan, M.; Fuinhas, J.A.; Silva, N. Exploring the capacity of renewable energy consumption to reduce outdoor air pollution death rate in Latin America and the Caribbean region. Environ. Sci. Pollut. Res. 2021, 28, 1656–1674. [Google Scholar] [CrossRef] [PubMed]
  112. Kotcher, J.; Maibach, E.; Choi, W.T. Fossil fuels are harming our brains: Identifying key messages about the health effects of air pollution from fossil fuels. BMC Public Health 2019, 19, 1079. [Google Scholar] [CrossRef] [PubMed]
  113. Marais, E.A.; Silvern, R.F.; Vodonos, A.; Dupin, E.; Bockarie, A.S.; Mickley, L.J.; Schwartz, J. Air quality and health impact of future fossil fuel use for electricity generation and transport in Africa. Environ. Sci. Technol. 2019, 53, 13524–13534. [Google Scholar] [CrossRef] [PubMed]
  114. Lelieveld, J.; Klingmüller, K.; Pozzer, A.; Pöschl, U.; Fnais, M.; Daiber, A.; Münzel, T. Cardiovascular disease burden from ambient air pollution in Europe reassessed using novel hazard ratio functions. Eur. Heart J. 2019, 40, 1590–1596. [Google Scholar] [CrossRef]
  115. González-Eguino, M. Energy poverty: An overview. Renew. Sustain. Energy Rev. 2015, 47, 377–385. [Google Scholar] [CrossRef]
  116. Machol, B.; Rizk, S. Economic value of US fossil fuel electricity health impacts. Environ. Int. 2013, 52, 75–80. [Google Scholar] [CrossRef]
  117. Apergis, N.; Bhattacharya, M.; Hadhri, W. Health care expenditure and environmental pollution: A cross-country comparison across different income groups. Environ. Sci. Pollut. Res. 2020, 27, 8142–8156. [Google Scholar] [CrossRef]
  118. Shadrina, E. Non-hydropower renewable energy in central Asia: Assessment of deployment status and analysis of underlying factors. Energies 2020, 13, 2963. [Google Scholar] [CrossRef]
  119. Többen, J. Regional net impacts and social distribution effects of promoting renewable energies in Germany. Ecol. Econ. 2017, 135, 195–208. [Google Scholar] [CrossRef]
  120. Böhringer, C.; Keller, A.; Van der Werf, E. Are green hopes too rosy? Employment and welfare impacts of renewable energy promotion. Energy Econ. 2013, 36, 277–285. [Google Scholar] [CrossRef]
  121. Iddrisu, I.; Bhattacharyya, S.C. Sustainable Energy Development Index: A multi-dimensional indicator for measuring sustainable energy development. Renew. Sustain. Energy Rev. 2015, 50, 513–530. [Google Scholar] [CrossRef]
  122. Ahn, K.; Chu, Z.; Lee, D. Effects of renewable energy use in the energy mix on social welfare. Energy Econ. 2021, 96, 105174. [Google Scholar] [CrossRef]
  123. Pasten, C.; Santamarina, J.C. Energy and quality of life. Energy Policy 2012, 49, 468–476. [Google Scholar] [CrossRef]
  124. Yang, X.; Liu, Y.; Thrän, D.; Bezama, A.; Wang, M. Effects of the German Renewable Energy Sources Act and environmental, social and economic factors on biogas plant adoption and agricultural land use change. Energy Sustain. Soc. 2021, 11, 6. [Google Scholar] [CrossRef]
  125. Bartosevičienė, V. Ekonominės statistikos pagrindai. In Kaunas: Technologija; KTU Leidykla Technologija: Kaunas, Lithuania, 2010. [Google Scholar]
  126. Pukėnas, K. Kokybinių Duomenų Analizė SPSS Programa; Lietuvos Kūno Kultūros Akademija: Kaunas, Lithuania, 2009. [Google Scholar]
  127. Bourcet, C. Empirical determinants of renewable energy deployment: A systematic literature review. Energy Econ. 2020, 85, 104563. [Google Scholar] [CrossRef]
  128. Şener, Ş.E.C.; Sharp, J.L.; Anctil, A. Factors impacting diverging paths of renewable energy: A review. Renew. Sustain. Energy Rev. 2018, 81, 2335–2342. [Google Scholar] [CrossRef]
  129. Virah-Sawmy, D.; Sturmberg, B. Socio-economic and environmental impacts of renewable energy deployments: A review. Renew. Sustain. Energy Rev. 2025, 207, 114956. [Google Scholar] [CrossRef]
  130. Milčiuvienė, S.; Paškevičius, J. The Investment Environment for Renewable Energy Development in Lithuania: The Electricity Sector. Balt. J. Law Politics 2014, 7, 29–48. [Google Scholar] [CrossRef]
  131. Vojtovič, S.; Stundžienė, A.; Kontautienė, R. The Impact of Socio-Economic Indicators on Sustainable Consumption of Domestic Electricity in Lithuania. Sustainability 2018, 10, 162. [Google Scholar] [CrossRef]
  132. Gomółka, K.; Kasprzak, P. ETS prices and renewable energy sources share in the energy mix—Example of Lithuania, Latvia and Estonia. Econ. Environ. 2024, 90, 844. [Google Scholar]
  133. Gecevičius, G.; Kavaliauskas, Ž. Development of Renewable Energy in Lithuania: Experience, State and Trends. Environ. Res. Eng. Manag. 2021, 77, 64–72. [Google Scholar] [CrossRef]
  134. Jonynas, R.; Puida, E.; Poškas, R.; Paukštaitis, L.; Jouhara, H.; Gudzinskas, J.; Miliauskas, G.; Lukoševičius, V. Renewables for district heating: The case of Lithuania. Energy 2020, 211, 119064. [Google Scholar] [CrossRef]
  135. Valančius, R.; Singh, R.; Jurelionis, A.; Vaiciunas, J. A Review of Heat Pump Systems and Applications in Cold Climates: Evidence from Lithuania. Energies 2019, 12, 4331. [Google Scholar] [CrossRef]
  136. Grigolienė, R.; Kiyak, D.; Šimanskienė, L.; Labanauskaitė, D.; Župerkienė, E.; Mishenina, H. Household energy consumption tendencies: The Baltic States context. J. Bus. Econ. Manag. 2024, 25, 1202–1219. [Google Scholar] [CrossRef]
  137. Walker, G. The role for ‘community’ in carbon governance. Wiley Interdiscip. Rev. Clim. Change 2011, 2, 777–782. [Google Scholar]
  138. Blumer, Y.B.; Stauffacher, M.; Lang, D.J.; Hayashi, K.; Uchida, S. Non-technical success factors for bioenergy projects—Learning from a multiple case study in Japan. Energy Policy 2013, 60, 386–395. [Google Scholar] [CrossRef]
  139. Donastorg, A.; Renukappa, S.; Suresh, S. Financing renewable energy projects in developing countries: A critical review. IOP Conf. Ser. Earth Environ. Sci. 2017, 83, 012012. [Google Scholar]
  140. Branker, K.; Shackles, E.; Pearce, J.M. Peer-to-peer financing mechanisms to accelerate renewable energy deployment. J. Sustain. Financ. Investig. 2011, 1, 138–155. [Google Scholar]
  141. Maulidia, M.; Dargusch, P.; Ashworth, P.; Ardiansyah, F. Rethinking renewable energy targets and electricity sector reform in Indonesia: A private sector perspective. Renew. Sustain. Energy Rev. 2019, 101, 231–247. [Google Scholar] [CrossRef]
  142. Geddes, A.; Schmidt, T.S.; Steffen, B. The multiple roles of state investment banks in low-carbon energy finance: An analysis of Australia, the UK and Germany. Energy Policy 2018, 115, 158–170. [Google Scholar] [CrossRef]
  143. Xu, N.; Kasimov, I.; Wang, Y. Unlocking private investment as a new determinant of green finance for renewable development in China. Renew. Energy 2022, 198, 1121–1130. [Google Scholar] [CrossRef]
  144. Janeliūnas, T. Energy Transformation in Lithuania: Aiming for the Grand Changes. In From Economic to Energy Transition; Palgrave Macmillan: Cham, Switzerland, 2020; pp. 283–313. [Google Scholar]
  145. Sattich, T.; Morgan, R.; Moe, E. Searching for energy independence, finding renewables? Energy security perceptions and renewable energy policy in Lithuania. Political Geogr. 2022, 96, 102656. [Google Scholar]
  146. Biekša, D.; Šiupšinskas, G.; Martinaitis, V.; Jaraminienė, E. Energy Efficiency Challenges in Multi-Apartment Building Renovation in Lithuania. J. Civ. Eng. Manag. 2011, 17, 467–475. [Google Scholar] [CrossRef]
  147. Prozuments, A.; Borodiņecs, A.; Zaharovs, S.; Banionis, K.; Monstvilas, E.; Norvaišienė, R. Evaluating Reduction in Thermal Energy Consumption across Renovated Buildings in Latvia and Lithuania. Buildings 2023, 13, 1916. [Google Scholar] [CrossRef]
  148. Švažas, M.; Bilan, Y.; Navickas, V.; Okręglicka, M. Energy Transformation in Municipal Areas—Key Datasets and Their Influence on Process Evaluation. Energies 2023, 16, 6193. [Google Scholar] [CrossRef]
  149. Baskutis, S.; Baskutienė, J.; Navickas, V.; Bilan, Y.; Cieslinski, W. Perspectives and Problems of Using Renewable Energy Sources and Implementation of Local “Green” Initiatives: A Regional Assessment. Energies 2021, 14, 5888. [Google Scholar] [CrossRef]
  150. Török, L. Economic Drivers of Renewable Energy Growth in the European Union: Evidence from a Panel Data Analysis (2015–2023). Energies 2025, 18, 3363. [Google Scholar] [CrossRef]
  151. Stec, M.; Grzebyk, M.; Caputa, W.; Hejdukova, P. Levels of Renewable Energy Use in Selected European Union Countries–Statistical Assessment of Changes and Prospects for Development. Comp. Econ. Res. Cent. East. Eur. 2024, 27, 117–140. [Google Scholar] [CrossRef]
  152. Kranzl, L.; Kalt, G.; Müller, A.; Hummel, M.; Egger, C.; Öhlinger, C.; Dell, G. Renewable energy in the heating sector in Austria with particular reference to the region of Upper Austria. Energy Policy 2013, 59, 17–31. [Google Scholar] [CrossRef]
  153. Şoimoşan, T.M.; Felseghi, R.A.; Răboacă, M.S.; Filote, C. Heating Systems: A Comparative Assessment of Alternative Solutions. In Retrofitting for Optimal Energy Performance; IGI Global: Hershey, PA, USA, 2019; pp. 283–307. [Google Scholar]
  154. Collazos, J.S.G.; Ardila, L.M.C.; Cardona, C.J.F. Energy transition in sustainable transport: Concepts, policies, and methodologies. Environ. Sci. Pollut. Res. 2024, 31, 58669–58686. [Google Scholar] [CrossRef]
  155. Cansino, J.M.; Pablo-Romero, M.D.P.; Román, R.; Yñiguez, R. Taxes incentives to promote res deployment: The Eu-27 case. In Sustainable Growth and Applications in Renewable Energy Sources; IntechOpen: London, UK, 2011. [Google Scholar]
  156. Varnagirytė-Kabašinskienė, I.; Lukmine, D.; Mizaras, S.; Beniusiene, L.; Armolaitis, K. Lithuanian forest biomass resources: Legal, economic and ecological aspects of their use and potential. Energy Sustain. Soc. 2019, 9, 41. [Google Scholar] [CrossRef]
  157. Balžekienė, A.; Budžytė, A. The Role of Environmental Attitudes in Explaining Public Perceptions of Climate Change and Renewable Energy Technologies in Lithuania. Sustainability 2021, 13, 4376. [Google Scholar] [CrossRef]
  158. Švažas, M.; Navickas, V.; Bilan, Y.; Nakonieczny, J.; Španková, J. Biomass Clusterization from a Regional Perspective: The Case of Lithuania. Energies 2021, 14, 6993. [Google Scholar] [CrossRef]
  159. Balázs, S.; Donatas, D. The impact of social structure and physical characteristics on housing estate renovation in postsocialist cities: Cases of Vilnius and Budapest. Geogr. Pol. 2020, 93, 229–244. [Google Scholar] [CrossRef]
  160. Navickienė, O.; Meidutė-Kavaliauskienė, I.; Činčikaitė, R.; Morkūnas, M.; Valackienė, A. The Expression of the Country’s Modernisation in the Context of Economic Environmental Sustainability: The Case of Lithuania. Sustainability 2023, 15, 10649. [Google Scholar] [CrossRef]
  161. Jakimavičius, D.; Adžgauskas, G.; Šarauskienė, D.; Kriaučiūnienė, J. Climate Change Impact on Hydropower Resources in Gauged and Ungauged Lithuanian River Catchments. Water 2020, 12, 3265. [Google Scholar] [CrossRef]
  162. Činčikaitė, R. Assessment of Sustainable Waste Management: A Case Study in Lithuania. Sustainability 2024, 17, 120. [Google Scholar] [CrossRef]
  163. Katinas, V.; Marčiukaitis, M.; Perednis, E.; Dzenajavičienė, E. Analysis of biodegradable waste use for energy generation in Lithuania. Renew. Sustain. Energy Rev. 2019, 101, 559–567. [Google Scholar] [CrossRef]
  164. Rybakovas, E.; Liugailaitė-Radzvickienė, L. Objectively Measured Quality of Life: The Case of Lithuanian Municipalities. Soc. Sci. 2013, 78, 7–21. [Google Scholar] [CrossRef][Green Version]
  165. Rybakovas, E. Quality of Life Peculiarities in Lithuania Regions. Econ. Manag. 2012, 17, 209–215. [Google Scholar] [CrossRef][Green Version]
  166. Ubarevičienė, R.; Van Ham, M. Population decline in Lithuania: Who lives in declining regions and who leaves? Reg. Stud. Reg. Sci. 2017, 4, 57–79. [Google Scholar] [CrossRef]
  167. Steć, M.; Grzebyk, M. Statistical Analysis of the Level of Development of Renewable Energy Sources in the Countries of the European Union. Energies 2022, 15, 8278. [Google Scholar] [CrossRef]
  168. Huterski, R.; Huterska, A.; Zdunek-Rosa, E.; Voss, G. Evaluation of the Level of Electricity Generation from Renewable Energy Sources in European Union Countries. Energies 2021, 14, 8150. [Google Scholar] [CrossRef]
  169. Brodny, J.; Tutak, M.; Bindzár, P. Assessing the Level of Renewable Energy Development in the European Union Member States. A 10-Year Perspective. Energies 2021, 14, 3765. [Google Scholar] [CrossRef]
  170. Andreas, J.; Burns, C.; Touza, J. Renewable Energy as a Luxury? A Qualitative Comparative Analysis of the Role of the Economy in the EU’s Renewable Energy Transitions During the ‘Double Crisis’. Ecol. Econ. 2017, 142, 81–90. [Google Scholar] [CrossRef]
  171. Musiał, W.; Zioło, M.; Luty, L.; Musiał, K. Energy Policy of European Union Member States in the Context of Renewable Energy Sources Development. Energies 2021, 14, 2864. [Google Scholar] [CrossRef]
  172. Sompolska-Rzechuła, A.; Bąk, I.; Becker, A.; Marjak, H.; Perzyńska, J. The Use of Renewable Energy Sources and Environmental Degradation in EU Countries. Sustainability 2024, 16, 10416. [Google Scholar] [CrossRef]
  173. Abdolmaleki, S.; Abdolmaleki, D.; Bugallo, P. Finding Sustainable Countries in Renewable Energy Sector: A Case Study for an EU Energy System. Sustainability 2023, 15, 10084. [Google Scholar] [CrossRef]
  174. Venghaus, S.; Märker, C.; Dieken, S.; Siekmann, F. Linking Environmental Policy Integration and the Water-Energy-Land-(Food-)Nexus: A Review of the European Union’s Energy, Water, and Agricultural Policies. Energies 2019, 12, 4446. [Google Scholar] [CrossRef]
  175. Eva, K.; Juraj, F.; Natalia, S.; Terezia, K.-G. Bitcoin, cryptocurrencies and tax evasion: A systematic literature review on global approaches to cryptocurrency taxation and the challenges for harmonising regulatory frameworks. Data Sci. Financ. Econ. 2025, 5, 234–257. [Google Scholar]
  176. Du, Z.; Lv, G. Can Digital Finance Unleash the Potential for Household Consumption? A Comparison Based on the Inconsistency Between Income and Consumption Classes. J. Theor. Appl. Electron. Commer. Res. 2025, 20, 275. [Google Scholar] [CrossRef]
  177. Zafar, M.W.; Shahbaz, M.; Sinha, A.; Sengupta, T.; Qin, Q. How renewable energy consumption contribute to environmental quality? The role of education in OECD countries. J. Clean. Prod. 2020, 268, 122149. [Google Scholar] [CrossRef]
  178. Petrauskienė, K.; Skvarnavičiūtė, M.; Dvarionienė, J. Comparative environmental life cycle assessment of electric and conventional vehicles in Lithuania. J. Clean. Prod. 2020, 246, 119042. [Google Scholar] [CrossRef]
  179. Sabūnas, A. Assessing the Feasibility of Climate Policies of Japan, Latvia and Lithuania to Reach the Targets of the Paris Agreement. Conect. Int. Sci. Conf. Environ. Clim. Technol. 2024, 70. [Google Scholar] [CrossRef]
  180. Punys, P.; Jurevičius, L. Assessment of Hydropower Potential in Wastewater Systems and Application in a Lowland Country, Lithuania. Energies 2022, 15, 5173. [Google Scholar] [CrossRef]
  181. Volkova, A.; Koduvere, H.; Pieper, H. Large-scale heat pumps for district heating systems in the Baltics: Potential and impact. Renew. Sustain. Energy Rev. 2022, 167, 112749. [Google Scholar] [CrossRef]
  182. Proença, S.; Fortes, P. The social face of renewables: Econometric analysis of the relationship between renewables and employment. Energy Rep. 2020, 6, 581–586. [Google Scholar] [CrossRef]
  183. Li, B.; Amin, A.; Nureen, N.; Saqib, N.; Wang, L.; Rehman, M. Assessing factors influencing renewable energy deployment and the role of natural resources in MENA countries. Resour. Policy 2024, 88, 104417. [Google Scholar] [CrossRef]
  184. Le, H.; Sarkodie, S. Dynamic linkage between renewable and conventional energy use, environmental quality and economic growth: Evidence from Emerging Market and Developing Economies. Energy Rep. 2020, 6, 965–973. [Google Scholar] [CrossRef]
  185. Chen, Y. Renewable energy investment and employment in China. Int. Rev. Appl. Econ. 2018, 33, 314–334. [Google Scholar] [CrossRef]
  186. De Laurentis, C.; Pearson, P.J. Policy-relevant insights for regional renewable energy deployment. Energy Sustain. Soc. 2021, 11, 19. [Google Scholar] [CrossRef]
  187. Belaîd, F.; Elsayed, A.; Omri, A. Key drivers of renewable energy deployment in the MENA Region: Empirical evidence using panel quantile regression. Struct. Change Econ. Dyn. 2021, 57, 225–238. [Google Scholar] [CrossRef]
  188. Cadoret, I.; Padovano, F. The political drivers of renewable energies policies. Energy Econ. 2016, 56, 261–269. [Google Scholar] [CrossRef]
  189. Piran, M.; Sharifi, A.; Safari, M.M. Exploring the roles of education, renewable energy, and global warming on health expenditures. Sustainability 2023, 15, 14352. [Google Scholar] [CrossRef]
  190. Qudrat-Ullah, H. A Review and Analysis of Green Energy and the Environmental Policies in South Asia. Energies 2023, 16, 7486. [Google Scholar] [CrossRef]
  191. Buonocore, J.; Hughes, E.; Michanowicz, D.; Heo, J.; Allen, J.; Williams, A. Climate and health benefits of increasing renewable energy deployment in the United States. Environ. Res. Lett. 2019, 14, 114010. [Google Scholar] [CrossRef]
  192. Atalla, T.; Bigerna, S.; Bollino, C.A.; Fuentes, R. Analyzing the effects of renewable energy and climate conditions on consumer welfare. Energy J. 2017, 38, 115–136. [Google Scholar] [CrossRef]
Figure 1. Conceptual framework of the study.
Sustainability 18 01111 g001
Figure 2. Mean Pearson correlations between RET determinants and societal welfare dimensions (2020–2024). (Note: Correlations are calculated based on standardized variables. The results highlighted in the text are statistically significant (p < 0.05); the heatmap displays average correlations for completeness).
Sustainability 18 01111 g002
Table 1. Qualitative characteristics of relationship strength.
Quantitative Characteristic of Relationship Strength<0.30.3–<0.70.7–<0.90.9–0.99
Qualitative characteristic of relationship strengthweakmoderatestrongvery strong
Table 2. Alignment of theoretical welfare domains with LQLI dimensions and Eurostat’s 8+1.
Welfare Domain (Theory)Lithuanian Quality of Life Index (LQLI)
(Dimensions)
Eurostat 8+1
(Dimensions)
Notes
EconomyMaterial living conditions; Entrepreneurial and business competitivenessMaterial living conditions; Productive or main activityIncome/employment; productivity/enterprise
Social relationships and communityDemography, civic and social engagementLeisure and social interactions; partially Governance and basic rightsParticipation, volunteering, civic activity; governance proxied via civic engagement
HealthHealth servicesHealthServices/access focus; add outcome indicators where available
Education and careEducational servicesEducationAccess/quality of services; informal care only partly captured
Local environmentInfrastructure, living environment and safetyNatural and living environment; Economic security and physical safetyHousing, transport, pollution, crime/safety
Personal characteristicsDemography, civic and social engagement
(Context across domains)
Demographic structure as context; informs distributional analysis
Subjective synthesis
(no direct LQLI dimension)
Overall experience of life (life satisfaction)LQLI lacks a direct counterpart; complement with survey-based life satisfaction/trust
Table 3. Economic, Social, and Environmental Determinants of Renewable Energy Technology Deployment.
Economic, Social, and Environmental Determinants of
Renewable Energy Technology Deployment
Economic RET Indicators
GDP per capita (EUR)
Disposable income per month (per household, EUR)
Foreign direct investment per capita (end of period, EUR)
Subsidies and grants (thousand EUR)
Electricity prices for households (annual consumption 1000–2500 kWh, incl. taxes, EUR)
Share of RES in total final energy consumption (%)
Share of RES in final energy consumption for heating and cooling (%)
Share of RES in final energy consumption in transport (%)
Social RET Indicators
Unemployment rate (%)
Labor force (thousands persons)
Employment (total by economic activity) (thousand persons)
Poverty risk level (%)
People unable to pay bills on time (%)
People who cannot afford to heat their homes adequately (%)
Health care expenditure (% of GDP)
Education of population (thousands persons)
Environmental RET Indicators
Amount of pollutants emitted into the atmosphere (thousand tons)
Greenhouse gas emissions (thousand tons)
Water consumed for energy purposes (thousand m3)
Recycled municipal waste (%)
Hazardous waste generated per 1000 population (tons)
Source: compiled by the authors based on scientific literature.
Table 4. Dimensions Defining Societal Welfare.
Dimensions Defining Societal Welfare
Material living conditions
Net monthly wage, EUR
Share of employed people among working-age population (%)
Usable floor space per capita (m2/person)
Entrepreneurial and business competitiveness
Foreign direct investment per 1000 inhabitants (end of year, million EUR)
Material investment per 1000 inhabitants (thousand EUR)
Company turnover per 1000 inhabitants (million EUR)
Health services
Mortality from non-communicable diseases (per 100,000 inhabitants)
Educational services
Number of students in universities and colleges per 1000 inhabitants
Demography, civic and social engagement
Gross natural population change rate
Number of persons arriving and departing (net migration)
Public infrastructure, quality of the living environment, and safety
Air pollutant emissions from stationary sources (tons)
Source: compiled by the authors based on scientific literature.
Table 5. Assumption diagnostics (Breusch–Pagan; Durbin–Watson) for OLS models of societal welfare.
Welfare DimensionBreusch–Pagan pDecision (Dispersion)Durbin–WatsonDecision
(Autocorr.)
Conclusion
Material living conditions0.125(p > 0.05)1.919(~1.5–2.5)Assumptions satisfied
Entrepreneurial and business competitiveness0.325(p > 0.05)1.817(~1.5–2.5)Assumptions satisfied
Educational services0.155(p > 0.05)1.829(~1.5–2.5)Assumptions satisfied
Public infrastructure, quality of the living environment, and safety0.214(p > 0.05)1.623(~1.5–2.5)Assumptions satisfied
For these four dimensions, the classical OLS assumptions of homoscedastic and independent residuals appear to hold, so standard OLS inference is appropriate. Next, the regression models are presented.
Table 6. Impact of RET factors on material living conditions: regression coefficients.
VariableBStd. ErrorSig. (p)ToleranceVIF
Constant4.3530.030
Economic factors0.9600.0570.0380.3742.676
Social factors0.1750.0980.3250.9491.054
Environmental factors0.3480.2270.3690.3622.760
Table 7. Impact of RET factors on entrepreneurial and business competitiveness: regression coefficients.
VariableBStd. ErrorSig. (p)ToleranceVIF
Constant−1.2880.051
Economic factors0.4190.0970.0450.3742.676
Social factors0.2040.1670.0440.9491.054
Environmental factors−1.1290.3870.0100.3622.760
Table 8. Impact of RET factors on educational services: regression coefficients.
VariableBStd. ErrorSig. (p)ToleranceVIF
Constant1.5670.015
Economic factors0.4340.0280.0150.3712.636
Social factors−0.4110.0480.0920.9321.454
Environmental factors0.0500.1120.4490.3572.640
Table 9. Impact of RET factors on public infrastructure, quality of the living environment and safety: regression coefficients.
VariableBStd. ErrorSig. (p)ToleranceVIF
Constant0.0140.183
Economic factors0.6490.3510.0150.6442.676
Social factors0.5480.6010.0290.4791.054
Environmental factors−1.5061.3940.0480.5622.760
Disclaimer/Publisher’s Note: The statements, opinions and data contained in all publications are solely those of the individual author(s) and contributor(s) and not of MDPI and/or the editor(s). MDPI and/or the editor(s) disclaim responsibility for any injury to people or property resulting from any ideas, methods, instructions or products referred to in the content.