Article

How Corporates Translate Digital Intelligence Transformation into Substantive Green Innovation: Evidence from an Internal Decision-Making Perspective


1
School of Economics, Management and Law, Changchun Normal University, 677 Changji North Road, Changchun 130032, China
2
School of Economics and Management, China University of Geosciences Beijing, No. 29, Xueyuan Road, Haidian District, Beijing 100083, China
3
School of Computer and Technology, Changchun Normal University, 677 Changji North Road, Changchun 130032, China
*
Author to whom correspondence should be addressed.
Sustainability 2026, 18(2), 1110; https://doi.org/10.3390/su18021110
Submission received: 31 December 2025 / Revised: 17 January 2026 / Accepted: 19 January 2026 / Published: 21 January 2026
(This article belongs to the Section Sustainable Management)

Abstract

Under the background of accelerating global transitions towards low-carbon development, digital intelligence transformation (DIT) has become a critical force that helps companies overcome green technological constraints and translate external green pressures into substantive green innovation. Taking the establishment of China’s NAIIDTZs as a quasi-natural experiment, this study investigates the impact of DIT on corporate green innovation (CGI) from an internal decision-making perspective. Based on a panel dataset of 19,440 samples from Chinese A-share listed companies during 2012–2023, our findings show that DIT significantly enhances both the quantity and quality of CGI. Mechanism analyses indicate that DIT promotes CGI’s quantity through increased R&D human capital input, while improving CGI’s quality through managerial myopia reduction. Heterogeneity analyses further reveal that the positive effects of DIT on CGI are particularly pronounced in firms operating under fierce market competition, in high industrial technological intensity, and in eastern regions. Furthermore, we find that CGI exerts a lagged effect on carbon emission reduction performance, while the effect of CGI’s quality is stronger than that of CGI’s quantity. These findings extend the dynamic capacity theory to digitalization and provide practical and policy implications for promoting CGI through digital intelligence development.

1. Introduction

With the accelerating pressure under global climate change, low-carbon development has become the core of global sustainability agendas [1]. Many international organizations, including IPCC, UNEP, and UNFCCC, prioritize the importance of green resource integration in reducing carbon emission projects. In this context, green innovation is seen as the main force driving low-carbon growth and green technological advancement, which affects how companies deal with environmental and market competition [2]. Many economies are advancing green innovation practices, such as the European Union with its Green Deal, the United States with its Inflation Reduction Act, and China with its Dual-Carbon Strategy. However, even with these global efforts, the outcomes of green innovation remain limited in many firms, partly because green practices are often undertaken as symbolic responses to institutional pressure [3]. In contrast, substantive green innovation is of greater significance, as it reflects verifiable green technological progress, captured by both the scale of green outcome creation (quantity) and its technological depth (quality) [4,5]. This gap between symbolic compliance and substantive outcomes mainly results from a structural mismatch between institutional guidance and corporate operational capacities. Specifically, governments increasingly ask corporations to promote green innovation, but many of them have limited capabilities in researching and developing green technologies, due to inadequate technological support, systematic integration capabilities and insufficient internal resources [6].
In this context, digital intelligence transformation (DIT) has obtained increasing attention as a potential solution to address this bottleneck. DIT is an organizational transformation targeting corporate internal decision-making processes, triggered by external technological and policy environments [7]. Unlike digital transformation emphasizing process digitalization or intelligent technologies emphasizing technology application, DIT is strategy-oriented, highlighting the integration of digital and AI technologies into decision-making processes and the managerial change in allocating and coordinating corporate resources and capabilities [6,8,9]. When facing inadequate technological support and weak R&D capabilities, DIT can streamline decision-making and organizational learning processes while enhancing cross-functional coordination, enabling companies to concentrate limited R&D resources on key technologies and core activities, thus improving R&D productivity [10]. Furthermore, DIT can help reduce search costs and strengthen resource integration capabilities in obtaining external resources, which enhances corporates’ responsiveness to green market needs and their capabilities to navigate environmental regulations, thereby improving resource allocation efficiency [11].
But the question of whether DIT effectively addresses corporate internal decision-making constraints and through which differentiated mechanisms it translates into substantive green innovation remains unanswered. The existing literature does not reach a commitment towards the influence of DIT on CGI’s quantity and quality, particularly with respect to CGI’s quality. Some scholars admit the positive role of DIT in accelerating technological upgrading in pollution control and dynamically monitoring the production process, which effectively allocates targeted resources and helps overcome environmental bottlenecks [12]. In contrast, other scholars argue that DIT may redirect a firm’s focus away from R&D in green products or services toward the exploration of complicated digital intelligent technologies. Such a shift distracts firms from their core innovative activities, thereby potentially weakening the CGI effectiveness [13].
To address this unsolved issue, we construct an integrated framework from internal decision-making perspectives, in which DIT shapes managerial cognition and resource allocation choices in R&D human capital and managerial myopia, thereby influencing the quantity and quality of substantive green innovation. To empirically examine this framework, we take the establishment of China’s New-Generation Artificial Intelligence Innovation and Development Pilot Zones (NAIIDTZs) as a quasi-natural experiment. This policy is implemented sequentially across cities, aiming to enhance regional digital resource availability and institutional support, creating substantially improved conditions for digital intelligence applications [14,15]. Therefore, NAIIDTZs tend to change the corporate internal decision-making environment by improving data accessibility, AI application, and digital governance, thus helping reduce information frictions and coordination costs. Based on this, we construct a staggered difference-in-differences (DID) model using panel data of Chinese A-share listed firms from 2012 to 2023 to explore how DIT influences CGI in its quantity and quality aspects, with a particular focus on internal decision-making mechanisms. Our empirical results show that DIT significantly increases both the quantity and the quality of CGI. Mechanism tests indicate that DIT expands the scale of innovation by increasing the R&D human capital input and improves the depth of green innovation by mitigating managerial myopia. We further find that CGI has a lagged effect on carbon emission reduction performance featured with short-term adjustment costs.
The contributions of this study are as follows: First, we extend the existing studies on DIT and CGI by exploring how DIT differentiates the production logic of CGI through corporate internal decision-making mechanisms. Unlike prior studies that attribute heterogeneous CGI outcomes to resource endowments or institutional pressures, we show that DIT reshapes corporate internal decision-making constraints, thus generating distinct CGI mechanisms. Specifically, we investigate how DIT reallocates R&D human capital input and reduces managerial myopia, providing a behavioral explanation for variations in the quantity and quality of CGI. Second, we employ the establishment of NAIIDTZs as an external policy shock and construct a quasi-natural experiment to ascertain the causal effect of DIT on CGI. Unlike utilizing text-based analysis or entropy-weighted analysis to proxy for DIT, our research design offers an alternative identification strategy that improves causal inference and reduces endogeneity concerns. Third, we provide valuable insights for companies seeking to make DIT consistent with long-term green goals by exploring how DIT translates into high-quality CGI. Rather than attributing unsatisfactory CGI practices to insufficient digital facilities or financial investment, we emphasize managerial myopia as a cognitive internal decision-making constraint that shapes the quality of CGI.
The remainder of this paper is organized as follows: Section 2 presents the literature review and proposes the research hypotheses. Section 3 outlines the research strategy and research design. Section 4 reports the empirical results, mechanism analysis results, heterogeneity analysis results, and carbon emission effect. Section 5 concludes the paper and discusses the policy implications and limitations.

2. Literature Review and Hypothesis Development

2.1. Digital Intelligence Transformation and Corporate Green Innovation

This study adopts an internal decision-making perspective, considering digital intelligence transformation (DIT) as a dynamic capability that overcomes corporate internal decision-making constraints. Featured with high innovativeness, strong permeability, wide coverage, and high investment, DIT serves as both a key engine for scaling up corporate innovation outputs and a disrupter shifting core focus away from product or service R&D [7,13]. Drawing on the dynamic capabilities theory (DCT), this study examines how DIT influences corporate green innovation (CGI) in sensing, seizing, and reconfiguring dimensions [16,17]. Specifically, sensing focuses on the expansion of the number of accessible opportunities, whereas seizing and reconfiguring emphasize the determination of the depth and long-term value of innovation outcomes. This differentiation provides a comprehensive foundation for explaining the divergence between CGI’s quantity and quality.
By utilizing digital and intelligent technologies, corporates can sense emerging green opportunities rapidly and precisely, thus potentially expanding the scope of CGI activities [18]. On the one hand, DIT increases managerial awareness of embedding advanced technologies into environmental protection conduct, thus paying more attention to emerging and potential green opportunities. On the other hand, corporates can utilize digital and intelligent auto-identified data systems to analyze subtle changes in environmental regulations and energy-efficient technologies [19]. Hence, DIT enables corporates to detect green opportunities more accurately and to form broader concepts for subsequent development. Meanwhile, by adjusting R&D efforts towards higher technological sophistication and more precise market positioning, corporates are more likely to develop green innovation products or services with greater technological depth and market relevance [20].
Building upon enhanced sensing capabilities, seizing capabilities describe how effectively corporates leverage DIT resources in response to identified opportunities, thus potentially influencing both the quantity and quality of CGI [21]. Specifically, DIT leverages intelligent decision-making platforms and inter-organizational data collaboration mechanisms to overcome both departmental barriers and resource allocation constraints. On the one hand, DIT helps corporates to integrate R&D, procurement, manufacturing, and marketing resources via shared data systems and algorithmic coordination, translating environmental requirements into design content and procurement specifications in real time [22]. On the other hand, DIT can help companies build intelligent connections with suppliers, research institutions, and end users, which can help adjust the relationship intensity automatically. Consequently, it forms a dynamic multi-participant collaboration system to support co-creation, data sharing, and feedback across the value chain [23]. This dual integration allows key elements of CGI to be rapidly aggregated, accelerates the information flow and allocation efficiency, and reduces the knowledge asymmetry risks and conversion costs. All of these benefits are expected to expand the scale of green innovation activities. Furthermore, DIT promotes the fusion of cross-domain knowledge and technologies, strengthening the technological complexity and institutional adaptability of green innovation practices, both of which are widely regarded as key indicators of innovation quality, to reflect technical depth and adaptability to changing policy and market environments [11]. Hence, DIT is expected to increase the quality of green innovation from a seizing perspective.
According to reconfiguring capabilities, DIT, with more intelligent technologies, tends to help corporates to flexibly adjust organizational structures and resource allocation patterns, thus possessing advantages in continuously governing, evaluating, and responding to the environmental management workflow [17]. Hence, this reconfiguring capability can help accelerate production efficiency, reduce process redundancies, and promote the rapid diffusion of green technologies [24]. Moreover, DIT also enables corporates to recombine heterogeneous green knowledge and create cross-functional design used in environmental protection, reshaping the cognition towards green innovation [25]. This process not only deepens the technological content of innovation but also enhances the sustainability and diffusion potential of green innovation outcomes. Therefore, with reconfiguration capability, DIT is considered to foster corporate continuous feedback and learning capabilities, all of which support the pursuit of high-quality CGI. Accordingly, this paper proposes the following hypotheses:
H1. 
Digital intelligence transformation positively influences the quantity of green innovation.
H2. 
Digital intelligence transformation positively influences the quality of green innovation.

2.2. Internal Decision-Making Mechanisms of Digital Intelligence Transformation on Corporate Green Innovation

From corporate internal decision-making perspectives, R&D, human resources, and managerial cognition shape a company’s effectiveness and decision-making structures, thereby determining how DIT is transformed into substantive green innovation practices. However, their roles differ across CGI dimensions.
The increased numbers of CGI outputs primarily rely on corporate execution capacity, which is determined by human capital input. R&D human capital embodied in skilled R&D personnel with high environmental awareness, data analytical ability, and green technological expertise reflects corporate decision-making choices that understand, absorb, and apply digital intelligence technologies in innovation activities [26]. Under DIT, where cognitive and data debugging capability become the binding constraint, human capital is the bottleneck resource. Such human capital input is likely to impact the execution efficiency and scalability of green innovation practices, thereby promoting the expansion of green application scenarios [24].
In contrast, the improvement of CGI’s quality requires long-term investment and strategic patience, which are mainly constrained by managerial cognition. From internal decision-making perspectives, managerial myopia is a cognitive bias showing managers’ decision-making preferences for short-term financial performance. Characterized by high uncertainty and long payback periods, it primarily constrains a corporate sustained commitment to CGI’s technological depth, thus potentially influencing CGI’s quality [27]. Therefore, we examine the underlying mechanism through which DIT influences both the quantity and quality of CGI via the channels of R&D human capital input and managerial myopia.

2.2.1. Mechanism of R&D Human Capital Input

Fundamentally, R&D reflects a firm’s internal decision-making behaviors under DIT, as it arises not only from investments in technology and facilities but also from continuous, uncertain decision-making processes through which green knowledge is absorbed, recombined, and applied. With the application of big data, AI, and other digital intelligence technologies, the complexity of clean technological exploration and green product operations has substantially increased [28]. To understand and apply these technologies in managerial and R&D decisions, corporates face growing demands for R&D personnel with stronger digital cognition and analytical skills, leading to higher investment in R&D human capital.
Based on the absorptive capability theory, the professional knowledge base and green innovation abilities of R&D human capital shape the effectiveness of absorptive and transformative processes, thereby influencing the strategic choices and the quantity of green innovation [24,29]. Through greater R&D human capital input, corporations enhance their abilities in exploring application scenarios for clean technologies and expanding the scales of green patent applications, thus increasing the quantity of CGI [30]. Therefore, DIT may induce corporates to adjust the R&D human capital input, which can subsequently be linked with a greater number of green innovation activities. Accordingly, this paper proposes the following hypotheses:
H3. 
Digital intelligence transformation positively influences the quantity of corporate green innovation through the increase in R&D human capital input.

2.2.2. Mechanism of Managerial Myopia

Compared with quantity, the quality of CGI is more characterized by long investment cycles, uncertain technical routes, and unmeasurable intermediate processes. These features make high-quality CGI sensitive to managerial cognition biases, especially managerial myopia [31]. In this context, managers tend to avoid R&D investments and commitments with uncertain and delayed returns, leading these firms to prefer CGI activities with low-pressure and visible returns in the short term.
DIT challenges the underlying factors that lead to such short-term tendencies. By introducing intelligent data analytics, real-time performance monitoring systems, and transparent operational information flows, DIT can measure potential benefits and risks of CGI, thus partially reducing the uncertainty and uncontrollability of long-term investment [32]. In other words, DIT offers technical support for managers to recognize the long-term returns of CGI efforts, addressing the overestimation of potential risks and thereby potentially reducing managerial myopia [16].
As managerial myopia is alleviated, managers may become more willing to pursue the breakthroughs and technical depth of green innovation outcomes instead of making superficial adjustments [33]. This change allows corporates to take on green innovation projects with greater technological depth, more uncertain applications, and more long-term values, all of which enhance the substantive quality of CGI [34,35]. Therefore, from internal decision-making perspectives, DIT reshapes the cognition of managers and reduces their managerial myopia, which enables them to pursue green innovation practices with greater technological depth and long-term values, ultimately improving the quality of CGI. Accordingly, this paper proposes the following hypotheses:
H4. 
Digital intelligence transformation positively influences the quality of corporate green innovation through the reduction in R&D managerial myopia.

2.3. Policy Background and Identification Context

The release of the New-Generation Artificial Intelligence Innovation and Development Pilot Zones (NAIIDTZs) in 2017 was a policy experiment that leverages advanced digital technologies as the core way to promote DIT within regional economic and social systems through the diffusion of technological applications, institutional innovation, and infrastructural upgrading. Beijing was the first city to try out this policy, which was started in 2019 [15]. In the same year, Shanghai, Shenzhen, Hangzhou, Tianjin, Deqing, and Hefei established their pilot zones after Beijing. In 2020, Chengdu, Chongqing, Jinan, Xi’an, Wuhan, and Guangzhou were added to the pilot list, expanding the geographical scope and application scene of NAIIDTZs. In 2021, Suzhou, Changsha, Shenyang, Harbin, and Zhengzhou became involved in this pilot program. And by the end of 2024, there were 18 pilot zones across China.
This plan utilizes local resources to explore digital intelligence technologies, conduct policy experiments, and undertake social trials, aiming to promote the integration of both digitalization and intelligence in regional development, innovate institutional mechanisms in industrial upgrading, and foster a sustainable ecosystem for digital intelligence development. Based on the positioning, these pilot zones are not merely technology R&D platforms but they leverage AI technology as the core of DIT to systemically reshape conventional production processes, governance mechanisms, and public service pathways [14]. Different from traditional innovation policies that directly promote corporate digital intelligence development, NAIIDTZs primarily emphasize data circulation, algorithmic computing, and intelligent systems at the regional level.
The policy requires the promotion of the exploration and application of digital intelligence technology in industrial sectors and enhances the integrated use of AI with digital technologies such as 5G and big data. Specifically, it includes the conversion of conventional information into digital data, the application of digital intelligence technologies in the real economy, policy experimentation in data openness and algorithm testing, and the establishment of 5G data and computing centers [15]. Based on this, these pilot zones directly promote the embedding of data elements, algorithmic technologies, and AI technology into the real economy and public services, representing a typical process of DIT. Furthermore, the policy provides investment in terms of communication networks, big data, and computing centers for these pilot zones to promote the openness and security of public data and reduce computing costs, all of which help seek proper institutional frameworks with the integrated development of both the digitalized economy and advanced intelligent technologies.
Based on the analysis above, this study considers the independence, authority, and timeliness of this policy. Regarding independence, NAIIDTZs embed digital intelligence into broader industrial systems but are not focused on specific enterprises or industries. The selection of pilot cities was decided by the central government, which is independent from green innovation behaviors made by corporates. Therefore, the policy supports the plausibility of an exogenous institutional shock in the consideration of independence corporations. Regarding authority, the plan of NAIIDTZs was endorsed in subsequent national policy documents and initiated by the Ministry of Science and Technology of China, the department that is widely acknowledged as a core mechanism in both policy implementation and academic discussion in terms of promoting DIT in China. Regarding timeliness, the establishment of NAIIDTZs followed a gradual, phased implementation. Pilot cities were set in 2019, 2020, and later, enabling variation across time and space. This gradual expansion provides time-sensitive treatment signals for evaluating how DIT has evolved and the impacts on corporate green innovation behaviors. In addition, although the selection of NAIIDTZ cities might correlate with local innovation potential, the policy was primarily determined by the central government’s strategic layout rather than firm-level behaviors, which mitigates endogeneity concerns. Consequently, NAIIDTZs serve as an appropriate quasi-natural experiment, establishing a platform for recognizing the effects of DIT on CGI.

3. Research Design

3.1. Data Source

Our study takes A-share companies listed on the Shanghai and Shenzhen Stock Exchanges from 2012 to 2023 as the research example, which are sourced from the CSMAR database. The sample data are processed as follows: (1) financial sector firms are excluded; (2) firms categorized as *ST and PT are removed; (3) samples with severely missing data or exhibited anomalies are eliminated; (4) all continuous variables are winsorized at the 1st and 99th percentiles to reduce the impact of extreme values on regression outcomes. After the above data screening and processing, a total of 19,440 sample data points are obtained. Among all companies, the manufacturing sector represents about 71.75% of the total samples, followed by the information transmission and software sectors (8.25%).

3.2. Variable Selection

3.2.1. Dependent Variable

Corporate green innovation (CGI) is the dependent variable. We take the quantity of corporate green innovation (CGI_quan) and the quality of corporate green innovation (CGI_qual) to measure this variable [36]. We search green patent classification numbers based on the International Patent Classification List launched by the WIPO and retrieve the annual number of green patents (including both utility and invention patents in green innovation) of each listed company from the CSMAR database. For the CGI’s quantity, we sum up the applied green utility model patents and green invention patents, add 1 to the aggregated number of green patent applications, and then take the natural logarithm as the measurement of the green innovation quantity to mitigate the issue of right-skewed distribution in the green patent data [37]. For CGI’s quality, we aggregate the cumulative citations received during the subsequent two-year period for green patents filed by firms in the current observation year to avoid the risk of specificity deficiencies arising from the inclusion of citations from preceding years and to ensure comparability given the absence of citation quantity restrictions for green patents within the same year [37].

3.2.2. Independent Variable

Digital intelligence transformation (DIT) is the independent variable. We take the establishment of New-Generation Artificial Intelligence Innovation and Development Pilot Zones (NAIIDTZs) as the exogenous policy shock reflecting DIT [14,15]. This variable captures whether the firm is located in a place that obtained approval for NAIIDTZ construction during the current year. The indicator variable DID takes the value of 1 if the firm’s city or autonomous region received either new approval or retained prior approval in that year and 0 if otherwise.

3.2.3. Control Variables

The financial and governance characteristics of the companies are considered control variables. Financial characteristics include asset-liability ratio (Lev), return on total assets (ROA), R&D expense ratio (RAD), and financial expense rate (Finrate). Governance characteristics include company age (Age), company nature (Nature), shareholding of the largest shareholder (Top1), management shareholding (Mshare), proportion of independent directors on the board (Indep), and CEO duality (Duality). All variable constructions are described in Table 1.

3.3. Model Design and Empirical Strategy

In China, regional governments play an active role in promoting AI-driven technological upgrading through targeted industrial policies. To further address the potential reverse causality between DIT and CGI, our study exploits the establishment of the “New-Generation Artificial Intelligence Innovation and Development Pilot Zones” (NAIIDTZs) as a quasi-natural experiment, representing an exogenous regional policy shock that affects firms’ DIT behaviors. Pilot cities of NAIIDTZs are assigned to the treatment group, while those cities without such platforms constitute the control group. Since some pilot cities were approved late in the year (i.e., after September), we adjust the treatment timing to reflect the actual year in which policy effects are likely to materialize. The DID policy variable captures an exogenous institutional shock, while the constructed DIT index reflects the endogenous strength of firms’ digital intelligence capabilities, which is subsequently used in robustness and mechanism analyses. Other variables are in line with the baseline regression analysis. The specific formula is as follows:
C G I i t = α 0 + α 1 D I D i t + α 2 C o n t r o l s i t + λ t + δ i + μ i t
In model (1), i represents the firm and t represents the year. The dependent variable in the regression model is corporate green innovation (CGI), which includes the quantity of green innovation (CGI_quan) and the quality of green innovation (CGI_qual). The independent variable is DIT, reflected by the DID model, Controls are a series of control variables, λ t is the time-fixed effect, δ i is the firm-fixed effect, and μ i t is the random disturbance term. Furthermore, we also employed t-statistics adjusted for cluster-robust standard errors.

4. Empirical Results and Analysis

4.1. Descriptive Statistics

The descriptive statistics results are reported in Table 2. As indicated in the table, the mean value of the DID is 0.264. The mean value of CGI_quan is 0.502 with a median of 0, and the mean value of CGI_quan is 0.943 with a median of 0. These two indicators suggest that more than half of the listed companies in China have not researched green patents or have received fewer than one citation within a two-year period, indicating a lack of emphasis on both the quantity and quality of green innovation. And compared with CGI_quan, listed companies in the samples tend to focus more on quality.

4.2. Baseline Results

Regression analysis results are displayed in columns (1)–(8) of Table 3. The DID variable positively influences both the CGI_quan (β = 0.027, p < 0.05) and CGI_qual (β = 0.061, p < 0.05), indicating that DIT can enhance green innovation in terms of both quality and quantity, which underscores its broad positive impact on CGI outcomes. The estimated coefficients imply an increase of 2.7% and 6.1% in green patent output and citations following DIT, respectively. These increases are substantial given the low baseline level of green innovation among Chinese listed firms. Based on these analyses, the H1 and H2 hypotheses are supported.

4.3. Robustness Test Results

4.3.1. Parallel Trend Tests

To ensure the validity of the DID estimation, this study constructs parallel trend tests to examine the treatment and control groups without the influence of the NAIIDTZs. Figure 1a,b represent regression results of the parallel trend test, with “pre5-pre1” indicating the pre-treatment years and “after1-after5” indicating the post-treatment years. Estimated coefficients are reported with 95% confidence intervals. From the result, pre-treatment years are insignificant, indicating no systematic differences in CGI between the two groups before the policy shock. In contrast, all post-treatment interaction terms, except the fifth year after the policy in CGI_qual, are statistically positive, confirming the policy intervention had an impact in the years following implementation. Our empirical results are consistent with the parallel trend assumption. The positive influence of DIT on CGI_qual is statistically insignificant in the fifth year after the policy. The core logic of this paper is that DIT can significantly enhance the purchasing efficiency of digital intelligence technologies and software in the initial years, thereby improving the quality of green innovation. Based on the result, we further find that short-term non-equilibrium adjustments may arise due to learning costs and resource reallocation. The dynamic DID results indicate that the influence of DIT on CGI evolves over time, which is consistent with an adjustment process that does not show an immediate equilibrium shift. However, this adjustment process is not unlimited. As companies gradually absorb the benefits of DIT, the marginal effects can gradually diminish over time. Meanwhile, initial advantages can be weakened when other competitors undertake similar DIT. Therefore, the insignificant effect of CGI_qual in the fifth year is consistent with the logic of market efficiency.

4.3.2. Placebo Test

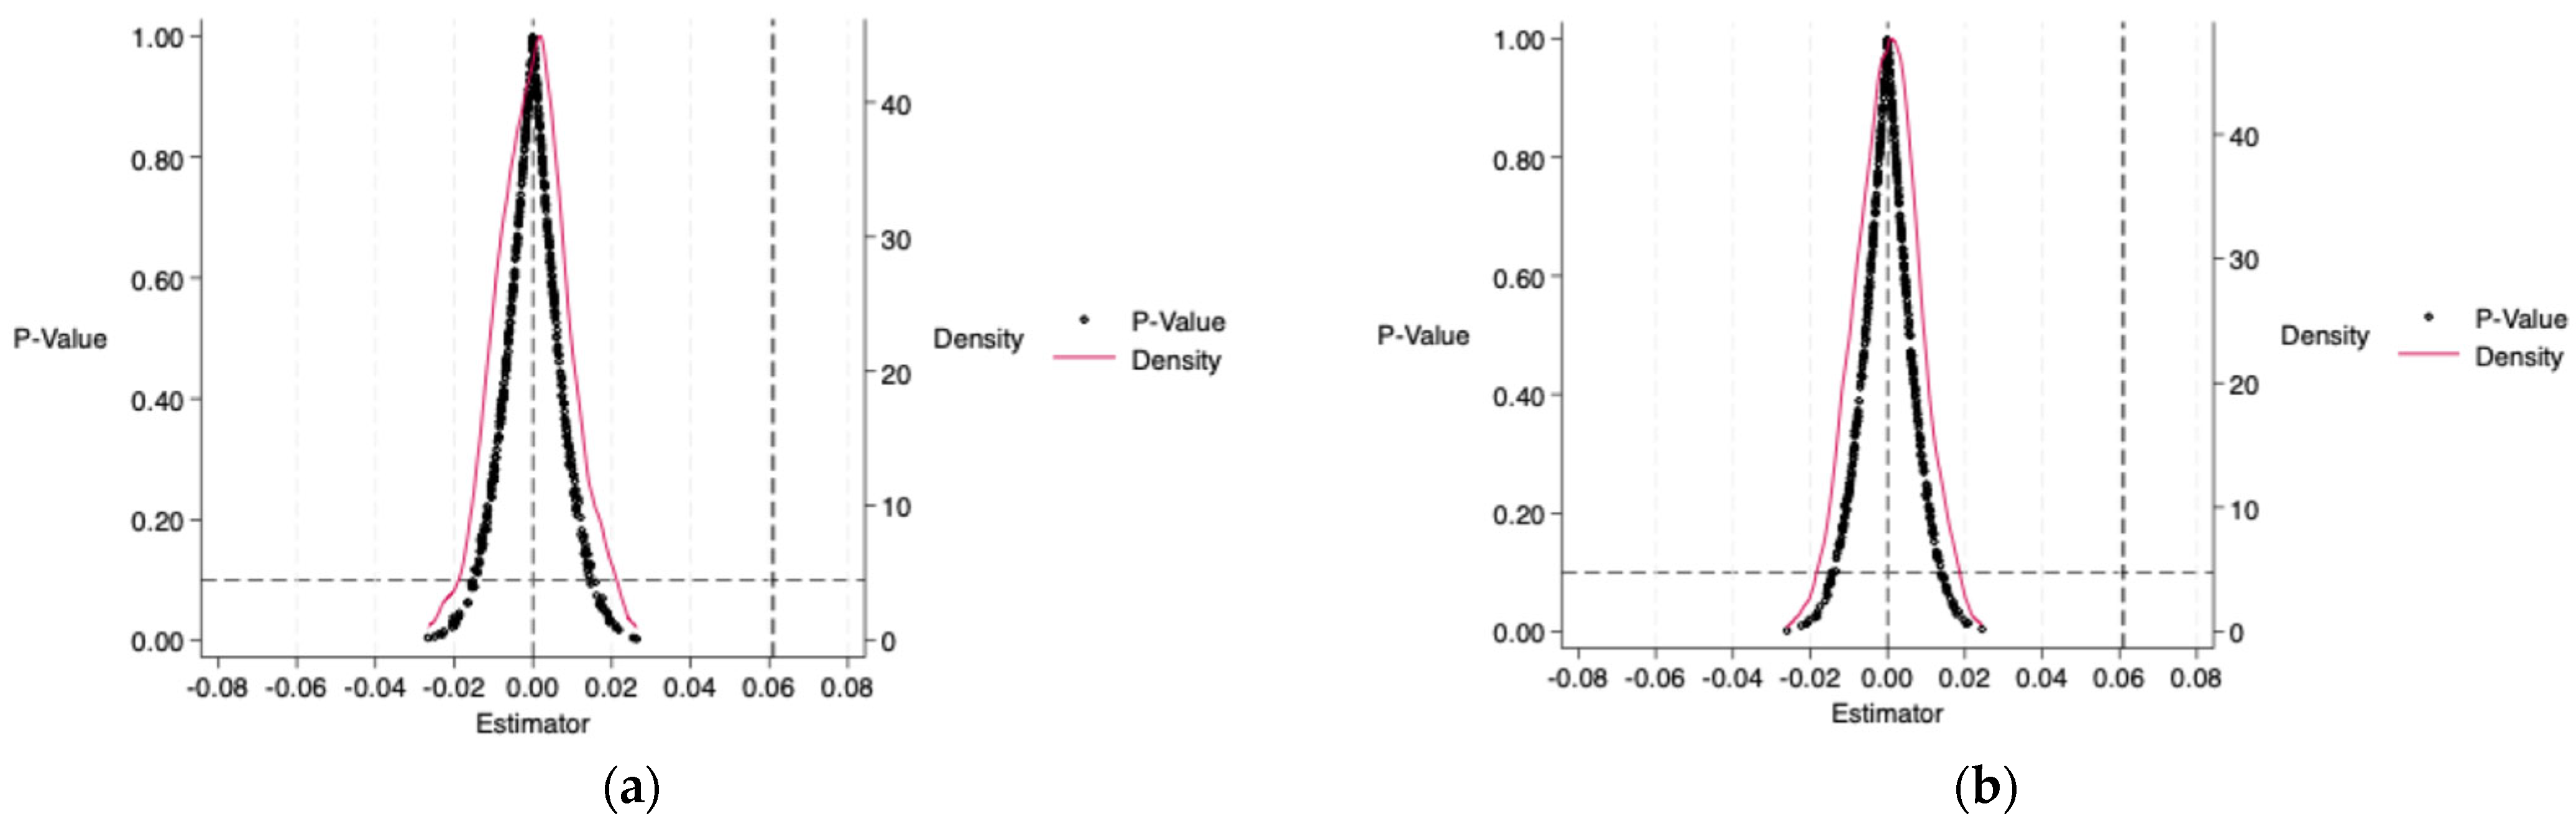
To address the concern that the estimated policy effects may be confounded by unobservable shocks coinciding with the establishment of NAIIDTZs, this study also conducts a placebo test taking a random sampling approach. Specifically, we randomly assign the establishment of NAIIDTZs to cities while holding the policy timing constant, and we repeat this process 500 times to generate empirical distributions of the regression coefficients for both CGI quantity and quality. Figure 2a,b present the placebo test results based on randomly assigning the NAIIDTZ treatment across cities while keeping the timing structure unchanged. The estimated coefficients and their 95% confidence intervals are centered around zero, and the vast majority of p-values are statistically insignificant. In addition, the baseline DID coefficients are outside the bulk of the placebo distributions. These findings indicate that the observed policy effects are unlikely to be driven by random chance and instead reflect the genuine causal impact of NAIIDTZs.

4.3.3. PSM-DID Tests

Even though the DID model can partially mitigate endogeneity concerns, the establishment of the NAIIDTZs does not constitute a strict natural experiment, indicating the potential risks for selection bias. The PSM-DID approach is used for robustness checks. This study employs nearest-neighbor matching, taking Age, Indep, RAD, and Lev as matching variables. Post-matching balance tests show that the standardized mean differences of all covariates are substantially reduced. There are no statistically significant differences between the treated and control groups, implying satisfactory matching quality. The results are shown in Table 4, where the regression coefficients of CGI_quan and CGI_qual are 0.071 (p < 0.05) and 0.090 (p < 0.05), respectively, confirming that the estimation results remain robust after employing the PSM-DID approach.

4.3.4. Eliminating Interference of Other Policies

The estimated regression results may not exclusively describe the policy impact of NAIIDTZs. Two policies, SCP (Smart City Pilot Policy) and NBDCPZs (National Big Data Comprehensive Pilot Zones), respectively, may have impacts on CGI during the same period. The SCP focuses on improving the city’s digital and intelligent level and provides infrastructural support for companies within the city in developing digital intelligence practices [38]. NBDCPZs promote digital and intelligent data flows within the zones, which may also generate spillover effects on CGI [39].
To account for these possible influences, we include dummy variables for both the SCP and NBDCPZs in the regressions. Columns (1)–(3) of Table 5 report the results for CGI_quan, while columns (4)–(6) report those for CGI_qual. The coefficients of the SCP and NBDCPZs remain statistically significant and stable across all model specifications, indicating that the core findings are not driven by these alternative policy shocks. Moreover, the coefficients of the DID of both CGI_quan and CGI_qual are significantly positive, but the coefficients of the SCP and NBDCPZs are statistically insignificant, suggesting that these policies did not exert a direct influence on the outcome variables. These results reinforce the credibility of the identification strategy.

4.3.5. Other Robustness Tests

Our study also takes the following robustness tests: (1) Delayed one-period inspection: We delay the one-period inspection and conduct the regression by using the one-period lag of the policy implementation year as the explanatory variable, in order to perform a robustness test that accounts for the time it takes for the policy to be implemented and its lagged impact on CGI. The regression results are shown in columns (1) and (4) of Table 6. (2) Replacing the explained variable: We employ the data on green patent authorization to replace the data on green patent applications to compute both the quantity and quality of CGI for re-estimation. The regression results are presented in columns (3) and (6) of Table 6. (3) Excluding samples of municipalities: Since municipalities differ from other prefecture-level cities in terms of policy support, fiscal basis, and innovative environments, we exclude corporations located in these municipalities (Beijing, Shanghai, Shenzhen, Tianjin, and Chongqing) before conducting the regression analysis. All results are displayed in columns (2) and (5) of Table 6. It is discovered that the estimated coefficient of the DID remains significantly positive, implying the results are robust.

4.4. Mechanism Analysis

DIT significantly improves both the quantity and the quality of CGI, as shown in the previous analysis. We further examine how DIT influences CGI through R&D capital input and managerial myopia by employing the following model to analyze these mechanisms:
M i t = α 0 + α 1 D I D i t + α 2 C o n t r o l s i , t + λ t + δ i + μ i t
In Equation (2), Mit serves as the mechanism indicator. Other variables are in line with the baseline regression analysis.

4.4.1. R&D Human Capital Input

This study employs the R&D personnel ratio as the core index to evaluate R&D human capital input (RHC), obtained from the CSMAR database. As reported in columns (1) and (3) of Table 7, the coefficient of the DID is significantly positive, and both the DID and RHC are positive regarding CGI’s quantity. The results confirm that DIT can increase R&D human capital input, thus increasing CGI’s quantity. The findings indicate that R&D human capital input can help corporates increase their execution, researching, and planning capacity, thus enabling corporates to apply advanced technologies in broader scenarios but not fundamentally deepen technological complexity. Accordingly, H3 is supported.

4.4.2. Managerial Myopia

Our study adopts textual analysis to measure managerial myopia, using the relative frequency of short-termism words (e.g., “within days”, “as soon as possible”, and “immediately”) in MD&A reports [33,40,41]. All MD&A reports are from the WinGo financial text analytics platform. Specifically, the index is calculated as the frequency of short-term-related vocabulary relative to the total word count, multiplied by 100. As shown in column (2) of Table 7, the DID significantly reduces managerial myopia (β = −0.056, p < 0.05), indicating that DIT can address managerial short-term orientation. Column (4) further shows that both the DID and managerial myopia significantly impact CGI’s quality, suggesting that mitigating managerial myopia helps increase corporate willingness to undertake projects with greater uncertainty and longer returns, which in turn contributes to the increase in the CGI’s quality improvement. Taken together, these findings imply that DIT enhances the quality of CGI by relaxing managers’ cognitive and strategic constraints. Accordingly, H4 is supported.

4.5. Heterogeneity Analysis

Our study undertakes a subgroup analysis from firm, region, and industry dimensions to further investigate potential heterogeneity in the impact of DIT on CGI. For firm-level heterogeneity, technological intensity can capture variations in both absorptive capacity and R&D capabilities, both of which play critical roles in transforming DIT into specific practices [42]. At the region level, the locations of corporations in China exhibit differences in digital infrastructure and economic development, which provide varying levels of support for utilizing DIT to enhance CGI. For industry-level heterogeneity, market competition intensity can capture differing innovation incentives and strategic responses, which influence the managerial response to CGI [43]. This multi-dimensional heterogeneity design helps understand the effectiveness of when and where DIT has a stronger impact on CGI. All data is from the CSMAR database.

4.5.1. Technological Intensity: High-Tech vs. Low-Tech

At the firm level, why do corporates operating under similar technological environments present different DIT processes and different efficiencies in translating those processes into green innovation outcomes? In addressing this question, technological intensity serves as a key indicator reflecting corporates’ capability to absorb and utilize digital tools for green innovation [42]. Based on this, our study categorizes companies into high-tech and low-tech intensity following the industrial classification standard issued by the 2013 High-Tech Industry Classification, introducing the binary variable that equals 1 for high-tech companies and 0 otherwise.
Table 8 reports the results, showing that DIT in high-tech-intensity companies has a significant positive impact on both the quantity and quality of CGI. The coefficients of low-tech firms in both quantity and quality are not statistically significant, and the between-group difference is statistically significant. These results indicate that DIT is more effectively translated into CGI in high-tech corporations. The possible reasons may lie in the fact that most high-tech corporates possess higher absorptive capabilities and digital analyzing abilities, allowing them to rapidly and effectively integrate and leverage digital intelligence tools into R&D and environmental management. In contrast, low-tech firms face limited resource allocation and constraints in both technological investment and R&D personnel structures, all of which negatively influence the effective transmission of DIT to CGI engagement.

4.5.2. Regional Development: Eastern vs. Central-Western China

Eastern regions in China differ from central and western regions in terms of higher GDP, stronger industrial bases, and better governance quality, while the latter two share similar infrastructure density [44]. Our study divides the sample corporates into eastern and central-western regions based on the official National Regional Classification Standard to further investigate the regional heterogeneity in the effect of DIT on CGI.
The results, which are shown in Table 9, indicate that the DID coefficients are positive for both the quantity and quality of CGI in eastern regions, whereas the effects are insignificant in central-western regions. The between-group differences are statistically significant. These findings indicate that DIT is more effectively translated into CGI in eastern regions, likely because corporates in these regions possess superior capabilities in conducting DIT and in embedding advanced intelligent techniques and environmental cognition into their green innovation practices. These advantages may stem from richer digital infrastructure, more knowledge networks and stronger human capital.

4.5.3. Market Competition: High vs. Low Intensity

At the industry level, industrial market structure determines the efficiency of resource allocation, and corporates operating under different industrial market structures are limited by markedly different environmental influences [43]. When the degree of industrial market competition is higher, corporates tend to increase their resource allocation efficiency to obtain advantages in the fierce competition. Given this, will the DIT process have significantly differentiated impacts among corporate groups operating under various levels of industrial market competition? To examine this issue, our study employs the Herfindahl–Hirschman Index (HHI) to represent the level of industrial market competition. Based on the annual median of HHI, corporates are divided into high-HHI (low market competition) and low-HHI (high market competition) groups.
It can be seen in Table 10 that the DID exerts a significantly positive influence on both the quantity and quality of CGI in low-HHI industries, indicating that the DID coefficients are positive for both the quantity and quality of CGI in intense market competition, whereas the effects are insignificant in low market competition. The between-group differences are statistically significant. The findings indicate that the positive influence of DIT on CGI is amplified in markets with intense competition, suggesting that corporates facing fierce market competition tend to respond rapidly to the market dynamics and adjust their resource allocation strategies. However, in low-competition markets, companies tend to have more organizational inertia in promoting DIT in CGI.

4.6. Further Analysis: The Effect on Carbon Emission Reduction Performance

Carbon emission reduction performance (CERP), evaluated by the emission efficiency of greenhouse gases when corporates create economic outputs, reflects corporates’ energy efficiency and emission reduction capability [45]. In modern times, when climate risks are intensifying and the economic environment is increasingly uncertain, corporates with poor CERP are facing greater environmental pressure, social supervision pressures, and higher capital costs. To maintain green images and competitiveness, corporates need to improve CERP to help achieve net-zero objectives [35]. In this context, analyzing how green innovation’s quantity and quality affects CERP can help recognize the role of the CGI in facilitating emission reduction in long-term competitiveness. Following Liu and Zhang (2024), our study uses the operating income per unit of carbon emissions as a proxy variable for representing CERP [46], which is calculated as follows:
C E R P = C o r p o r a t e   O p e r a t i n g   I n c o m e I n d u s t r y   C a r b o n   E m i s s i o n s I n d u s t r y   M a i n   B u s i n e s s   C o s t + 1 × B u s i n e s s   O p e r a t i n g   c o s t
The larger the value of the indicator, the greater the performance of companies in reducing carbon emissions, and all data are from the CEAD database. In addition, considering the time lag, we also include the 1–3 year lagged values in the analysis. As illustrated in Table 11, both the quantity and quality of CGI show a dynamic time lag effect on CERP. In the first two years, CGI_quan exhibits either no significant impact or a negative effect, while CGI_qual has a consistently negative impact. Both findings indicate that corporates initially engaging in CGI may need to adjust R&D personnel structures and increase the purchase of new equipment, which may temporarily lower carbon efficiency. However, from the second lagged year, both the quantity and quality of CGI show a positive influence on CERP, indicating that green innovation starts to create technological diffusion and energy efficiency improvements to deliver emission reduction benefits for corporates. All data show that the effect of green innovation on CERP cannot be detected immediately. Instead, it follows a transition from short-term adjustment costs—including temporary inefficiencies related to capacity and facility replacement, and the reallocation of resources towards R&D, which reduces short-term investment in energy efficiency—to long-term gains in carbon efficiency.

5. Conclusions, Implications, and Limitations

5.1. Discussions and Conclusions

The transformation of digital intelligence within companies has emerged as a trend for future green innovation development. Using a staggered DID design based on the establishment of China’s NAIIDTZs, we demonstrate that DIT dramatically increases both the quantity and quality of CGI. Moreover, this result is consistent with our extended analysis indicating that green innovation with high quality can dramatically reduce carbon emissions. Mechanism analysis shows that DIT stimulates R&D human capital input to expand the quantity of green innovation while reducing managerial myopia and encouraging corporates to explore more sophisticated and high-valued techniques, thus improving the quality of green innovation. Heterogeneity analysis indicates that the effect of DIT on CGI is more pronounced in fierce market competition, high technological intensity, and those located in eastern regions. A series of robustness checks further confirm the reliability of these findings.
Consistent with the existing studies, our results confirm the positive effect of DIT on CGI’s quantity and further extend existing studies by identifying the role of DIT in increasing the quality of CGI, rather than diverting attention away from corporates’ core innovative business, which is suggested in other studies [13]. Furthermore, our study extends beyond the specific context of green innovation, suggesting that internal decision-making constraints in R&D human resource allocation and managerial short-term orientation constitute a general mechanism through which DIT shapes corporate long-term substantive green innovation outcomes. More importantly, unlike existing studies that attribute CGI to resource endowments or institutional pressure, we provide novel evidence that the impact of DIT on CGI is influenced by corporate internal decision-making constraints. In addition, unlike prior studies that assume an immediate environmental impact from green innovation, we discover a lagged effect of CGI on CERP [45]. The possible reasons may arise from the widespread use of digital intelligence technologies, which increases energy consumption during technology diffusion, while long-term deployment improves the energy efficiency and reduces emissions at the source, particularly for high-quality CGI outputs.
Furthermore, our study provides a broader contribution to international studies in developing green innovation. Although we focus on China’s institutional context, corporate internal decision-making constraints including R&D human capital input and managerial myopia are common in other emerging and developed economies. Therefore, firms in other economies still need to promote DIT to increase R&D human capital input and reduce managerial myopia to improve CDI practice. However, the extent to which DIT translates to substantive CGI is likely to vary across contexts depending on regional digital infrastructure, corporate technological intensity, and market competition.

5.2. Theoretical and Practical Implications

These findings carry important implications for theoretical, organizational, and policymaker levels. At the theoretical level, our study extends the application of the dynamic capabilities theory to the field of digital intelligence transformation and enriches the green innovation literature by introducing an internal decision-making perspective to explain how DIT differentiates the quantity and quality of CGI. Unlike existing studies focusing on institutional pressure or resource endowments, we highlight R&D human capital input and managerial myopia as critical internal decision-making mechanisms through which DIT is translated into substantive green innovation.
At the organizational level, corporates are advised to advance digital intelligence transformation as a strategic decision-making initiative rather than a technological upgrade to strengthen CGI. In particular, greater emphasis should be put on increasing R&D human capital input and reducing managerial myopia, for example, by aligning managerial evaluation and incentive strategies with long-term innovation objectives and sustainable performance, as these two factors critically condition how DIT translates into green innovation outcomes.
At the policymakers’ level, compared with recent studies emphasizing the construction of digital infrastructure, our findings suggest that greater attention should be paid to improving corporate internal decision-making capabilities when designing DIT-related policies. Policymakers are advised to make differentiated policies in DIT across regions, considering variations in industrial technology intensity, market competition, and digital infrastructures, so as to effectively stimulate CGI and achieve net-zero objectives.

5.3. Limitations and Future Research

Our study has some limitations and can be further improved. First, we employ secondary data and textual analysis of MD&A reports to examine the internal decision-making mechanisms, which may not capture the dynamic evolution of decision processes or managers’ unobservable psychological traits. Future research could use psychological questionnaires, case studies, or experimental measures to complement textual analysis and empirically validate the proposed framework. Second, even though green patent indicators are widely used to measure green innovation, they may not comprehensively reflect the degree of effectiveness and technology complexity. Future research could integrate patent indicators with more measures to better capture CGI.

Author Contributions

Formal analysis, R.C. and Y.W.; Writing—review and editing, W.Z.; Software and data analysis, Q.L. All authors have read and agreed to the published version of the manuscript.

Funding

This research was funded by the Social Science Foundation of Changchun Normal University (Grant No. CSJJ2024001GSK), Humanities and Social Science Fund of Ministry of Education of China (Grant No. 23YJC630013), and Scientific Research Foundation of Educational Department of Jilin Province (Grant No. JJKH20260372SK).

Institutional Review Board Statement

Not applicable.

Informed Consent Statement

Not applicable.

Data Availability Statement

The data presented in this study are available on request from the corresponding author.

Conflicts of Interest

The authors declare no conflicts of interest.

References

  1. Bai, T.; Qi, Y.; Li, Z.; Xu, D. Digital economy, industrial transformation and upgrading, and spatial transfer of carbon emissions: The paths for low-carbon transformation of Chinese cities. J. Environ. Manag. 2023, 344, 118528. [Google Scholar] [CrossRef] [Scilit]
  2. Takalo, S.K.; Tooranloo, H.S. Green innovation: A systematic literature review. J. Clean. Prod. 2021, 279, 122474. [Google Scholar] [CrossRef] [Scilit]
  3. George, G.; Schillebeeckx, S.J. Digital transformation, sustainability, and purpose in the multinational enterprise. J. World Bus. 2022, 57, 101326. [Google Scholar] [CrossRef] [Scilit]
  4. Cubillas-Para, C.; Tomaseti-Solano, E.; Madrid-Guijarro, A. How do the perception of the technological and symbolic dimensions and the social context affect the green consumer adoption process of eco-innovations? Bus. Strategy Environ. 2024, 33, 2533–2545. [Google Scholar] [CrossRef] [Scilit]
  5. Lian, G.; Xu, A.; Zhu, Y. Substantive green innovation or symbolic green innovation? The impact of environmental regulation on enterprise green innovation based on the dual moderating effects. J. Innov. Knowl. 2022, 7, 100203. [Google Scholar] [CrossRef] [Scilit]
  6. Cao, B.; Li, L.; Zhang, K.; Ma, W. The influence of digital intelligence transformation on carbon emission reduction in manufacturing firms. J. Environ. Manag. 2024, 367, 121987. [Google Scholar] [CrossRef] [Scilit] [PubMed]
  7. Magistretti, S.; Dell’Era, C.; Messeni Petruzzelli, A. How intelligent is Watson? Enabling digital transformation through artificial intelligence. Bus. Horiz. 2019, 62, 819–829. [Google Scholar] [CrossRef] [Scilit]
  8. Song, Y.; Zhang, Y.; Zhang, Z.; Sahut, J. Artificial intelligence, digital finance, and green innovation. Glob. Financ. J. 2025, 64, 101072. [Google Scholar] [CrossRef] [Scilit]
  9. Ben Slimane, S.; Coeurderoy, R.; Mhenni, H. Digital transformation of small and medium enterprises: A systematic literature review and an integrative framework. Int. Stud. Manag. Organ. 2022, 52, 96–120. [Google Scholar] [CrossRef] [Scilit]
  10. Appio, F.P.; Frattini, F.; Petruzzelli, A.M.; Neirotti, P. Digital transformation and innovation management: A synthesis of existing research and an agenda for future studies. J. Prod. Innov. Manag. 2021, 38, 4–20. [Google Scholar] [CrossRef] [Scilit]
  11. Zhu, X.; Li, Y. The use of data-driven insight in ambidextrous digital transformation: How do resource orchestration, organizational strategic decision-making, and organizational agility matter? Technol. Forecast. Soc. Change 2023, 196, 122851. [Google Scholar] [CrossRef] [Scilit]
  12. Rammer, C.; Fernández, G.P.; Czarnitzki, D. Artificial intelligence and industrial innovation: Evidence from German firm-level data. Res. Policy 2022, 51, 104555. [Google Scholar] [CrossRef] [Scilit]
  13. Cheng, J.; Xu, N.R.; Khan, N.U.; Singh, H.S.M. The impacts of artificial intelligence literacy, green absorptive capacity, and green information system on green innovation. Corp. Soc. Responsib. Environ. Manag. 2025, 32, 2375–2389. [Google Scholar] [CrossRef] [Scilit]
  14. Mijit, R.; Hu, Q.; Xu, J.; Ma, G. Greening through AI? The impact of Artificial Intelligence Innovation and Development Pilot Zones on green innovation in China. Energy Econ. 2025, 146, 108507. [Google Scholar] [CrossRef] [Scilit]
  15. Lin, B.Q.; Yang, Y.X. Building efficiency: How the national AI innovation pilot zones enhance green energy utilization? Evidence from China. J. Environ. Manag. 2025, 387, 125945. [Google Scholar] [CrossRef] [Scilit]
  16. Gao, Y.; Liu, S.; Yang, L. Artificial intelligence and innovation capability: A dynamic capabilities perspective. Int. Rev. Econ. Finance 2025, 98, 103923. [Google Scholar] [CrossRef] [Scilit]
  17. Teece, D.J. The foundations of enterprise performance: Dynamic and ordinary capabilities in an economic theory of firms. Acad. Manag. Perspect. 2014, 28, 328–352. [Google Scholar] [CrossRef] [Scilit]
  18. Wei, H.; Zhang, J.; Yuan, K. Digital horizons, green futures: How does new-generation artificial intelligence pilot zone drive corporate low-carbon transformation? J. Asian Econ. 2025, 100, 102000. [Google Scholar] [CrossRef] [Scilit]
  19. Borah, P.S.; Dogbe, C.S.K.; Pomegbe, W.W.K.; Bamfo, B.A.; Hornuvo, L.K. Green market orientation, green innovation capability, green knowledge acquisition and green brand positioning as determinants of new product success. Eur. J. Innov. Manag. 2023, 26, 364–385. [Google Scholar] [CrossRef] [Scilit]
  20. Akter, S.; Hossain, M.A.; Sajib, S.; Sultana, S.; Rahman, M.; Vrontis, D.; McCarthy, G. A framework for AI-powered service innovation capability: Review and agenda for future research. Technovation 2023, 125, 102768. [Google Scholar] [CrossRef] [Scilit]
  21. Rees-Jones, R.E.; Brown, R.; Jones-Evans, D. Trigger points and high growth firms: The vital role of founder “sensing” and “seizing” capabilities. Int. J. Entrep. Behav. Res. 2024, 30, 1–22. [Google Scholar] [CrossRef] [Scilit]
  22. Lerman, L.V.; Benitez, G.B.; Müller, J.M.; de Sousa, P.R.; Frank, A.G. Smart green supply chain management: A configurational approach to enhance green performance through digital transformation. Supply Chain Manag. 2022, 27, 147–176. [Google Scholar] [CrossRef] [Scilit]
  23. Jiang, H.; Yang, J.; Gai, J. How digital platform capability affects the innovation performance of SMEs: Evidence from China. Technol. Soc. 2023, 72, 102187. [Google Scholar] [CrossRef] [Scilit]
  24. Zahrani, A.A. The influence of green human resource management practices on organizational environmental performance: Mediating roles of green innovation and employee performance. Cogent Bus. Manag. 2024, 11, 2387378. [Google Scholar] [CrossRef] [Scilit]
  25. Chang, Y.; Chen, L.; Zhou, Y.; Meng, Q. Elements, characteristics, and performances of inter-enterprise knowledge recombination: Empirical research on green innovation adoption in China’s heavily polluting industry. J. Environ. Manag. 2022, 310, 114736. [Google Scholar] [CrossRef] [Scilit]
  26. Lee, M.; Kim, Y.; Roh, T. Exploring the role of digital servitization for green innovation: Absorptive capacity, transformative capacity, and environmental strategy. Technol. Forecast. Soc. Change 2024, 207, 123614. [Google Scholar] [CrossRef] [Scilit]
  27. Liang, L.; Li, Y. How does organizational resilience promote firm growth? The mediating role of strategic change and managerial myopia. J. Bus. Res. 2024, 177, 114636. [Google Scholar] [CrossRef] [Scilit]
  28. Yang, S.; Feng, D.; Lu, J.; Wang, C. The effect of venture capital on green innovation: Is environmental regulation an institutional guarantee? J. Environ. Manag. 2022, 318, 115641. [Google Scholar] [CrossRef] [Scilit] [PubMed]
  29. Ben Slimane, S. Absorption–Technological absorptive capacity and innovation: The primacy of knowledge. In Innovation Economics, Engineering and Management Handbook 2; Chapter 3; Uzunidis, D., Kasmi, F., Adatto, L., Eds.; Wiley: Hoboken, NJ, USA, 2021. [Google Scholar]
  30. Wang, Z.; Wu, G.; Miao, Z.; Guo, A. The impact of green and low-carbon technologies on carbon emission intensity: Evidence from patent data in China’s counties. J. Clean. Prod. 2025, 519, 145997. [Google Scholar] [CrossRef] [Scilit]
  31. Shi, N.; Yang, M. Shareholder resource synergy and corporate green innovation in China: A dynamic capabilities and managerial myopia perspective. Environ. Dev. Sustain. 2025; in press. [CrossRef] [Scilit]
  32. Qian, Y.; Chen, J. The green innovation effect of digital transformation: Evidence from the Chinese experience. Environ. Dev. Sustain. 2024; in press.
  33. Brochet, F.; Loumioti, M.; Serafeim, G. Speaking of the short-term: Disclosure horizon and managerial myopia. Rev. Account. Stud. 2015, 20, 1122–1163. [Google Scholar] [CrossRef] [Scilit]
  34. Liang, P.; Sun, X. Does digital transformation promote the green innovation of China’s listed companies? Environ. Dev. Sustain. 2024, 26, 22199–22235. [Google Scholar] [CrossRef] [Scilit]
  35. Chen, R.; Cao, L. How do enterprises achieve sustainable success in the green manufacturing era? The impact of organizational environmental identity on green competitive advantage in China. Kybernetes 2025, 54, 71–89. [Google Scholar] [CrossRef] [Scilit]
  36. Guo, X.; Xu, J. Can urban digital intelligence transformation promote corporate green innovation? Evidence from China. J. Environ. Manag. 2024, 371, 123245. [Google Scholar] [CrossRef] [Scilit] [PubMed]
  37. Sun, G.; Fang, J.; Li, J.; Wang, X. Research on the impact of the integration of digital economy and real economy on enterprise green innovation. Technol. Forecast. Soc. Change 2024, 200, 123097. [Google Scholar] [CrossRef] [Scilit]
  38. Du, R.; Liu, H.; Li, J. Does smart city pilot policy promote the enterprises’ digitalisation? Evidence from a quasi-natural experiment in China. Technol. Anal. Strateg. Manag. 2024, 36, 4730–4744. [Google Scholar]
  39. Lyu, Y.; Xiao, X.; Zhang, J. Does the digital economy enhance green total factor productivity in China? The evidence from a national big data comprehensive pilot zone. Struct. Change Econ. Dyn. 2024, 69, 183–196. [Google Scholar] [CrossRef] [Scilit]
  40. Hu, N.; Xue, F.J.; Wang, H.N. Does managerial myopia affect long-term investment? Based on text analysis and machine learning. Manag. World 2021, 37, 139–156. [Google Scholar]
  41. Lu, Q.; Deng, J.; Chen, S.; Hussain, Y. Managerial myopia and its barrier to green innovation in high-pollution enterprises: A machine learning approach. J. Environ. Manag. 2025, 376, 124477. [Google Scholar] [CrossRef] [Scilit]
  42. Hwang, H.; Jang, S.; Chung, Y.; Seo, H. How do technological intensity and competition affect R&D persistence? A new approach using cost asymmetry model. Technol. Anal. Strateg. Manag. 2023, 35, 962–978. [Google Scholar]
  43. Chai, J.; Wang, L.; Guo, J.; Wu, A. The impact mechanism of regional competition policy intensity on market competition efficiency: Evidence from Chinese IT industry. Appl. Econ. 2025; in press.
  44. Du, G.; Zhou, C.; Ma, Y. Impact mechanism of environmental protection tax policy on enterprises’ green technology innovation with quantity and quality from the micro-enterprise perspective. Environ. Sci. Pollut. Res. 2023, 30, 80713–80731. [Google Scholar] [CrossRef] [Scilit] [PubMed]
  45. Miao, X.; Feng, E.; Siu, Y.L.; Li, S.; Wong, C.W.Y. Can China’s carbon intensity constraint policies improve carbon emission performance? Evidence from regional carbon emissions. J. Environ. Manag. 2023, 348, 119268. [Google Scholar] [CrossRef] [Scilit] [PubMed]
  46. Liu, X.M.; Zhang, Y.Q. Digital transformation, green innovation, and carbon emission reduction performance of energy-intensive enterprises. Sci. Rep. 2024, 14, 54587. [Google Scholar] [PubMed]
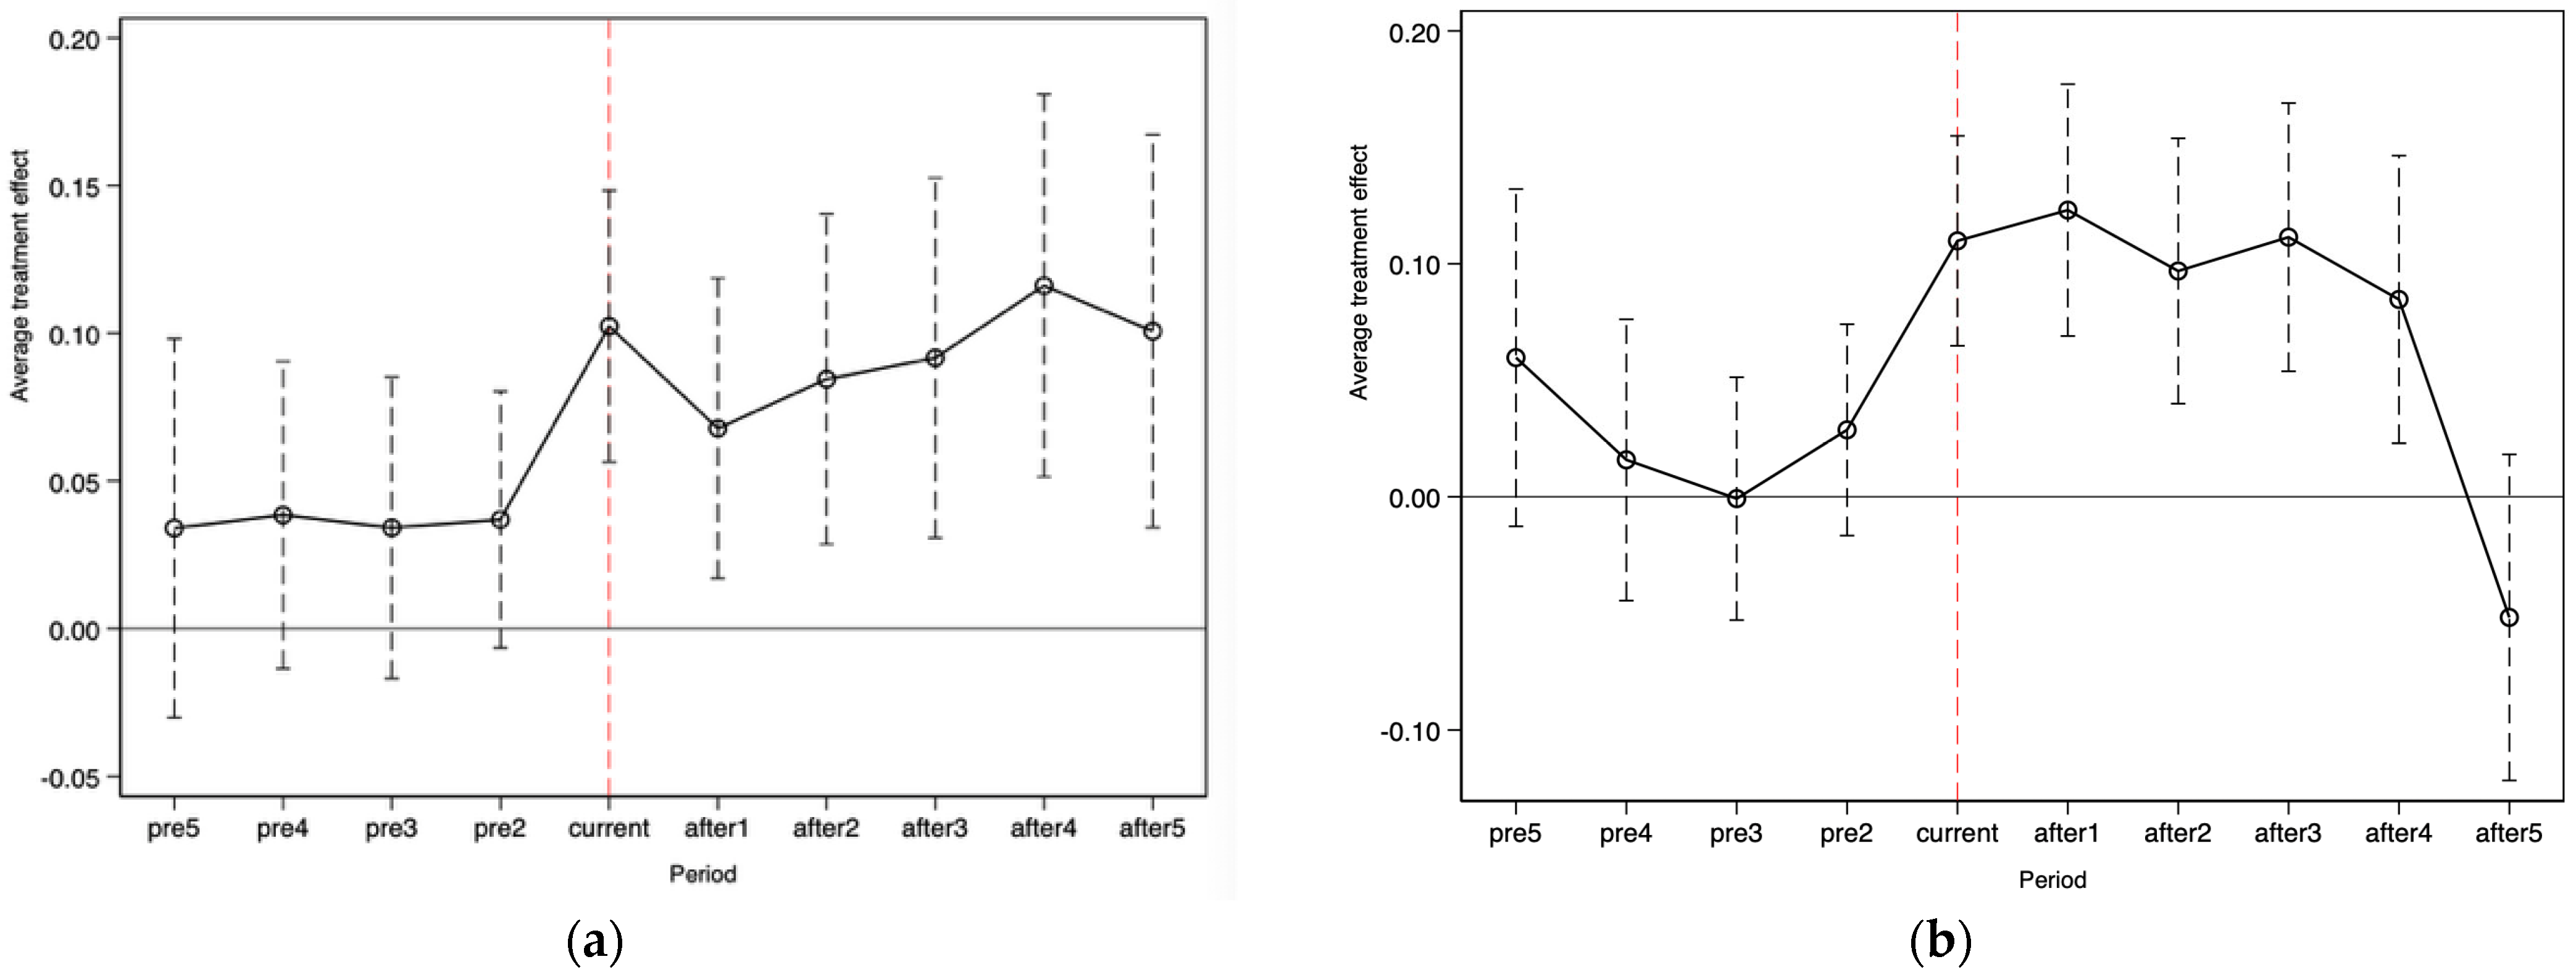
Figure 1. (a) Parallel trend test result of CGI_quan. (b) Parallel trend test result of CGI_qual. Note: The horizontal axis reports periods relative to the policy implementation year, where “pre5” to “pre1” denote the five years before treatment, “current” denotes the treatment year, and “after1” to “after5” denote the five years after treatment. The dots represent point estimates of the dynamic DID coefficients and the vertical bars indicate 95% confidence intervals.
Sustainability 18 01110 g001
Figure 2. (a) Placebo test result of CGI_quan. (b) Placebo test result of CGI_qual.
Sustainability 18 01110 g002
Table 1. Variable and definition.
Variable TypeSymbolDefinition
Dependent variableCGI_quanln (Number of applied green patents applied this year + 1)
CGI_qualln (Citationstt+2 + 1)
Independent variableDIDDummy variable. A value of 1 if the firm’s city/autonomous received either new approval or retained prior approval in that year and 0 if otherwise
Control variablesLevTotal liabilities/total assets
ROANet income/total assets
RADR&D expenses at Year-End/operating revenue at Year-End
FinrateFinancial expenses at Year-End/operating revenue at Year-End
Age ln (Current Year − Year of Listing + 1)
NatureValue of 1 if the company is state-owned and 0 if otherwise.
Top1Shares held by largest shareholder/total number of shares
MshareShares held by management/total number of shares
IndepNumber of independent directors/total number of directors
DualityValue of 1 if the roles are combined and 0 if otherwise
Table 2. Descriptive statistics of main variables.
VariableMeanSDMinP25P50P75Max
DID0.2640.38500011
CGI_quan0.5020.9290000.6937.062
CGI_qual0.9431.3590001.6097.932
Mshare13.26718.46500.0061.53424.39589.177
Indep37.6575.46214.29033.33036.36042.86083
Age11.1797.3210591733
Top132.17714.4780.29021.28029.96041.30089.990
Lev0.4150.212−0.0870.2540.4050.5605.724
ROA0.0090.017−0.1250.0010.0070.0150.746
Finrate0.0210.191−15.443−0.0010.0100.02713.852
RAD0.0320.097−0.01100.0030.0406.318
Table 3. Baseline regression results.
VariableCGI_quanCGI_qual
(1)(2)(3)(4)(5)(6)(7)(8)
DID0.066 **
(2.57)
0.233 ***
(6.92)
0.080 ***
(3.16)
0.027 **
(2.60)
0.057 **
(2.33)
0.284 ***
(9.82)
0.206 ***
(7.57)
0.061 **
(2.52)
Mshare −0.010 **
(−0.67)
0.023
(1.63)
0.018
(1.24)
−0.028 *
(−1.86)
−0.034 **
(−2.405)
−0.068 ***
(−4.27)
Indep 0.005
(0.38)
0.018 *
(1.95)
0.019 **
(2.02)
−0.015
(−1.15)
−0.008
(−0.73)
−0.006
(−0.65)
Age −0.105 ***
(−5.60)
0.095 ***
(4.39)
−0.073
(−0.38)
−0.047 ***
(−2.73)
−0.505 ***
(−20.27)
0.680
(1.36)
Top1 0.020
(1.22)
−0.003
(−0.21)
−0.001
(−0.01)
−0.012
(−0.76)
−0.055 ***
(−2.80)
−0.033 *
(−1.86)
Lev 0.181 ***
(10.43)
0.009
(0.73)
0.013
(1.03)
0.189 ***
(11.47)
−0.010
(−0.68)
0.058 ***
(4.47)
ROA 0.043 ***
(3.73)
0.022 ***
(3.16)
0.016 **
(2.19)
0.007
(0.60)
−0.013
(−1.45)
−0.011
(−1.37)
Finrate −0.060 ***
(−3.45)
−0.010
(−1.02)
−0.014
(−1.41)
−0.031
(−1.95)
0.053 ***
(5.19)
−0.006
(−0.73)
RAD 0.109 ***
(6.82)
0.021 *
(1.95)
0.008
(0.65)
0.037 ***
(3.79)
−0.088 ***
(−7.88)
−0.047 ***
(−3.86)
Duality −0.047 *
(−1.72)
−0.005
(−0.25)
−0.002
(−0.10)
−0.059 *
(−2.19)
−0.029
(−1.33)
−0.020
(−1.04)
Nature 0.191 ***
(4.64)
−0.035
(−0.82)
−0.038
(−0.90)
0.172 ***
(4.38)
−0.151 ***
(−3.29)
−0.063
(−1.45)
Year FEYesYes YesYesYes Yes
Firm FEYes YesYesYes YesYes
Observations19,44019,20219,20219,20219,20219,44019,20219,202
Within R20.0550.0550.0130.0020.0010.0730.1250.010
Note: *** p < 0.01; ** p < 0.05; * p < 0.1; and robust standard errors are in parentheses. The t value is corrected after clustering at the enterprise level.
Table 4. PSM-DID results.
VariablesCGI_quanCGI_qual
(1)(2)
DID0.071 **
(2.26)
0.090 ***
(2.92)
ControlsYesYes
Year FEYesYes
Firm FEYesYes
Observations11,95211,952
Within R20.0040.009
Note: *** p < 0.01; ** p < 0.05; and robust standard errors are in parentheses. The t value is corrected after clustering at the enterprise level.
Table 5. Eliminating other policies’ interference.
VariablesCGI_quanCGI_qual
(1)(2)(3)(4)(5)(6)
DID0.066 **
(2.55)
0.094 ***
(2.98)
0.092 ***
(2.95)
0.062 **
(2,54)
0.076 ***
(2.97)
0.075 ***
(2.95)
SCP−0.062
(−0.33)
0.021
(0.65)
0.033
(0.67)
−0.022
(−0.49)
NBDCPZs −0.036
(−0.97)
−0.035
(−0.97)
−0.027
(−0.99)
−0.027
(−0.99)
ControlsYesYesYesYesYesYes
Year FEYesYesYesYesYesYes
Firm FEYesYesYesYesYesYes
Observations19,20219,20219,20219,20219,20219,202
Within R20.0030.0030.0030.0100.0070.007
Note: *** p < 0.01; ** p < 0.05; and robust standard errors are in parentheses. The t value is corrected after clustering at the enterprise level.
Table 6. Results of other robustness tests.
VariableCGI_quanCGI_quan2CGI_qualCGI_qual2
(1)(2)(3)(4)(5)(6)
d_DID0.020 **
(2.20)
0.021 **
(3.90)
DID 0.018 **
(2.08)
0.028 ***
(3.00)
DID 0.037 **
(2.43)
0.042 ***
(2.84)
Controls YESYESYESYESYESYES
Year FEYESYESYESYESYESYES
Firm FEYESYESYESYESYESYES
Observations19,20219,20219,20219,20219,20219,202
Within R20.0070.0080.0020.1470.1480.010
Note: *** p < 0.01; ** p < 0.05; and robust standard errors are in parentheses. The t value is corrected after clustering at the enterprise level.
Table 7. Mechanism regression results.
VariablesRHCMyopiaCGI_quanCGI_qual
(1)(2)(3)(4)
DID0.113 ***
(4.21)
−0.056 **
(−2.12)
0.062 **
(2.42)
0.061 **
(2.51)
RHC 0.041 ***
(2.83)
Myopia −0.032 **
(−2.31)
ControlsYesYesYesYes
Year FEYesYesYesYes
Firm FEYesYesYesYes
Observations19,20219,20219,20219,202
Within R20.0300.0060.0030.010
Note: *** p < 0.01; ** p < 0.05; and robust standard errors are in parentheses. The t value is corrected after clustering at the enterprise level.
Table 8. Technological intensity results.
VariablesCGI_quanCGI_qual
(1)
High-Tech
(2)
Low-Tech
(3)
High-Tech
(4)
Low-Tech
DID0.030 **
(1.93)
0.024
(1.48)
0.046 **
(3.54)
0.026
(1.58)
Empirical p-value0.028 **0.041 **
ControlsYesYesYesYes
Year FEYesYesYesYes
Firm FEYesYesYesYes
Observations13,434600613,4346006
Within R20.0660.0630.0750.066
Note: ** p < 0.05 and robust standard errors are in parentheses. The empirical p-value was calculated by Fisher’s Permutation test (1000 samples).
Table 9. Regional development results.
VariablesCGI_quanCGI_qual
(1)
Eastern
(2)
Central-Western
(3)
Eastern
(4)
Central-Western
DID0.025 **
(1.90)
0.022
(1.11)
0.051 ***
(4.14)
0.025
(1.37)
Empirical p-value0.037 **0.013 **
ControlsYesYesYesYes
Year FEYesYesYesYes
Firm FEYesYesYesYes
Observations14,127531314,1275313
Within R20.0520.0750.0690.074
Note: *** p < 0.01; ** p < 0.05; and robust standard errors are in parentheses. The empirical p-value was calculated by Fisher’s Permutation test (1000 samples).
Table 10. Market competition results.
VariablesCGI_quanCGI_qual
(1)
Low HHI
(2)
High HHI
(3)
Low HHI
(4)
High HHI
DID0.035 **
(2.17)
0.012
(0.80)
0.049 ***
(3.26)
0.016
(0.92)
Empirical p-value0.029 **0.044 **
Controls YesYesYesYes
Year FEYesYesYesYes
Firm FEYesYesYesYes
Observations9694974696949746
Within R20.0540.0610.0690.066
Note: *** p < 0.01; ** p < 0.05; and robust standard errors are in parentheses. The empirical p-value was calculated by Fisher’s Permutation test (1000 samples).
Table 11. Regression results of CGI on CERP.
CERPL1.CERPL2.CERPL3.CERP
(1)(2)(3)(4)(5)(6)(7)(8)
CGI_quan−0.012
(−1.57)
−0.016 **
(−2.49)
0.036 **
(2.02)
0.025 *
(1.75)
CGI_qual −0.049 ***
(−3.47)
−0.035 ***
(−3.40)
0.037 **
(2.03)
0.036 **
(1.99)
ControlsYesYesYesYesYesYesYesYes
Year FEYesYesYesYesYesYesYesYes
Firm FEYesYesYesYesYesYesYesYes
Observations19,20219,20219,20219,20219,20219,20218,29218,292
Within R20.0120.0160.0130.0150.0020.0040.0030.003
Note: *** p < 0.01; ** p < 0.05; * p < 0.1; and robust standard errors are in parentheses. The t value is corrected after clustering at the enterprise level.
Disclaimer/Publisher’s Note: The statements, opinions and data contained in all publications are solely those of the individual author(s) and contributor(s) and not of MDPI and/or the editor(s). MDPI and/or the editor(s) disclaim responsibility for any injury to people or property resulting from any ideas, methods, instructions or products referred to in the content.