1. Introduction
Steels remain the backbone of modern infrastructure, transportation, and energy systems, and incremental improvements in their mechanical performance have considerable economic and environmental impacts [
1,
2]. Ultimate tensile strength (UTS) is a key design parameter for structural and high-performance steels, as it constrains allowable stresses, safety factors, and service lifetimes [
3]. Traditionally, UTS has been tuned through empirical adjustments of composition and heat-treatment schedules, guided by physical metallurgy and iterative plant or laboratory trials [
4]. However, as alloy chemistries become more complex and processing routes more diverse, this trial-and-error approach becomes increasingly costly, time-consuming, and resource-intensive [
5,
6,
7,
8]. At the same time, the advances in machine learning (ML) provide new opportunities to learn quantitative structure processing property relationships directly from data and to accelerate the design and optimization of steels [
6,
8]. The objectives of this study are to (i) construct a physically consistent, ML-ready dataset of heat-treated steels by combining full chemical composition with structured heat-treatment descriptors extracted from free-text records; (ii) develop and evaluate a leakage-free baseline model for predicting UTS that generalizes to unseen composition–processing conditions; and (iii) interpret the learned relationships to identify which compositional and processing variables most strongly govern strength, with an emphasis on actionable and physically meaningful trends.
Although the mechanisms governing strength in steels are well established, encompassing solid-solution strengthening, precipitation, grain refinement, and transformation hardening, the combined effects of multiple alloying elements and multi-step heat treatments are highly nonlinear [
7,
9]. This complexity makes it challenging to derive simple, generalizable models that accurately predict UTS over a wide range of compositions and processing conditions [
10]. In recent years, ML methods such as artificial neural networks, support vector machines, gradient boosting, and Random Forests (RFs) have been increasingly applied to steels and other alloys to predict mechanical properties from composition and processing descriptors [
6,
7,
11]. Many of these studies have reported promising accuracy and demonstrated the potential of data-driven approaches to complement conventional alloy design [
12]. Still, they often rely on proprietary datasets, focus on narrow composition ranges or specific grades, or give limited attention to interpretability and physically meaningful preprocessing [
7].
Accordingly, the overall goal of this work is to develop a transparent and reproducible machine-learning workflow that predicts UTS from information that is commonly available in the literature, chemical composition, and basic heat-treatment descriptors—while reporting conservative generalization to unseen composition–processing conditions. This goal is addressed through three research questions: (1) Can UTS be predicted accurately from tabular composition + extracted processing descriptors using a simple ensemble model? (2) How does performance change when evaluation is made leakage-free by grouping repeated measurements into unique thermomechanical states? (3) Which variables dominate the predictions, and do their effects agree with established metallurgical expectations?
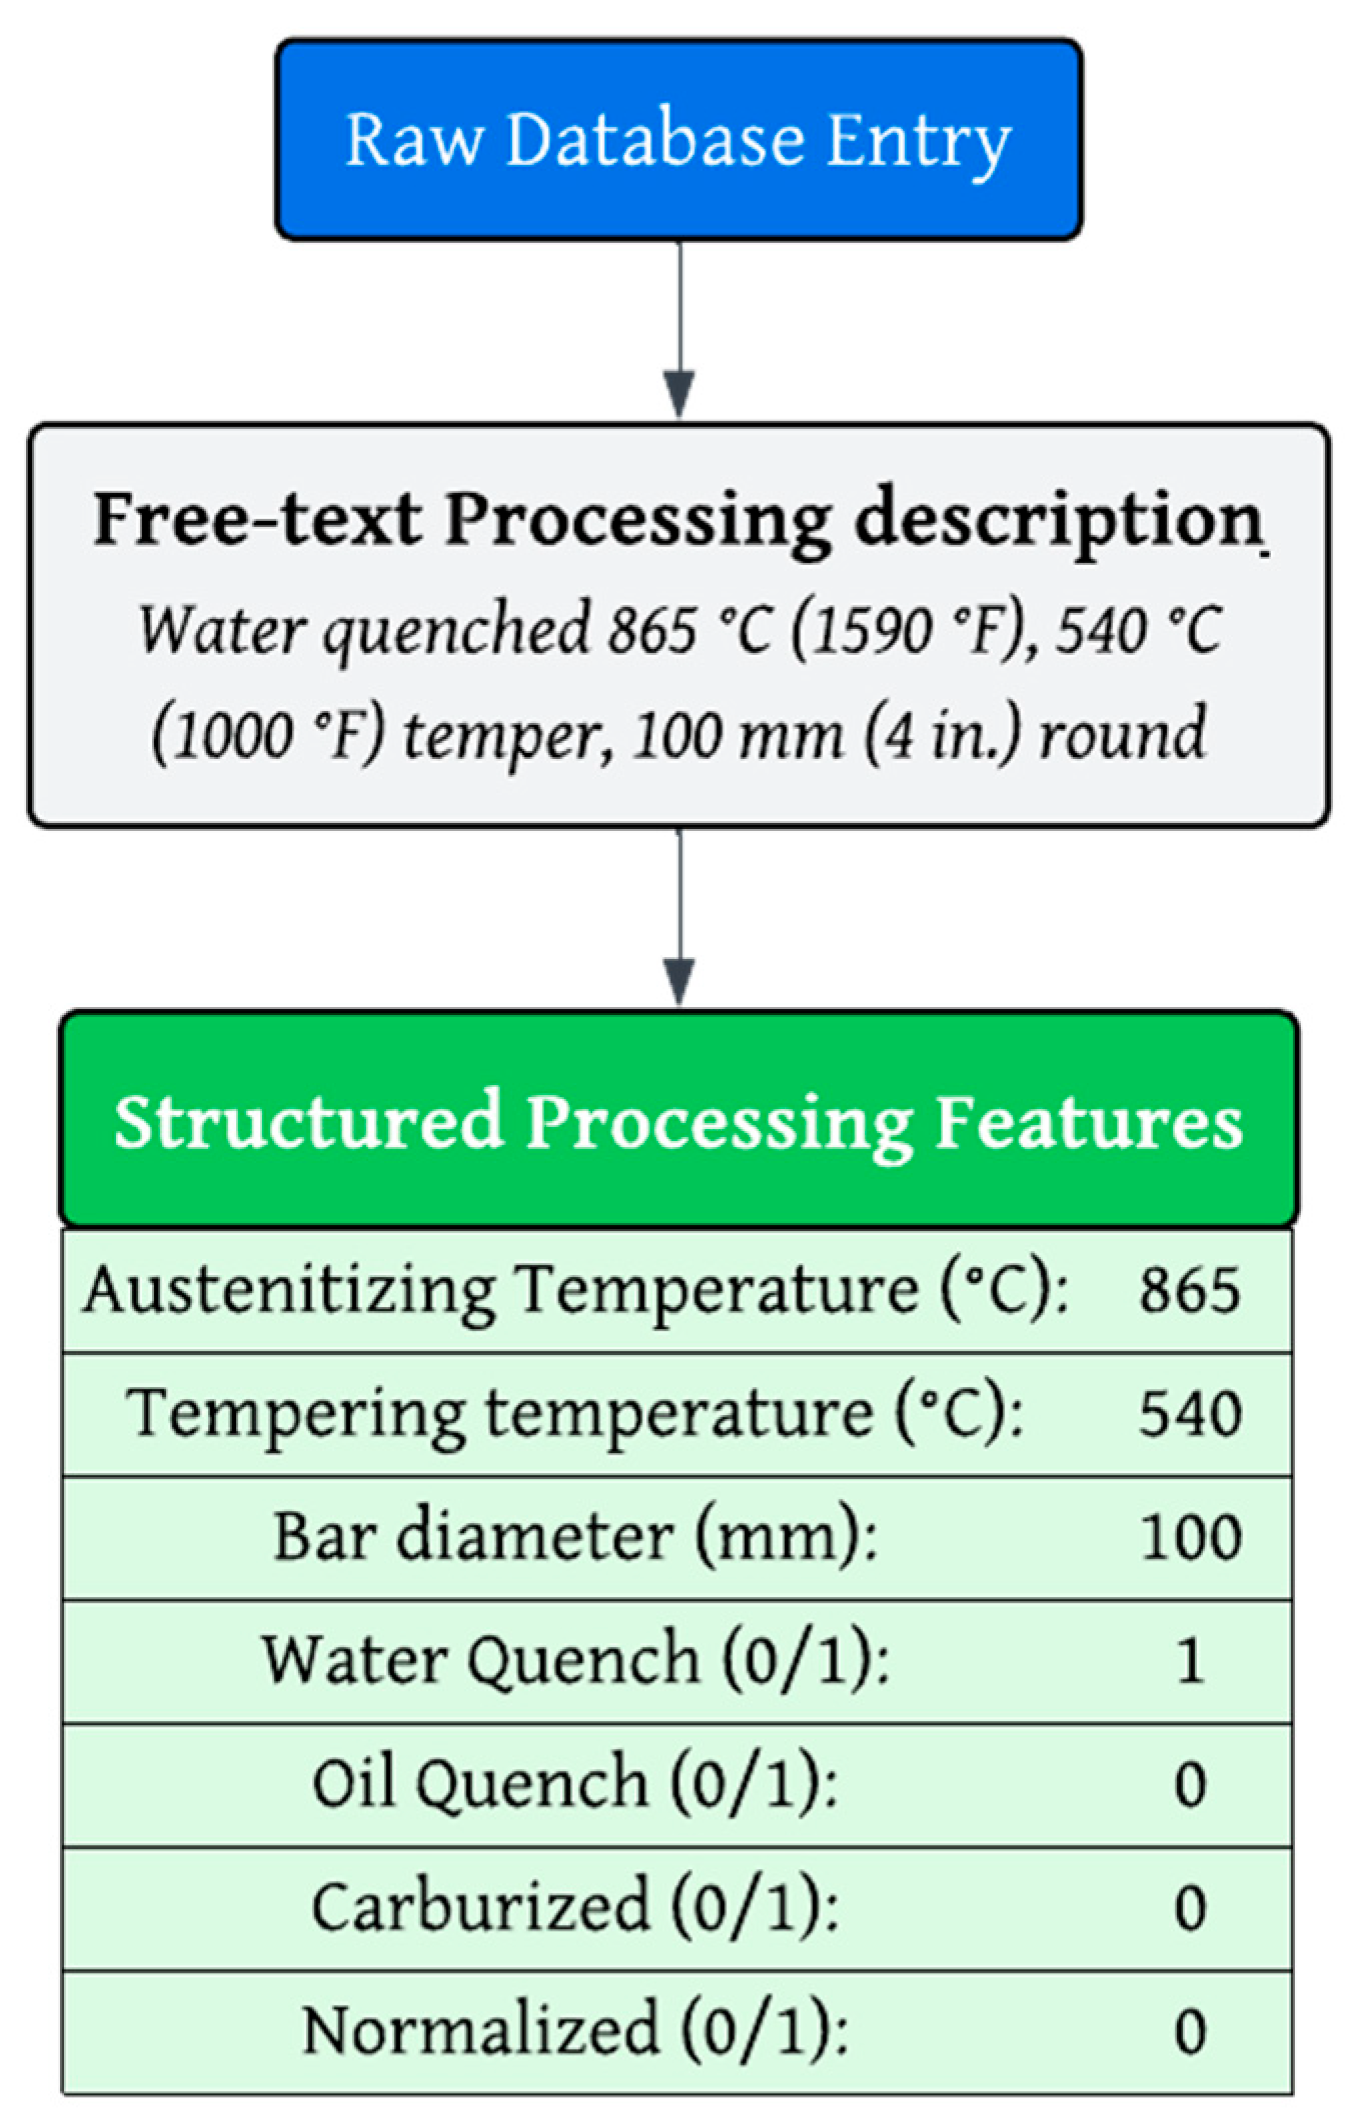
This study makes four contributions. First, it converts heterogeneous free-text heat-treatment descriptions into a consistent set of structured processing descriptors and combines them with full composition to form a unified feature space. Second, it enforces basic metallurgical consistency through transparent screening rules, producing a curated dataset suitable for reproducible modeling. Third, lead-lag information leakage is prevented by defining thermomechanical states and performing group-aware splitting and cross-validation, so the reported performance reflects state-level generalization rather than record-level interpolation. Fourth, it couples predictive modeling with SHAP/PDP interpretability and strength-stratified error analysis to provide physically meaningful insights and to identify regimes where uncertainty increases.
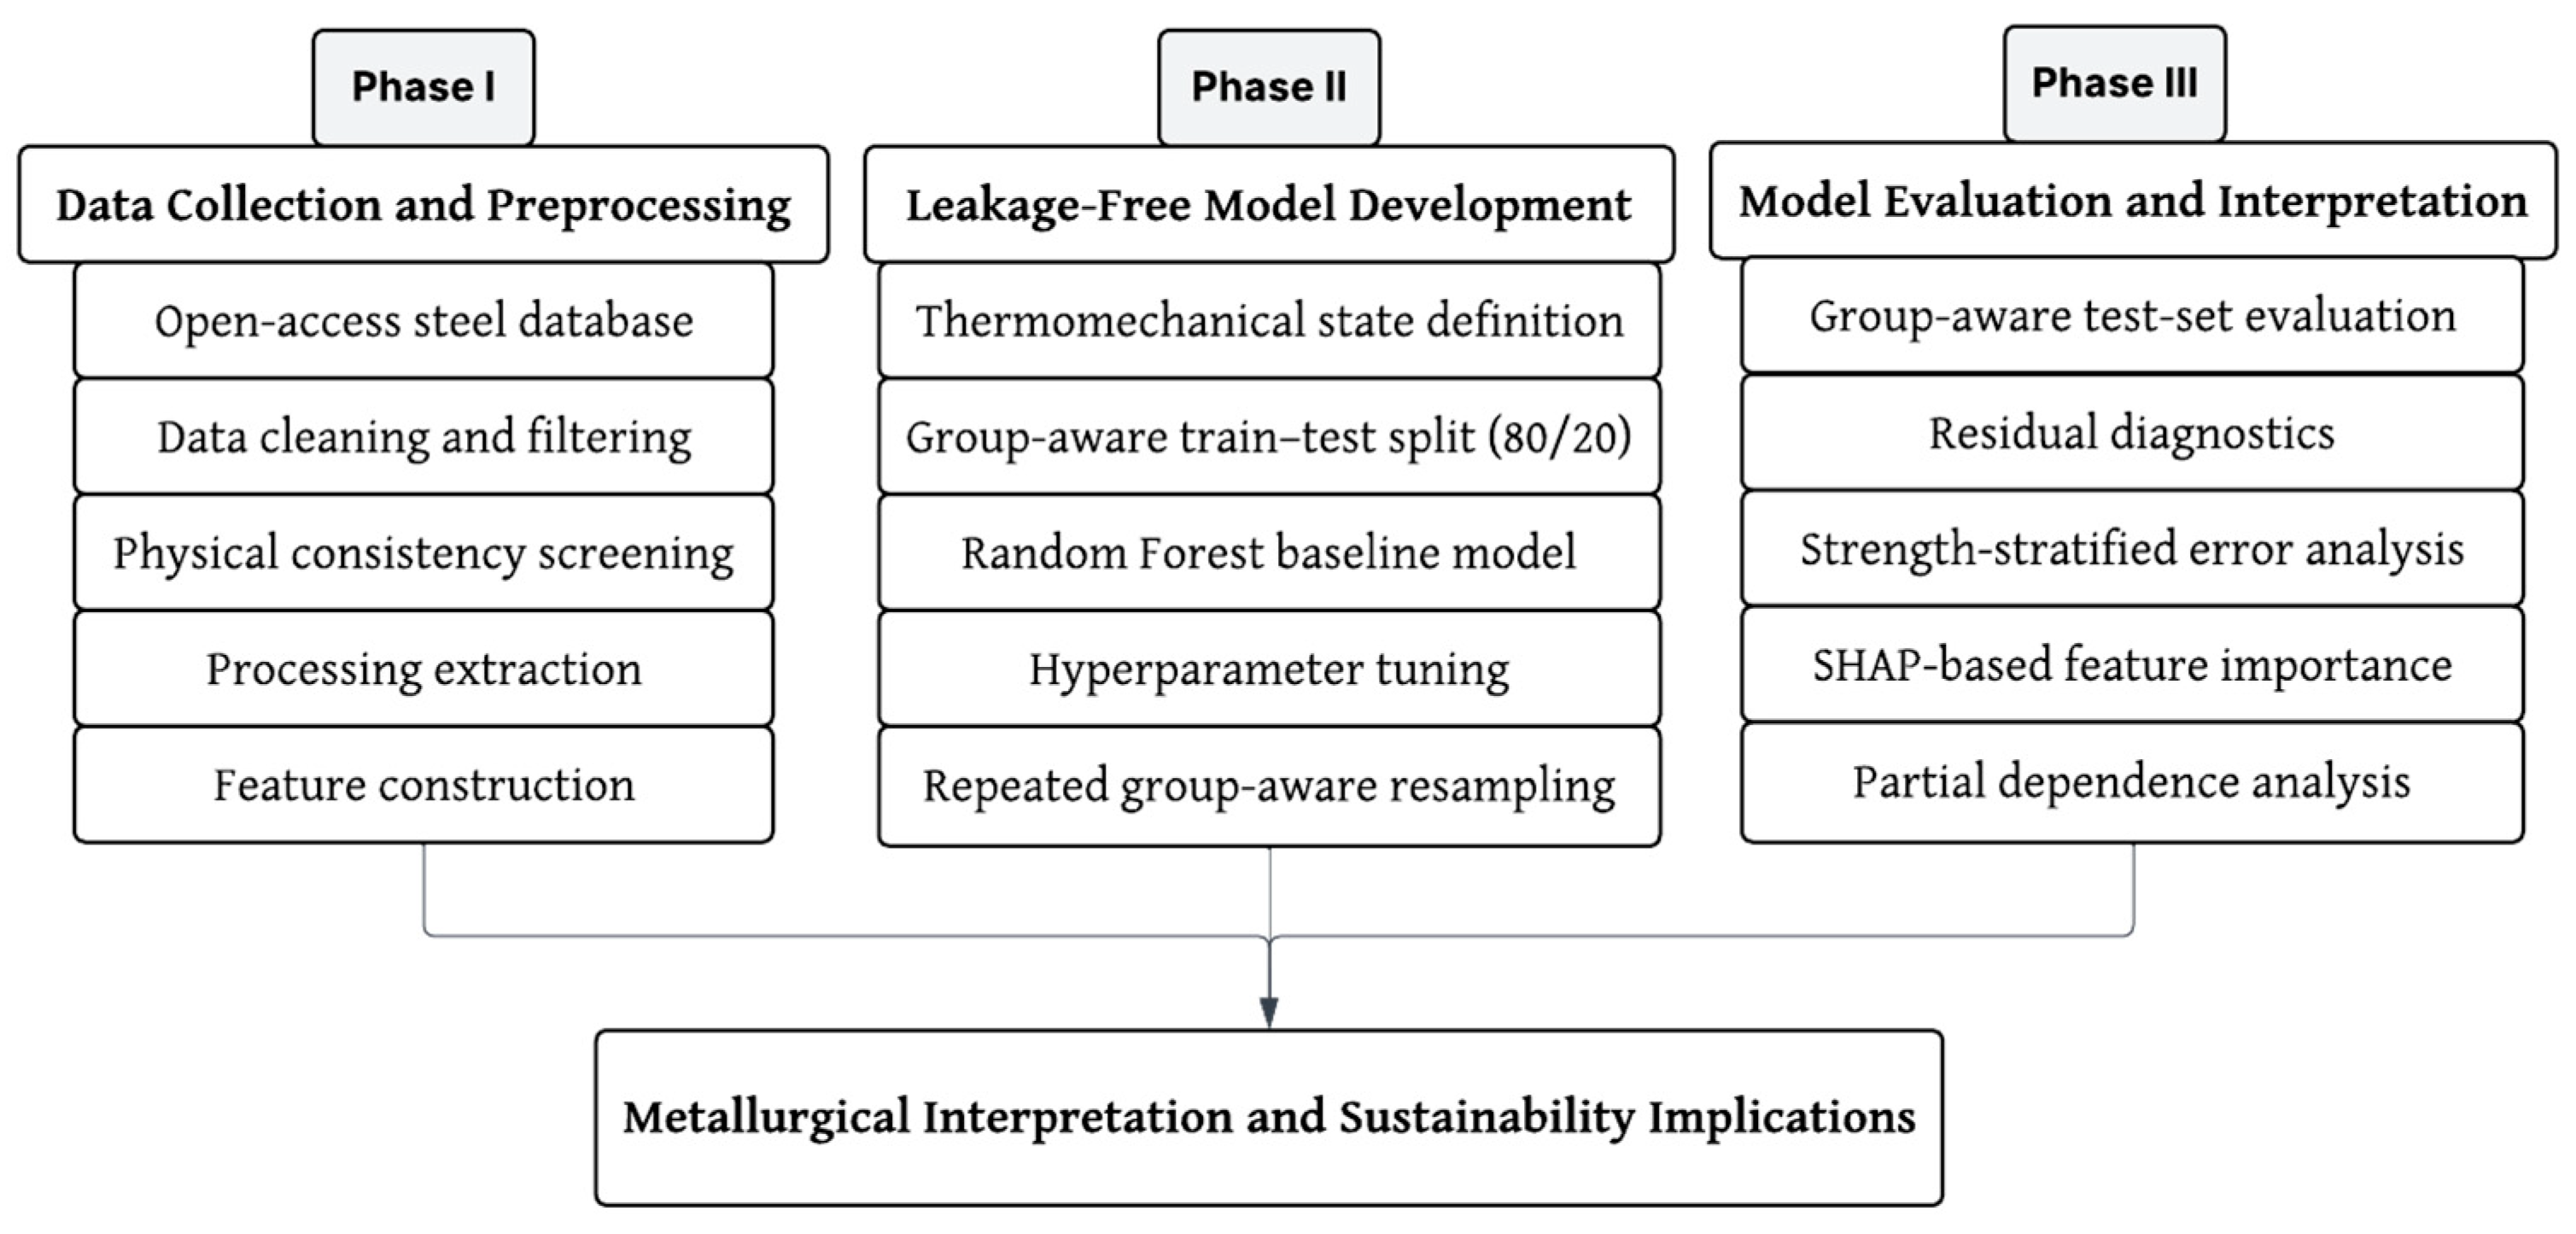
The overall research workflow is summarized in
Figure 1, which presents a three-phase framework encompassing data collection and preprocessing, leakage-free model development, and model evaluation and interpretation. The workflow begins with data acquisition from an open-access steel database, followed by data cleaning, physical consistency screening, and rule-based extraction of processing parameters to construct the final feature space. Model development is performed using thermomechanical state definition, group-aware train–test splitting, RF training with group-aware cross-validation, and robustness analysis via repeated resampling. The final phase includes group-aware test-set evaluation, residual and strength-stratified error analysis, and model interpretability using SHapley Additive exPlanations (SHAP) and partial dependence analysis, which together support subsequent metallurgical interpretation and sustainability assessment.
The rest of the paper is organized as follows. After a focused review of relevant literature on machine-learning approaches for predicting the mechanical properties of steels and other alloys, the dataset, preprocessing steps, and logical filters used to ensure physical consistency are described. The development of the Random Forest model, group-aware cross-validation, and hyperparameter optimization strategy are then presented, followed by leakage-free evaluation on the test set, residual analysis, and interpretable feature analysis using SHAP and partial dependence plots. Finally, the metallurgical interpretation of key features is discussed, the model’s robustness and limitations are assessed, and broader implications for data-driven, sustainable steel design are highlighted before the overall conclusions are drawn.
2. Literature Review
Accurately predicting UTS of steels is crucial for designing safe, lightweight, and durable structures [
13]. Traditional alloy development relied on lengthy experiments and empirical correlations, but modern sustainability goals require rapid screening of compositions and processing methods [
14]. Materials science now combines high-throughput experiments and simulations with available databases to understand the relationships between composition, process, and properties. The Materials Genome Initiative and similar programs encourage integrating experiments, simulation, and data analysis [
15]. ML plays a key role in this integrated computational materials engineering (ICME) framework by identifying patterns in complex data and allowing rapid property predictions [
16].
Semi-empirical and physically based models have long linked microstructure to strength [
17]. A classic example is the Hall-Petch relation [
17,
18], where yield strength increases with decreasing grain size as
Solid-solution, precipitation, work hardening, and transformation hardening are also quantified through metallurgical theory [
19]. CALculation of PHAse Diagrams (CALPHAD) and micromechanical models simulate phase evolution and mechanical response, but often treat one mechanism at a time and require extensive calibration [
14,
20]. These limitations hinder their use for multi-element steels with complex heat treatments, motivating the adoption of data-driven methods [
16].
ML accelerates alloy design by learning composition–process–property relationships and by adopting structured predictive-modeling pipelines that integrate feature construction, model benchmarking, and validation strategies [
8,
21,
22]. Supervised regression models, including linear regression, support vector machines, neural networks, and RFs, have been applied to predict UTS, yield strength, hardness, and ductility [
21]. Datasets typically contain tens to hundreds of samples. Cheng et al. compiled 580 samples of Fe-C-Mn-Al steels with compositions and heat-treatment conditions [
23]. RF delivered an average absolute error of about 90 MPa for UTS and 7.9% for elongation and was used to identify high-strength compositions [
23]. Kateb and Safarian evaluated a smaller, more diverse steel dataset (13 chemical inputs) and found that RFs were both accurate and robust across cross-validation schemes [
24]. Their models captured the trade-off between elongation and strength and highlighted the significance of tempering temperature and the concentrations of carbon, chromium, and manganese.
In automotive steels, Wang et al. assembled 106 samples spanning composition, heat treatment, and strain rate [
25]. RF models performed comparably to other ensemble methods, and SHAP analysis indicated that carbon, manganese, and tempering temperature strongly influence tensile strength [
25]. For high-entropy alloys, Ibarra et al. used structural, electronic, and thermodynamic descriptors with RFs, employing genetic algorithms to select salient features and 10-fold cross-validation for robust evaluation [
26]. Wan et al. combined RF classification and regression to analyze 304 high-entropy alloys (HEAs) and linked descriptors, such as enthalpy of mixing and valence-electron concentration, to compressive strength and hardness [
27].
Microstructure-informed models. ML has also been combined with image-based features. Darabi et al. generated 1188 synthetic dual-phase microstructures and extracted features using convolutional neural networks [
28]. RF regression achieved a mean squared error below 2%, outperforming AdaBoost. In TWinning-Induced Plasticity (TWIP) steel, RF models predicted yield strength with R
2 ≈ 0.80, beating neural networks and support vector machines [
28].
Tree-based ensembles, particularly Random Forests, and hybrid, physics-aware machine-learning frameworks have become increasingly popular for predictive modeling in engineering applications, balancing accuracy, robustness, and interpretability while embedding physical or mechanistic constraints [
21,
29,
30,
31,
32]. They model nonlinear interactions without explicit functional forms, handle missing values and mixed data types, and offer built-in measures of feature importance. Studies consistently report that RFs match or surpass neural networks and support vector machines in accuracy while offering interpretability. For example, Cheng et al. found that RFs outperformed other models for Fe-C-Mn-Al steels [
23]. Kateb and Safarian observed robustness across validation schemes [
24]. SHAP analysis in automotive steels highlighted how carbon, manganese, and tempering temperature govern strength [
25]. Feature importance in these models aligns with metallurgical expectations (e.g., carbon and nitrogen strengthen steel), enabling actionable insights.
Many studies consider only composition or a few processing variables, yet heat-treatment parameters such as austenitising temperature, quenching medium, and bar diameter strongly affect the microstructure [
22,
33]. Datasets often lack curation, contain inconsistent units, or omit metadata, undermining model reliability. Feature importance is sometimes reported without connecting to metallurgical mechanisms. Curated steel databases with both composition and processing information are still rare [
21,
22]. The present work uses an open database with 18 composition variables and seven processing descriptors, applies rigorous data cleaning, and builds RF models that emphasize interpretability and sustainable alloy design.
Representative peer-reviewed studies on ML prediction of mechanical properties in steels and related alloys are summarized in
Table 1. The table highlights the alloy systems, targeted properties, input features, ML models, dataset sizes, and reported performance. The variety of datasets and models illustrates the breadth of the field. At the same time, the prominence of RF and related tree ensembles underscores their suitability for predicting mechanical properties from tabular data.
Across this literature, two practical gaps recur: (i) heat-treatment information is frequently unstructured or partially reported, limiting reproducible use as model inputs; and (ii) repeated measurements of identical composition–processing conditions are often split across folds, which can inflate reported accuracy through leakage. The present study addresses both gaps by extracting structured processing descriptors from free-text records and by evaluating models using thermomechanical-state grouping under group-aware splitting and cross-validation.
4. Results
4.1. Dataset Structure and Thermomechanical State Characteristics
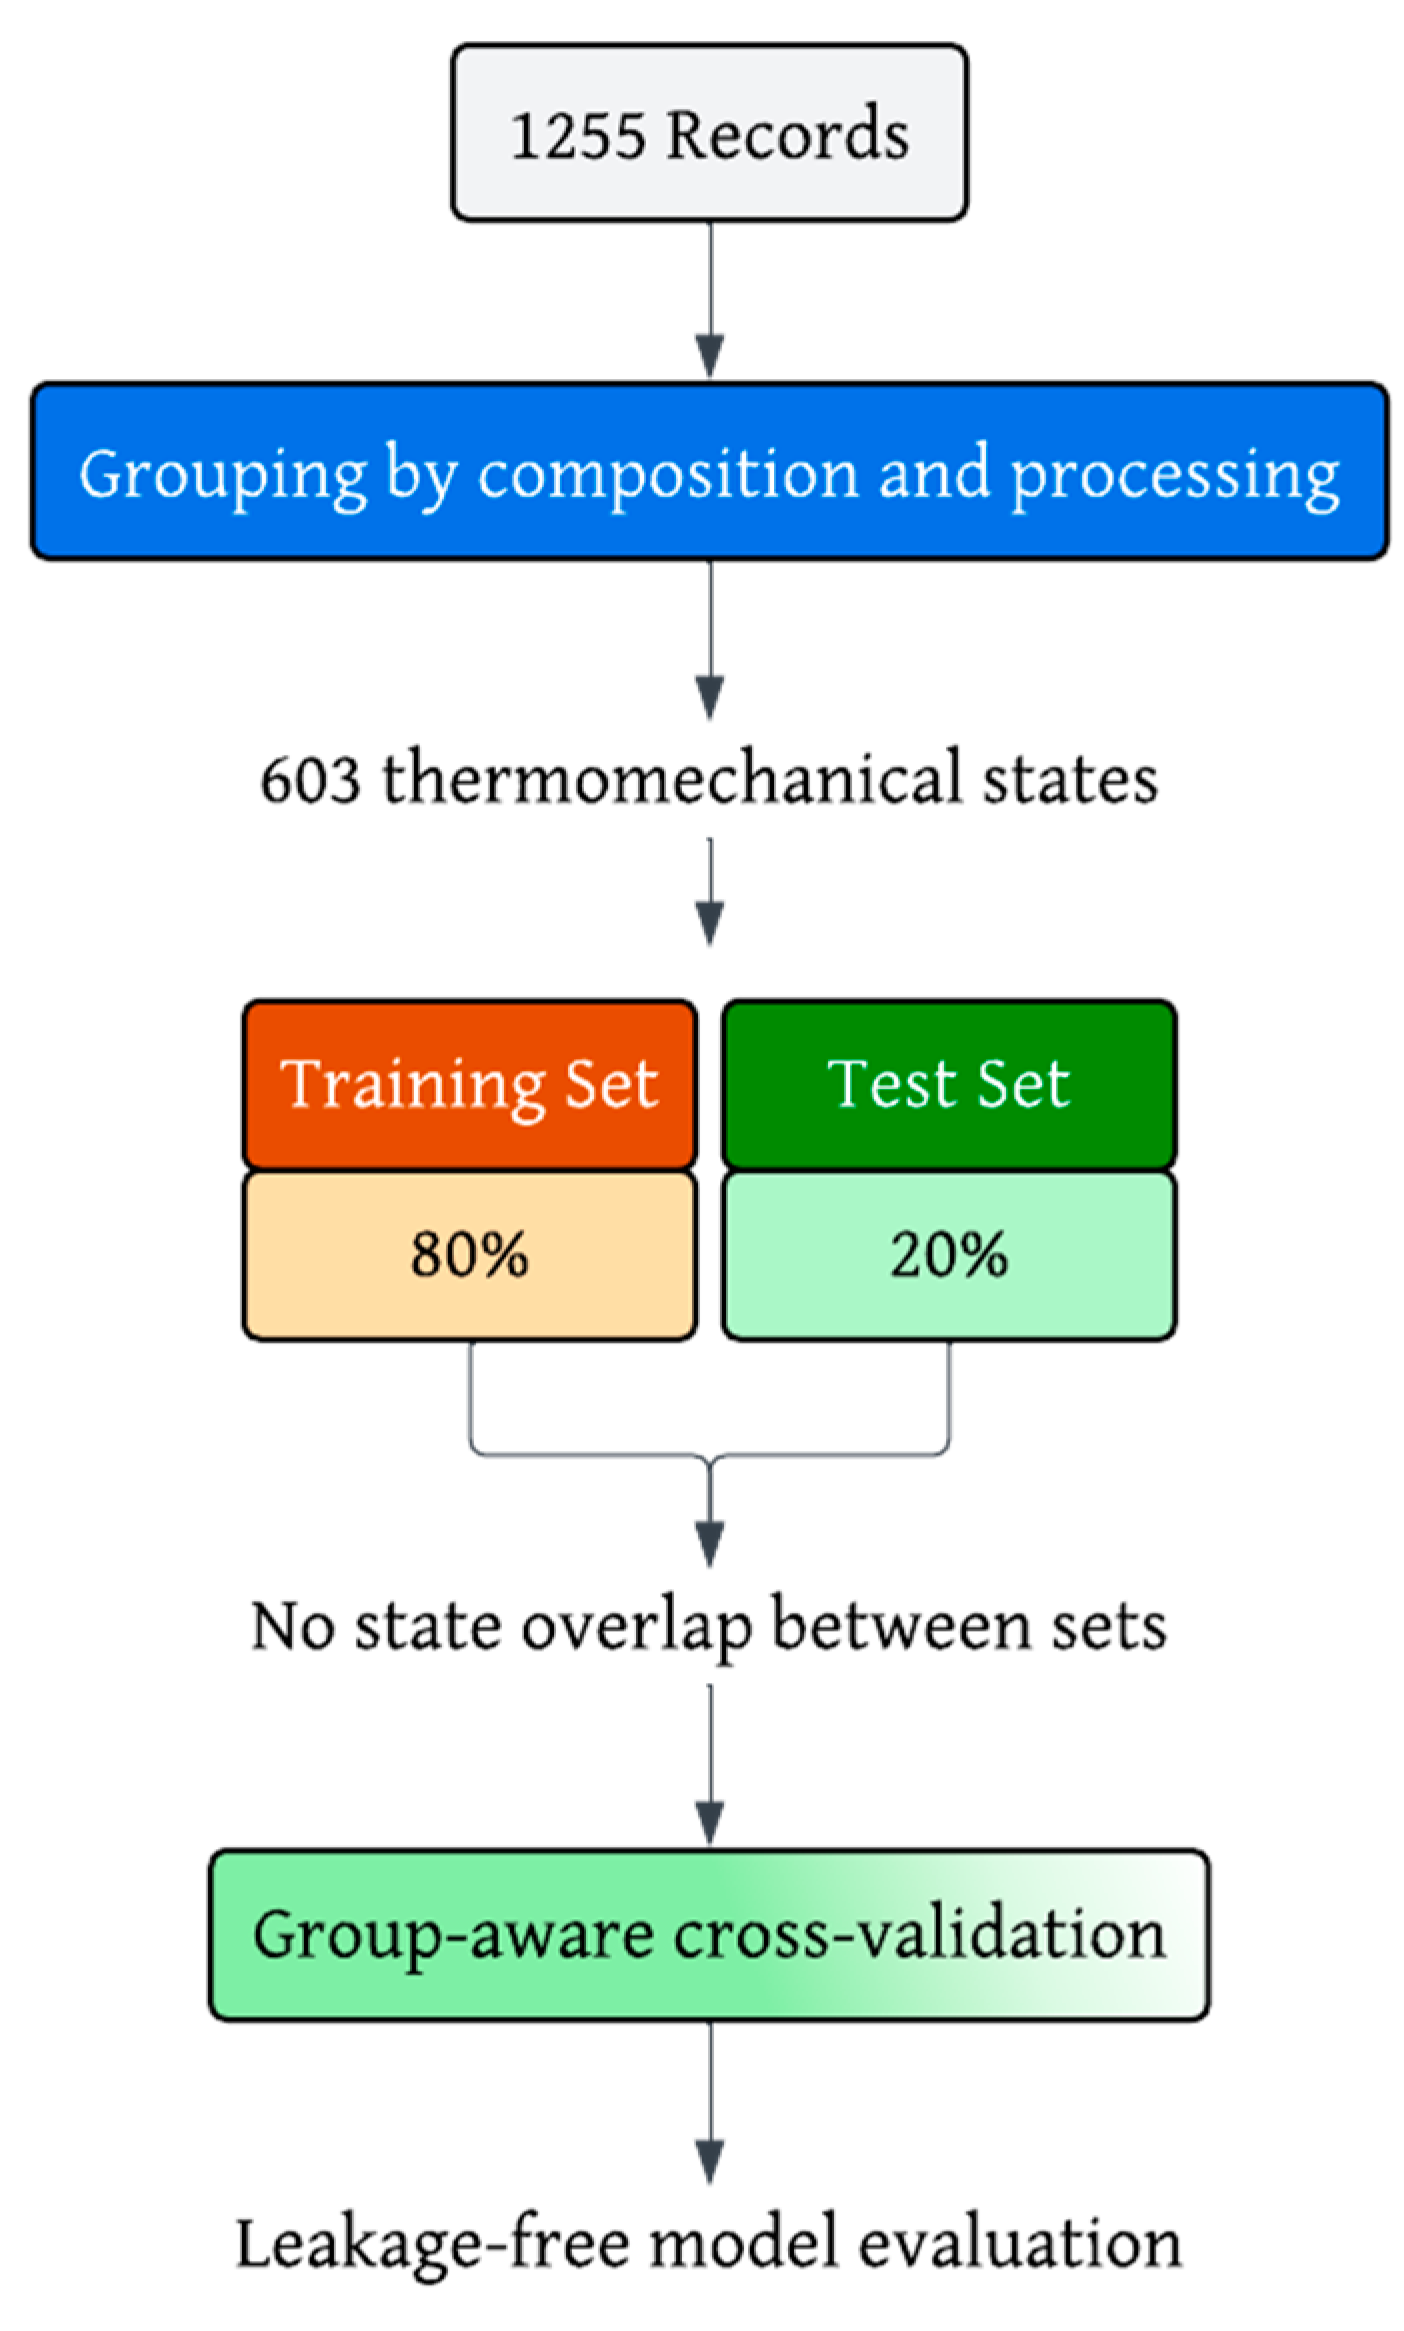
The final curated dataset consists of 1255 records, each described by 25 input features and UTS as the target variable. Because multiple records correspond to repeated measurements of identical composition–processing conditions, the dataset was grouped into 603 unique thermomechanical states, which represent the physically meaningful unit of independence.
The number of observations per state ranges from 1 to 12, with an average of 2.08. State-level mean UTS values span a wide range, from approximately 385 MPa to 1911 MPa, with a median near 940 MPa. Within-state variability is generally low, with most states exhibiting negligible dispersion in UTS, indicating good internal consistency among repeated measurements. These dataset characteristics, summarized in
Table 5, motivate the group-aware training and evaluation strategy adopted in the subsequent results sections.
4.2. Group-Aware Predictive Performance of the Random Forest Model
The predictive performance of the RF model was evaluated using a group-aware train–test split, ensuring that all thermomechanical states in the test set were completely unseen during training. This evaluation provides a conservative estimate of model generalization across distinct composition–processing conditions.
On the group-aware test set, the baseline RF model achieved strong predictive performance, with an R
2 of approximately 0.90, a mean absolute error (MAE) of about 40 MPa, and a root mean squared error (RMSE) of about 78 MPa. Hyperparameter tuning using group-aware cross-validation yielded only marginal improvements in test-set performance, suggesting that the baseline configuration already captures the dominant composition processing strength relationships supported by the available data. The corresponding test-set performance metrics for the baseline and tuned models are summarized in
Table 6.
The close agreement between baseline and tuned model performance confirms the robustness of the RF model under leakage-free evaluation conditions. All subsequent results and analyses are therefore based on the tuned RF configuration, unless stated otherwise.
4.3. Actual Versus Predicted Ultimate Tensile Strength
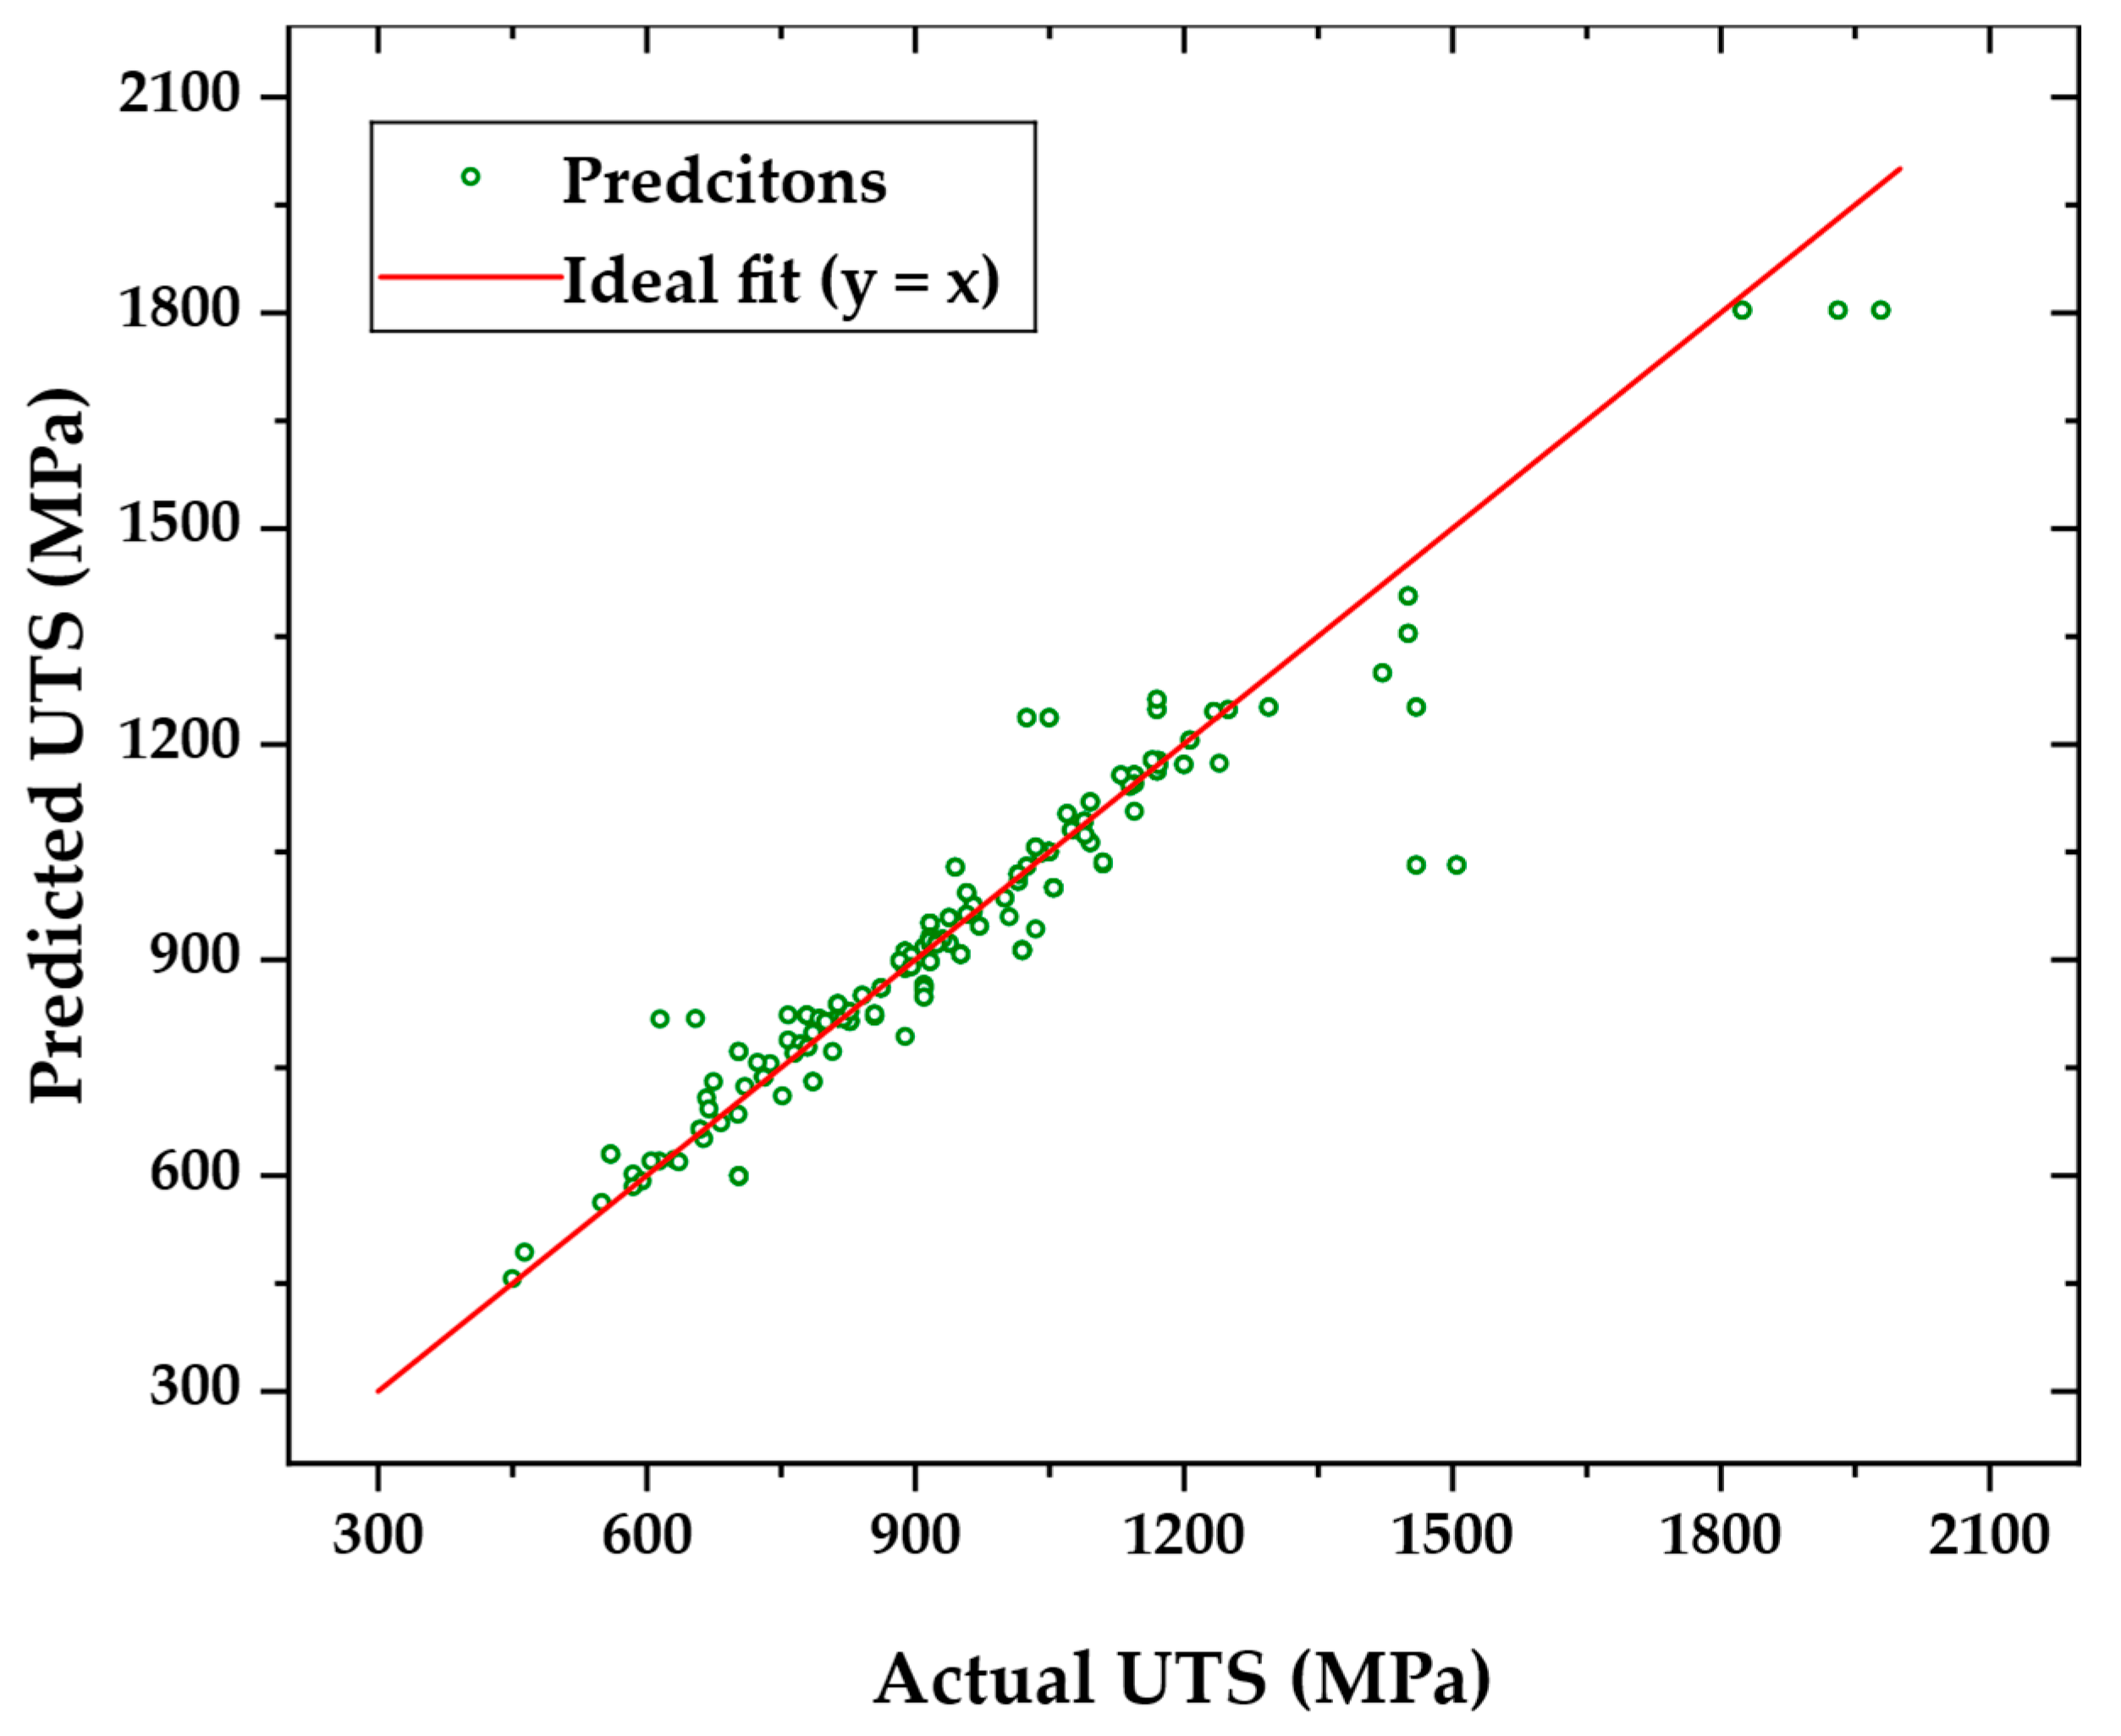
The agreement between predicted and measured UTS values for the final tuned RF model is illustrated in
Figure 4, based on the group-aware test set. The predicted values closely follow the 1:1 reference line over a wide range of strengths, indicating strong agreement between model predictions and experimental measurements under leakage-free evaluation conditions.
While predictions remain tightly clustered around the ideal trend for low- and medium-strength steels, increased scatter is observed at higher UTS levels. This behavior reflects reduced data coverage and greater sensitivity to processing conditions in the high-strength regime, rather than systematic model bias. Overall, the distribution confirms that the tuned model captures the dominant composition processing strength relationships while maintaining stable performance across most of the strength spectrum.
4.4. Residual Structure and Bias Assessment
The residual behavior of the final tuned RF model was examined using the group-aware test set to assess potential bias and error structure.
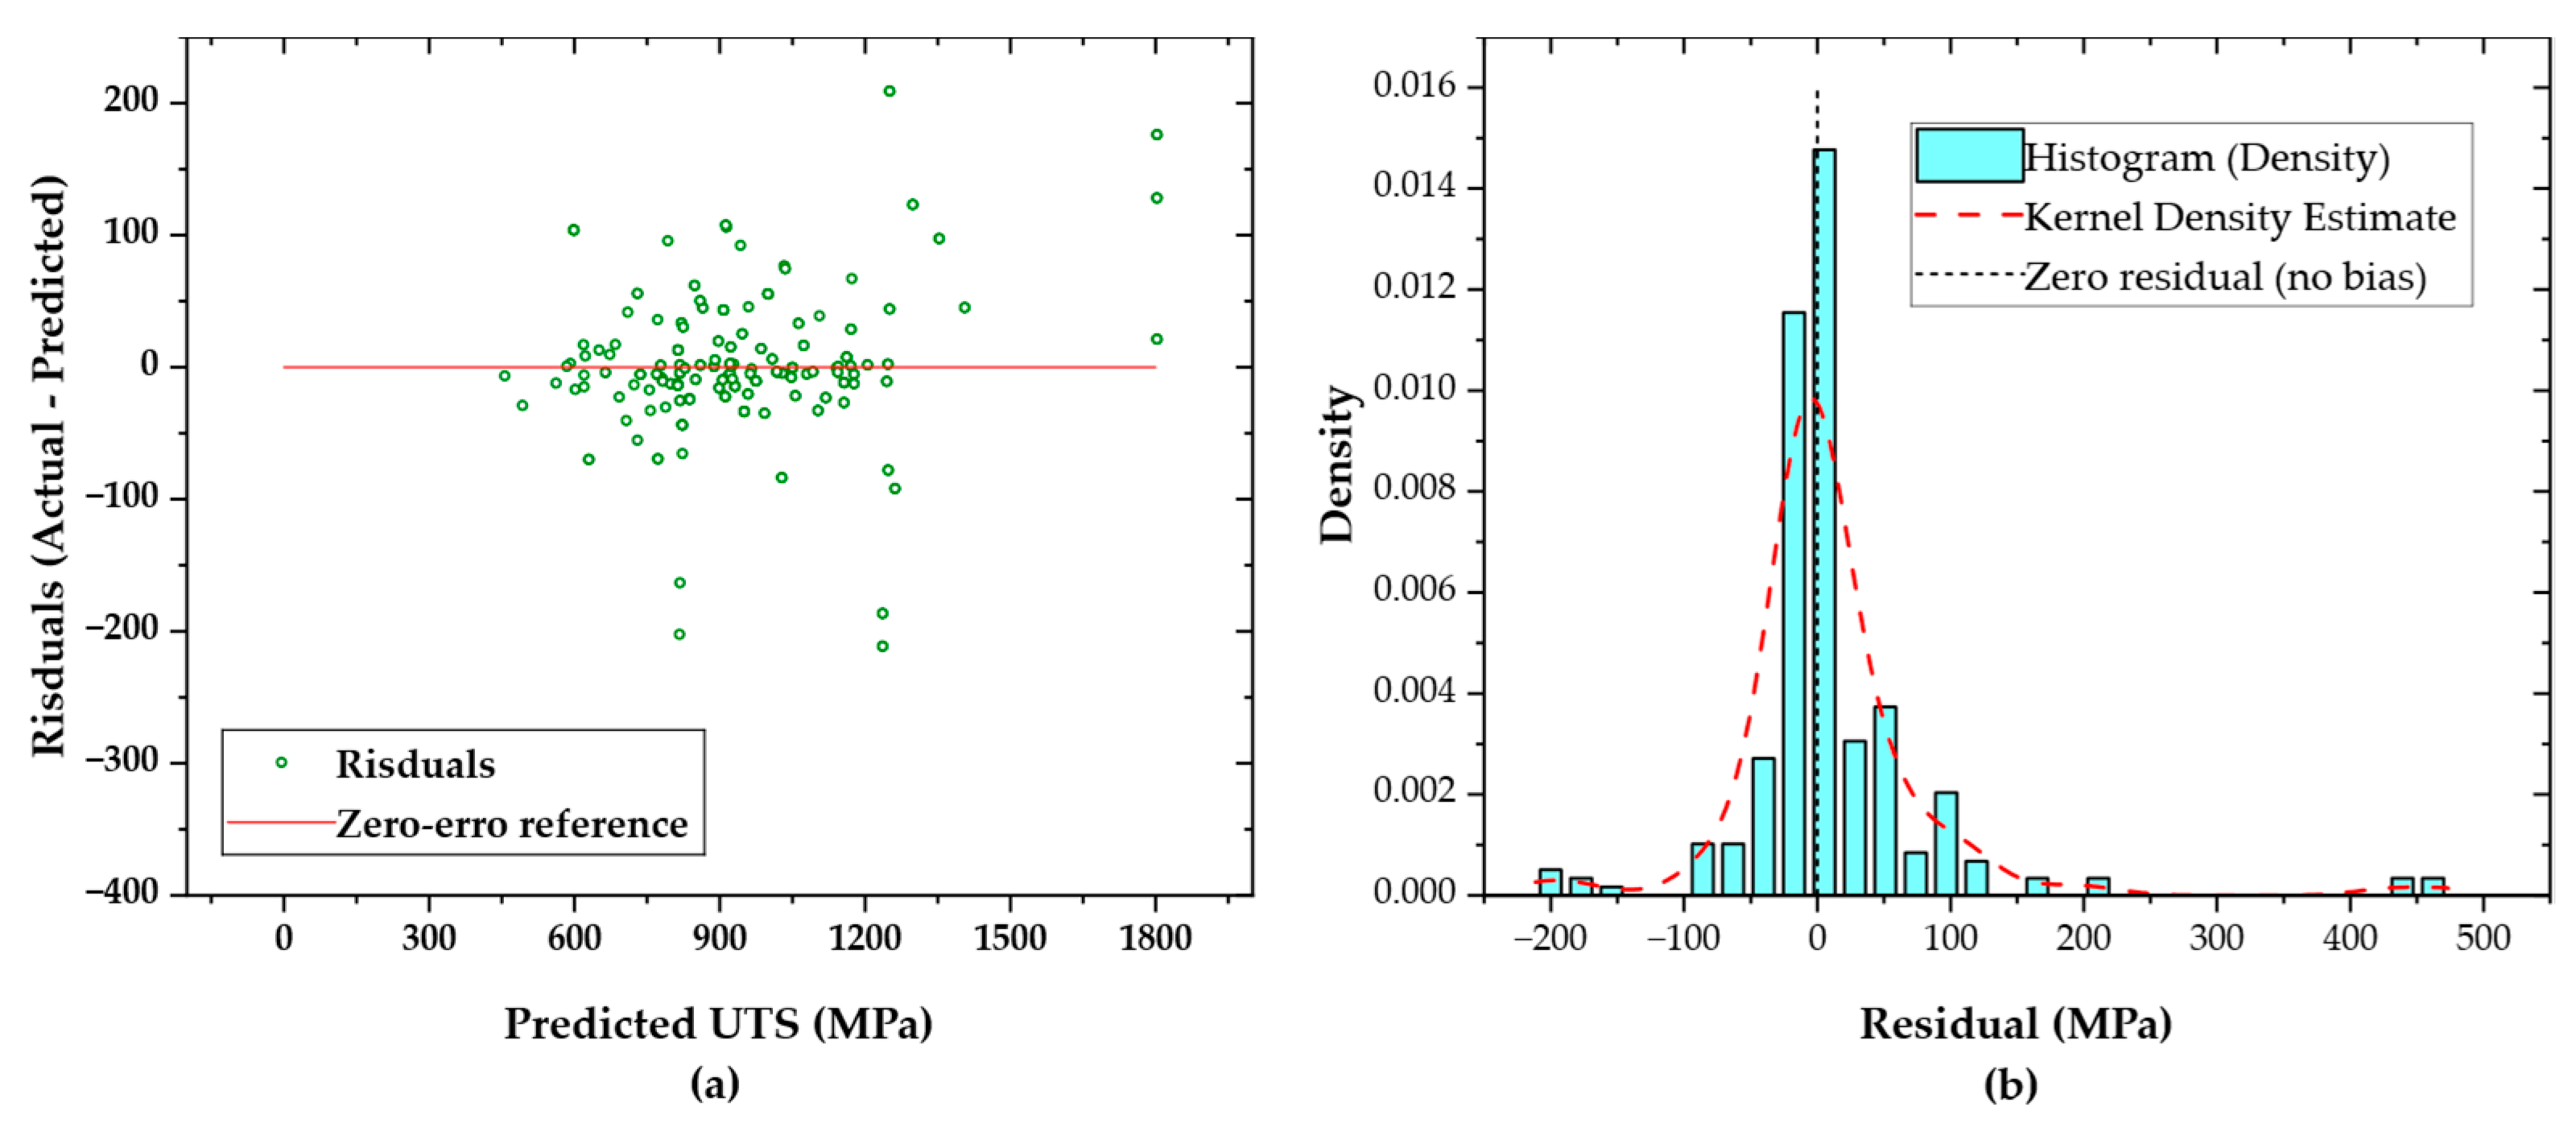
Figure 5a presents residuals plotted against predicted UTS values. The residuals are distributed around zero across the full prediction range, with no clear trend or curvature, indicating no systematic over- or under-prediction.
To further support this observation, the empirical distribution of residuals is shown in
Figure 5b. The residual histogram is approximately symmetric and centered near zero, providing additional evidence that the model errors are unbiased on average. While a small number of large residuals are present, primarily associated with high-strength steels, the overall distribution confirms stable predictive behavior without directional bias. Together, these diagnostics demonstrate that the tuned RF model maintains consistent accuracy under leakage-free evaluation conditions, and that the reported performance metrics are not driven by systematic residual skewness.
4.5. Robustness Under Repeated Group-Aware Resampling
The robustness of the final tuned RF model was evaluated using repeated group-aware train–test splits, in which thermomechanical states were randomly reassigned while preserving strict state-level separation between training and test sets. This analysis quantifies the sensitivity of predictive performance to variations in state composition within the test data.
As summarized in
Table 7, the coefficient of determination (R
2) exhibits substantial variability across splits, ranging from 0.19 to 0.96, with a mean value of 0.82 and a standard deviation of 0.23. The lowest R
2 values occur in splits dominated by sparsely represented, high-strength thermomechanical states, for which the variance-normalized R
2 metric is particularly sensitive, even when absolute error magnitudes remain moderate. In particular, individual splits containing a small number of extreme-strength states can be disproportionately influenced by a few large squared errors, leading to a sharp reduction in R
2 despite otherwise reasonable pointwise predictions. This behavior reflects the known sensitivity of R
2 to outliers under strict group-aware extrapolation and does not indicate model instability or information leakage.
Error-based metrics show more stable behavior across splits. The mean MAE is 40.6 MPa with a standard deviation of 11.6 MPa, while the mean RMSE is 81.6 MPa with a standard deviation of 36.4 MPa (
Table 7). These values indicate that, despite variability in explained variance, typical prediction errors remain on the order of a few tens of megapascals across most partitions.
Overall, the results in
Table 7 demonstrate that the RF model maintains reliable average predictive accuracy under repeated leakage-free resampling, while naturally reflecting increased uncertainty for test splits concentrated in difficult or underrepresented regions of the composition–processing space.
4.6. Strength-Stratified Prediction Accuracy
To examine how prediction accuracy varies across the tensile strength spectrum, the performance of the final tuned RF model was evaluated separately within predefined UTS regimes using the group-aware test set. This stratification highlights differences in error behavior associated with data density and material complexity across strength levels.
As reported in
Table 8, prediction errors are lowest in the medium-strength regime (700–1000 MPa), with an MAE of 23.0 MPa and an RMSE of 33.2 MPa, reflecting dense data coverage in this range. Errors increase for both lower- and higher-strength regimes. In the low-strength regime (<700 MPa), the MAE and RMSE are 36.6 MPa and 63.6 MPa, respectively, while in the high-strength regime (1000–1300 MPa), they are 36.2 MPa and 60.2 MPa, respectively.
The largest errors occur in the very high-strength regime (>1300 MPa), where the model exhibits an MAE of 189.0 MPa and an RMSE of 241.7 MPa (
Table 8). This behavior reflects the limited number of test samples in this regime and the UTS’s increased sensitivity to processing variations at very high strength levels. Overall, the stratified results in
Table 8 demonstrate that model accuracy is strongly dependent on strength regime, with reliable performance in well-represented regions of the data and increased uncertainty in sparsely populated extremes.
4.7. Feature Importance and Model Interpretability
Model interpretability was assessed for the final tuned RF model using SHAP-based global feature importance and PDPs, both evaluated on the group-aware test set. These complementary tools were used to identify influential variables and to examine the direction and nonlinearity of their effects on predicted UTS.
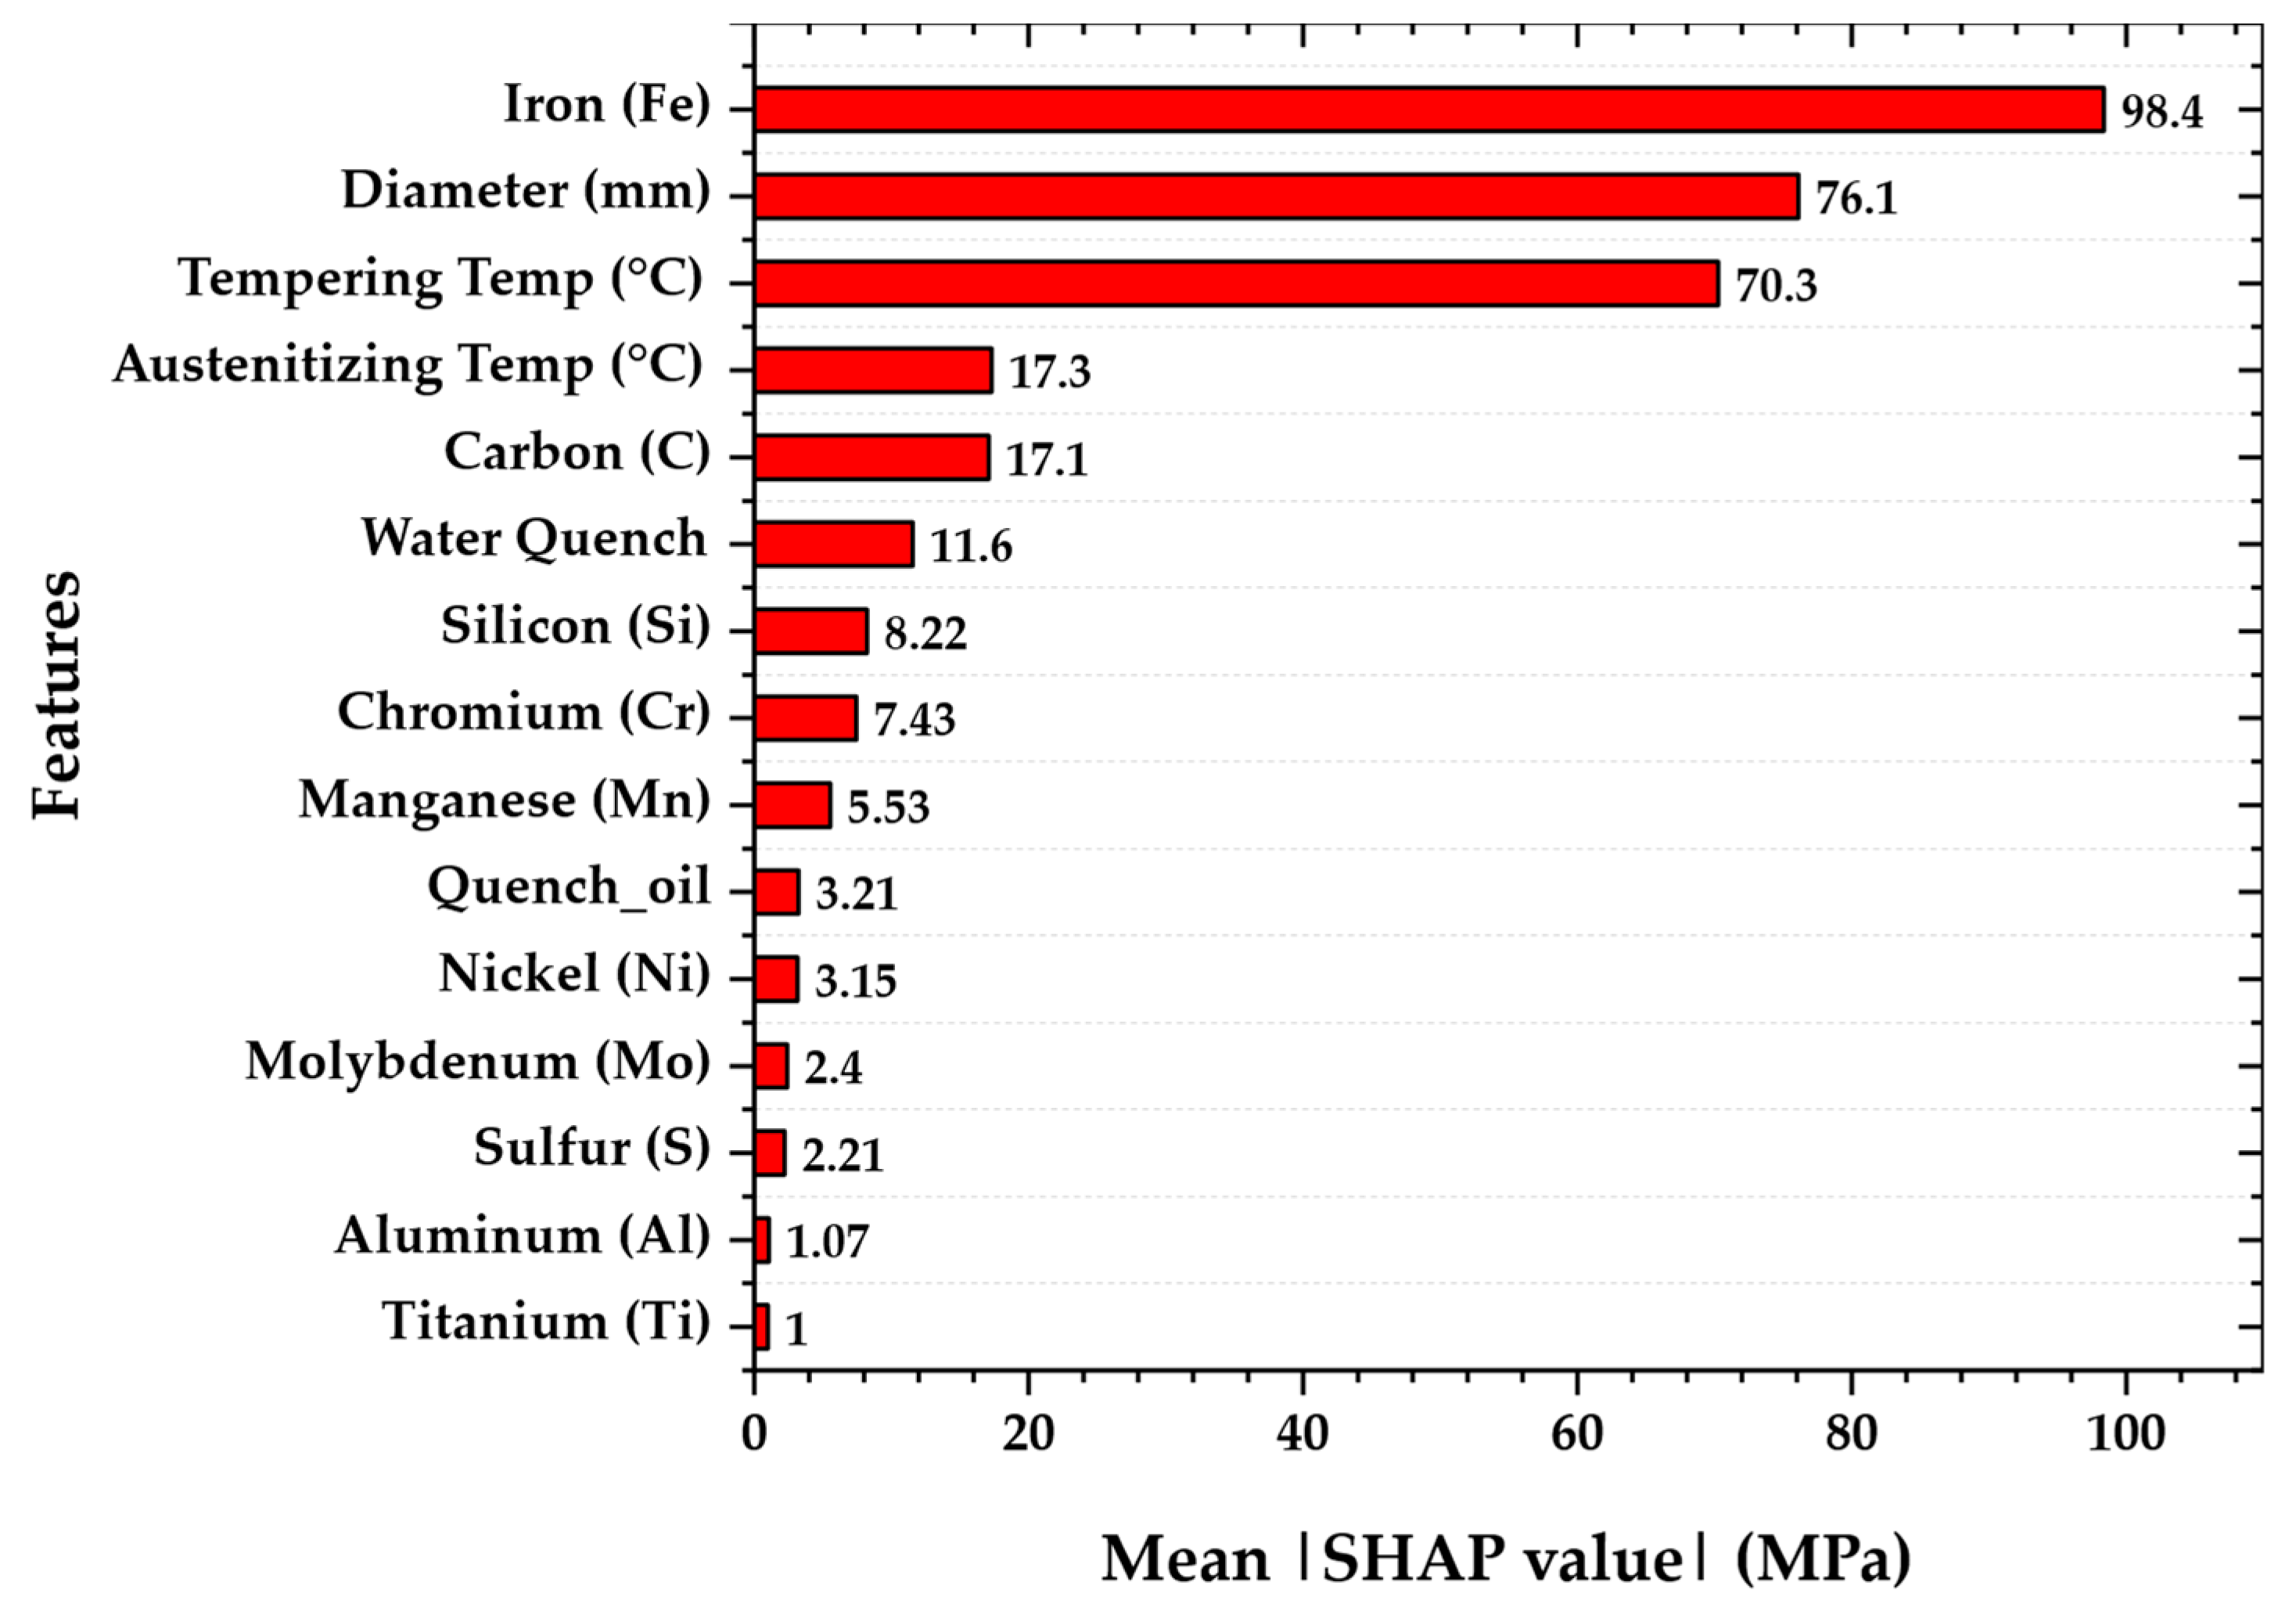
The SHAP global importance results (
Figure 6) show that model predictions are primarily governed by a limited set of variables, with processing-related parameters, notably bar diameter, tempering temperature, and austenitizing temperature, ranking among the most influential features, alongside carbon content. The high SHAP importance of Fe reflects the compositional closure constraint (sum ≈ 100 wt.%), whereby Fe acts as a proxy for total alloying content rather than representing an independent strengthening contribution.
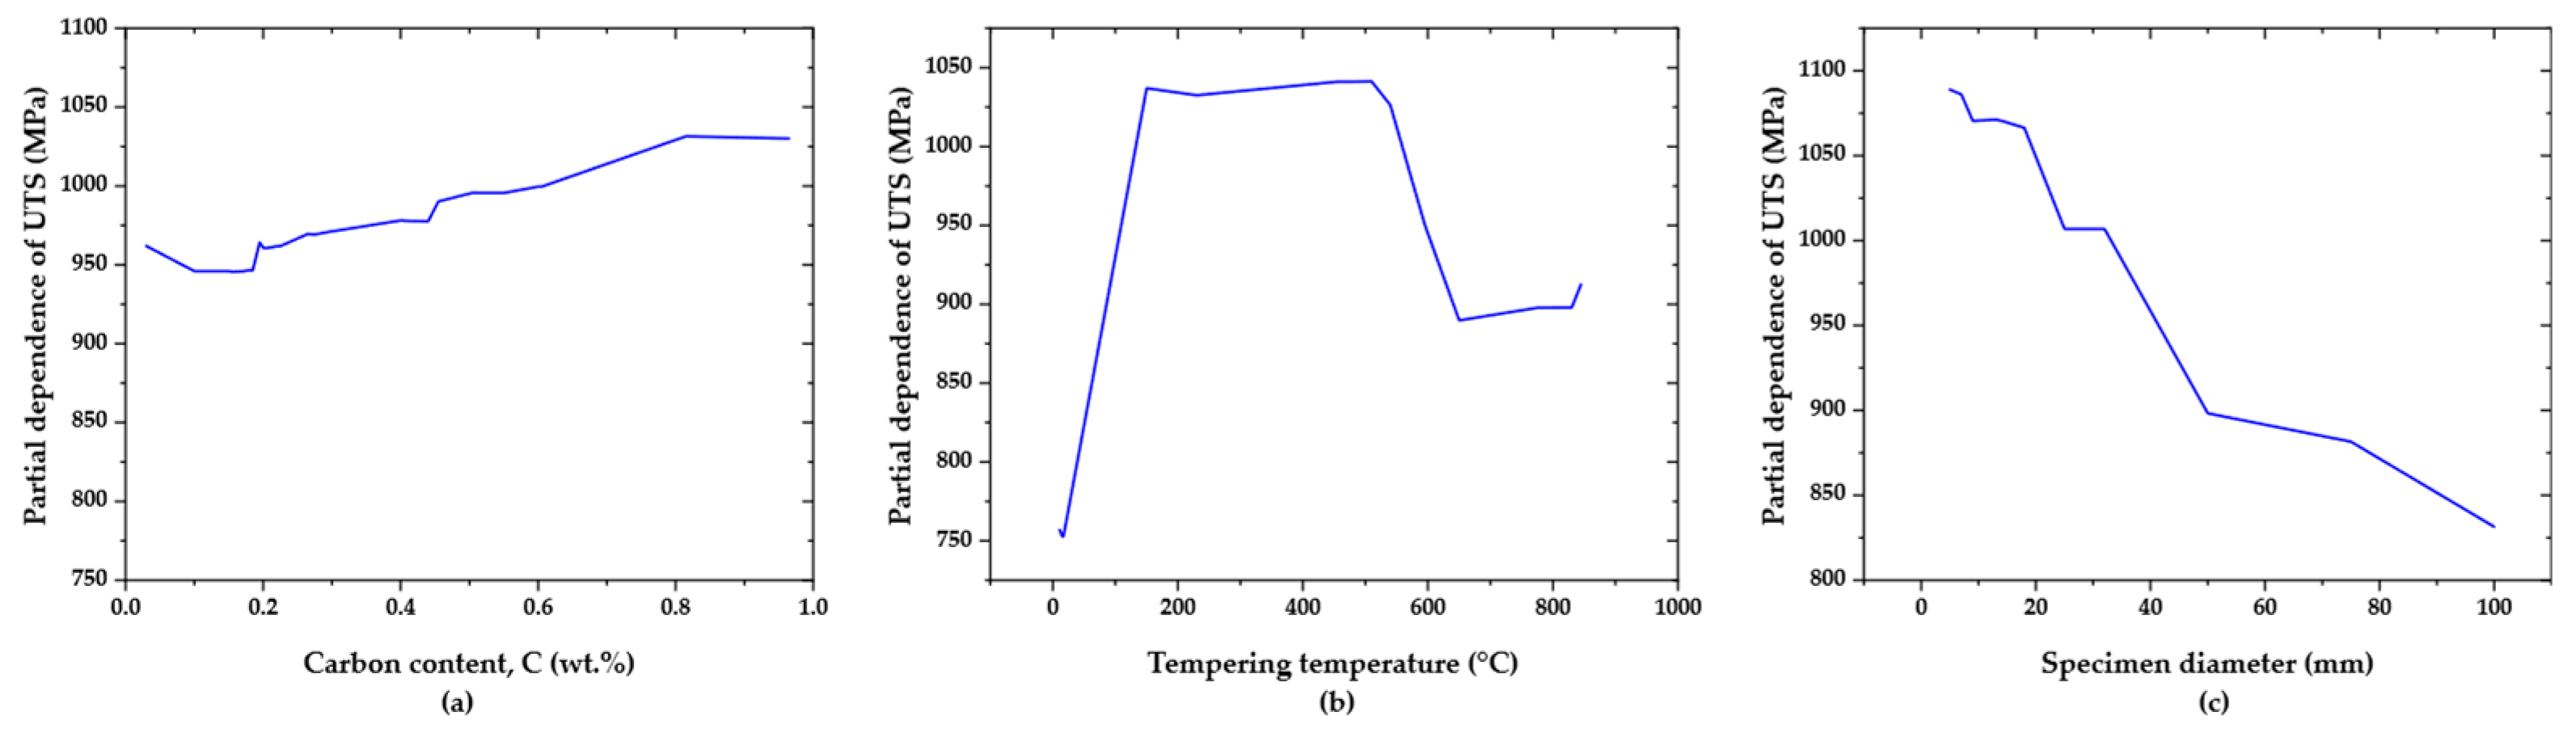
To further interpret these influences, PDPs for selected key variables are presented in
Figure 7. The PDPs reveal physically consistent trends: increasing carbon content leads to higher predicted UTS, increasing tempering temperature results in strength reduction, and increasing bar diameter is associated with lower predicted UTS due to reduced cooling rates in larger bar diameters. These marginal effects are nonlinear, highlighting the RF model’s ability to capture complex composition–processing interactions beyond simple linear relationships.
Together, the SHAP and PDP analyses confirm that the model’s predictions are driven by physically meaningful and metallurgically consistent relationships, supporting both the interpretability of the learned mappings and the credibility of the reported results.
4.8. Comparison with Alternative Models
To place the performance of the final tuned RF model in context, its predictive accuracy was compared with alternative regression models evaluated under the same group-aware test conditions. Specifically, Gradient Boosting (GB) and Support Vector Regression with an RBF kernel (SVR) were considered, using identical training-test splits and evaluation metrics.
As reported in
Table 9, the final tuned RF model achieved an R
2 of 0.899, a mean absolute error (MAE) of 39.9 MPa, and a root mean squared error (RMSE) of 78.4 MPa on the group-aware test set. Gradient Boosting exhibited comparable explanatory power (R
2 = 0.902) but showed notably higher errors, with an MAE of 51.0 MPa and an RMSE of 77.5 MPa. In contrast, the SVR model performed substantially worse, yielding an R
2 of 0.665, an MAE of 83.3 MPa, and an RMSE of 143.2 MPa.
Overall, the comparison in
Table 9 indicates that ensemble tree-based methods outperform kernel-based regression under leakage-free, state-level validation, with the RF model providing the best balance between explained variance and absolute prediction error.
5. Discussion
5.1. Metallurgical Interpretation of Key Features
Across the curated dataset and under strict group-aware evaluation, the RF model consistently identifies a limited set of metallurgical factors as dominant controls on UTS. These factors span overall alloying level, transformation control through processing, and carbon content, reflecting a physically coherent picture of strength development in heat-treated steels [
42].
At the compositional level, Fe emerges as the most influential variable, as shown by the global feature analyses (
Figure 6). This dominance does not imply that Fe acts as a primary strengthener, but rather reflects the compositional closure constraint inherent to steel datasets, in which all elements are expressed as weight percent and sum to approximately 100 wt.% [
43,
44]. In this setting, Fe serves as a proxy for the total degree of alloying, capturing the combined effect of solute additions that enhance hardenability and strengthen steels through solid-solution, precipitation, and transformation-controlled mechanisms [
45]. The prominence of Fe therefore indicates that the model is sensitive to overall alloying intensity rather than isolated elemental effects, which is metallurgically reasonable.
Processing-related variables play an equally central role [
46]. Bar diameter and tempering temperature consistently rank among the most influential predictors, underscoring the importance of transformation kinetics and post-quench microstructural evolution. Larger bar diameters reduce cooling rates during quenching, promoting softer transformation products and lower UTS, while higher tempering temperatures reduce strength through recovery and carbide coarsening [
45,
46,
47]. These trends are evident in the model behavior across the dataset and are further supported by the partial dependence relationships shown in
Figure 7.
Among individual alloying elements, carbon is the most influential solute, reflecting its fundamental role in controlling martensite hardness, austenite stability, and hardenability. The model’s sensitivity to carbon is consistent with classical steel metallurgy and is observed across both global importance rankings and strength-dependent performance trends [
48,
49]. Other alloying elements, such as silicon and molybdenum, contribute more modestly, in line with their secondary roles in solid-solution strengthening and temper resistance within the composition–processing space sampled here [
50].
Elements such as N, Cu, and Nb exhibit limited influence in the present analysis. This should not be interpreted as metallurgical insignificance, but rather as a consequence of the dataset scope and descriptor resolution. The strengthening contributions of microalloying elements are often strongly coupled to thermo-mechanical processing details that are not explicitly represented in the available data [
51]. As a result, their effects are only weakly expressed in a model driven primarily by bulk composition and heat-treatment parameters.
5.2. Machine Learning Performance and Robustness
Under strict group-aware evaluation, the RF model demonstrates strong, yet deliberately conservative, predictive performance. When evaluated on the group-aware test set comprising 121 unseen thermomechanical states (258 records), the final tuned model achieves an R2 of approximately 0.90, with a mean absolute error of about 40 MPa and a root mean squared error of about 78 MPa. These error magnitudes are small relative to the wide UTS range covered by the dataset (≈385–1911 MPa), indicating that the model captures the dominant composition processing strength relationships while avoiding information leakage.
The close agreement between baseline and tuned model performance further supports the robustness of the learning framework. Hyperparameter tuning yields only marginal improvements in test-set metrics, indicating that the predictive signal is primarily determined by the underlying data structure rather than aggressive model optimization. This behavior is consistent with a well-posed regression problem in which physically meaningful descriptors already encode much of the relevant information.
Robustness was further examined through ten repeated group-aware train–test resampling experiments, which reveal substantial variability in the coefficient of determination, with R2 values ranging from 0.19 to 0.96 and a mean of 0.82. This variability reflects the dataset’s heterogeneity and the sensitivity of variance-normalized metrics such as R2 to the composition of the test set. In particular, splits dominated by a small number of sparsely represented, very high-strength states can exhibit disproportionately low R2 values, even when absolute error magnitudes remain moderate. Importantly, error-based metrics are considerably more stable across splits, with mean MAE ≈ 40.6 ± 11.6 MPa and mean RMSE ≈ 81.6 ± 36.4 MPa, indicating consistent pointwise prediction accuracy.
Strength-stratified analysis provides additional insight into this behavior. Prediction errors are lowest in the medium-strength regime (700–1000 MPa), where data coverage is densest, and increase toward both lower- and higher-strength extremes. In the very high-strength regime (>1300 MPa), errors increase substantially, reflecting limited sample availability and heightened sensitivity of UTS to processing variations. This pattern highlights that the model performs best as an interpolator within well-represented regions of the composition–processing space, while extrapolation toward sparsely sampled extremes remains challenging [
52].
The present model infers microstructural effects indirectly through coarse processing descriptors, such as bar diameter and tempering temperature, rather than explicit microstructural variables (e.g., grain size, phase fractions, or precipitation state). This limitation is particularly relevant for microalloyed steels and advanced thermomechanical routes, where strength is strongly influenced by deformation history and precipitation mechanisms. Incorporating microstructure-informed or mechanics-guided features represents a natural extension of the framework and may further improve predictive accuracy and physical fidelity.
Several key parameters known to influence UTS are not explicitly represented in the present feature space, including prior austenite grain size, phase fractions, cooling rate beyond bar diameter, deformation history, and precipitation state. The absence of these microstructural and thermo-mechanical descriptors may bias the learned relationships toward composition and coarse processing variables, contributing to the increased error observed in sparsely populated and high-strength regimes. As a result, residual scatter should be interpreted as reflecting both model uncertainty and unmodeled physical variability rather than purely statistical noise.
Overall, the combination of leakage-free evaluation, consistent test-set performance, and transparent robustness analysis indicates that the RF model provides reliable and physically plausible UTS predictions within the domain of the curated dataset. The observed performance variability under repeated group-aware resampling should be interpreted not as model instability, but as an honest reflection of data heterogeneity and the intrinsic difficulty of generalizing across distinct thermomechanical states.
5.3. Sustainability Implications
From a sustainability perspective, developing accurate, data-driven models to predict mechanical properties offers significant opportunities to reduce the environmental footprint of steel design and processing. The present RF model, trained on an open-access database and evaluated under a conservative group-aware framework, enables virtual screening of composition and heat-treatment combinations prior to resource-intensive experimental testing. In practice, such models are best viewed as decision-support tools that narrow the design space rather than as replacements for final experimental validation.
To illustrate the potential scale of sustainability benefits, scenario-based estimates were constructed using published life-cycle and industrial data. A recent life-cycle assessment of tensile testing on 316L stainless steel reports that a standard ASTM E8 [
53] tensile test consumes approximately 2 MJ of electricity per test (≈0.56 kWh) and destroys a specimen weighing about 0.256 kg. Using a representative grid emission factor of 0.394 kg CO
2 per kWh and an average steel production intensity of 2.18 kg CO
2e per kilogram of steel [
54,
55], avoided physical tests translate directly into energy, material, and emissions savings.
Because the extent to which ML screening can replace physical tests depends on project context, a sensitivity analysis was performed by considering three realistic screening scenarios, in which 50%, 70%, and 80% of initially planned tensile tests are replaced by ML-based virtual screening, while the remaining tests are retained for confirmation and certification. As summarized in
Table 10, these scenarios yield approximately 28–44 kWh in electricity savings, 12.8–20.5 kg in steel savings, and combined CO
2e emissions reductions of roughly 39–62 kg per 100 candidate compositions. While these values are approximate and depend on local energy mixes, specimen geometry, and testing protocols, they demonstrate that even partial adoption of ML screening can yield non-negligible sustainability benefits.
Beyond direct reductions in testing energy and material use, this study’s results suggest broader opportunities for sustainable alloy and process design. The concentration of predictive influence in a small set of variables, primarily overall alloying level, carbon content, bar diameter, and tempering temperature, indicates that UTS can often be tuned effectively through processing optimization rather than increased alloying. This creates opportunities to reduce reliance on alloying additions with high embodied energy or supply risk, while still achieving target strength levels through optimized heat-treatment schedules and section geometry.
In addition, robust ML models can support more efficient use of secondary raw materials and scrap, where compositional variability poses challenges for high-recycled-content steels [
55]. By linking small deviations in chemistry to adjusted processing routes and predicted UTS, ML-based tools can help steelmakers accommodate broader scrap chemistries while maintaining property specifications. In this sense, the sustainability value of ML extends beyond test reduction alone, contributing to improved circularity, reduced resource intensity, and more flexible steel production pathways.
It should be noted that the assumed electricity consumption per test, emission factors, and specimen mass represent typical literature values and may vary across regions, facilities, and testing protocols. As a result, the reported energy, material, and CO2 savings should be interpreted as order-of-magnitude estimates rather than precise predictions. While explicit uncertainty bounds are not quantified, the scenario-based analysis captures a realistic range of outcomes, and the relative trends remain robust across plausible variations in these parameters.
6. Conclusions
This study demonstrates that an RF model trained on a carefully curated open-access database of 1255 heat-treated steels can provide reliable and physically meaningful predictions of UTS when evaluated under a leakage-free, group-aware validation framework. Using 18 compositional and 7 processing descriptors, the final tuned model achieves robust test-set performance (R2 ≈ 0.90, MAE ≈ 40 MPa), with unbiased residuals and generalization across distinct thermomechanical states.
The results show that UTS is governed by a hierarchy of metallurgical controls, dominated by overall alloying level, carbon content, and processing parameters that regulate transformation kinetics, particularly bar diameter and tempering temperature. SHAP-based importance analysis and partial dependence trends confirm that the model’s learned relationships are consistent with classical steel metallurgy, while also highlighting the limitations imposed by dataset scope and descriptor resolution for microalloying effects.
Beyond predictive accuracy, this work underscores the importance of physically informed data curation, state-level validation, and cautious interpretation of correlated features in materials machine learning. The proposed framework positions ML as a robust decision-support tool rather than a replacement for experiments, enabling efficient virtual screening of composition–processing combinations prior to targeted validation.
Overall, the study provides a transparent and reproducible foundation for data-driven UTS prediction in steels and illustrates how open data and conservative ML workflows can support more efficient, interpretable, and sustainable materials development. Future extensions may incorporate richer microstructural descriptors, additional mechanical properties, and coupled process structure property modeling within integrated computational materials engineering frameworks.