1. Introduction
Tea is one of the most economically valuable agricultural commodities worldwide, not only due to its commercial importance but also because of its socio-cultural significance across producing regions. The stability of global consumption, advances in processing technologies, and the expansion of international trade networks have strengthened tea’s role as a major source of income and employment, particularly in Asia [
1,
2]. However, tea production levels are increasingly shaped by climate conditions, input costs, labor structures, demand dynamics, government support mechanisms, and trade policies. Moreover, the concentration of production within specific agro-ecological zones exposes the sector to both environmental and economic vulnerabilities [
3,
4].
Global tea production is dominated by a limited number of leading countries. China alone accounts for nearly half of total world output, while India, Kenya, Sri Lanka, Türkiye, and Vietnam collectively contribute nearly 90% of the world’s total tea production [
5]. Owing to this concentration, fluctuations in the production patterns of these countries exert a disproportionate impact on global supply stability. Understanding their long-term production dynamics is, therefore, critical for evaluating supply resilience and designing sustainable production policies.
Producer countries have exhibited markedly different responses to climate-related risks, including rising temperatures, irregular precipitation, and extreme weather events. Empirical evidence indicates that heatwaves and temperature extremes have amplified yield losses in several regions, particularly in China [
6], while countries such as Kenya, Sri Lanka, and India experience production volatility driven by rainfall irregularities, labor cost, and ecological constraints [
7,
8,
9]. In contrast, Vietnam has improved both yield and long-term production stability through agro-ecological practices and soil management improvements [
10]. Although Türkiye’s tea cultivation areas are geographically limited, high domestic demand, modern cultivation techniques, and producer training programs have supported relatively stable productivity despite land constraints. These contrasting responses highlight the structural heterogeneity underlying global tea production dynamics [
11].
The existing literature documents a wide range of environmental, economic, and policy-related factors influencing tea production. Nevertheless, most studies focus on single-country analyses, short-term assessments, or specific yield determinants and, therefore, fail to capture cross-country differences in production behavior. In addition, long-term time-series studies that integrate structural trends with short-term shocks remain limited, and multi-country projection analyses are largely absent [
12,
13,
14,
15,
16]. This gap is particularly important given that producer countries differ substantially in their structural characteristics, environmental sensitivities, and economic responses to market and climate fluctuations.
To address these limitations, this study adopts a unified, multi-country, and long-term analytical framework. Unlike previous research, it integrates country-specific ARIMA models with market concentration indicators to jointly assess production dynamics and structural dominance across major tea-producing countries. By examining annual data from 1961 to 2023 and generating projections for 2024–2028, the study explicitly compares long-term trajectories and short-term fluctuations across countries within a consistent methodological setting. This approach provides new analytical insight into the heterogeneity of global tea production dynamics and advances the existing literature by moving beyond single-country or short-horizon forecasting studies.
The overarching research question of this study is as follows:
“How have production dynamics evolved across major tea-producing countries, and in what ways do their structural behaviors differ over time?”
To answer this question, this study
Develops ARIMA models tailored to each country’s time series;
Isolates long-term trends and short-term shocks;
Produces production projections for 2024–2028;
Compares production structures, sensitivities, and trajectories across countries.
It should be noted that the forecasting horizon adopted in this study is not intended to provide short-term point predictions for immediate calendar years, but rather to examine medium- to long-term production trends, structural dynamics, and cross-country heterogeneity in global tea production. Accordingly, the forecast results are interpreted primarily in terms of trend behavior and comparative patterns, rather than real-time year-specific accuracy.
3. Results
Table 2 summarizes the global tea production structure from the 1961–1970 period up to the 2024–2028 projection interval. The results show a steady increase in market concentration over time. The share of the largest producer (CR
1), which was around 33.6% in the 1960s, rose to 41.7% in 2011–2020 and further to an estimated 53.9% in 2024–2028. Similarly, the combined share of the top five producers (CR
5) is expected to reach 89.3% in 2024–2028, indicating that global tea supply is increasingly dominated by a small number of countries.
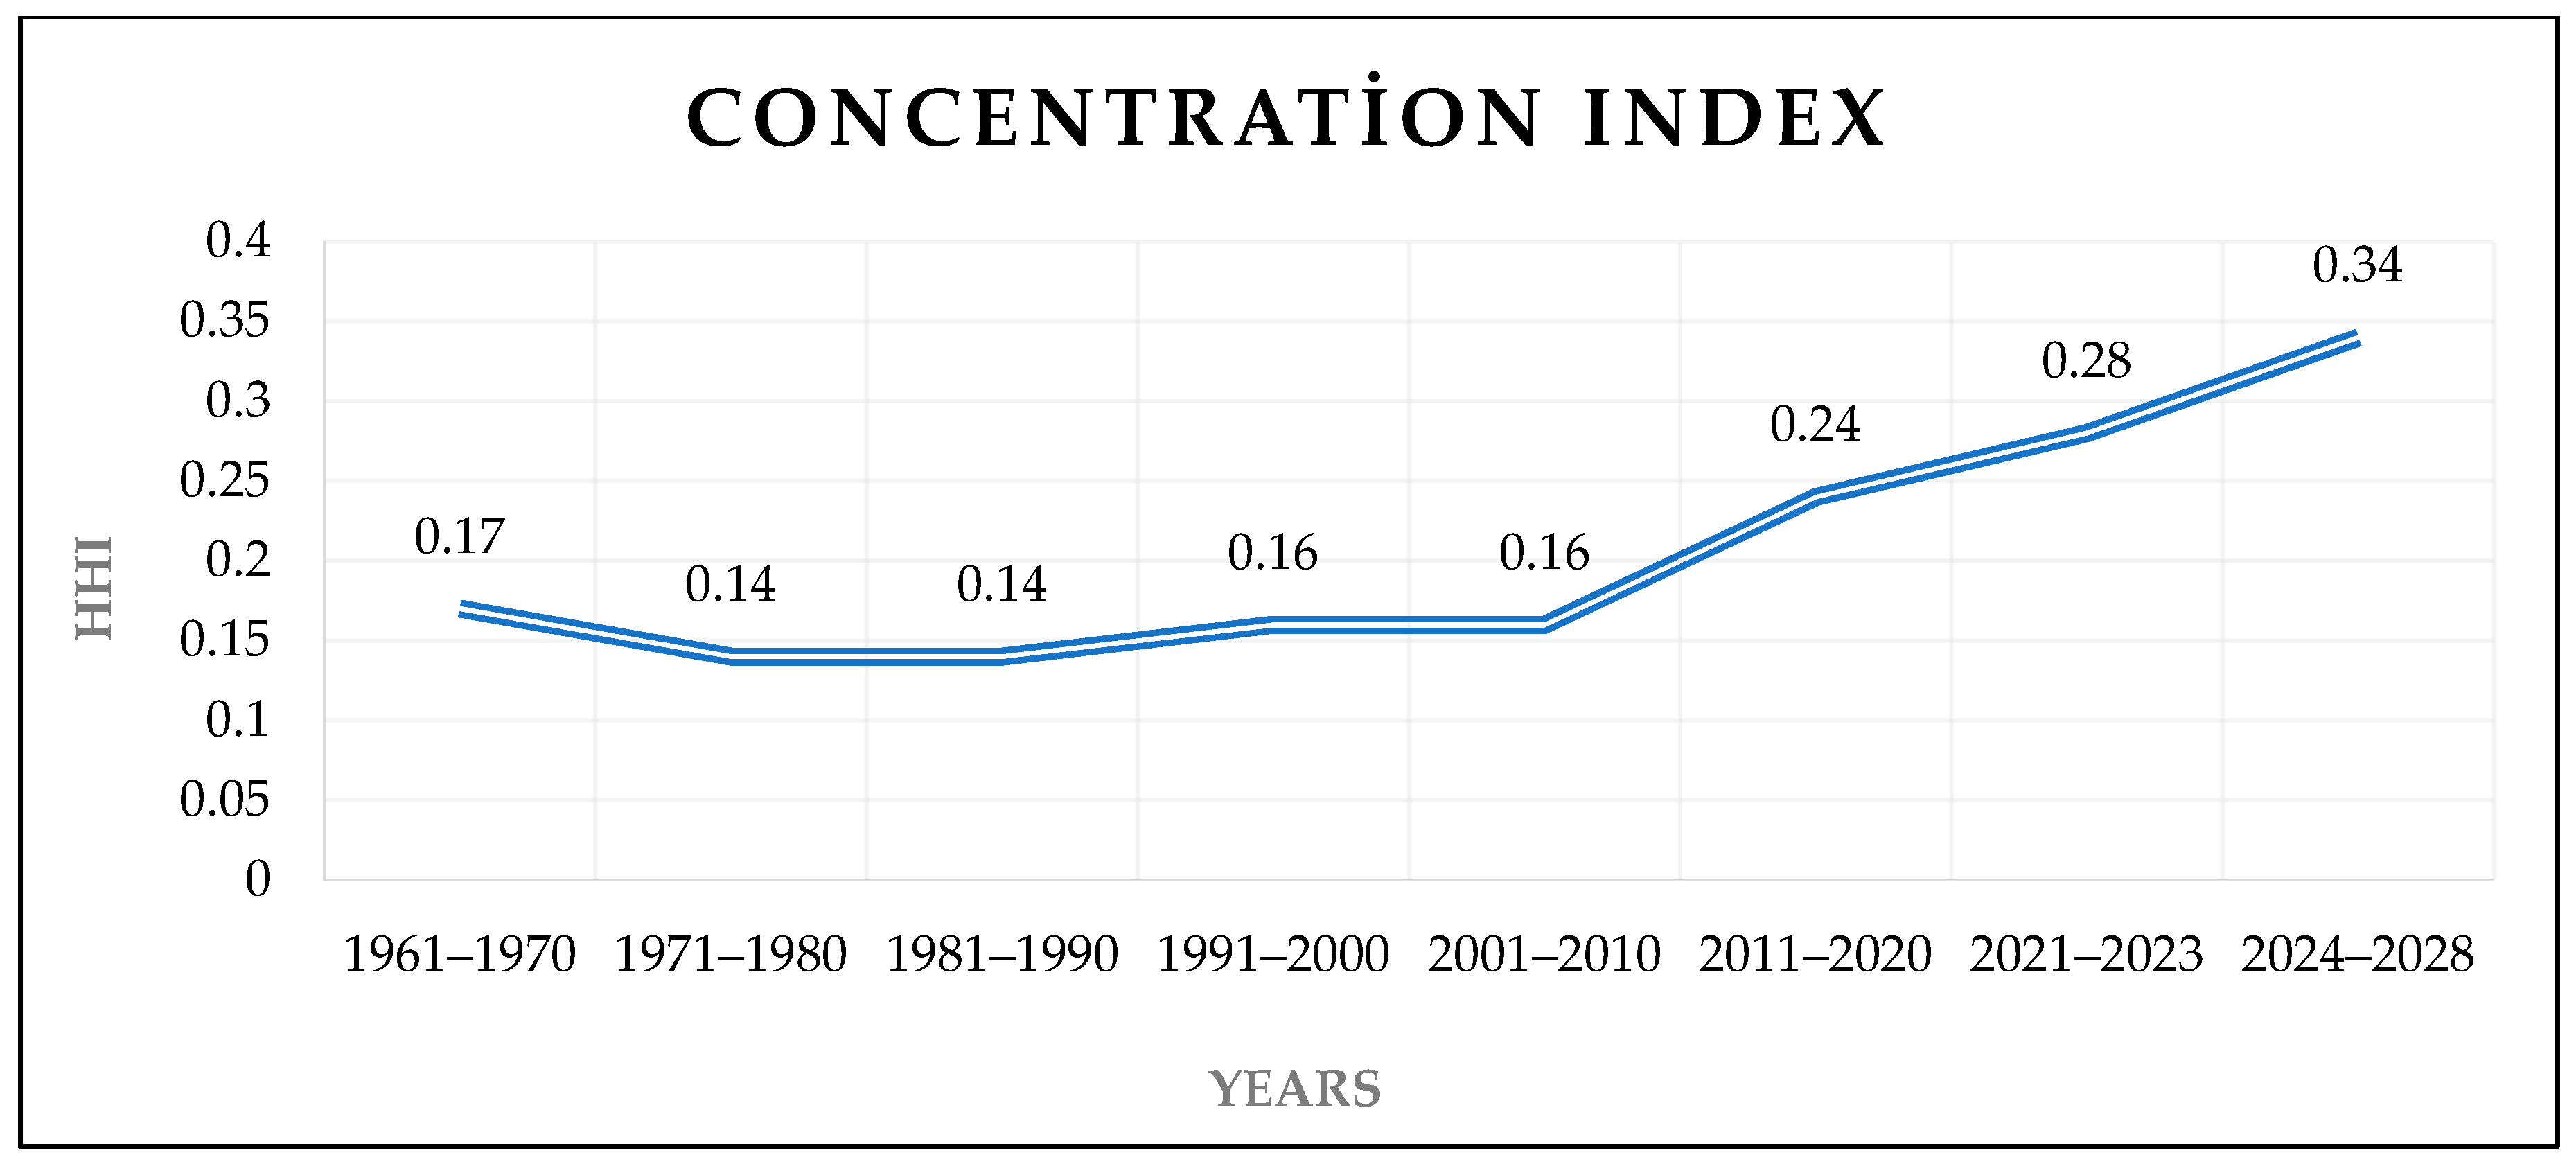
This trend is also supported by the Herfindahl–Hirschman Index (HHI), which increased from 0.17 in 1961–1970 to 0.34 in the 2024–2028 projections (
Figure 1). An HHI value of 0.34 suggests a transition toward an oligopolistic market structure. Conversely, the inverse index (HHI
−1), which reflects the “equivalent number of producers,” decreased from 5.91 to 2.97 during the same period, implying that market power has become concentrated among fewer leading countries.
Changes in country-level dominance across decades also support this structural shift. While India, Sri Lanka, China and Japan were among the key producers in the 1960s–1970s, China’s rapid production growth since the early 2000s enabled the country to surpass other producers, becoming the global leader. Over time, India, Kenya, Sri Lanka and Türkiye alternated positions, yet the top-producing group continued to dominate global output. This prolonged stability in leadership indicates an increasingly settled oligopolistic market configuration.
Overall, the long-term trajectory suggests that global tea production has evolved into a more concentrated system with limited producer diversification. The projection period (2024–2028) confirms that this concentration is expected to persist, with significant implications for market resilience, supply stability and international trade dynamics.
3.1. Projections for Tea Production in Leading Producer Countries
The ARIMA-based production forecasts for the major tea-producing countries are presented in
Table 3. These projections, limited to a five-year horizon in accordance with model reliability standards, indicate consistent upward trends across nearly all leading producers.
Global tea output is expected to rise steadily from 32.83 million tons in 2024 to 35.33 million tons in 2028, corresponding to an approximate increase of 3 million tons over the projection period. This confirms a stable and persistent upward trajectory in world tea production.
It should be noted that the ARIMA-based forecasts presented in
Table 3 represent expected production trajectories and should be interpreted within the context of associated confidence intervals. As with all time-series projections, forecast uncertainty increases with the projection horizon, and therefore, the reported values reflect central tendencies rather than deterministic outcomes. Acknowledging this uncertainty is particularly important for policy formulation and strategic planning, as projected growth rates may vary depending on future climatic, economic, and market conditions.
Accordingly, these projections are intended to support scenario-based decision-making rather than precise quantitative targets.
At the national level, China exhibits the highest projected growth rate, reinforcing its dominant leadership in global tea production. India is expected to show modest but continuous growth, while Kenya and Vietnam demonstrate small, yet steady increases driven primarily by export-oriented production structures. Türkiye and Sri Lanka, on the other hand, show comparatively limited and more fluctuating growth patterns, reflecting structural constraints and variability in production conditions.
Overall, the projections signal a continuation of the current global production hierarchy, with China’s dominance intensifying, India maintaining stable expansion, and Kenya–Vietnam sustaining export-driven incremental growth. These trends collectively suggest that the global tea market will remain concentrated, with limited shifts in the distribution of production shares over the forecast horizon.
3.2. Forecasting Global Tea Production
Time-series analysis of global tea production first required determining whether the series exhibited stationarity. Augmented Dickey–Fuller (ADF) test results indicated that the series was non-stationary at the level of production but became stationary after first differencing (p < 0.05). Accordingly, the order of differencing was set to d = 1. Model identification based on the Autocorrelation Function (ACF), Partial Autocorrelation Function (PACF), and SCAN–ESACF tables suggested that ARIMA (1, 1, 1) was the most appropriate structure for capturing the series’ autoregressive and moving-average components.
Parameter estimates confirmed that differencing successfully removed the unit-root effect. Although the MA(1) parameter did not reach statistical significance (MA(1) = −0.0019571; p = 0.9880), residual diagnostics demonstrated that the overall model performance remained adequate. The Durbin–Watson statistic of approximately 2.00 and Ljung–Box Q statistics exceeding the 0.05 threshold indicated that residuals behaved as white noise, supporting the suitability of the ARIMA (1, 1, 1) model.
Model-selection criteria further validated this structure. Among alternative ARIMA (
p, 1, q) candidates, ARIMA (1, 1, 1) produced the lowest AIC (1901.495) and BIC (1903.822) values. Forecast-accuracy measures based on one-step-ahead predictions yielded MAE = 556,247 and RMSE = 1,087,383.46, confirming that the model provided sufficiently reliable long-term projections for annual global tea production. Detailed model statistics are reported in
Table A1.
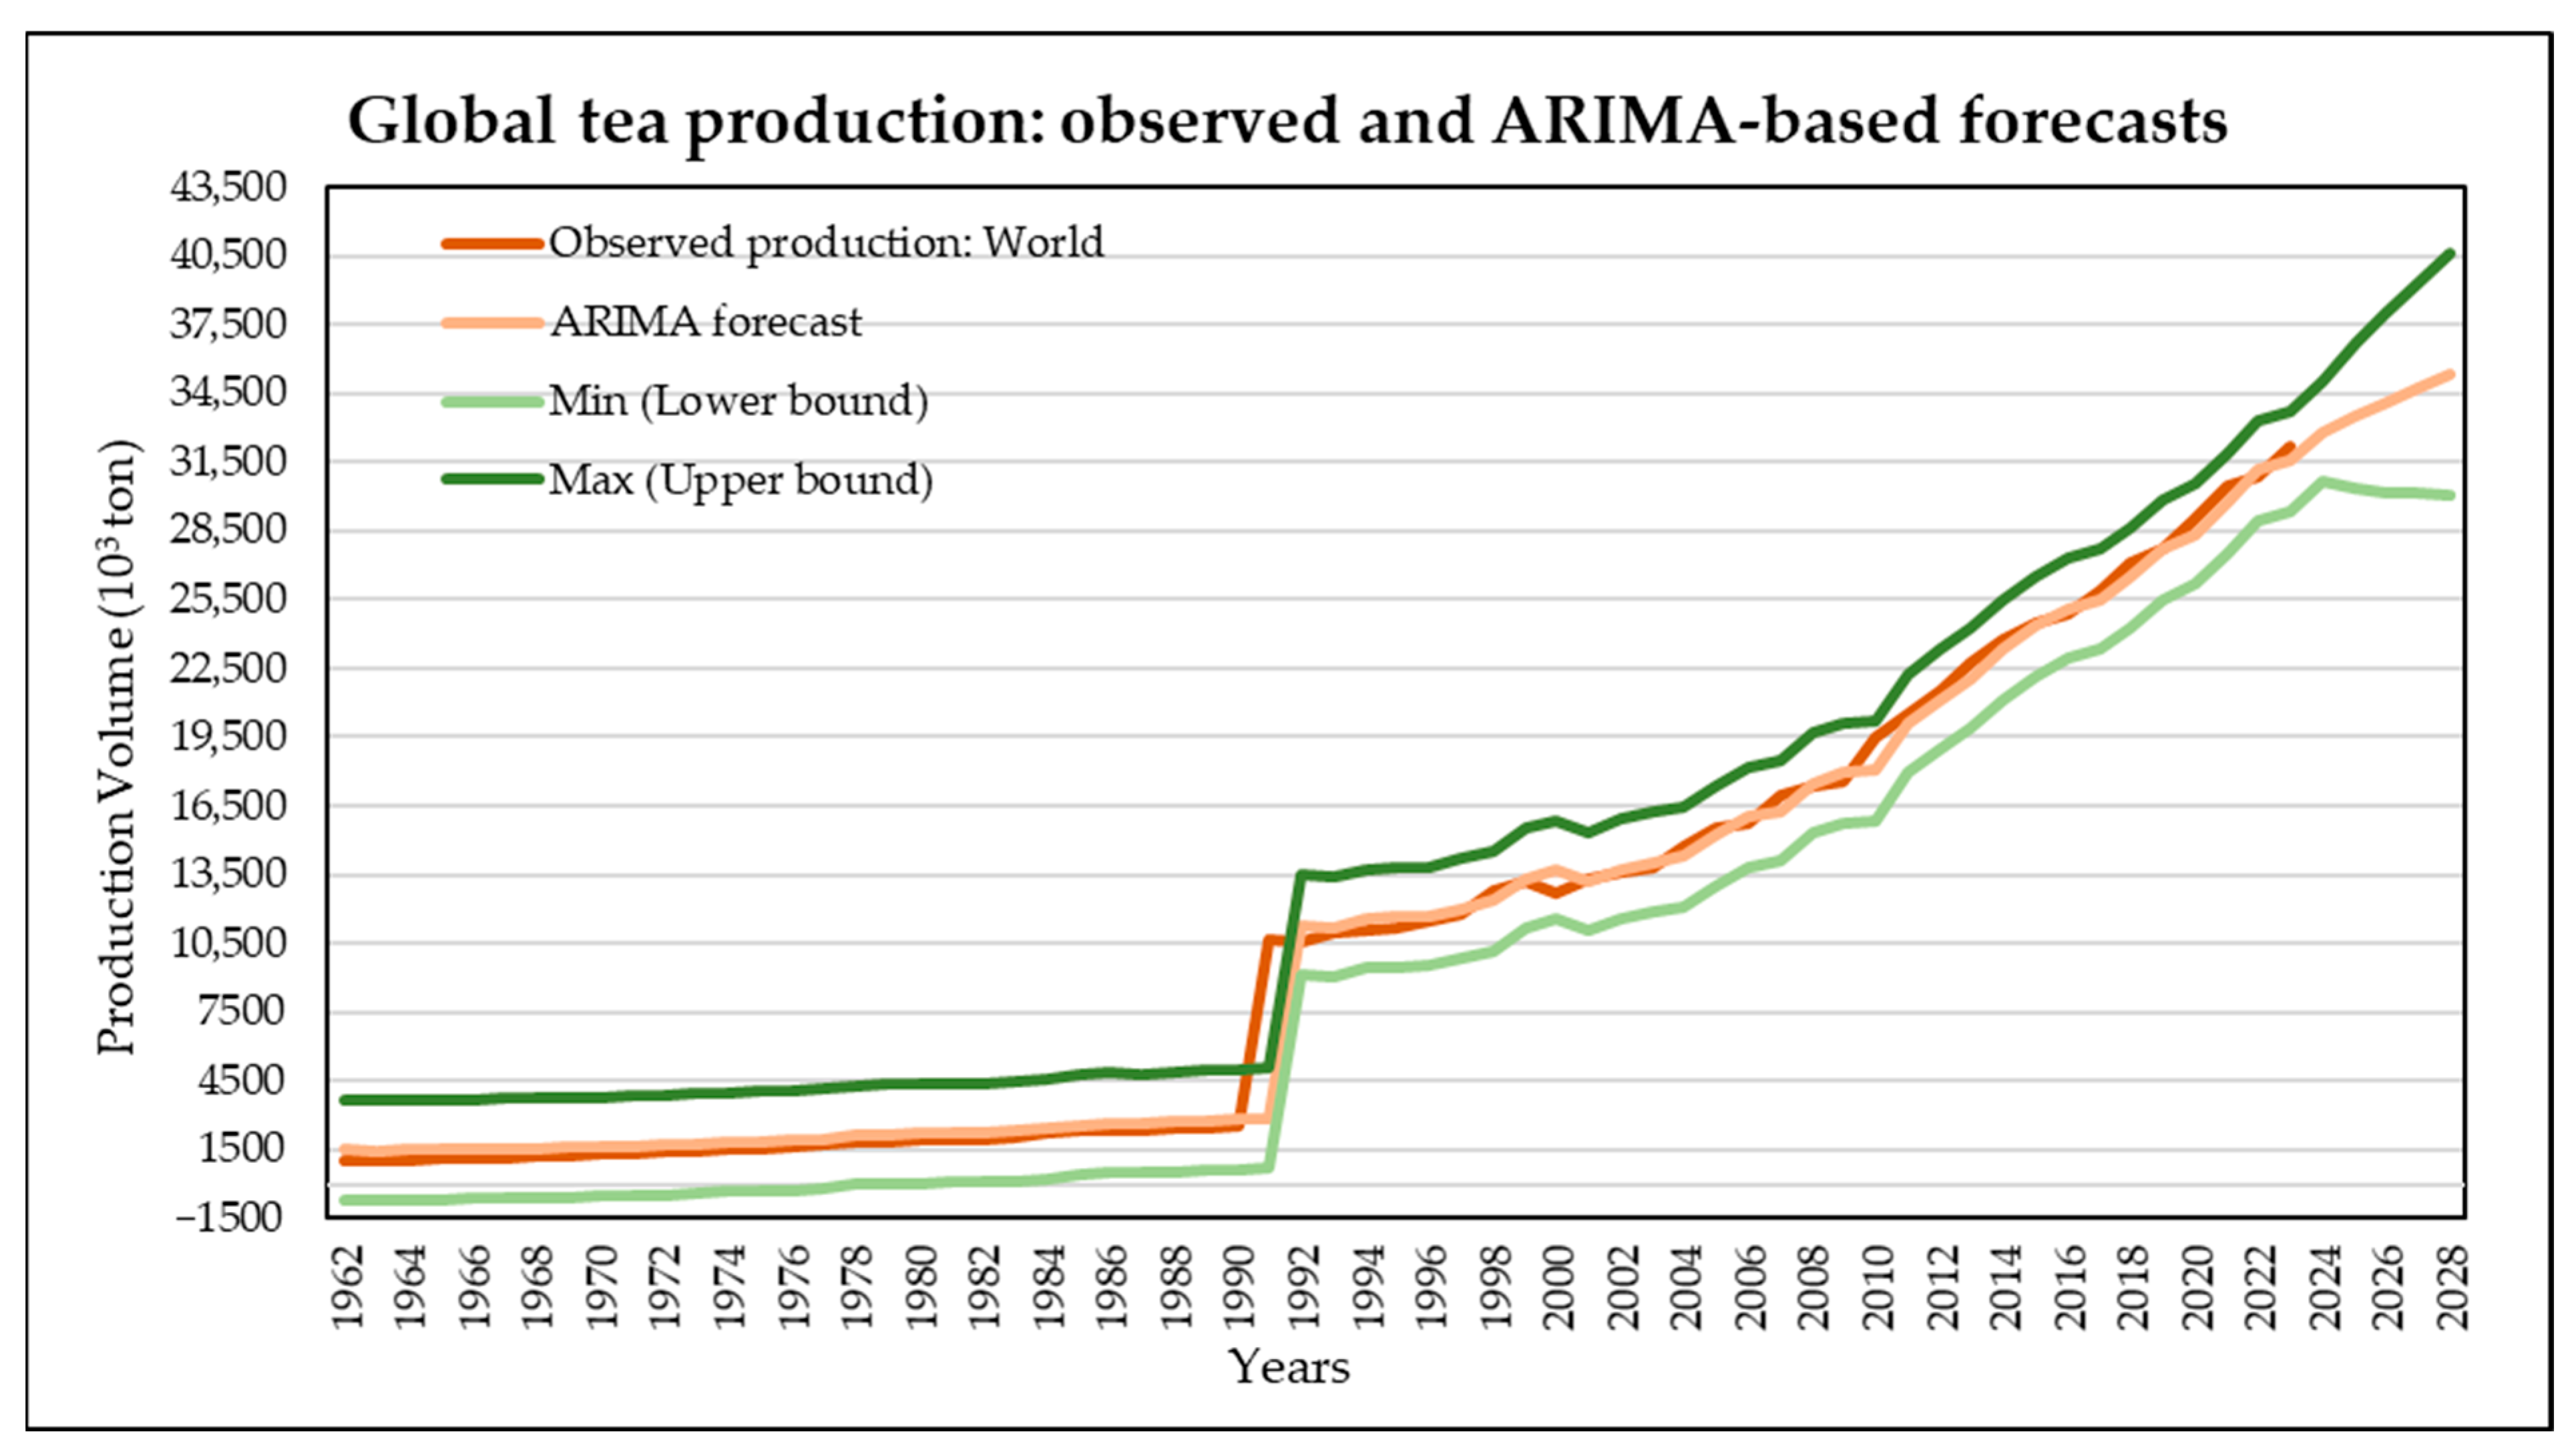
The ARIMA (1, 1, 1) projections reveal a persistent upward trend in global tea production over the long term (
Figure 2). In all figures, the Min and Max curves denote the lower and upper bounds of the forecasted values obtained from the ARIMA model, providing an interval-based representation of forecast uncertainty. While production increased moderately yet steadily from the 1960s through the early 1990s, a more pronounced acceleration emerged thereafter, reflecting expanding cultivated areas, technological advancements, and rising global demand. The model’s forecast intervals (Lower–Upper bounds) indicate that the projection uncertainty remains within reasonable limits, predicting that global tea output will reach an average of approximately 34.09 million tons by 2028.
The pronounced increase observed around the early 1990s reflects a structural change inherent in the historical global tea production data rather than an artifact generated by the ARIMA model. The ARIMA framework captures and extrapolates this data-driven transition, preserving the underlying production dynamics without imposing artificial trend shifts.
The noticeable increase observed around 1990 reflects a structural shift in global tea production rather than a modeling artifact. This period coincides with the expansion of tea cultivation areas, accelerated technological adoption in major producing countries, and increasing global demand, particularly from emerging markets. The ARIMA model captures this transition as an inherent feature of the historical data, thereby projecting the post-1990 growth trajectory accordingly.
Overall, the findings demonstrate that the global tea sector continues to grow economically and culturally, with long-term production dynamics shaped primarily by environmental conditions, input costs, and productivity levels. The ARIMA (1, 1, 1) model successfully captures these trends and provides statistically reliable forecasts for future global production patterns.
3.3. China’s Tea Production Forecast
The annual time series data for China’s tea production were first examined in terms of stationarity. The Augmented Dickey–Fuller (ADF) test indicated that the series was non-stationary at the level of production but became stationary after first differencing (p < 0.05). Therefore, the differencing order was set to d = 1, and the model identification process—based on ACF–PACF analyses, SCAN, and ESACF tables—suggested that the ARIMA (1, 1, 1) specification was the most appropriate structure for the series.
Parameter estimation results show that the ARIMA (1, 1, 1) model is statistically significant. The constant term was found to be significant (MU = 258,593.9; p < 0.0001). The moving-average parameter MA(1) was also significant (MA(1) = −0.33724; p = 0.0090), indicating that past error terms have a meaningful influence on current production levels.
Model adequacy criteria and forecasting performance metrics are presented in
Table A1. The ARIMA (1, 1, 1) model yielded the lowest AIC (1737.86) and BIC (1744.25) values among all alternative ARIMA structures. In addition, error metrics confirmed the model’s strong performance (MAE = 128,878.33; RMSE = 279,999.63). The Durbin–Watson statistic being close to 2.00 suggests no autocorrelation in the residuals. Collectively, these diagnostics demonstrate that the ARIMA (1, 1, 1) model is statistically reliable for explaining and forecasting China’s tea production.
Forecast results also indicate that China continues to strengthen its leadership position in global tea production. Beyond the statistical properties of the forecast, the magnitude of China’s projected production growth can be interpreted in light of several external factors. Technological advancements, including mechanization, improved processing efficiency, and the adoption of high-yield cultivars, have significantly enhanced production capacity over recent decades. In parallel, investments in climate adaptation strategies—such as improved irrigation, pest management, and region-specific cultivation practices—have mitigated the adverse effects of climatic variability. From an economic perspective, sustained domestic demand, export-oriented policies, and economies of scale within China’s tea sector further support the persistence of the upward production trajectory observed in the forecasts.
These factors collectively provide a structural explanation for why the statistically projected growth remains both stable and pronounced over the forecast horizon. The projections suggest a consistent and stable upward trend during the 2024–2028 period, with the average annual increase estimated to range between 70,000 and 120,000 tons. The relatively narrow confidence intervals imply low forecast uncertainty and high predictive power.
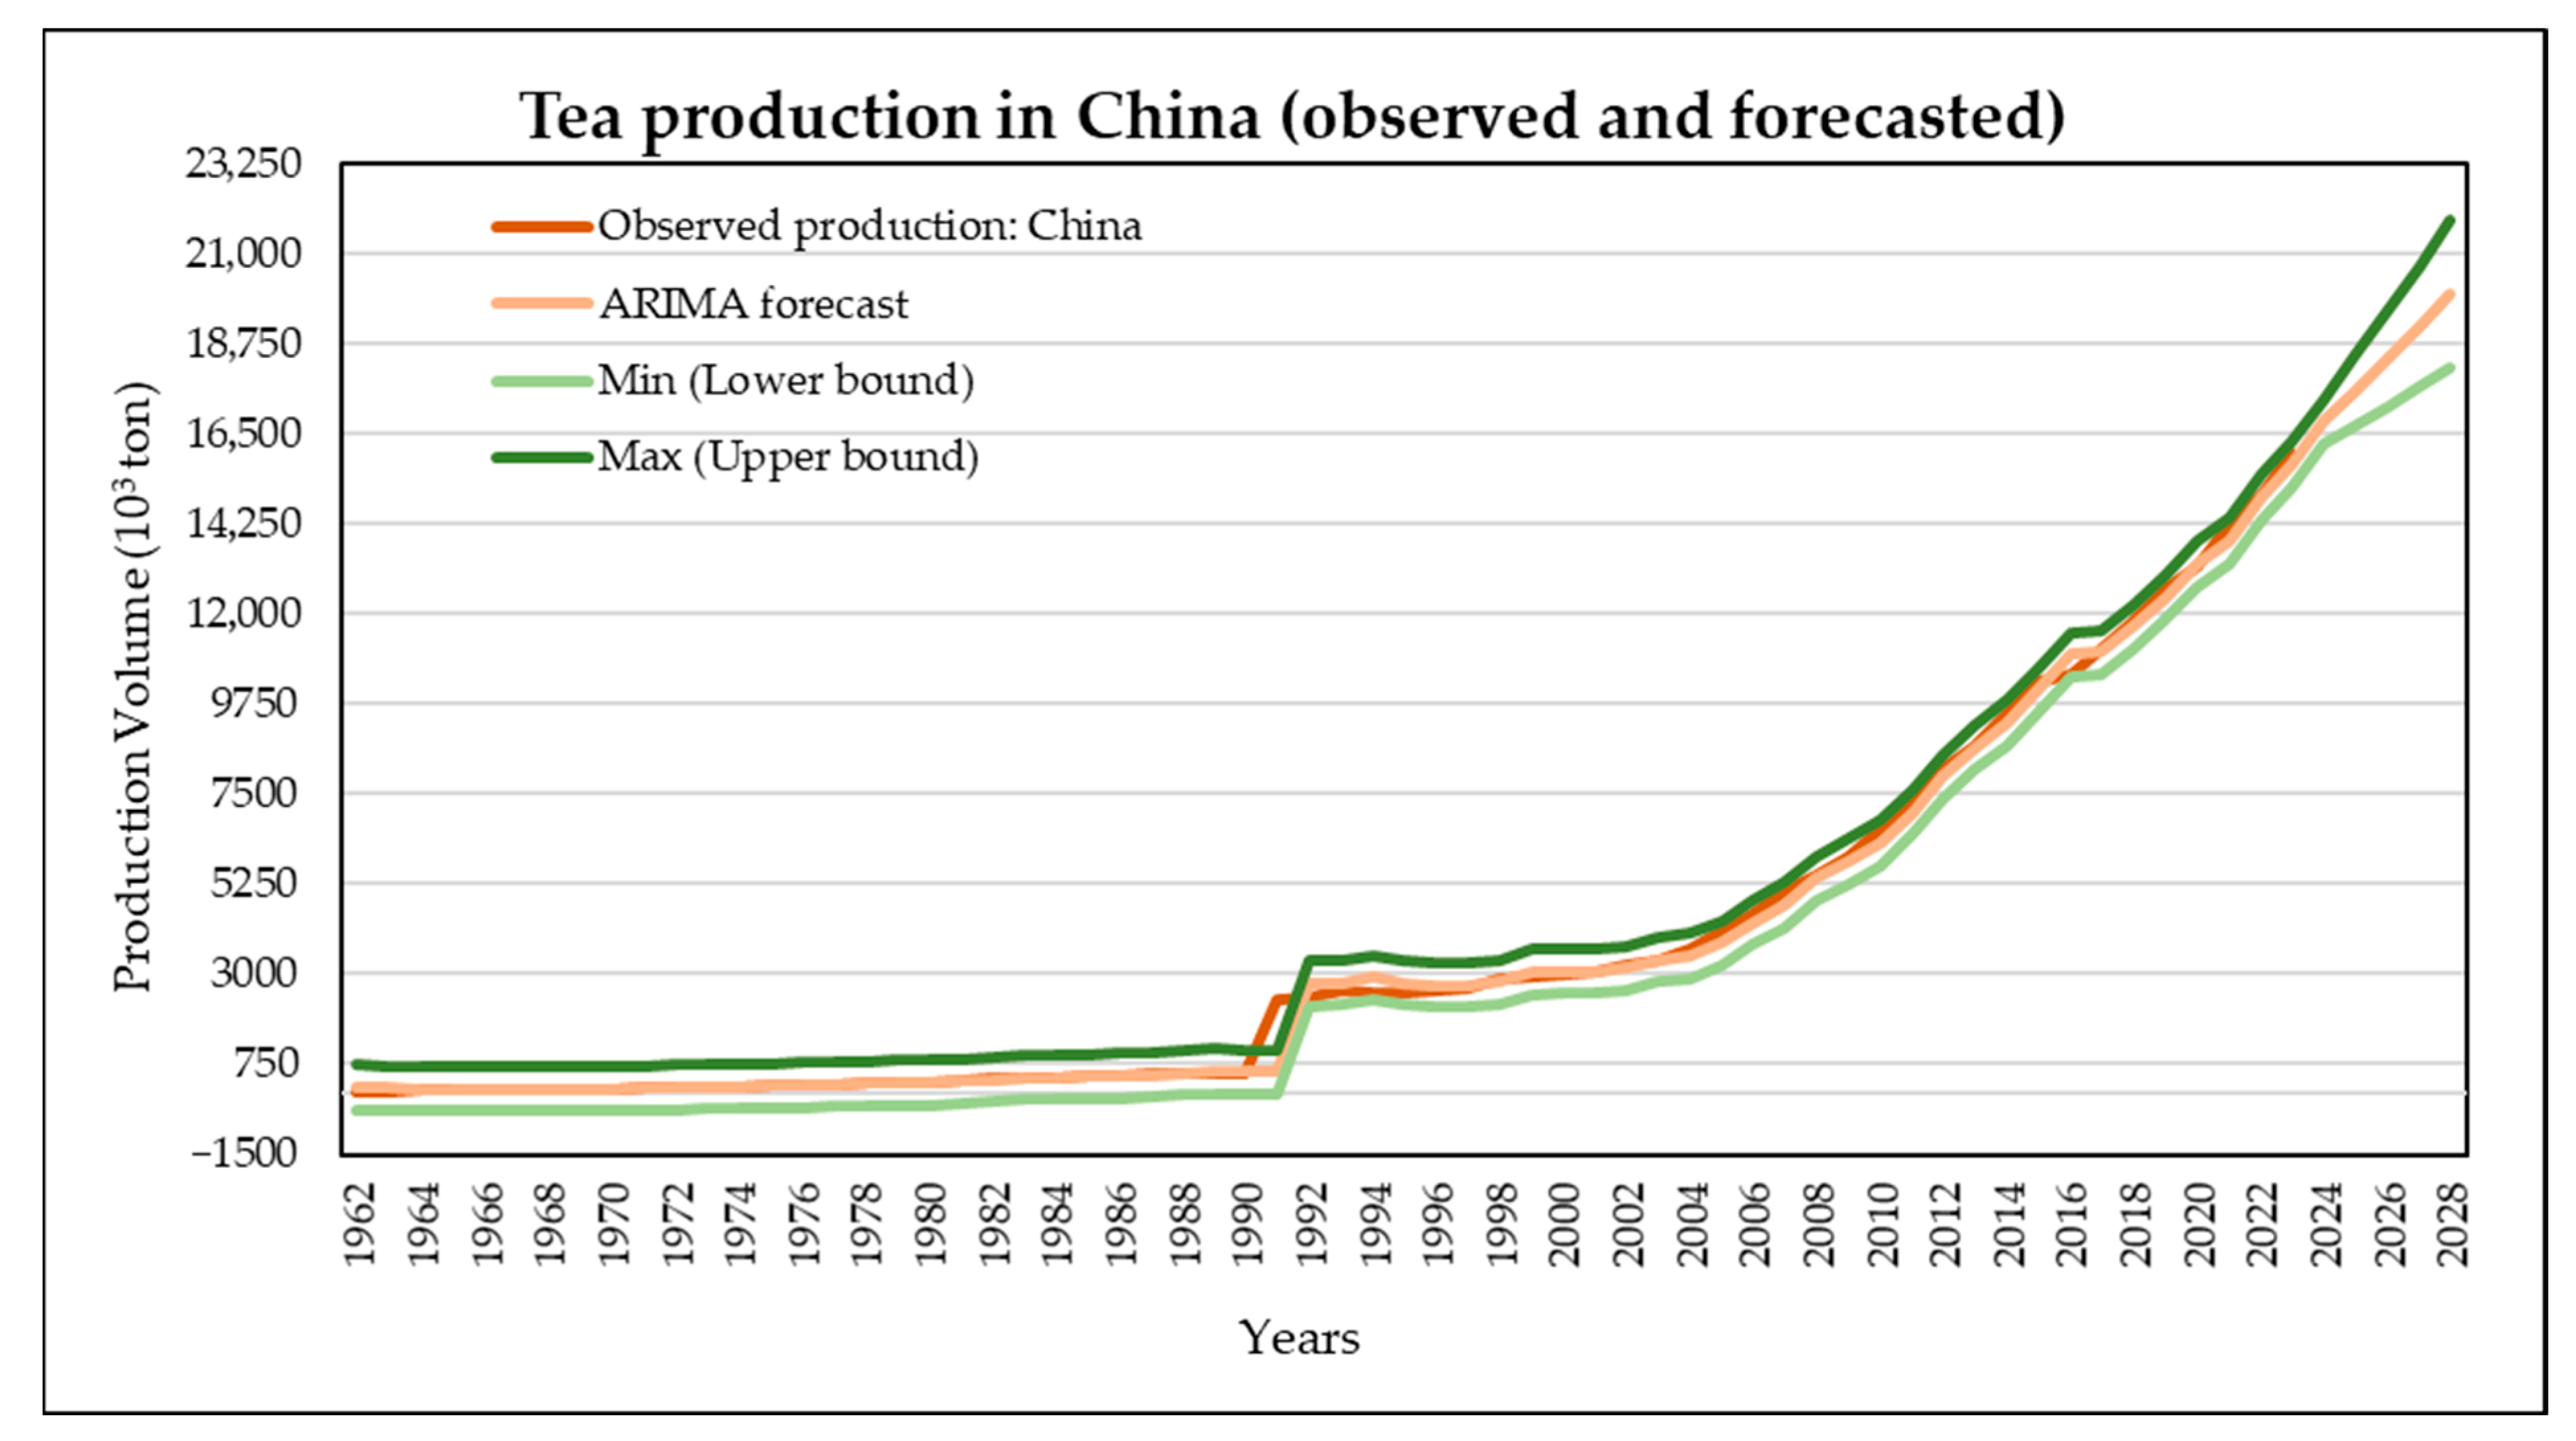
The production forecast curve for the 1961–2028 period (
Figure 3) reveals a pronounced long-term upward trend in China’s tea output. While growth was relatively modest in the 1960s and 1970s, a rapid and continuous increase began in the early 1990s and has persisted to the present. The close alignment between the forecast series and observed values further confirms the strong fit of the ARIMA (1, 1, 1) model.
The model’s forecasted values and confidence bounds indicate that China’s production capacity will continue to expand in the coming years. Projections estimate that China’s tea production will average around 18.38 million tons during the 2024–2028 period. These findings suggest that China will maintain and further reinforce its dominant position in the global tea market, sustaining its production momentum over the long term.
3.4. Forecasting Tea Production in India
The stationarity properties of India’s annual tea production series were examined using the Augmented Dickey–Fuller (ADF) test. The test results indicated that the series was non-stationary at the level of production but became stationary after first differencing (p < 0.05). Accordingly, the differencing order was set as d = 1, and the model identification process suggested an ARIMA (1, 1, 1) structure.
The estimated model parameters showed that the constant term (μ = 96,888.4; p ≈ 0.02) was statistically significant, confirming the presence of a long-term upward trend in India’s tea production. In contrast, the MA(1) coefficient representing short-term error-correction dynamics (≈0.07; p > 0.05) was found to be statistically insignificant, suggesting that short-term shocks have a limited influence on the production process. The absence of autocorrelation in the residuals (Durbin–Watson ≈ 2.00) and Ljung–Box statistics above 0.05 further confirmed that the ARIMA (1, 1, 1) model adequately captured the error structure.
The statistical insignificance of the MA(1) component indicates that short-term error-correction effects play a limited role in shaping India’s tea production dynamics. Instead, the forecasting performance of the ARIMA (1, 1, 1) model is largely driven by the persistence of the long-term trend component, reflecting structurally stable growth supported by sustained domestic demand and export-oriented production. As a result, the absence of a significant moving-average term does not adversely affect predictive accuracy, but rather suggests that production dynamics are governed primarily by gradual, trend-based adjustments rather than transitory shocks.
Consistent with the diagnostic and validation framework applied to other major producers, the AIC–BIC criteria and error metrics confirm the adequacy of the selected ARIMA (1, 1, 1) specification for India’s tea production.
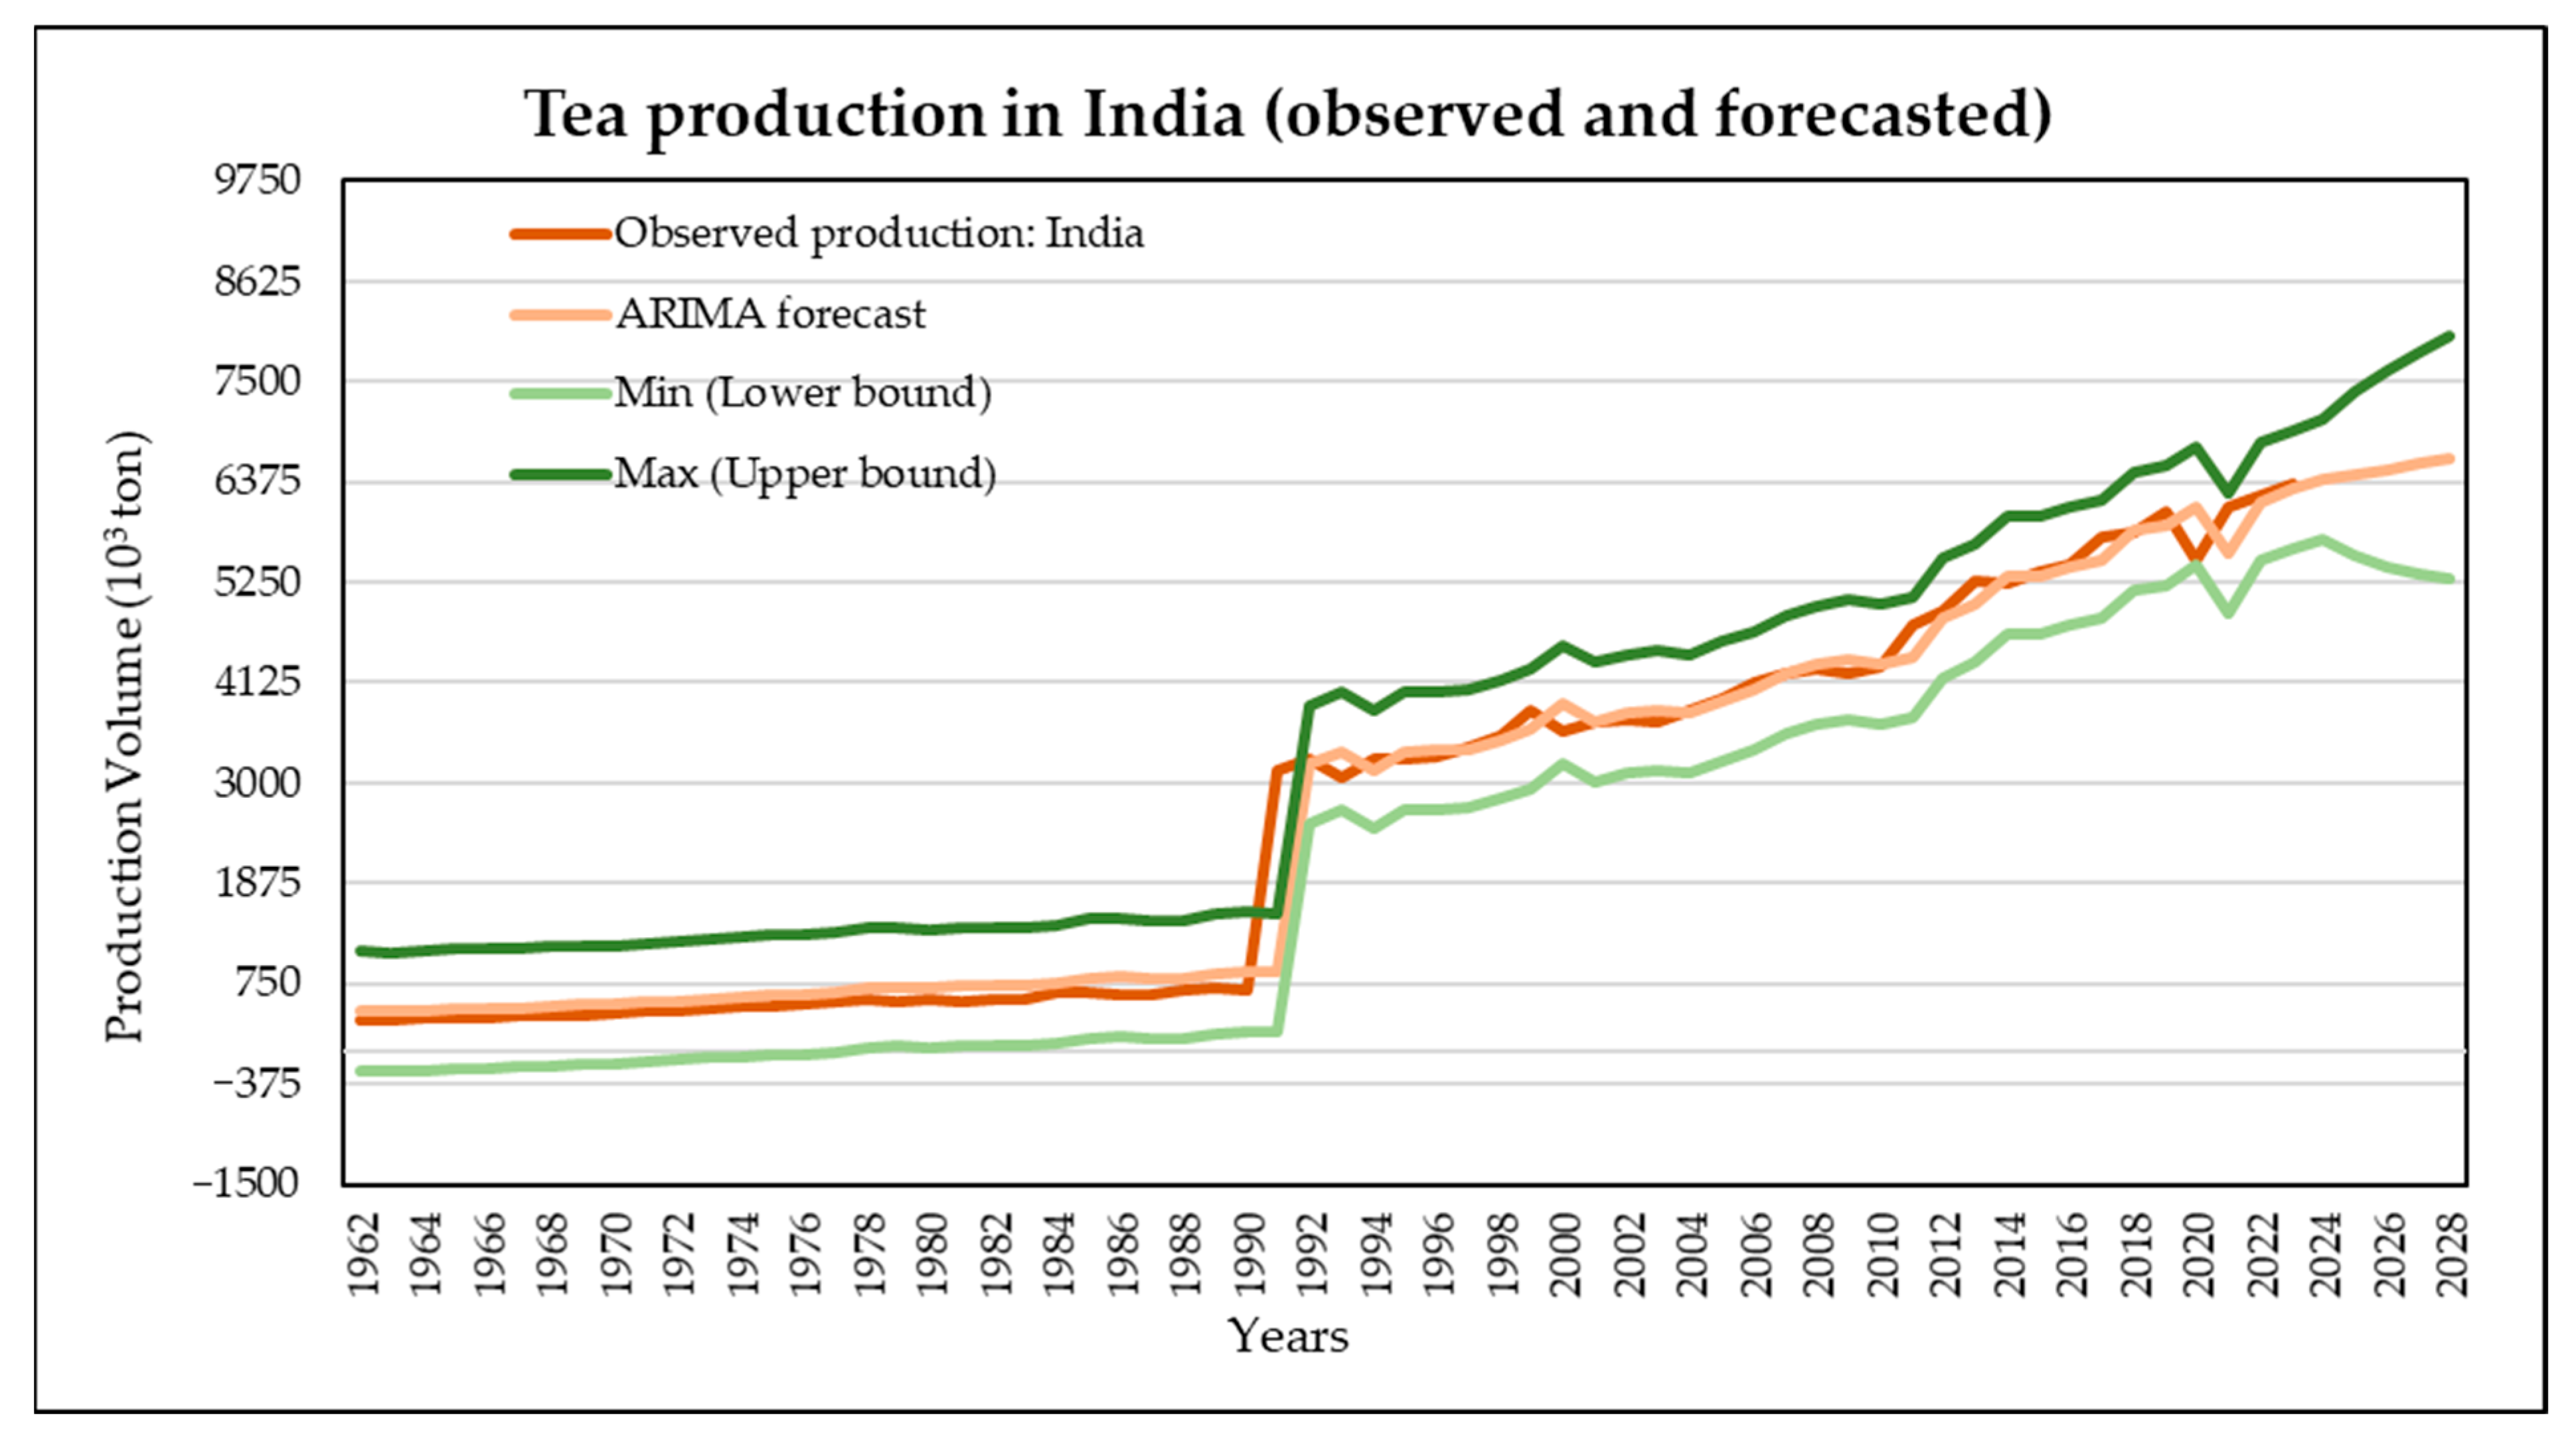
Forecasts for the period 1961–2028 are presented in
Figure 4. The model results indicate that India’s tea production exhibited a relatively stable upward trend between 1960 and 1990, followed by a marked acceleration in growth during the early 1990s. This shift reflects the influence of both domestic demand and export-oriented expansion on the country’s tea production.
The strong alignment between the ARIMA (1, 1, 1) forecast series and the historical data demonstrates the high predictive accuracy of the model. The lower and upper confidence bounds (Min–Max) indicate that future production will continue its upward trajectory, albeit with possible periodic fluctuations. According to the projections, India’s tea production is expected to range around 6.52 million tons between 2024 and 2028, suggesting that the country will maintain its strong position in the global tea market.
3.5. Forecasting Tea Production in Kenya
Consistent with the diagnostic framework applied to other major producers, Kenya’s tea production series was rendered stationary after first differencing, and the ARIMA (1, 1, 1) specification was selected based on standard information criteria and forecasting performance indicators.
The selected ARIMA (1, 1, 1) model demonstrates satisfactory goodness-of-fit and forecasting accuracy, as confirmed by low information criterion values and acceptable error metrics (
Table A1), indicating its suitability for Kenya’s tea production forecasting.
The estimated model parameters indicate that Kenya’s tea production is shaped by both long-term structural trends and short-term shocks. The significance of the AR(1) and MA(1) components suggests that both lagged production values and past error terms play an influential role in the production process. This structure implies that, although Kenya’s tea production exhibits a long-term upward trend, short-term fluctuations driven by market conditions, climate variability, and production factors also have discernible effects.
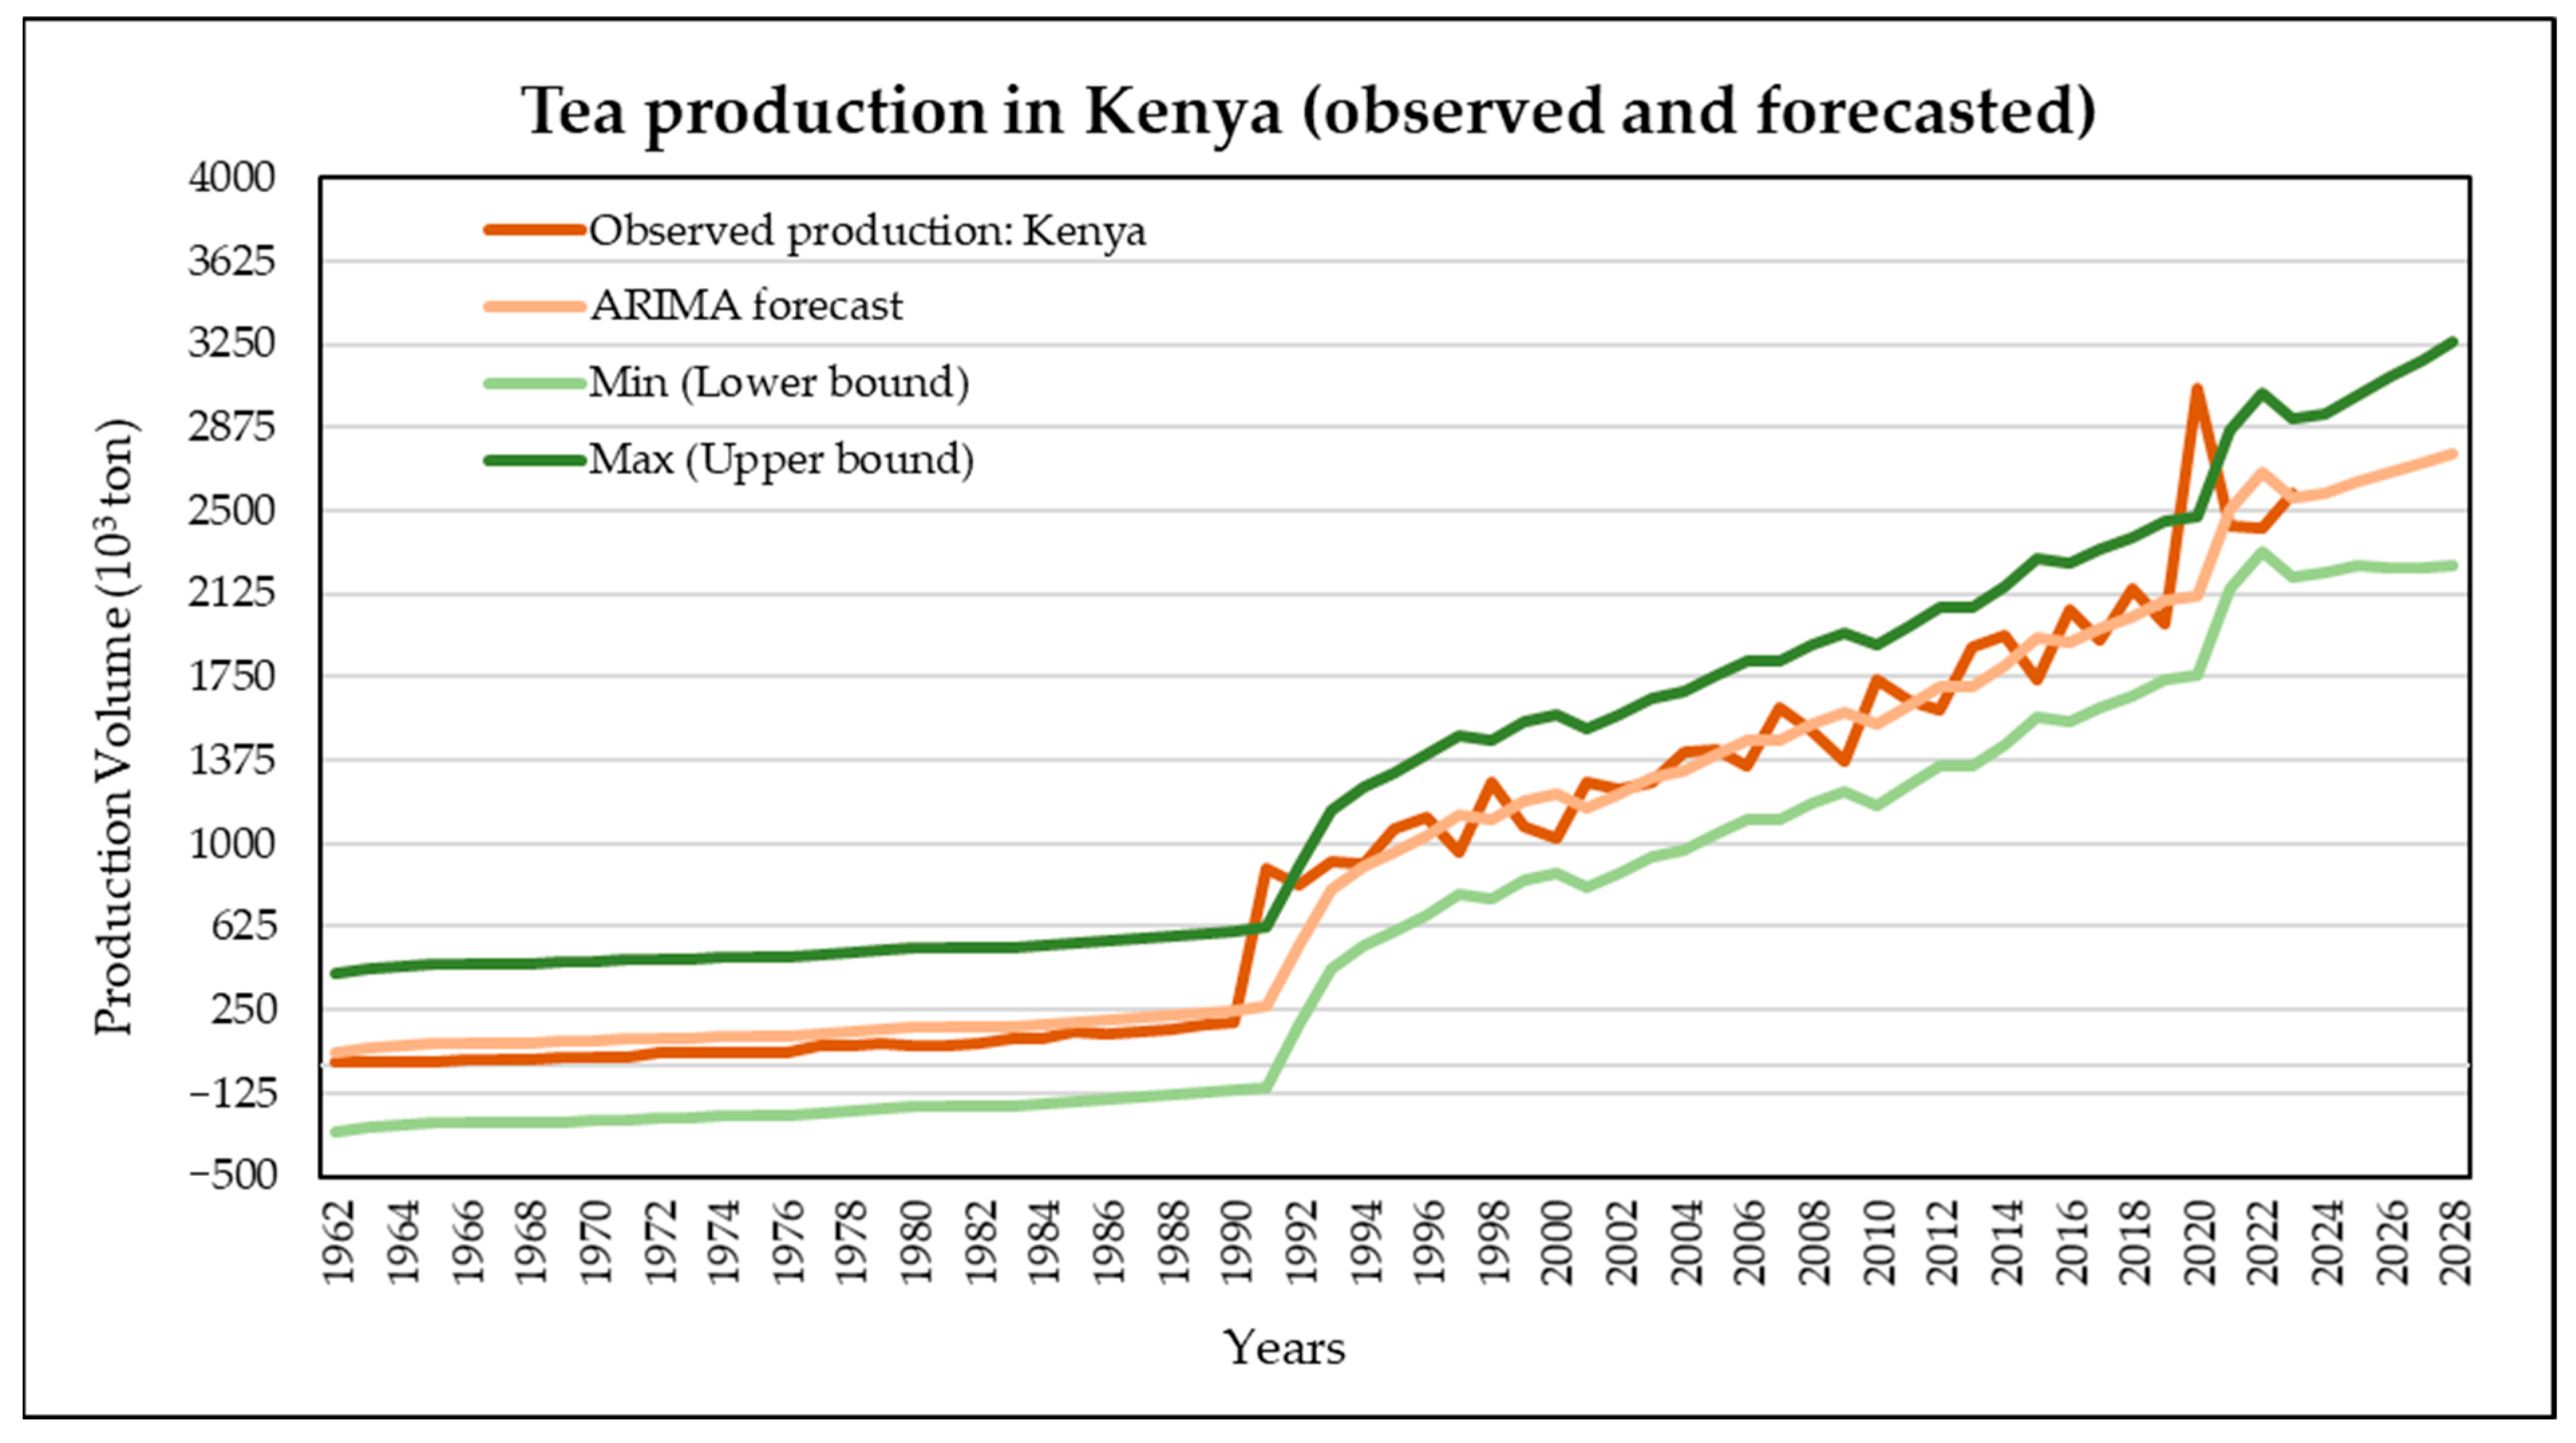
Figure 5 presents the observed data and ARIMA (1, 1, 1) forecasts for the 1961–2028 period. The graphical results reveal a moderate upward trend between 1960 and 1990, followed by a more pronounced and consistent growth momentum from the early 1990s onward. The close alignment between the forecasted and observed series confirms the strong predictive accuracy of the model. Additionally, the lower and upper confidence bounds progress in parallel with the trend line, indicating a statistically robust basis for the projected growth pattern.
According to the projections, Kenya’s tea production is expected to range around 2.62 million tons between 2024 and 2028. This finding suggests that Kenya will continue to maintain its competitive position in the global tea market. The ARIMA (1, 1, 1) model successfully captures the structural growth trend in Kenya’s tea production and provides a reliable tool for forward-looking forecasts.
3.6. Forecasting Tea Production in Sri Lanka
Consistent with the diagnostic procedure applied to other major producers, Sri Lanka’s tea production series was rendered stationary after first differencing, and the ARIMA (5, 1, 2) specification was selected based on combined information criteria and residual diagnostics.
The selected ARIMA (5, 1, 2) model demonstrates satisfactory forecasting accuracy and goodness-of-fit, as evidenced by favorable information criteria and error metrics reported in
Table A1, confirming its suitability for Sri Lanka’s tea production forecasts.
The estimated parameters reveal that Sri Lanka’s tea production dynamics are influenced by both long-term structural trends and short-term shocks. Most of the AR(1)–AR(5) parameters, along with the MA(1) and MA(2) coefficients, were found to be statistically significant. This indicates that both past production values and previous error terms have meaningful effects on subsequent production levels, reflecting the inherently complex nature of Sri Lanka’s tea production process. The estimated constant term (μ ≈ 20,295) further suggests the persistence of a positive long-term trend.
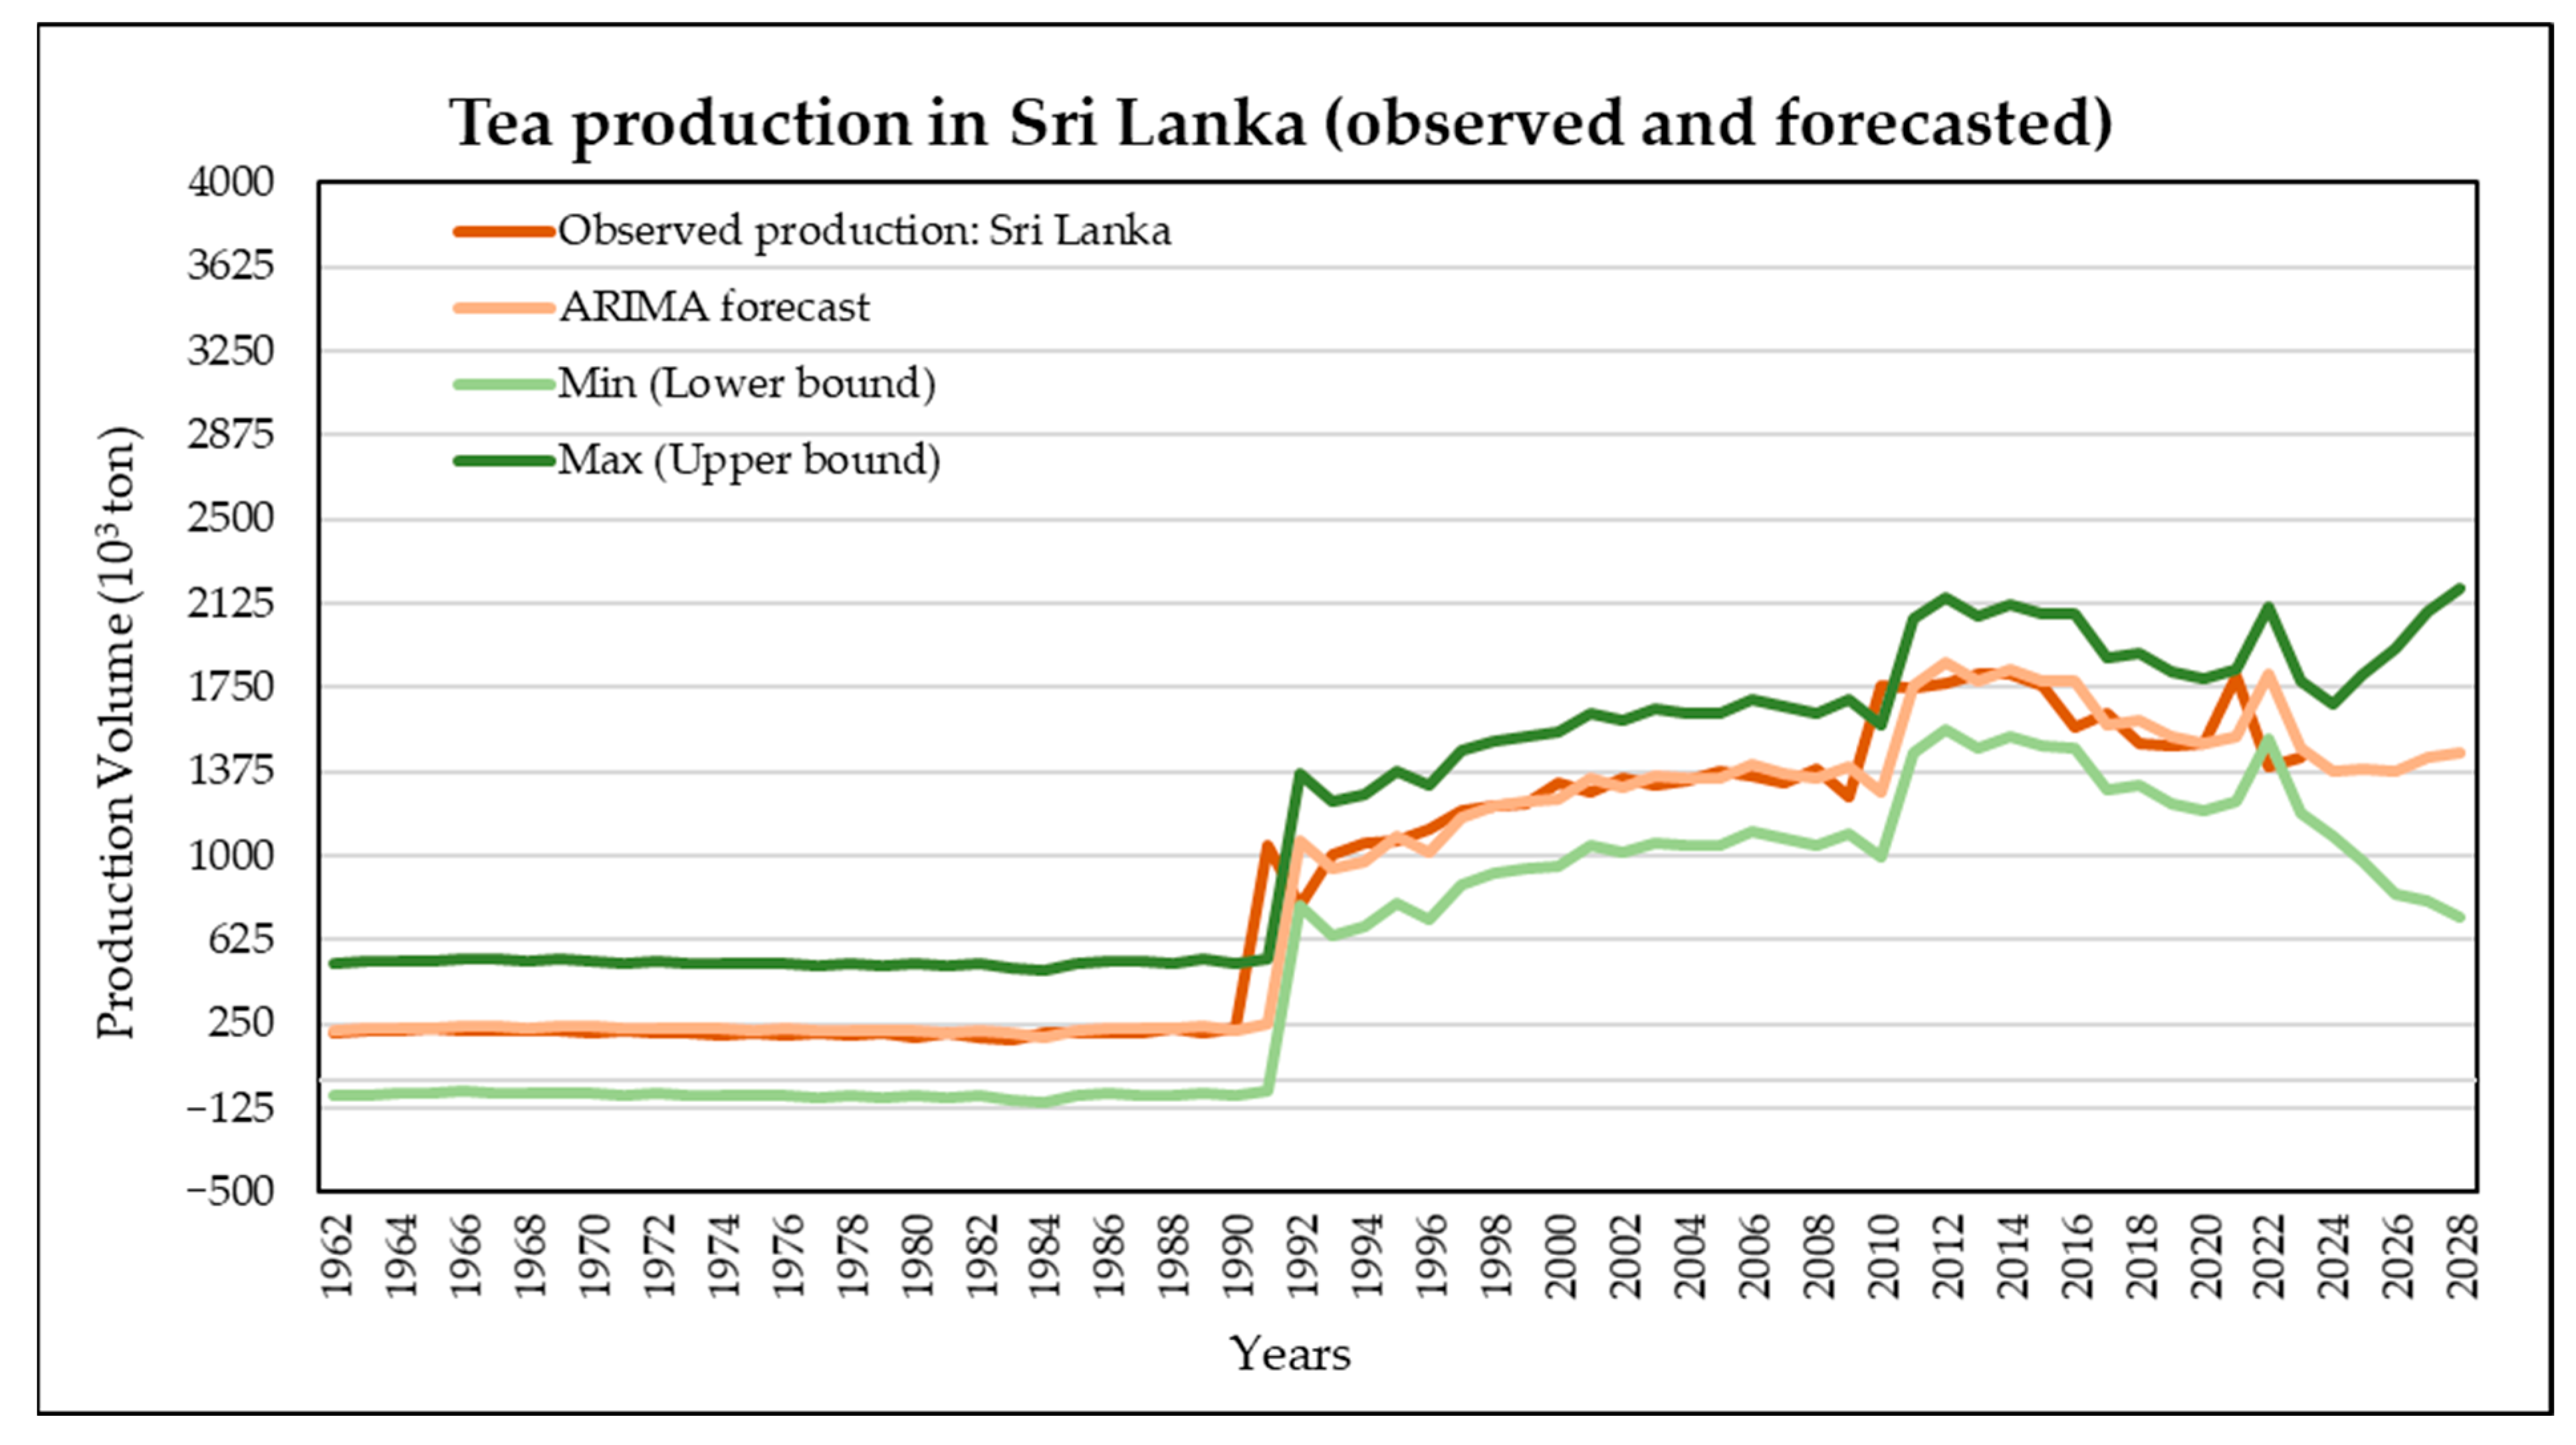
Figure 6 presents the observed tea production data along with the forecast series generated by the ARIMA (5, 1, 2) model. The graphical assessment indicates that Sri Lanka’s tea production exhibited relatively modest increases between 1960 and 1980, followed by a more pronounced upward trend from the mid-1990s onward. The close alignment between observed and forecast values demonstrates the strong predictive capability of the ARIMA (5, 1, 2) model. Furthermore, the lower and upper confidence bounds follow the general trend of the forecasts, indicating that the long-term upward trajectory of tea production is expected to continue.
According to the projections, Sri Lanka’s tea production is anticipated to range around 1.41 million tons during the 2024–2028 period. This finding suggests that Sri Lanka will maintain its position as a significant producer in the global tea market. The ARIMA (5, 1, 2) model effectively captures the structural growth trend in Sri Lanka’s tea production and provides a reliable tool for forward-looking projections.
3.7. Forecasting Tea Production in Türkiye
Consistent with the diagnostic framework applied across other major producers, Türkiye’s tea production series became stationary after first differencing, and the ARIMA (2, 1, 4) specification was selected based on information criteria and residual diagnostics as the most appropriate model for capturing its production dynamics.
The adequacy of the ARIMA (2, 1, 4) model is supported by favorable information criteria and error metrics reported in
Table A1, indicating reliable forecasting performance despite the relatively high variability characterizing Türkiye’s tea production.
The parameter structure of the selected model suggests that Türkiye’s tea production is primarily influenced by short-term adjustment mechanisms rather than strong production inertia. The statistical significance of the MA(1) component indicates that temporary shocks—such as climatic variability, market conditions, or policy-driven adjustments—tend to propagate into subsequent periods. In contrast, the comparatively weak AR(1) effect implies limited persistence of past production levels, consistent with Türkiye’s structurally constrained and regionally concentrated tea production system.
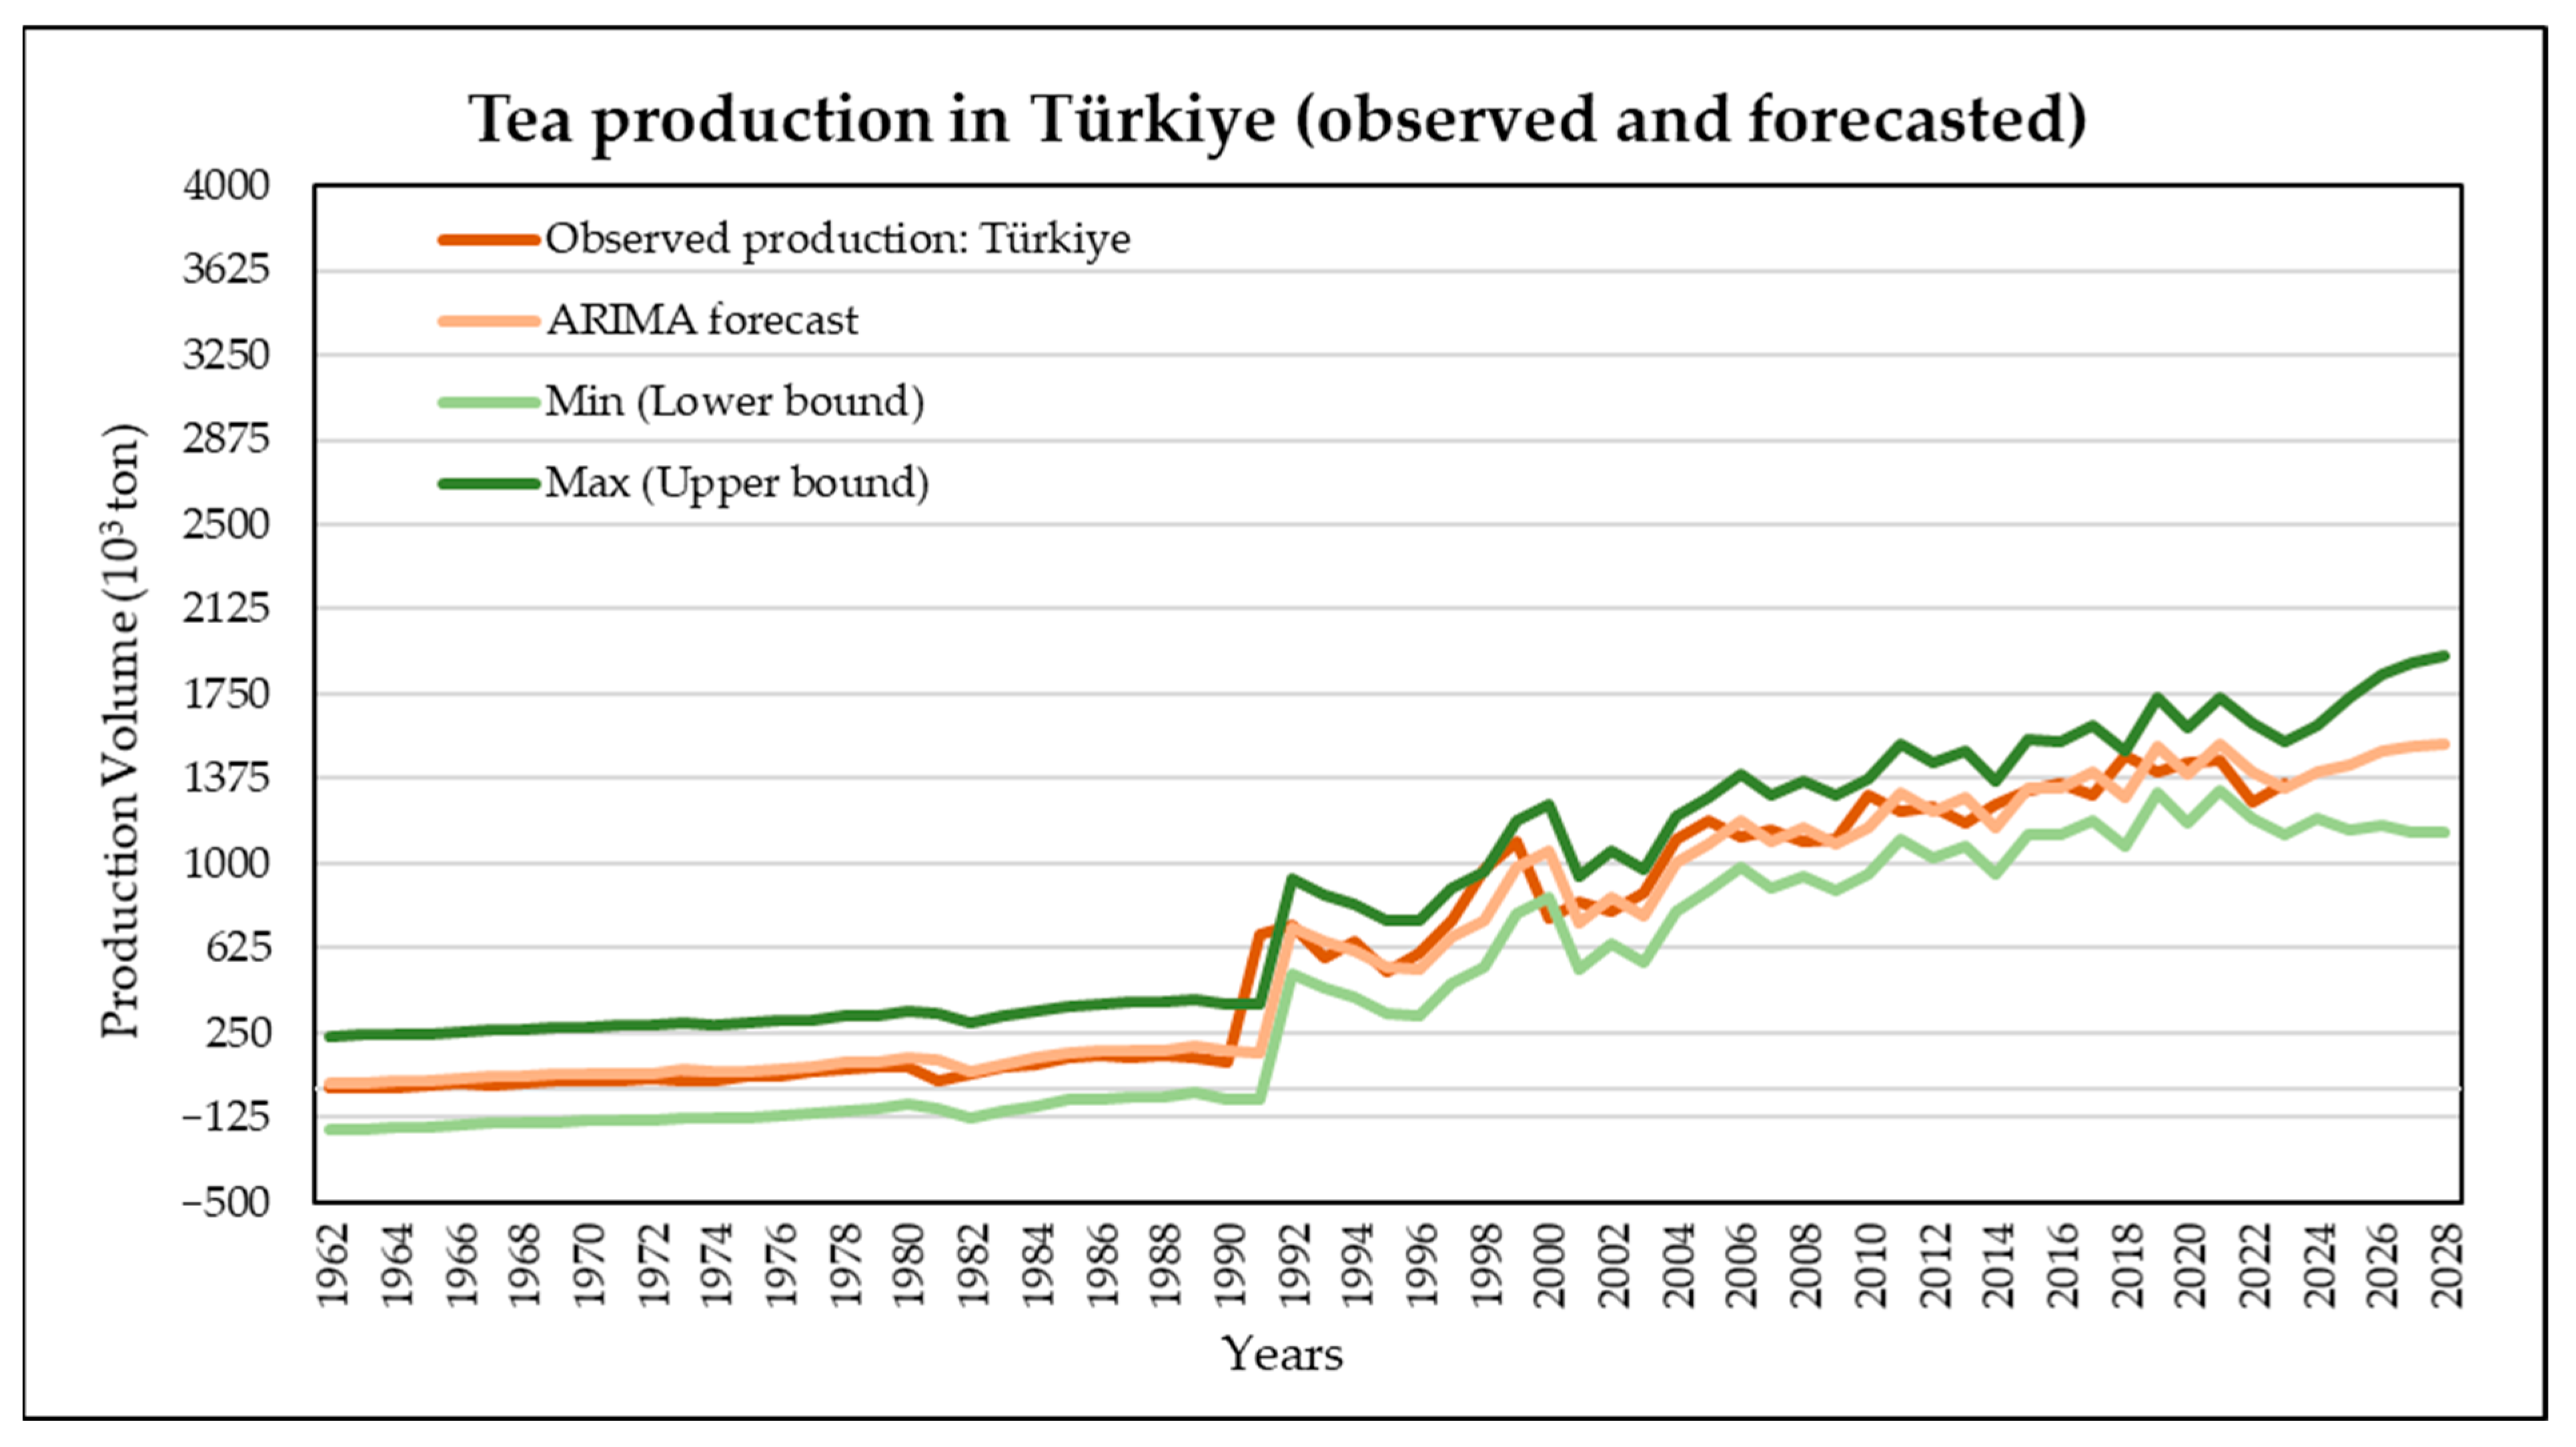
Figure 7 illustrates the long-term production trend and model-based forecasts. The graph shows that Türkiye’s tea production increased slowly yet steadily from the 1960s to the late 1980s, followed by a pronounced surge in the early 1990s. This phase corresponds to the modernization of tea processing facilities, strengthened producer cooperatives, and supportive public policies. The strong alignment between the forecast and observed series confirms the high predictive accuracy of the ARIMA (2, 1, 4) model. Moreover, the Min–Max confidence bounds follow the same upward trajectory, indicating sustained future growth.
According to the projections, Türkiye’s tea production is expected to average around 1.48 million tons during the 2024–2028 period. This indicates that Türkiye will continue to maintain its strong position in global tea production; however, the results also suggest that production levels are approaching a maturity threshold, with the pace of increase likely to moderate in the coming years. This projected moderation does not indicate a decline in production capacity, but rather reflects structural characteristics of Türkiye’s tea sector, including geographically limited cultivation areas, land-use constraints in steep terrain, and saturation effects associated with long-established production zones. Moreover, the relatively weak persistence of past production levels, as reflected by the limited AR component, suggests that long-term growth is increasingly governed by structural and institutional factors rather than by endogenous momentum. As a result, future production dynamics are expected to follow a more gradual and stabilized growth path. Overall, the ARIMA (2, 1, 4) model is evaluated as a scientifically valid and reliable tool that successfully captures the structural growth trajectory of Türkiye’s tea production.
3.8. Forecasting Tea Production in Vietnam
Consistent with the diagnostic framework applied across other major producers, Vietnam’s tea production series became stationary after first differencing, and the ARIMA (3, 1, 2) specification was selected based on information criteria and residual diagnostics as the most suitable model for capturing its production dynamics.
The adequacy of the selected ARIMA (3, 1, 2) model is supported by favorable information criteria and residual diagnostics reported in
Table A1, confirming its strong predictive performance.
The estimated parameters indicate that Vietnam’s tea production is characterized by a strong and persistent long-term upward trend, combined with a rapid short-term adjustment mechanism. The statistically significant and negative MA(1) component suggests that short-term disturbances are corrected quickly in subsequent periods, reflecting a flexible and responsive production structure. This behavior implies limited propagation of temporary shocks, consistent with Vietnam’s export-oriented and rapidly modernizing tea sector.
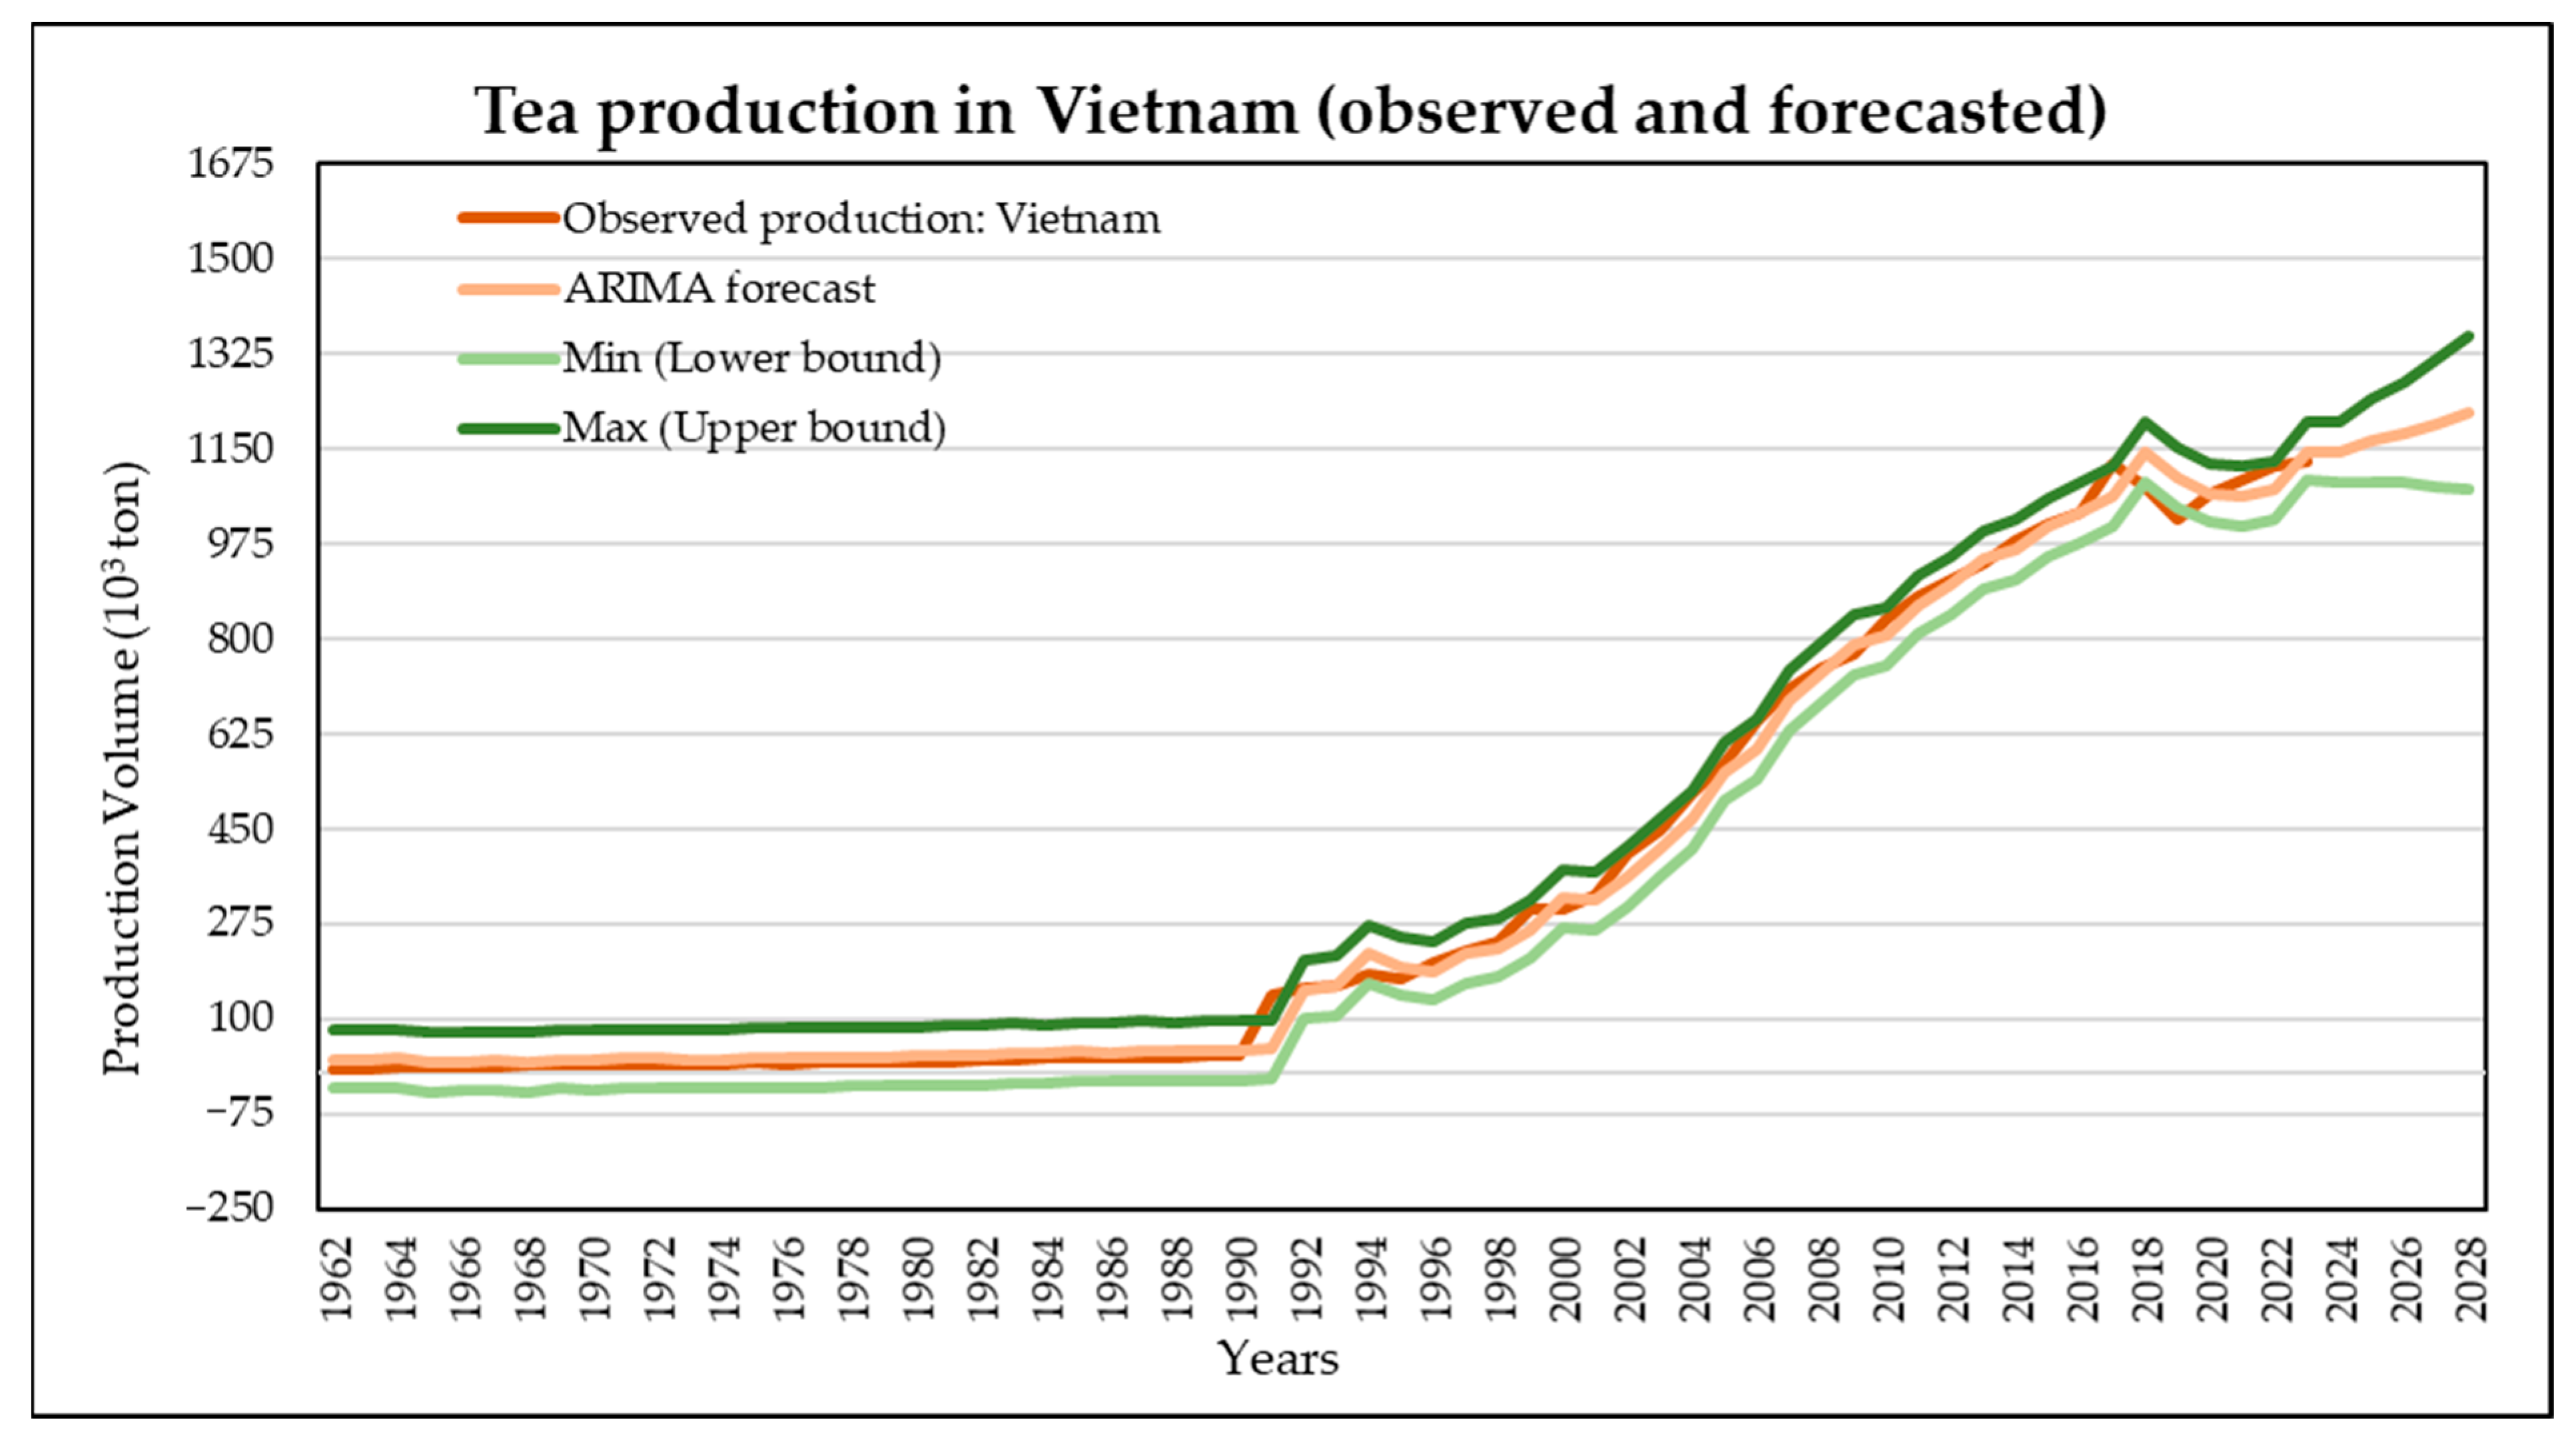
As shown in
Figure 8, Vietnam’s tea production exhibited slow yet steady growth from the 1960s to the late 1980s, followed by a marked acceleration beginning in the early 1990s. The strong alignment between the ARIMA (3, 1, 2) forecast series and the observed data demonstrates the model’s high predictive accuracy. The Min–Max confidence bounds closely follow the production trend, further indicating that this upward trajectory is expected to persist in the coming years.
According to the projections, Vietnam’s tea production is estimated to average around 1.18 million tons during the 2024–2028 period. This suggests that Vietnam is strengthening its position as an emerging tea-producing nation and may continue to expand its share in the global tea market.
3.9. Forecasting Tea Production in Other Countries
Consistent with the diagnostic approach applied to other country groups, the aggregated tea production series classified as “Other countries” became stationary after first differencing, and the ARIMA (3, 1, 1) specification was selected based on information criteria and residual diagnostics as the most suitable model.
The adequacy of the selected ARIMA (3, 1, 1) model is supported by favorable information criteria and residual diagnostics reported in
Table A1, indicating statistically reliable forecasting performance for the aggregated group.
The parameter structure indicates that tea production dynamics in the “Other countries” group are predominantly driven by long-term structural trends rather than short-term fluctuations. The statistically insignificant MA(1) component suggests that temporary disturbances tend to dissipate quickly without exerting persistent effects on subsequent production levels. This behavior is consistent with the heterogeneous composition of the group, where aggregated long-term growth dominates individual country-level short-run variability.
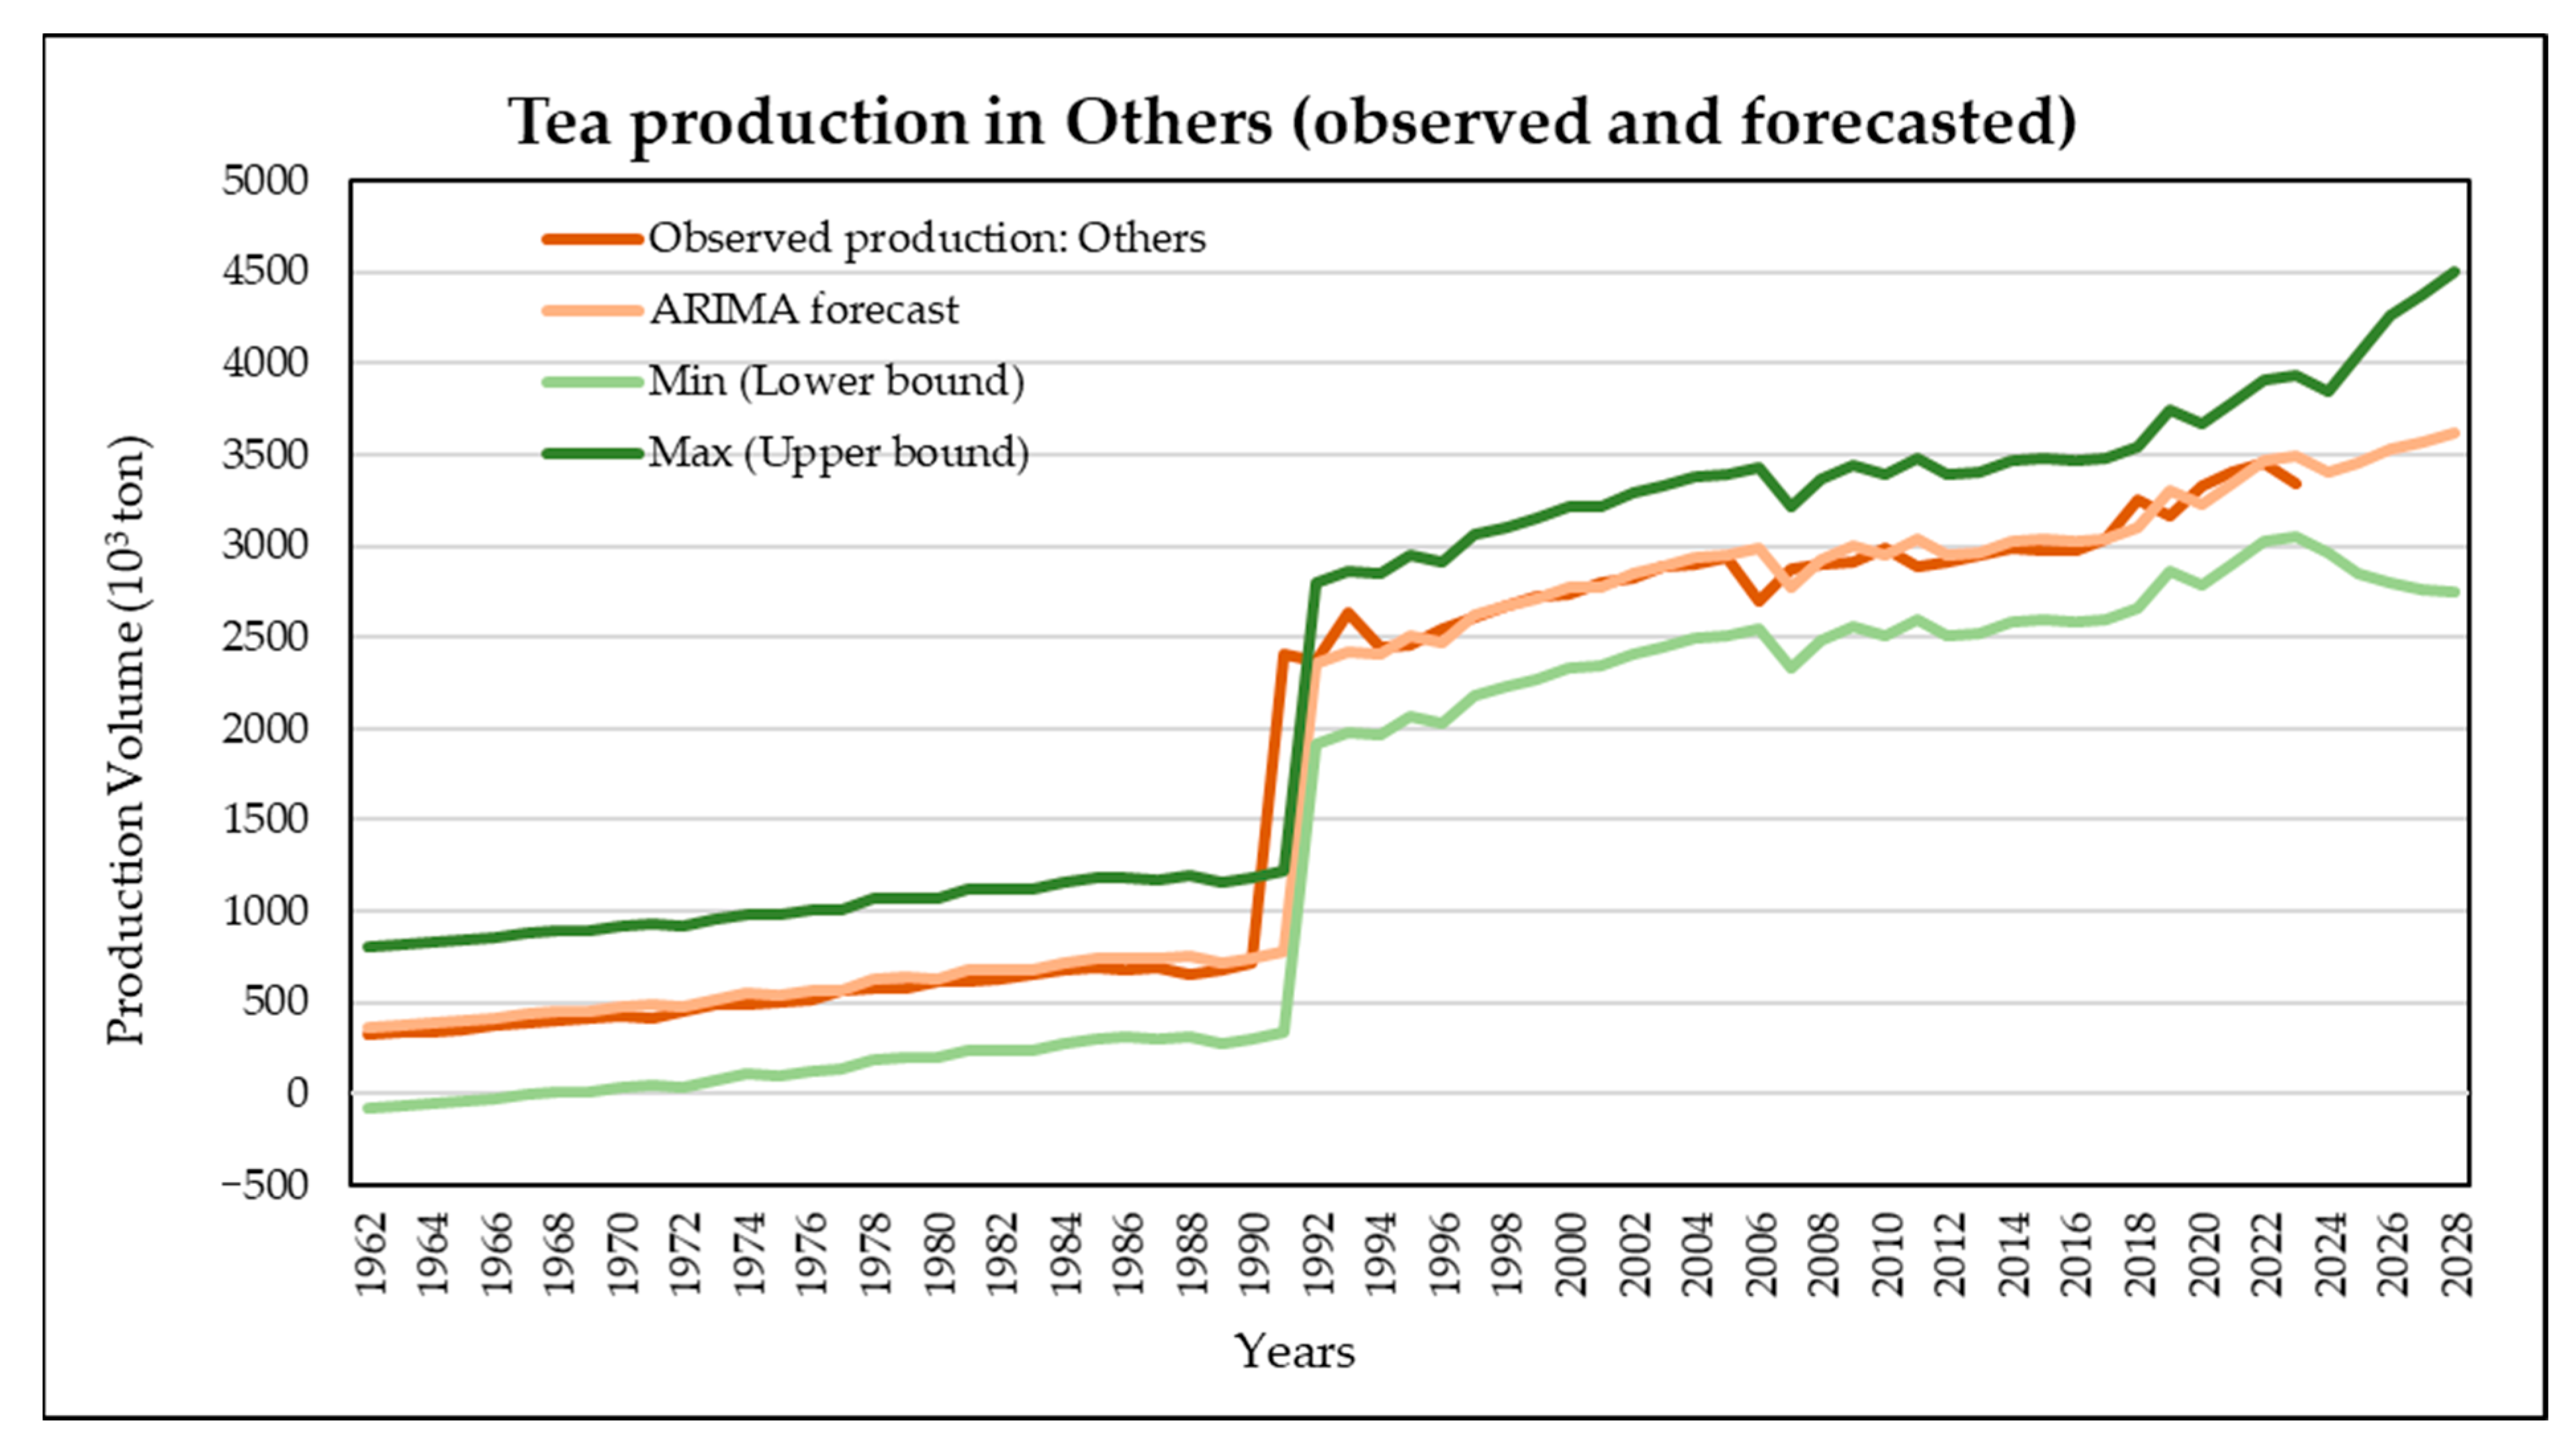
As illustrated in
Figure 9, tea production in this group remained relatively low and stable between 1960 and 1980, reflecting a nearly horizontal trend. Beginning in the early 1990s, however, production entered a period of marked acceleration, indicating substantial structural growth among these countries. The strong alignment between the forecast series and the observed values demonstrates that the ARIMA (3, 1, 1) model effectively captures the dynamics of the production series. Furthermore, the close tracking of the Min–Max confidence intervals with the production trend confirms the statistical reliability of the model’s forward-looking projections.
According to the model outputs, tea production in the “Others” group is expected to average approximately 3.52 million tons during the 2024–2028 period. This result suggests that these countries are likely to continue strengthening their cumulative contribution to global tea production, with a stable upward trend projected for the near future.
4. Discussion
4.1. Comparative Analysis of Tea Production Trends in Six Leading Countries (1961–2028)
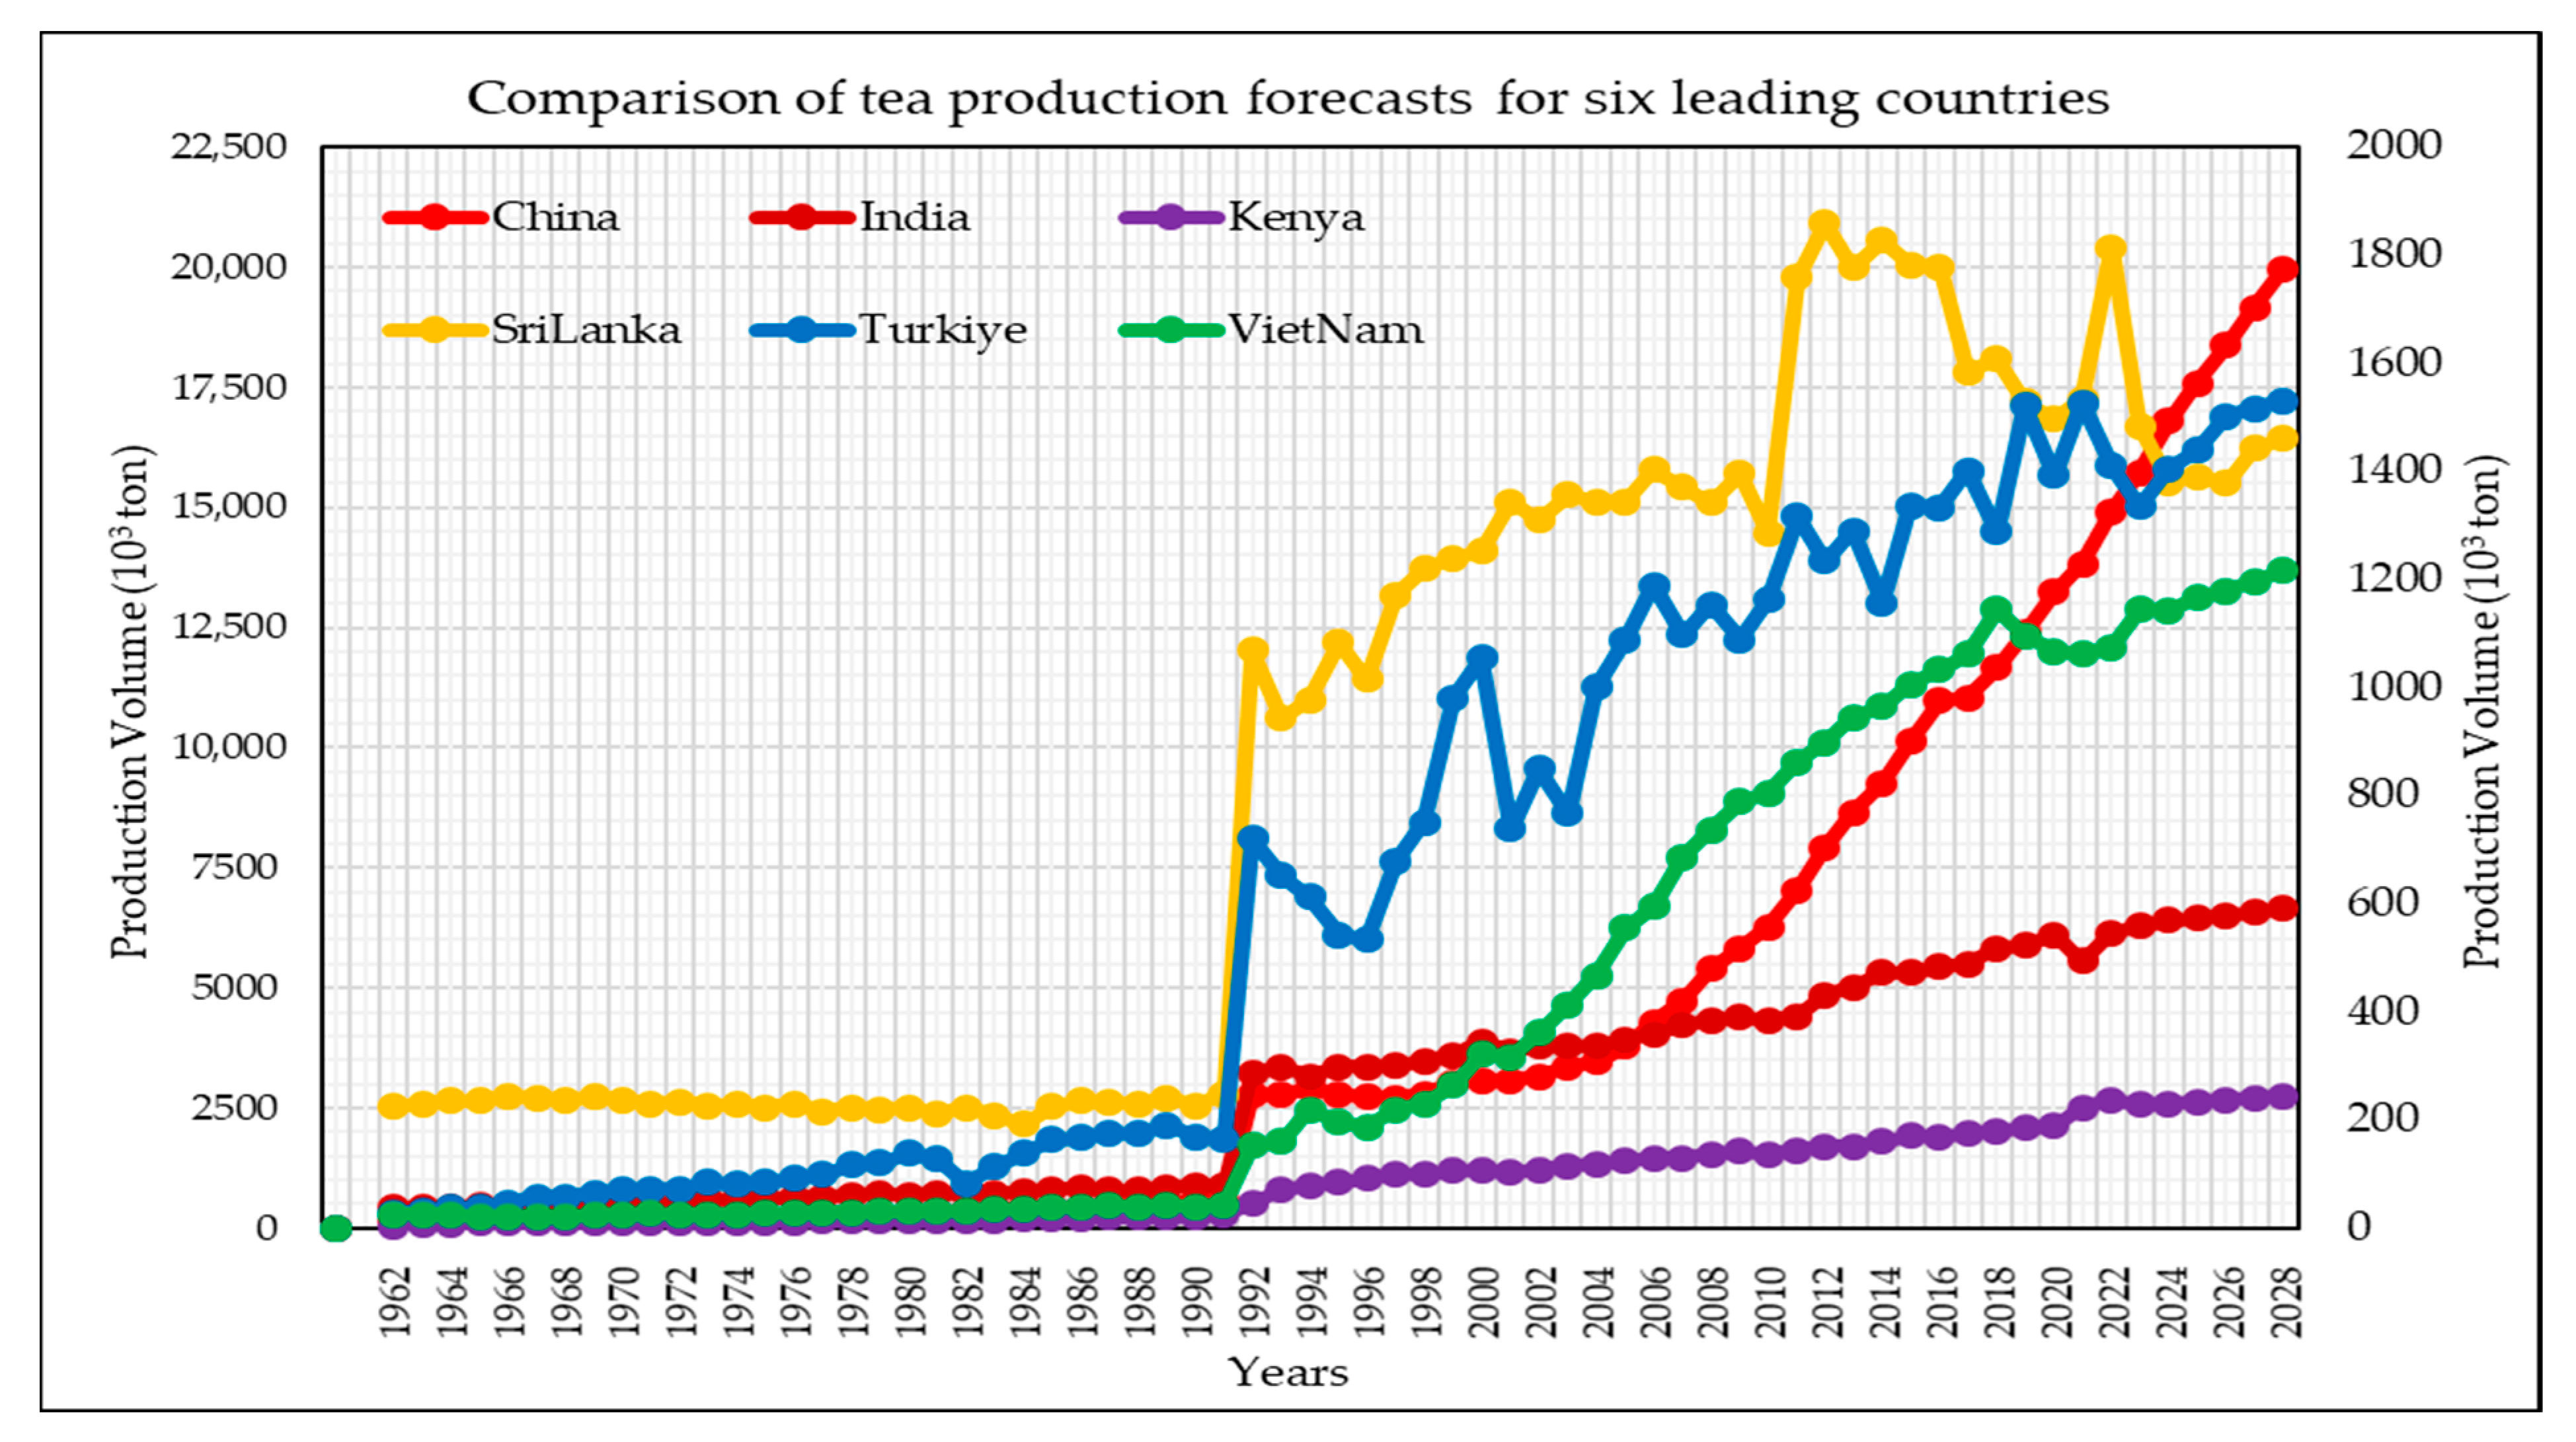
Figure 10 presents a comparative overview of historical and forecasted tea production trends for six leading producer countries between 1961 and 2028. Rather than reflecting uniform growth patterns, the results reveal distinct and diverging production trajectories, shaped by differences in structural capacity, market orientation, and long-term development strategies. To enhance comparative analysis, the forecast trends of major tea-producing countries (e.g., China, India, Kenya, Sri Lanka, Türkiye, and Vietnam) are integrated into a single comparative chart (
Figure 10). This visualization facilitates a clearer assessment of similarities and differences in long-term growth patterns across countries with markedly different production scales, thereby improving the interpretability of cross-country production dynamics.
Although all country-level production series exhibit non-stationary behavior in levels and become stationary after first-order differencing, this transformation reflects more than a technical requirement of ARIMA modeling. The differencing process enables the isolation of long-term structural production regimes and facilitates cross-country comparison by filtering out scale effects and persistent growth components, thereby allowing a clearer interpretation of relative production dynamics among leading producers.
The comparison highlights a clear asymmetry between large-scale producers and structurally constrained producers. China’s exponential growth trajectory reflects a combination of extensive land availability, large-scale modernization, and strong domestic demand, positioning it as the dominant driver of global tea supply expansion. In contrast, India follows a more stable and linear growth path, suggesting a mature production system characterized by incremental gains rather than structural acceleration.
Among export-oriented producers, Kenya and Vietnam exhibit relatively dynamic expansion patterns, although driven by different mechanisms. Kenya’s growth reflects responsiveness to export incentives and market cycles, accompanied by higher sensitivity to climatic variability, while Vietnam’s steeper upward trajectory indicates rapid structural adjustment supported by investment, technological adoption, and policy support. These contrasting patterns illustrate how export orientation alone does not determine growth magnitude, but rather interacts with institutional and technological factors.
Sri Lanka and Türkiye represent cases where production growth remains moderate despite long-standing sectoral experience. In Sri Lanka, limited arable land and a strategic focus on quality over quantity constrain volumetric expansion. Türkiye displays a more gradual but sustained increase, reflecting structural improvements within geographically limited production zones. Together, these cases underscore how physical and institutional constraints can moderate long-term growth even under favorable market conditions.
The comparative results further suggest that long-term production trajectories are increasingly shaped by structural and technological drivers, while remaining vulnerable to external shocks, particularly climatic extremes. Evidence from recent studies demonstrates that temperature anomalies can induce significant yield fluctuations, reinforcing the interpretation that ARIMA-based forecasts capture underlying trend structures but do not explicitly account for short-term climate disturbances. The presence of corrective MA components in several country-specific models is consistent with such shock-adjustment behavior.
Overall, the cross-country comparison demonstrates that future global tea supply growth is likely to be unevenly distributed, reflecting divergent production capacities and development paths among major producers. These diverging production trajectories are increasingly shaped by structural and technological factors and remain vulnerable to climate-induced shocks, as documented in the recent literature [
27]. The uneven distribution of future production growth suggests that global tea supply dynamics should be interpreted not only in volumetric terms but also in relation to market concentration and competitive restructuring.
4.2. Global Production Dynamics and Emerging Producers
Global tea production is concentrated among a limited number of producer countries, with China, India, Kenya, Sri Lanka, Türkiye, and Vietnam accounting for the majority of global output. Recent production statistics indicate that China alone represents nearly half of global tea production, while ARIMA-based projections suggest that this share may exceed 50% by 2028. These trends imply not only continued growth in global tea supply but also an increasing concentration of production capacity and market influence among leading producers [
4,
28].
The literature consistently highlights that cost structures, productivity levels, and international trade dynamics play a decisive role in shaping competitiveness within the global tea market. Empirical evidence suggests that countries such as India, Kenya, and Vietnam benefit from comparative advantages linked to scale, export orientation, and institutional support, which align closely with the upward production trajectories identified in this study. In contrast, more limited growth patterns observed in Sri Lanka reflect structural constraints related to productivity and cost competitiveness, consistent with both the ARIMA results and existing assessments of the sector [
4].
Studies focusing on emerging and export-oriented producers further support these findings. Research on India and Kenya demonstrates that tea production exhibits long-term upward trends despite sensitivity to climatic and market fluctuations, confirming the suitability of ARIMA-based approaches for medium- to long-term forecasting. Similarly, recent analyses of Vietnam emphasize the role of technological adoption and sustainable cultivation practices in supporting rapid production expansion, which corresponds to the pronounced acceleration observed in the post-1990 period in this study [
10,
13,
29,
30,
31].
Overall, the global production dynamics indicate that future growth in tea supply is likely to be driven disproportionately by a subset of rapidly expanding producers, while other countries may experience more gradual or constrained development. These emerging patterns underscore the importance of interpreting production forecasts within a broader context that considers competitiveness, trade structures, and environmental vulnerability, rather than relying solely on projected volume increases.
4.3. Structural, Climatic, and Technological Drivers of Production Differences
Cross-country differences in tea production are shaped by the combined effects of climatic conditions, technological capacity, and structural characteristics of agricultural systems. When climate-sensitive process-based model outcomes reported in [
31] are considered alongside the ARIMA projections obtained in this study, it becomes evident that long-term production trajectories largely reflect underlying climatic exposure and resource constraints. While rising CO
2 concentrations may enhance yields in some major producers, rainfall variability and water scarcity remain critical limiting factors in others, indicating that long-term growth patterns are inherently heterogeneous across regions [
31].
The ARIMA results are consistent with this differentiated climatic sensitivity. Countries exhibiting robust and sustained upward production trends also display greater structural resilience, whereas producers facing higher climatic volatility show flatter or more unstable trajectories. Although ARIMA models effectively capture short- and medium-term dynamics, existing evidence suggests that long-term projections may shift substantially under changing rainfall regimes and water availability, highlighting the importance of interpreting time-series forecasts within broader climate-scenario contexts [
31].
Short-term climatic disturbances further complicate production dynamics. Evidence indicates that extreme temperature events can induce significant yield losses, introducing asymmetric and episodic shocks that are not explicitly incorporated into ARIMA-based forecasts [
6]. Nevertheless, the presence of short-term moving-average components in several country-specific models suggests that production systems exhibit corrective responses following sudden deviations, partially mitigating the impact of transient climatic or market shocks. This behavior reinforces the interpretation that ARIMA projections primarily reflect underlying trend structures rather than short-lived extremes.
Beyond climate, technological modernization emerges as a key driver of long-term productivity. Empirical studies confirm that technological upgrading, mechanization, and improved management practices significantly enhance agricultural output, particularly in large-scale production systems [
9,
24]. The persistent upward trends captured by the ARIMA models for major producers are therefore consistent with continued technological diffusion, although such gains remain conditional on supportive climatic and institutional environments.
Production dynamics are also shaped by qualitative and management-related factors that influence market competitiveness. Evidence from the literature demonstrates that alternative production systems and management practices affect not only yield but also product quality, with implications for international positioning and value creation [
32]. Accordingly, sustained growth in production volumes may not translate into proportional gains in competitiveness unless accompanied by quality-oriented strategies and technological adaptation.
In contrast, structurally constrained producers exhibit heightened sensitivity to climatic variability. Empirical findings indicate that temperature, rainfall patterns, and short-term weather fluctuations exert strong influences on yield stability, contributing to more volatile or limited growth trajectories [
7]. The comparatively modest and fluctuating production patterns identified in the ARIMA projections for such producers are therefore consistent with the climatic vulnerability and resource limitations highlighted in the literature [
7,
31].
4.4. Country-Specific Production Insights: Turkey as a Case Study
Türkiye’s tea sector exhibits production dynamics that reflect the interaction of micro-level management practices, structural capacity, and long-term institutional development. Evidence indicates that input use, farmer experience, and maintenance practices play a decisive role in determining productivity, while inefficiencies associated with aging tea gardens and suboptimal management can constrain output [
33]. These micro-level characteristics are consistent with the ARIMA-based projections of this study, which indicate a moderate but steady increase in Türkiye’s tea production during 2024–2028, accompanied by short-term fluctuations that plausibly reflect variations in local production conditions.
At the national scale, time-series-based projections suggest that Türkiye’s production growth is driven more by yield improvements than by expansion of harvested area, implying a gradual intensification process rather than extensive growth [
11]. When evaluated within the broader multi-country framework of this study, Türkiye’s production trajectory exceeds the global average but remains below that of the largest producers, supporting the interpretation of sustained yet structurally bounded expansion. The projected rise in Türkiye’s global ranking by 2028 further indicates a capacity to preserve—and modestly strengthen—its position in the international tea market over the medium term.
Long-term production capacity in Türkiye is underpinned by durable structural foundations. Historical expansion of tea-growing areas and pronounced regional concentration, particularly in the Eastern Black Sea region, have established a stable production base characterized by entrenched institutional and infrastructural patterns [
34]. These features provide a coherent explanation for the persistent upward trend captured by the ARIMA (2, 1, 4) model and suggest that future production growth is grounded in long-standing sectoral development rather than short-lived shocks.
Beyond agricultural output, Türkiye’s tea sector also exhibits increasing socio-economic diversification. Evidence highlights the growing cultural and touristic significance of tea production, particularly in key producing regions, where tea has evolved from a purely agricultural commodity into a symbol of regional identity and economic activity [
1]. In this context, continued production growth may generate complementary benefits through tourism-related value creation, reinforcing the sector’s broader economic role.
Despite favorable production prospects, the literature emphasizes that long-term competitiveness will depend on the transition toward value-added strategies. Empirical findings suggest that Türkiye’s position in high-value global tea markets remains limited, underscoring the importance of quality-oriented production, branding, and product differentiation [
28,
35]. When considered alongside the projected increase in production volumes identified in this study, these insights point to the need for integrated national strategies that balance quantitative growth with qualitative upgrading in order to strengthen Türkiye’s international market positioning.
4.5. Methodological Reflections and Future Risk Scenarios
The forecasting outcomes obtained from the ARIMA framework are consistent with the broader methodological literature, which recognizes the capacity of time-series models to capture short- and medium-term dynamics as well as long-run growth tendencies with reasonable reliability [
13,
19,
21,
25]. Nevertheless, periods characterized by structural breaks, policy interventions, or external shocks are known to generate wider uncertainty bands and reduced forecast precision, particularly in production systems exhibiting higher volatility. This pattern is especially evident in countries such as Sri Lanka, where historical production series display greater irregularity compared to more structurally stable producers.
Methodological evidence further indicates that while ARIMA models perform effectively in describing intra- and inter-annual fluctuations, their predictive accuracy may be substantially influenced by exogenous disturbances such as climatic anomalies or institutional changes [
13]. The projections generated in this study for the 2024–2028 period reflect this duality: global tea production is expected to maintain an overall upward trajectory, yet the magnitude and stability of growth vary considerably across countries. Producers with smoother historical trends exhibit narrower forecast ranges, whereas countries characterized by abrupt shifts and irregular patterns display wider confidence intervals, signaling elevated exposure to external risks.
From a methodological perspective, the findings reaffirm the core principles of the Box–Jenkins approach, wherein future values of a time series are governed by the combined effects of past observations and stochastic error components. In line with established best practices, model identification and validation procedures relied on information criteria and diagnostic statistics to ensure robustness and internal consistency [
21,
25]. All series were first tested for stationarity, after which SCAN, ESACF, AIC, and BIC metrics were systematically applied to determine optimal ARIMA (
p, d, q) specifications for each country.
The resulting diversity in model structures across countries reflects fundamental differences in production dynamics, policy environments, and exposure to external shocks. While simpler model forms are often sufficient for relatively stable or declining production systems [
36], the more complex specifications identified in this multi-country analysis point to heightened variability and structural transformation in major tea-producing regions. In this sense, the present study extends existing single-country ARIMA applications by adopting a comparative global perspective, demonstrating how methodological rigor can reveal heterogeneous long-term risk profiles and highlighting the limitations of purely univariate forecasting approaches when confronted with climate- and policy-driven uncertainties.
While ARIMA models provide a transparent and statistically rigorous framework for long-term trend analysis, they are inherently limited in capturing nonlinear dynamics, abrupt environmental shocks, and regime changes that may characterize future production systems. More recent approaches, including seasonal extensions, multivariate models, and machine-learning-based methods, offer promising alternatives for addressing these complexities. However, the deliberate use of a unified ARIMA framework in this study prioritizes cross-country comparability and interpretability, while future research may build upon the present findings by integrating nonlinear or hybrid forecasting techniques.
4.6. General Assessment and Strategic Implications
Overall, the findings of this study demonstrate that global tea production dynamics are shaped by structurally divergent national conditions, heterogeneous climatic exposure, and varying levels of technological capacity across producer countries. The long-term trends captured by ARIMA models reveal strong and persistent growth patterns in leading producers such as China, India, Kenya, and Türkiye, where production expansion is primarily driven by structural modernization, improvements in cultivation and processing capacity, and sustained domestic or export-oriented demand. In contrast, Vietnam and the broader group of emerging producers exhibit a more dynamic and capacity-expansion-oriented growth trajectory, reflecting rapid agricultural transformation and increasing integration into global markets. Sri Lanka’s comparatively flat and volatile production profile, on the other hand, is consistent with documented climatic vulnerability and structural efficiency constraints, underscoring the challenges faced by producers with limited adaptive flexibility.
Taken together, these results indicate that future assessments of global tea supply should extend beyond extrapolations of historical production trends and explicitly account for countries’ climate-adaptation capacity, technological upgrading potential, and long-term policy orientation. The comparative evidence presented in this study suggests that sustainability in tea production will increasingly depend on how effectively national systems manage climate-induced risks while simultaneously enhancing productivity and resilience. From a strategic perspective, this implies that uniform policy approaches are unlikely to be effective. Instead, differentiated national strategies—tailored to country-specific risk–opportunity profiles—are required to support resilient, competitive, and technologically adaptive tea production systems in an increasingly uncertain global environment.
From an operational perspective, the findings suggest several strategic directions for stakeholders across the tea value chain. Governments in major producing countries should prioritize climate adaptation policies, including investment in resilient cultivars, improved water management, and early-warning systems for extreme weather events. For producers, targeted technological upgrading—such as mechanization, precision agriculture, and improved processing efficiency—appears critical for sustaining productivity under increasing climatic uncertainty. At the value-chain level, diversification strategies encompassing product differentiation, quality upgrading, and branding can mitigate risk exposure while enhancing competitiveness in global markets. Together, these strategic lines underscore that future growth in tea production will depend not only on expanding output but also on strengthening adaptive capacity, technological resilience, and market-oriented innovation.
5. Conclusions
This study analyzed the annual tea production series of seven major producer groups—China, India, Kenya, Sri Lanka, Vietnam, Türkiye, and the “Other Countries” group—for the period 1961–2023 and identified the most suitable ARIMA models for each country. The results indicate that all production series are non-stationary at the level of production and become stationary after first differencing, implying that global tea production is characterized by structural upward trends driven by persistent long-term dynamics rather than short-term fluctuations.
Model selection criteria (AIC, BIC, RMSE, MAE) show that the fitted ARIMA structures successfully capture the production behaviors specific to each country. China and India exhibit strong trend components and stable, long-term growth trajectories. Kenya and Sri Lanka maintain increasing production levels but display more pronounced short-run volatility, consistent with their climate-sensitive and structurally constrained production environments. The selected models for Türkiye (ARIMA (2, 1, 4)) and Vietnam (ARIMA (3, 1, 2)) reflect both sustained long-term growth and notable short-term adjustment mechanisms, indicating structured yet differentiated expansion paths. For the Other Countries group, findings point to a moderate growth pattern primarily supported by periodic capacity increases.
This study’s approach relies solely on historical production values, without incorporating exogenous drivers such as climatic conditions, input costs, labor availability, productivity indicators, land-use characteristics, or policy interventions. Consequently, the reported trends reflect the internal statistical dynamics of production series rather than causal effects. Although the literature highlights the critical role of climate variability, yield efficiency, cost structures, and institutional factors in shaping tea production, this research focuses on revealing comparative temporal patterns across countries, not on modeling these causal mechanisms.
Overall findings suggest that global tea production is likely to continue its upward trajectory; however, the pace and stability of growth will differ across countries depending on structural capacities, technological readiness, and sectoral strategies. While long-term trend components remain strong in all major producers, the magnitude and persistence of short-term shocks vary substantially, underscoring the heterogeneous and evolving nature of global tea supply.
Future studies may benefit from integrating climate variables, cost dynamics, labor market indicators, or policy frameworks into ARDL, VECM, ARIMAX, or machine learning-based models. Additionally, analyzing micro-level producer behavior using regional or farm-level datasets may provide deeper insight into the drivers of production variability and support more comprehensive policy recommendations.
From a practical and policy-oriented perspective, the findings underscore the necessity of differentiated strategies tailored to country-specific production structures and risk profiles. Policymakers in major tea-producing countries should prioritize climate adaptation measures, including resilient production systems, improved water management, and early-response mechanisms to mitigate climate-induced shocks. At the sectoral level, targeted technological investment and productivity-enhancing practices are essential to sustain long-term growth under increasing environmental uncertainty. Furthermore, value-chain strategies emphasizing product diversification, quality upgrading, and market-oriented innovation can enhance competitiveness while reducing vulnerability to external shocks. Looking ahead, future research may benefit from integrating exogenous variables—such as climatic indicators, cost dynamics, and institutional factors—into multivariate or hybrid modeling frameworks, thereby supporting more comprehensive scenario-based assessments and evidence-informed decision-making.