Article

Socioecological Evaluation of the Complexity of Wildlife Management Systems: A Case Study of Mexican Socioecosystems

by
Carolina Álvarez-Peredo
1,*,
Armando Contreras-Hernández
1,
Elí A. Saucedo-Castillo
2,
Luis M. García-Feria
3,
Rosario Landgrave
4,
Sonia Gallina
2,
Alejandro Ortega-Argueta
5 and
Luciana Porter-Bolland
1
1
Red de Ambiente y Sustentabilidad, Instituto de Ecología A.C., Carretera Antigua a Coatepec 351, El Haya, Xalapa 91073, VER, Mexico
2
Red de Biología y Conservación de Vertebrados, Instituto de Ecología A.C., Carretera Antigua a Coatepec 351, El Haya, Xalapa 91073, VER, Mexico
3
Conservación y Manejo de Fauna–Enlace Durango, Secretaría Técnica, Instituto de Ecología A.C., Carretera Antigua a Coatepec 351, El Haya, Xalapa 91073, VER, Mexico
4
Red de Ecología Funcional, Instituto de Ecología A.C., Carretera Antigua a Coatepec 351, El Haya, Xalapa 91073, VER, Mexico
5
Departamento de Conservación de la Biodiversidad, El Colegio de la Frontera Sur, Unidad San Cristóbal, Carretera Panamericana y Periférico sur s/n, Barrio de María Auxiliadora, San Cristóbal de las Casas 29290, CH, Mexico
*
Author to whom correspondence should be addressed.
Sustainability 2026, 18(19), 9852; https://doi.org/10.3390/su18199852
Submission received: 21 May 2026 / Revised: 15 August 2026 / Accepted: 7 September 2026 / Published: 26 September 2026

Abstract

The sustainable use of wildlife and rural socioeconomic development have been crucial factors in, and subjects of public policy in many countries. This paper describes the case of a public policy in Mexico aimed at conserving biodiversity through sustainable use and management and thereby contributing to rural socioeconomic development. UMAs (Units of Management for the Conservation and Sustainable Use of Wildlife) are the central instrument of this public policy. Although these socioecosystems are complex systems that work as integral and adaptive socioecological systems to administer wildlife populations and their habitats, they are usually not considered this way. We propose the evaluation of UMAs in the State of Veracruz, Mexico, as complex systems, using the Socioecosystemic Dynamics Index (SDI), which is composed of the following: (1) the partial ecological index, which includes the ecological dimension, and (2) the partial management index, which includes the social, economic, cultural and management dimensions. The evaluation of nine free-living UMAs showed three main scenarios for the development of adaptive management strategies, showing how the mechanisms of regulation, such as the diversity of critical wildlife species (i.e., mesocarnivores) and the proportions of natural ecosystems, as well as disturbance factors, such as landscape matrix, urbanization, and human population density, influence significantly the auto-organization processes and the antifragility of free-living modality UMAs. The SDI can be a relevant and comprehensive methodological tool for evaluating public policy instruments for the adaptive management of wildlife and socioeconomic development in the context of complex socioecosystems. Its estimations allow for the identification of trajectories within system dynamics and leverage points in each socioecosystemic scenario; in this case, it showed the influence of social actors; management interventions and management plans and objectives; economic performance; and the cultural background of each socio-ecosystem as socio-management key attributes giving direction to the socioecosystems’ dynamics.

1. Introduction

In the face of rising numbers and impacts of socioenvironmental conflicts, governments, non-governmental organizations, businesses, and academic institutions have invested efforts in reconciling multidimensional economic, social, cultural, and environmental objectives, under the discourse of sustainable development [1,2,3,4,5]. However, this approach has ignored socioenvironmental complexity and the disciplinary limitations of academia and the public and private sectors, factors that can make it impossible to offer effective solutions to the crisis of biodiversity and socioeconomic marginalization [6].
Evaluation of the ecological interactions and resource use in an ecosystem can aid in identifying key factors regarding the structures of ecological communities [7,8], as well as the functions of organisms within ecological dynamics, which is fundamental for wildlife and habitat management. The diversity, heterogeneity, and complexity of ecological processes and interactions confer certain advantages relevant to the integrity and resilience of complex systems. A complex system is understood as a set of mutually dependent and interdefinable subsystems with sufficiently strong interactions, where undergoing changes occur at a speed comparable to the observer’s timescale; it transcends the mere sum of its constituent elements, representing instead a living network of interactions [9,10,11]. Considering that living systems must acquire information about their surroundings to respond and adapt to change, a complex ecosystem’s structure is key to its “antifragility” [9,10,11]. Antifragility denotes not only the ability of living systems to react to the environment’s variability by the means of natural selection, but also built-in characteristics that enable them to discover surrounding variations and cope with adversity, variability and uncertainty [11]. In the face of these scenarios, an interdisciplinary approach like the holistic approach of the “socioecosystem” has been necessary in research and evaluation in order to overcome the limitations of disciplinary analyses and allow institutional changes that facilitate adaptive management [2,3].
Ecosystems should be holistically analyzed using a complex-systems approach to determine their capacity for adaptation, resilience, and antifragility in the face of change [9,11,12,13,14,15]. One premise of this approach is the attempt to try to understand human society as a regulating factor in the functioning of ecosystems, given the close relationships between the properties of the ecosystems (resistance, resilience, stability, and antifragility) and the needs of human society (food, health, and well-being) [1,5,11,16].
In conceptualizing the socioecosystemic approach, most wildlife management and conservation instruments can be evaluated as integral and adaptive socioecological complex systems utilized for the management of wildlife and its habitats [5]. Since all managed ecosystems are complex systems, even those intended for wildlife conservation, their internal interactions occur at multiple levels and hierarchies that interact with external interactions and are ultimately influenced by anthropogenic and ecological factors [9,15,17].
In an ideal model of sustainability, the structures and functioning of the human component should aspire neither to damage nor to improve those of the natural component [3,4,5,18]. However, the intensity of human influence on the ecosystems can reduce the complexity of the latter by altering the spatial heterogeneity and natural patterns of effective flows of materials and energy that serve to maintain local biodiversity [11,19]. This reflects the need to consider the intensity of management as an active variable of the dynamics of socioecosystems and, therefore, as an indicator for their evaluation. Recognition of the ecological benefits and estimated biodiversity alone is insufficient to evaluate and direct management and conservation strategies under an integral and multidisciplinary vision [4]. Knowledge obtained through interviews with landowners, technicians, and caretakers regarding management decisions allows for the integration of information related to the socioecological system [16]. This approach enables the evaluation of the socioecosystemic dynamics of these systems.
The objective of this study was therefore to conduct a socioecological evaluation of a wildlife management and conservation instrument, namely, the Units of Management for the Conservation and Sustainable Use of Wildlife (UMA, by its Spanish acronym) [20] in Mexico, by providing a proposal for an analytical tool aiming to facilitate the identification of key elements driving the socioecosystemic dynamics within the UMAs, and leverage certain points to design pertinent adaptive management strategies. This conservation scheme integrates strategies in two modalities, free-living (in situ conservation; comprising wildlife species in the wild, without movement restraints, and within big areas, from hundreds to thousands of hectares) and intensive (ex situ conservation; comprising small properties with species maintained in captivity) wildlife management. Particularly, free-living UMAs (UMAs-fl) constitute an instrument with which the development of adaptive management strategies is possible through the evaluation of socioecosystemic dynamics and the identification of possible base scenarios. The practical application of this kind of evaluation by means of an analytical multidimensional tool has two scales: (1) local, directed to self-management aimed at identifying leverage points and guiding adaptive management strategies, and (2) national, directed towards the evaluation of a public policy by providing a standardized analytical and comprehensive tool potentially replicable and adapting to regional contexts.

2. Materials and Methods

2.1. Study Area

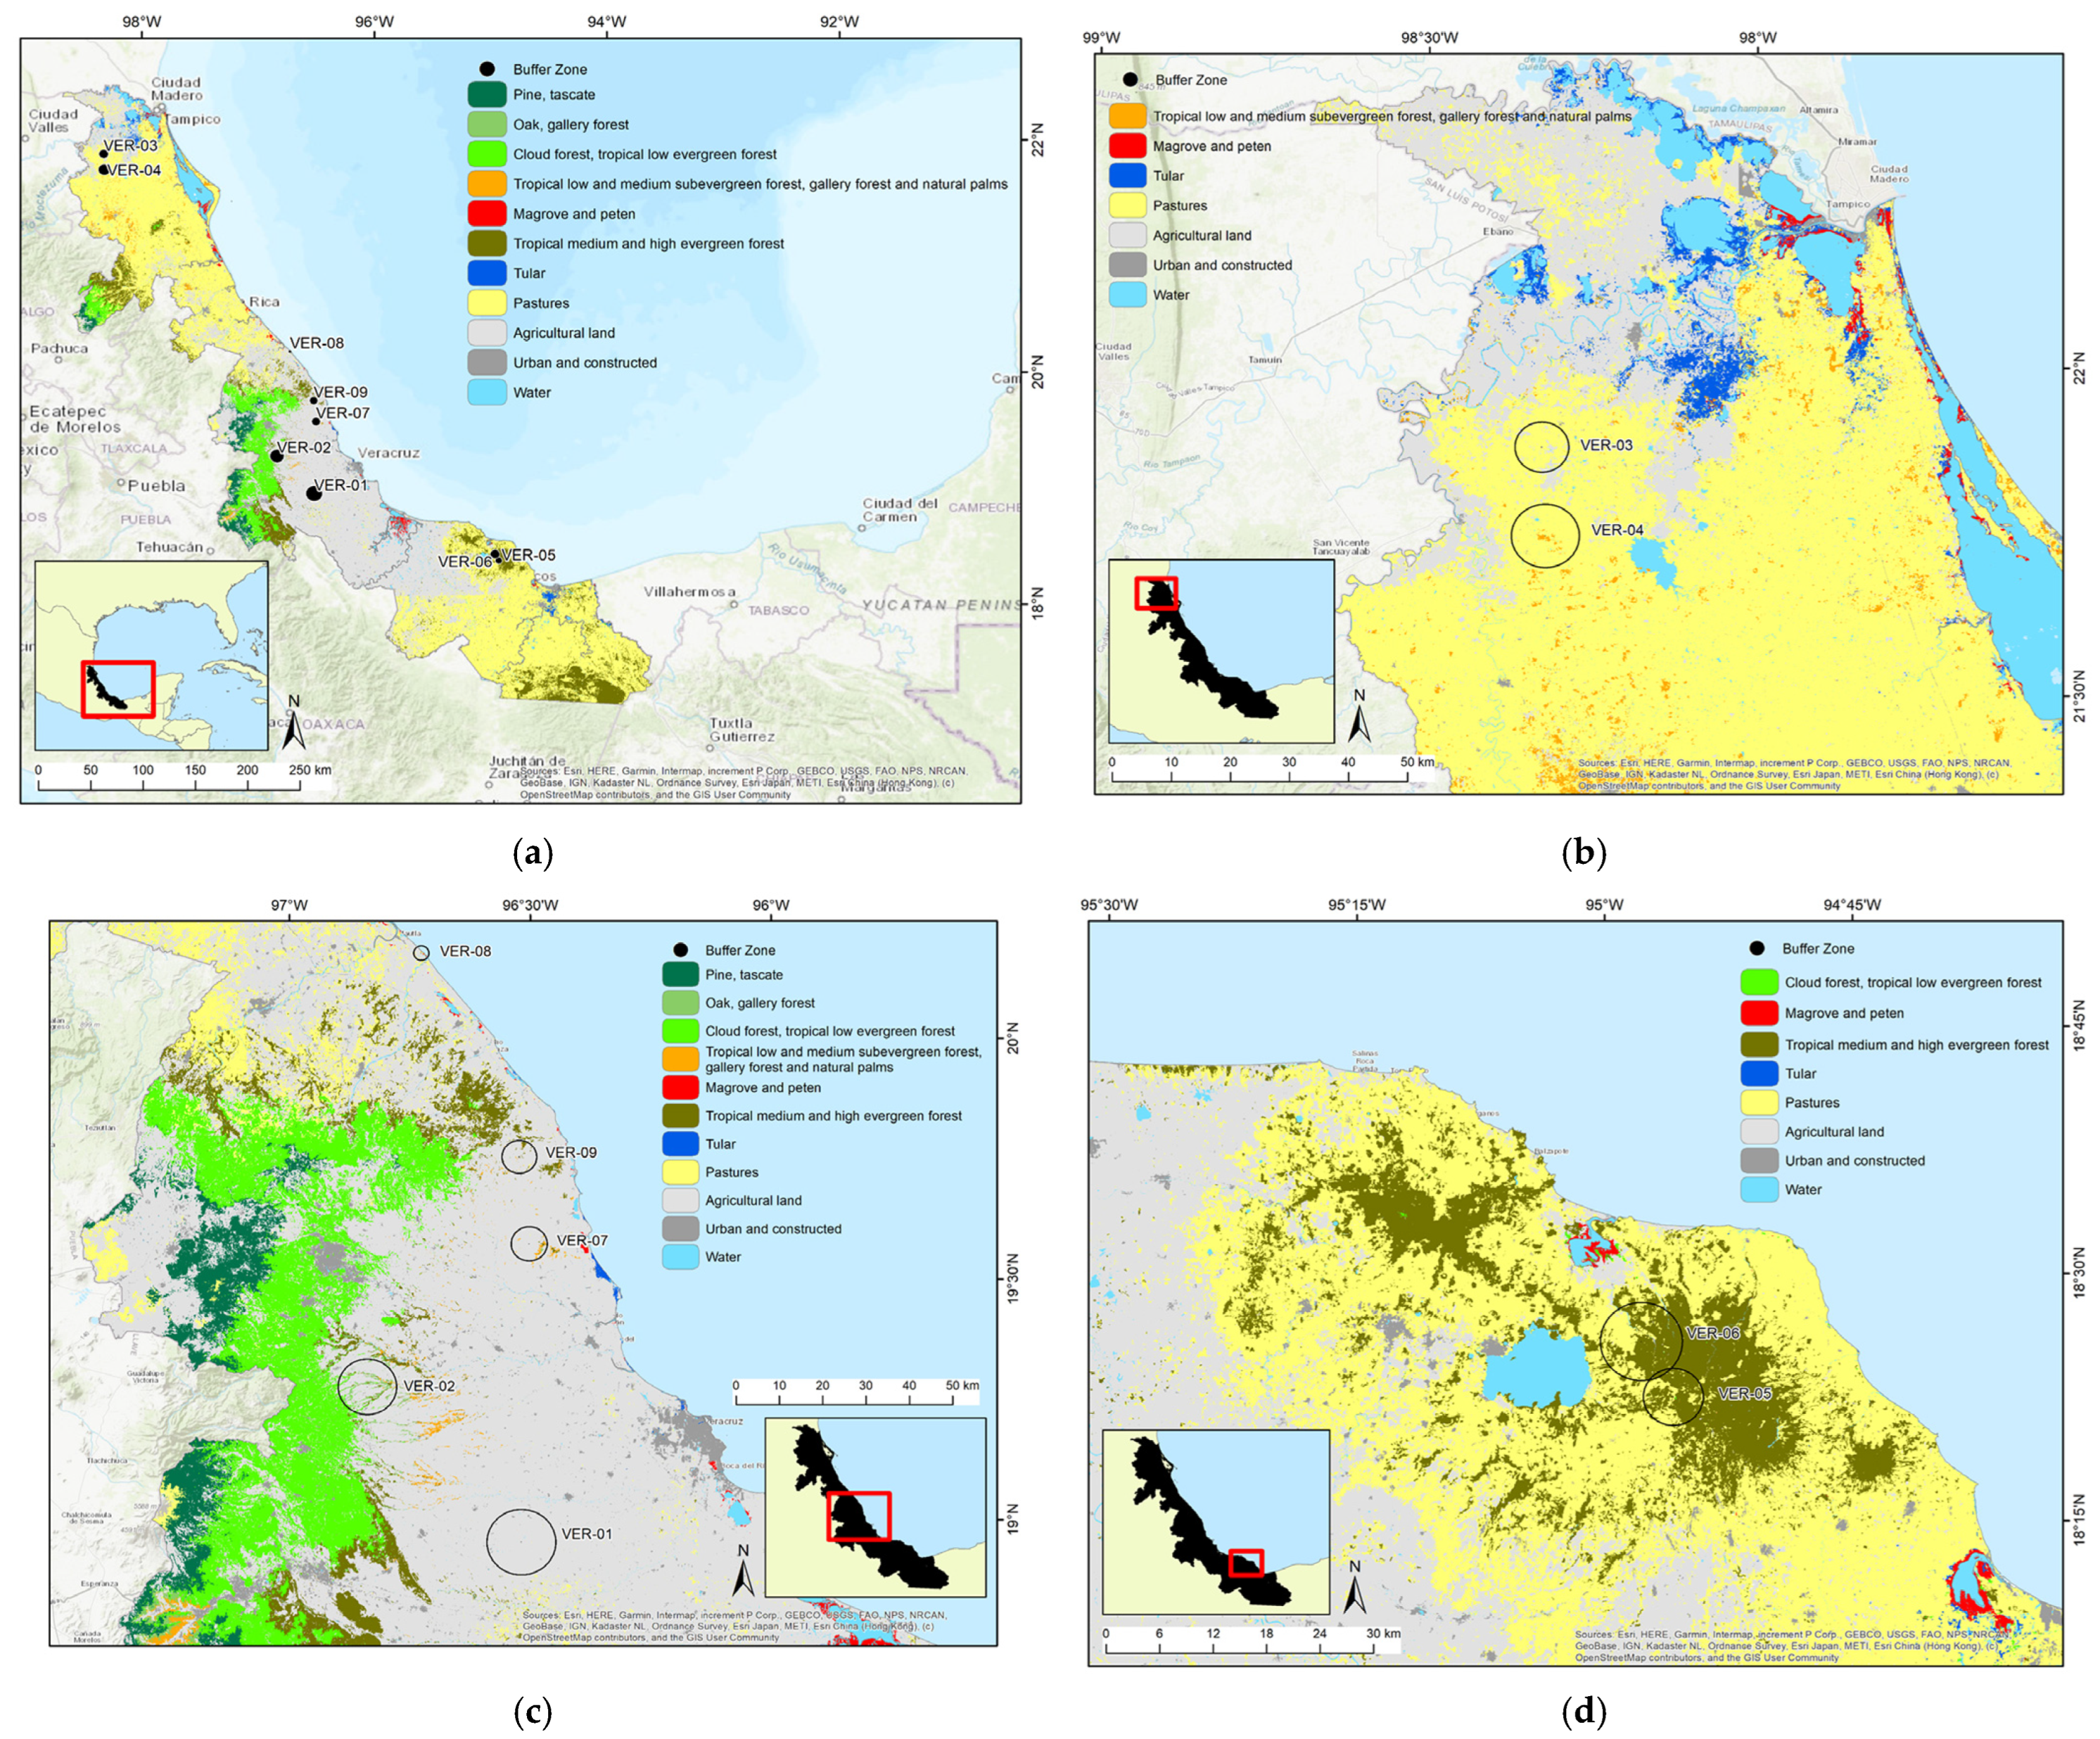
To develop the SDI, we relied on nine UMAs-fl (VER-01 to VER-09), selected from different municipalities across the state of Veracruz, Mexico, largely to represent the heterogeneity of the landscapes (Table 1; Figure 1a). These UMAs-fl were selected from official records from 1997, as updated to February 2017, according to the following characteristics: (1) a minimum period of six years in operation (considered the minimum time required for a UMA to reflect potentially significant economic growth), (2) operational communication with the Ministry of Environment and Natural Resources (SEMARNAT, by its Spanish acronym) during the last six years (a period from 2011–2012 to 2016–2017), (3) validation of operational status with the environmental authorities, (4) maximum extension and (5) spatial representation throughout the state [5]. Two UMAs were thus selected from the northern zone of the state (Figure 1b), five in the central zone (Figure 1c) and two in the southern zone (Figure 1d). The selection of UMAs also included the consideration of having different vegetation types, land uses and intensities of habitat management, as well as different types of extractive (i.e., hunting, auto-consumption, and commercialization of parts and derivatives) and non-extractive (i.e., environmental education, ecotourism, and conservation) uses of wildlife (Table 1).

2.2. Integration of an Index of Socioecosystemic Dynamics

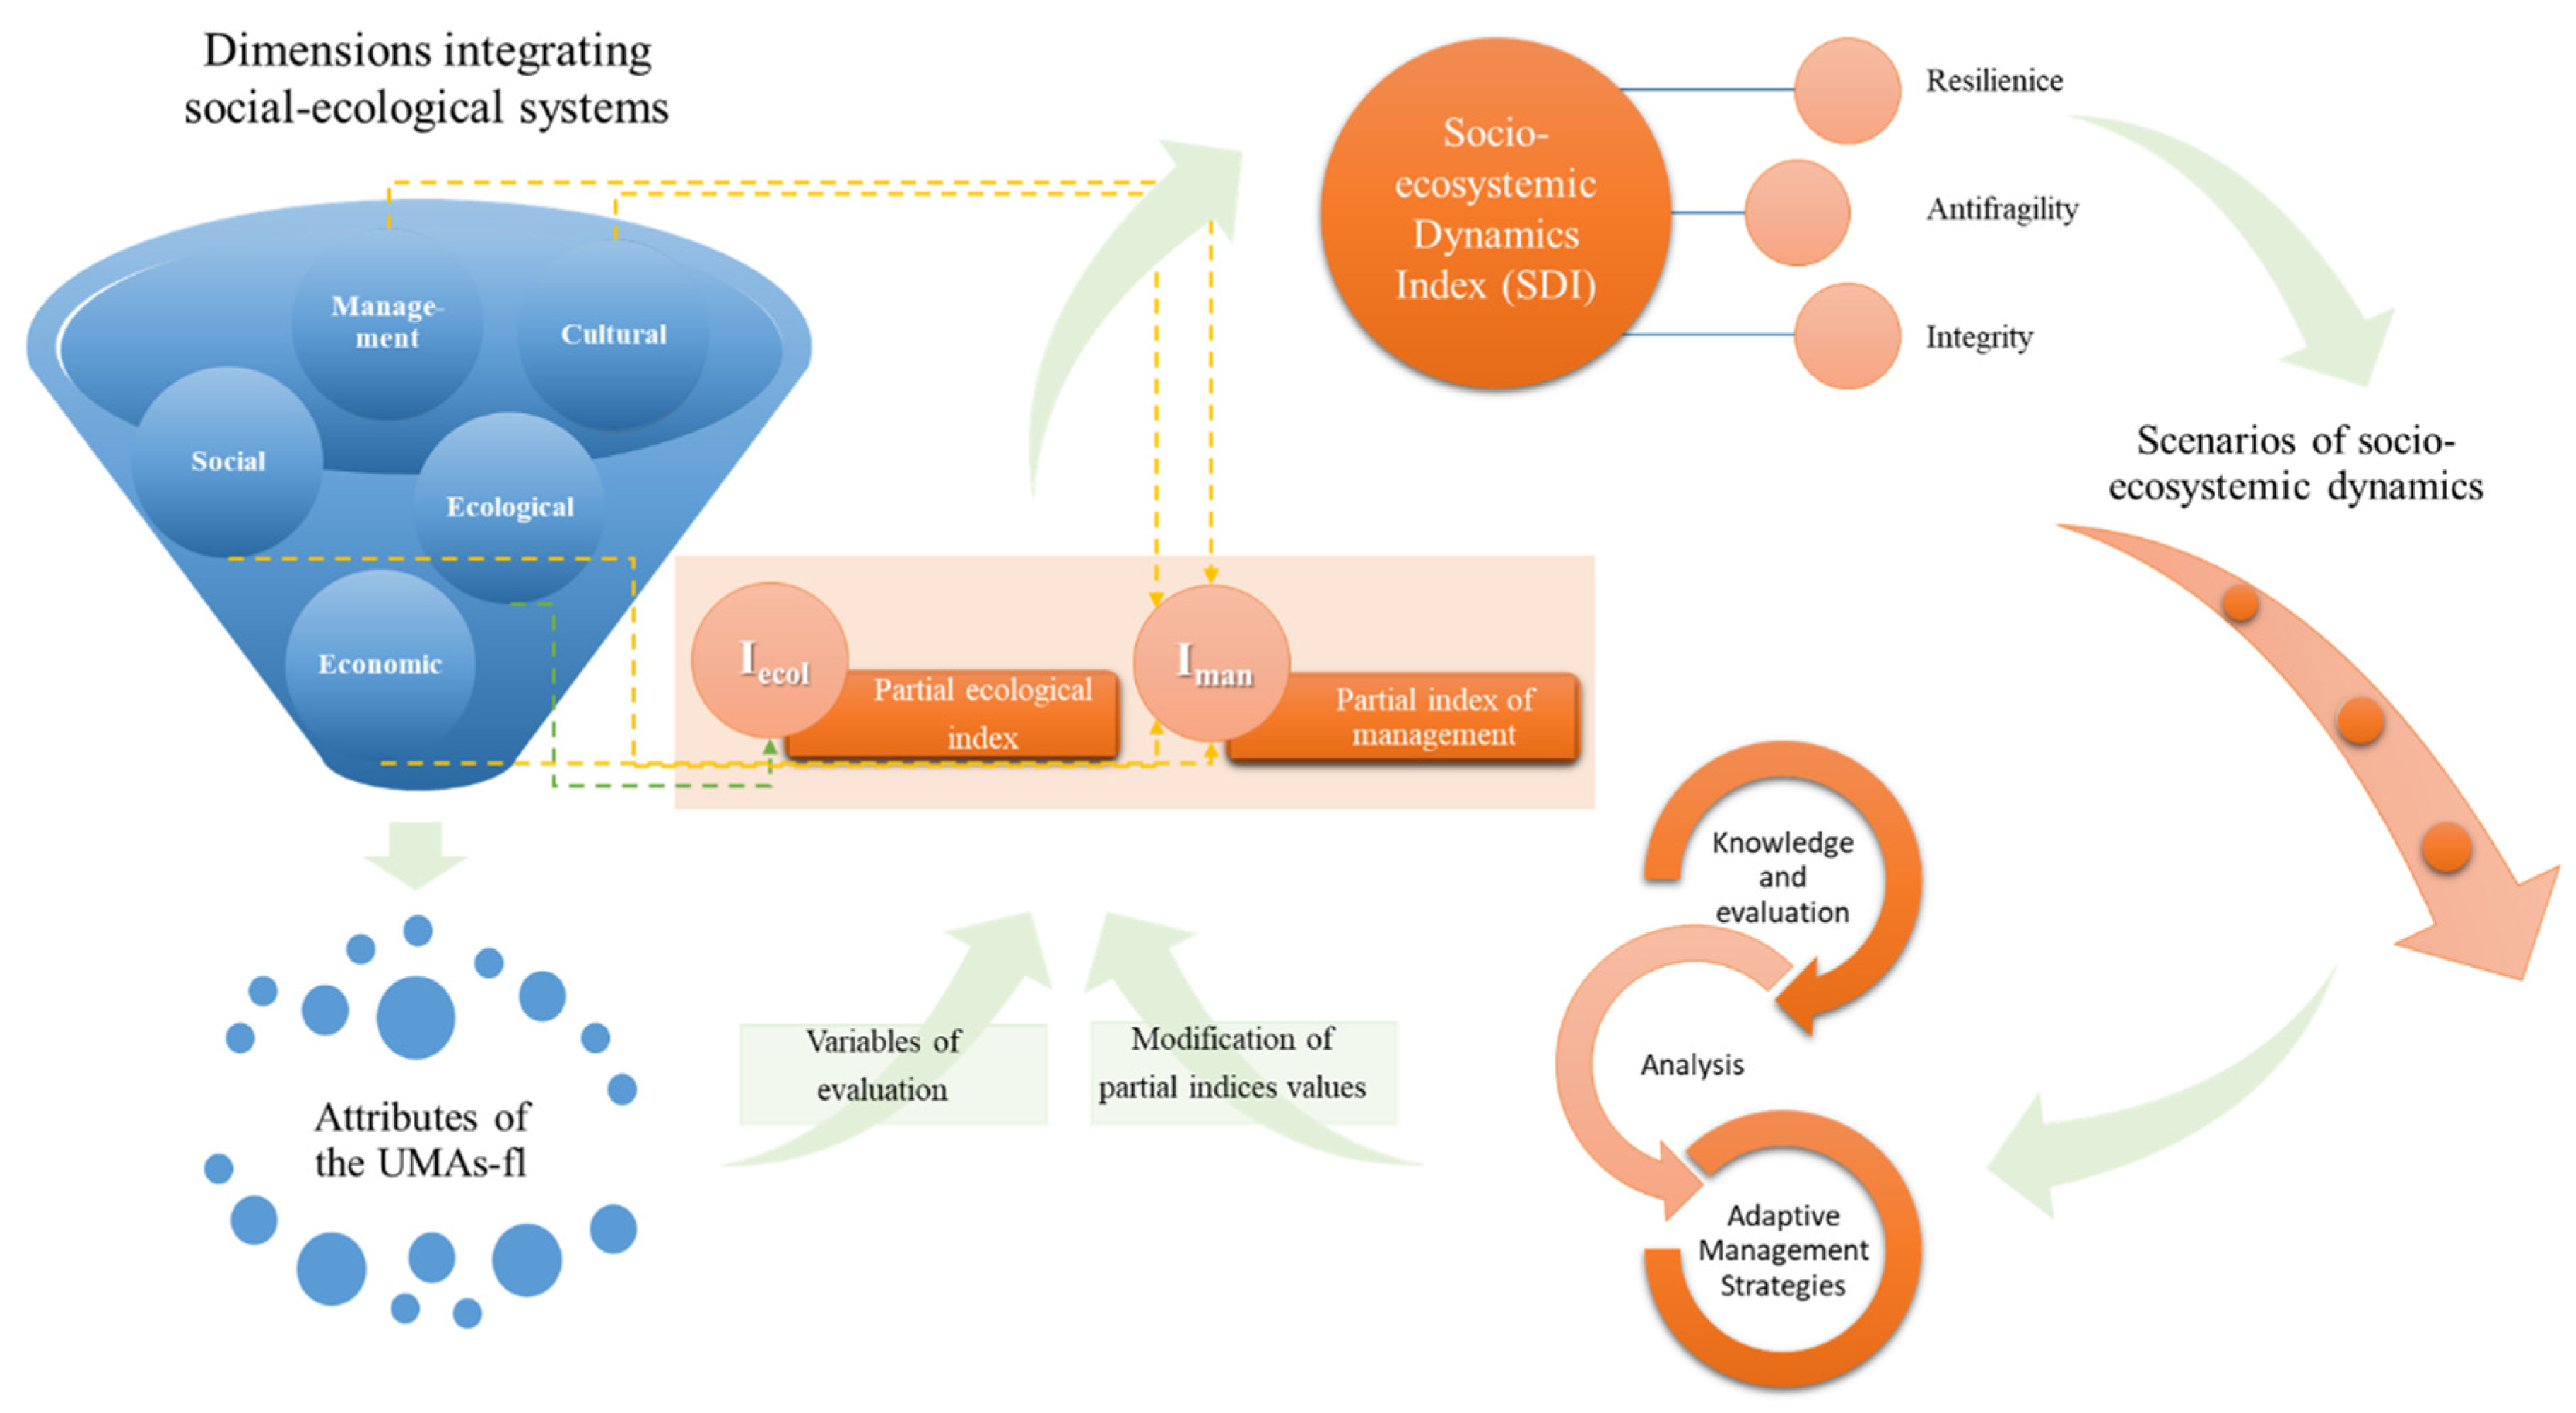
As complex socioecosystems, all nine UMAs were evaluated using an indicator model named Socioecosystemic Dynamics Index (SDI), integrating two partial indices that comprise the attributes of these areas in five dimensions: the ecological, social, economic, and cultural aspects, and consideration of its management objectives and practices (Table S1).
The SDI for each UMA was estimated using the following formula:
S D I   = I e c o l + I m a n
where Iecol = partial ecological index, which includes all the variables of ecological character inherent to the properties of the UMA, and Iman = partial index of management, which incorporates all the variables that are modifiable by direct human intervention.
Following Aronson and Le Floc’h [19], the attributes of the model were constructed by considering vital characteristics of the landscape. The resulting 31 attributes were evaluated through 47 variables obtained from specific inputs (Figure 2; Table S2 [21,22,23,24,25,26,27,28,29,30,31,32,33,34,35,36,37,38,39,40]).

2.2.1. Partial Ecological Index (Iecol)

This index evaluates the ecological dimension, considering the diversity of terrestrial vertebrates, the Incidence Value Index (InVI) of the species, the complexity and stability of the ecological interaction networks, and spatial variables which were generated considering the UMA core area and its potential area of influence (buffer) according to the minimum factor for potential connectivity, which is equivalent to 20 times the area of each UMA [4] (Table S2).
  • Diversity of terrestrial vertebrates and critical/functional groups.
Diversity was estimated through sampling with camera-traps (CuddeBack, Non Typical, Inc., Green Bay, WI, EE. UU). Between 6 and 10 camera traps were deployed per UMA, depending on the site’s surface area, taking into consideration a minimum separation of 500 m between each. They remained active for continuous periods of 30 to 45 days, achieving the minimum sampling effort of 450 trap-days estimated as the minimum sampling effort required to achieve a sampling completeness of over 90% (for more methodology details see Table S2). Captures were considered independent if separated by at least 12 h for individuals of the same species, or if they consisted of continuous sequences involving individuals of different species. The nine UMAs were sampled alternately between April 2019 and May 2020, without regard to seasonality (for methodology see Table S2). To fulfill variables related to diversity, it was evaluated with three orders of true diversity based on the Hill numbers (0D, 1D and 2D) [26,27], for both the communities of mesocarnivores and interacting species (Table S2), and for the community of fauna in general (all the species recorded making use of the landscape) for each UMA, using the package iNEXT [41] of the software R version 3.6.2 (R Core Team, 2019, Version 3.6.2 [42]). Sample coverage, estimated with an extrapolation of the species accumulation curves with the non-parametric estimator Chao 1 [43], was considered to be of greater than 90% completeness.
  • Estimation of the Incidence Value Index (InVI)
A modification based on the independent records was made to the Index of Relative Abundance (IRA) [44], considering the incidences (number of individuals per capture) for each species in each UMA. Given that the camera-trap sampling method can record captures with more than one individual, these were also counted as new cases [45]. The InVI per species was estimated as follows:
I n V I   =   ( C i +   I i )   /   S E )   ×   100  
where C = number of captures of photographic events of species i separated by 12 h, I = incidence or number of individuals of species i recorded in captures with more than one individual, SE = sampling effort (number of cameras per day of sampling) and 100 = days/camera (standard unit).
  • Complexity of networks of ecological interaction
Analysis of the parameters of the interaction network complexity (Table S2) was conducted using the package bipartite [46] of the software R version 3.6.2 (R Core Team, 2019), using nine bipartite matrices of affiliation that represented the interaction network of the terrestrial vertebrates recorded in the camera-traps. Each event of co-presence of two or more species in the same sampling unit (camera trap)—though not necessarily within the same record—was considered a spatial co-occurrence interaction, with the species acting as “actors” and the camera trap serving as the sampling unit for the “affiliation event” [46]. The intensity of the co-occurrence interaction was estimated quantitatively, weighting each interaction with the InVI of each species, considering all taxonomic groups, and making use of the landscape per sampling unit, and thus considering the sampling effort as a possible factor of incidence in the level of connectivity of the network [32].
Although the importance (species strength) of each species in the ecological networks was not included as a variable in the index, it was estimated in order to analyze the structures of the communities of terrestrial vertebrates, which leads to the interpretation of the roles of certain key species inside the UMA. Species strength was estimated as a measure of its abundance and distribution in the landscape, and of the sum of its dependencies with other species and relative to the site (affiliation) [7,9]. It is calculated based on the percentage of the target species’ total interactions with each one of the other species in the network (it is cumulative), incorporating species abundance into the equation too [47]. Finally, the importance of livestock (i.e., Bos spp. and Capra spp.), as non-native species in the ecosystems, was correlated with the true diversity 1D of wild terrestrial vertebrates in each UMA, to recognize the relationship between the presence and abundance of the livestock and the richness and abundance of the native wild fauna.

2.2.2. Partial Index of Management (Iman)

This index considers the social, economic, cultural and management dimensions. Data were obtained from semi-structured interviews with technicians and UMA owners (see the interview in Contreras-Hernández et al. [5]) and review of the Management Plan of each UMA and official government files. Additionally, spatial variables considering the core area and the potential area of influence (buffer) of each UMA were considered according to the minimum factor for potential connectivity; for each UMA; the potential area of influence is equivalent to 20 times the area of the UMA [4] (Table S2).

2.3. Statistical Analysis and Estimation of the SDI

Using a Pearson multiple linear correlation test, the collinearity of the 47 variables that make up the partial indices (17 from Iecol and 30 from Iman) was evaluated using the package psych [48] of the software R version 3.6.2 (R Core Team, 2019). Variables with correlation coefficients (R ≥ 0.7) with one another were excluded from the analysis due to being highly correlated. The inverse values of the variables documented as having a negative effect on the socioecosystemic dynamics of the UMAs [19] were previously estimated (Table S3). Inverse values allow for the weighting—to a greater or lesser degree—of the effects these variables have on the system; lower values imply a greater effect, and vice versa. To allow direct comparisons among the units of the variables and avoid bias introduced because of differences in scale, these were weighted in a range of 0–1, divided by their maximum value.
To equilibrate both partial indices, Iecol and Iman, and eliminate bias in their contribution to the SDI, the mean value of each was estimated, dividing it by the number of variables they comprise after the correlation test (13 and 24, respectively). The values estimated for each partial index were correlated with the value of true diversity 1D for all the terrestrial vertebrate species recorded in each UMA, since this considers the distribution of species according to their frequency of appearance, without favoring the common species above the rare or cryptic species [27]. This correlation allowed determination of the expected value of each partial index according to the mean value of the true diversity 1D, through the equation of the estimated correlation, considering this expected value of the indices to represent the minimum value of positive evaluation for the UMAs. Variables that presented a negative tendency in the correlation were considered variables with negative effects in the equation and were integrated as the sum of the reciprocal of their value.

3. Results

3.1. Partial Ecological Index (Iecol)

The collinearity test eliminated ten variables that were highly correlated (Table S4). Of the remaining 37 variables, 13 integrate the Iecol (Table S2 and Table S3) constructed from nine attributes (Table S2) of the ecological dimension. Five of them were estimated by field data and eight using official government databases (Table S2).
Iecol = CoEIN + (1/DistwB) + Divγ + DivMes + Divβ + IEH + ITH + INVeg + RobEIN + WB1 + WB2 + (1/SusNP) + ITHum
where Iecol = Partial ecological index, CoEIN = Co-occurrence of the ecological interaction network, DistWB = Mean distance to water bodies, Divγ = Diversity of species that use the landscape, DivMes = Diversity of critical/functional groups, Div β _ = Mean β diversity, IEH = Index of ecotone heterogeneity, ITH = Index of topographic heterogeneity, INVeg = Index of natural vegetation, RobEIN = Robustness of the ecological interaction network, WB1 = Weighted value of water bodies 1, WB2 = Weighted value of water bodies 2, SusNP = Weighted value of susceptibility to natural perturbations, and ITHum = Weighted value of index of topographic humidity.

3.1.1. Diversity of Terrestrial Vertebrates and Critical/Functional Groups

The estimated sample coverage indicated that a sample completeness for species richness of greater than 90% was achieved (Table 2), independently of the variation in the sampling effort applied in each UMA. For all nine UMAs pulled together, 74 wild terrestrial vertebrate species were identified (24 mammals, 46 birds and four reptiles), as well as six species of domestic fauna. Concerning the mammals, 81% of the species reported in the management plans of the UMAs-fl of Veracruz were recorded.
The UMA VER-07 presented the highest number of species of mesocarnivores (n = 8), although not the greatest diversity. On the other hand, UMA VER-02 presented the greatest richness of interacting species (n = 30). The diversities of order 1D and of order 2D, as a function of the frequencies of incidence, indicated that UMAs VER-06 and VER-02 are the most diverse regarding mesocarnivores and interacting species, respectively (Table 2).
The UMA VER-08, with a lower species richness of mesocarnivores (n = 2; Table 2), presented the lowest values for diversity 1D and 2D, in contrast to UMA VER-04, in which the richness of mesocarnivores was low (n = 4), but there were higher values for diversity than found in some other UMAs with greater numbers of species. Concerning the community of interacting species, UMA VER-09, with lesser richness (n = 5), presented the lowest values for diversity 1D and 2D.

3.1.2. Estimation of the Incidence Value Index (InVI)

Of the total fauna records (wild and domestic), 13 species of mesocarnivores were recorded (Table S5), along with 66 interacting species (46 birds, 17 mammals and three reptiles) (Table S6).

3.1.3. Complexity of Networks of Ecological Interaction

It was determined that the network with greatest connectivity, considering the value of the index of specialization H’2, corresponded to UMA VER-05 (H’2 = 0.61), while that of the least specialization was UMA VER-09 (H’2 = 0.23) (Table 3), with a correspondingly lesser richness, indicating that most of the species in the latter are generalists. Regarding co-occurrence of species and niche overlap, UMA VER-08 presented the highest indices (0.27 and 0.44, respectively). In contrast, the lowest values of co-occurrence (0.09) and niche overlap (0.18) were estimated for UMA VER-02, showing that despite high diversity values, most species are specialists, making a specific use of the landscape. For network robustness, the nine UMAs presented relatively high values, signifying that all have a tolerance for species loss of greater than 75%, for the species they host. The most robust networks corresponded to the UMAs VER-03 and VER-06 (both R = 0.89), while the least robust was that of UMA VER-05 (R = 0.77).
The white-tailed deer (Odocoileus virginianus) and the armadillo (Dasypus novemcinctus) were identified as species of importance in four UMAs, with mean importance values of 2.03 and 1.93, respectively. Among the species identified as important, there was a prominent influence of cattle (Bos spp.) in the interaction dynamics of four UMAs (VER-01, VER-03, VER-04 and VER-07), with a mean importance value (species strength) of 2.17 (Table 4), while in the UMAs VER-02, VER-06 and VER-08, no records were reported in the camera traps. The correlation of the importance of the cattle (Bos spp.) in the UMAs with the true diversity 1D of wild terrestrial vertebrates tends towards a positive, although not significant, (r = 0.57, p = 0.111) relationship. This indicates that cattle have no influence over wildlife terrestrial vertebrates, although they represent an important species in the dynamic interactions in some UMAs.

3.2. Partial Index of Management (Iman)

The collinearity test determined that 24 variables integrate the Iman (Table S2 and Table S3) constructed from 22 attributes (Table S1) of the social (four), management (10), cultural (five) and economic (three) dimensions. Of the variables evaluated, one was estimated from field data, 15 from the review of the UMA Management Plans and from information derived from interviews, and eight through the review of official government databases (Table S2).
I m a n = A + M A P C + 1 / D e n s P o p + D i s t H S + D i s t R H + D i s t I E + 1 / I V I s p i + 1 / I V e g I + 1 / H S + I n c P A + I n c S + 1 / U r b + S a t C o n s + S a t E c o n + S a t S o c + T e n + U s e S P L I + U s e T P + U s e T r a d W + 1 / R H + 1 / A c t I + 1 / S o u r c e A D + U s e s C H + ( 1 / U s e s P H )
where Iman = Partial index of management, A = Age, MAPC = Minimum area of potential connectivity, Denspop = Population density, DistHS = Mean distance to human settlements, DistRH = Mean distance to roads and highways, DistIE = Mean distance to induced ecosystems, InVIspi = Accumulated incidence value index of invasive species, IVegI = Index of induced vegetation, HS = Number of human settlements, IncPA = Percentage of income of productive activities, IncS = Percentage of income of services offered, Urb= Proportion of urbanization, SatCons = Satisfaction in conservation terms, SatEcon = Satisfaction in economic terms, SatSoc = Satisfaction in social terms, Ten = Type of land tenure, UseSPLI = Use of species of local importance, UseTP = Use of traditional practices and empirical knowledge, UseTradW = Use of traditional uses of wildlife, CC = Weighted value of roads and highways, ActI = Weighted value of activities of impact, SourceAD = Weighted value of the sources of anthropogenic degradation, UsesCH = Weighted value of current human uses, and UsesPH = Weighted value of previous human uses.

3.3. Statistical Analysis and Estimation of the SDI

The SDI equation was constructed based on the Iecol and Iman partial indices. Estimation of the partial indices from the 37 variables resulting from the collinearity test (13 from Iecol and 24 from Iman), as well as the SDI for each UMA, indicated that the UMA with the highest index value was VER-02 (SDI = 1.130) (Table 5), while that with the lowest SDI value was VER-09 (SDI = 0.846). Concerning the partial indices, the UMA with the highest value for management was VER-07 (Iman = 5.90), but this UMA also had the lowest value for the partial ecological index (Iecol = 0.401), while the UMA with the lowest value for management was VER-04 (Iman = 0.379). However, we found that the UMA with the greatest ecological value was VER-02 (Iecol = 0.591).
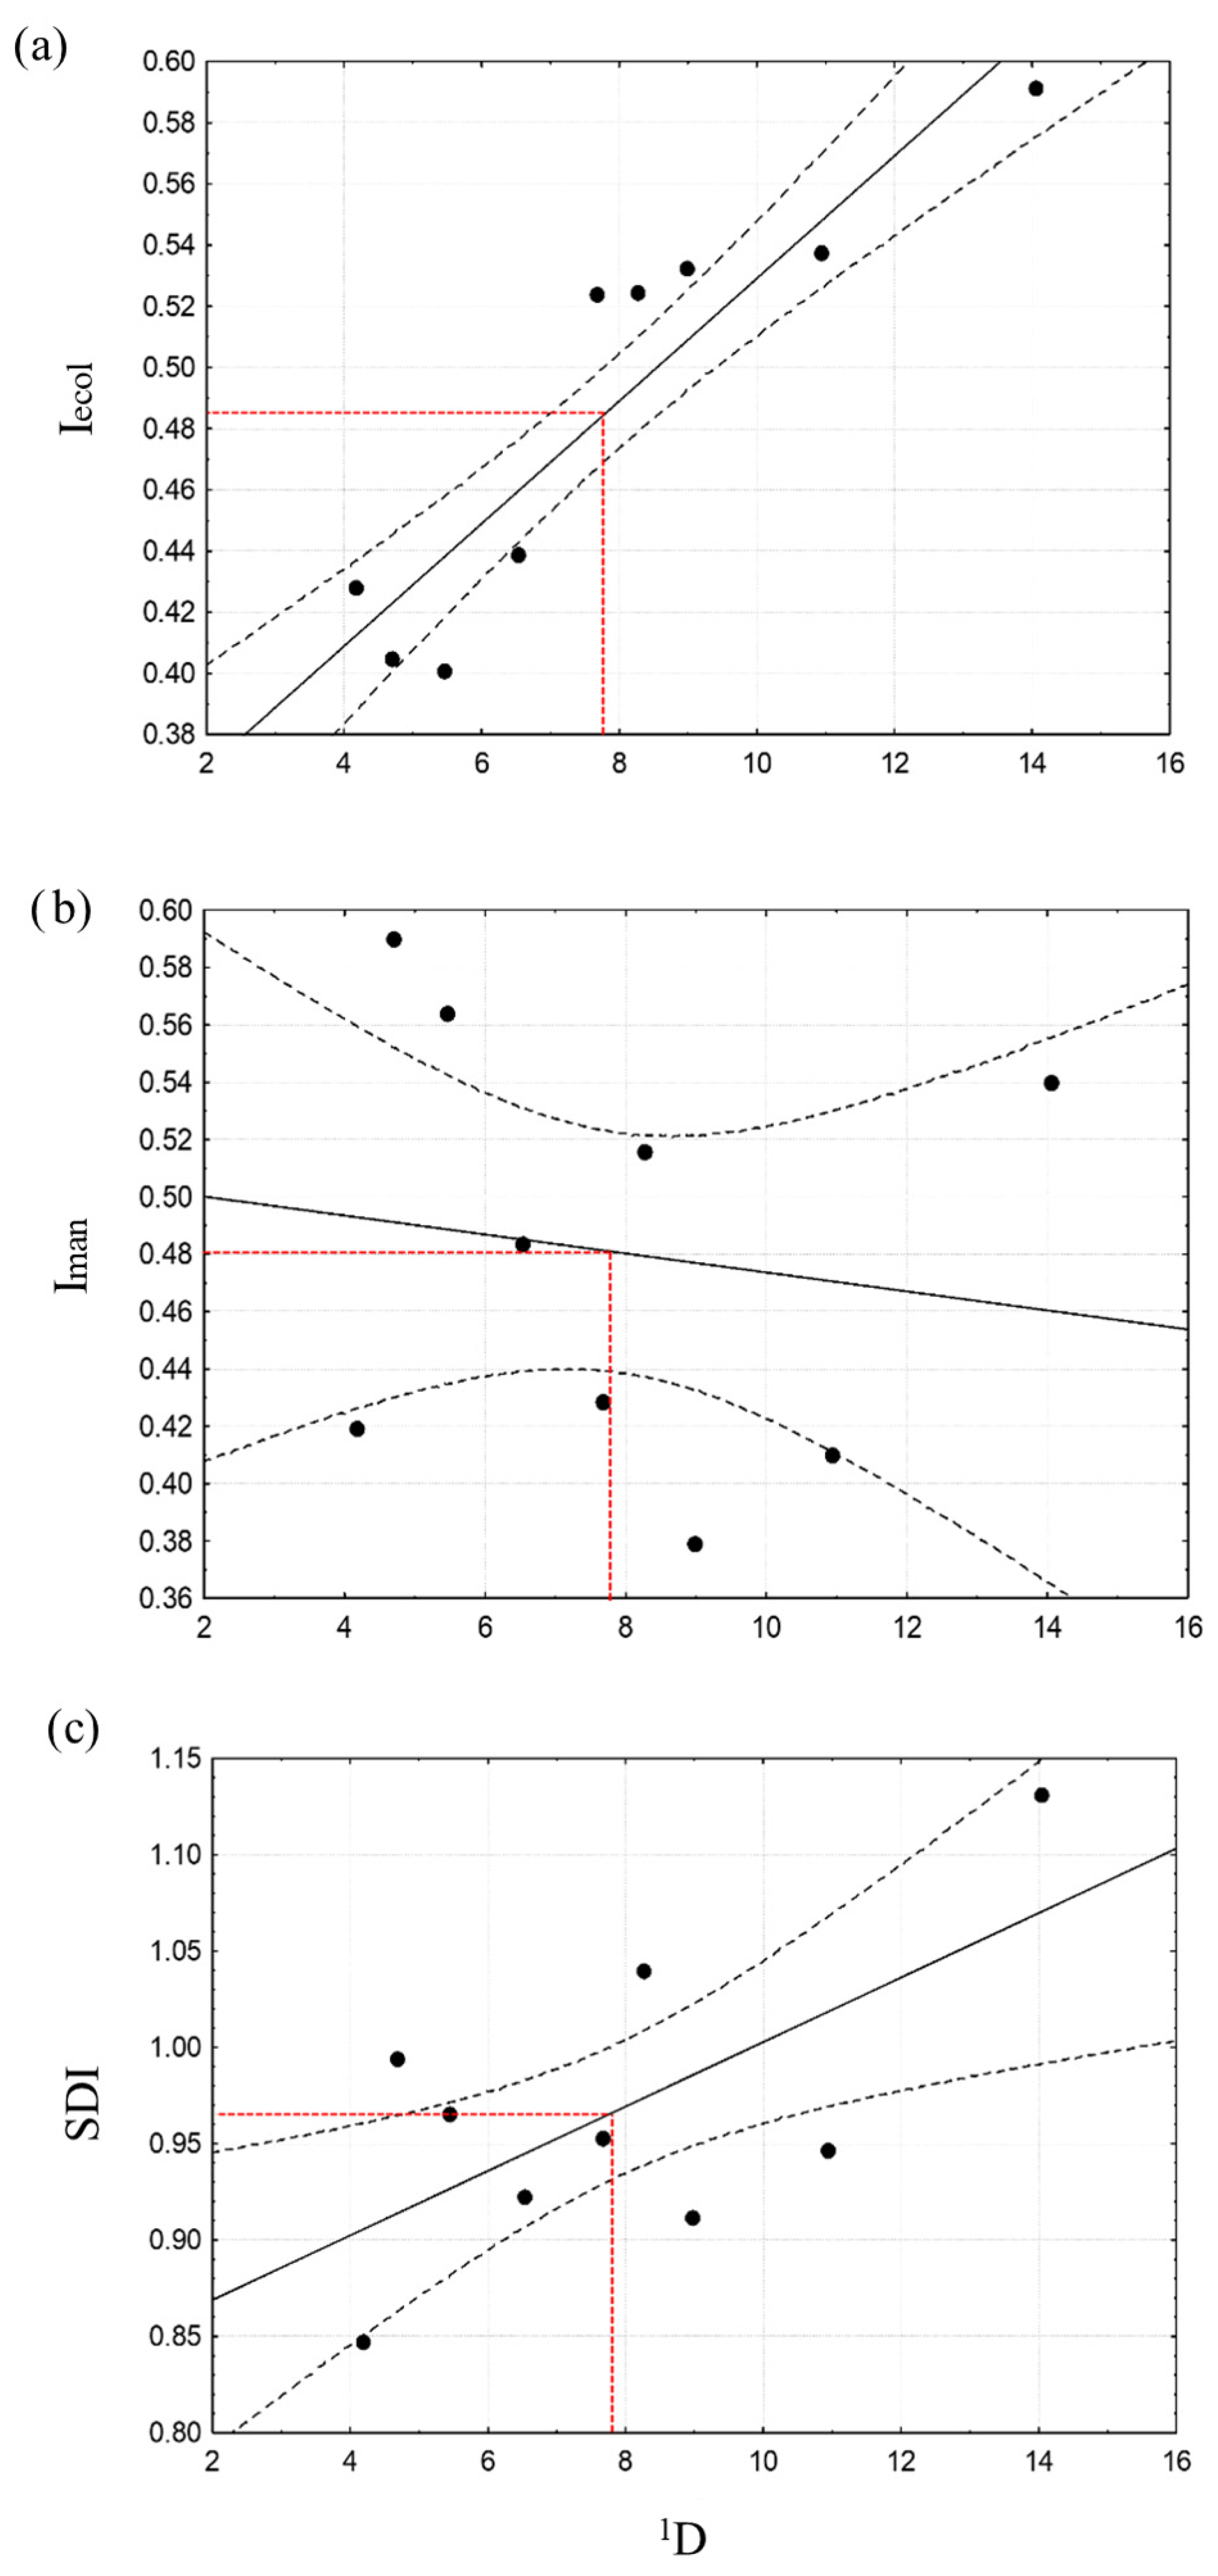
The correlation of the value of each partial index and the true diversity 1D for each UMA indicates that Iecol presented a positive and significant relationship with the true diversity 1D (r = 0.92, p = 0.0005) (Figure 3a), while Iman presents a non-significant negative relationship (r = −0.14, p = 0.72) (Figure 3b). This tendency is explained by the negative correlation of 18 of the 24 variables that integrate the Iman with the true diversity 1D, mainly because of the negative effects associated with these in the equation with the estimation of their respective reciprocals, although only one of these was significant (Percentage of income for services offered: r = −0.77, p = 0.0154). Finally, the SDI reflects a positive non-significant relationship with the true diversity 1D (r = 0.65, p = 0.058) (Figure 3c).
The fit with the mean value of true diversity 1 D ¯ for the nine UMAs (1 D ¯ =   7 .88) allowed estimation of the minimum desirable values for each index, with a minimum value of 0.486 for Iecol, and of 0.481 for Iman, while a minimum desirable value of 0.967 was estimated for the SDI (Figure 3).

4. Discussion

The results show that Wildlife Management Units (UMAs) function as complex socioecosystems where biodiversity conservation depends on both management interventions and the surrounding landscape conditions. Three main scenarios were identified, determinations by vertebrate richness, the proportion of natural ecosystems, and the degree of landscape transformation, and the results demonstrated that larger and more connected UMAs promote greater ecological complexity and conservation. Although management increases landscape heterogeneity and contributes to maintaining biodiversity, excessive intervention or inadequate management, along with external pressures such as urbanization, illegal hunting, and habitat loss, can negatively affect ecosystem self-organization and resilience. This study proposes the Socioecosystemic Dynamics Index (SDI) as a comprehensive tool to evaluate UMAs and identify imbalances between their ecological and management components and therefore recognize leverage points and thus guide adaptive management strategies that simultaneously improve biodiversity conservation and the sustainability of wildlife use, and provide socioeconomic benefits for owners and communities.
Over the past 20 years, the implementation of UMAs has increased the number of interventions and efforts to manage wildlife and its habitats, contributing to greater ecosystem complexity. Complexity is understood as a dynamic balance among adaptation, emergence of important species, and the auto-organization of the system [10,11,12,17]. However, auto-organization was not found to be optimal for the conservation and persistence of the managed ecosystems. In UMAs-fl, management as an internal pressure, as well as external disturbances in the landscape, could contribute to an “excess of auto-organization”. Some feedback is not desired, given the detrimental consequences for ecosystems [10,11].
For example, UMAs in which the management is inefficient or insufficient for owners and technicians to mitigate impacts of external actors (i.e., illegal hunters) give rise to sustained negative feedback of auto-organization due to the occurrence of non-sustainable illegal activities [11]. In turn, these scenarios generate specific interactions within the components of the system that cause patterns of adaptation at greater scale, impacting not only the structure of the UMA as a unit, but also at landscape scale. Similarly, this impact on the exterior affects the original components of the system at their basic scale (biodiversity and its interactions) through iterative feedback [12,17].
According to the diversity recorded in the UMAs analyzed and the characteristics of the internal and surrounding landscape, three main scenarios were identified: (1) There are UMAs with a great richness of terrestrial vertebrate species, but a lower proportion and diversity of natural ecosystems, both in their core and in their area of influence. These are UMAs immersed in a transformed matrix dominated by induced pastures and cultivated areas, human settlements, and densely populated urban areas. (2) There are UMAs with a lesser richness of terrestrial vertebrate species, but a greater proportion and diversity of natural ecosystems. These are close to protected areas and have a lower proportion of urbanization and moderate population density. (3) Finally, there are UMAs with high levels of richness and abundance of terrestrial vertebrate species, but with a proportional medium diversity of natural ecosystems in their core and in their area of influence. These cover wide areas and are surrounded by a high proportion of densely populated urban areas. This latter case reinforces the argument for the need to encourage the establishment of UMAs with greater area, based on spatial and potential connectivity analyses [4,5].
These three scenarios are a clear example of how the mechanisms of regulation, such as certain management interventions within UMAs (i.e., those affecting the proportion and diversity of natural ecosystems), serve as processes of auto-organization of the ecosystem in UMAs-fl, and how some external disturbances (i.e., landscape matrix, urbanization, and human population density) influence their auto-organization and maintenance [10,12,17]. Disorderly interventions in natural systems, as well as the randomness or the absolute suppression of stress factors, can lead to a loss of antifragility that significantly affects the resilience and capacity for adaptation in the ecosystem facing pressures of greater magnitude, such as natural disturbances and climate change [15,49].
Live systems require the correct quantity of randomness to prosper [50], and even many wild species are favored by certain conditions of landscape heterogeneity that act to enhance their complexity. However, this heterogeneity is influenced by scale [15,51], e.g., the cases of the white-tailed deer (Odocoileus virginianus) [52] and armadillo (Dasypus novemcinctus). This was observed in this study, in which the importance of these two species was high within the interaction networks of most UMAs evaluated. The loss of complexity in the natural landscapes is evident in the analysis of the matrix surrounding the areas of influence of UMAs. Except for examples located within or close to a protected area (i.e., UMAs VER-05 and VER-06 located in the Los Tuxtlas Biosphere Reserve), these areas of influence are surrounded by large areas of induced pasture and agricultural and urban zones. The UMAs-fl counteract homogenization and habitat loss by contributing to the area dedicated to conservation [4,5]. In this way, while different management interventions converge within the UMAs (e.g., agricultural activities), the objectives of conservation and sustainable use allow for the preservation of certain percentages of natural vegetation, which acts to increase landscape heterogeneity and enhance the complexity of the ecosystem and the maintenance of biodiversity [4,5,15,50].
Regarding changes in the landscape, the mesocarnivores are a potentially critical group used to provide data at local scale [53,54]. The record of 11 species in the sampled UMAs is comparable to the 11 species recorded for the Sierra Norte de Oaxaca [55], and to the 10 species recorded for the region north of the Chimalapas, both in southeastern Mexico [53]. For all of these, the point of convergence is the availability of potential prey. Reptiles, small birds, and small mammals form an integral part of the diet of strict carnivores, such as the ocelot (Leopardus pardalis), margay (Leopardus wiedii) and the jaguarundi (Herpailurus yaguaroundi) [56]. The coexistence of these species, as part of a trophic ensemble within the group of mesocarnivores, can be related to corporal size, morphology, and prey segregation. The presence of other generalist predators such as the gray fox (Urocyon cinereoargenteus), raccoon (Procyon lotor) and white-nosed coati (Nasua narica) also implies the ability to exploit resources when they are abundant and rich as a result of landscape heterogeneity [54,57].
However, structural landscape changes in complex socioecosystems also require consideration of the increased number of elements and processes of human components [1,9,10,16]. Such is the case with the presence, abundance, and importance of livestock within the ecological interaction networks in most UMAs. The high importance of livestock in four of the UMAs indicates that the livestock coexists with and shares spatial resources with wild species. Some negative effects on the herbivores have been reported, mainly through competition, and positive effects relating to increasing the productivity and nutritional quality of the vegetation and promoting the abundance of some wild herbivore species [58]. Moreover, the introduction of domestic dogs and cats, considered invasive species which have great capacities for colonization and dispersion [59,60], impacts the formation and dynamics of the local entities, since these species come to form part of the trophic ensembles, competing with, and possibly displacing, other native species that belong to the same guild [61,62]. Our results show that the positive correlation of the importance of livestock with the diversity of wild species does not imply that the presence of the livestock would favor fauna diversity but suggests that livestock management within the UMAs does not have a negative impact on the richness and abundance of native wild species. Furthermore, management and size of pasture fragments and the proportion of land use change within UMAs can foster landscape heterogeneity. This management facilitates the persistence of microhabitats, which is in turn reflected in the increases in wild species and the stability of the interactions among them [7,15,51]. For this reason, UMAs-fl with a controlled intensity of livestock management do not negatively affect the biodiversity they conserve [5,63], particularly in regions that present high levels of livestock production, like the state of Veracruz in Mexico.
To understand complex systems such as UMAs-fl, as well as their ecosystem dynamics, it is necessary to understand their organization. The notion of interactions can be related to the structures within the trophic networks and the social networks of the parties that interact, including humans, with the latter’s management interventions and use of resources [9,10,11,12,13,17]. For this reason, the Socioecosystemic Dynamics Index (SDI) may be an important and comprehensive tool for evaluation and self-management of a wildlife management and conservation instrument that can work within the context of adaptive management, like UMAs. Estimations of the SDI and of the partial indices, particularly that relating to management (Iman), showed that the influence of social actors and the management interventions, as well as their respective interdependencies, can vary depending on the objectives (i.e., social, commercial, and conservation) in the management plans of each UMA, as well as their respective economic performance and cultural backgrounds. The proposed model of evaluation allows improvement of the understanding of the socioecosystemic dynamics of UMAs-fl as an example of a wildlife management and conservation instrument, thanks to the integration of the smaller-scale components (variables that comprise the Iecol and the Iman), allowing exploration of the interactions at larger scales in the influence area of the UMAs, and thus, identifying leverage points at which to direct adaptive management strategies and the scales at which they must be implemented.
It is possible to detect UMAs-fl for which the numbers of management interventions are high, and with high values of Iman that contribute significantly to their SDI, but with relatively low values for their ecological components (Iecol) (i.e., UMAs VER-03, VER-07 and VER-08). Low values can be even below the minimum desirable value estimated according to the main diversity of terrestrial vertebrates for the region and the characteristics of the area of influence (i.e., scenario 2). In these cases, it is recommended to review in detail the management interventions and the specific objectives in order to modify those that impact directly on biodiversity and habitat conservation. Examples of this include the restoration of ecosystems, eradication of invasive species, and the redesign of activities and services offered by the UMA, which are considered to be high impact. Furthermore, a review of the sources of degradation and human uses practiced within the UMA is needed, followed by strategies of adaptive management designed based on the evaluation of the socioecosystemic dynamics [3,5]. On the other hand, UMAs were identified (i.e., UMAs VER-01, VER-02, VER-04 and VER-05) in which the Iecol values were relatively high, but which had low values for their scale of management that impacted the estimation of their final SDI (i.e., scenarios 1 and 3). In these cases, the design and execution of given management interventions of low impact for the local biodiversity and its habitat could be recommended in terms of diversifying the productivity (i.e., regenerative agriculture and farming) [64,65] and services offered and increasing the economic benefit and social development of the managers and their communities, thus contributing to the sustainability of the UMA [3,5,64]. Some good examples practiced in certain UMAs include low-impact regenerative livestock production such as organic livestock or agrosilvopastoral systems [66,67]. Moreover, other measures might include non-intensive cultivation of flora with traditional uses, as well as active interventions in terms of conservation, such as reforestation, restoration, and recovery of water bodies, among others [68].
The main strength of this tool for evaluating wildlife management and conservation instruments like UMAs-fl through the SDI consists of the possibility to utilize the wide availability of data that exists for Mexico, and many other countries, at different scales and from different information sources. It should be noted that, to have such effects, free access to information on the part of governmental agencies is of great importance, since this type of methodology of integral evaluation provides knowledge that is vital to decision-making in terms of conservation and management of wildlife and its habitats [3,4,5,69]. If wildlife management and conservation instruments like UMAs are considered as complex socioecosystems, biodiversity and ecosystems have the capacity to adapt and evolve even in the presence of factors involving pressure, such as land use change and management interventions. For this reason, the inclusion of information referring to the social dimensions (economic, cultural, and management), within a model that tends to evaluate the socioecosystemic dynamics more from antifragility than from resilience as a design criterion [11,70], gives rise to a more robust and favorable scheme of evaluation, compared to the more simplistic models also used to evaluate biodiversity.
This model is proposed on a methodological and analytical basis to evaluate socioecosystemic dynamics in complex socioecosystems; it can be replicated in UMAs-fl of other regions of Veracruz and Mexico in general, and for some other wildlife management and conservations instruments worldwide, and it is also proposed as a basis for the evaluation in the context of other management modalities like intensive UMAs. The practical application of this kind of evaluation by means of an analytical multidimensional tool has two scales: (1) local, directed to self-management aimed at identifying leverage points and guiding suitable adaptive management strategies, considering their specific needs and their zones of influence as a function of its own socioecosystemic dynamics, and (2) national, directed to evaluation of a public policy by providing a standardized analytical and comprehensive tool potentially replicable and adaptable to regional contexts. Efforts of sampling and information compilation of this magnitude are feasible if proposed in terms of strategies of collaboration among the social actors involved. A strategy of exchange of knowledge and information among agencies could contribute significantly to counteracting the lack of capacity for evaluation and monitoring on the part of the government environmental agencies. This could be achieved by facilitating periodic auto-evaluation on digital platforms to contribute to a comprehensive balance of the results in terms of effectiveness in the conservation of wildlife and its habitats and the socioeconomic benefits of these wildlife management and conservation instruments, from the analytical perspective of socioecosystemic complexity.

Supplementary Materials

The following supporting information can be downloaded at: https://www.mdpi.com/article/10.3390/su18199852/s1. Table S1: Attributes of the UMAs in five dimensions that determine their socioecosystemic dynamics; Table S2. Descriptive matrix of construction of variables that integrate the Socioecosystemic Dynamics Model in free-living UMAs; Table S3. Evaluated variables that integrate the Socioecosystemic Dynamics Model in free-living UMA; Table S4. Multiple linear correlation matrix for 47 analytical variables for the integration of the Socioecosystemic Dynamics Model in free-living UMAs; Table S5. List of mesopredators of the Order Carnivora recorded in nine free-living UMAs in the state of Veracruz, Mexico; Table S6. List of interacting species of mesopredators of the Order Carnivore recorded in nine free-living UMAs in the state of Veracruz, Mexico.

Author Contributions

Conceptualization and Project administration, C.Á.-P. and A.C.-H.; funding acquisition, A.C.-H.; data collection and analysis, C.Á.-P., E.A.S.-C., L.M.G.-F. and R.L.; writing—original draft preparation, C.Á.-P.; writing—review and editing, C.Á.-P., A.C.-H., E.A.S.-C., L.M.G.-F., S.G., A.O.-A. and L.P.-B. All authors have read and agreed to the published version of the manuscript.

Funding

This research was funded by Consejo Nacional de Ciencia y Tecnología (CONACYT), grant number PN-4106/2016, and the APC was funded by the authors.

Institutional Review Board Statement

Ethical review and approval were waived for this study due to Article 17(I) and Articles 20–22 of the Reglamento de la Ley General de Salud en Materia de Investigación para la Salud (RLGSMIS; DOF 6 January 1987, as amended), as well as CEAS Código de Ética. The researchers obtained the informed consent of the participants and ensured the anonymity and confidentiality of data. The study involved no direct handling of animals; field activities complied with the LGVS (DOF 3 July 2000, as amended), particularly Article 39 on UMAs and the LGEEPA (DOF 28 January 1988, as amended).

Informed Consent Statement

Informed consent was obtained from all subjects involved in the study.

Data Availability Statement

The datasets generated and/or analyzed during the current study are available from the corresponding author on reasonable request.

Acknowledgments

This work was supported by the Consejo Nacional de Ciencia y Tecnología (CONACYT) under Grant [Project PN-4106/2016] to the project “Evaluation of the Management Units for the Conservation of Wildlife (UMAs) as a national conservation policy”, carried out by the Instituto de Ecología A.C. (INECOL) in collaboration with El Colegio de la Frontera Sur (ECOSUR) and the Universidad Autónoma de Chiapas (UACH). We appreciate the collaboration of the Secretaría del Medio Ambiente y Recursos Naturales (SEMARNAT) in the federal offices and thank the Delegation of Veracruz for the official SUMA databases. We especially thank those who collaborated in the development of this study by supporting field and administrative work and providing information by reviewing official databases: Carlos I. Flores-Romero, Rolando González-Trápaga (†), Emma Gómez, Uriel Echavarría-Dominguez, Johnny J García-Bautista, Mónica Maravert, Bruce Zacarías, and Valeria Huerta-Saavedra; and we thank Mariana Pineda-Vázquez for her contribution to the methodological design. We appreciate the assistance from Keith MacMillan with translation. The authors have reviewed and edited the output and take full responsibility for the content of this publication.

Conflicts of Interest

The authors declare no conflicts of interest.

Abbreviations

The following abbreviations are used in this manuscript:
UMAUnits of Management for the Conservation and Sustainable Use of Wildlife
UMAs-flFree-living UMAs
SDISocioecosystemic Dynamics Index
InVIIncidence Value Index
IRAIndex of Relative Abundance
IecolPartial Ecological Index
ImanPartial Index of Management

References

  1. Castillo, A.; Magaña, A.; Pujadas, A.; Martínez, L.; Godínez, C. Understanding the interaction of rural people with ecosystems: A case study in a tropical dry forest of Mexico. Ecosystems 2005, 8, 630–643. [Google Scholar] [CrossRef] [Scilit]
  2. Ortega-Uribe, T.; Mastrangelo, M.E.; Villarroel-Torrez, D.; Piaz, A.G.; Vallejos, M.; Saenz-Ceja, J.E.; Gallego, F.; Soler-Franquesa, M.; Calzada, L.; Espinosa, N.; et al. Estudios transdisciplinarios en socio-ecosistemas: Reflexiones teóricas y su aplicación en contextos latinoamericanos. Investig. Ambient. Cienc. Política Pública 2014, 6, 123–136. [Google Scholar]
  3. Ortega-Argueta, A.; González-Zamora, A.; Contreras-Hernández, A.A. Framework and indicators for evaluating policies for conservation and development: The case of wildlife management units in Mexico. Environ. Sci. Policy 2016, 63, 91–100. [Google Scholar] [CrossRef] [Scilit]
  4. Álvarez-Peredo, C.; Contreras-Hernández, A.; Gallina-Tessaro, S.; Pineda-Vázquez, M.; Ortega-Argueta, A.; Tejeda-Cruz, C.; Landgrave, R. Impact of the wildlife management units policy on the conservation of species and ecosystems of southeastern Mexico. Sustainability 2018, 10, 4415. [Google Scholar] [CrossRef] [Scilit]
  5. Contreras-Hernández, A. Importancia Socioambiental del Manejo de la Vida Silvestre Unidades de Manejo Para la Conservación de la Vida Silvestre en Veracruz, Tabasco y Chiapas; Secretaria de Medio Ambiente y Recursos Naturales: Ciudad de México, Mexico; Instituto de Ecología AC: Xalapa, Mexico, 2021. [Google Scholar]
  6. Galán, C.; Balvanera, P.; Castellarini, F. Políticas Públicas Hacia la Sustentabilidad: Integrando la Visión Ecosistémica; Centro de Investigaciones en Ecosistemas (CIEco)-UNAM: Morelia, Mexico; Comisión Nacional para el Conocimiento y Uso de la Biodiversidad (CONABIO): Mexico City, Mexico, 2013. [Google Scholar]
  7. Bascompte, J.; Jordano, P.; Olesen, J.M. Asymmetric coevolutionary networks facilitate biodiversity maintenance. Science 2006, 312, 431–433. [Google Scholar] [CrossRef] [Scilit] [PubMed]
  8. Tu, C.; Suweis, S.; Grilli, J.; Formentin, M.; Maritan, A. Reconciling cooperation, biodiversity and stability in complex ecological communities. Sci. Rep. 2019, 9, 5580. [Google Scholar] [CrossRef] [Scilit] [PubMed]
  9. Parrott, L.; Chion, C.; Gonzalès, R.; Latombe, G. Agents, individuals, and networks: Modeling methods to inform natural resource management in regional landscapes. Ecol. Soc. 2012, 17, 32. [Google Scholar] [CrossRef] [Scilit]
  10. Filotas, E.; Parrott, L.; Burton, P.J.; Chazdon, R.L.; Coates, K.D.; Coll, L.; Haeussler, S.; Martin, K.; Nocentini, S.; Puettmann, K.J.; et al. Viewing forests through the lens of complex systems science. Ecosphere 2014, 5, 1–23. [Google Scholar] [CrossRef] [Scilit]
  11. Equihua, M.; Aldama, M.E.; Gershenson, C.; López-Corona, O.; Munguía, M.; Pérez-Maqueo, O.; Ramírez-Carrillo, E. Ecosystem antifragility: Beyond integrity and resilience. PeerJ 2020, 8, e8533. [Google Scholar] [CrossRef] [Scilit] [PubMed]
  12. Levin, S.A. Fragile Dominion: Complexity and the Commons; Perseus Books: Cambridge, MA, USA, 1999. [Google Scholar]
  13. Liu, J.; Dietz, T.; Carpenter, S.R.; Alberti, M.; Folke, C.; Moran, E.; Pell, A.N.; Deadman, P.; Kratz, T.; Lubchenco, J.; et al. Complexity of coupled human and natural systems. Science 2007, 317, 1513–1516. [Google Scholar] [CrossRef] [Scilit] [PubMed]
  14. Messier, C.; Puettmann, K.J.; Coates, K.D. Managing Forests as Complex Adaptive Systems: Building Resilience to the Challenge of Global Change; Routledge: London, UK, 2013. [Google Scholar]
  15. Oliver, T.H.; Heard, M.S.; Isaac, N.J.B.; Roy, D.B.; Procter, D.; Eigenbrod, F.; Freckleton, R.; Hector, A.; Orme, C.D.L.; Petchey, O.L.; et al. Biodiversity and Resilience of Ecosystem Functions. Trends Ecol. Evol. 2015, 30, 673–684. [Google Scholar] [CrossRef] [Scilit] [PubMed]
  16. Lynam, T.; de Jong, W.; Sheil, D.; Kusumanto, T.; Evans, K.A. A review of tools for incorporating community knowledge, preferences, and values into decision making in natural resources management. Ecol. Soc. 2007, 12, 1–15. [Google Scholar] [CrossRef] [Scilit]
  17. Perry, D.A. Self-organizing systems across scales. Trends Ecol. Evol. 1995, 10, 241–244. [Google Scholar] [CrossRef] [Scilit] [PubMed]
  18. Cabezas, H.; Pawlowski, C.W.; Mayer, A.L.; Hoagland, N.T. Sustainable systems theory: Ecological and other aspects. J. Clean. Prod. 2005, 13, 455–467. [Google Scholar] [CrossRef] [Scilit]
  19. Aronson, J.; Le Floc’h, E. Vital landscape attributes: Missing tools for restoration ecology. Restor. Ecol. 1996, 4, 377–387. [Google Scholar] [CrossRef] [Scilit]
  20. Secretaría de Medio Ambiente, Recursos Naturales y Pesca (SEMARNAP). Programa de Conservación de la Vida Silvestre y Diversificación Productiva en el Sector Rural; SEMARNAP: Ciudad de México, Mexico, 1997; Available online: http://legismex.mty.itesm.mx/progs/pcvs.pdf (accessed on 26 June 2024).
  21. Instituto Nacional de Estadística y Geografía (INEGI). Continuo de Elevaciones Mexicano y Modelos Digitales de Elevación. 2013. Available online: https://www.inegi.org.mx/app/geo2/elevacionesmex/ (accessed on 18 February 2025).
  22. Dilts, T.E. Topography Tools for ArcGIS 10.1.; University of Nevada: Reno, NV, USA, 2015; Available online: http://www.arcgis.com/home/item.html?id=b13b3b40fa3c43d4a23a1a09c5fe96b9 (accessed on 1 June 2026).
  23. Instituto Nacional de Estadística y Geografía (INEGI); Comisión Nacional Forestal (CONAFOR); Comisión Nacional para el Conocimiento y Uso de la Biodiversidad (CONABIO); Secretaría de Medio Ambiente y Recursos Naturales (SEMARNAT). Mapa Nacional de Referencia, Cobertura de Suelo, 1:20000; Veraruz MadMex Sentinel2; Mexico. 2018. Available online: https://monitoreo.conabio.gob.mx/snmb_charts/descarga_datos_madmex.html (accessed on 1 June 2026).
  24. Buskirk, S.W.; Zielinski, W.J. Small and mid-sized carnivores. In Mammal Community Dynamics: Management and Conservation in the Coniferous Forests of Western North America; Zabel, C., Anthony, R.G., Eds.; Cambridge University Press: Cambridge, UK, 2003; pp. 207–249. [Google Scholar]
  25. Roemer, G.W.; Gompper, M.E.; Van Valkenburgh, B. The ecological role of the mammalian mesocarnivore. BioScience 2009, 59, 165–173. [Google Scholar] [CrossRef] [Scilit]
  26. Hill, M. Diversity and evenness: A unifying notation and its consequences. Ecology 1973, 54, 427–432. [Google Scholar] [CrossRef] [Scilit]
  27. Jost, L. Entropy and diversity. Oikos 2006, 113, 363–375. [Google Scholar] [CrossRef] [Scilit]
  28. Niedballa, J.; Sollmann, R.; Courtiol, A.; Wilting, A. CamtrapR: An R package for efficient camera trap data management. Methods Ecol. Evol. 2016, 7, 1457–1462. [Google Scholar] [CrossRef] [Scilit]
  29. Anderson, M.J.; Crist, T.O.; Chase, J.M.; Vellend, M.; Inouye, B.D.; Freestone, A.L.; Sanders, N.J.; Cornell, H.V.; Comita, L.S.; Davies, K.F.; et al. Navigating the multiple meanings of β diversity: A roadmap for the practicing ecologist. Ecol. Lett. 2011, 14, 19–28. [Google Scholar] [CrossRef] [Scilit] [PubMed]
  30. Blüthgen, N.; Menzel, F.; Blüthgen, N. Measuring specialization in species interaction networks. BMC Ecol. 2006, 6, 9. [Google Scholar] [CrossRef] [Scilit] [PubMed][Green Version]
  31. Stone, L.; Roberts, A. Competitive exclusion, or species aggregation? An aid in deciding. Oecologia 1992, 91, 419–424. [Google Scholar] [CrossRef] [Scilit] [PubMed]
  32. Blüthgen, N. Why network analysis is often disconnected from community ecology: A critique and an ecologist’s guide. Basic Appl. Ecol. 2010, 11, 185–195. [Google Scholar] [CrossRef] [Scilit]
  33. Chao, A.; Chazdon, R.L.; Colwell, R.K.; Shen, T.J. Abundance-based similarity indices and their estimation when there are unseen species in samples. Biometrics 2006, 62, 361–371. [Google Scholar] [CrossRef] [Scilit] [PubMed]
  34. Memmott, J.; Waser, N.M.; Price, M.V. Tolerance of pollination networks to species extinctions. Proc. R. Soc. B Biol. Sci. 2004, 271, 2605–2611. [Google Scholar] [CrossRef] [Scilit] [PubMed]
  35. Instituto Nacional de Estadística y Geografía (INEGI). Red Hidrográfica Edición 2.0 Veracruz, 1:50000. Mexico, 2010. Available online: https://www.inegi.org.mx/temas/hidrografia/#Descargas (accessed on 15 August 2024).
  36. Sørensen, R.; Zinko, U.; Seibert, J. On the calculation of the topographic wetness index: Evaluation of different methods based on field observations. Hydrol. Earth Syst. Sci. 2006, 10, 101–112. [Google Scholar] [CrossRef] [Scilit]
  37. Mora González, I.; Morales Barrera, W.; Rodríguez Elizarrarás, S. (Eds.) Atlas de Peligros Geológicos e Hidrometeorológicos del Estado de Veracruz; Secretaría de Protección Civil del estado de Veracruz: Universidad Veracruzana, UNAM: México, 2010. [Google Scholar]
  38. Secretaría de Comunicaciones y Transportes (SCT); Instituto de Estadística y Geografía (INEGI); Instituto Mexicano del Transporte; Red Nacional de Caminos (RNC). Red Nacional de Caminos. RNC. 2019. Available online: https://www.inegi.org.mx/app/biblioteca/ficha.html?upc=889463776086 (accessed on 1 June 2026).
  39. Instituto Nacional de Estadística y Geografía (INEGI). Censo de Población y Vivienda 2010. 2010. Available online: https://www.inegi.org.mx/programas/ccpv/2010/ (accessed on 1 June 2026).
  40. Instituto Nacional de Estadística y Geografía (INEGI). Cartografía Geoestadística Urbana, Cierre del Censo de Población y Vivienda 2010. 2010. Available online: https://www.inegi.org.mx/app/mapas/?t=0710000000000000&tg=3604 (accessed on 1 June 2026).
  41. Hsieh, T.; Ma, K.; Chao, A. INEXT: An R package for interpolation and extrapolation of species diversity (Hill Number). Methods Ecol. Evol. 2015, 7, 1451–1456. [Google Scholar] [CrossRef] [Scilit]
  42. R Core Team. R: A Language and Environment for Statistical Computing, Versión 3.6.2 [Computer software]; R Foundation for Statistical Computing: Vienna, Austria, 2019; Available online: https://www.R-project.org/ (accessed on 1 June 2026).
  43. Chao, A.; Jost, L. Coverage-based rarefaction, and extrapolation: Standardizing samples by completeness rather than size. Ecology 2012, 93, 2533–2547. [Google Scholar] [CrossRef] [Scilit] [PubMed]
  44. O’Brien, T.G.; Timothy, G. Abundance, density and relative abundance: A conceptual framework. In Camera Traps in Animal ecology: Methods and Analyses; O’Connell, A.F., Nichols, J.D., Karanth, K.U., Eds.; Springer: Tokyo, Japan, 2011; pp. 71–96. [Google Scholar]
  45. Chao, A.; Chiu, C.H. Nonparametric estimation and comparison of species richness. eLS 2016, 1–11. [Google Scholar] [CrossRef] [Scilit]
  46. Dormann, C.F.; Gruber, B.; Fründ, J. Introducing the bipartite package: Analysing ecological networks. R News 2008, 8/2, 8–11. [Google Scholar]
  47. De Nooy, W.; Mrvar, A.; Batagelj, V.; Mehri, D.; Auto, I.; Lee, C.S.; Works, W.S.; Szwarcberg, M.; Voters, M.P. Exploratory Social Network Analysis with Pajek (Structural Analysis in the Social Sciences), 3rd ed.; Cambridge University Press: New York, NY, USA, 2005. [Google Scholar]
  48. Revelle, W.R. Psych: Procedures for Personality and Psychological Research. 2017. Available online: https://CRAN.R-project.org/package=psych (accessed on 5 August 2025).
  49. Levin, S.A. Self-organization and the emergence of complexity in ecological systems. Bioscience 2005, 55, 1075–1079. [Google Scholar] [CrossRef] [Scilit]
  50. Fernández-Oto, C.; Tzuk, O.; Meron, E. Front instabilities can reverse desertification. Phys. Rev. Lett. 2019, 122, 048101. [Google Scholar] [CrossRef] [Scilit] [PubMed]
  51. Hautier, Y.; Isbell, F.; Borer, E.T.; Seabloom, E.W.; Harpole, W.S.; Lind, E.M.; MacDougall, A.S.; Stevens, C.J.; Adler, P.B.; Alberti, J.; et al. Local loss and spatial homogenization of plant diversity reduce ecosystem multifunctionality. Nat. Ecol. Evol. 2018, 2, 50–56. [Google Scholar] [CrossRef] [Scilit] [PubMed]
  52. Galindo-Leal, C.; Weber, M. El Venado de la Sierra Madre Occidental: Ecología Manejo y Conservación; Comisión Nacional Para el Conocimiento y Uso de la Biodiversidad (CONABIO): Ciudad de México, Mexico, 1998. [Google Scholar]
  53. Pérez-Irineo, G.; Santos-Moreno, A. Riqueza de especies y gremios tróficos de mamíferos carnívoros en una selva alta del sureste de México. Therya 2013, 4, 551–564. [Google Scholar] [CrossRef] [Scilit]
  54. Curveira-Santos, G.; Marques, T.A.; Björklund, M.; Santos-Reis, M. Mediterranean mesocarnivores in spatially structured managed landscapes: Community organisation in time and space. Agric. Ecosyst. Environ. 2017, 237, 280–289. [Google Scholar] [CrossRef] [Scilit]
  55. Hernández-Sánchez, A.; Santos-Moreno, A.; Pérez-Irineo, G. Abundance of mesocarnivores in two vegetation types in the southeastern region of Mexico. Southwest. Nat. 2017, 62, 101–108. [Google Scholar] [CrossRef] [Scilit]
  56. Ceballos, G.; Miranda, A. Guía de Campo de los Mamíferos de la Costa de JALISCO, Mexico; Fundación Ecológica de Cuixmala AC: La Huerta, Mexico, 2000. [Google Scholar]
  57. Saint-Béat, B.; Baird, D.; Asmus, H.; Asmus, R.; Bacher, C.; Pacella, S.R.; Johnson, G.A.; David, V.; Vézina, A.F.; Niquil, N. Trophic networks: How do theories link ecosystem structure and functioning to stability properties? A review. Ecol. Indic. 2015, 52, 458–471. [Google Scholar] [CrossRef] [Scilit]
  58. Chaikina, N.A.; Ruckstuhl, K.E. The effect of cattle grazing on native ungulates: The good, the bad, and the ugly. Rangeland 2006, 28, 8–14. [Google Scholar] [CrossRef] [Scilit]
  59. Boitani, L. Carnivore introductions and invasions: Their success and management options. In Carnivore Conservation; Gittleman, J.L., Funk, S.M., Macdonald, D.W., Wayne, R.K., Eds.; Cambridge University Press: Cambridge, MA, USA, 2001; pp. 123–144. [Google Scholar]
  60. Álvarez-Romero, J.G.; Medellín, R.A.; Oliveras de Ita, A.; Gómez de Silva, H.; Sánchez, O. Animales Exóticos en México: Una amenaza Para la Biodiversidad; Comisión Nacional para el Conocimiento y Uso de la Biodiversidad: Ciudad de México, Mexico; Instituto de Ecología-UNAM: Ciudad de México, Mexico; Secretaría de Medio Ambiente y Recursos Naturales: Ciudad de México, Mexico, 2008. [Google Scholar]
  61. Zapata-Ríos, G. Dogs are more than wet kisses and tail wags: Domestic dogs as invasive species. Anim. Conserv. 2018, 21, 287–288. [Google Scholar] [CrossRef] [Scilit]
  62. Plaza, P.I.; Speziale, K.L.; Zamora-Nasca, L.B.; Lambertucci, A.S. Dogs and cats put wildlife at risk. J. Wildl. Manag. 2019, 83, 767–768. [Google Scholar] [CrossRef] [Scilit]
  63. Kowal, V.A.; Jones, S.M.; Keesing, F.; Allan, B.F.; Schieltz, J.M.; Chaplin-Kramer, R.A. Coupled forage-grazer model predicts viability of livestock production and wildlife habitat at the regional scale. Sci. Rep. 2019, 9, 19957. [Google Scholar] [CrossRef] [Scilit] [PubMed]
  64. Serna-Lagunes, R.; Olguín-Hernández, A.; Pérez-Sato, J.A.; García-García, C.G.; Casas-López, I.; Salazar-Ortiz, J. Venado veracruzano: (Odocoileus virginianus veraecrucis Goldman & Kellogg, 1940): Una opción para la ganadería diversificada y la conservación de ecosistemas. Agro Product. 2013, 6, 58–64. [Google Scholar]
  65. Newton, P.; Civita, N.; Frankel-Goldwater, L.; Bartel, K.; Johns, C. What is regenerative agriculture? A review of scholar and practitioner definitions based on processes and outcomes. Front. Sustain. Food Syst. 2020, 4, 577723. [Google Scholar] [CrossRef] [Scilit]
  66. Musálem-Santiago, M.A. Sistemas agrosilvopastoriles: Una alternativa de desarrollo rural sustentable para el trópico mexicano. Rev. Chapingo. Ser. Cienc. For. Ambiente 2002, 8, 91–100. [Google Scholar]
  67. Escribano, A.J. Organic livestock farming—Challenges, perspectives, and strategies to increase its contribution to the agrifood system’s sustainability—A review. In Organic Farming—A Promising Way of Food Production; Konvalina, P., Ed.; IntechOpen: London, UK, 2016; pp. 229–260. [Google Scholar] [CrossRef] [Scilit] [PubMed]
  68. LaCanne, C.E.; Lundgren, J.G. Regenerative agriculture: Merging farming and natural resource conservation profitably. PeerJ 2018, 6, e4428. [Google Scholar] [CrossRef] [Scilit] [PubMed]
  69. Binkley, D.; Duncan, S.L. The past and future of Colorado’s forests: Connecting people and ecology. Ecol. Soc. 2009, 14, 9. [Google Scholar] [CrossRef] [Scilit]
  70. De Bruijn, H.; Größler, A.; Videira, N. Antifragility as a design criterion for modelling dynamic systems. Syst. Res. Behav. Sci. 2020, 37, 23–37. [Google Scholar] [CrossRef] [Scilit]
Figure 1. Locations of free-living UMAs studied in the state of Veracruz, Mexico. The sizes of the buffer circles indicate an area 20-fold the area of each UMA. The main vegetation and land use types for Veracruz State are also indicated. (a) Location of the nine UMA-fl units (VER-01 to VER-09) throughout the territory of the state of Veracruz; (b) Location of two UMA-fl units in the northern zone of the state of Veracruz (UMA-03 and UMA-04); (c) Location of five UMA-fl units in the central zone of the state of Veracruz (UMA-01, UMA-02, UMA-07, UMA-08 and UMA-09); (d) Location of two UMA-fl units at the southern zone of the state of Veracruz (UMA-05 an UMA-06).
Sustainability 18 09852 g001
Figure 2. Conceptual process of integration of the Socioecosystemic Dynamics Index (SDI) and its application in the development of adaptive management strategies.
Sustainability 18 09852 g002
Figure 3. Relationship trends between the (a) partial ecological index (Iecol), (b) partial index of management (Iman) and (c) Socioecosystemic Dynamics Index (SDI) and the true diversity (1D) in nine free-living UMAs in the state of Veracruz, Mexico. The red line indicates the fit of the mean value of true diversity of order 1 (1 D ¯ ) for the sample and the minimum desirable value estimated for each index. The dashed lines indicate the confidence interval at 84%.
Sustainability 18 09852 g003
Table 1. Units of Management for the Conservation and Sustainable Use of Wildlife (UMAs) selected for monitoring wildlife in the state of Veracruz, Mexico, and their main environmental and administrative characteristics.
ID
UMA
MunicipalityModality aLand Tenure bManagement Type cArea (ha)Vegetation Type dWater Bodies e
Nat.Art.
VER-01Soledad de DobladoFLPEx890TLDF-TMF-A-IP1240
VER-02TenampaFLPEx640TLDF-OF55
VER-03PanucoFLPEx450TLDF-IP07
VER-04El HigoFLPEx282TLDF-IP-A07
VER-05CatemacoFL, IPEx, NEx160TMCF-TMF600
VER-06CatemacoFLEEx, NEx300THEF150
VER-07ActopanFLPEx765TLDF-IP-A200
VER-08NautlaFL, IPEx, NEx65TMSEF-M10
VER-09Alto LuceroFLPEx259TLDF-TF50
a Modality: FL = free-living, I = intensive; b Land tenure: E = ejido, P = private; c Management type: Ex = extractive use, NEx = non-extractive use; d Vegetation type: A = agricultural zone, OF = oak forest, TMCF = tropical montane cloud forest, TF = temperate forest, M = mangrove, IP = induced pasture, THEF = tropical high evergreen forest, TLDF = tropical low deciduous forest, TMF = tropical medium forest, TMSEF = tropical medium sub-evergreen forest; e Water bodies: Nat. = natural, Art. = artificial.
Table 2. True diversity observed in each UMA based on the Hill numbers for the communities of mesocarnivores, interacting species and the community of fauna in general.
LevelUMATrue Diversity aEff bSC cAccI d
0D1D2D
MesocarnivoresVER-0151.821.364800.9341
VER-0262.791.944590.9757
VER-0341.491.217241117
VER-0443.223.03556141
VER-0562.751.983760.9757
VER-0674.743.674720.9538
VER-0783.62.3215100.9763
VER-0821.291.15348142
VER-0973.182.356540.99101
Interacting
species
VER-01209.146.194800.98224
VER-023011.367.414590.96317
VER-03115.23.877240.99256
VER-04227.115.285560.98404
VER-05105.233.53760.9462
VER-06115.634.174720.99227
VER-07133.231.9515100.99467
VER-0894.262.643480.9993
VER-0952.11.636540.99268
General communityVER-012510.957.514800.97265
VER-023614.069.184590.96374
VER-03156.544.937240.99373
VER-04268.996.295560.98445
VER-05167.685.163760.95119
VER-06188.285.514720.98265
VER-07214.712.4715100.99530
VER-08115.473.793480.99135
VER-09124.22.816540.99369
True diversity a: 0D = Species richness, 1D = Exp. Shannon diversity, 2D = Inv. Simpson diversity; Eff b = sampling effort in days/camera; SC c = sample coverage: proportion of sampling completeness; AccI d = Accumulated incidences: sum of independent captures of all species within the level.
Table 3. Complexity values for the networks of ecological interactions of the fauna in nine free-living UMAs in the state of Veracruz, Mexico.
UMAH’2 aNiche OverlapCo-OccurrenceNRob b
VER-010.540.220.120.86
VER-020.430.180.090.87
VER-030.420.270.120.89
VER-040.250.380.170.83
VER-050.610.290.150.77
VER-060.280.230.130.89
VER-070.320.230.120.88
VER-080.510.440.270.84
VER-090.230.320.170.87
H’2 a = Index of specialization; NRob b = Network robustness.
Table 4. Species of importance in the ecological interaction networks of fauna in nine free-living UMAs in the state of Veracruz, Mexico.
UMASpeciesImportance
(Species Strength) a
VER-01Bos spp.2.88
VER-02Odocoileus virginianus3.50
Nasua narica1.23
Dasypus novemcinctus1.11
VER-03Bos spp.2.21
Dasypus novemcinctus1.77
Sylvilagus floridanus1.35
Odocoileus virginianus1.29
VER-04Odocoileus virginianus3.50
Nasua narica2.97
Bos spp.1.24
VER-05Dasypus novemcinctus2.75
VER-06Dasyprocta mexicana2.46
Cuniculus paca1.32
Dasypus novemcinctus1.19
VER-07Bos spp.3.93
Urocyon cinereoargenteus1.42
Odocoileus virginianus1.32
VER-08Procyon lotor1.17
VER-09Cuniculus paca2.33
a The order of importance is quantified as a function of the importance or “species strength” within the interaction dynamic of the network. Only the species with importance values greater than 1 are shown.
Table 5. Socioecosystemic Dynamics Index (SDI), partial ecological index (Iecol) and partial index of management (Iman) estimated for nine free-living UMAs in the state of Veracruz, Mexico.
UMAIecolImanSDI
VER-010.5370.4090.946
VER-020.5910.5391.130
VER-030.4390.4830.922
VER-040.5320.3790.911
VER-050.5230.4280.952
VER-060.5240.5151.039
VER-070.4040.5900.994
VER-080.4010.5640.964
VER-090.4280.4190.846
Disclaimer/Publisher’s Note: The statements, opinions and data contained in all publications are solely those of the individual author(s) and contributor(s) and not of MDPI and/or the editor(s). MDPI and/or the editor(s) disclaim responsibility for any injury to people or property resulting from any ideas, methods, instructions or products referred to in the content.