Article

An Evidence-Informed Framework for Practice-Oriented Geographical Fieldwork Education: Lessons from Environmental Analysis and Resource Assessment of China’s Eight Major Deserts
1
School of Geography and Tourism, Shaanxi Normal University, Xi’an 710119, China
2
China Meteorological Administration Eco-Environment and Meteorology for the Qinling Mountains and Loess Plateau Key Laboratory, Shaanxi Meteorological Bureau, Xi’an 710014, China
3
Qilian Mountains Glacier, Frozen Soil and Ecohydrology Research Station, State Key Laboratory of Cryospheric Science and Frozen Soil Engineering, Northwest Institute of Eco-Environment and Resources, Chinese Academy of Sciences, Lanzhou 730000, China
4
Qilian Mountains Field Research Station for Interactions Among Cryosphere and Multi-Spheres, China Meteorological Administration, Lanzhou 730000, China
5
University of Chinese Academy of Sciences, Beijing 100049, China
*
Author to whom correspondence should be addressed.
Sustainability 2026, 18(17), 9142; https://doi.org/10.3390/su18179142
Submission received: 22 July 2026 / Revised: 3 September 2026 / Accepted: 4 September 2026 / Published: 6 September 2026

Abstract

Drawing on ERA5 reanalysis data for 2005–2025, this study examines long-term environmental change across China’s eight major deserts and on this basis develops a data-informed framework for integrating geoscientific evidence into geographical fieldwork education. Temperature change, surface radiation and vertical soil moisture profiles are used to construct inquiry tasks on regional warming, land–atmosphere interactions and dryland hydrology. A four-dimensional resource assessment integrating solar resource abundance, thermal stability, soil moisture support and wind exposure stability is then applied using multi-criteria decision analysis (MCDA) to compare relative resource characteristics and ecological constraints across desert regions. The contrasting resource profiles of the Taklimakan, Tengger, and Kubuqi Deserts provide the basis for a scenario-based decision-making activity incorporating equal-weight, energy-priority, and ecology-priority perspectives on renewable energy development and ecological protection. Rather than treating deserts as static landscapes, the proposed framework positions them as dynamic coupled human–environment systems and is designed to engage students in interpreting long-term datasets, comparing regional processes and evaluating sustainability trade-offs. The study illustrates how environmental datasets can be organised into fieldwork questions, analytical tasks and decision scenarios, offering an adaptable framework in which quantitative reasoning, systems thinking and evidence-based sustainability learning are specified as intended educational outcomes in higher geographical education.

1. Introduction

Drylands are coupled human–environment systems shaped by interactions among climate change, land use, and socioeconomic development. Their ecological trajectories reflect climate, water availability, vegetation feedbacks, and human activities, making single indicators insufficient for explaining risk and development pathways [1,2,3]. Across northern China’s drylands, desertification control, oasis agriculture, ecological restoration, and renewable energy development coexist, creating trade-offs among ecological improvement, water constraints, and land-use transitions [4]. Photovoltaic infrastructure has become an important component of these interactions. Combining solar energy with agriculture or natural vegetation may create synergies but can also involve management, ecological, and spatial trade-offs [5,6]. China’s deserts provide natural geographical units for examining climate and land-surface processes and place-based contexts for considering resource development, ecological protection, and sustainable governance. These overlapping environmental and development processes also make drylands suitable for examining how scientific evidence can inform decisions involving competing resource-use and conservation priorities.
Geographical fieldwork connects abstract concepts and spatial evidence with specific places, allowing learners to observe processes, compare scales, and critically evaluate explanations. Its educational value depends on task design, prior knowledge, and assessment rather than on field exposure alone [7,8]. Contemporary geographical education emphasises inquiry-driven fieldwork and continuity among pre-field preparation, field observations, and post-field reflection [9,10]. Geographic information systems, location-based data, and multi-source environmental datasets have expanded opportunities to obtain, map, and interpret spatial evidence. The increasing availability of long-term geospatial and reanalysis datasets further extends the scope of field-based inquiry beyond conditions observable during a single visit. Such datasets can provide temporal context for local observations and support comparison between site-level evidence and broader regional patterns. This is particularly relevant in dryland environments, where climatic variability, water constraints, ecological restoration, and resource development operate simultaneously across different spatial and temporal scales. Effective data-supported inquiry requires explicit questions, appropriate scaffolding, and assessable evidence products [11,12]. This approach is consistent with the systems thinking, normative judgement, strategic thinking, and integrated problem solving emphasised in education for sustainable development [13,14]. A temporal and spatial discontinuity remains between short field visits and long-term environmental evidence. One or several visits can document contemporary landforms, surface materials, vegetation, soils, infrastructure, and human disturbance, but they cannot directly observe multi-decadal changes in temperature, radiation, or soil moisture. ERA5 and other reanalysis datasets provide continuous and physically consistent regional time series [15], yet they cannot replace direct observation of dune–oasis transitions, local topography, land use, and engineered structures. Virtual field guides and immersive experiences can support site preparation, cross-scale representation, and selected learning tasks, while extending access when physical access is constrained [16,17]. These approaches do not provide a systematic mechanism for linking long-term environmental analyses with pre-field questions, observable or measurable field evidence, post-field scale comparisons, and sustainability-oriented decision tasks. Long-term datasets and direct field observations have complementary rather than interchangeable roles. Their integration requires explicit attention to differences in spatial scale, temporal representativeness, and uncertainty. The key methodological and pedagogical challenge is how evidence at different spatial and temporal scales can assume complementary roles and jointly support geographical interpretation.
China’s eight major deserts provide a contrasting regional context for developing this integration framework. The Taklimakan, Gurbantunggut, Kumtag, Qaidam Basin, Badain Jaran, Tengger, Ulan Buh, and Kubuqi Deserts span a pronounced east–west aridity gradient. They differ in elevation, surface radiation, soil moisture, wind exposure, and vegetation. These environmental contrasts intersect with large-scale land management and ecological restoration, water-resource constraints, and photovoltaic development [18,19,20]. The study area provides multiple comparative cases for examining why similar resource objectives may lead to different planning priorities under different environmental constraints. A multidimensional comparison is particularly relevant because favourable conditions in one resource dimension do not necessarily correspond to favourable conditions in others. This provides a rationale for using MCDA to make indicator normalisation, weighting assumptions, and alternative decision priorities explicit while interpreting the resulting scores as relative comparisons rather than absolute measures of development suitability.
This study comprised three interrelated components based on fixed boundaries for the eight deserts and ERA5 reanalysis data. These components correspond to three explicit study objectives. First, it quantified regional differences and monotonic trends in temperature and surface radiation during 2005–2025 and in layered soil moisture during 2015–2025. Second, it developed a transparent four-dimensional assessment of solar resource abundance, thermal stability, soil moisture support, and wind exposure stability. Multi-criteria decision analysis (MCDA) was used to make the effects of normalisation, weighting, and decision priorities on relative rankings explicit [21]. Third, the environmental evidence provided the empirical basis for a staged geographical fieldwork framework comprising data inquiry before fieldwork, field observations and measurements, evidence integration after fieldwork, and decision making for sustainability.

2. Materials and Methods

2.1. Study Area and Data

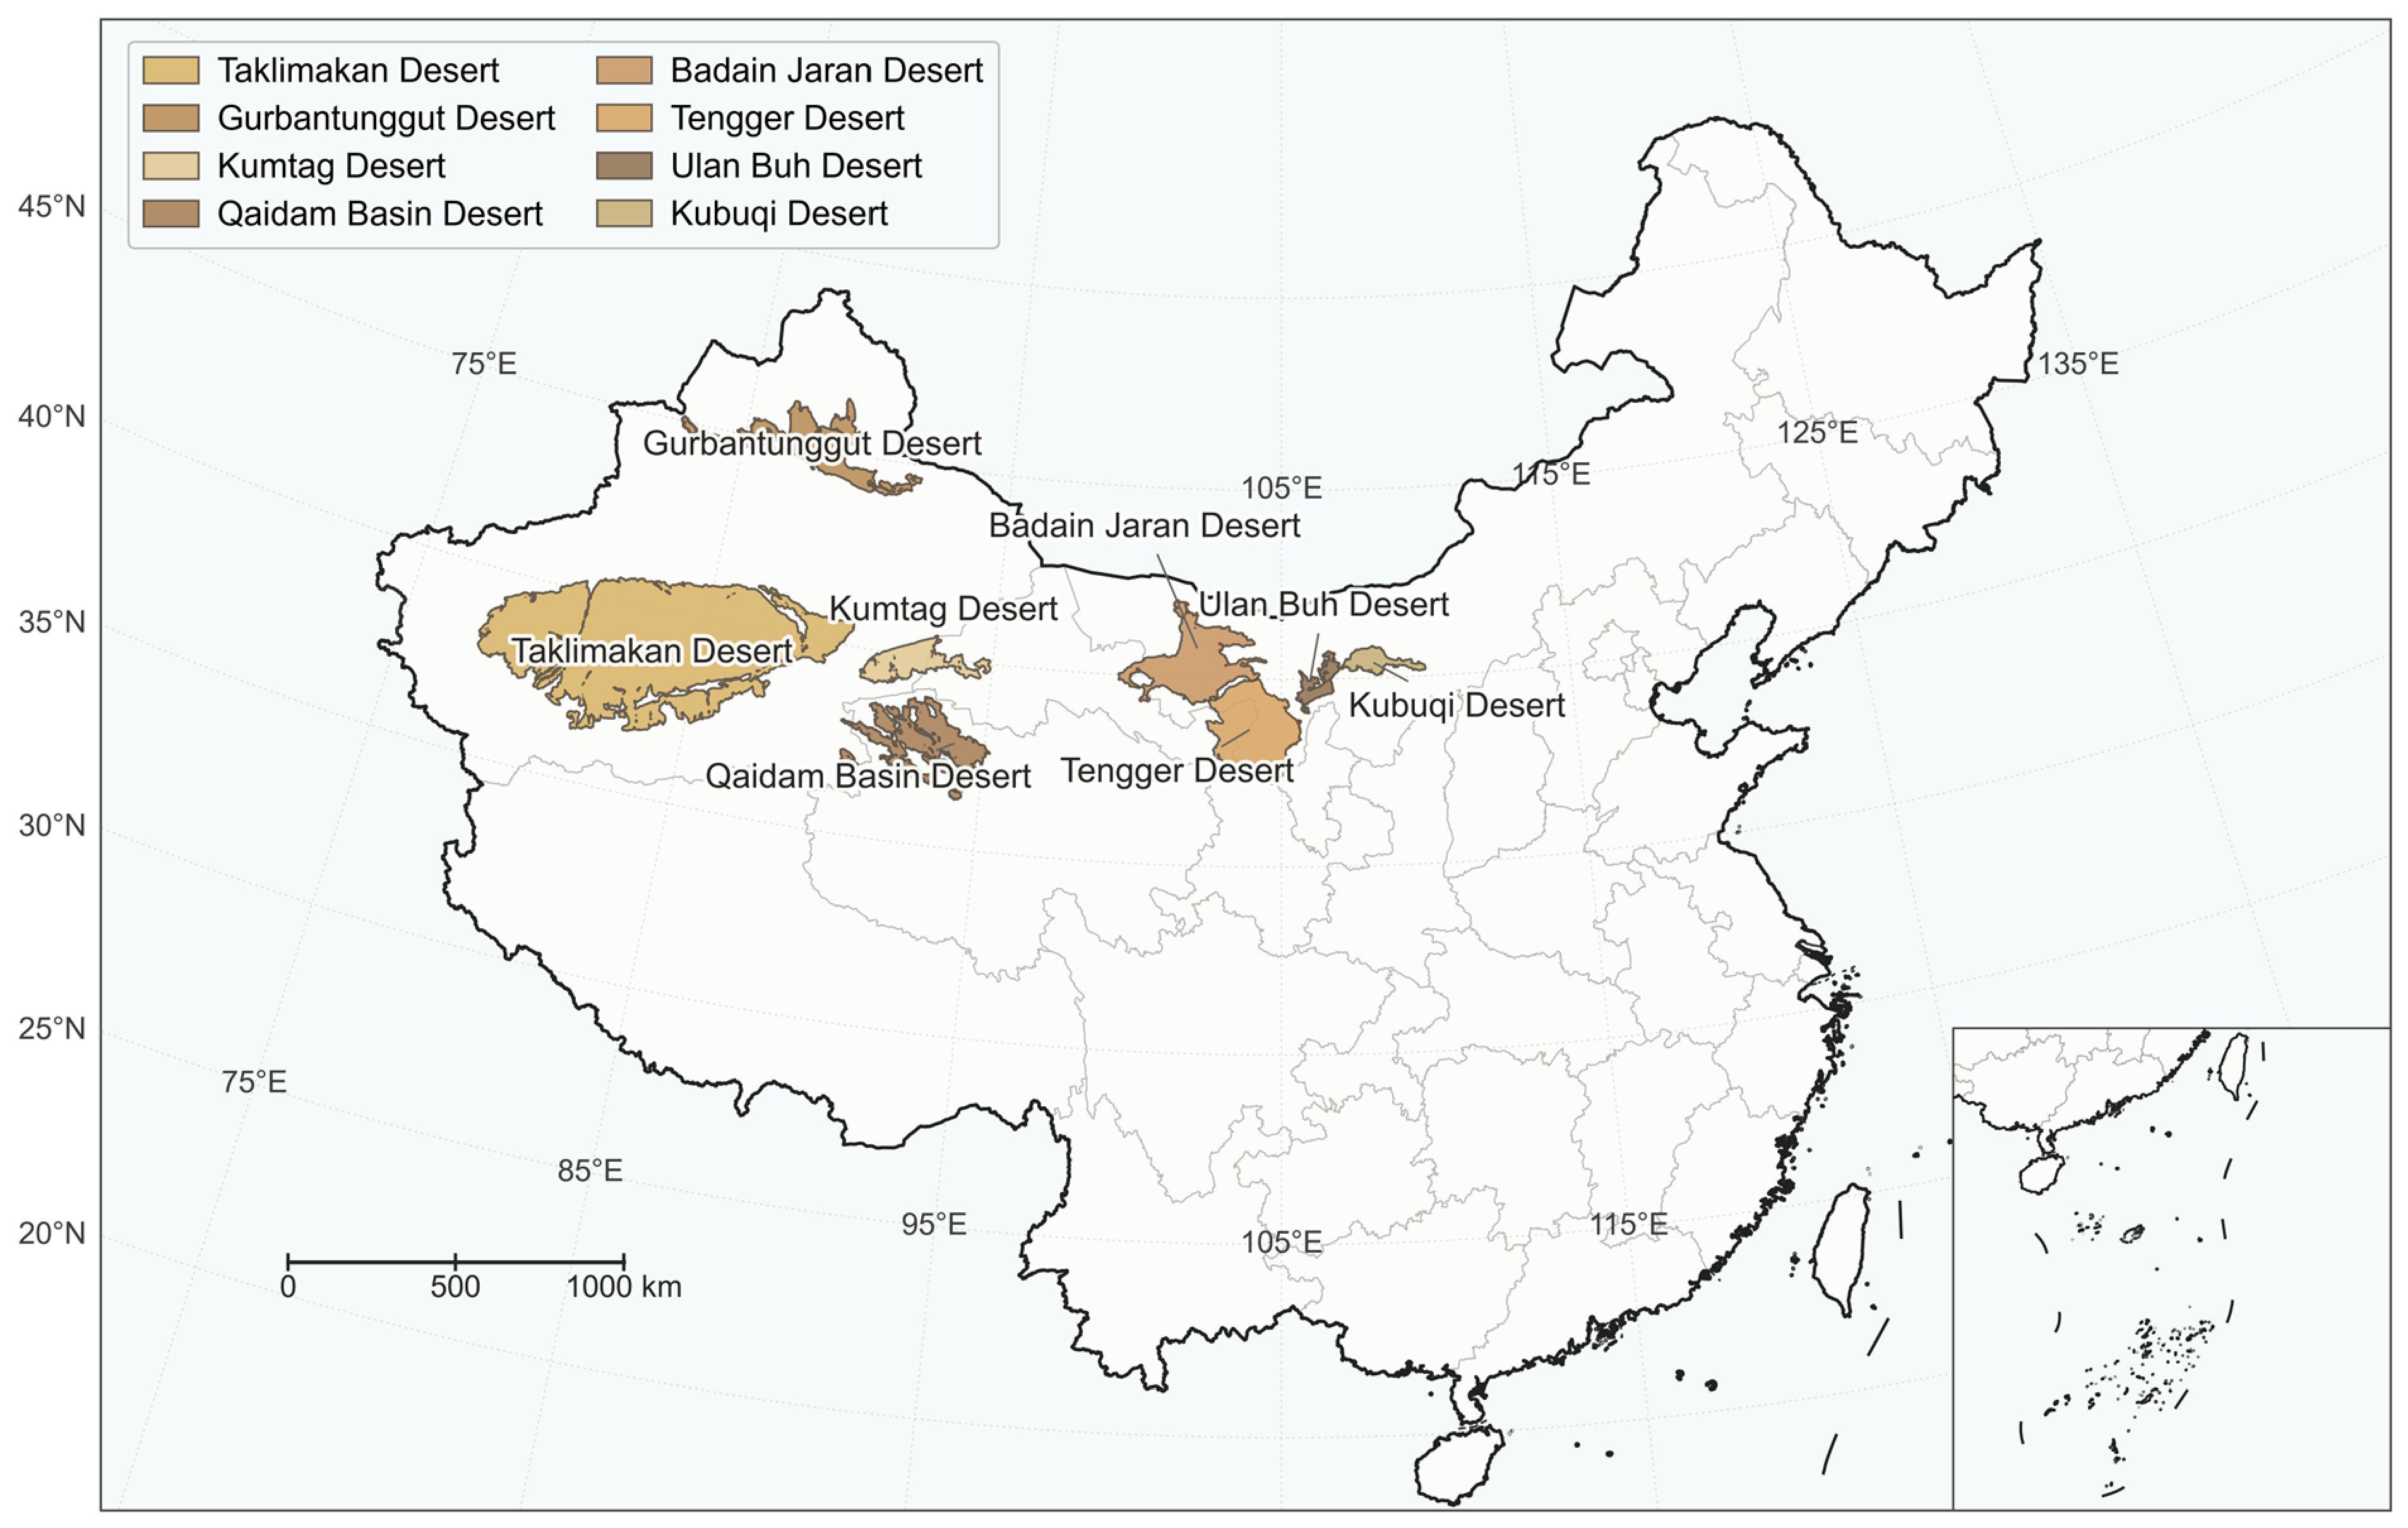
The study focused on eight major deserts in China: the Taklimakan, Gurbantunggut, Kumtag, Qaidam Basin, Badain Jaran, Tengger, Ulan Buh, and Kubuqi Deserts (Figure 1). These deserts span the arid and semi-arid regions of northwestern and northern China and encompass substantial gradients in climate, elevation, surface conditions, soil moisture, vegetation cover, and aeolian activity. These contrasting environmental characteristics provide a suitable regional basis for comparing long-term environmental variability and resource conditions across representative desert systems.
Desert boundaries were derived from the China 1:100,000 Desert (Sandy Land) Distribution Dataset provided by the National Cryosphere Desert Data Center [22]. The extracted vector boundaries of the eight deserts were used as fixed spatial units for subsequent spatial aggregation and regional analysis. Environmental data for 2005–2025 were obtained primarily from the ERA5 reanalysis produced by the European Centre for Medium-Range Weather Forecasts (ECMWF). The dataset provided the atmospheric and land-surface variables required for the analysis of temperature, surface radiation, soil moisture, and near-surface wind conditions. Detailed information on the variables, temporal and spatial resolutions, units, and data sources is provided in Supplementary Table S1.

2.2. Environmental Data Processing and Assessment

Desert-scale environmental variables were derived using polygon area weighting based on the actual intersection between ERA5 grid cells and desert boundaries. The area weighting and regional aggregation followed the grid polygon intersection approach described by Thapa et al. [23]. Monthly temperature, radiation, and soil moisture data were aggregated to annual values. Hourly 10 m wind speed was calculated from the ERA5 u10 and v10 components following Sun et al. [24]. Temperature and radiation analyses covered 2005 to 2025, soil moisture analyses covered 2015 to 2025, and wind data used for resource assessment covered 2005 to 2025. Temporal trends were evaluated using the Theil-Sen estimator and the Mann–Kendall test following Xu et al. [25]. Trend uncertainty was assessed using 95% confidence intervals, with moving block bootstrap analysis used to examine the robustness of temperature and radiation trends following Lolli et al. [26]. Surface shortwave albedo was calculated from surface net solar radiation and surface solar radiation downwards using the formulation applied by Correa et al. [27]. Vertical soil moisture conditions were assessed from ERA5 Layers 1 to 4 and the difference between Layer 4 and Layer 1. The latter was defined as a study-specific indicator of vertical soil moisture contrast.
Resource characteristics were assessed across four dimensions: solar resource abundance, thermal stability, soil moisture support, and wind exposure stability. Indicators were normalised to a common scale using the Min-Max procedures for benefit and constraint criteria described by Elavarasan et al. [28]. Composite scores were calculated using weighted linear aggregation following the MCDA approach of Oakleaf et al. [29]. Equal-weight, energy-priority, and ecology-priority scenarios were used to examine the sensitivity of the results to alternative weighting preferences. Detailed indicator definitions, calculation procedures, preference directions, normalisation rules, and scenario weights are provided in Table S2. Sensitivity was evaluated using composite score variation, rank changes, and Spearman rank correlation. The assessment represents relative resource characteristics among the eight deserts and does not constitute an engineering suitability assessment. All data processing, spatial analysis, statistical analyses, and figure preparation were performed using Python 3.12.14 and the associated open-source scientific computing packages.

2.3. Resource Assessment and Fieldwork Framework Development

The activity design followed constructive alignment [30] and the principles of geographical inquiry and fieldwork [10,11]. The sequence comprised data inquiry before fieldwork, observation and feasible measurement at desert sites, evidence integration after fieldwork, and decision making for sustainability. Before fieldwork, learners would interpret the environmental and resource results, identify contrasting desert cases, formulate inquiry questions, and prepare observation plans. Field activities would focus on landforms, surface materials, vegetation, soil and moisture conditions, aeolian features, ecological restoration, renewable energy infrastructure, water constraints, land use, and human–environment relationships. After fieldwork, learners would compare field evidence with regional environmental data and examine differences in spatial scale, temporal representation, and uncertainty. Alternative MCDA scenarios would support comparison of resource use and environmental protection priorities.
The intended learning outcomes include environmental data literacy, spatial reasoning, systems thinking, integration of regional data and field evidence, interpretation of uncertainty, and decision making for sustainability. The proposed assessment evidence includes annotated maps, georeferenced field records, data and field comparison reports, MCDA worksheets, and decision reports supported by evidence. Detailed relationships among environmental evidence, fieldwork activities, intended learning outcomes, and assessment evidence are provided in Table S3.

3. Results

3.1. Environmental Change Across China’s Eight Major Deserts

3.1.1. Temperature

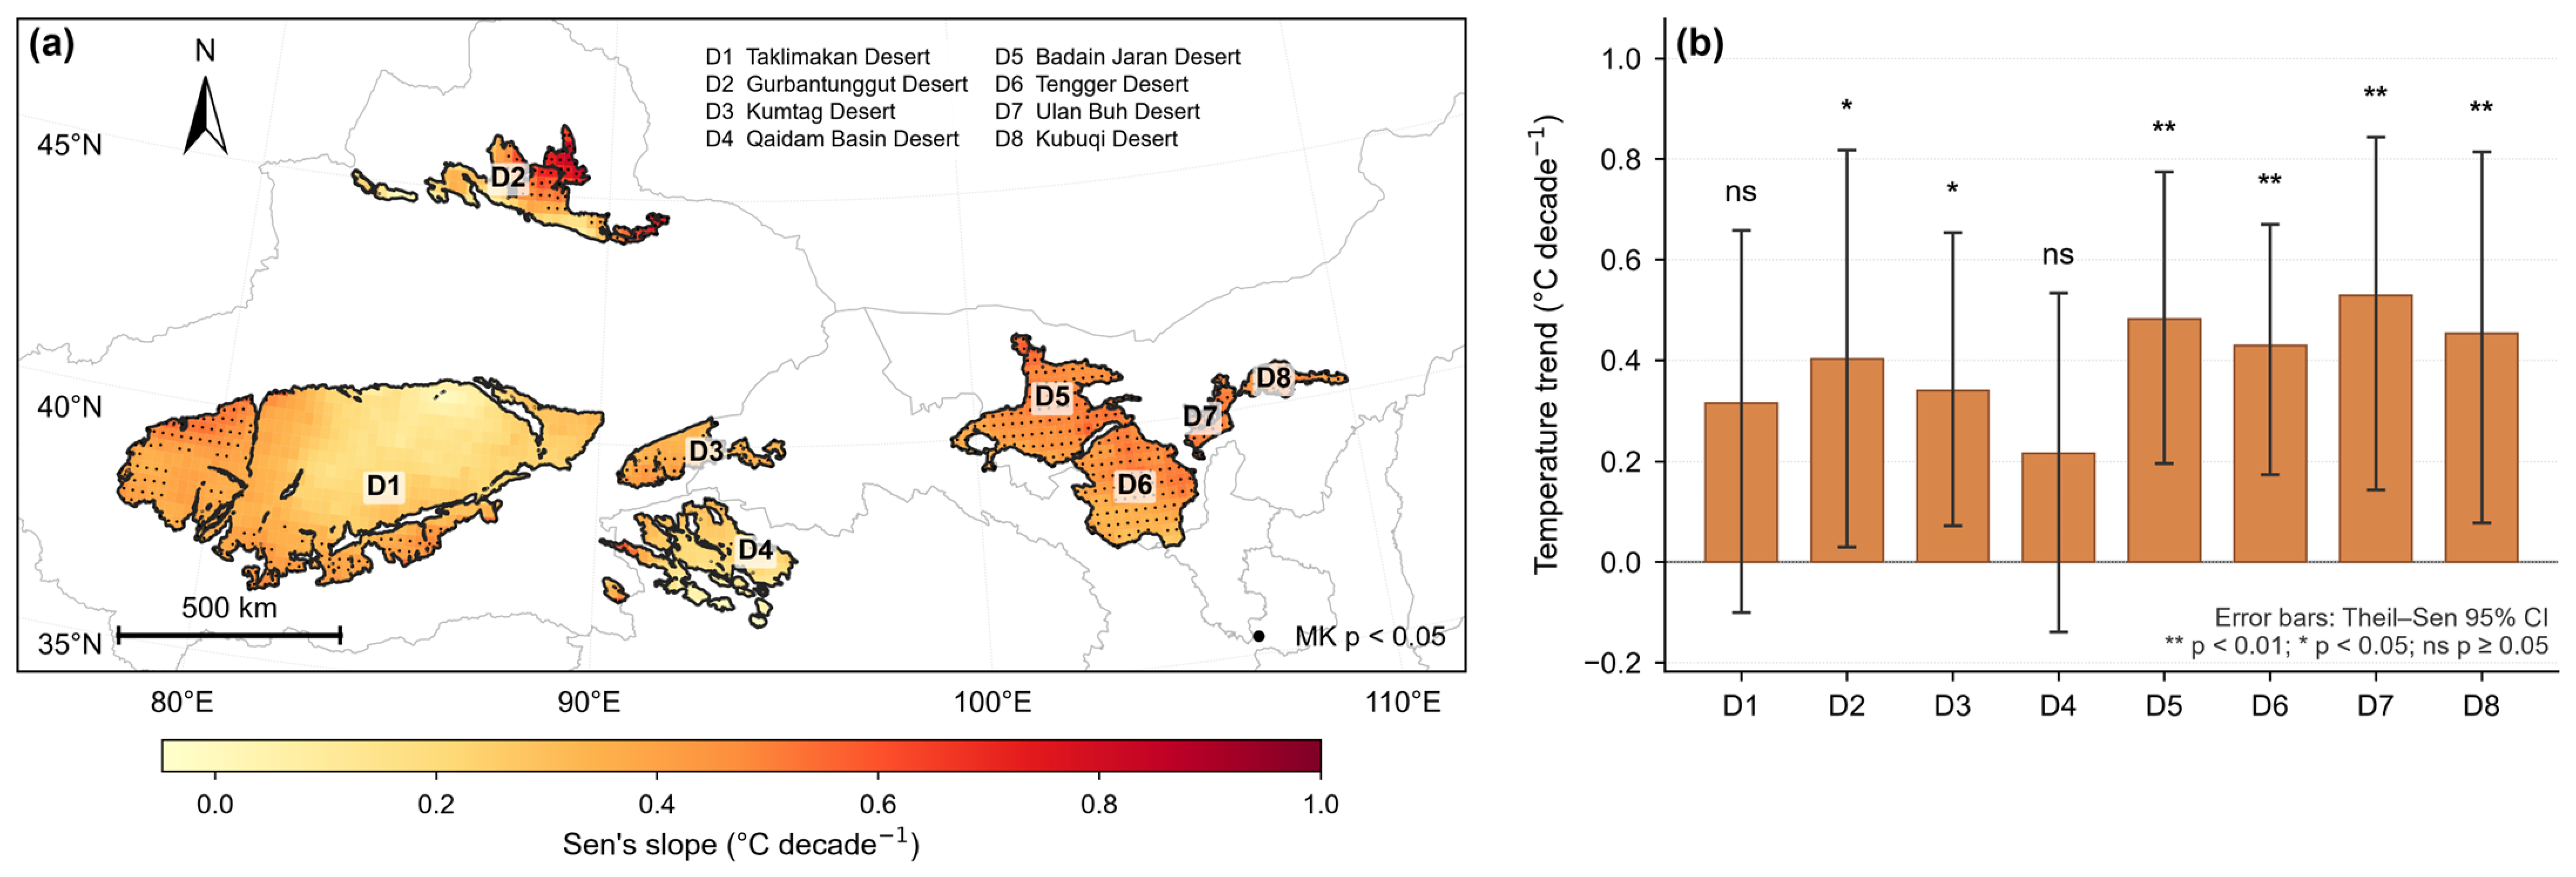
During 2005–2025, annual mean 2 m air temperature differed markedly among the eight deserts. The Taklimakan Desert had the highest mean temperature (13.27 °C), whereas the Qaidam Basin Desert had the lowest (4.17 °C). Sen’s slopes were positive in every desert and ranged from 0.22 to 0.53 °C decade−1. The fastest warming rate occurred in the Ulan Buh Desert (0.53 °C decade−1), followed by the Badain Jaran (0.48 °C decade−1), Kubuqi (0.45 °C decade−1), and Tengger Deserts (0.43 °C decade−1) (Figure 2). Mann–Kendall tests indicated statistically significant warming in the Gurbantunggut and Kumtag Deserts (p < 0.05). Warming in the Badain Jaran, Tengger, Ulan Buh, and Kubuqi Deserts was significant at p < 0.01. The Sen’s slope for the Ulan Buh Desert was 0.53 °C decade−1, with a 95% confidence interval of 0.14–0.84 °C decade−1. Confidence intervals for the Badain Jaran, Tengger, and Kubuqi Deserts also excluded zero. The Taklimakan and Qaidam Basin Deserts showed positive slopes, but their trends were not statistically significant (p ≥ 0.05), and both confidence intervals included zero. Grid cells with significant warming occurred mainly in parts of the Gurbantunggut Desert and across the four eastern deserts. Trends within the Taklimakan and Qaidam Basin Deserts showed greater spatial heterogeneity.
The results show that recent warming differed in magnitude and statistical significance among China’s major desert systems. Previous studies have reported pronounced responses of dryland regions to regional and global climate warming. Local temperature change can also be influenced by large-scale atmospheric circulation, land–atmosphere interactions, and local environmental conditions [2,3]. Latitude, elevation, continentality, and surface properties may contribute to the observed differences among deserts. The present analysis does not identify the contribution of individual drivers. The Qaidam Basin Desert had a positive temperature trend that was not statistically significant despite its high elevation. Global assessments show substantial regional and seasonal variation in elevation-dependent warming [31].

3.1.2. Surface Radiation and Shortwave Albedo

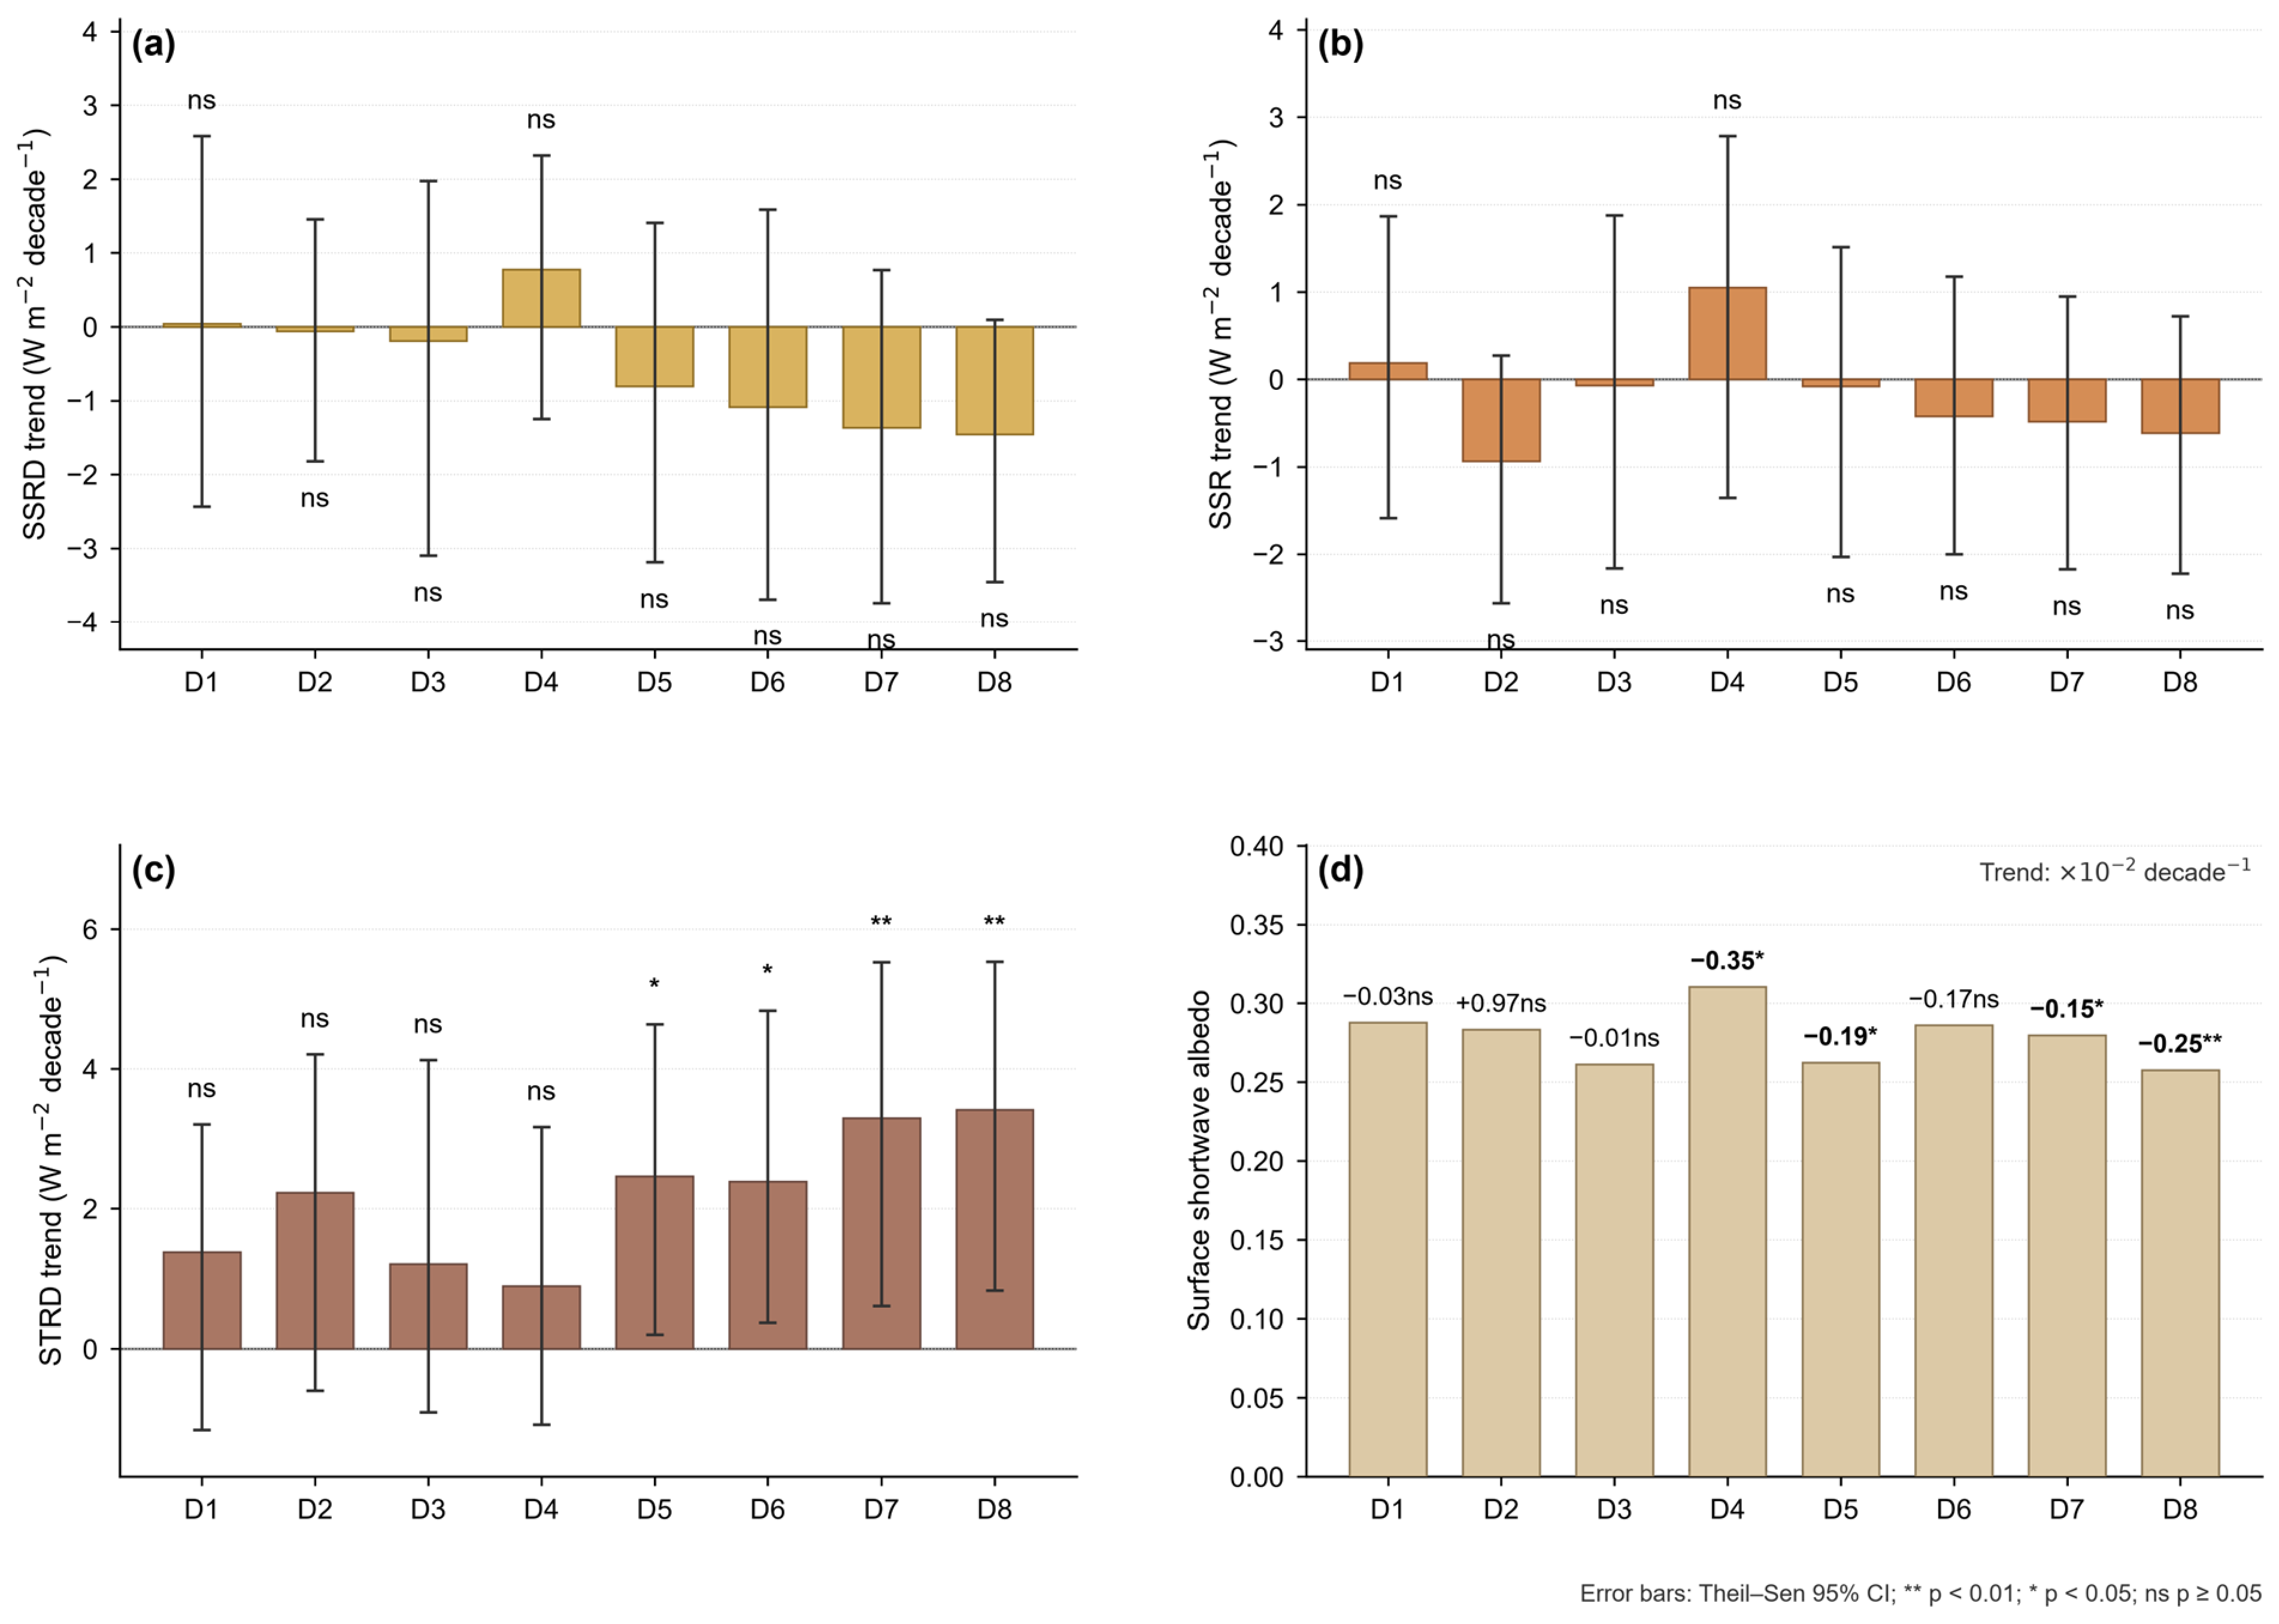
Surface radiative conditions differed substantially among the eight deserts from 2005 to 2025. Multiyear mean surface solar radiation downwards (SSRD) ranged from 190.59 to 232.80 W m−2. The highest value occurred in the Qaidam Basin Desert and the lowest in the Gurbantunggut Desert. Multiyear mean surface net solar radiation (SSR) ranged from 140.79 to 164.36 W m−2. The Kumtag Desert had the highest value and the Gurbantunggut Desert had the lowest. Sen’s slopes for SSRD and SSR varied in direction among deserts. None of these trends were statistically significant (p ≥ 0.05), and all corresponding 95% confidence intervals included zero (Figure 3a,b). The eight deserts showed no consistent statistically significant monotonic trend in the shortwave radiation components during the study period.
Multiyear mean surface thermal radiation downwards (STRD), representing downward longwave radiation, ranged from 234.83 to 287.36 W m−2. The Taklimakan Desert had the highest value and the Qaidam Basin Desert had the lowest. STRD had a positive Sen’s slope in all eight deserts. Significant increases of 2.46, 2.39, 3.29, and 3.42 W m−2 decade−1 occurred in the Badain Jaran, Tengger, Ulan Buh, and Kubuqi Deserts, respectively. The trends in the Badain Jaran and Tengger Deserts were significant at p < 0.05. The trends in the Ulan Buh and Kubuqi Deserts were significant at p < 0.01 (Figure 3c). STRD trends in the other four deserts were not statistically significant. Multiyear mean surface shortwave albedo ranged from 0.258 to 0.310. The Qaidam Basin Desert had the highest value and the Kubuqi Desert had the lowest. Significant decreases of 0.0035, 0.0019, 0.0015, and 0.0025 decade−1 occurred in the Qaidam Basin, Badain Jaran, Ulan Buh, and Kubuqi Deserts, respectively. The trend in the Kubuqi Desert was significant at p < 0.01. The trends in the Qaidam Basin, Badain Jaran, and Ulan Buh Deserts were significant at p < 0.05 (Figure 3d). Albedo trends in the Taklimakan, Gurbantunggut, Kumtag, and Tengger Deserts were not statistically significant. The radiative variables showed different temporal responses. Surface albedo can be affected by vegetation cover, bare ground fraction, soil moisture, snow cover, dust deposition, and land use. Vegetation change can also modify albedo, evapotranspiration, and atmospheric feedbacks [32,33].

3.1.3. Layered Soil Moisture

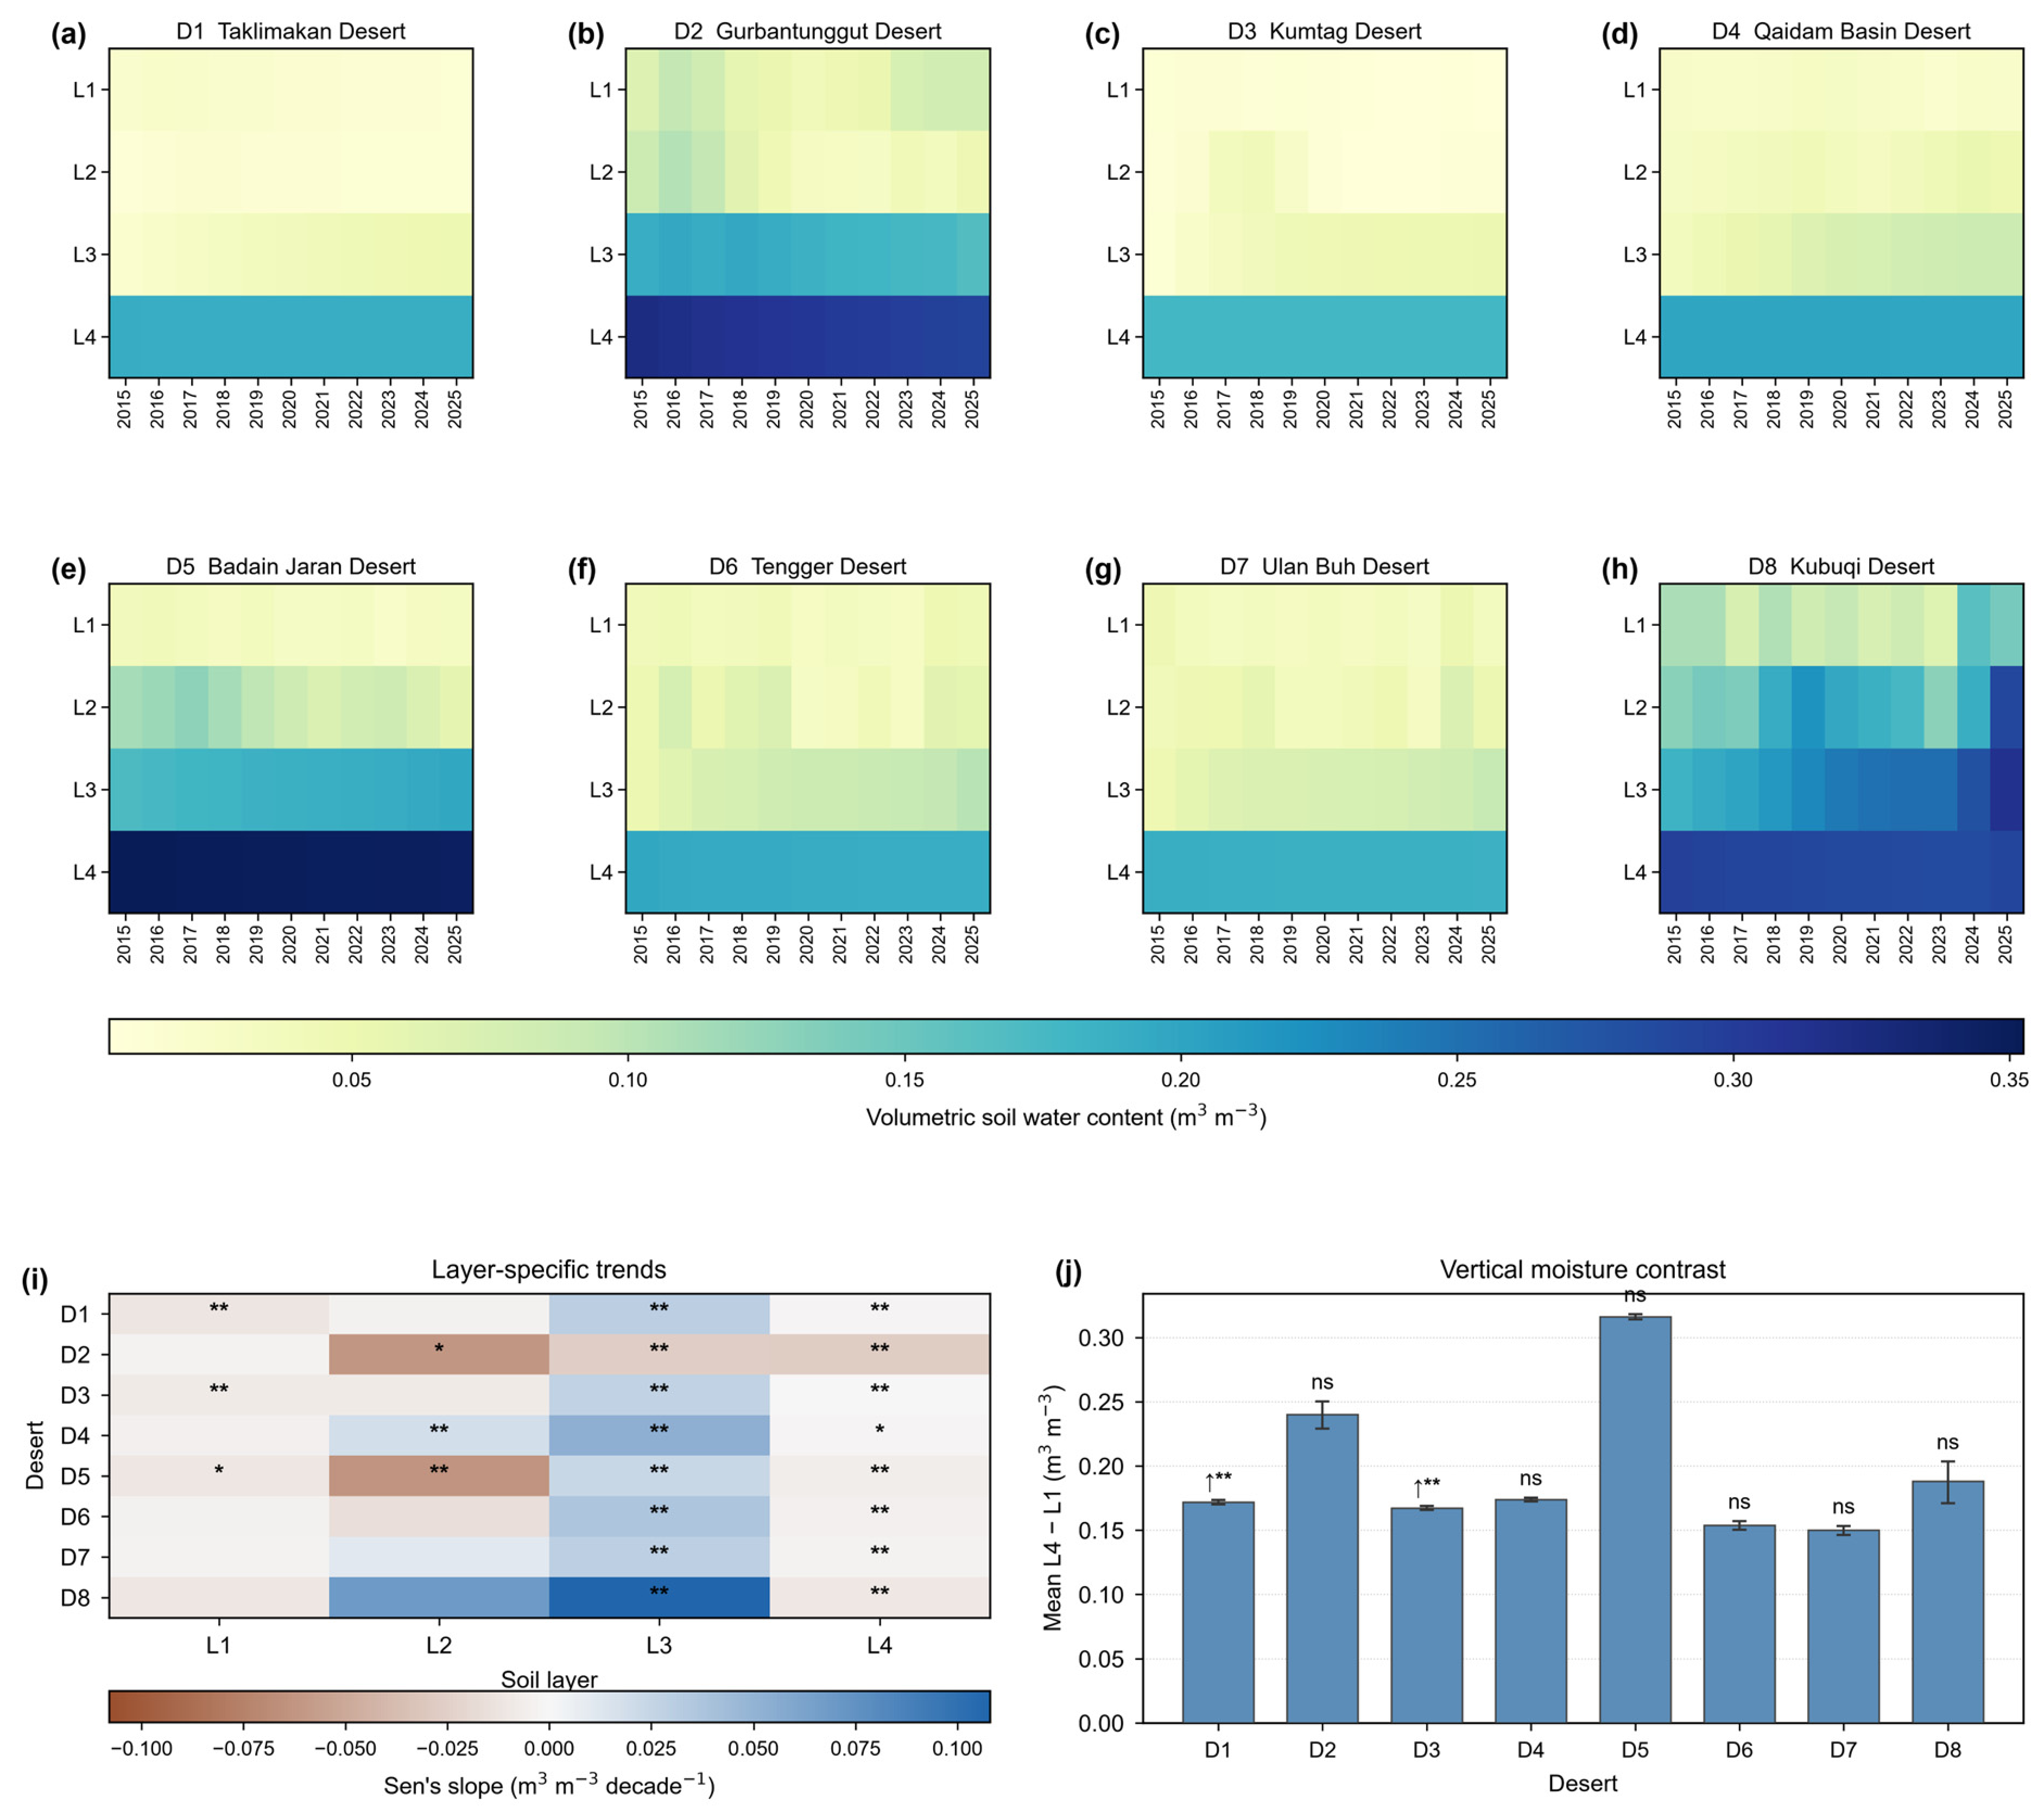
Volumetric soil water content showed clear vertical stratification across all eight deserts from 2015 to 2025 (Figure 4a–h). The magnitude of the differences among layers and their interannual variability differed among deserts. Multiyear mean soil moisture in Layer 4 (100–289 cm) exceeded that in Layer 1 (0–7 cm) in every desert. The mean difference between Layer 4 and Layer 1 ranged from 0.150 to 0.316 m3 m−3. The Badain Jaran Desert had the largest difference at 0.316 m3 m−3, followed by the Gurbantunggut Desert at 0.240 m3 m−3. The Ulan Buh and Tengger Deserts had smaller differences of 0.150 and 0.154 m3 m−3, respectively. Trend directions were not consistent among soil layers (Figure 4i). Layer 3 moisture (28–100 cm) increased significantly in the Taklimakan, Kumtag, Qaidam Basin, Badain Jaran, Tengger, Ulan Buh, and Kubuqi Deserts (p < 0.01), with Sen’s slopes of 0.023–0.108 m3 m−3 decade−1. It decreased significantly in the Gurbantunggut Desert (−0.026 m3 m−3 decade−1, p < 0.01). Layer 4 declined in all eight deserts, with p < 0.05 in the Qaidam Basin Desert and p < 0.01 elsewhere. Layer 1 declined significantly only in the Taklimakan, Kumtag, and Badain Jaran Deserts. For Layer 2, significant declines occurred in the Gurbantunggut and Badain Jaran Deserts, a significant increase occurred in the Qaidam Basin Desert, and the remaining trends were not statistically significant. Trends in the Layer 4 minus Layer 1 difference showed that vertical contrasts increased significantly in the Taklimakan and Kumtag Deserts, at 0.0093 and 0.0082 m3 m−3 decade−1, respectively (p < 0.01) (Figure 4j). Trends in the other six deserts were not statistically significant. Overall vertical stratification and temporal changes in that stratification therefore represent distinct results.
Soil moisture influences plant productivity, community composition, and ecological drought [34]. Water stored at different depths may have different implications for rooting strategies and ecosystem responses [34]. ERA5 Layer 4 soil moisture cannot be interpreted directly as groundwater recharge or plant-available water. Reanalysis soil moisture combines land surface modelling and data assimilation, and its performance varies with climate region, soil depth, and validation scale. Evaluations using extensive sensor networks have identified substantial spatial variation in the performance of soil moisture products [35]. Ecological restoration has been associated with vegetation greening in parts of China’s drylands, and increasing pressure on regional water resources has also been reported [4].

3.2. Resource Assessment for Geographical Fieldwork Education

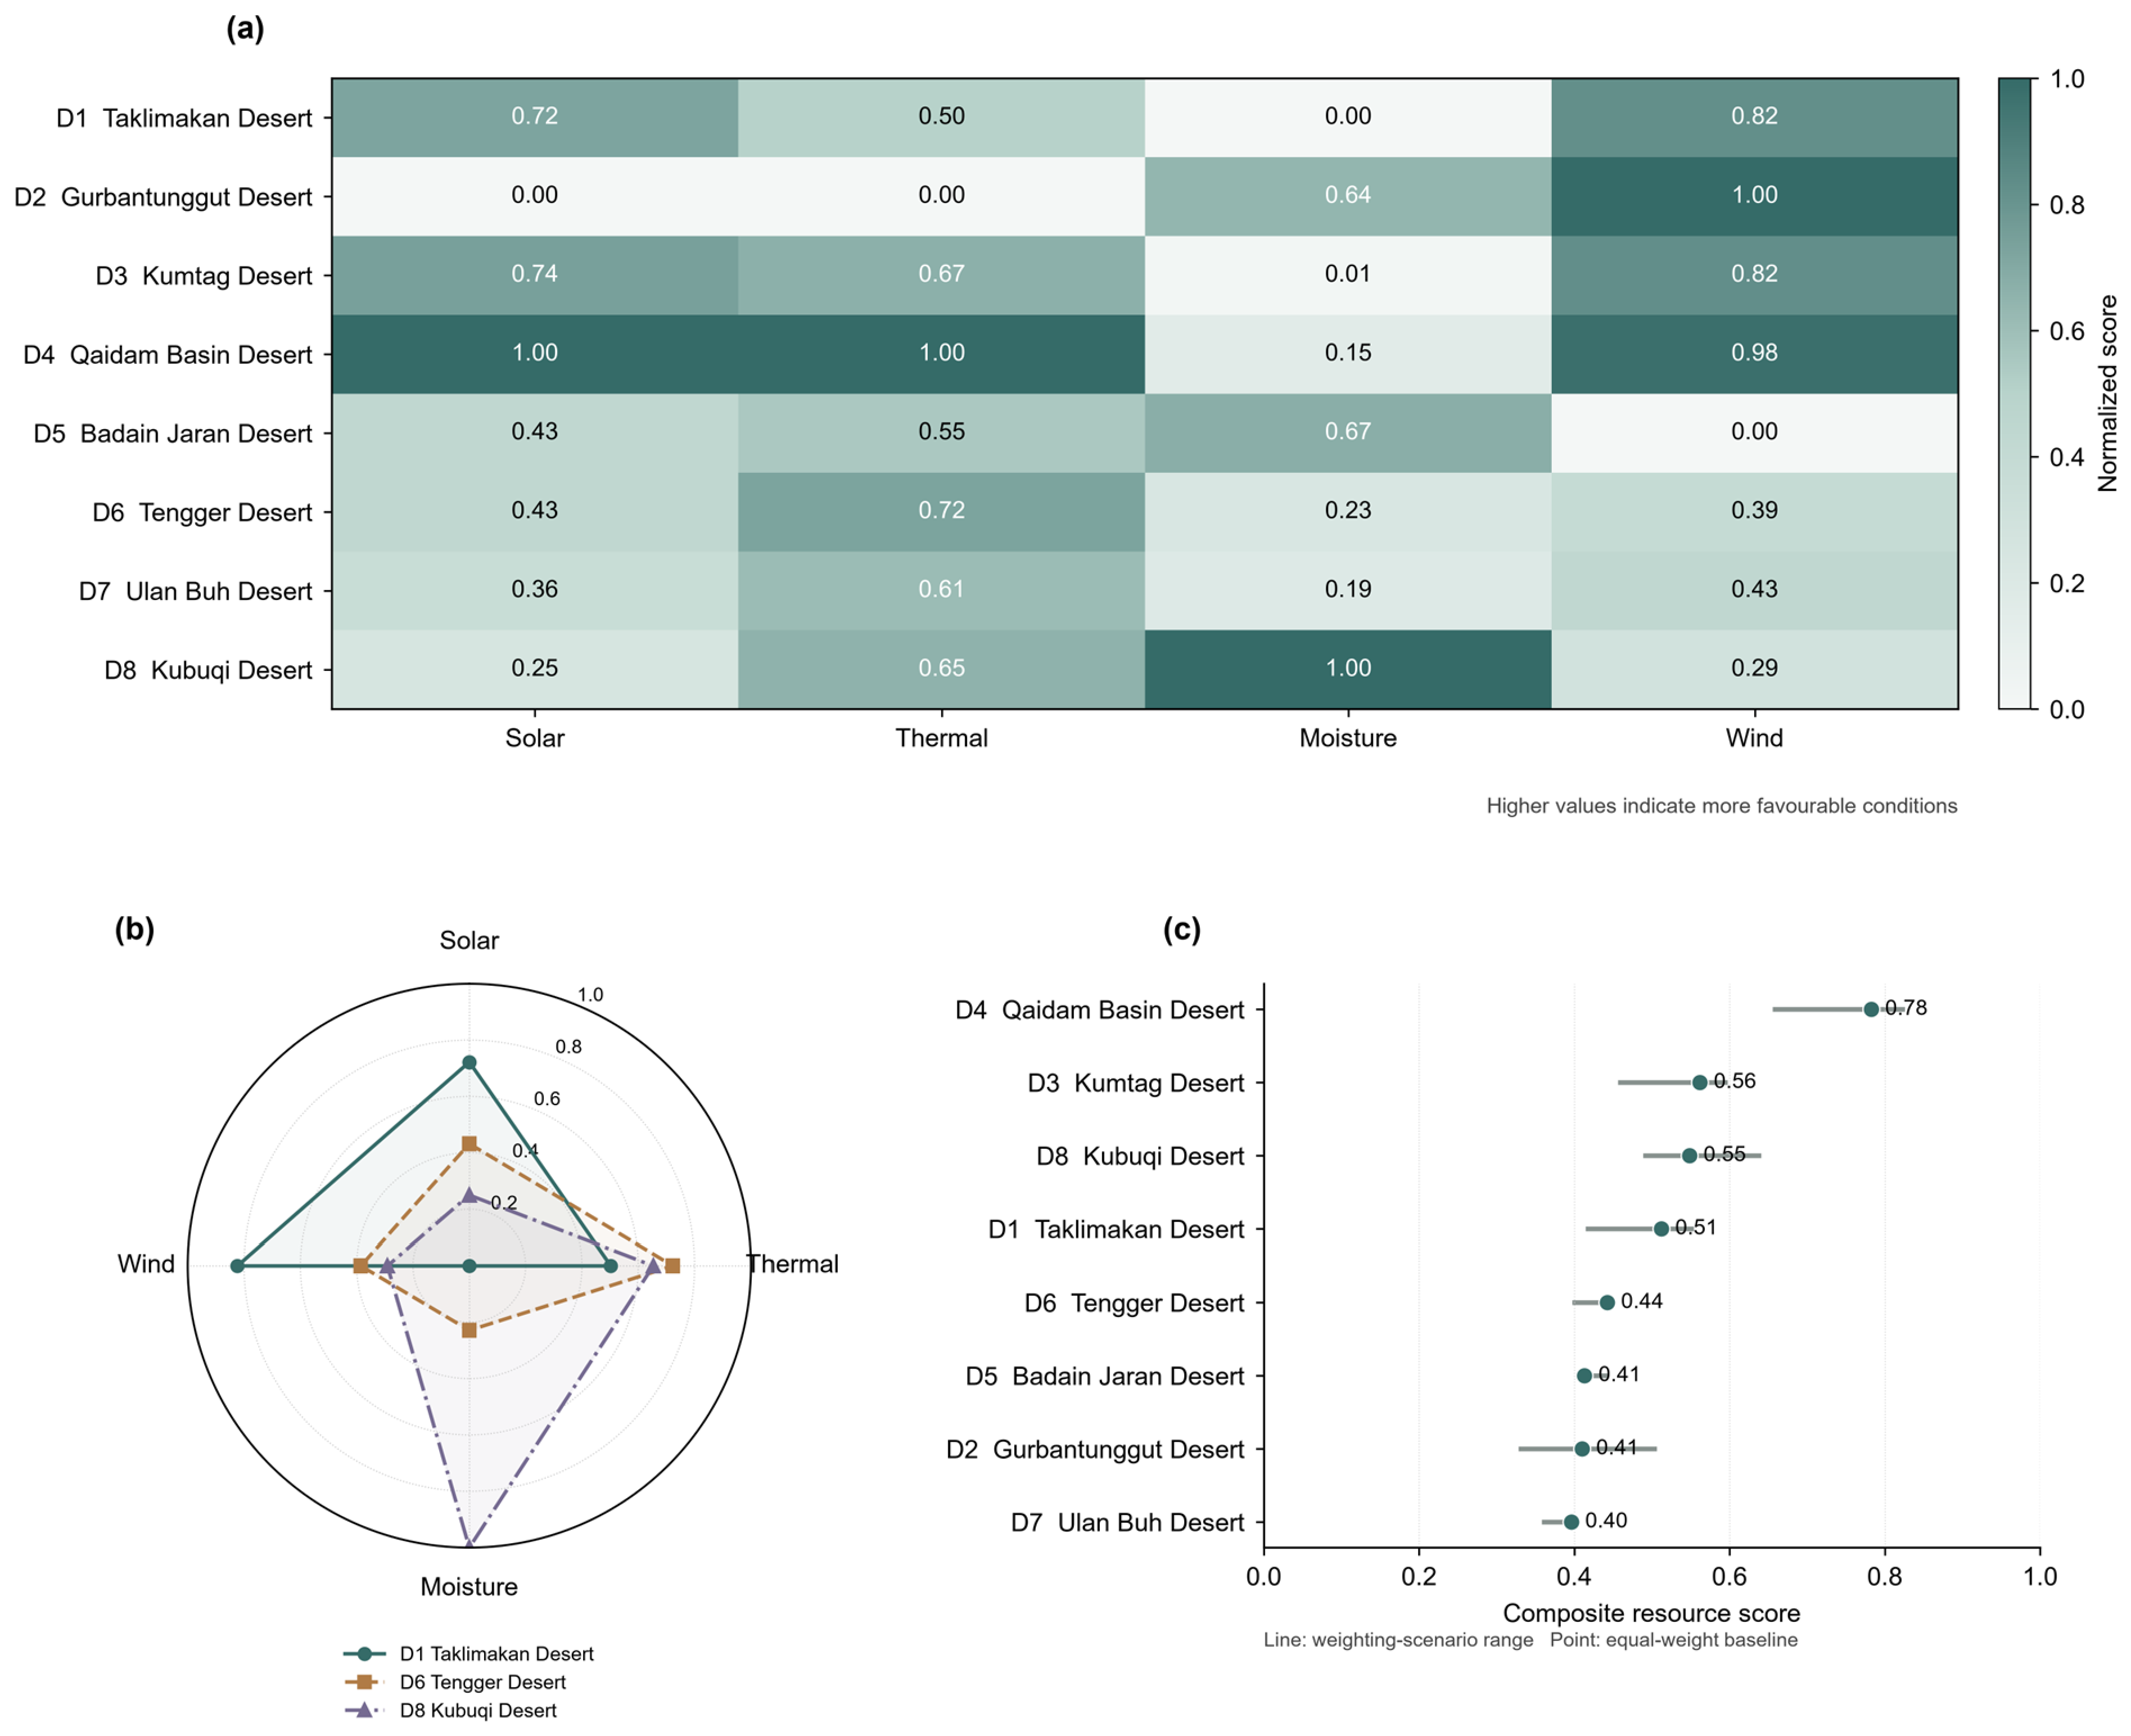
The four-dimensional assessment revealed distinct resource profiles across China’s eight major deserts (Figure 5a). The Qaidam Basin Desert had the highest normalised scores for solar resource abundance (1.00) and thermal stability (1.00), with a wind exposure stability score of 0.98 and a soil moisture support score of 0.15. The Kubuqi Desert had the highest soil moisture support score (1.00) and a thermal stability score of 0.65. Its solar resource abundance and wind exposure stability scores were 0.25 and 0.29. The Gurbantunggut Desert had the lowest scores for solar resource abundance and thermal stability (both 0.00), a soil moisture support score of 0.64, and the highest wind exposure stability score (1.00). The results show that favourable conditions were concentrated in specific resource dimensions. No single indicator represented the overall resource characteristics of a desert. The radar profiles of the Taklimakan, Tengger, and Kubuqi Deserts illustrate different combinations of resource strengths and constraints (Figure 5b). The Taklimakan Desert had relatively high scores for solar resource abundance (0.72) and wind exposure stability (0.82), a thermal stability score of 0.50, and a soil moisture support score of 0.00. The Tengger Desert had a thermal stability score of 0.72, with lower scores for solar resource abundance (0.43), soil moisture support (0.23), and wind exposure stability (0.39). The Kubuqi Desert was characterised by its high soil moisture support score, with lower scores for solar resource abundance and wind exposure stability. These profiles show differences in both individual indicators and the combinations of resource advantages and constraints. Under the equal-weight scenario, composite resource scores were 0.78 for the Qaidam Basin Desert, 0.56 for the Kumtag Desert, 0.55 for the Kubuqi Desert, 0.51 for the Taklimakan Desert, 0.44 for the Tengger Desert, 0.41 for the Badain Jaran Desert, 0.41 for the Gurbantunggut Desert, and 0.40 for the Ulan Buh Desert (Figure 5c). The Qaidam Basin Desert remained the highest-ranked desert under the equal-weight, energy-priority, and ecology-priority scenarios. Spearman’s rank correlation was 0.95 between the equal-weight and energy-priority scenarios and 0.64 between the equal-weight and ecology-priority scenarios. The Gurbantunggut Desert ranked between third and eighth place across the three scenarios. The Taklimakan Desert ranked between third and sixth place. The horizontal ranges in Figure 5c show the variation in composite scores across the three weighting scenarios and the dependence of the results on the selected decision priorities.
Sensitivity to weighting is intrinsic to MCDA because the method combines multiple criteria with different meanings and decision priorities [21,36,37]. The high solar resource score of the Qaidam Basin Desert did not correspond to favourable conditions in every dimension because its soil moisture support score was low. The high soil moisture support score of the Kubuqi Desert was not accompanied by comparable scores for solar resource abundance or wind exposure stability. Figure 5 presents a relative comparison within the defined indicator system. The composite scores do not represent an absolute ranking of development suitability. Solar resource abundance identifies favourable energy resource conditions but does not establish ecological or social suitability for photovoltaic development. Remote sensing studies have reported spatially heterogeneous vegetation responses around photovoltaic facilities in drylands [20]. Agrivoltaic experiments have reported improvements in soil moisture conditions and crop performance under specific environmental and management conditions [5]. Reviews show that these effects depend on climate, soil properties, system configuration, ecosystem services, and stakeholder interests [6]. China’s drylands are affected simultaneously by ecological restoration, land degradation, water resource pressure, and renewable energy development [4].

3.3. Environmental Evidence for Geographical Fieldwork Education

The environmental analyses provide a scientific basis for geographically grounded inquiry. Figure 2, Figure 3, Figure 4 and Figure 5 present evidence on temperature change, surface radiation and albedo, vertical soil moisture conditions, and multidimensional resource characteristics across China’s eight major deserts. These environmental differences support inquiry into spatial variation, environmental processes, resource opportunities, ecological constraints, and human–environment relationships. The environmental analyses provide the empirical basis for the development of a staged geographical fieldwork framework. Regional environmental evidence is used to formulate inquiry questions before fieldwork, guide observation and measurement during fieldwork, and support evidence integration and decision making for sustainability after fieldwork.
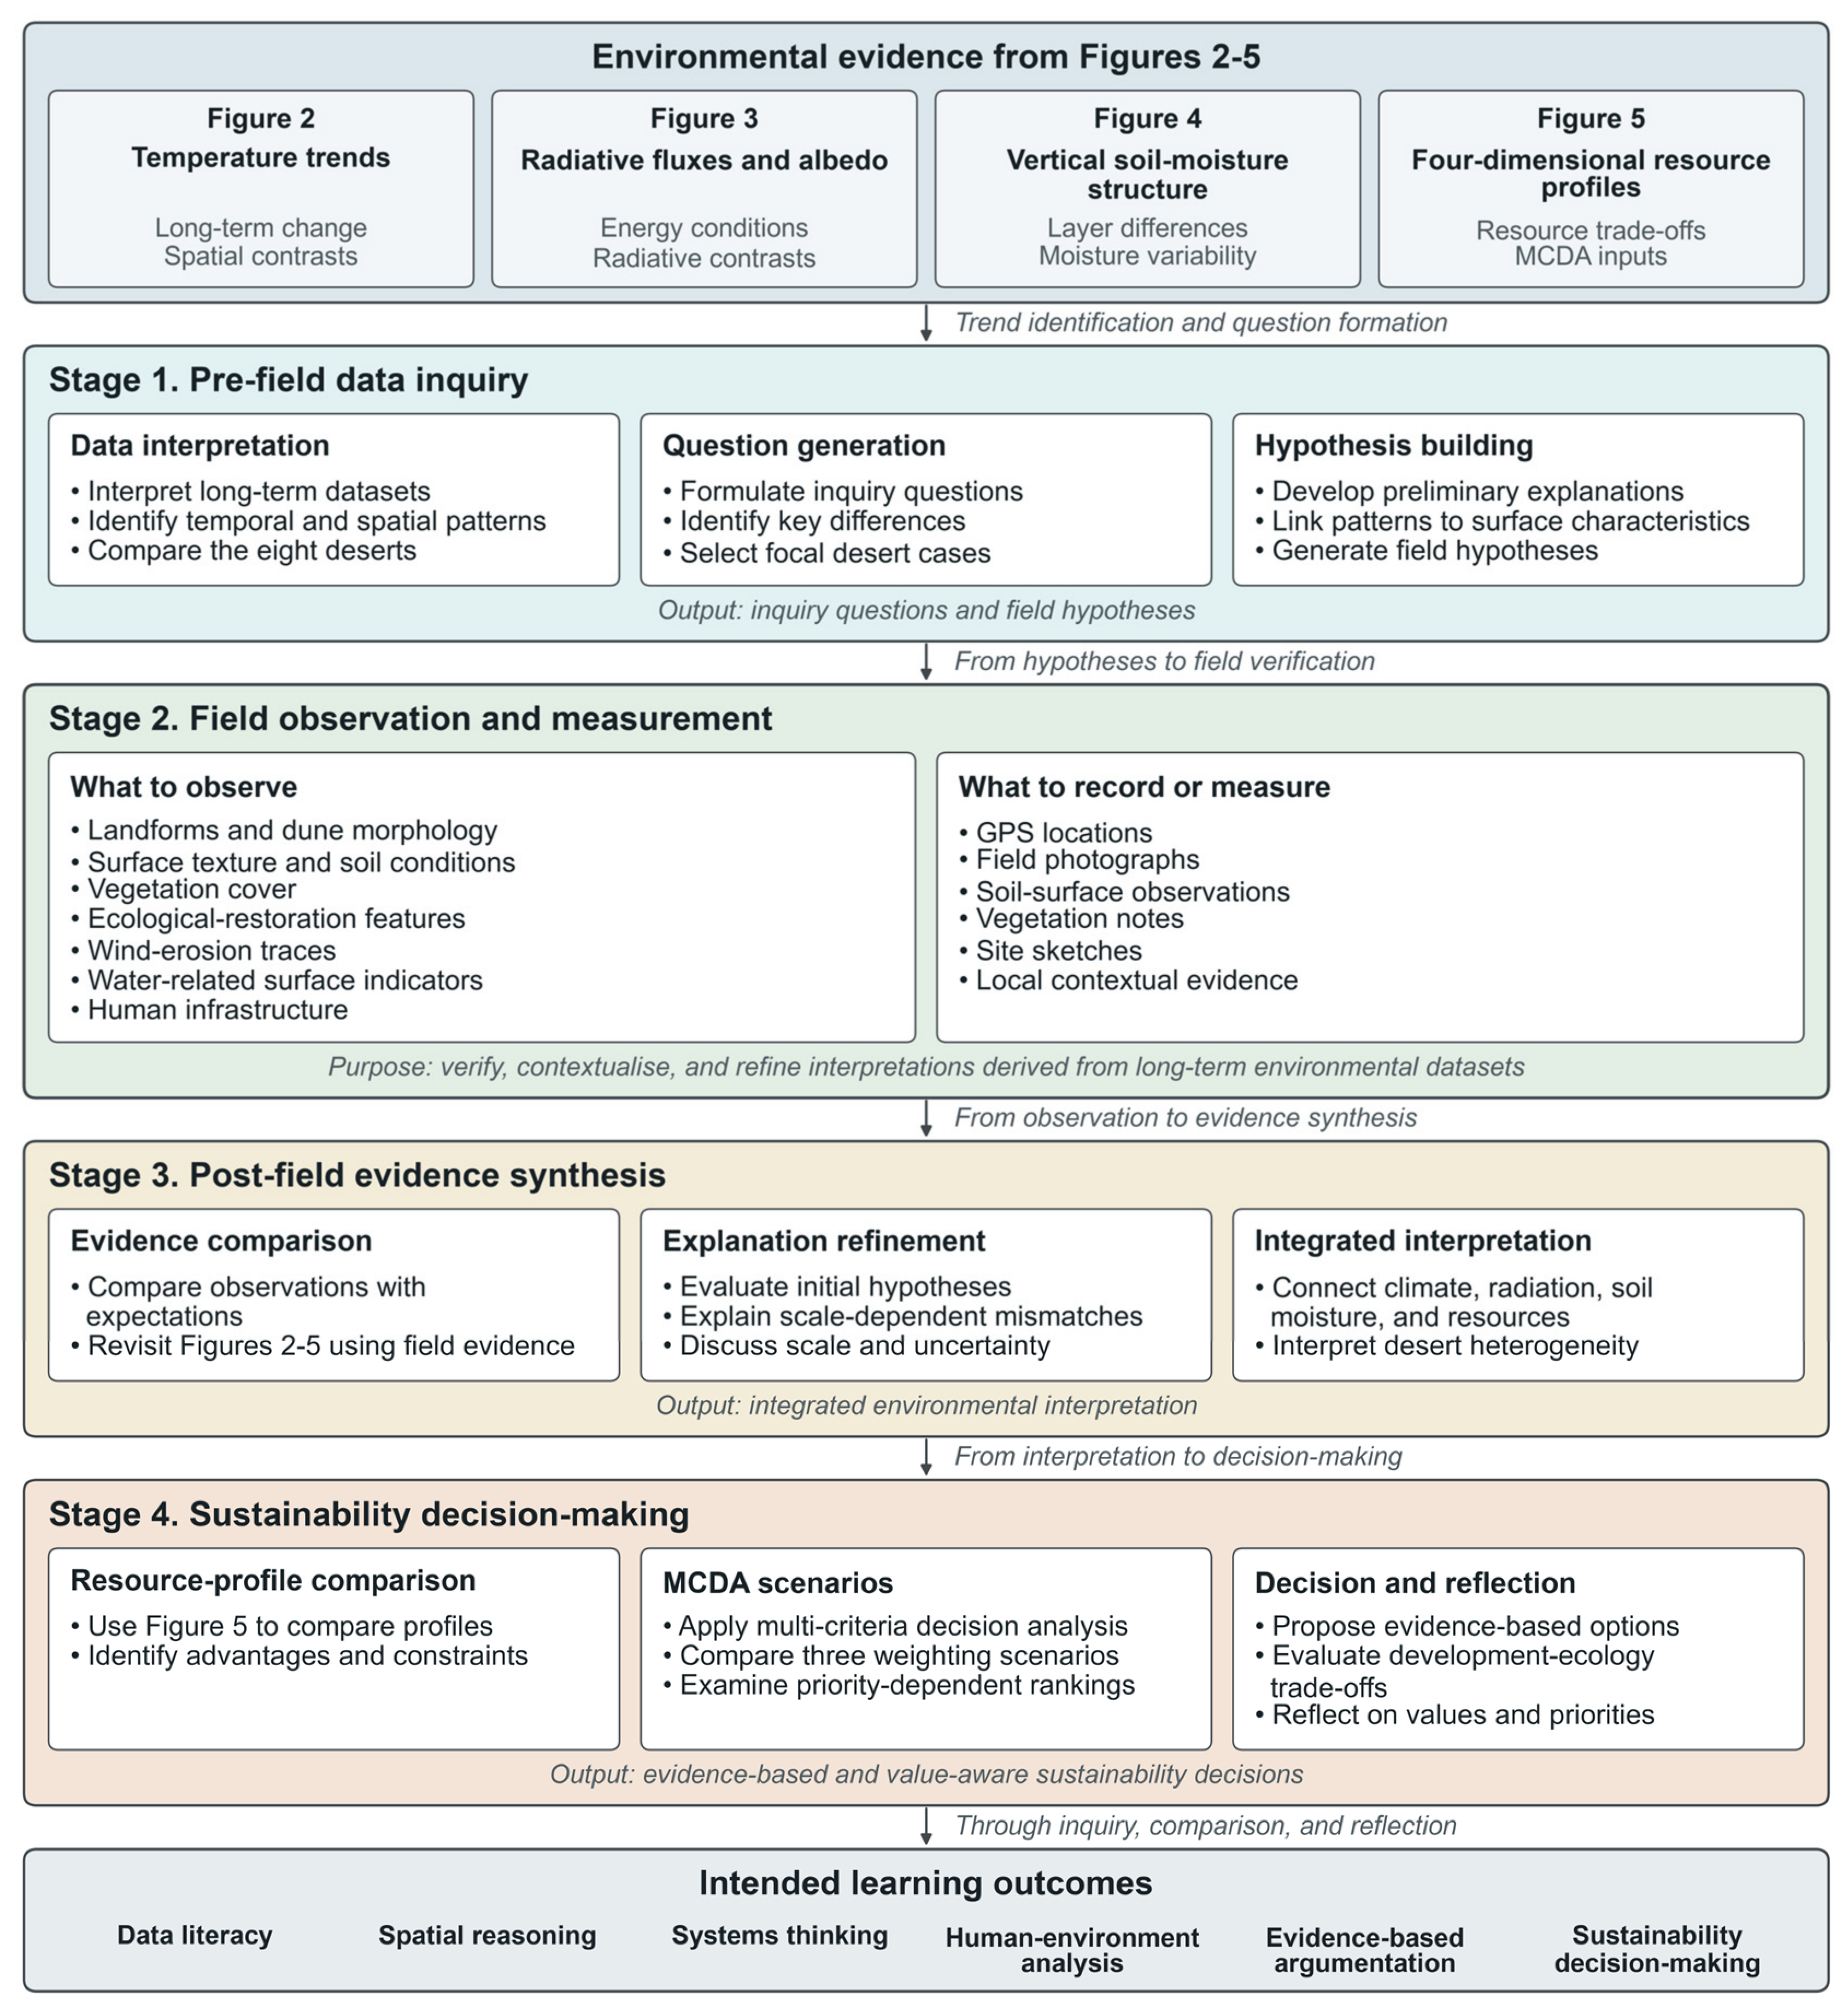
The framework contains four stages (Figure 6). Data inquiry before fieldwork requires learners to interpret the spatial and temporal patterns presented in Figure 2, Figure 3, Figure 4 and Figure 5, identify environmental contrasts among the deserts, formulate inquiry questions, and develop preliminary hypotheses for selected field sites. Field observation and measurement require georeferenced records of landforms, surface materials, vegetation, soil and moisture conditions, aeolian features, ecological restoration infrastructure, photovoltaic facilities, and other human–environment interactions. Field observations document local environmental characteristics and processes that cannot be represented adequately by desert-scale averages. Evidence integration after fieldwork requires learners to compare field records with regional environmental patterns, reconsider initial hypotheses, and identify possible explanations for agreements and discrepancies between the two evidence sources. Decision making for sustainability uses environmental characteristics and alternative MCDA weighting scenarios to compare resource use and environmental protection priorities and to develop judgements supported by evidence. Regional environmental datasets and short-duration field observations represent different spatial and temporal scales. ERA5 trends describe environmental variation over broad areas and extended periods. Field observations record local conditions associated with surface materials, dune and oasis transitions, vegetation, land use, infrastructure, and recent disturbances. Short field visits cannot validate long-term regional trends. Regional reanalysis cannot replace direct observation of local environmental conditions. Differences between the two evidence sources form part of the inquiry process. Learners can examine the effects of spatial resolution, temporal representativeness, soil depth, measurement conditions, and local environmental heterogeneity. Scale and uncertainty become explicit components of geographical reasoning.
The framework draws on established principles of inquiry in geographical education and learning through direct engagement with place. Fieldwork connects disciplinary concepts with observations made in real environments and requires structured preparation, disciplinary knowledge, and appropriate instructional support [7,8]. GIS-based inquiry requires learners to formulate geographical questions, identify relevant evidence, and interpret spatial relationships [11]. Geospatial technologies, georeferenced data, and citizen science approaches provide additional opportunities for collecting and integrating spatial evidence [12]. Inquiry in specific places requires the integration of local contextual knowledge with scientific knowledge [9]. Research on geographical fieldwork has identified explicit pedagogical structure as an important element in connecting field experience with disciplinary learning [10]. Figure 6 connects environmental evidence, inquiry questions, field observations, evidence integration, and assessment products within one learning sequence. The task structure, intended learning outcomes, and assessment evidence are presented in Table S3 in the Supplementary Materials. The MCDA component connects environmental interpretation with decision making for sustainability. Its educational purpose is to make evaluation criteria, weighting choices, and resource trade-offs explicit. Learners compare the equal-weight, energy-priority, and ecology-priority scenarios and examine changes in the relative evaluation of the eight deserts. They identify the assumptions represented by different weighting schemes. The analysis can include ecological thresholds, water constraints, protected areas, infrastructure requirements, community interests, and conflicts between development and conservation that are not fully represented by the quantitative indicators. These tasks correspond to sustainability competencies involving systems thinking, normative judgement, strategic reasoning, and integrated problem solving [13,14].

4. Conclusions

This study integrated environmental analysis, multidimensional resource assessment, and geographical fieldwork design across China’s eight major deserts. From 2005 to 2025, Sen’s slopes of annual mean 2 m air temperature ranged from 0.22 to 0.53 °C decade−1, with statistically significant warming in six deserts. Surface solar radiation downwards and surface net solar radiation showed no statistically significant monotonic trends, while surface thermal radiation downwards increased significantly in four deserts. Soil moisture from 2015 to 2025 showed clear vertical differentiation, with mean differences between Layer 4 and Layer 1 ranging from 0.150 to 0.316 m3 m−3. The four-dimensional resource assessment identified contrasting combinations of solar resource abundance, thermal stability, soil moisture support, and wind exposure stability. Equal-weight composite scores ranged from 0.40 to 0.78, and the Gurbantunggut Desert shifted from third to eighth place under different weighting scenarios. The resource comparison represents relative profiles that depend on the selected indicators and weighting priorities and should not be interpreted as absolute development suitability.
The environmental analyses provided the empirical basis for the development of a staged geographical fieldwork design connecting data inquiry before fieldwork, field observation, evidence integration after fieldwork, and decision making for sustainability. Long-term regional datasets are used to identify contrasting environmental conditions and formulate inquiry questions, while field observations provide local evidence that desert-scale reanalysis cannot resolve. The proposed framework identifies environmental data literacy, spatial reasoning, systems thinking, evidence integration, and decision making for sustainability as intended learning outcomes.

Supplementary Materials

The following supporting information can be downloaded at: https://www.mdpi.com/article/10.3390/su18179142/s1, Table S1: Environmental datasets, variables, and their applications in this study; Table S2: Indicators, directions of preference, normalisation, and weights used in the three MCDA scenarios; Table S3: Translation of environmental evidence into geographical fieldwork tasks and intended learning outcomes.

Author Contributions

Conceptualization, S.X.; Methodology, S.X. and Z.W.; Software, S.X.; Validation, S.X.; Formal analysis, S.X. and W.D.; Investigation, S.X.; Resources, S.X.; Data curation, S.X. and Z.W.; Writing—original draft, S.X. and Z.W.; Writing—review & editing, S.X. and Z.W.; Visualization, S.X.; Supervision, S.X.; Project administration, S.X.; Funding acquisition, S.X. and W.D. All authors have read and agreed to the published version of the manuscript.

Funding

This research was funded by the National Natural Science Foundation of China, grant numbers 42171158 and 41771220; the Open Research Fund Project of the Key Laboratory of Eco-Environmental Meteorology of the Qinling Mountains and Loess Plateau, China Meteorological Administration, grant number 2021G-10; and the West Light Foundation of the Chinese Academy of Sciences, grant number xbzg-zdsys-202306.

Institutional Review Board Statement

Not applicable.

Informed Consent Statement

Not applicable.

Data Availability Statement

Publicly available datasets were analyzed in this study. The China 1:100,000 Desert (Sandy Land) Distribution Dataset is available from the National Cryosphere Desert Data Center at https://doi.org/10.12072/ncdc.Westdc.db0027.2021. ERA5 monthly averaged data on single levels and ERA5 hourly data on single levels are available from the Copernicus Climate Data Store at https://doi.org/10.24381/cds.f17050d7 and https://doi.org/10.24381/cds.adbb2d47, respectively. The processed data generated during this study are available from the corresponding author upon reasonable request.

Conflicts of Interest

The authors declare no conflict of interest.

References

  1. Reynolds, J.F.; Stafford Smith, D.M.; Lambin, E.F.; Turner, B.L.; Mortimore, M.; Batterbury, S.P.; Downing, T.E.; Dowlatabadi, H.; Fernández, R.J.; Herrick, J.E.; et al. Global desertification: Building a science for dryland development. Science 2007, 316, 847–851. [Google Scholar] [CrossRef] [Scilit] [PubMed]
  2. Huang, J.; Li, Y.; Fu, C.; Chen, F.; Fu, Q.; Dai, A.; Shinoda, M.; Ma, Z.; Guo, W.; Li, Z.; et al. Dryland climate change: Recent progress and challenges. Rev. Geophys. 2017, 55, 719–778. [Google Scholar] [CrossRef] [Scilit]
  3. Burrell, A.L.; Evans, J.P.; De Kauwe, M.G. Anthropogenic climate change has driven over 5 million km2 of drylands towards desertification. Nat. Commun. 2020, 11, 3853. [Google Scholar] [CrossRef] [Scilit] [PubMed]
  4. Li, C.; Fu, B.; Wang, S.; Stringer, L.C.; Wang, Y.; Li, Z.; Liu, Y.; Zhou, W. Drivers and impacts of changes in China’s drylands. Nat. Rev. Earth Environ. 2021, 2, 858–873. [Google Scholar] [CrossRef] [Scilit]
  5. Barron-Gafford, G.A.; Pavao-Zuckerman, M.A.; Minor, R.L.; Sutter, L.F.; Barnett-Moreno, I.; Blackett, D.T.; Thompson, M.; Dimond, K.; Gerlak, A.K.; Nabhan, G.P.; et al. Agrivoltaics provide mutual benefits across the food–energy–water nexus in drylands. Nat. Sustain. 2019, 2, 848–855. [Google Scholar] [CrossRef] [Scilit]
  6. Merheb, C.; Macknick, J.; Davatzes, N.; Ravi, S. Synergies and trade-offs of multi-use solar landscapes. Nat. Sustain. 2025, 8, 857–870. [Google Scholar] [CrossRef] [Scilit]
  7. Fuller, I.C.; Edmondson, S.; France, D.; Higgitt, D.; Ratinen, I. International perspectives on the effectiveness of geography fieldwork for learning. J. Geogr. High. Educ. 2006, 30, 89–101. [Google Scholar] [CrossRef] [Scilit]
  8. Hope, M. The importance of direct experience: A philosophical defence of fieldwork in human geography. J. Geogr. High. Educ. 2009, 33, 169–182. [Google Scholar] [CrossRef] [Scilit]
  9. Seow, T.; Chang, J.; Irvine, K.N. Field-based inquiry as a signature pedagogy for geography in Singapore. J. Geogr. 2019, 118, 227–237. [Google Scholar] [CrossRef] [Scilit]
  10. Kim, M. Developing pre-service teachers’ fieldwork pedagogical and content knowledge through designing enquiry-based fieldwork. J. Geogr. High. Educ. 2022, 46, 61–79. [Google Scholar] [CrossRef] [Scilit]
  11. Favier, T.T.; van der Schee, J.A. Exploring the characteristics of an optimal design for inquiry-based geography education with Geographic Information Systems. Comput. Educ. 2012, 58, 666–677. [Google Scholar] [CrossRef] [Scilit]
  12. Kerski, J.J. Geo-awareness, geo-enablement, geotechnologies, citizen science, and storytelling: Geography on the world stage. Geogr. Compass 2015, 9, 14–26. [Google Scholar] [CrossRef] [Scilit]
  13. Wiek, A.; Withycombe, L.; Redman, C.L. Key competencies in sustainability: A reference framework for academic program development. Sustain. Sci. 2011, 6, 203–218. [Google Scholar] [CrossRef] [Scilit]
  14. Brundiers, K.; Barth, M.; Cebrián, G.; Cohen, M.; Diaz, L.; Doucette-Remington, S.; Dripps, W.; Habron, G.; Harré, N.; Jarchow, M.; et al. Key competencies in sustainability in higher education—Toward an agreed-upon reference framework. Sustain. Sci. 2021, 16, 13–29. [Google Scholar] [CrossRef] [Scilit]
  15. Hersbach, H.; Bell, B.; Berrisford, P.; Hirahara, S.; Horányi, A.; Muñoz-Sabater, J.; Nicolas, J.; Peubey, C.; Radu, R.; Schepers, D.; et al. The ERA5 global reanalysis. Q. J. R. Meteorol. Soc. 2020, 146, 1999–2049. [Google Scholar] [CrossRef] [Scilit]
  16. Cliffe, A.D. A review of the benefits and drawbacks to virtual field guides in today’s geoscience higher education environment. Int. J. Educ. Technol. High. Educ. 2017, 14, 28. [Google Scholar] [CrossRef] [Scilit]
  17. Klippel, A.; Zhao, J.; Jackson, K.L.; La Femina, P.; Stubbs, C.; Wetzel, R.; Blair, J.; Wallgrün, J.O.; Oprean, D. Transforming Earth Science Education Through Immersive Experiences: Delivering on a Long Held Promise. J. Educ. Comput. Res. 2019, 57, 1745–1771. [Google Scholar] [CrossRef] [Scilit]
  18. Bryan, B.A.; Gao, L.; Ye, Y.; Sun, X.; Connor, J.D.; Crossman, N.D.; Stafford-Smith, M.; Wu, J.; He, C.; Yu, D.; et al. China’s response to a national land-system sustainability emergency. Nature 2018, 559, 193–204. [Google Scholar] [CrossRef] [Scilit] [PubMed]
  19. Feng, X.; Fu, B.; Piao, S.; Wang, S.; Ciais, P.; Zeng, Z.; Lü, Y.; Zeng, Y.; Li, Y.; Jiang, X.; et al. Revegetation in China’s Loess Plateau is approaching sustainable water resource limits. Nat. Clim. Change 2016, 6, 1019–1022. [Google Scholar] [CrossRef] [Scilit]
  20. Xia, Z.; Li, Y.; Guo, S.; Chen, R.; Zhang, W.; Guo, X.; Zhang, X.; Du, P. Satellites reveal spatial heterogeneity in dryland photovoltaic plants’ effects on vegetation dynamics. Earth’s Future 2024, 12, e2024EF004427. [Google Scholar] [CrossRef] [Scilit]
  21. Malczewski, J. GIS-based multicriteria decision analysis: A survey of the literature. Int. J. Geogr. Inf. Sci. 2006, 20, 703–726. [Google Scholar] [CrossRef] [Scilit]
  22. Yan, C.Z.; Wang, J.H. China 1:100,000 Desert (Sandy Land) Distribution Dataset [Dataset]; National Cryosphere Desert Data Center: Lanzhou, China, 2021. [Google Scholar] [CrossRef]
  23. Thapa, L.H.; Saide, P.E.; Bortnik, J.; Berman, M.T.; da Silva, A.; Peterson, D.A.; Li, F.; Kondragunta, S.; Ahmadov, R.; James, E.; et al. Forecasting Daily Fire Radiative Energy Using Data Driven Methods and Machine Learning Techniques. J. Geophys. Res. Atmos. 2024, 129, e2023JD040514. [Google Scholar] [CrossRef] [Scilit]
  24. Sun, T.; Zanocco, C.; Flora, J.; Sheshadri, A.; Rajagopal, R. Unified 0.25-degree gridded infrastructure-critical extreme weather for the United States from 1979 to 2100. Sci. Data 2025, 12, 1544. [Google Scholar] [CrossRef] [Scilit] [PubMed]
  25. Xu, Y.; Dai, Q.Y.; Lu, Y.G.; Zhao, C.; Huang, W.T.; Xu, M.; Feng, Y.X. Identification of ecologically sensitive zones affected by climate change and anthropogenic activities in Southwest China through a NDVI-based spatial-temporal model. Ecol. Indic. 2024, 158, 111482. [Google Scholar] [CrossRef] [Scilit]
  26. Lolli, S.; Dolinar, E.K.; Lewis, J.R.; Salcedo-Bosch, A.; Campbell, J.R.; Welton, E.J. Long-term trends in daytime cirrus cloud radiative effects: Analyzing twenty years of Micropulse Lidar Network measurements at Greenbelt, Maryland in eastern North America. Atmos. Chem. Phys. 2026, 26, 411–426. [Google Scholar] [CrossRef] [Scilit]
  27. Correa, L.F.; Folini, D.; Chtirkova, B.; Wild, M. Causes for Decadal Trends in Surface Solar Radiation in the Alpine Region in the 1981–2020 Period. J. Geophys. Res. Atmos. 2024, 129, e2023JD039998. [Google Scholar] [CrossRef] [Scilit]
  28. Elavarasan, R.M.; Nadarajah, M.; Shafiullah, G.M. Multi-criteria decision analysis of clean energy technologies for envisioning sustainable development goal 7 in Australia: Is solar energy a game-changer? Energy Convers. Manag. 2024, 321, 119007. [Google Scholar] [CrossRef] [Scilit]
  29. Oakleaf, J.R.; Kennedy, C.M.; Baruch-Mordo, S.; Gerber, J.S.; West, P.C.; Johnson, J.A.; Kiesecker, J. Mapping global development potential for renewable energy, fossil fuels, mining and agriculture sectors. Sci. Data 2019, 6, 101. [Google Scholar] [CrossRef] [Scilit] [PubMed]
  30. Biggs, J.B.; Tang, C. Teaching for Quality Learning at University: What the Student Does, 4th ed.; Open University Press: Maidenhead, UK, 2011. [Google Scholar]
  31. Mountain Research Initiative EDW Working Group. Elevation-dependent warming in mountain regions of the world. Nat. Clim. Change 2015, 5, 424–430. [Google Scholar] [CrossRef] [Scilit]
  32. Piao, S.; Wang, X.; Park, T.; Chen, C.; Lian, X.; He, Y.; Bjerke, J.W.; Chen, A.; Ciais, P.; Tømmervik, H.; et al. Characteristics, drivers and feedbacks of global greening. Nat. Rev. Earth Environ. 2020, 1, 14–27. [Google Scholar] [CrossRef] [Scilit]
  33. Lian, X.; Jeong, S.; Park, C.-E.; Xu, H.; Li, L.Z.X.; Wang, T.; Gentine, P.; Peñuelas, J.; Piao, S. Biophysical impacts of northern vegetation changes on seasonal warming patterns. Nat. Commun. 2022, 13, 3925. [Google Scholar] [CrossRef] [Scilit] [PubMed]
  34. Schlaepfer, D.R.; Bradford, J.B.; Lauenroth, W.K.; Munson, S.M.; Tietjen, B.; Hall, S.A.; Wilson, S.D.; Duniway, M.C.; Jia, G.; Pyke, D.A.; et al. Climate change reduces extent of temperate drylands and intensifies drought in deep soils. Nat. Commun. 2017, 8, 14196. [Google Scholar] [CrossRef] [Scilit] [PubMed]
  35. Beck, H.E.; Pan, M.; Miralles, D.G.; Reichle, R.H.; Dorigo, W.A.; Hahn, S.; Sheffield, J.; Karthikeyan, L.; Balsamo, G.; Parinussa, R.M.; et al. Evaluation of 18 satellite- and model-based soil moisture products using in situ measurements from 826 sensors. Hydrol. Earth Syst. Sci. 2021, 25, 17–40. [Google Scholar] [CrossRef] [Scilit]
  36. Shao, M.; Han, Z.; Sun, J.; Xiao, C.; Zhang, S.; Zhao, Y. A review of multi-criteria decision making applications for renewable energy site selection. Renew. Energy 2020, 157, 377–403. [Google Scholar] [CrossRef] [Scilit]
  37. Jong, F.C.; Ahmed, M.M. Multi-Criteria Decision-Making Solutions for Optimal Solar Energy Sites Identification: A Systematic Review and Analysis. IEEE Access 2024, 12, 143458–143484. [Google Scholar] [CrossRef] [Scilit]
Figure 1. Spatial distribution of China’s eight major deserts.
Sustainability 18 09142 g001
Figure 2. Trends in 2 m air temperature across China’s eight major deserts, 2005 to 2025. (a) Spatial distribution of ERA5 grid-scale Sen’s slopes. Stippled cells indicate p < 0.05 in the Mann–Kendall test. (b) Desert-scale Sen’s slopes with 95% Theil–Sen confidence intervals. D1 to D8 denote the Taklimakan, Gurbantunggut, Kumtag, Qaidam Basin, Badain Jaran, Tengger, Ulan Buh, and Kubuqi Deserts, respectively. * p < 0.05; ** p < 0.01; ns, p ≥ 0.05.
Sustainability 18 09142 g002
Figure 3. Surface radiative fluxes and shortwave albedo across China’s eight major deserts, 2005 to 2025. (a) Trends in surface solar radiation downwards (SSRD). (b) Trends in surface net solar radiation (SSR). (c) Trends in surface thermal radiation downwards (STRD). (d) Multiyear mean surface shortwave albedo and its Sen’s slope. Error bars in (ac) represent 95% bootstrap confidence intervals for Sen’s slope. D1 to D8 are defined in Figure 2. * p < 0.05; ** p < 0.01; ns, p ≥ 0.05.
Sustainability 18 09142 g003
Figure 4. Layered soil moisture dynamics across China’s eight major deserts from 2015 to 2025. (ah) Annual mean volumetric soil water content in Layers 1 to 4. (i) Sen’s slopes for each soil layer. (j) Multiyear mean difference between Layer 4 and Layer 1 with 95% confidence intervals. Arrows indicate a statistically significant increase in the difference. Layers 1 to 4 correspond to 0 to 7, 7 to 28, 28 to 100, and 100 to 289 cm, respectively. D1 to D8 are defined in Figure 2. * p < 0.05; ** p < 0.01; ns, p ≥ 0.05.
Sustainability 18 09142 g004
Figure 5. Four-dimensional relative resource characteristics and multi-criteria comparison of China’s eight major deserts. (a) Normalised scores for solar resource abundance, thermal stability, soil moisture support, and wind exposure stability. (b) Contrasting resource profiles for the Taklimakan, Tengger, and Kubuqi Deserts. (c) Equal-weight composite scores and score ranges under the energy-priority and ecology-priority scenarios. Higher normalised scores indicate relatively more favourable conditions. Points show equal-weight scores, and horizontal lines show score ranges across the three weighting scenarios.
Sustainability 18 09142 g005
Figure 6. Proposed evidence-informed staged framework integrating environmental data analysis with geographical fieldwork. Environmental evidence from Figure 2, Figure 3, Figure 4 and Figure 5 informs pre-field data inquiry, field observation and measurement, post-field evidence synthesis, and sustainability-oriented decision-making. Arrows indicate the sequential progression from environmental evidence through the four stages to the intended learning outcomes. Background colors distinguish the functional components. Blue-gray represents environmental evidence; light blue, pre-field inquiry; light green, field observation and measurement; and light yellow, post-field evidence synthesis. Light orange represents sustainability-oriented decision-making, and gray represents the intended learning outcomes. The colors do not indicate quantitative values, weights, or priority levels. Intended learning outcomes include environmental data literacy, spatial reasoning, systems thinking, human–environment analysis, evidence-based argumentation, and sustainability-oriented decision-making. The framework represents a proposed design rather than an empirically validated teaching intervention.
Sustainability 18 09142 g006
Disclaimer/Publisher’s Note: The statements, opinions and data contained in all publications are solely those of the individual author(s) and contributor(s) and not of MDPI and/or the editor(s). MDPI and/or the editor(s) disclaim responsibility for any injury to people or property resulting from any ideas, methods, instructions or products referred to in the content.