1. Introduction
Sustainable fresh sweetcorn-based production systems must address two closely connected challenges: maintaining soil fertility for a nutrient-demanding crop and managing fall armyworm (FAW;
Spodoptera frugiperda, J.E. Smith) without excessive reliance on synthetic fertilizers and insecticides. Concerns about soil degradation, agrochemical resistance, environmental contamination, biodiversity loss, and increasing production costs have stimulated interest in biologically derived agricultural inputs [
1,
2]. However, the adoption of these inputs depends not only on their capacity to improve crop performance or reduce environmental harm, but also on whether they can be produced and applied at costs that agricultural enterprises and farmers can recover.
Vermicompost (VC) is a stabilized organic amendment produced through the decomposition of organic residues by earthworms and microorganisms. Its application can improve soil structure, organic matter, nutrient availability, cation exchange capacity, water retention, and microbial activity [
3]. Vermicompost tea (VCT), a liquid extract of VC, contains soluble nutrients, microorganisms, humic substances, and other bioactive compounds that may enhance nutrient uptake, physiological performance, and crop vigor [
3,
4,
5]. Previous studies on fresh sweetcorn also showed reduced or delayed FAW damage under selected VC and VCT treatments, indicating that improved plant nutrition and physiological resilience may contribute to preventive pest suppression [
6,
7]. In crop rotations, these amendments may continue to influence soil fertility and subsequent crop performance [
8]. Fresh sweetcorn–strawberry and fresh sweetcorn–soybean systems are particularly relevant because strawberry provides a high-value residual crop. In contrast, soybean contributes crop diversification, biological nitrogen acquisition, and rhizosphere-mediated nutrient cycling [
9,
10].
Numerous studies have documented the agronomic benefits of VC and VCT, including improvements in soil fertility, crop growth, yield, and pest resilience [
11,
12,
13,
14]. However, comparatively few studies have examined whether these benefits translate into positive economic outcomes across rotational cropping systems, particularly when amendment costs are incurred during the first crop and residual benefits are realized in a subsequent crop. This gap is especially important in rotational systems, where amendment costs are incurred during the first crop but some benefits may be realized during a subsequent crop. The economic outcome may also differ depending on whether VC and VCT are sold as agricultural products or retained for on-farm use. VCT may create considerable value as a processed retail product, yet repeated high-volume applications can generate substantial material and labor costs when extrapolated to commercial plant populations. An agronomically effective treatment may therefore remain economically unsuitable unless application concentration, volume, frequency, and delivery method are optimized. However, evaluating the sustainability of fresh sweetcorn-based rotations requires consideration not only of nutrient management and amendment costs, but also of the economic feasibility of controlling FAW when preventive crop-health benefits are insufficient.
Nutrient and soil-health management alone may not provide sufficient protection when FAW pressure becomes severe. Conventional insecticides can provide direct control, but their repeated use is associated with resistance, non-target effects, environmental contamination, and safety concerns [
15,
16,
17,
18]. Neem-derived azadirachtin products offer a biologically based alternative, although conventional formulations may be constrained by poor solubility, rapid photodegradation, and limited environmental persistence [
19,
20,
21]. In previous work, cellulose acetate-based azadirachtin nanoformulations produced by electrospinning exhibited improved photostability, controlled release, high FAW mortality, and no acute earthworm mortality under the conditions evaluated [
22]. Within an integrated nutrient- and pest-management framework, VC and VCT can therefore serve as inputs for soil fertility, crop vigor, and preventive resilience. At the same time, the nanopesticide provides a potential targeted intervention when monitored FAW pressure reaches an economically important level. The nanopesticide was not applied in the crop-rotation experiments and is consequently evaluated as a separate but related management intervention rather than as part of the crop-level budgets.
This study evaluated the economic feasibility of VC and VCT as nutrient-management inputs in fresh sweetcorn-based rotations and, separately, the production feasibility of a previously developed azadirachtin nanopesticide as a potential FAW-targeted intervention. The specific objectives were to: (1) compare the production economics of VC-only, VCT-only, and integrated VC + VCT enterprises under retail, bulk, product-allocation, market-price, and labor-cost scenarios; (2) determine the crop-level and rotation-level economic performance of VC and VCT in fresh sweetcorn–strawberry and fresh sweetcorn–soybean systems; (3) assess how VCT concentration, application volume, and application frequency influenced modeled field-use profitability; and (4) conduct a separate production-feasibility assessment of the previously developed azadirachtin nanopesticide by evaluating its annualized production costs, break-even selling price, and price sensitivity as a potential threshold-triggered FAW-management input. Given the retrospective nature of the study, the analysis was guided by economic expectations that value addition through VCT production could improve enterprise returns, increasing VCT application intensity could reduce field-level profitability when additional crop value failed to recover the associated costs, residual crop responses could recover part of the initial amendment investment, and nanopesticide production feasibility would depend strongly on the relationship between annualized production cost and selling price. The nanopesticide was not applied in either crop-rotation experiment; therefore, this study did not evaluate its field-level effects on crop yield, FAW-related yield protection, or rotation profitability. No new field or pesticide-efficacy experiments were conducted.
2. Methodology
2.1. Study Design, Context, and Data Sources
This study is a retrospective economic assessment based on data generated in previously completed and published agronomic and nanopesticide studies. No new field, greenhouse, laboratory-efficacy, or nanopesticide production experiments were conducted for this analysis. The crop-level economic assessment used treatment, yield, soil, nutrient, and fall armyworm data from the previously reported 2022 fresh sweetcorn–strawberry and 2024 fresh sweetcorn–soybean experiments. The nanopesticide assessment used formulation, production-scale, material-input, efficacy, photostability, controlled-release, and earthworm-safety data from the previously published azadirachtin nanopesticide study. These biological datasets were combined with documented input prices, labor rates, crop prices, equipment costs, and market assumptions to construct the production budgets, partial budgets, cost–benefit ratios, return measures, break-even estimates, and sensitivity analyses reported here.
This study evaluated the economic feasibility of vermicompost (VC) and vermicompost tea (VCT) as nutrient-management and pest-suppression inputs, and, separately, an azadirachtin nanopesticide as a potential additional pest-management intervention within an integrated nutrient- and pest-management framework for fresh sweetcorn-based rotations. No new agronomic or pesticide-efficacy experiments were conducted. Crop yield, soil fertility, treatment application, and FAW incidence data were obtained from previously published field experiments involving fresh sweetcorn, strawberries, and soybeans [
6,
7,
9,
10]. The nanopesticide production analysis was based on previously reported research on the green synthesis, characterization, and biological efficacy of azadirachtin nanoformulations [
22].
The field experiments were conducted at the Agroecology program’s USDA-recognized organic garden of Florida International University in Miami-Dade County, South Florida, USA (25.75° N, 80.38° W) [
7]. The site has a subtropical climate, calcareous sandy-loam soil, and a history of organic management. The VC used in the experiments was produced locally from mushroom waste [
6,
10] and from rabbit manure and coconut coir residues [
7,
9]. For the nanopesticide study, commercially purchased pure cold-pressed neem oil was used as the starting neem material, and the neem extract was subsequently prepared from the neem oil before incorporation into cellulose acetate nanofibers [
22]. These production conditions were considered when identifying the costs of raw materials, processing equipment, labor, packaging, utilities, and marketing.
The study context should be considered when interpreting the results. The crop experiments were conducted under subtropical South Florida conditions in calcareous sandy-loam soil at a site with a history of organic management. The evaluated crop sequences, amendment materials, labor assumptions, market prices, and input procurement conditions reflect this production environment. The nanopesticide was prepared from commercially sourced neem oil and neem extracts rather than directly harvested local neem leaves; consequently, its production feasibility depends on reliable access to standardized neem-derived raw materials at comparable prices and quality. These contextual conditions were incorporated into the economic analysis and limit direct transfer of the results to regions with substantially different soils, climates, crop rotations, labor markets, input supply chains, or output prices.
The original crop experiments followed randomized complete block designs with three replicates per treatment. Each treatment contained 12 plants, divided into three replicates of four plants each. Treatment effects were evaluated in the original studies using analysis of variance followed by Tukey’s honestly significant difference test at (
p < 0.05) [
6,
7,
9,
10]. The studies also documented treatment-related changes in soil organic matter, nitrogen, phosphorus, cation exchange capacity, crop yield, and FAW incidence [
9,
10].
The present study did not undertake an independent statistical analysis of soil or plant nutrient concentrations and does not reproduce the complete soil and nutrient datasets reported in the original agronomic studies. Consequently, later-season strawberry and soybean yields are interpreted as crop responses observed under the carryover treatment conditions rather than as direct proof that a specific residual nutrient or soil property caused the observed yield differences. References to residual fertility or nutrient carryover in this economic assessment are therefore based on the treatment history and the soil and plant measurements reported in the corresponding agronomic studies [
9,
10].
The present study used these validated agronomic data for economic evaluation. Fresh sweetcorn yield was reported in hundredweight per acre (CWT/acre) to correspond with fresh-market pricing. Strawberry and soybean yields were reported in metric tonnes per acre (t/acre). Liquid inputs and nanopesticide production quantities were expressed in liters.
Crop-production costs were obtained primarily from agricultural enterprise budgets published by the University of Florida Institute of Food and Agricultural Sciences Extension (UF/IFAS) [
23] and the University of Georgia Agricultural and Applied Economics Extension [
24]. These budgets provided benchmark costs for seed, fertilizer, irrigation, field operations, labor, harvesting, packaging, transportation, and other crop-production activities. Season-specific fresh sweetcorn prices were obtained from the USDA National Agricultural Statistics Service [
25,
26].
For specialized VC-, VCT-, and nanopesticide-production materials that were not reported in agricultural enterprise budgets, observed procurement costs were obtained from supplier invoices and quotations available to the production enterprise. Publicly listed retail prices were consulted only as secondary replacement-cost references when an invoice or extension benchmark was unavailable. Where retail replacement prices were required, they were cross-checked against at least one supplier quotation or alternative vendor price whenever comparable products were available. These values therefore represent small-scale procurement assumptions for specialized materials rather than representative commercial agricultural prices. The influence of uncertainty in these assumptions was evaluated through market-price and labor-cost sensitivity analyses and, for the nanopesticide, through alternative selling-price and break-even scenarios.
The economic evaluation comprised two related but independent assessments. The first assessed the economics of production and field application of vermicompost and vermicompost tea within a fresh sweetcorn-based crop rotation, using data from previously completed field experiments. The second assessed the production economics of azadirachtin nanopesticides using cost information derived from previously published formulation and efficacy studies. These assessments were not integrated into a single enterprise budget because they represent distinct production systems. Instead, they were evaluated separately to assess their potential contributions to an integrated nutrient- and pest-management framework for sustainable crop production.
2.2. Vermicompost and Vermicompost Tea Production Systems
Three enterprise configurations were evaluated: VC-only production, VCT-only production, and combined VC-VCT production. The VC-only enterprise was based on an annual production capacity of 12,000 lb (5.443 t) of VC. In the VCT-only enterprise, the entire annual VC output was allocated to producing 20,000 gallons (75,708 L) of VCT. In the combined enterprise, 76% of the annual VC output (4.137 t) was sold as solid VC, while the remaining 24% (1.306 t) was converted into 4800 gallons (18,170 L) of VCT.
VCT production was based on a conversion factor of 1.667 gallons of VCT per pound of VC, equivalent to mixing 27.2 kg of VC with 378.5 L of water [
6]. The analysis included feedstock, water, electricity, labor, packaging, production equipment, facility expenses, maintenance, marketing, and other applicable costs. Revenue, net return, cost–benefit ratio, and return on annual cost were calculated for each enterprise using
Equations (S1a)–(S2e) in Supplementary Table S1.
2.3. Fresh Sweetcorn-Based Rotations
2.3.1. Fresh Sweetcorn–Strawberry Rotation
The 2022 fresh sweetcorn experiment was conducted in raised beds measuring 243.84 cm long, 60.96 cm wide, and 30.48 cm deep. The treatments were: V0: organic 8-4-8 NPK fertilizer (0.3 t/acre); VC1: VC applied at 1 t/acre; VCT100: 100 mL of 20% VCT solution per plant per application; VC1 + VCT50: VC at 1 t/acre plus 50 mL of 20% VCT solution per plant per application; VC3: VC applied at 3 t/acre; and VC3 + VCT50: VC at 3 t/acre plus 50 mL of 20% VCT solution per plant per application. VCT was applied six times during the fresh sweetcorn growing season [
6]. In the treatment names VCT50 and VCT100, the numerical suffix refers to the volume of 20% VCT solution applied per plant during each application event, rather than to the VCT concentration.
Strawberries were subsequently grown in the same beds from November 2022 to April 2023 without additional VC or VCT application to evaluate subsequent crop performance under the treatment conditions established during the preceding fresh sweetcorn phase [
6,
9,
10]. The VC3 and VC3 + VCT50 treatments did not produce marketable strawberries. These treatments were classified as crop-establishment or marketability failures and were excluded from comparisons requiring marketable strawberry yield.
2.3.2. Fresh Sweetcorn–Soybean Rotation
A second experiment was conducted in Summer 2024 to evaluate the effects of VCT concentration, with and without solid VC, on the performance of fresh sweetcorn. The treatments were: V0: untreated control with no fertilizer, VC, or VCT; VC1 + VCT10: VC at 1 t/acre plus 100 mL of 10% VCT solution per plant; VC1 + VCT20: VC at 1 t/acre plus 100 mL of 20% VCT solution per plant; VC1 + VCT40: VC 1 t/acre plus 100 mL of 40% VCT solution per plant; VCT10: 100 mL of 10% VCT solution per plant without solid VC; VCT20: 100 mL of 20% VCT solution per plant without solid VC; and VCT40: 100 mL of 40% VCT solution per plant without solid VC. VCT was applied six times during the fresh sweetcorn growing season. The numerical suffixes 10, 20, and 40 indicate the VCT concentration in the final solution. All VCT treatments received 100 mL of the final solution per plant per application, but the amount of concentrated VCT varied among treatments.
Soybeans were subsequently grown in the same beds to evaluate residual nutrient effects without additional VC or VCT application [
7,
9]. The original VC and VCT costs were assigned to the preceding fresh sweetcorn phase and were not charged again to the soybean phase.
The treatment abbreviations used in this study follow the nomenclature adopted in the original field experiments. Because the two experiments evaluated different VCT application strategies, the numerical suffixes have different meanings. In the 2022 fresh sweetcorn–strawberry rotation, VCT50 and VCT100 refer to application volumes of 50 mL and 100 mL of a 20% VCT solution per plant per application, respectively. In contrast, in the 2024 fresh sweetcorn–soybean rotation, VCT10, VCT20, and VCT40 denote VCT concentrations of 10%, 20%, and 40%, respectively, with a constant application volume of 100 mL per plant per application. The original treatment names were retained to maintain consistency with the previously published agronomic studies from which the economic analysis was derived.
2.4. Crop Yield and Economic Analysis
The fresh sweetcorn experiments were conducted in controlled raised-bed plots rather than full commercial fields. Fresh cob yield was therefore expressed as a plant-density-extrapolated per-acre-equivalent using an assumed population of 36,000 plants/acre. This population was selected as a commercially relevant scaling density. UF/IFAS guidance indicates an ideal population of 26,000–36,000 plants/acre for irrigated corn production [
27], while a field experiment specifically evaluating sweetcorn tested plant populations up to 35,000 plants/acre and reported commercially relevant yield responses at this density [
28]. The 36,000 plants/acre assumption used in the present analysis is therefore within, or very close to, plant populations used in intensively managed corn and sweetcorn production systems. Nevertheless, optimal plant population varies with cultivar, irrigation, soil conditions, production region, and management; accordingly, we used 36,000 plants/acre as a consistent scaling assumption rather than a universal optimum for fresh sweetcorn production.
Fresh cob yield was calculated independently for each four-plant replicate using
Equation (S3a) (Supplementary Table S1), and the treatment mean was subsequently calculated from the three replicate-level yield estimates using
Equation (S3b). The mean yield was converted from kg/acre to CWT/acre using
Equation (S3c). The same assumed plant population was applied consistently across all treatments and used to calculate VCT requirements, as VCT was applied on a per-plant basis. Consequently, the plant-density assumption affected both extrapolated crop revenue and the quantity and cost of VCT required per acre. The resulting values represent standardized acre-equivalent estimates under the stated plant-density assumption and not yields measured directly from a commercial acre. Fresh sweetcorn was valued using fresh-market rather than grain-corn prices because the harvested product consisted of fresh cobs. Florida-specific USDA National Agricultural Statistics Service (USDA-NASS) values were used because both fresh sweetcorn experiments were conducted in South Florida. The fresh sweetcorn selling price was USD 42.10/CWT for the 2022 season [
25] and USD 32.80/CWT for the 2024 season [
26].
The strawberry farm-level price was estimated at USD 4.45/kg, equivalent to USD 4450/t, based on a retail price of USD 8.38/kg and an estimated farm share of 53% reported by the USDA Economic Research Service [
29], because strawberry is an established commercial crop in Florida and the state-level value represents the amount received by producers rather than a retail consumer price. For soybean, a comparable Florida state-level producer price was not available in the source used for the economic analysis. The USDA-NASS Georgia value was therefore used as a regional market proxy [
26]. Georgia was selected because it is a neighboring southeastern state with established commercial soybean production and provides a geographically relevant benchmark for evaluating the potential economic performance of soybean as a rotation crop under South Florida conditions. The soybean price was USD 0.48/kg, equivalent to USD 480/t, based on the USDA market price source used for the soybean economic assessment [
26]. The Georgia soybean price should therefore be interpreted as an explicit market assumption for the economic analysis rather than as a Florida-observed farm price. Crop gross revenue was calculated by multiplying marketable yield by the corresponding crop price, as shown in
Equation (S3d) (Supplementary Table S1). Only marketable yield was included in the revenue calculation.
Production costs were evaluated using a partial-budget approach. The analysis included fertilizer, VC, VCT, irrigation, seed, planting labor, weeding labor, VCT application labor, scouting, fuel and machinery, crop insurance, harvesting, precooling, containers, packaging, transportation, and marketing where applicable. Land rent, owner-management charges, interest on capital, general overhead, and depreciation of long-term farm equipment were excluded unless explicitly included in the source enterprise budget. Accordingly, crop and rotation net returns represent revenue remaining after deducting the included variable costs, rather than the complete commercial-farm profit. Throughout the crop and rotation analyses, a positive net return or CBR greater than one therefore indicates recovery of the costs included in the partial budget under the stated assumptions; it should not be interpreted as evidence of positive farm profit after all fixed, ownership, management, financing, and overhead costs are considered. Net returns, therefore, represent returns above the included variable costs rather than the full commercial-farm profit. Fertilizer, VC, VCT material, and VCT application-labor costs were calculated using
Equations (S4a)–(S4g) (Supplementary Table S1). A concentrated VCT price of USD 6/gallon (equivalent to USD 1.585/L) was used. VCT application labor was valued at USD 15/acre/application.
For illustration, applying 100 mL of a 20% VCT solution to 36,000 plants required 720 L of concentrated VCT per acre per application. Applying 50 mL of the same solution required 360 L of concentrated VCT per acre per application. The corresponding 2024 quantities were calculated using VCT concentration fractions of 0.10, 0.20, and 0.40 applied at 100 mL per plant.
Season-specific postharvest costs were subsequently applied to the corresponding fresh sweetcorn yield. Marketing cost was set to 10% of gross revenue in the marketing-cost scenario and to zero in the farm-gate scenario. Total variable cost, net return, CBR, and return on variable cost were calculated using
Equations (S5a)–(S5d) (Supplementary Table S1). A CBR greater than one indicated that gross revenue exceeded the included variable costs, whereas a CBR below one indicated that the treatment did not recover its variable production costs.
For the residual strawberry and soybean phases, the original VC and VCT costs were not charged again. Rotation-level revenue, total variable cost, and net return were calculated using
Equations (S6a)–(S6c) (Supplementary Table S1). This approach counted the initial VC and VCT investment once while capturing its potential residual value in the subsequent crop.
2.5. Sensitivity and Threshold Analyses
2.5.1. Vermicompost Allocation Sensitivity
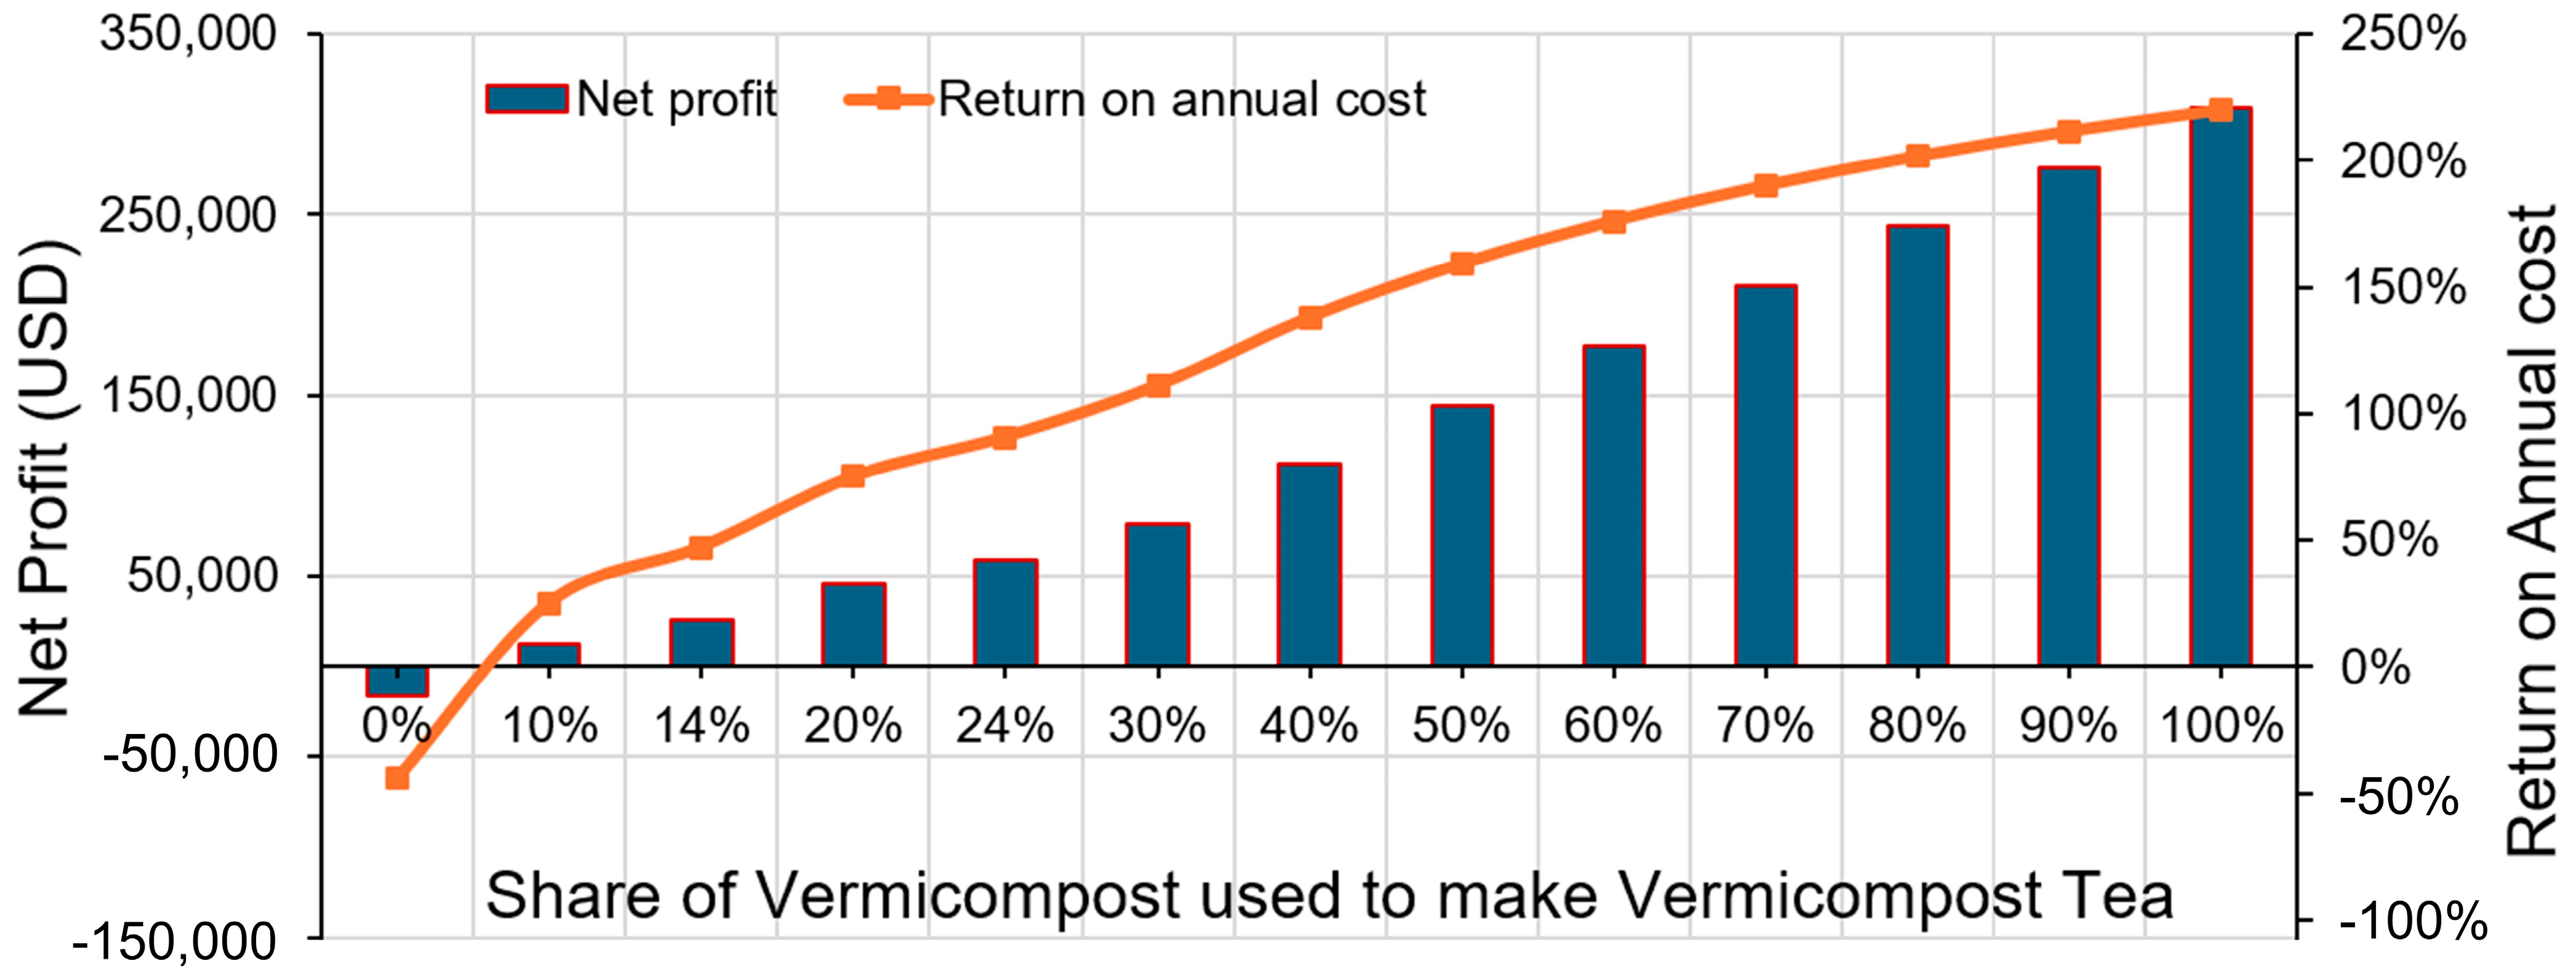
The proportion of total VC output allocated to VCT production was varied to determine how product allocation affected the profitability of the combined VC–VCT enterprise. The evaluated conversion levels were 0%, 10%, 14%, 20%, 24%, 30%, 40%, 50%, 60%, 70%, 80%, 90%, and 100%. For each allocation level, the quantities of VC sold and VCT produced were calculated using
Equations (S1a)–(S1c) (Supplementary Table S1). Revenue, total cost, net return, CBR, and return on annual cost were then calculated using
Equations (S2a)–(S2e) (Supplementary Table S1). The allocation analysis used the operating-cost structure of the combined VC–VCT production unit. The 0% allocation scenario, therefore, represented the operation of the combined production unit without converting VC into VCT and was not identical to that of the separate VC-only enterprise.
2.5.2. Market-Price and Labor-Cost Sensitivity
Market-price and labor-cost sensitivity analyses were conducted for the VC-only, VCT-only, and combined VC–VCT enterprises. Annual recurring production labor in the base model was USD 29,200. Product selling prices were evaluated at 80%, 100%, and 120% of their base values. Scenario revenue was calculated using
Equation (S8a) (Supplementary Table S1), where the market-price multiplier (m_P) was 0.80, 1.00, or 1.20. Labor cost was also evaluated at 80%, 100%, and 120% of its base value. Scenario cost was calculated using
Equation (S8b) (Supplementary Table S1), where the labor multiplier (m_L) was 0.80, 1.00, or 1.20. Two combined scenarios were also evaluated: an unfavorable scenario combining a 20% decrease in selling prices with a 20% increase in labor cost; and a favorable scenario combining a 20% increase in selling prices with a 20% decrease in labor cost. Net return, CBR, and return on annual cost were calculated for every scenario.
Supplementary Table S5 presents the complete market-price, labor-cost, and combined-scenario calculations for the VC-only, VCT-only, and integrated VC + VCT production systems.
2.5.3. VCT Application-Intensity Threshold Analysis
VCT application-intensity analyses were conducted separately for the 2022 and 2024 fresh sweetcorn experiments. Four final-solution volumes were evaluated: 25 mL/plant/application, 50 mL/plant/application, 75 mL/plant/application, and 100 mL/plant/application. For each application volume, application frequency ranged from 1 to 6 applications per season. The 2022 analysis included VCT100, VC1 + VCT50, and VC3 + VCT50. The VCT concentration was held at 20%, while application volume and frequency were varied. The 2024 analysis included VC1 + VCT10, VC1 + VCT20, VC1 + VCT40, VCT10, VCT20, and VCT40. The treatment concentrations of 10%, 20%, and 40% were retained, while volume and application frequency were varied. The quantity and cost of concentrated VCT under each scenario were calculated using
Equations (S4c)–(S4f) (Supplementary Table S1). Observed fresh sweetcorn yield and revenue were held constant within each treatment because yield-response data were available only for the original experimental application schedule. The analysis therefore isolated the economic effects of VCT concentration, volume, and application frequency. It should be interpreted as a cost-threshold analysis and not as evidence that lower volumes or fewer applications would maintain the observed crop response.
2.6. Azadirachtin Nanopesticide Production Economics
The nanopesticide enterprise model was based on the previously reported electrospinning of azadirachtin formulations from neem oil and neem extract into cellulose acetate fibers [
22]. The original study reported 80–100% FAW mortality within one week in feeding bioassays, improved photostability, controlled release, and no observed acute mortality among the tested earthworms [
22]. No new efficacy experiments were conducted, and the present economic analysis did not estimate field-level yield protection. The economic model evaluated annual production of 350 gallons, equivalent to 1324.9 L of concentrated azadirachtin nanopesticide. Costs included cellulose acetate, neem oil or neem extract, solvents, utilities, labor, packaging, quality-control materials, operating and maintenance expenses, insurance, taxes, laboratory rent, and capital-use costs. The model represents production-stage feasibility and does not include the complete downstream costs of regulatory registration, product-specific safety and residue testing, commercial-scale manufacturing validation, distribution, market development, applicator training, or post-market monitoring because reliable product-specific estimates for these activities were unavailable. Because no year-specific differences in annual production output, operating costs, or selling conditions were available, the nanopesticide enterprise was evaluated on an annualized basis rather than as multiple separate operating years.
The listed startup equipment and laboratory-setup items had a combined initial investment cost of USD 23,747. Because these items represent capital assets that would support production beyond a single operating year, assigning their full purchase cost to Year 1 would substantially overstate that year’s annual production cost. The source production data did not include asset-specific useful lives, replacement schedules, financing terms, or salvage values. A common 10-year economic life was therefore adopted as a transparent simplifying assumption, and the startup investment was allocated using straight-line annualization. No salvage value or discount rate was applied. This approach was intended to estimate a representative annual capital-use charge for the production-feasibility assessment, not to constitute a full discounted investment appraisal. The resulting annualized startup cost was USD 2374.70. Nanopesticide revenue, annual costs, net cash flow, CBR, net profit margin, and break-even price were calculated using
Equations (S7a)–(S7k) in Supplementary Table S1.
The nanopesticide price-sensitivity analysis evaluated selling prices of USD 25/L, USD 50/L, USD 105.67/L, and USD 150/L. The USD 105.67/L scenario was equivalent to the base target price of USD 400/gallon. These prices were treated as scenario assumptions for a concentrated specialty nanopesticide and were close to established market prices. Annual output and year-specific costs were held constant while the selling price was varied. The break-even selling price was calculated by dividing total annual cost by annual production output.
The azadirachtin nanopesticide was not applied to fresh sweetcorn, strawberry, or soybean in the rotation experiments evaluated in this economic study. Accordingly, nanopesticide costs, pest-control benefits, and avoided crop losses were not included in the crop-level or rotation-level partial budgets. The nanopesticide analysis represents a separate enterprise-level assessment of a previously developed FAW-targeted formulation that could potentially be used during the fresh sweetcorn phase when scouting indicates that pest pressure has reached an action threshold. It therefore evaluates the financial feasibility of producing this potential IPM input rather than estimating its realized economic contribution to the crop rotations examined in the study.
Prices for specialized nanopesticide materials and laboratory equipment were based primarily on documented supplier invoices and quotations. Where historical invoices were unavailable, current replacement costs from comparable commercial suppliers were used and treated as model assumptions rather than established agricultural-industry benchmarks. The resulting uncertainty was addressed through selling-price sensitivity and break-even analyses.
2.7. Statistical Analysis
The original agronomic experiments followed randomized complete block designs with three biological replicates per treatment. Each treatment consisted of 12 plants distributed among three replicate blocks of four plants each, with each replicate block treated as the experimental unit. For the present economic analysis, fresh sweetcorn yield was calculated independently for each replicate before obtaining treatment means. Gross revenue was then calculated for each replicate by multiplying replicate-level marketable yield by the corresponding season-specific fresh sweetcorn price. Replicate-level net return was calculated by subtracting the assigned treatment-specific variable cost from each replicate’s gross revenue. The detailed formulae are presented in
Supplementary Table S1.
Because the assigned variable cost was deterministic and constant across biological replicates within a treatment, replicate-to-replicate variation in net return arose from variation in marketable yield and the corresponding gross revenue rather than from replicated variation in the cost components. Accordingly, the ANOVA of net return tested differences among treatment-level net-return means after applying the predetermined treatment-specific cost offsets, with experimental error derived from biological replicate variation. It should not be interpreted as an inferential test of variability in input prices, labor rates, or other deterministic cost assumptions.
Treatment effects on fresh sweetcorn yield and net return were evaluated separately using analysis of variance consistent with the randomized complete block design. Where the ANOVA indicated significant treatment effects, treatment means were separated using Tukey’s honestly significant difference test at . Results are presented as means with measures of replicate-level variability, and different letters indicate statistically significant differences among treatment means.
For the rotation-level analysis, replicate-level net returns from fresh sweetcorn and the corresponding residual crop were summed within the respective treatment and replicate block to obtain combined rotation-level net returns. These combined net returns were analyzed separately for the 2022 fresh sweetcorn–strawberry and 2024 fresh sweetcorn–soybean rotations using the same randomized complete block ANOVA and Tukey mean-separation procedure. Because treatment structures and residual crops differed between years, no formal statistical comparison was made between the two rotations.
Gross revenue was not subjected to a separate inferential analysis because a common selling price was applied to all treatments within each season, making gross revenue a direct linear transformation of yield and producing the same statistical inference. Assigned variable costs were not analyzed using ANOVA because they were deterministic values calculated from fixed treatment application rates, input prices, and labor assumptions, rather than independently observed random measurements. Cost–benefit ratio, return on variable cost, enterprise CBR, and return on annual cost were also reported descriptively, as they were derived from revenue and cost estimates.
2.8. Integration Within the Nutrient- and Pest-Management Framework
The VC/VCT and nanopesticide analyses were conducted as separate but related economic assessments. VC and VCT were evaluated as production enterprises and as nutrient-management inputs in fresh sweetcorn–strawberry and fresh sweetcorn–soybean rotations. The nanopesticide analysis assessed the production feasibility of a targeted FAW management input. Within the proposed integrated framework, VC was treated as a soil amendment, VCT as a supplemental nutrient-management input, and the azadirachtin nanopesticide as a selective intervention for threshold-based FAW management during the fresh sweetcorn phase. The strawberry and soybean phases represented the potential extension of the initial amendment value by using residual nutrients.
A combined field-level return-on-investment model for VC, VCT, and nanopesticide application was not calculated because field data quantifying nanopesticide-mediated yield protection, avoided FAW losses, field application rates, and displacement of conventional pesticide sprays were unavailable. The nanopesticide analysis was therefore limited to production feasibility. Its integration with VC and VCT represents a prospective nutrient- and pest-management strategy requiring validation through future field-scale trials.
2.9. Generative AI-Assisted Figure Preparation
Generative artificial intelligence was used as a visualization aid during preparation of selected graphical elements of the manuscript. ChatGPT (GPT-5.6 sol, OpenAI) was used to assist in developing the conceptual illustration and the graphical abstract based on scientific content, relationships, and decision pathways specified by the authors. The authors subsequently reviewed and edited the generated outputs for scientific accuracy, terminology, and consistency with the study. Generative AI was not used to generate experimental or economic data, perform statistical analyses, calculate economic indicators, or determine the study conclusions. Figures presenting quantitative study results were prepared from the underlying numerical data using conventional plotting procedures.
4. Discussion
This study indicates that the agronomic performance of sustainable agricultural inputs should not be interpreted independently of their production, application, and opportunity costs. The discussion focuses on four broader questions: whether VC and VCT can be produced profitably, whether their agronomic benefits justify their field-use costs, whether residual effects improve whole-rotation performance, and whether azadirachtin nanopesticide production can serve as a selective threshold-based pest-management strategy. These questions provide an integrated basis for interpreting the economic feasibility of the evaluated nutrient- and pest-management options. Accordingly, the nanopesticide enterprise should be interpreted as a prospective pest-management component rather than as a financial extension of the vermicompost and vermicompost tea enterprise budgets.
4.1. VC and VCT Production Economics and Their Use in Fresh Sweetcorn-Based Rotations
A central contribution of this study is the connection established between the economics of producing VC and VCT and the economics of using those products in fresh sweetcorn-based rotations. These two parts of the analysis represent different stages of the same value chain. At the enterprise level, VC and VCT are marketable products whose profitability depends on production cost, processing intensity, selling price, and market access. At the farm level, the same products become production inputs whose economic value depends on the yield, pest management, soil health, and residual-crop benefits they generate relative to their application costs. The results show that an input can be profitable to manufacture and sell but expensive to retain and apply in crop production.
Under the assumed retail-market prices, value addition through VCT production substantially improved enterprise performance. The VC-only system did not recover its annual cost, whereas the VCT-only and integrated VC + VCT systems produced CBR values of 3.15 and 1.91, respectively. The allocation analysis further showed that the combined enterprise crossed the modeled break-even point when approximately 5.9% of total VC output was converted into VCT. The base allocation of 24% was therefore sufficiently high to produce a positive enterprise return. These results indicate that the economic limitation of the VC-only system was not necessarily VC production itself. The low value was captured when the material was sold without further processing at the assumed retail price.
This finding is consistent with the broader principle that organic-residue enterprises often depend on value addition, market differentiation, and spreading fixed costs across several products. Nevertheless, the outcome is not universal. Field studies show that vermicompost can generate positive economic returns when crop-yield gains are large enough to offset amendment costs. For example, partial-budget analysis in faba bean production found that compost and vermicompost treatments increased yield and economic returns relative to mineral fertilization. However, profitability differed among compost types and application rates [
30]. The contrast with the present VC-only production enterprise illustrates that profitability depends on what is being evaluated: the return from selling VC as a product is different from the return obtained when VC is applied to a crop and generates additional marketable yield.
The bulk-sales analysis further indicated that market channel was a major determinant of the modeled profitability of the VC and VCT production systems. All three VC/VCT production systems became unprofitable at bulk prices, even though VCT-only production remained closest to break-even. The VCT-only system required a comparatively modest 19.1% increase in the evaluated bulk price to break even, while the integrated and VC-only systems required much larger price increases. Therefore, the high profitability observed under retail assumptions should not be interpreted as evidence that all VCT production operations will be profitable. It depends on access to retail or specialty markets capable of absorbing 75,708 L annually at the assumed selling price. The sensitivity analysis nevertheless showed that VCT-only and integrated production remained profitable when retail prices declined by 20% and labor costs increased by 20%, suggesting that their base-case retail performance was not dependent on a single narrowly defined scenario.
Recent evidence also indicates that expanding interest in vermicompost does not eliminate the importance of local production costs and market conditions. A six-year smallholder study reported substantial increases in vermicompost production in several farming communities, while simultaneously identifying raw-material availability, environmental constraints, farmer participation, and difficulties in product sale as important limitations to sustained adoption and commercialization [
31]. Recent comparative economic analysis has likewise shown that vermicomposting can produce marketable organic amendments whose selling value exceeds production cost under favorable local conditions, profitability depends on feedstock, labor, operating costs, production scale, and available markets [
32]. These recent findings are consistent with the present results: demand for biologically based soil amendments may create opportunities for VC and VCT enterprises, but market growth alone does not guarantee profitability. The ability to capture retail- or differentiated-market value remains critical, particularly when production and processing costs are substantially higher than prices obtainable through bulk sales.
The enterprise results also establish an opportunity cost for field application. VCT retained for application to fresh sweetcorn is VCT that cannot be sold. Consequently, repeated high-volume applications should generate sufficient crop revenue or longer-term system benefits to justify both the direct production cost and the income forgone by not selling the product. This explains why VCT can be the most profitable enterprise product while simultaneously being the least economical input under an intensive field-application schedule.
4.2. Agronomic Effectiveness and Field-Level Partial-Budget Performance
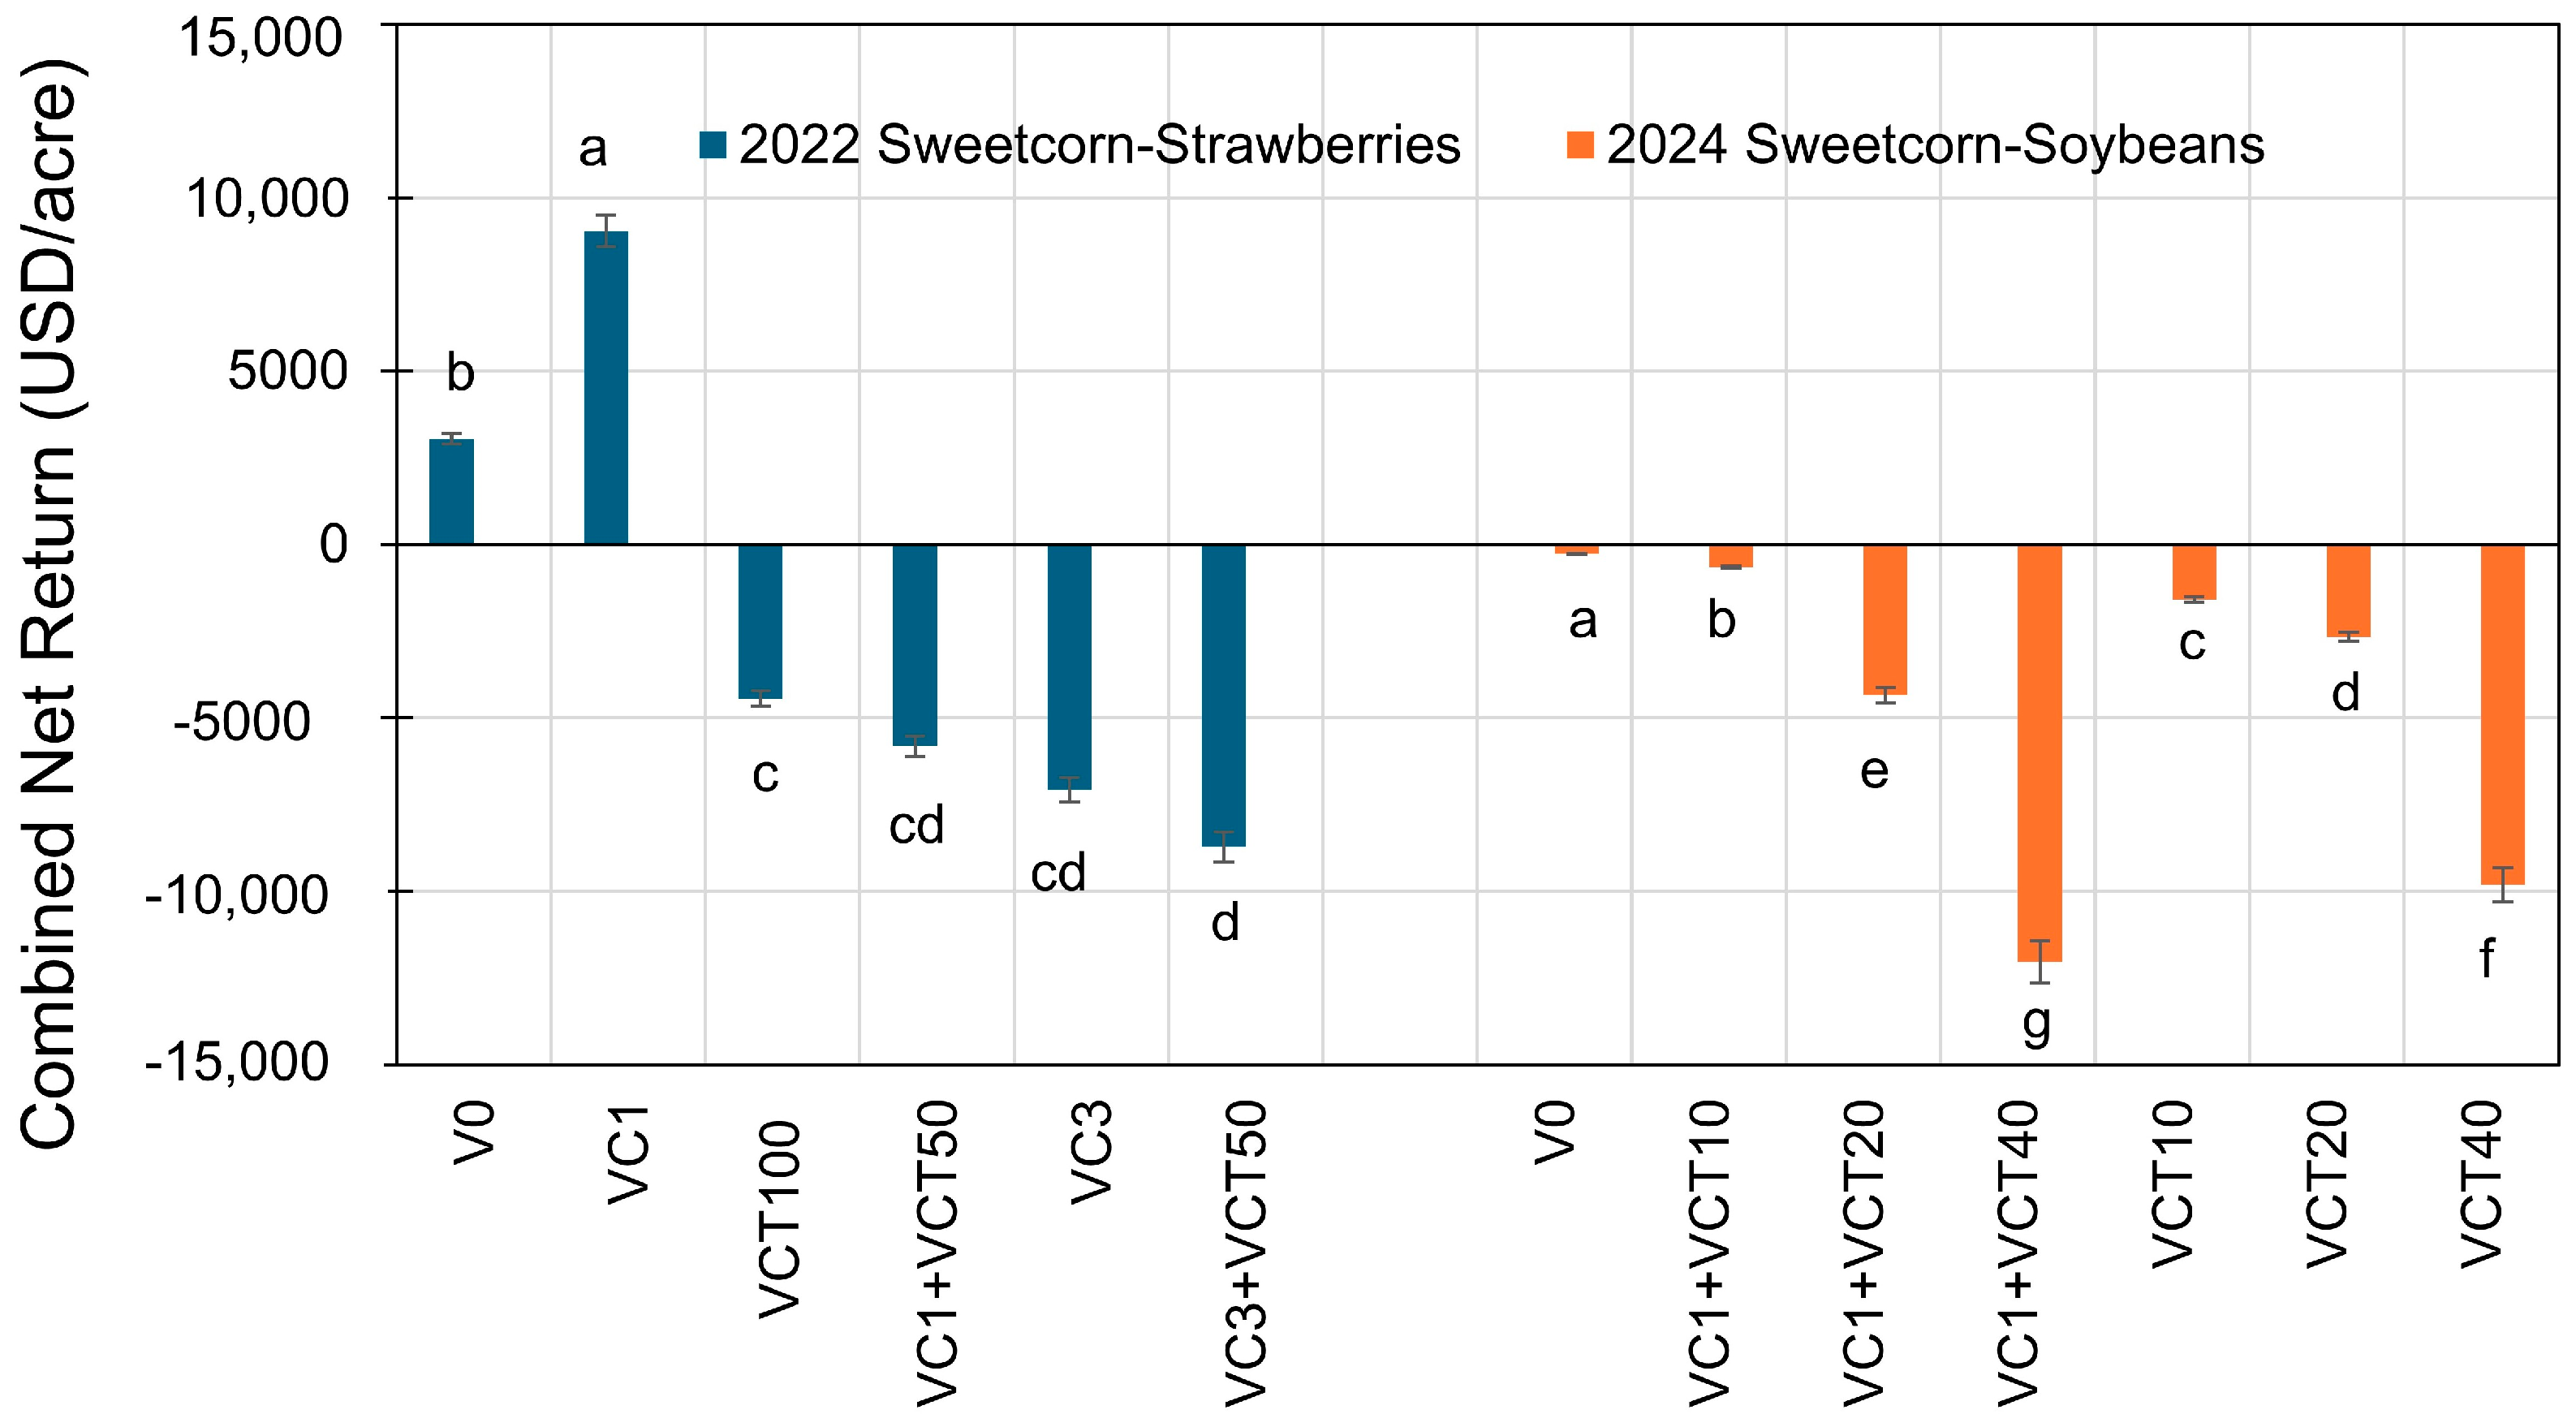
The fresh sweetcorn results reveal a clear distinction between agronomic effectiveness and the ability of crop revenue to recover the costs included in the partial budget. In 2022, VCT100 and VC3 + VCT50 produced among the highest fresh sweetcorn yields, yet neither recovered its variable production costs under the experimental six-application schedule. In contrast, VC1 generated the highest net return and CBR even though it did not produce the highest yield. The one-time, moderate VC application therefore generated a more favorable balance between crop response and input cost than the repeated VCT applications.
The biological findings from the original 2022 experiment help explain why the VCT-containing treatments performed well agronomically. VC and VCT improved plant nutrient uptake, relative chlorophyll content, growth, and physiological status. VC1 + VCT50 remained free from FAW infestation throughout the season, while VC1 delayed infestation until a later growth stage [
6]. These results support the agronomic value of VC and VCT, the present economic analysis shows that the biological response was not large enough to recover the full cost of six applications when extrapolated to 36,000 plants/acre.
The same divergence was even more apparent in 2024. VCT20 and VCT40 produced the highest fresh sweetcorn yields and experienced complete FAW suppression, while the untreated control had the lowest yield and moderate FAW infestation [
7]. The original study also documented improved surface and subsurface soil nutrient contents, enhanced nutrient uptake, greater chlorophyll content, and increased plant growth in the amended treatments. However, none of the seven treatments recovered total variable cost under the six-application program. VCT20, despite producing the highest yield, recorded a net loss because the value of the additional fresh sweetcorn did not offset the concentrated VCT application costs. VCT40 and VC1 + VCT40 were even more economically constrained because higher concentrations increased VCT consumption without producing a proportional yield increase.
This result does not invalidate the agronomic conclusions of the original experiments. Instead, it means that VCT20 can be biologically effective for nutrient supply, fresh cob production, and FAW suppression while remaining economically unsuitable when applied at 100 mL/plant on six occasions at the evaluated concentrate price. Agronomic efficiency concerns the crop response to an input; economic efficiency concerns whether the monetary value of that response exceeds the cost of obtaining it. Sustainable input recommendations require considering both conditions.
Published VCT studies similarly show that biological responses can be variable and context-dependent. In field evaluations involving cereals and vegetables, VCT increased microbial abundance and produced some crop-quality benefits but did not consistently increase yield [
33]. In a short-term vegetable system, VCT temporarily altered soil food-web indicators and reduced some nematode populations, the cover crop increased zucchini yield rather than VCT drenching [
34]. These studies agree with the present conclusion that VCT should not be assumed to generate a sufficiently large marketable-yield response under every production system. Product composition, feedstock, extraction method, concentration, application timing, crop, soil conditions, and pest pressure can all affect the outcome.
The year-to-year differences in the present study also demonstrate the importance of crop prices and background fertility. The 2024 fresh sweetcorn price of USD 32.80/CWT was lower than the 2022 price of USD 42.10/CWT, reducing revenue per unit of yield. In addition, the 2024 control was untreated, whereas the 2022 control received organic fertilizer. These differences contributed to the lower control yield in 2024 and to the larger agronomic response to VCT, but the response did not compensate for the intensive application cost. The results therefore show that treatment selection should not be based solely on yield ranking or pest suppression.
4.3. Effect of VCT Application Volume and Frequency on Field Use
The application-intensity analyses identify the main reason that VCT became economically unfavorable. At a plant population of 36,000 plants/acre, applying 100 mL of a 20% VCT solution required 720 L of concentrated VCT per acre for each application. Six applications required 4320 L of concentrate per acre. At a 40% concentration, the corresponding requirement doubled to 1440 L per application and 8640 L over six applications. Even before adding application labor, these quantities created a large treatment cost.
The cost-threshold analyses showed that reducing either application volume or frequency substantially expanded the number of scenarios that reached break-even. In 2022, VCT100 was profitable with only two applications at 100 mL/plant, while VC1 + VCT50 was profitable with one application and VC3 + VCT50 did not reach break-even at that volume. In 2024, the maximum profitable frequency at 100 mL/plant ranged from four applications for VC1 + VCT10 to zero for VC1 + VCT40. All treatments were below break-even when 100 mL/plant was applied six times.
The economic pattern resembles findings from FAW insecticide-frequency studies, where the value of yield protected should be compared with the product and labor cost of every spray. A field experiment in northern Ghana found that the optimum FAW management schedule depended on treatment efficacy, application frequency, market price, and spraying cost rather than on maximum spray frequency alone [
35]. Although VCT is not equivalent to a conventional insecticide, the economic principle is the same: repeated applications should continue only while the expected value of the additional benefit exceeds the marginal application cost.
The threshold results presented here should be interpreted with caution because observed yield was held constant while VCT cost was reduced. They demonstrate how partial-budget net returns and break-even status would change mathematically under lower input intensity. They do not establish that one or two applications would reproduce the yield, nutrient, or FAW-suppression response observed under six applications. Future research therefore should not recommend fewer applications. It is to determine the minimum biologically effective schedule through field experimentation.
Such optimization could examine applications targeted to critical fresh sweetcorn growth stages, reduced per-plant volumes, lower concentrations, separate foliar and soil-drench programs, precision delivery, and on-farm VCT production. Mechanization could reduce labor cost, but it would not eliminate the material cost generated by high concentrate volumes. The ideal program would preserve the agronomic and preventive pest-management benefits while reducing the amount of VCT applied per acre.
4.4. Effect of Residual Crop Responses in Recovering Fresh Sweetcorn Losses
The strawberry and soybean phases show why amendment economics should be assessed across rotations rather than only during the initial fresh sweetcorn crop. Neither residual crop received additional VC or VCT. The subsequent yields and revenues therefore represent economic outcomes observed under the carryover treatment conditions established during the preceding fresh sweetcorn phase. Although corresponding agronomic studies reported treatment-related soil and plant nutrient changes [
9,
10], this economic analysis does not independently establish that these changes caused the later-season yield responses.
In the strawberry phase, VC1 generated the highest marketable yield, net return, and CBR. Its residual strawberry net return was more than four times the control’s and was sufficient to make the combined VC1 fresh sweetcorn–strawberry rotation the best-performing 2022 system. Moderate solid VC therefore provided value in two ways: it supported the fresh sweetcorn crop at a manageable cost. It was followed by strong yield and economic performance in the high-value strawberry phase. This association is consistent with residual soil effects reported in the corresponding agronomic study [
10]. The present economic analysis does not isolate residual nutrient availability as the sole cause of the strawberry response.
This result agrees with field research showing that vermicompost can increase strawberry growth, flower production, and marketable fruit yield, although the response may not increase linearly with application rate. Arancon et al. reported marketable strawberry-yield increases of up to 35% following vermicompost application, with location-dependent responses to 5 and 10 t/ha rates [
36]. The absence of a consistent dose–response relationship in that study supports the present observation that more VC was not necessarily better.
The failure of VC3 and VC3 + VCT50 to produce marketable strawberries is economically and agronomically important. The original strawberry study found high sodium concentrations in the amended soils. It associated the poor growth, low chlorophyll indicators, low stomatal conductance, and poor marketability of high-rate treatments with salinity stress [
10]. The results indicate that residual nutrient quantity alone may not adequately reflect soil quality. A treatment can increase soil N, P, organic matter, and cation exchange capacity while also creating ionic or salinity conditions that reduce the performance of a salt-sensitive crop. Feedstock selection, electrical conductivity, sodium concentration, amendment maturity, and receiving-crop sensitivity should therefore be screened before recommending high VC rates.
The soybean phase produced a different outcome. Every soybean treatment generated a positive net return because soybean production costs were comparatively low and the original amendment costs were not charged again. VC1 + VCT20 produced the highest soybean yield, net return, and CBR, indicating that this moderate combined treatment generated the most economically valuable carryover outcome. The corresponding agronomic study reported greater residual soil nutrient retention, cation exchange capacity, leaf nutrient uptake, chlorophyll content, stomatal conductance, biomass, and yield in amended treatments, particularly VC1 + VCT20 [
9]. These findings support a possible soil- and nutrient-mediated explanation, although the present economic analysis does not establish a direct causal relationship between individual soil properties and soybean yield.
Soybean adds an important ecological dimension to the rotation. Through symbiotic biological nitrogen fixation and rhizosphere activity, soybean can reduce its direct dependence on fertilizer N and stimulate nutrient cycling. In the original experiment, soil N and organic matter increased during the soybean phase even in the untreated control, although amended soils retained higher nutrient pools [
9]. Nevertheless, soybean should not automatically be described as providing a large net N credit to every subsequent crop. Recent isotope-based evidence indicates that soybean can be approximately N-neutral when considering N removal in harvested grain [
37]. The interpretation is that soybean supports biological N acquisition, rhizosphere cycling, crop diversification, and reduced in-season fertilizer demand. At the same time, the magnitude of any net soil-N contribution depends on biomass retention, grain removal, nodulation, and management.
Despite the positive soybean returns, all 2024 fresh sweetcorn–soybean rotations remained negative. Soybean reduced the loss inherited from the fresh sweetcorn phase but could not compensate for the cost of six high-volume VCT applications. By contrast, the higher-value strawberry crop allowed the moderate VC1 system to produce a strong positive rotation return in 2022. This comparison shows that residual benefits matter, but they cannot be assumed to rescue an economically inefficient first crop. Rotation-level feasibility depends on the economic performance of both phases, the value of the residual crop, and the magnitude of the initial amendment investment.
The contrasting outcomes observed in the 2022 fresh sweetcorn–strawberry and 2024 fresh sweetcorn–soybean experiments should be interpreted descriptively rather than as evidence of a year effect. The experiments differed in treatment structure, control treatment, VCT concentration or application-volume structure, fresh sweetcorn market price, and subsequent rotational crop. Consequently, differences in yield or economic performance between the two experiments cannot be attributed specifically to year or tested as formal interannual treatment effects. Instead, the experiments provide two independent examples of how economic outcomes may differ under distinct treatment, crop-sequence, and market conditions. The market-price, labor-cost, product-allocation, and application-intensity sensitivity analyses were therefore used to evaluate the robustness of the respective base-case conclusions under plausible economic risk conditions.
4.5. Interpretation Within an Integrated Nutrient- and Pest-Management Framework
The integration proposed here should be distinguished from experimental co-application. VC and VCT were evaluated in the fresh sweetcorn-based rotation experiments. In contrast, the azadirachtin nanopesticide was developed and evaluated separately and is assessed in the present study through its production economics. The purpose of the integrated framework is therefore not to imply that these inputs were tested together, but to connect their complementary management functions within a prospective decision pathway: VC/VCT provide preventive soil-fertility, nutrient-management, and plant-resilience functions, while scouting determines whether a separate direct FAW intervention may be required. Field-scale testing of this combined management pathway remains necessary before its joint agronomic or economic performance can be established.
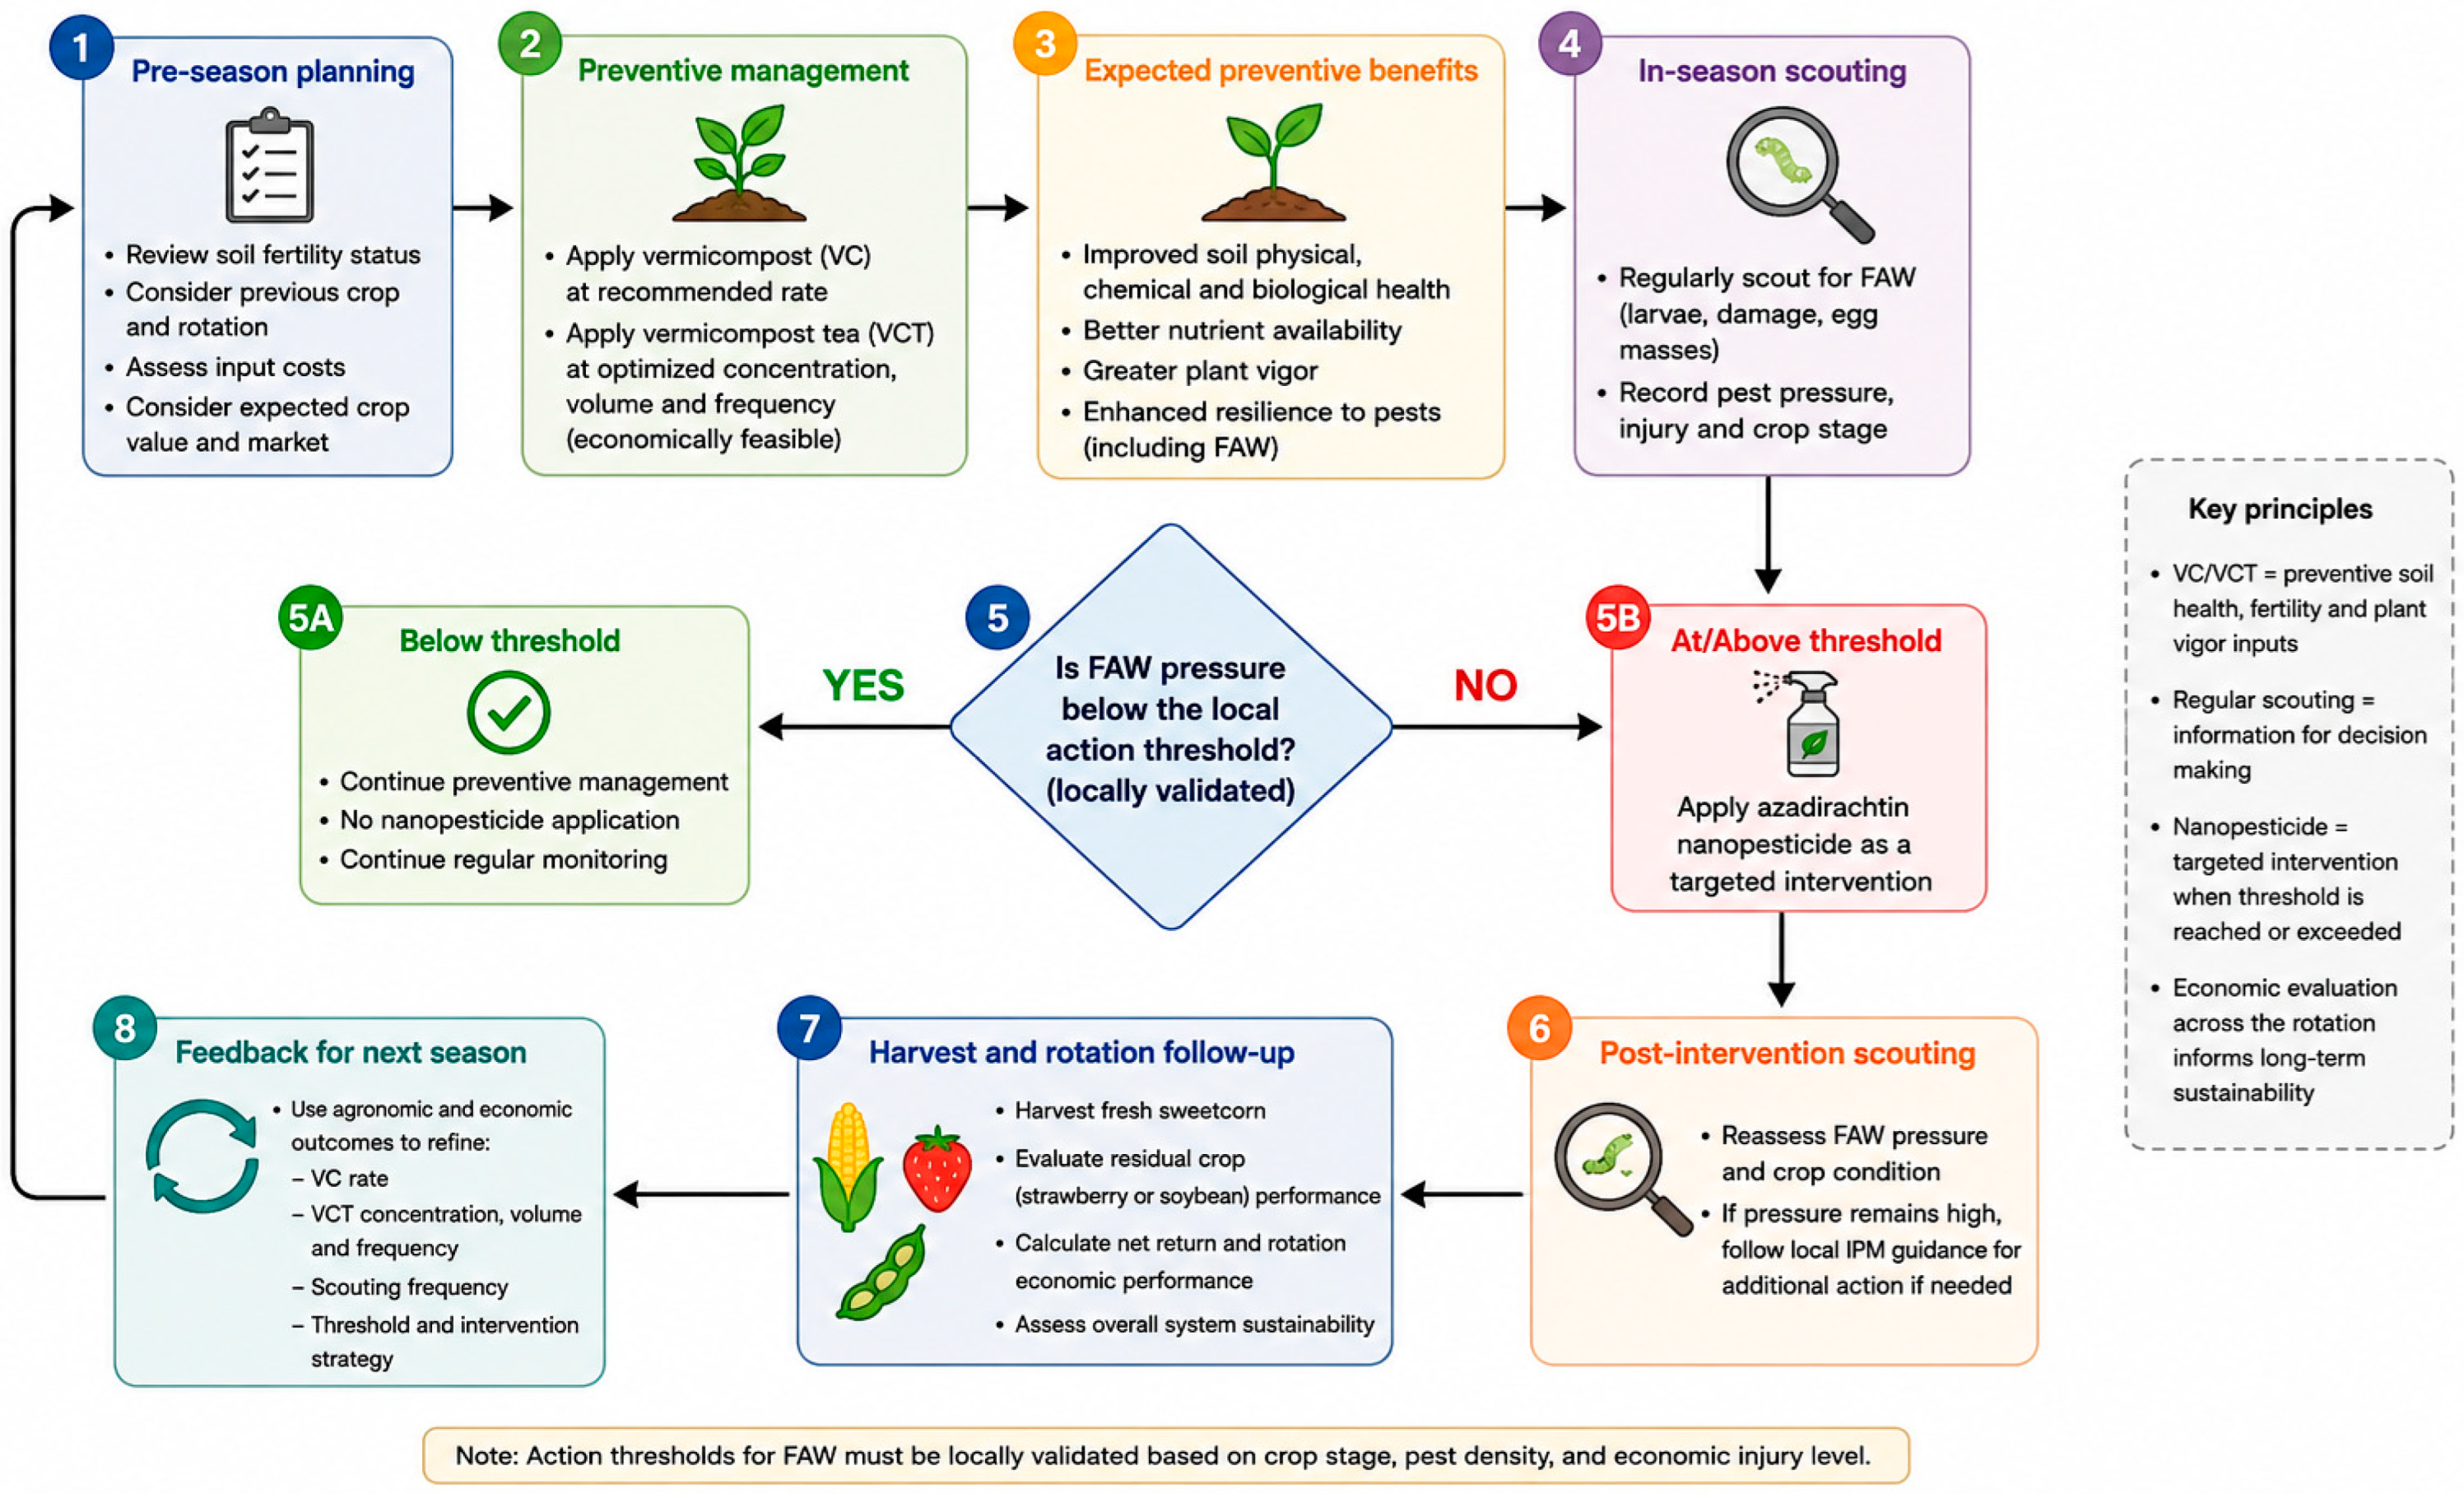
The IPM framework provides the scientific connection between VC/VCT and the azadirachtin nanopesticide, but the connection depends on assigning each input a distinct function. VC and VCT function primarily as preventive soil-fertility, nutrient-delivery, and plant-vigor inputs, with any associated reduction in FAW pressure interpreted as a resilience-building benefit rather than direct insecticidal control. Regular scouting during the fresh sweetcorn phase then determines whether preventive management is sufficient. When monitored FAW pressure remains below a locally validated action threshold, no direct pesticide intervention is required, and crop management continues with monitoring alone. When FAW pressure persists or exceeds that threshold, the azadirachtin nanopesticide becomes a targeted intervention. This decision pathway, together with the evaluation of residual crop responses and economic outcomes, is summarized in
Figure 3.
The previous field studies support the preventive role of VC and VCT. In 2022, VC1 + VCT50 remained free from FAW damage, and VC1 delayed infestation [
6]. In 2024, VCT20 and VCT40 experienced no FAW infestation, while VCT10 and the VC + VCT treatments had only slight damage compared with the untreated control [
7]. Comparable pest suppression has been reported in other cropping systems. Low rates of solid vermicompost reduced cucumber beetle populations and tomato hornworm damage in field and greenhouse experiments, while aqueous vermicompost extracts suppressed cucumber beetles and hornworms under controlled conditions [
38].
The proposed mechanisms include improved nutrient status, changes in plant secondary metabolites, humic substances, microbial activity, and induced plant defenses. However, these responses are not guaranteed. VCT suppression of root-knot nematodes, for example, differed with vermicompost curing stage and did not persist across all response measures [
39]. Thus, VC and VCT should not be presented as replacements for direct FAW control under every level of pest pressure.
It would therefore be inaccurate to state that VC and VCT “failed” and were replaced by the nanopesticide. A stronger interpretation is that they occupy the first, preventive layer of an IPM program. Healthy plants supported by balanced nutrition and biologically active soils may tolerate or resist some pest pressure, reducing the probability or urgency of direct intervention. When scouting shows that FAW pressure continues to increase and approaches a locally validated action threshold, a selective control may then be justified. In this case under the IPM framework: VC/VCT support prevention and resilience, while the nanopesticide serves as a targeted intervention.
Action thresholds are inherently economic. They depend not only on pest density or leaf damage, but also on crop growth stage, expected yield loss, crop price, treatment efficacy, control cost, and application labor. Therefore, this study does not transfer a numerical FAW threshold from another location or grain-maize system directly to fresh sweetcorn; rather, it recommends local monitoring and threshold validation. Evidence from FAW-management trials shows that both treatment frequency and economic performance change with pest pressure and treatment cost [
35].
4.6. Nanopesticide Production Feasibility and Its Supporting IPM Role
The azadirachtin nanopesticide provides the direct-control component of the proposed IPM strategy. The previously developed cellulose acetate–neem extract and cellulose acetate–neem oil formulations improved azadirachtin stability and release behavior and produced substantial FAW mortality [
22]. The neem-extract formulation was the stronger treatment: concentrations of 20% or more were effective during the early bioassay period, the estimated concentration producing 50% mortality stabilized near 13%, and the 50% formulation achieved complete mortality by day 5. The study also reported reduced leaf damage from seed-applied fibers and no acute or chronic earthworm toxicity under the evaluated conditions [
22].
Other azadirachtin nanoformulation studies support these properties. Nanoencapsulation using whey protein improved UV stability, biodistribution, and larvicidal efficacy against FAW compared with bulk azadirachtin [
19]. A more recent glycine-based formulation similarly reduced photodegradation, sustained release over seven days, and increased larvicidal potency [
40]. Such findings support the technical rationale for nanopesticides: natural active ingredients that degrade rapidly or have limited solubility may become more effective when protected and released through a carrier.
Technical efficacy, however, does not establish commercial profitability [
41,
42]. At the base target price of USD 105.67/L, the annualized nanopesticide enterprise generated a net profit of USD 4378 (
Table 6 and
Supplementary Table S11). The corresponding net profit margin was 3.1%, while the CBR was 1.032. The enterprise was therefore slightly profitable under the base assumptions, the small net margin indicates limited capacity to absorb increases in raw-material prices, labor, fixed costs, or marketing expenses.
The break-even price further demonstrates how narrow the result is. Production required a selling price of USD 102.36/L, compared with the base target price of USD 105.67/L, giving a difference of only USD 3.30/L. Selling prices of USD 25/L and USD 50/L did not recover annual costs, whereas USD 150/L generated a substantially higher positive return. The analysis therefore does not demonstrate secure or broadly transferable profitability [
42]. Instead, it suggests that production may be marginally feasible when the concentrated product can be sold near the assumed specialty-product price and when the modeled cost structure can be maintained.
The treatment of startup capital should also be considered when interpreting this narrow margin. The reported break-even price of USD 102.36/L and net profit margin of 3.1% are based on the stated straight-line allocation of the USD 23,747 startup investment over a 10-year economic life. A shorter assumed economic life, a higher cost of capital, or earlier equipment replacement would increase the annual capital charge, raising the break-even selling price and reducing the reported net margin. Conversely, a longer useful life or recoverable salvage value could reduce the annualized capital burden. Because asset-specific useful lives, financing conditions, replacement schedules, and salvage values were unavailable, these alternatives were not modeled. The reported nanopesticide margin should therefore be interpreted as conditional on the stated annualization assumption rather than as a discounted long-term investment return.
The recent literature indicates that the commercialization challenge identified here remains relevant despite continuing advances in nano-enabled crop protection. A 2026 review of nano-agrochemicals reported that these products still account for less than 1% of the global agrochemical market, indicating that technical development has not yet translated into widespread market penetration [
43]. Recent reviews of nanopesticides similarly identify manufacturing scale-up, formulation stability, quality control, regulatory assessment, and cost-effectiveness as continuing barriers to commercial deployment [
44]. These observations support the present finding that favorable biological performance alone is insufficient to establish commercial feasibility. For the azadirachtin formulation evaluated here, the narrow difference between the modeled selling price and break-even price further indicates that reductions in production cost, improved manufacturing efficiency, and verified market demand will be important before commercial-scale adoption can be considered financially robust.
Comparable FAW studies demonstrate why both efficacy and cost should be considered. An experiment in Uganda found that azadirachtin reduced FAW damage, although some synthetic products were more effective, showing that biological selectivity can involve efficacy trade-offs [
45]. A recent multi-location study in Burkina Faso found that several ecologically complex IPM programs produced lower gross margins because their additional costs were not matched by improved yield. At the same time, a tolerant variety combined with azadirachtin was the second-best economic strategy [
46]. These findings closely parallel the main conclusion of the present study: environmentally desirable or biologically effective technologies require explicit economic evaluation before adoption.
The present nanopesticide estimates remain incomplete on both the benefit and cost sides. No revenue was assigned to avoided FAW losses, displacement of conventional insecticides, environmental or worker-safety benefits, or possible price premiums in differentiated markets. Conversely, the annual production budget should not be interpreted as the complete cost of bringing a new biopesticide from laboratory development to commercial use. Several expenditures arise between successful formulation and routine farm adoption and can substantially increase a new product’s capital and working-capital requirements.
These additional or “hidden” commercialization costs may include regulatory registration and dossier preparation; toxicological, ecotoxicological, residue, and environmental-fate testing required for authorization; formulation optimization and validation during scale-up; batch-to-batch quality assurance and analytical testing; stability and shelf-life studies; packaging and labeling development; storage and transportation under appropriate conditions; intellectual-property and licensing expenses where applicable; manufacturing validation and losses from rejected or out-of-specification batches; distributor and retailer margins; product promotion, farmer demonstrations, extension and applicator training; application equipment and field-delivery costs; insurance and regulatory compliance; and post-market monitoring. Some of these expenditures occur before the first commercial sale, whereas others recur throughout production and distribution. Their magnitude will vary substantially by jurisdiction, production scale, formulation, regulatory classification, and market channel and therefore could not be defensibly quantified from the available experimental data. Accordingly, the present analysis should be interpreted as a production-feasibility assessment rather than a complete commercialization or investment appraisal. A field- and market-level assessment would require verified application rates, treatment frequency, measured yield protection, displacement of conventional pesticide applications, and product-specific regulatory, manufacturing, distribution, and market-entry costs.
4.7. Practical Implications, Limitations, and Research Priorities
The findings support a differentiated strategy rather than a single recommendation for all three inputs.
For input enterprises, VCT production offered the greatest modeled return under retail pricing, while bulk-market sales were insufficient. Producers would therefore require verified demand, appropriate packaging, distribution capacity, and market segmentation before allocating most VC to VCT. The apparent profitability of 100% conversion should not be interpreted as a recommendation to convert all VC unless the market can absorb the full volume without reducing the selling price.
For field nutrient management, moderate solid VC was more economically stable than intensive VCT use. It was applied once, required less repeated labor, and produced residual value in the strawberry phase. VCT remains agronomically promising, especially at moderate concentrations, but the present cost-threshold analysis does not identify a biologically or economically optimal application schedule. Instead, it identifies combinations of application volume and frequency that warrant field testing to determine whether lower input intensity can maintain acceptable yield and FAW-suppression responses while reducing treatment costs. The current six-application schedules were experimental agronomic programs and should not be interpreted as economically optimized farm recommendations.
Adoption feasibility will differ between commercial input enterprises and individual smallholder farms. Moderate solid VC application may be more accessible to smallholders because it requires a single application and less specialized equipment and repeated labor than intensive VCT programs. In contrast, frequent high-volume VCT application and electrospun nanopesticide production may be difficult for individual farmers to adopt because of material requirements, labor demand, processing equipment, quality-control needs, and startup costs. Cooperative production units, farmer associations, local input enterprises, shared application equipment, extension support, and credit or matching-grant programs could reduce these barriers by distributing fixed costs and improving access to standardized products. Policy support should therefore prioritize locally adapted application recommendations, producer training, product-quality standards, transparent labeling, and field validation rather than promoting maximum input use.
Organic-market integration may provide an additional adoption pathway, but compatibility with organic certification should not be assumed solely because the inputs are biologically derived. VC and VCT production would require verification of feedstock origin, processing practices, contamination risks, and compliance with the applicable organic-input standards. Similarly, an azadirachtin nanopesticide would require regulatory registration, formulation-quality assurance, residue and non-target safety evaluation, and confirmation that both the active ingredient and carrier system are permitted under the relevant certification framework. When these requirements are met, certified organic or other differentiated markets may improve market access and support premium pricing. Future commercial-scale economic assessments should include the costs of certification, documentation, quality assurance, and regulatory compliance.
For rotation planning, residual crops should be included in amendment decisions. Practitioners should also avoid assuming that increasing the rate of an organic amendment will necessarily improve subsequent crop performance. In the strawberry phase, the high-rate VC3 and VC3 + VCT50 treatments produced no marketable fruit, and the corresponding agronomic study associated their poor performance with elevated soil sodium and salinity stress [
10]. This finding is particularly important for salt-sensitive crops such as strawberry because excessive application of some organic amendments may increase soluble salts even while improving other soil-fertility indicators. Before adopting high VC rates, practitioners should consider amendment feedstock, maturity, electrical conductivity, sodium concentration, application rate, and the salt sensitivity of the receiving crop. Moderate application rates should be preferred unless higher rates have been demonstrated to be agronomically safe under the relevant soil, amendment, and crop conditions. Soybean produced lower direct revenue than strawberry but offered relatively low production cost, biological N acquisition, crop diversification, and residual soil-health functions. These services can improve system resilience even when they do not fully offset a loss in the preceding fresh sweetcorn phase.
For FAW management, the proposed system should begin with soil health, balanced nutrition, crop scouting, and preventive resilience. A targeted azadirachtin nanopesticide could then be considered when monitored FAW pressure persists or reaches a locally defined action threshold. It should not be applied routinely merely because it is biologically derived. Need-based use is important because repeated application of any pest-control input can reduce economic performance. Research on optimum spray frequency for FAW has similarly shown that the least costly effective schedule can be more attractive than the most intensive schedule [
35].
Several limitations should guide interpretation of the findings of this study. First, fresh sweetcorn yields were extrapolated from four-plant experimental units in small raised-bed plots to an assumed population of 36,000 plants/acre. Although this is a commercially relevant scaling density supported by published corn-production guidance and sweetcorn plant-population experiments [
27,
28], extrapolation from small experimental units introduces uncertainty because per-plant performance may not scale perfectly to full commercial fields. Larger fields can differ in plant-to-plant competition, spatial variability, pest pressure, microclimate, stand uniformity, and management efficiency. The extrapolated yields, revenues, and plant-dependent VCT requirements should therefore be interpreted as standardized acre-equivalent estimates used for economic comparison among treatments rather than as directly measured commercial-field performance. Field-scale validation would be required to determine the absolute yields and profitability of these treatments under specific commercial production conditions. Consequently, positive crop- or rotation-level net returns indicate recovery of the costs included in the partial budget and should not be interpreted as estimates of complete commercial-farm profit. Second, the analysis was a partial budget and did not include all land, overhead, management, financing, or long-term capital costs. Third, crop and input prices were deterministic, although selected price and labor assumptions were examined through sensitivity analysis. Fourth, we evaluated only two fresh sweetcorn seasons and one residual crop following each season. Fifth, although the source agronomic studies reported soil and plant nutrient measurements, the present economic analysis did not independently analyze or reproduce those datasets. Differences in later-season crop performance should therefore be interpreted as associations with preceding amendment treatments rather than definitive evidence of nutrient-mediated yield improvement. Sixth, the VCT intensity analysis held yield constant and did not estimate biological responses to fewer or lower-volume applications. Seventh, the nanopesticide was not tested within the crop-rotation trials, preventing calculation of a combined field-level return on investment. Finally, the nanopesticide enterprise model assumed a common 10-year economic life for the startup investment and constant annual output, operating costs, and selling conditions. It did not model asset-specific replacement schedules, inflation, salvage value, production interruptions, or variation in annual demand. Longer-term commercial-scale data would be required to quantify interannual variability and downside risk more accurately.
The findings are also geographically and institutionally context-dependent. The crop responses were obtained under subtropical South Florida conditions in calcareous sandy-loam soil and within fresh sweetcorn–strawberry and fresh sweetcorn–soybean rotations managed at an organic research site. Agronomic performance may differ under contrasting rainfall patterns, temperatures, soil textures, soil salinity, pest pressure, production scales, and crop sequences. Economic outcomes are similarly sensitive to local labor costs, amendment feedstock availability, product prices, market access, and the cost and availability of standardized neem oil or neem extracts. The results should therefore be interpreted as evidence applicable primarily to comparable production and market conditions rather than as universally transferable profitability estimates. Site-specific field validation and locally parameterized enterprise budgets are required before recommending adoption in other regions.
The present study focused on annual enterprise budgets, partial-budget analysis, annualized capital costs, cost–benefit ratios, and price sensitivity rather than a full discounted investment appraisal. The nanopesticide analysis represented a typical annual production cycle in which the initial startup investment was allocated over an assumed 10-year economic life. The one-year cash-flow reconciliation was included only to illustrate the timing of the initial startup payment. It should not be interpreted as a complete multi-year investment analysis. Net present value, internal rate of return, discounted payback period, reinvestment requirements, asset replacement, inflation, and changes in future product demand were not estimated. Future studies using commercial-scale production data over the full economic life of the equipment could apply discounted-cash-flow methods to evaluate long-term investment feasibility.
Future research should evaluate the full strategy in a field-scale factorial IPM experiment. Such a study could compare moderate VC, alternative VCT volumes and application frequencies, and monitored threshold-triggered nanopesticide use against conventional and untreated systems. It should measure fresh sweetcorn yield and quality, FAW damage, nanopesticide application rate, avoided conventional sprays, labor, soil-health changes, residual strawberry or soybean performance, non-target effects, and whole-rotation net returns over several years. Stochastic or Monte Carlo analysis could then quantify uncertainty in crop prices, labor, pest pressure, and product demand.
The study indicates that VC, VCT, and azadirachtin nanopesticides can be coherently evaluated within an integrated nutrient- and pest-management framework without implying that they were applied together in the same field experiment. VC and VCT contribute to nutrient management, soil-health improvement, plant vigor, and preventive pest resilience. At the same time, the subsequent crop results in this study represent treatment-associated carryover responses rather than independently established residual-fertility effects. The nanopesticide contributes a potential direct FAW-control option when additional intervention is justified. Their economic feasibility, however, is not automatic. It depends on product market, application intensity, crop value, residual benefits, pest pressure, and the cost of the management function each input is expected to perform.