1. Introduction
Global climate deterioration and ecological degradation have grown increasingly severe throughout the 21st century, making sustainable development a core consensus of global governance. Having achieved long-term rapid economic progress, China—the largest developing country worldwide—now suffers from multiple daunting ecological pressures, namely, strained resource supplies, pervasive environmental pollution, and impaired ecological functions. Against this backdrop, balancing economic development with environmental protection has become a core issue in advancing sustainable development. In recent years, China has witnessed a pivotal shift in its developmental philosophy. Rather than focusing solely on economic growth, the country now targets high-quality integrated development of economic, social and environmental systems [
1,
2]. Such strategic adjustment aims to elevate the overall level of ecological welfare performance [
3,
4], a concept that comprehensively reflects the intricate relationship between ecological resource consumption and human well-being.
Cities, as major hubs of population, industry, and resources, are both primary sources of ecological–environmental pressure and key arenas for achieving green transformation and improving ecological welfare [
5,
6]. Improving urban ecological welfare performance is defined as creating superior economic outputs, healthier ecological surroundings and optimized public services while minimizing resource depletion and environmental pollution. This essential advancement ultimately delivers holistic upgrades to the living standards of urban residents. However, this transition faces significant funding gaps and technical bottlenecks, as the traditional financial system, which favors short-term high-return projects, struggles to effectively support green projects that have positive externalities but require long investment cycles and carry higher risks. In the current ecological and economic context, green finance development plays a vital policy role in optimizing capital allocation. By diverting social capital resources to eco-friendly and low-carbon fields, this approach solves capital shortages in ecological management and boosts the sustainable upgrading of the regional economy [
7,
8,
9].
In 2015, the concept of a green finance system was formally incorporated into China’s national policy framework, marking the starting point of China’s booming green finance industry. Over the years, the scale of green credit has kept rising, the domestic green bond market has secured a top-tier position worldwide, various innovative green financial products have flourished, and national pilot reform zones have yielded replicable and promotable development practices. These practices indicate that green finance has entered a stage of large-scale policy implementation, and academic circles have conducted extensive research on its environmental and economic effects, confirming its positive role in energy conservation and emission reduction, industrial structure upgrading, and achieving the “dual-carbon” goals. However, a critical question remains underexplored: as a financial innovation that coordinates environment and economy, does green finance effectively translate into and enhance urban comprehensive ecological welfare performance (EWP), and through what mechanisms? The answer to this question directly relates to the precision and effectiveness of policy design.
Although research on green finance and sustainable development has yielded fruitful results [
10,
11,
12,
13], studies focusing on how green finance affects multi-dimensional urban EWP and revealing its underlying mechanisms still present significant theoretical and practical gaps, mainly in three aspects: First, there are issues of “insufficient granularity” and a “mechanism black box” in research perspectives. Existing studies mostly rely on national or provincial macro-data, which struggle to capture the internal heterogeneity of urban units. As cities are the core carriers of policy implementation and direct recipients of ecological welfare, macro-level analyses tend to obscure key features and mechanisms. More critically, the pathways through which green finance affects EWP remain systematically unclear. Current research predominantly focuses on direct environmental effects or indirect economic impacts, lacking a chain-like examination of how green finance translates into comprehensive welfare through mediating variables such as green technological innovation, particularly the core transmission path of “optimal allocation of financial resources → green technological breakthroughs → enhanced EWP,” which lacks large-sample urban data support. Second, temporal dynamics are neglected. The effects of green finance policies exhibit time lags and a cumulative nature, and their relationship with EWP may evolve dynamically with development stages, policy intensity, and market conditions. However, existing empirical studies often rely on short-term panel or cross-sectional data, which struggle to capture long-term effects and may lead to underestimating the policy’s long-term efficacy. Third, regional heterogeneity and the complexity of China’s practice are insufficiently addressed. China faces pronounced regional developmental imbalances: eastern coastal areas, leveraging their economic foundation and policy advantages, may lead in green finance development and EWP improvement, while central and western regions, northeastern areas, and resource-dependent cities confront challenges such as high transition pressure, weak financial infrastructure, and inadequate technological innovation capacity. This heterogeneity is critical for formulating targeted policies but remains underexplored.
Building on the above research background, this study addresses two key research inquiries: whether the progression of green finance exerts a significant promotional impact on the overall EWP of Chinese cities, and what the specific direction and strength of this influencing mechanism are. Whether green technological innovation serves as a core mediator throughout the impact process remains to be examined. Specifically, this paper intends to test whether the cascaded logic “green finance drives green innovation, thereby improving EWP” holds valid. Do these effects exhibit temporal dynamics and significant regional heterogeneity? What are the underlying causes?
This study constructs a city-level multi-dimensional measurement system and employs methods such as two-way fixed effects models and mediation effect tests to make marginal contributions in three aspects: Theoretically, using, for the first time, large-sample city-level data across China, this study systematically empirically tests and verifies the partial mediation effect of green technological innovation between green finance and EWP. It breaks through the previous “black box” research limitation. This study offers novel micro-level evidence to clarify the underlying functional mechanism of green finance. Furthermore, it strengthens the theoretical intersection among environmental finance, innovative economics and sustainable development research.
This study delivers methodological contributions by establishing a comprehensive urban evaluation system and adopting optimized empirical strategies. It pioneers a multi-dimensional green finance evaluation indicator system for prefecture-level cities, which encompasses seven key aspects, such as green credit, investment and insurance. With the entropy weight method applied to quantify index scores, this research supports accurate cross-city horizontal comparisons. For EWP measurement, it constructs a comprehensive indicator system including four types of inputs (capital, labor, etc.), three types of desirable outputs (economic, environmental, and public services), and three types of undesirable outputs (wastewater, etc.), and applies the SBM-Undesirable model for Data Envelopment Analysis to accurately capture real efficiency under resource constraints. Leveraging 20-year long-period data, it fully captures policy cumulative effects and dynamic evolution, laying the foundation for analyzing nonlinear characteristics. Comprehensive robustness tests and subgroup heterogeneity analysis ensure the reliability and generalizability of conclusions.
This paper proceeds with the subsequent chapters, as outlined below: Theoretical Analysis and Hypothesis Development will systematically review the literature on green finance, urban ecological welfare performance, and green technological innovation, deeply analyze their logical connections, and propose four core research hypotheses. Research Design will elaborate on data sources, sample selection criteria, and measurement methods for core variables. Data Analysis and Results will present descriptive statistics, correlation analysis, hypothesis testing, robustness tests, and key findings from temporal and regional heterogeneity analysis. Conclusions and Discussion will systematically summarize the main findings, discuss their theoretical contributions and policy implications, and identify research limitations and future directions. Through rigorous theoretical construction, meticulous methodological design, and solid empirical analysis, this study aims to provide new insights into understanding how green finance influences urban ecological welfare improvement, offering academic wisdom to promote precise and efficient policies and support China’s goals of high-quality development and modernization characterized by harmony between humanity and nature.
2. Theoretical Analysis and Hypothesis Development
2.1. Literature Review
Green finance serves as a vital bridge connecting ecological governance and economic sustainability, with its theoretical system progressively maturing from qualitative definition to quantitative measurement. In prior research, Wang, Zhao and Bi [
14] developed a GFI evaluation framework based on a combination of entropy weighting and improved AHP techniques. By adopting green credit, carbon market performance and other relevant metrics, their study verified the fast-developing trajectory of China’s green finance industry from 2011 to 2019. In practical policy implementation, China’s green credit stock has maintained a 12% annual growth ratefollowing the launch of the national green finance system guidelines in 2016. Even so, unbalanced regional development continues to constrain the homogeneous progress of green finance nationwide. Lv, Bian, Lee and He [
15], using distributional dynamics methods (Dagum Gini coefficient decomposition, kernel density estimation, and Markov chain analysis) with Chinese provincial data for 2010–2019, found that China’s green finance development exhibits a ladder-shaped regional distribution across the east, central, west, and northeast regions, with the inter-regional gap constituting the main source of the overall disparity, and called for differentiated policies to promote coordinated regional development.
Using a stochastic frontier production function model with Jiangsu Province data covering the period of 2005–2019, He, Fang and Xie [
3] found that industrial structure exerts significant negative spatial spillover effects on urban EWP, while technological innovation and industrial structure optimization positively contribute to urban welfare performance, with innovation level exhibiting significant threshold effects. In an empirical investigation of the Yangtze River Economic Belt using the SE-SBM approach, Bao, Ding, Zhang and Ma [
16] verified that urban EWP presents a typical U-shaped spatial distribution, with eastern regions outperforming western areas. The research further indicated that economic urbanization and social urbanization exert significant positive effects on EWP, whereas population urbanization and land urbanization exert significant negative inhibitory effects on EWP.
The available literature verifies that green finance exerts its promotional influence by means of indirect pathways. Recent evidence further suggests that green finance policy can facilitate urban low-carbon advancement by stimulating green innovation and optimizing resource allocation [
17].
We adopt ecological modernization theory as the core theoretical basis for analyzing the relationship between green finance and ecological welfare performance (EWP). Ecological modernization theory rejects the zero-sum view that economic growth must come at the expense of environmental degradation. Instead, it holds that modern societies can achieve synergistic advancement of economic benefits and ecological protection, with technological innovation acting as the central driving force for such win–win transitions.
From this theoretical perspective, green finance provides important capital-side conditions to realize the logic of ecological modernization at the city level. By means of differentiated credit allocation, green finance raises the financing cost of high-pollution and high-energy-consumption activities, while delivering favorable financial support for low-carbon transformation projects. This reshapes enterprises’ cost–benefit trade-offs and motivates them to expand investment in green-oriented research and development. Therefore, green technological innovation becomes the key transmission channel. Green innovation improves resource utilization efficiency and curtails pollutant emissions, enabling economic production to be maintained or expanded with reduced ecological resource input. When such micro-level enterprise behaviors accumulate at the regional level, they jointly promote the comprehensive improvement of urban ecological welfare performance, which covers both economic welfare output and ecological environmental quality.
2.2. Research Hypotheses
Green finance, as a core policy tool for directing capital toward eco-friendly industries, is closely associated with urban ecological welfare performance. In terms of capital allocation outcomes, green finance steers social capital toward energy-saving, environmental protection and clean-energy sectors. This resource-guiding function is realized via differentiated interest rate instruments as well as financial vehicles, including green credits and green bonds [
18,
19]. This directly drives the implementation of urban ecological infrastructure construction and pollution control projects. Essentially, this capital guidance mechanism optimizes resource allocation via market-based means, enabling eco-friendly industries to gain more financial support and thereby enhancing EWP. As Ozili [
19] noted, green finance is a necessary financial innovation for achieving ecological environmental protection and effectively avoiding environmental risks, as it promotes coordinated economic and environmental development by directing capital flows. Furthermore, green finance mobilizes private capital for environmental projects, reduces pollution, and improves ecological efficiency by optimizing energy structures.
From the perspective of risk management and incentive mechanisms, green finance internalizes corporate environmental costs through environmental risk assessment systems, forcing high-pollution industries to transform or exit the market. This dual-mechanism of “punitive pricing + incentive subsidies” not only optimizes industrial structure but also indirectly enhances EWP by improving environmental quality. In their investigation of the nexus between green finance and circular economy development, Agrawal et al. [
20] highlighted that green-finance-related dimensions carry substantial weight in investment-related decision making, which makes long-run capital inflows into green, sustainable economic undertakings feasible. By establishing monitoring mechanisms to ensure financing budgets are allocated to eco-friendly products, green finance effectively reduces business risks and supply chain complexity, creating favorable conditions for the sustained improvement of urban ecological welfare. Additionally, green finance drives sustained growth in EWP by supporting green technological innovation, forming a theoretical closed loop of synergy among capital allocation, risk management, and technological innovation.
Given this, this study proposes Hypothesis 1:
H1. There is a significant positive correlation between the green finance index and urban ecological welfare performance.
Defined as eco-oriented technological progress, green innovation covers the development, practical application and large-scale promotion of new technologies, production procedures, products and operational models. Such innovation activities are dedicated to environmental protection, pollution mitigation, resource efficiency optimization and long-term sustainable development [
21,
22,
23]. Essentially, it represents an integration of ecological principles and technological breakthroughs. This integration contributes to reduced energy and resource consumption, minimized environmental contamination, and balanced, integrated progress across economic, social and ecological dimensions [
24]. According to Agrawal et al. [
20], green finance primarily functions to guide societal capital toward environmental research and development as well as clean production activities via market-oriented tools represented by green bonds and green loans. This capital allocation effect not only directly alleviates financing constraints for green innovation projects but also enhances the feasibility of technology commercialization by optimizing the allocation of innovation resources. For instance, green bonds provide long-term, low-cost funding for renewable energy technology R&D, while green credits, through differentiated interest rate mechanisms, internalize the environmental costs of highly polluting enterprises, compelling them to shift towards low-carbon technological innovation paths. Meanwhile, green finance further reduces financial uncertainties in corporate green transitions through risk-sharing functions such as government subsidies, tax incentives, and environmental risk pricing. Non-polluting enterprises can obtain low-cost funding via green bonds, creating a synergistic “punishment + incentive” effect that encourages increased R&D investment and drives the marketization of green technologies from laboratories to practical applications.
Du, Zhang and Hou [
17] conceptualized China’s green finance reform and innovation pilot zones as a quasi-natural experiment and, using a difference-in-differences approach with data on Chinese cities for 2006–2020, found that the pilot policy significantly enhances carbon emission efficiency, exhibiting a sustained dynamic effect. Their mechanism analysis reveals that fostering green innovation, broadening financial supply, optimizing industrial structures, and improving energy efficiency are pivotal channels through which the pilot policy enhances carbon emission efficiency, thereby directing more capital toward green technology sectors and strengthening the construction of urban green technological innovation ecosystems.
H2. There is a significant positive correlation between the green finance index and the level of urban green technological innovation.
Revolutions in production and consumption technical frameworks fueled by eco-friendly innovation constitute the primary impetus behind the improvement of urban ecological welfare levels. Technological breakthroughs in clean production and end-stage pollution control, represented by wastewater reuse technologies, can substantially cut unit output pollution intensity. Ultimately, such progress helps renovate natural capital and significantly enhance ambient air and water quality. The proliferation of circular economy technologies, through closed-loop design of resources–products–regenerated resources, enhances resource utilization efficiency and reduces waste generation. These technological innovations not only restore ecosystem functions damaged by overexploitation but also lower environmental risks and boost the supply capacity of ecological services, providing a material basis for realizing non-market welfare such as residents’ health, education, and cultural well-being.
In addition, green technological innovation can optimize the interactive relationship between social and ecological systems, thereby indirectly enhancing the sustainable development capacity of ecological welfare performance. The rise of new energy technology industries creates high-quality jobs that elevate residents’ income levels, while intelligent environmental monitoring technologies, through real-time air quality early warning functions, enhance the efficiency of public services and increase residents’ sense of participation and gain in environmental governance. Meanwhile, the internalization of environmental costs via mechanisms such as carbon trading and improved ecological compensation systems corrects the unequal distribution of ecological welfare caused by market failures, promoting intergenerational and regional equity. This co-evolutionary process of technology and institutions essentially constructs a virtuous cycle of innovation-driven environmental improvement, shifting urban EWP beyond short-term environmental indicator optimization to a multi-dimensional performance system encompassing ecological resilience, social inclusiveness, and developmental sustainability.
H3. There is a significant positive correlation between the level of green technological innovation and urban ecological welfare performance.
The association between the green finance index and urban ecological welfare performance can be systematically explained through the mediating mechanism of green technological innovation. As an ecology-oriented resource allocation tool, green finance directly alleviates the capital constraints faced by green technological innovation by selectively reducing financing costs for green technology projects, providing funding support for environmental R&D, clean equipment procurement, and ecological restoration projects. For example, preferential interest rates on green credit for energy-saving technological transformation projects accelerate the adoption of waste heat recovery systems, while green bonds’ special financing for carbon capture technologies drives the commercialization of negative emission technologies. Once green technological innovation obtains sufficient financial resources, it enhances EWP through two pathways: the diffusion of cleaner production technologies and the improvement of resource circular efficiency, specifically by expanding the supply of ecological products such as community-level distributed photovoltaic power stations and enhancing public service intelligence like IoT-based waste classification and recycling systems. Such empirical logic demonstrates that green finance cannot improve EWP through direct linear effects. Alternatively, green technological innovation functions as a pivotal transforming channel to mediate the finance–welfare performance nexus. Through this technological mediator, the ecological orientation of financial capital is translated into perceptible welfare improvements, ultimately forming a technological mediation mechanism between financial policies and ecological welfare.
In light of this, this paper proposes Hypothesis 4:
H4. Green technological innovation plays a mediating role between the green finance index and urban ecological welfare performance.
3. Results
3.1. Data Sources
This study constructs an empirical analysis sample using panel data from 279 prefecture-level cities in China over a 20-year period (2003–2022). Choosing prefecture-level cities as the core analytical unit offers distinct suitability and representativeness: First, prefecture-level cities are the core components and key governance levels of China’s urban system. They serve as the primary implementers of national and provincial macro-policies (including green finance policies) and are the specific formulators and executors of local environmental governance, industrial development, and welfare enhancement policies, making them most suitable for observing the impact mechanisms of green finance at the urban governance practice level. Second, prefecture-level cities exhibit significant internal heterogeneity and broad representativeness in terms of economic development levels, industrial structures, resource endowments, and ecological environmental foundations, enabling research conclusions to more comprehensively reflect the effects of green finance across diverse city types and enhance generalizability and policy relevance. Finally, prefecture-level cities generally have relatively well-established and stable statistical systems, with key economic, social, and environmental data showing good continuity and comparability in official statistical materials, providing a solid foundation for large-sample, long-term quantitative analysis.
The sample includes the vast majority of Chinese prefecture-level cities with relatively stable administrative divisions and high data availability during this period. A small number of missing values in specific years were reasonably supplemented using linear interpolation after prudent evaluation to ensure data quality. This balanced panel dataset, constructed from 20 years of data across 279 prefecture-level cities, provides a reliable and targeted empirical foundation for this study to deeply examine the long-term, multi-dimensional impact mechanisms of green finance on urban ecological welfare performance.
3.2. Measurement of Core Variables
3.2.1. Urban Ecological Welfare Performance
A multi-dimensional assessment system is constructed in this work to evaluate ecological welfare performance, encompassing three modules: resource consumption, factor inputs, and ecological welfare outputs. The input side includes three types of development factors—capital (fixed asset investment), human resources (environmental management personnel), and technology (science and technology expenditure)—as well as two resource consumption indicators: industrial electricity consumption and gas supply. The output side adopts a “desired–undesired” dichotomy, with desired outputs covering three welfare categories: economic (per capita GDP), ecological (green coverage rate and pollution-disposal-related indicators), and public services (educational and medical facilities). Note that the public services dimension is further subdivided into education and healthcare sub-categories, which are reported as four separate desirable output subgroups in
Table 1 for concrete indicator illustration. Meanwhile, undesired outputs include three types of pollution emissions: industrial wastewater, sulfur dioxide, and smoke/dust. This system, through 15 sub-indicators (see
Table 1), systematically characterizes the relationship between resource–environmental inputs and ecological welfare outputs in urban development.
As a typical non-parametric efficiency evaluation method, Data Envelopment Analysis (DEA) adopts linear programming to build a production frontier, which enables the quantitative measurement of relative efficiency among decision-making units (DMUs) [
25]. Its core advantages include the following: (1) no need to prespecify a production function form, avoiding subjective assumptions of parametric models [
26]; (2) the capacity to handle multiple inputs and outputs simultaneously, aligning with the multi-dimensional nature of ecological welfare performance; and (3) the ability to identify efficiency improvement directions through slack variable analysis. This study adopts the output-oriented Super-SBM-Undesirable model under variable returns-to-scale (VRS) to calculate urban ecological welfare performance (EWP). Compared with conventional SBM-Undesirable, confined to the [0,1] interval, the super-efficiency specification excludes the evaluated decision-making unit from the reference production set. It produces efficiency scores potentially greater than 1 and achieves complete ranking for all DMUs [
27], which is beneficial for distinguishing the performance of frontier cities. Although the directional distance function (DDF) also handles mixed desirable–undesirable outputs, it is a radial technique limited to proportional input–output adjustment and ignores non-radial slack losses such as pollutant redundancy and insufficient public service provision. The SBM-Undesirable model incorporates slack terms into the objective function to capture non-proportional inefficiency, yielding less biased estimates for multi-dimensional urban EWP. Specifically, using 279 Chinese prefecture-level cities as DMUs and based on panel data from 2003 to 2022, we calculate the comprehensive ecological welfare efficiency index under resource–environmental constraints for each city. Projection analysis is then used to reveal efficiency loss pathways, such as capital misallocation and pollution redundancy, providing quantitative evidence for differentiated policy formulation.
3.2.2. Green Finance Index
To scientifically evaluate the comprehensive development level of green finance across Chinese prefecture-level cities, this study constructs a multi-dimensional evaluation index system for the green finance index and employs the entropy weight method for measurement. Proposed based on information theory, the entropy weight method serves as an objective weighting technique for quantitative evaluation [
28]. The fundamental logic of this method is straightforward: indicators with higher dispersion degrees correspond to lower information entropy values. Such indicators deliver more valid information for cross-city evaluation analyses, thereby being assigned greater weights in the final comprehensive assessment results. This method effectively avoids subjective weighting biases and sensitively captures dynamic data changes, ensuring the objectivity and scientific rigor of index measurement. The index evaluation system constructed in this study covers seven key areas of green finance, with seven specific indicators (see
Table 2).
All raw data were standardized to ensure comparability and meet the computational requirements of the entropy weight method. All sub-indicators were pooled and min–max-normalized into [0, 1] before weighting to reduce cross-metric sensitivity. Since the final index is a dimensionless composite score, unit-root tests are not conventionally applied to its inputs. We confirm all normalized sub-indicators maintain adequate temporal variation across the sample. This enables the index to be used for both cross-sectional comparisons and longitudinal analysis. The data sources strictly adhere to the principle of authority, primarily drawn from official websites of national and local statistical bureaus, statistical bulletins, the Ministry of Science and Technology, the Ministry of Ecology and Environment, and the People’s Bank of China.
3.2.3. Level of Green Technological Innovation
For the purpose of effectively evaluating the green innovation capacity of prefecture-level cities, this research employs annual urban green technology patent application volume as the proxy variable. This mature measurement approach has been widely adopted by Ma et al. [
29], Fu et al. [
30], and Bai et al. [
31]. The original data utilized in this study were retrieved from the official and authoritative patent analysis system of CNIPA. During the retrieval process, we identified and filtered green technology patents that met the definition using relevant green keywords, based on the International Patent Classification Green Inventory published by the World Intellectual Property Organization (WIPO). After data collection, we merged and summarized the information based on the application year and the address of the applicant, ultimately obtaining the number of green technology patents for 279 cities as statistical units over the 2003–2022 period. This indicator features objectivity, strong quantifiability, and authoritative and reliable data sources, effectively reflecting the activity and output scale of cities in green technology R&D and innovation. It is a commonly used and widely recognized metric for measuring the level of urban green technological innovation. Note that the GTI is constructed by dividing the raw count of urban green technology patent applications by 100, i.e., measured in hundreds of patent applications. No logarithmic transformation is implemented for this variable.
3.3. Models
The benchmark model of this study is presented as follows:
To examine the impact of green finance on the level of urban GTI, the following regression equation is constructed:
The control variables selected in this study include the GDP growth rate, proportion of secondary industry, foreign capital, population density, local general public budget expenditure, year-end loan balance of financial institutions, and number of urban employed persons.
It should be noted that two control variables, loan balance (total credit scale) and budget expenditure (total fiscal expenditure), may be contemporaneously correlated with green finance development. Nevertheless, loan balance reflects aggregate city-wide credit volume rather than green-specific credit, and budget expenditure captures overall fiscal capacity instead of only environmental fiscal spending. Two-way city and year fixed effects are applied to absorb time-invariant city heterogeneity and nationwide macro policy shocks. Complete elimination of simultaneity bias for these contemporaneous controls remains challenging given the lack of valid city-level instrumental variables, which should be noted as a caveat for interpreting baseline results.
To test the mediating effect of GTI, the following regression equation is constructed:
4. Data Analysis and Results
4.1. Descriptive Statistics and Correlation Analysis
Table 3 shows that between 2003 and 2022, the mean value of urban ecological welfare performance across 279 Chinese cities was 0.525, with a standard deviation of 0.377, a minimum of 0.001, and a maximum of 2.994. Statistical results reveal that the green finance index of the sampled cities averages 0.299, with a standard deviation of 0.106 and values ranging from 0.036 to 0.657. This evident data dispersion suggests unbalanced green finance development among different regions. Meanwhile, the urban green technological innovation level, which is quantified based on green patent applications, has a sample mean of 0.305 and a maximum observed value of 13.
Table 4 reports a statistically significant positive correlation between the green finance index and urban ecological welfare performance (r = 0.084;
p < 0.01). Similarly, a significant positive correlation exists between the level of green technological innovation and EWP (r = 0.072;
p < 0.01). Additionally, the analysis reveals a significant negative correlation between urban GDP growth rate and EWP (r = −0.042;
p < 0.01), as well as between the proportion of secondary industry and EWP (r = −0.186;
p < 0.01).
4.2. Hypothesis Testing
Table 5 presents the multiple-regression results for the green finance index, green technological innovation, and urban ecological welfare performance. Model 1 is the null model without core explanatory variables. It shows that among the selected control variables, urban GDP growth rate (β = −0.004;
p < 0.01) and foreign investment level (β = −0.009;
p < 0.05) both exhibit significant negative correlations with EWP.
Table-based regression outputs for the main effect are displayed in Model 2. With the full set of control variables held constant, there exists a significant positive association between the green finance index and EWP (β = 0.605; p < 0.01), in favor of Hypothesis 1. Model 3 reveals that the proportion of secondary industry bears a significant negative correlation with green technological innovation (β = −0.004; p < 0.01). Model 4 identifies a marked positive connection between GFI and GTI (β = 1.436; p < 0.01), supporting Hypothesis 2. The results from Model 5 further suggest a significant positive association running between GTI and EWP (β = 0.037; p < 0.01), confirming Hypothesis 3. The mediating effect of GTI is assessed in Model 6. Following the introduction of this mediating factor, GFI continues to exert a significant positive influence on EWP (β = 0.557; p < 0.01), and the regression coefficient corresponding to the mediator is likewise statistically significant (β = 0.033; p < 0.01). This set of results demonstrates that GTI serves as an intermediate transmission mechanism between GFI and EWP, verifying Hypothesis 4. Specifically, the indirect effect accounts for approximately 7.9% of the total GFI effect on EWP (a × b/c = 1.436 × 0.033/0.605 = 0.048/0.605), indicating that green technological innovation mediates about 7.9% of the total effect.
To formally test the statistical significance of the indirect effect, we supplemented the Baron–Kenny procedure with a Sobel test (Sobel, 1982) [
32], together with the Aroian (1947) [
33] and Goodman (1960) [
34] corrections. Based on the two-way fixed-effects regressions (Model 4: GFI → GTI; Model 6: EWP on GFI and GTI jointly), the indirect effect is a × b = 1.436 × 0.033 = 0.048. The Sobel test statistic is z = 3.412 (
p < 0.001); the Aroian and Goodman variants yield z = 3.387 (
p < 0.001) and z = 3.437 (
p < 0.001), respectively, indicating that green technological innovation significantly transmits the effect of green finance on urban ecological welfare performance. When city-clustered robust standard errors are used to account for within-city serial correlation, the indirect effect remains statistically significant (z = 2.524;
p = 0.012). The indirect effect accounts for approximately 7.9% of the total effect (a × b/c = 0.048/0.605), corroborating the mediation evidence from the Baron–Kenny approach [
32,
33,
34].
The R-squared values for our two-way fixed-effects models are generally moderate to low. For large prefecture-level city panel datasets, such magnitudes of R2 are fairly typical. Unit and year fixed effects absorb substantial time-invariant cross-city differences and common time-variant shocks; identification relies on within-city over-time variation, which leaves a relatively low explained proportion of total variance. It should be noted that our research focuses on estimating partial associations between variables rather than pursuing high model explanatory power, so low R2 does not undermine the reliability of coefficient-based inference within this panel setting.
4.3. Robustness Tests
Given that this study includes panel data from 279 Chinese cities over a 20-year period (2003–2022), with a large number of observational units, spatial dependence among neighboring cities may affect the regression results. To mitigate this concern, we employ a spatial lag of the dependent variable (EWP_w) as an alternative specification. The spatial lag approach captures potential spillover effects by incorporating the weighted average of EWP in neighboring cities, serving as a robustness check for the baseline two-way fixed-effects model.
Model 8 in
Table 6 shows that, using the spatial lag of EWP, the independent variable remains significantly positively correlated with the dependent variable (β = 0.360;
p < 0.01). Model 10 indicates a significant positive correlation between the green finance index and urban green technological innovation (β = 1.436;
p < 0.01). Model 12 displays mediation effect estimates obtained under the spatial lag specification. Under this specification, the core independent variable is still positively and significantly linked to the dependent variable; meanwhile, the mediator variable yields a notable positive effect on the outcome variable. This indicates that the robustness check results are consistent with the hypothesis-testing results. Hypotheses 1–4 passed the robustness test.
4.4. Heterogeneity Tests
To further examine potential heterogeneity in the data analysis results, this study conducted heterogeneity analyses in two dimensions: temporal and regional. The temporal heterogeneity analysis was necessary because the panel data spanned 20 years (2003–2022), a relatively long period, and variations in variable relationships across different development stages needed to be considered. The threshold for temporal heterogeneity testing was set at 2012. This year was chosen as a critical temporal demarcation point because 2012 marked a significant political milestone in China, the 18th National Congress of the Communist Party of China (CPC), which formed a new leadership collective. The new leadership significantly elevated its emphasis on ecological and environmental governance. This strategic shift reshaped local government incentive frameworks and laid the institutional groundwork for subsequent specialized green finance policies. For this theoretical reason, we adopt the 18thCPC Congress as our baseline time cut-off.
Model 18 in
Table 7 reveals that after the 18th CPC National Congress (post-2012), GFI maintained a significant positive correlation with EWP (β = 0.662;
p < 0.01), and GTI also demonstrated a significant positive correlation with EWP (β = 0.021;
p < 0.05).
To further examine whether the temporal heterogeneity findings are sensitive to the choice of the breakpoint year, we re-estimated the time-split regressions using 2015 as an alternative breakpoint, reflecting China’s growing green-finance policy emphasis around that period (the Guidelines on Establishing a Green Finance System were formally launched in 2016), and divided the sample into 2003–2015 and 2016–2022. The results show that green finance significantly promoted urban ecological welfare performance in both sub-periods (β = 0.905 and p < 0.01 for 2003–2015; β = 0.733 and p < 0.01 for 2016–2022), and the direct effect after controlling for green technological innovation remained statistically significant in both periods. The first-stage path from GFI to GTI was strongly significant in 2003–2015 (β = 0.954; p < 0.01) but positive and statistically insignificant in the short 2016–2022 sub-sample (β = 0.765, SE = 0.587, and p = 0.193). A structural-break interaction test on the full sample indicated that the interaction term GFI × Post was significantly positive in the GTI equation (β = 0.776; p < 0.01) and significantly negative in the EWP equation (β = −0.305; p < 0.01), while the post-2015 slope for EWP remained significantly positive (0.916 − 0.305 = 0.611). These results suggest that the insignificant first-stage path in the 2016–2022 sub-sample largely reflects the reduced statistical power of the shorter estimation window (seven years; N = 1953) rather than the disappearance of the mediating mechanism. We also acknowledge that the 2016–2022 sub-sample overlaps with the COVID-19 pandemic period, which independently disrupted municipal fiscal spending and R&D activity in China; the attenuated GFI→GTI estimate in this sub-sample may, therefore, partly reflect pandemic-induced disruptions to local fiscal capacity and innovation activity, constituting a plausible alternative explanation. Overall, replacing 2012 with 2015 as the breakpoint year does not alter the sign, significance, or qualitative conclusions of the main analysis.
Regional heterogeneity constitutes the second core analytical dimension of this study. Owing to prominent regional disparities in economic foundation, resource stock and industrial structure, exploring heterogeneous influencing mechanisms among research variables is of great necessity and research significance.
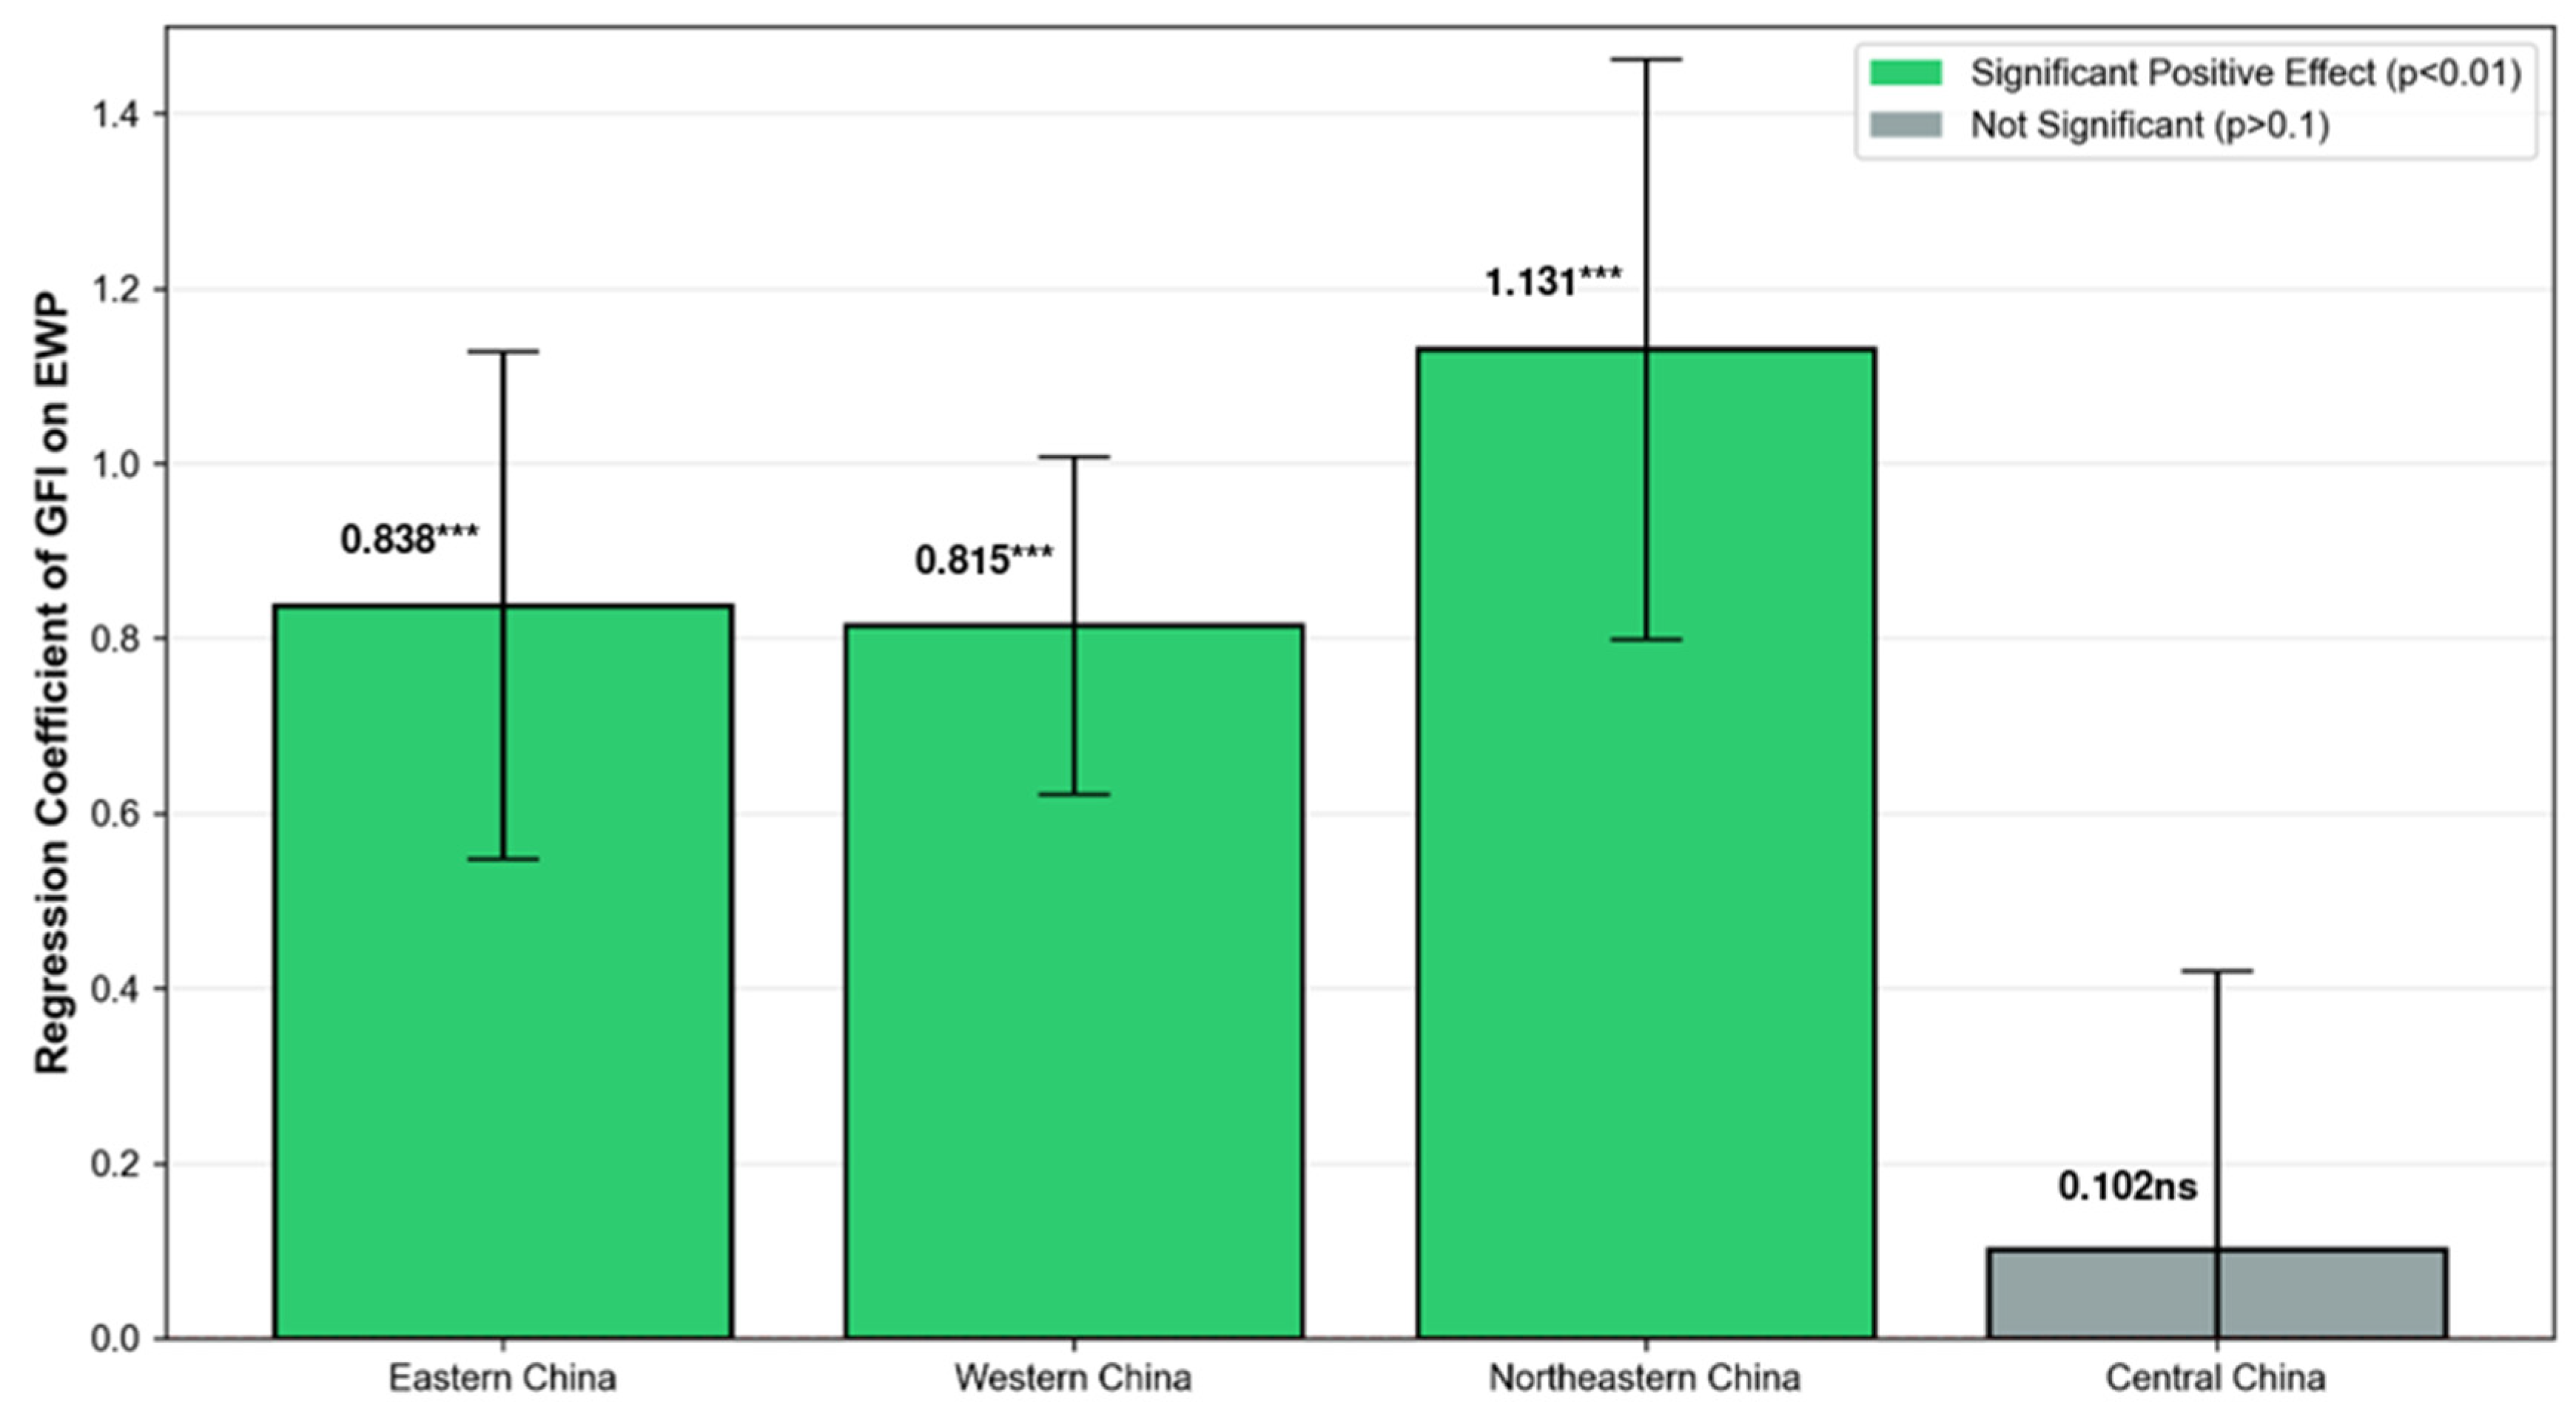
The bar chart (
Figure 1) shows significant regional differences in GFI’s effect: positive and significant in Eastern (β = 0.838 ***), Western (β = 0.815 ***) and Northeastern China (β = 1.131 ***), while insignificant in Central China (β = 0.102, ns).
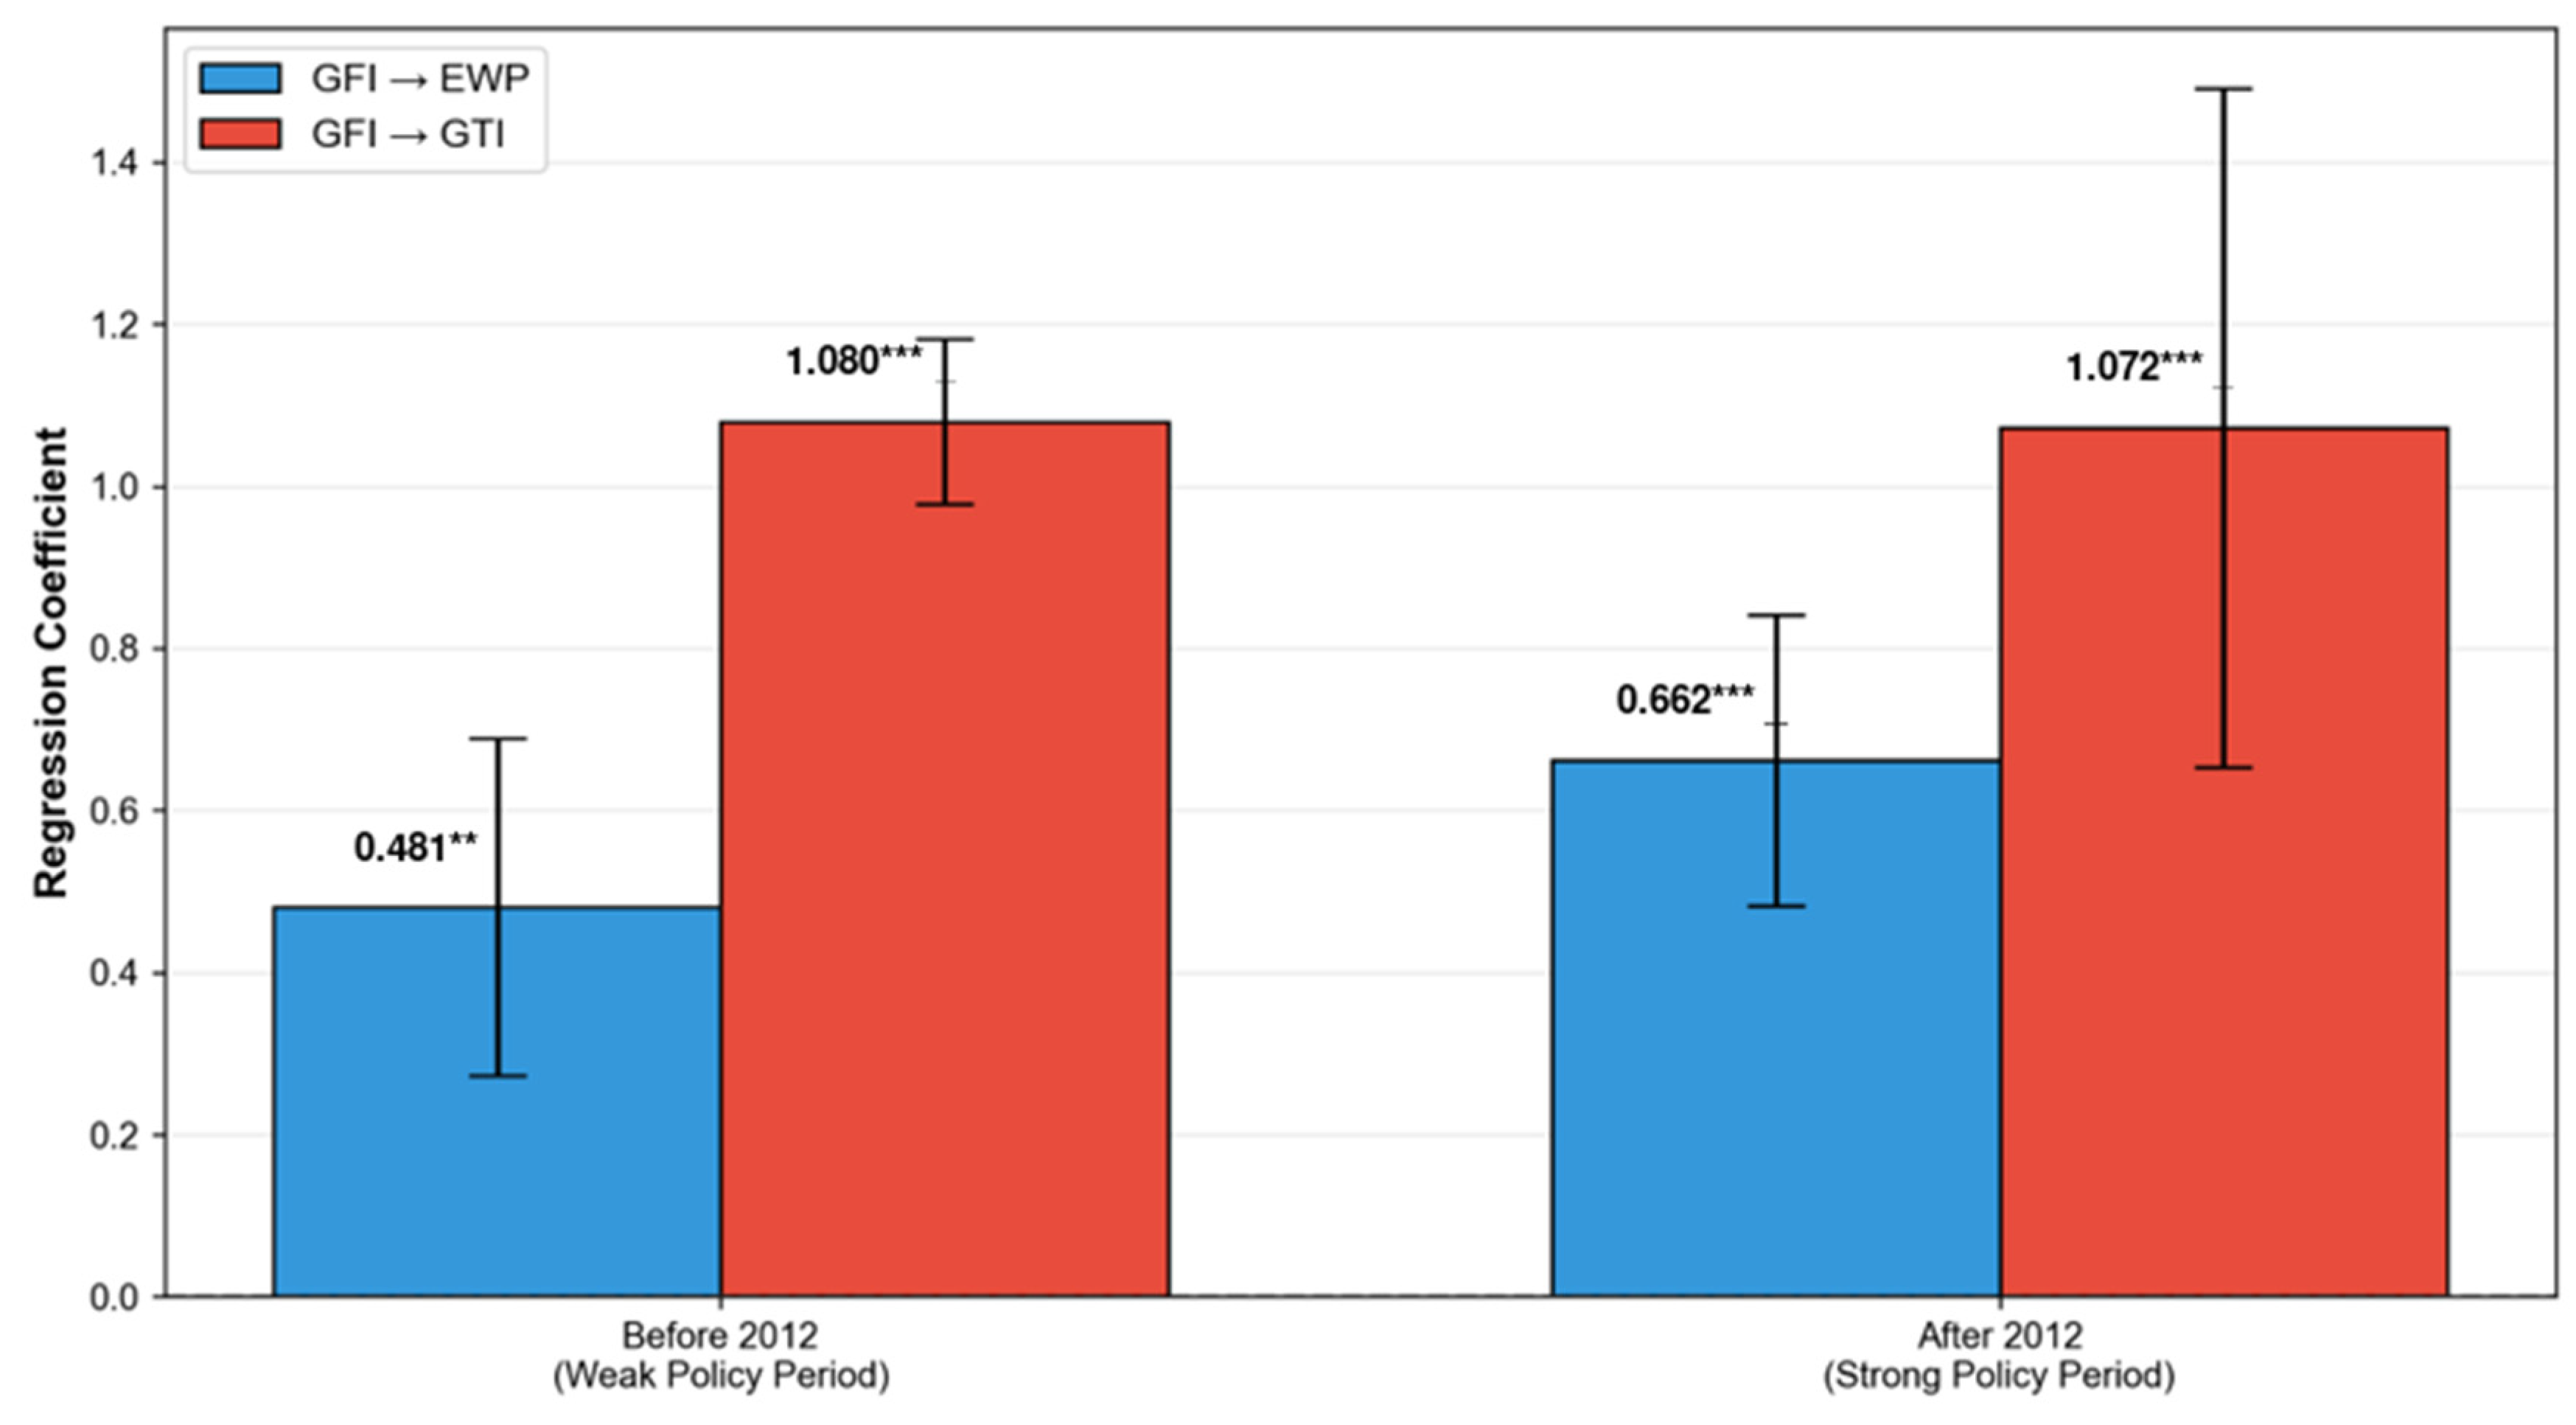
Figure 2 compares GFI’s effects before and after 2012: the positive impact of GFI on EWP and GTI persisted across periods, with a stronger effect on EWP after 2012 (β = 0.662 ***) than before (β = 0.481 **).
Table 8 presents the test results for Northeast China. The sample includes 34 cities in this region. Model 19 shows a statistically significant positive association between the green finance index and regional ecological welfare performance (β = 1.131;
p < 0.01). Similarly, Model 20 indicates a statistically significant positive association between GFI and regional green technological innovation (β = 0.874;
p < 0.01). Model 22 reveals that, after controlling for the level of green technological innovation, GFI remains statistically significantly and positively associated with regional UEWP (β = 0.991;
p < 0.01). The estimation results support this study’s theoretical assumptions in the context of Northeast China.
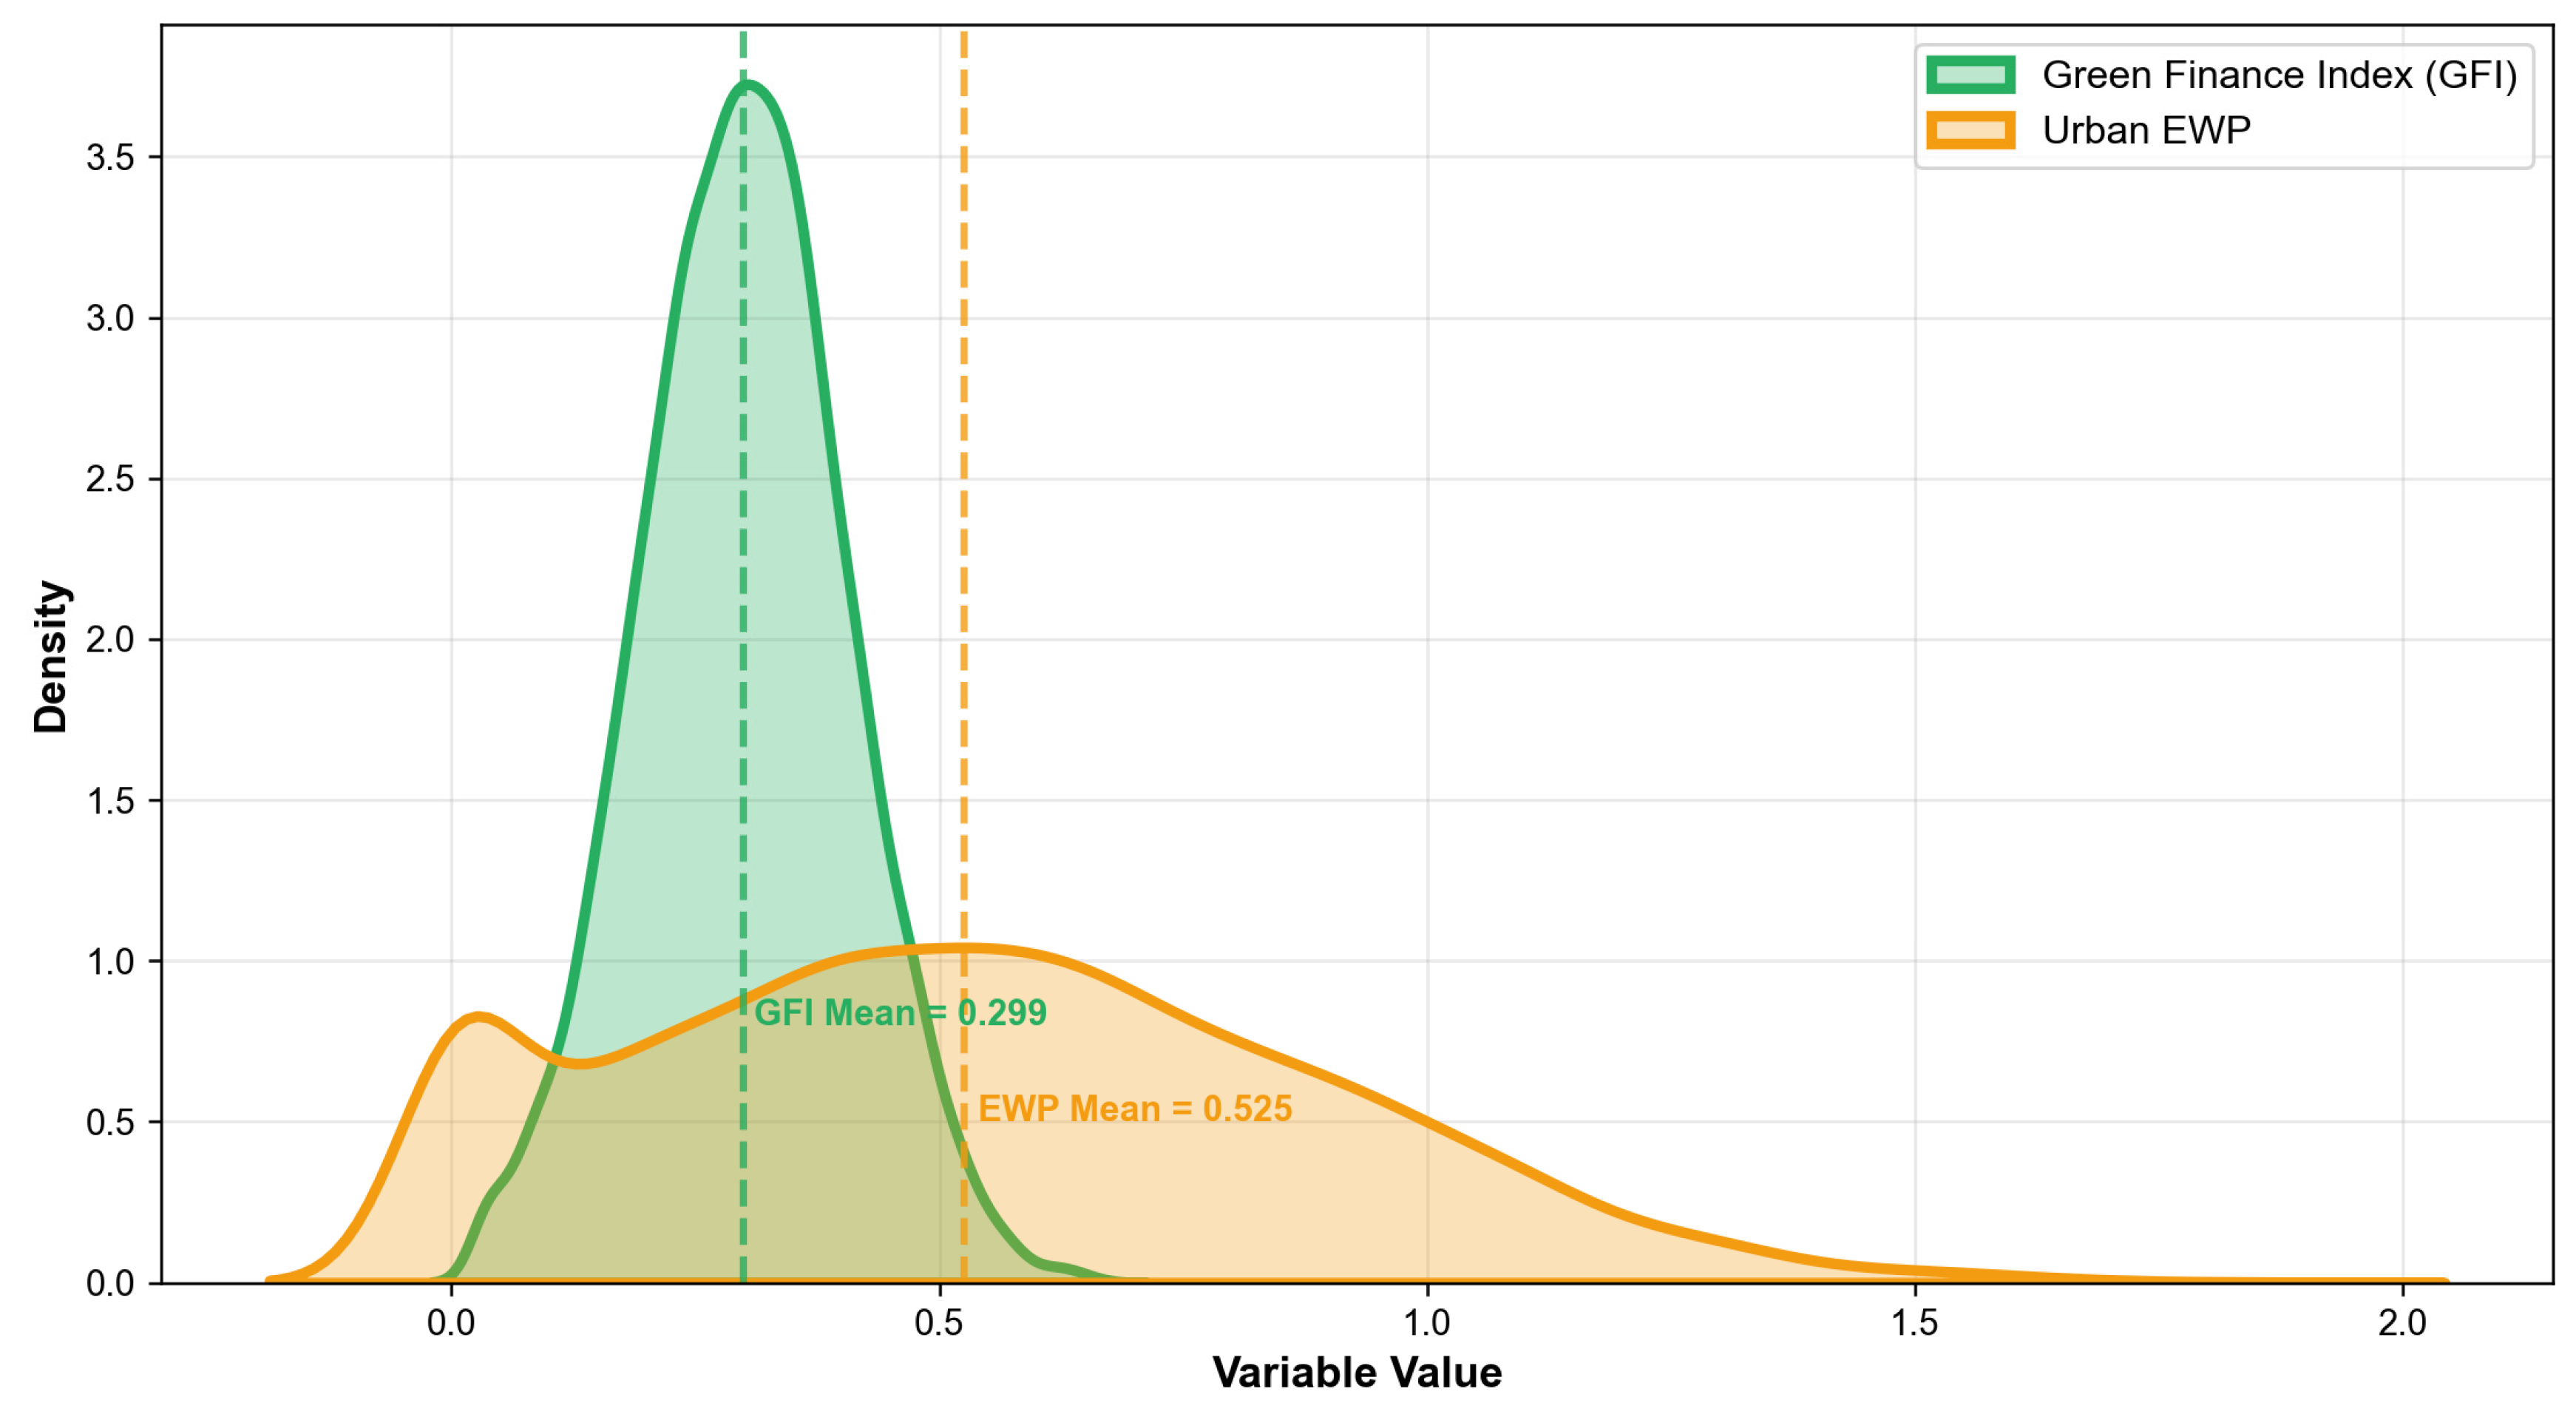
The kernel density plot (
Figure 3) depicts the distribution of GFI and EWP, with GFI having a mean of 0.299 and EWP having a mean of 0.525, reflecting the overall distribution pattern of core variables in the sample.
The estimation results for the East China region are demonstrated in
Table 9. The sample includes 83 cities in this region. Model 23 shows a statistically significant positive association between the green finance index and urban ecological welfare performance (β = 0.838;
p < 0.01). Similarly, Model 24 indicates a statistically significant positive association between GFI and regional green technological innovation (β = 2.866;
p < 0.01). As shown in Model 25, green technological innovation exerts a significant positive effect on EWP (β = 0.024;
p < 0.05). Model 26 reveals that, after controlling for the level of green technological innovation, GFI remains statistically significantly and positively associated with regional EWP (β = 0.777;
p < 0.01). Consistent with expectations, the empirical evidence validates the hypothesized associations for the East China subsample.
Empirical outcomes for the West China subsample are displayed in
Table 10, which consists of 82 prefecture-level cities. As reflected in Model 27, the green finance index exerts a prominent positive influence on urban ecological welfare performance (β = 0.815;
p < 0.01). Similarly, Model 28 indicates a significant positive correlation between GFI and regional green technological innovation (GTI) (β = 1.136;
p < 0.01). Model 29 documents a statistically significant positive relationship between green technological innovation and EWP (β = 0.135;
p < 0.01). Model 30 reveals that, after controlling for the level of green technological innovation, GFI remains significantly positively correlated with regional EWP (β = 0.679;
p < 0.01). These results confirm that the hypothesized relationships in this study hold true for West China.
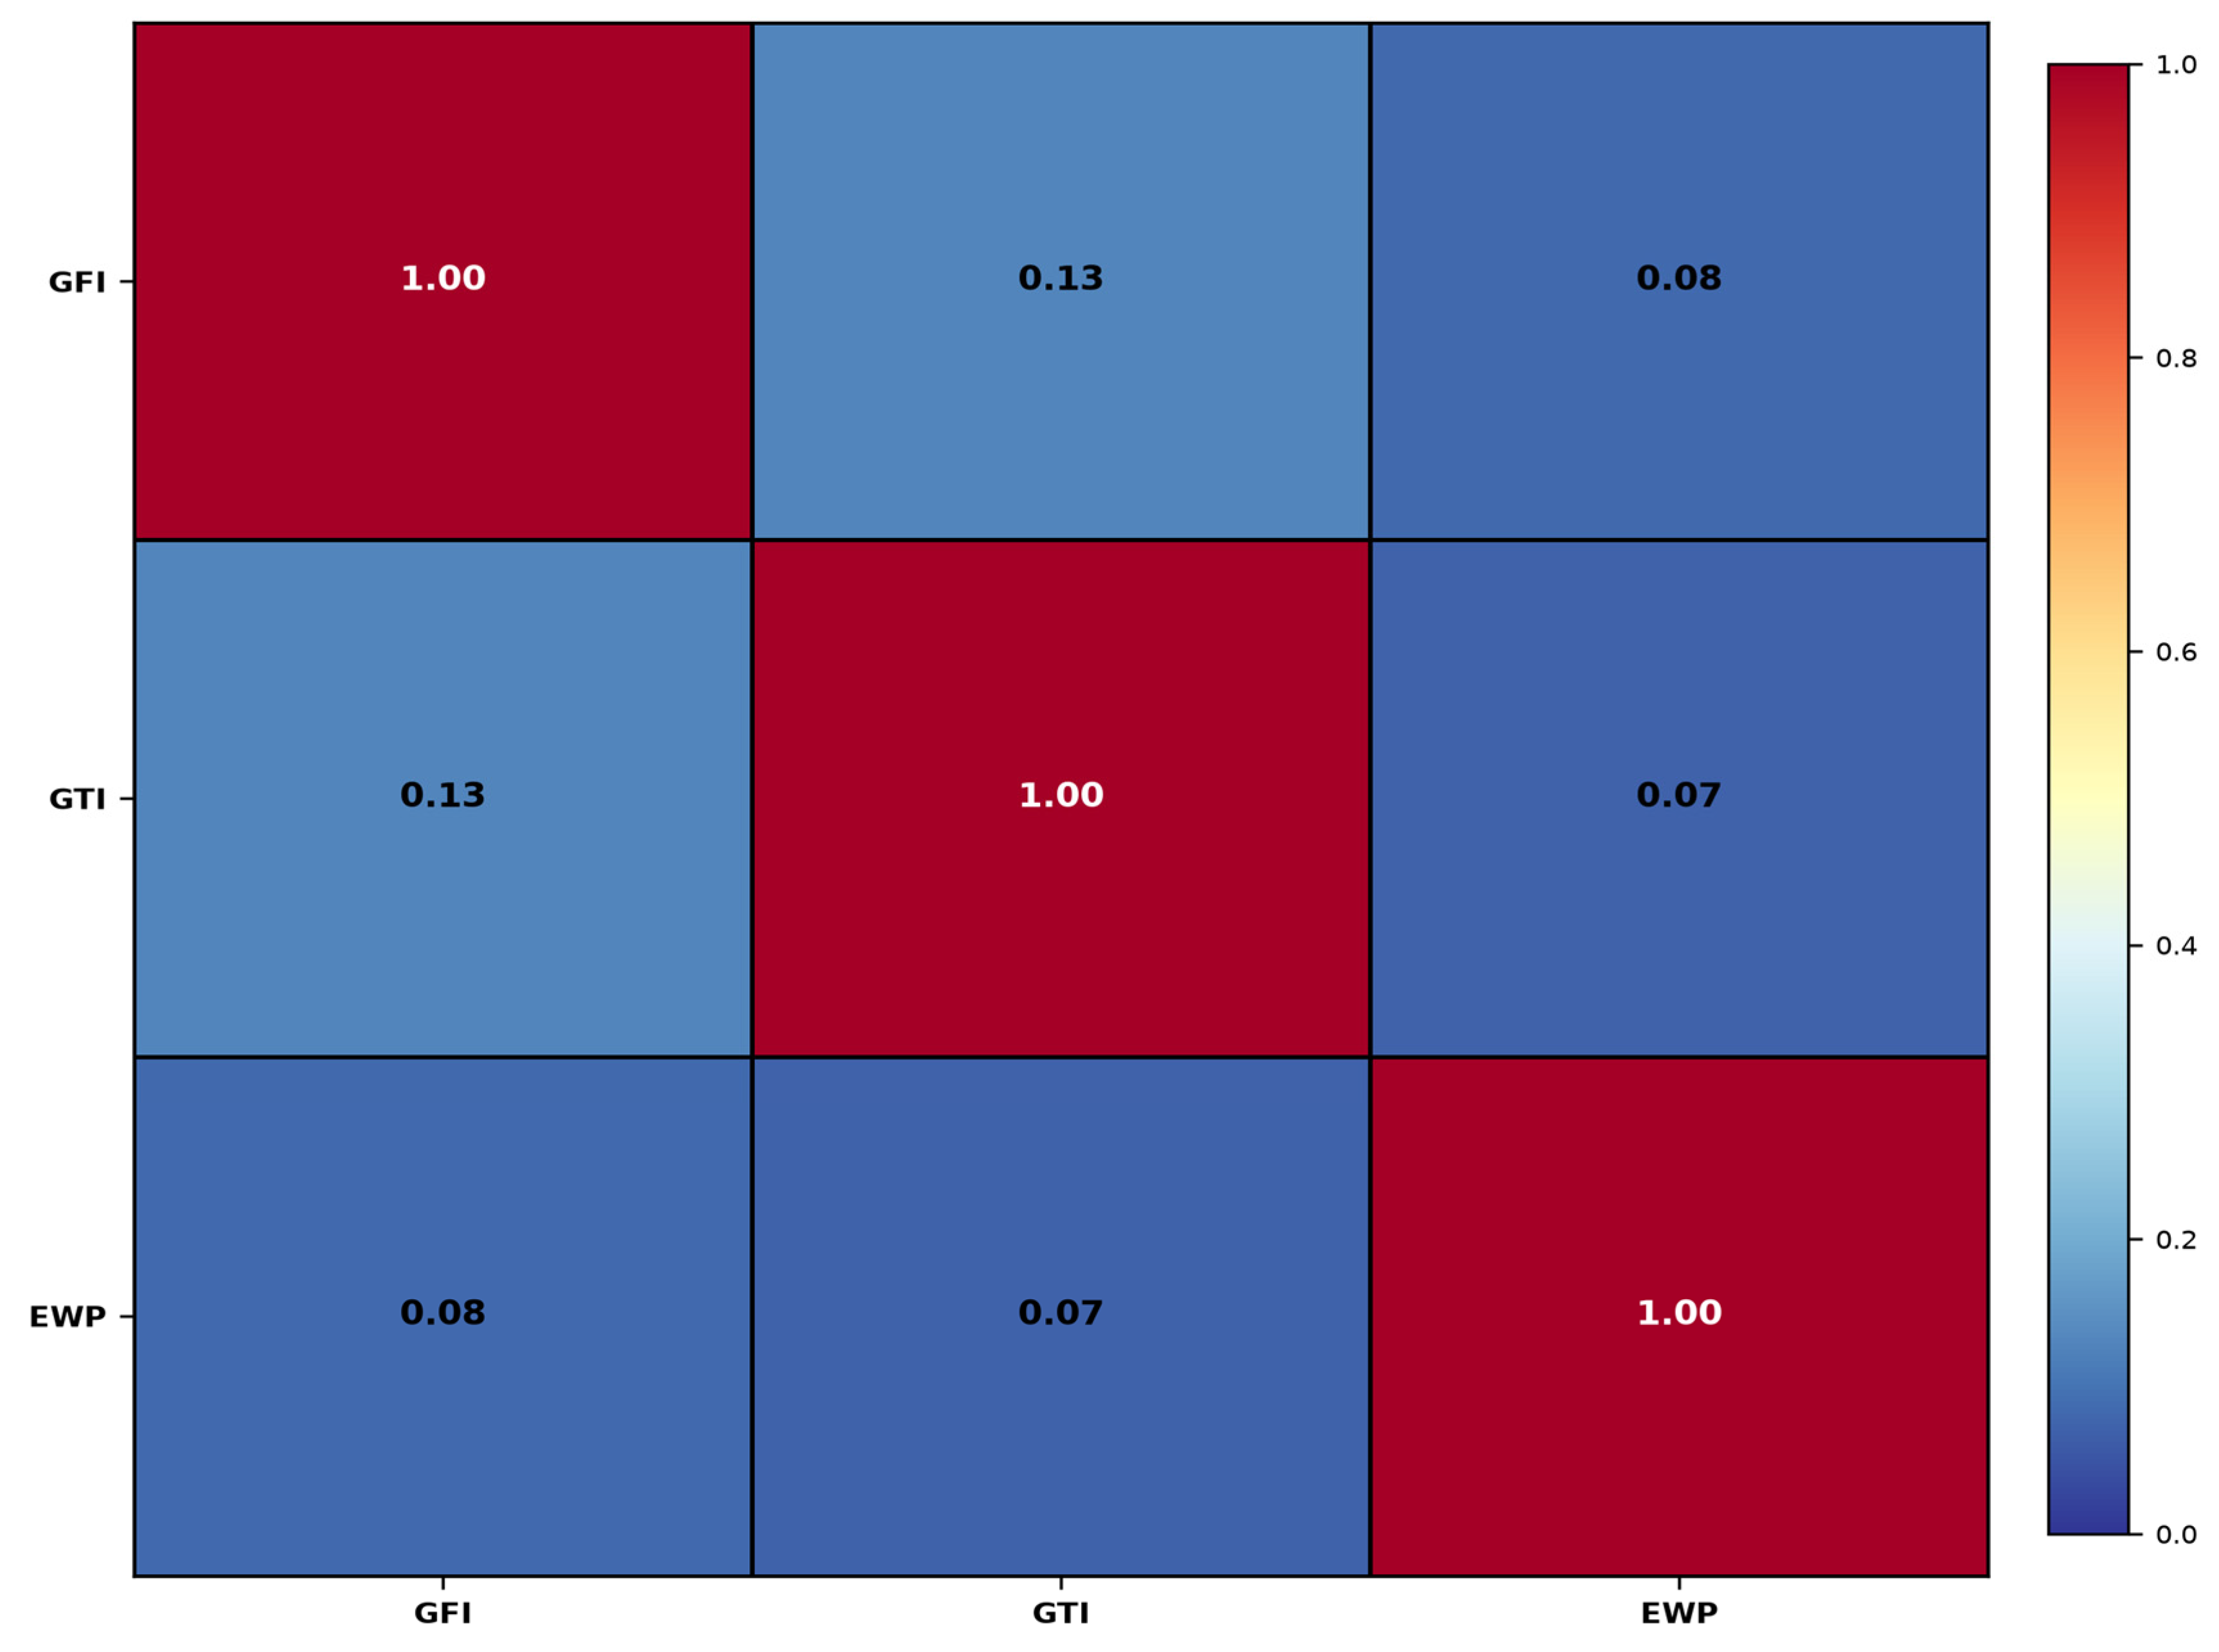
The heatmap (
Figure 4) displays the pairwise correlations among GFI, GTI, and EWP, with all correlation coefficients below 0.7, confirming no severe multicollinearity in the core variables.
Table 11 presents the test results for Central China. The sample includes 80 cities in this region. Model 31 examines the main effect and shows no statistically significant positive association between the green finance index and urban ecological welfare performance (β = 0.102, ns). Similarly, Model 32 indicates no significant positive correlation between GFI and regional green technological innovation (β = 0.030, ns). This suggests that, in Central China, the hypothesized relationships explored in this study do not hold. In other words, the mechanism linking green finance, green technological innovation, and urban ecological welfare performance is only validated in East China, Northeast China, and West China, but not in Central China.
5. Conclusions and Discussion
5.1. Research Findings
Using balanced panel data of 279 prefecture-level cities from 2003 to 2022, the present study developed indicator systems to measure the green finance index and urban ecological welfare performance. Through two-way fixed effects models and mediation effect tests, the following core observational patterns were identified: First, green finance exhibits a significant positive association with ecological welfare performance. Empirical analysis shows that a 0.1-unit absolute increase in GFI is associated with an average 0.0605-unit growth in EWP, with significant positive correlations observed in the east, west, and northeast regions. Second, the level of green technological innovation plays a partial mediating role between green finance and regional ecological welfare performance. Specifically, the data are consistent with an indirect positive linkage between green finance and EWP via technological innovation pathways, pointing to a “finance–technology–ecology” associative linkage. Third, these correlational patterns appear stable across different time periods. Finally, the data point to uneven regional patterns. In Central China, the association between green finance and EWP was not significant (β = 0.102, ns). Based on our sample-wide regional descriptive statistics, Central China displays a relatively lower green finance index and green credit share compared with Eastern China. Notably, Central China’s fiscal R&D intensity is close to the level of Eastern China’s and even slightly higher during 2013–2022, whereas its green technological innovation output remains substantially lower. This suggests that the insignificant association in Central China plausibly arises not from insufficient aggregate R&D input, but from the fact that limited green-oriented capital cannot effectively steer local R&D resources into green technology fields, consistent with a disrupted associative linkage from green finance to green innovation and further to ecological welfare performance.
Furthermore, classic environmental–economic theories offer complementary interpretative perspectives for such regional disparities. From the environmental Kuznets curve perspective, regions at disparate economic development stages exhibit different trade-offs between economic expansion and ecological welfare. Eastern China has reached a relatively high developmental level, where greater demand for ecological wellbeing enables green finance to play its capital-guiding role more effectively. In contrast, Central China remains in a phase of industrial expansion, where economic growth priorities may dilute the effectiveness of green finance initiatives. In addition, the pollution haven hypothesis for intra-country industrial transfer provides another reference: inward transfer of high-pollution industries may bring extra ecological pressure to Central China, partially offsetting potential welfare gains brought by green finance resources. These theoretical perspectives serve as auxiliary explanations and do not supersede our core inference regarding broken capital innovation transmission mechanisms. Plausibly, countervailing factors, including capital allocation frictions and potential green-washing risks, may also partly inhibit the transmission from green finance resources to real-world ecological welfare gains within Central China.
5.2. Discussion
The present study delivers marginal theoretical advancements in two key aspects. To begin with, it constructs an innovative “finance–technology–ecology” transmission model and verifies the intermediate driving role of green technological innovation in the green finance–ecological welfare nexus. Different from traditional linear research frameworks, this study introduces dynamic mechanistic interpretations to the theoretical system of sustainable development. Furthermore, empirical heterogeneity analysis covering 279 urban samples uncovers unique developmental characteristics in Central China. The results refute the generalized applicability of green finance governance effects and facilitate the formation of theoretical support for targeted, region-specific green economic policies. Third, it innovatively constructs a GFI measurement system for prefecture-level cities covering seven dimensions and an EWP measurement framework including four types of input indicators, four types of desired output indicators, and three types of undesired output indicators, providing new methods for evaluating urban sustainable development. These theoretical innovations collectively build a regional differentiated explanation framework for green finance effects, deepening the intersection of environmental economics and regional development theory.
Based on the observed associational patterns in this study, several targeted and evidence-consistent practical implications can be inferred with caution. Given the significant regional heterogeneity in the linkage between green finance and urban ecological welfare performance, differentiated green financial allocation strategies should be formulated across regions. For Eastern, Western, and Northeastern regions with a significant positive association, steady expansion of effective green credit supply helps sustain improved ecological welfare outcomes. In particular, Central China faces insufficient conversion of existing R&D investment into green innovation due to limited green-oriented capital resources. Therefore, priority should be given to optimizing regional green credit resource allocation in Central China, unlocking local R&D potential, and promoting the efficient transformation of research and development inputs into tangible green technological progress, so as to improve urban ecological welfare performance. To make this recommendation more actionable, we propose concrete targets informed by the sample-wide descriptive statistics: Central China’s green credit share (3.98%) remains substantially below the Eastern China level (5.43%), and its green technological innovation output (GTI = 0.269) lags behind the Eastern China benchmark (GTI = 0.383). We, therefore, suggest setting a phased policy target of raising Central China’s green credit share by approximately 1.5 percentage points toward the Eastern China level, and channeling incremental fiscal R&D investment into green technology fields so that green patent output gradually converges to the Eastern benchmark, which is expected to restore the green finance–green innovation–EWP transmission mechanism in this region.
5.3. Limitations
This study explores the associational linkage between green finance and urban ecological welfare performance based on city-level balanced panel data, while several limitations remain to be acknowledged. First, the empirical analysis adopts an observational research design. Although two-way fixed-effects models are employed to mitigate unobserved heterogeneity, they cannot fully eliminate endogeneity concerns, including potential reverse causality and omitted variable bias. Accordingly, the documented relationships should be interpreted as conditional associations rather than strict causal effects. In future research, employing lagged explanatory variables or system GMM estimators could further strengthen causal identification by alleviating reverse causality and dynamic endogeneity concerns.
Second, both the green finance index and core explanatory indicators suffer from measurement limitations. The green finance dataset excludes non-bank green financial instruments such as green trusts and ESG funds, and its provincial-to-city data allocation may generate city-level measurement mismatch. In addition, green technological innovation is measured by aggregate green patent applications without distinguishing patent quality types due to historical data constraints, which fails to capture heterogeneous innovation value across cities.
Third, this study conducts multiple baseline, mediation, robustness and subgroup tests without formal multiple-comparison corrections. Although all specifications are theoretically motivated, cumulative type I error inflation cannot be completely ruled out. Fourth, the sample is restricted to Chinese prefecture-level cities under China’s institutional and green governance frameworks, which limits the generalizability of the findings to cross-national contexts.