Article

Multi-Environment Evaluation of Bread Wheat Genotypes for Sustainable Production Using AMMI, GGE Biplot and Multi-Trait Stability Index Analyses

by
Mohamed S. Genedy
1,
Mahmoud A. Hussein
1,
Asaad R. Ibrahim
1,
Ahmed M. Sorour
2,
Hala A. M. El-Sayed
3,
Ramy N. F. Abdelkawy
4,* and
Ezzat R. Marzouk
5,6,*
1
Wheat Research Department, Field Crops Research Institute, Agricultural Research Center, Giza 12619, Egypt
2
Crops Technology Research Department, Food Technology Research Institute, Agricultural Research Center, Giza 12619, Egypt
3
Department of Agricultural Sciences, Higher Institute of Agricultural Cooperation, Qalubia 13776, Egypt
4
Central Laboratory for Design and Statistical Analysis Research, Agricultural Research Center, Giza 12619, Egypt
5
Department of Soils & Water, Faculty of Environmental Agricultural Sciences, Arish University, Al-Arish 45511, Egypt
6
Agricultural Research Department, Ministry of Municipality, Doha 200022, Qatar
*
Authors to whom correspondence should be addressed.
Sustainability 2026, 18(17), 9010; https://doi.org/10.3390/su18179010
Submission received: 23 July 2026 / Revised: 28 August 2026 / Accepted: 30 August 2026 / Published: 2 September 2026
(This article belongs to the Section Sustainable Agriculture)

Abstract

Climate change and environmental variability pose major challenges to sustainable wheat production, highlighting the need for stable and high-yielding cultivars. This study evaluated fifteen bread wheat (Triticum aestivum L.) genotypes across twelve environments during two consecutive growing seasons using a randomized complete block design with three replications. Stability and performance were assessed using Additive Main Effects and Multiplicative Interaction (AMMI), Genotype main plus Genotype × Environment (GGE) biplot, and multi-trait stability index (MTSI). AMMI combined ANOVA indicated that both grain yield per plot and falling number were significantly affected by genotype, environment and their interaction (GEI). The GGE biplot revealed that the first two principal components together explained 86.92% of the total variation in grain yield per plot and 88.27% for falling number, demonstrating the reliability of the model in interpreting GEI patterns. AMMI and GGE biplot analyses consistently identified Sakha 95 (G1), Misr 4 (G3), Sakha Line#1 (G6), Sakha Line#2 (G7), Gemmeiza Line#2 (G14), and Gemmeiza Line#3 (G15) as high-yielding and stable genotypes across environments. In contrast, Sakha Line#4 (G9), Sakha Line#6 (G11), Sakha Line#7 (G12), and Gemmeiza Line#1 (G13) showed poor adaptation and low stability. MTSI further refined selection by integrating yield and quality traits, identifying Gemmeiza Line#3, Sakha Line#3, Sakha Line#2, and Giza 171 as superior genotypes at 25% selection intensity, characterized by low MTSI values. The identification of stable, high-performing genotypes with desirable grain quality can contribute to sustainable wheat production by improving yield reliability under diverse environmental conditions and supporting more efficient cultivar selection for climate-resilient wheat production. Overall, integrating AMMI, GGE biplot, and MTSI provided a robust framework for identifying stable and high-performing wheat genotypes, supporting selection decisions in multi-environment breeding programs.

1. Introduction

Bread wheat is the most widely cultivated cereal crop worldwide. Bread wheat accounts for approximately 90% of global wheat production, with the remaining 10% being durum wheat [1,2]. It is a staple food and a principal energy source for nearly 35% of the world’s population. Bread wheat ranks as the second most important staple food crop after rice due to its high nutritional value and global cultivation. In 2024, the global wheat area reached 220.8 million hectares, with a total production of about 791.4 million tons [3].
Egypt is the world’s largest importer of bread wheat, relying on imports for more than 50% of its consumption. In 2023, the cultivated wheat area in Egypt amounted to 1.45 million hectares (approximately 3.3 million feddans; 1 feddan = 0.42 hectare), with a total production of about 9 million tons [4]. The large gap between domestic production and consumption places a heavy financial burden on the Egyptian government, costing billions of dollars annually and increasing economic pressure.
Wheat in Egypt is cultivated mainly in the Nile Valley and Delta regions, characterized by clay and clay loam soils, while most of the country consists of desert areas [5]. Wheat production is constrained by limited water resources and a fixed allocation of Nile water, coupled with scarce rainfall restricted to the northern coast [5,6]. To address these constraints, the government has launched a national initiative to expand land reclamation to the western desert, where soils are predominantly sandy. Spring bread wheat is cultivated throughout the country, and the principal breeding objective remains the development and release of high-yielding, stable cultivars.
In plant breeding, evaluating genotypes across diverse environments is crucial for identifying those with consistently superior performance. The Genotype × Environment Interaction (GEI) reflects the differential responses of genotypes to varying environmental conditions and is fundamental for determining the stability and adaptability of breeding materials [7,8,9]. Stable genotypes are those that maintain high and consistent performance across environments [10]. Although conventional methods such as combined analysis of variance can detect the presence of GEI, they provide limited insight into its underlying structure. Therefore, several advanced analytical approaches have been developed and widely employed to provide a more precise evaluation of genotype stability [11]. Additionally, location-specific combined analyses were conducted to evaluate the consistency of genotype performance across seasons within each testing location, whereas AMMI and GGE biplot analyses across location × season environments were used to assess genotype × environment interaction, identify broadly and specifically adapted genotypes, and evaluate stability across the overall set of environments.
The objectives of the present study are to (i) evaluate ten promising bread wheat genotypes and five high-yielding check cultivars for grain yield and selected grain quality traits across twelve environments in Egypt, (ii) investigate genotype × environment interaction; (iii) identify stable and high-performing genotypes using AMMI, GGE biplot, and MTSI analyses.

2. Materials and Methods

2.1. Bread Wheat Cultivars

Fifteen bread wheat genotypes (Table 1) were kindly provided by the Wheat Research Department, Field Crops Research Institute, ARC, Giza, Egypt.

2.2. Experimental Sites

The present study was carried out in two growing seasons, 2023/2024 and 2024/2025, at six locations, namely, Sakha (SK), Gemmeiza (GM), Etay El Baroud (ET), Nubaria (NB), Malawy (ML) and Shandaweel (SH). Latitude, longitude and altitude for each location are presented in Table 2. Environment was defined as a specific location × growing season combination. Thus, the six geographical locations evaluated during the two growing seasons (2023/2024 and 2024/2025) constituted twelve environments. The twelve experimental environments differed in their agro-climatic conditions across the six locations and two growing seasons (Table 2 and Supplementary Tables S1 and S2). Soils were predominantly clayey at Sakha, Gemmeiza, Etay El Baroud, and Shandaweel, calcareous sandy loam at Nubaria and loam at Malawy. Seasonal rainfall varied considerably among locations, ranging from 2.4 mm at Malawy in 2023/2024 to 73.1 mm at Sakha in 2024/2025. Sakha and Nubaria received relatively similar seasonal rainfall, whereas Gemmeiza and Malawy experienced comparatively lower rainfall. No rainfall was recorded at Shandaweel during either of the two growing seasons. Temperature conditions also varied among environments, with minimum temperatures ranging from 10.51 to 17.45 °C, maximum temperatures from 21.87 to 26.21 °C, and mean temperatures from 17.02 to 20.32 °C. These differences in soil type, rainfall, and temperature characterized the environmental diversity of the twelve location × season combinations evaluated in this study.

2.3. Field Experiment

The experiment was arranged in a randomized complete block design with three replicates at each location and season. Each experimental plot area measured 4.2 m2 and comprised six rows, each 3.5 m long and spaced 20 cm apart.

2.4. Crop Management Practices

Fifteen bread wheat genotypes were sown at six experimental locations between 15 and 20 November during each growing season, using a sowing rate of 350 seeds m−2. Superphosphate (15.5% P2O5) was band-applied at sowing. Nitrogen fertilizer was applied at a rate of 75 kg N fed−1 as urea (46.5% N; approximately 178 N ha−1) in two equal applications before the first and second irrigations. The first irrigation was applied approximately 25 days after sowing, followed by three to four additional irrigations at approximately 25–30-day intervals, depending on crop water requirements and environmental conditions at each location. Irrigation was discontinued approximately 110–120 days after sowing, depending on the location and season. The crop was harvested manually at physiological maturity, when the vegetative parts had turned yellow, approximately 150–155 days after sowing, generally between 1 and 10 May. Other agronomic practices for wheat cultivation at each location were implemented in accordance with the standard recommendations of the Ministry of Agriculture and Land Reclamation.

2.5. Studied Traits

A total of eight traits were evaluated in the present study, comprising four grain yield traits and four grain quality traits. At harvest, the number of spikes m−2 was determined from a representative 1 m2 area within each plot. In addition, ten plants were randomly selected from each plot in each season at each location, harvested, and threshed. The number of grains per spike and 1000-grain weight (g) were recorded from the selected plants. Grain yield per plot (kg) was determined from the entire plot after harvesting and threshing. In addition, four grain quality traits, namely, crude protein (%), wet gluten (%), gluten index (%), and falling number (s), were determined from grain samples collected from each plot.
The falling number test is used to determine the level of α-amylase activity in bread wheat or flour, which reflects the degree of starch degradation often associated with pre-harvest sprouting. A low falling number indicates high enzyme activity and poor baking quality, while a high falling number indicates low enzyme activity and good starch integrity. The analysis was carried out according to the AACC International [12].

2.6. Statistical Analysis

2.6.1. Combined Analysis of Variance over Two Seasons for Each Location

The homogeneity of error variances across environments (seasons) was assessed using Levene’s test [13] before conducting the combined analysis. Homogeneity was found for most traits, whereas heterogeneity was detected for the remaining three traits, namely, grain yield per plot, crude protein and falling number (Supplementary Table S3). Subsequently, a combined ANOVA across environments was performed using plot means to assess the effects of genotype, environment, and genotype × environment interaction, according to Gomez and Gomez [14]. The combined analysis over environments was based on the following model:
Yijk = μ + Gi + Ej + (GE){ij} + R{k(j)} + ε{ijk}
where (Y{ijk}) is the observation of the (i)th genotype in the (k)th replication within the (j)th environment, (μ) is the overall mean, (Gi) is the genotype effect, (Ej) is the environment (season) effect, ((GE){ij}) is the genotype × environment interaction effect, (R{k(j)}) is the effect of replication nested within season, and (ε{ijk}) is the residual error. The location-specific combined analyses were performed to assess genotype performance and consistency across seasons within each location.

2.6.2. Mean Comparison Combined over Two Seasons for Each Location

Mean comparisons were performed using the Least Significant Difference (LSD) test at the 5% probability level.

2.6.3. Adaptability and Stability Analyses

The AMMI and GGE biplot analyses were applied specifically to grain yield and falling number, which were considered the primary target traits for evaluating genotype performance and stability across the 12 environments. These analyses enabled the assessment and visualization of genotype × environment (G × E) interaction and the identification of broadly and specifically adapted genotypes. The AMMI model focuses on partitioning and interpreting the genotype × environment (G × E) interaction, thereby identifying genotypes with distinctive interaction patterns and stability across environments. In contrast, the GGE biplot focuses on the G + G × E component, which represents genotype effects together with their interaction with environments, following the method described by [15]. The AMMI model equation is as follows:
Y i j = μ + α i + β j + n = 1 N λ n γ i n δ j n + θ i j + ε i j
where Yij = the mean yield of genotype i in environment j, μ = the grand mean of the yield, αi = the deviation of the genotypes mean from the grand mean, βj = the deviation of the environment mean from the grand mean, λn = the singular value for the PCA; n, N = the number of PCA axis retained in the model, γin = the PCA score of an genotype for PCA axis n, δjn = the environmental PCA score for PCA axis n, θij = the AMMI residual and εij = the residuals.
The AMMI Stability Value (ASV) was calculated according to the procedure outlined by [16]. The first two principal component axes (IPCA1 and IPCA2) were used to construct AMMI biplots illustrating genotype × environment relationships, following the method proposed by [17].
The formula of the Genotype Selection Index (GSI) is as follows:
GSIi = RYi + RASVi
where (GSIi) is the Genotype Selection Index of the (i)th genotype, (RYi) is the rank of the genotype based on mean grain yield, and (RASVi) is the rank of the genotype based on the AMMI Stability Value (ASV). Lower GSI values indicate genotypes combining higher grain yield with greater stability. AMMI analyses and GGE biplot constructions were performed using GenStat software version 19 [18].
GGE biplot analysis was performed using the first two principal components (PC1 and PC2) to visualize genotype performance and genotype × environment interaction (GEI). Genotypes or environments positioned to the right of the y-axis midpoint exhibited higher grain yield scores compared to those located on the left side. The ideal genotype or environment is characterized by high yield and consistent stability across different environments, appearing on or closest to the innermost concentric circle of the biplot. Genotypes and environments located nearer to the ideal point are considered more stable. AMMI and GGE biplot analyses were conducted across the 12 location × season environments to characterize the broader genotype × environment interaction and evaluate genotype performance and stability across environments.
The Multi-Trait Stability Index (MTSI) was calculated using the metan package, while graphical representations were generated using the ggplot2 package. Before factor analysis, the traits were standardized within the MTSI procedure, enabling traits measured on different scales to be analyzed jointly. No trait-specific weights were assigned; therefore, all traits contributed equally to the selection index. The MTSI was used to identify genotypes combining favorable performance and stability across all evaluated traits. R version 4.5.1; 2025 [19] was used to perform the combined analyses of variance and MTSI. A selection intensity of 25% was adopted to identify the top-performing genotypes, corresponding to the selection of the best quarter of the evaluated genotypes, while maintaining a balance between selection stringency and the retention of sufficient genetic diversity for subsequent breeding.

3. Results

The results of Levene’s test [14] showed that the error variances were homogeneous for most traits across the two years at each location, thereby supporting the validity of performing a pooled analysis of variance across years (Supplementary Table S3).

3.1. Combined Analysis of Variance (ANOVA) over Two Seasons at Each Location

The location-specific combined analyses (over two growing seasons) revealed highly significant differences (p ≤ 0.01) among the 15 wheat genotypes for all studied traits at each of the six locations (Table 3 and Supplementary Tables S4–S9).
For yield components, genotype mean squares were markedly higher than the corresponding error mean squares at all locations. For example, number of spikes m−2 showed large genotypic mean squares ranging from 2966.1 to 8194.3 compared with the relatively low error variances (141.6–479.3), indicating significant differences among genotype means under the evaluated conditions. Similarly, significant variation was observed for number of grains spike−1 and 1000-grain weight, reflecting differential genotypic performance across locations. Grain yield per plot also exhibited highly significant genotypic differences at all locations, with genotype mean squares greatly exceeding the error mean squares. All grain quality traits were significantly affected by genotype across the six locations (Table 3). The large magnitude of genotype mean squares relative to experimental error indicates that a substantial proportion of the phenotypic variance was genotypic.
Overall, the significant genotypic effects for both yield and quality traits across environments indicate substantial phenotypic variation among the evaluated genotypes and support further multi-environment testing and selection to identify superior cultivars.

3.2. Mean Performance of Fifteen Bread Wheat Genotypes Combined over Two Seasons at Each Location

The combined analysis (over two growing seasons) showed highly significant differences among the fifteen evaluated genotypes for all studied traits at each location, which can be attributed to the genetic variability among them [20]. The location-specific combined analyses were conducted to evaluate the consistency of genotype performance across seasons within each testing location. These analyses provided location-specific information on the effects of genotype, season, and their interaction, thereby identifying genotypes that maintained consistent performance across seasons under the agro-environmental conditions of each location.

3.2.1. Grain Yield and Yield Component Traits

Fifteen genotypes were tested for yield and yield component traits at each location for two growing seasons (2023/2024 and 2024/2025). The genotypes showed different reactions to yield and component traits. The genotypes differed significantly in number of spikes m−2 and number of grains spike−1 at all six locations (p < 0.05; Table 4).
Number of spikes m−2 ranged from 278.7 spikes m−2 (G11) at the Nubaria location (L4) to 510.5 spikes m−2 (G3) at the Etay El Baroud location (L3), with a grand mean of 402.9 spikes m−2. The genotypes G3, G6, G1, G7 and G14 recorded the highest number of spikes when averaged over locations and seasons, indicating superior tillering ability. In contrast, G11, G9 and G13 exhibited the lowest values. With regard to number of grains per spike, values ranged from 51.4 (G9) at the Etay El Baroud location (L3) to 73.2 (G1) at the Gemmeiza location (L2), with an overall mean of 60.8 grains spike−1. Genotypes G3, G1, G14, G7 and G6 consistently produced higher grain numbers across the six locations, reflecting their genetic potential for yield components. Meanwhile, G11, G12, and G9 had relatively lower grains per spike (Table 4). The combined analysis over two seasons revealed significant genotypes (G) effects at the 5% probability level for spikes m−2 and grains spike−1, respectively.
The 1000-grain weight varied from 45.7 g (G12) at the Etay El Baroud location (L3) to 68.4 g (G3) at the Gemmeiza location (L2), with an overall mean of 53.5 g. The genotypes G3, G6, G1, G7, and G15, recorded the highest 1000-grain weights across locations, while G12 and G5 showed the lowest values (lower than 50 g). Grain yield per plot ranged from 2.0 kg (G9 and G11) at the Shandaweel location (L5), to 5.8 kg (G1) at the Gemmeiza location (L2), with a mean of 3.4 kg. The highest grain yields were obtained from G3, G1, G6, G7 and G14, (4.5, 4.4, 4.1, 4.0 and 4.0 kg/plot, respectively) which performed consistently well across most locations, whereas G11, G12, G9 and G13 produced the lowest yields (lower than 3 kg per plot) (Table 5). These results indicate that genotypic performance varied across locations for both 1000-grain weight and yield traits [21].
Overall, clear variation was detected among the fifteen bread wheat genotypes across traits and environments. Genotypes G1, G3 and G6 consistently showed high performance, making them promising candidates for high-yield bread wheat under Egyptian conditions. In contrast, G9, G11 and G12 recorded relatively low values for most yield traits, indicating lower productivity. The observed variation among genotypes highlights the effectiveness of multi-environment testing in identifying superior and stable bread wheat genotypes suitable for diverse growing regions.

3.2.2. Grain Quality Traits

The studied genotypes showed significant differences for grain quality traits. Regarding crude protein percentage, the highest percentage across all locations was 12.3% for G1 and G3. In contrast, G12 recorded the lowest value, being 11.3%, across all locations. The specific percentages at each location were 10.7%, 10.9%, 11.7%, 11.7%, 11.3% and 11.9% for corresponding locations of L1 (Sakha), L2 (Gemmeiza), L3 (Etay El Baroud), L4 (Nubaria), L5 (Shandaweel), and L6 (Malawy), respectively. Regarding wet gluten percentage, traits also differed significantly across the locations, ranging from 26.3% for G13 at L3 (Etay El Baroud) to 31.4% for G3 at L6 (Malawy). The genotypes G1, G3, G6, G14 and G15 showed the highest percentage overall six locations (more than 28.5%). The lowest mean overall the six locations was recorded for G12 (27.7%), followed by G13 (27.8%) (Table 6). This difference could be due to the genetic potential of the studied genotypes.
Gluten index ranged from 72.7% (G9 and G13) at the Etay El Baroud location (L3) to 92.3% (G1) at the Malawy location (L6), with a mean of 83.9%. The highest percentages across all locations were 86.9% and 86.7% for G1 and G3, respectively. Meanwhile, G11 exhibited the lowest percentage being 81.8%, across all locations. The specific percentages at each location were 81.5%, 81.7%, 73.8%, 82.2%, 83.0% and 88.5% at L1 (Sakha), L2 (Gemmeiza), L3 (Etay El Baroud), L4 (Nubaria), L5 (Shandaweel) and L6 (Malawy), respectively (Table 7).
For the falling number, it varied from 266.7 s for G10 to 309.0 s for G3 at the same location (L6) (Malawy), with a general mean of 283.8 s, indicating clear variation in α-amylase activity and grain quality stability. The highest value across all locations was 294.1 s for G3. The corresponding value at each location were 287.5, 298.0, 288.5, 291.2, 290.3 and 309.0 s for corresponding locations L1 (Sakha), L2 (Gemmeiza), L3 (Etay El Baroud), L4 (Nubaria), L5 (Shandaweel) and L6 (Malawy), respectively (Table 7). Genotypes G3, G1 and G6 recorded the highest mean falling number (294.1, 293.9 and 291.7 s respectively), reflecting low α-amylase activity and good grain quality suitable for bread-making. In contrast, G11 and G8 exhibited the lowest mean falling numbers (276.5 and 276.9 s), suggesting higher α-amylase activity and consequently lower baking quality.
Generally, genotypes G1, G3, G6, G14 and G15 recorded the highest values for crude protein, wet gluten, gluten index, and falling number across locations, indicating superior grain quality. In contrast, G11, G12 and G13 showed the lowest values, reflecting weaker quality potential under varying environments.

3.3. AMMI Combined Analysis for Grain Yield per Plot Across Twelve Environments

AMMI and GGE biplot analyses were conducted across the 12 environments (six locations × two growing seasons) to characterize the broader genotype × environment interaction and evaluate genotype performance, adaptability, and stability across the overall set of testing environments.
The combined analysis of variance based on the Additive Main Effects and Multiplicative Interaction (AMMI) model across twelve environments for the 15 evaluated genotypes is presented in Table 8. All AMMI model components showed significant differences. Genotypes, environments and their interaction accounted for 38.85%, 31.48% and 22.99% of the total variation, respectively. The G × E interaction was further decomposed into IPCA1 and IPCA2, which explained 58.38% and 12.76% of the interaction variance, respectively, collectively accounting for 71.14% of the total GEI variation.
Table 9 presents the AMMI Stability Value (ASV) along with the IPCA1 and IPCA2 scores derived from the AMMI model for each of the 15 genotypes, providing their respective stability rankings. As a result, the genotypes Misr 4, Sakha 95, Sakha Line#1, Sakha Line#2 and Gemmeiza Line#2 had the highest mean grain yield per plot; meanwhile, Misr 3, Giza 171, Sakha Line#3, Sids 15 and Gemmeiza Line#2 were the most stable. This metric plays a key role in ranking and evaluating genotypes based on their stability to grain yield per plot. Genotypes with the lowest GSI values combine the greatest stability with the highest grain yield. According to the GSI, the most desirable genotypes combining both stability and highest grain yield were Misr 3, Giza 171, Gemmeiza Line#2, Misr 4, Sids 15, Sakha Line#2 and Sakha Line#3. In contrast, Sakha Line#7, Gemmeiza Line#1, Sakha Line#6 and Sakha Line#4 were found to be unstable and associated with lower grain yield per plot, as supported by the AMMI analysis and calculated stability parameters.

3.4. AMMI Combined Analysis for Falling Number Across Twelve Environments

The AMMI combined analysis of variance for falling number across twelve environments among fifteen bread wheat genotypes revealed that treatments (T), genotypes (G), environments (E) and genotype × environment interaction (G × E) were highly significant (p < 0.01) for the falling number. Residual effects were also significant (Table 10). The highly significant genotypic differences reflect variation among the genotypes studied for the falling number. The variation in the falling number was partitioned as follows: 42.27% due to genotypes, 7.26% due to environments and 30.41% due to the G × E interaction. The genotype effect accounted for roughly six times more of the total variance than the environmental effect. The G × E interaction was further divided into two principal components, IPCA1 and IPCA2, which explained 54.09% and 22.24% of the interaction variance, respectively, jointly representing 76.33% of the total genotype × environment interaction (GEI) (Table 10).
For the falling number, the ASV with its ranking for fifteen genotypes in addition to the AMMI model 2 IPCA1 and IPCA2 scores for each genotype are shown in Table 11. Accordingly, Misr 4, Sakha 95, Sakha Line#1, Gemmeiza Line#2 and Sakha Line#2 exhibited high mean falling numbers, while the genotypes Gemmeiza Line#2, Giza 171, Gemmeiza Line#3, Sids 15 and Sakha Line#2 were the most stable according to the ASV rank. According to the GSI, the most favorable genotypes for selection of both stability and high value falling number were Gemmeiza Line#2 followed by Gemmeiza Line#3, then Sakha Line#2, followed by Sakha 95 and Giza 171 (the same rank 11), which had the lowest GSI values. On the other hand, the genotypes Sakha Line#7, Sakha Line#5, Sakha Line#6 and Misr 3 were unstable and had low or intermediate falling numbers, with corresponding rank GSI values of 26, 25, 22 and 22, respectively (Table 11).

3.5. GGE Biplot for Grain Yield per Plot Across Twelve Environments

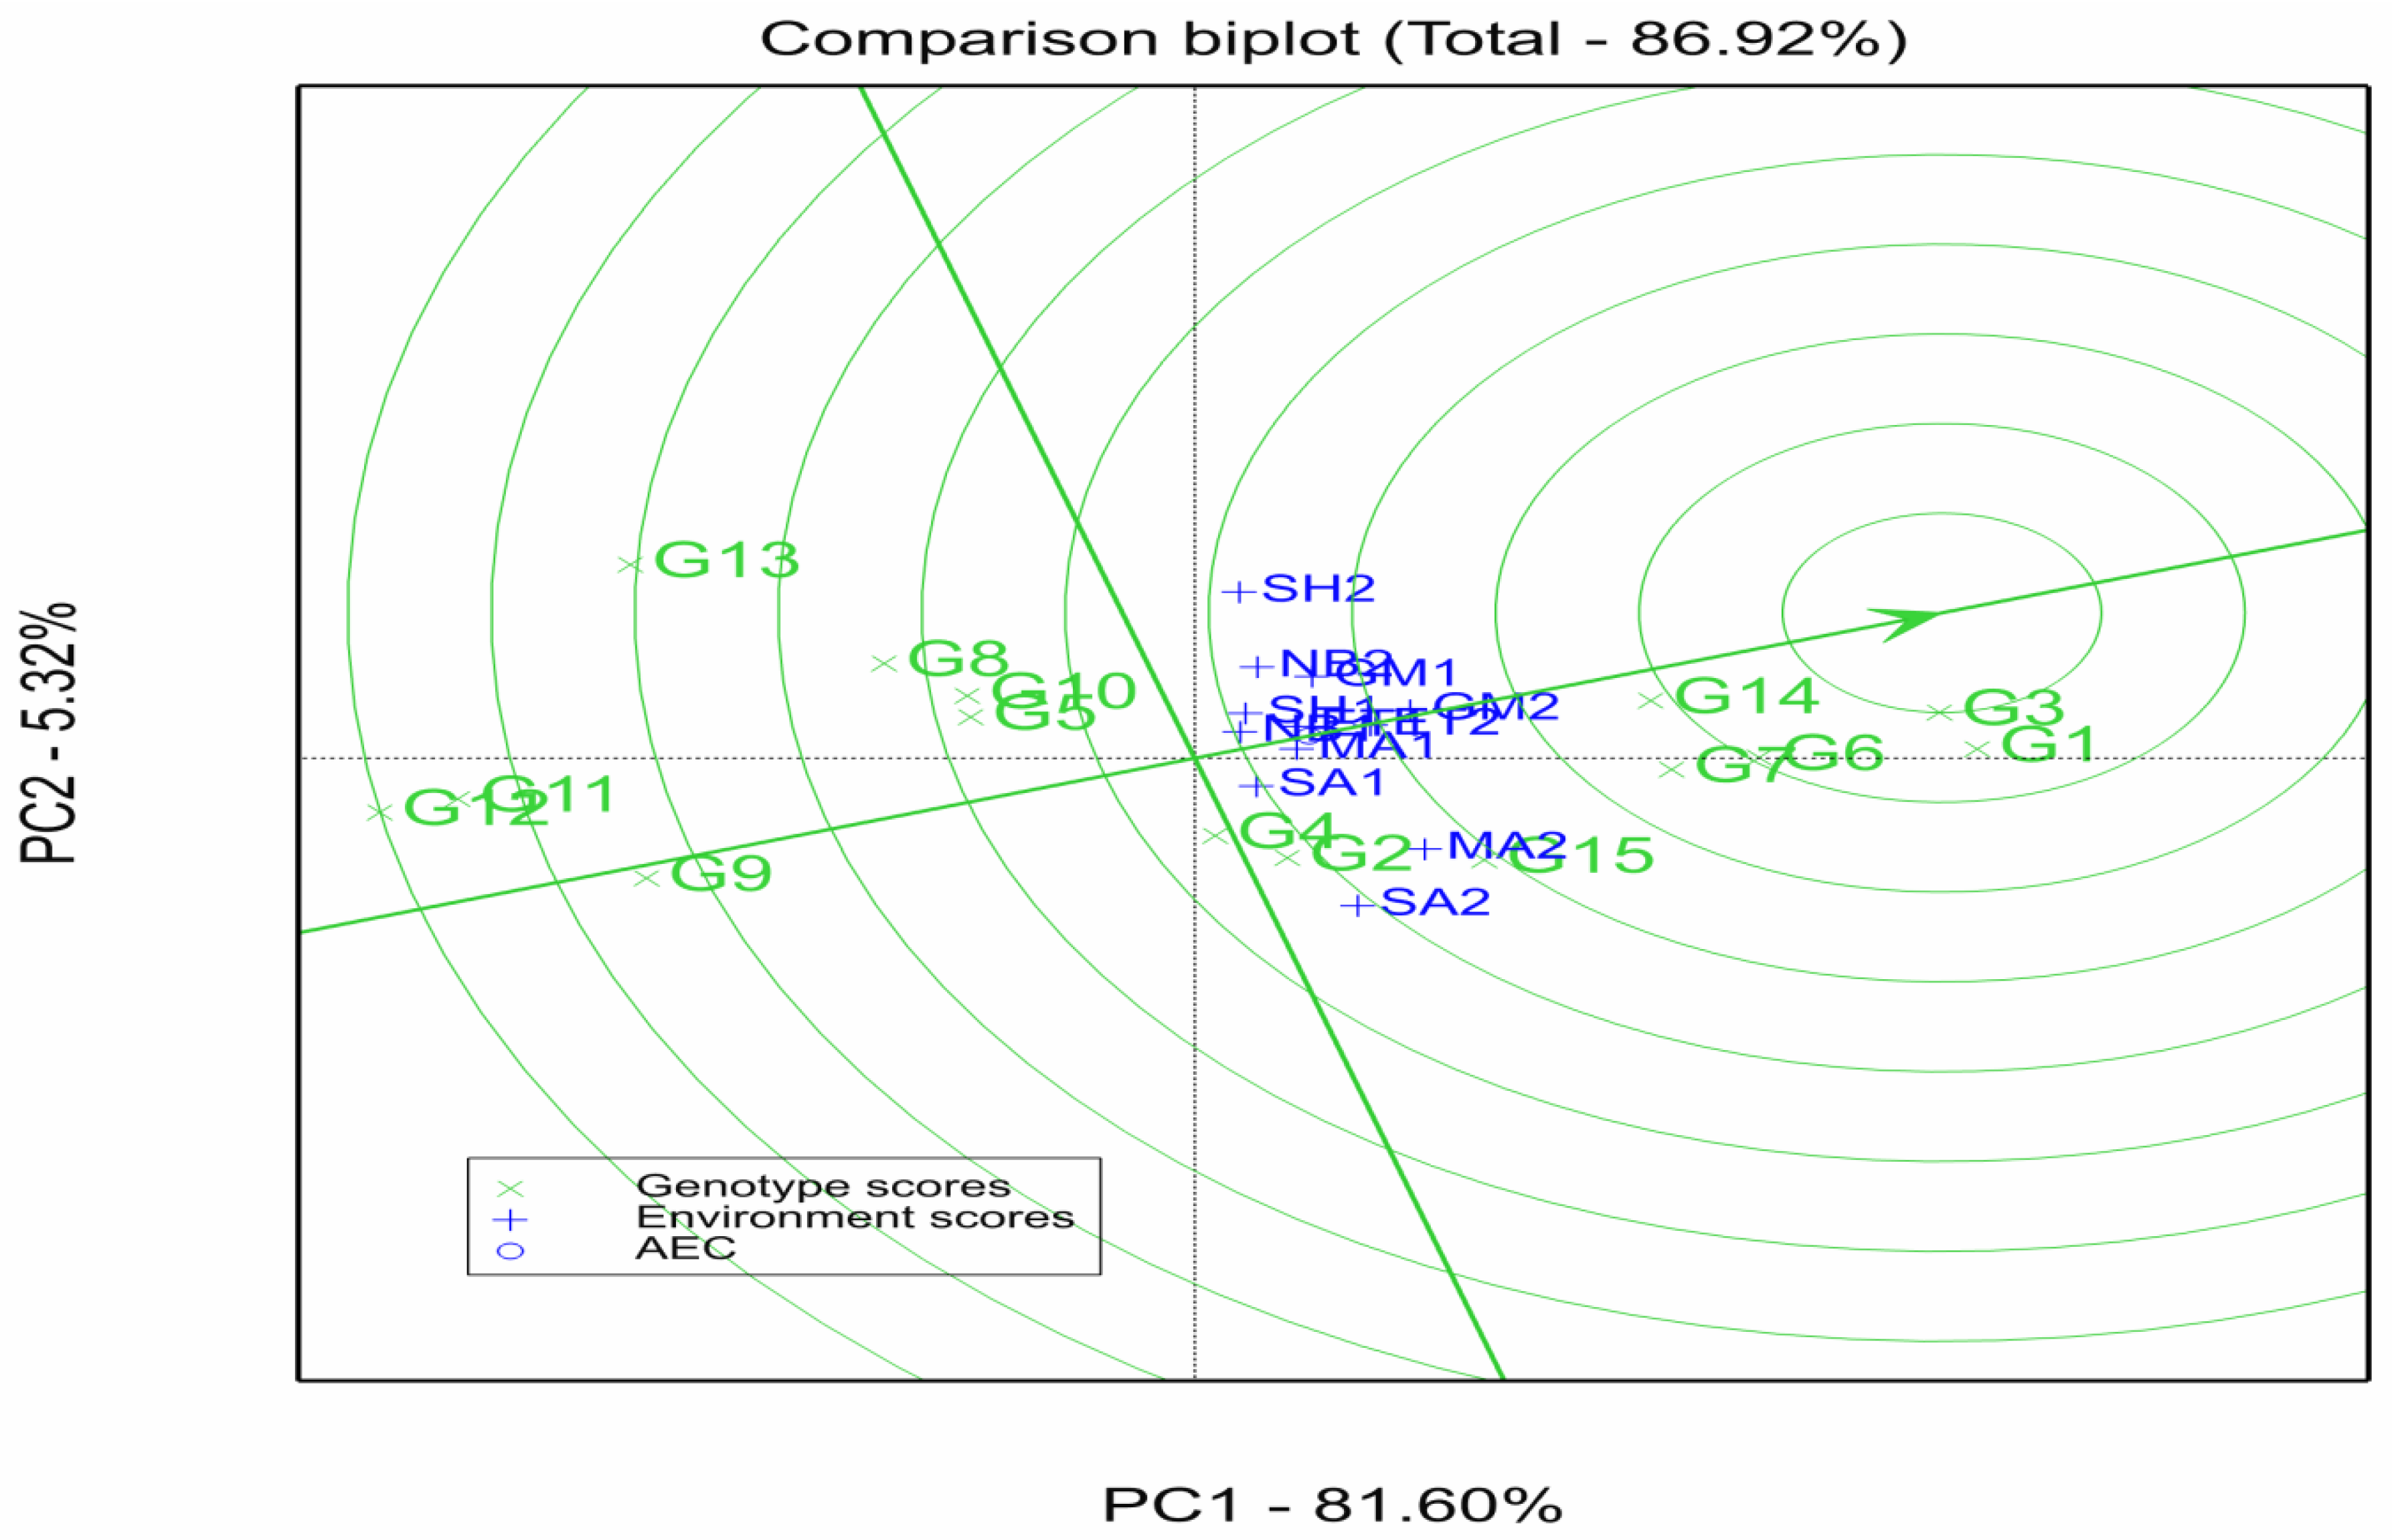
A biplot was made using the genotype-by-environment interaction from the first two principal components. The biplot provides a graphical illustration of the stability of genotypes. PC1 and PC2 of the GGE biplot accounted for 81.60% and 5.32% of the genotype plus genotype × environment (G + G × E) variation for grain yield per plot, respectively (86.92% in total; Figure 1).
The comparison of genotypes and environments with an ideal genotype and environment, respectively, provides a useful means for evaluating their performance [22,23]. The GGE biplot comparing genotypes with the ideal genotype showed that genotype Misr 4 (G3) occupied the central (middle) circle, indicating that it was considered the ideal genotype, combining high yield potential with relative stability compared to the other tested genotypes. Sakha 95 (G1), Sakha Line#1 (G6), Gemmeiza Line#2 (G14) and Sakha Line#2 (G7) were considered as desirable genotypes because they were the closest ones to ideal genotype. Gemmeiza Line#3 (G15), Misr 3 (G2) and Giza 171 (G4) also had higher grain yield per plot and stable genotypes than those genotypes on the left side (Figure 1). Conversely, genotypes positioned farthest from the ideal genotype were regarded as the least desirable, exhibiting both lower yield performance and lower stability.
In general, Misr 4 (G3), Sakha 95 (G1), Sakha Line#1 (G6), Gemmeiza Line#2 (G14) and Sakha Line#2 (G7) were the best genotypes and more favorable across different studied environments, which indicated that they were highly stable (Figure 1).
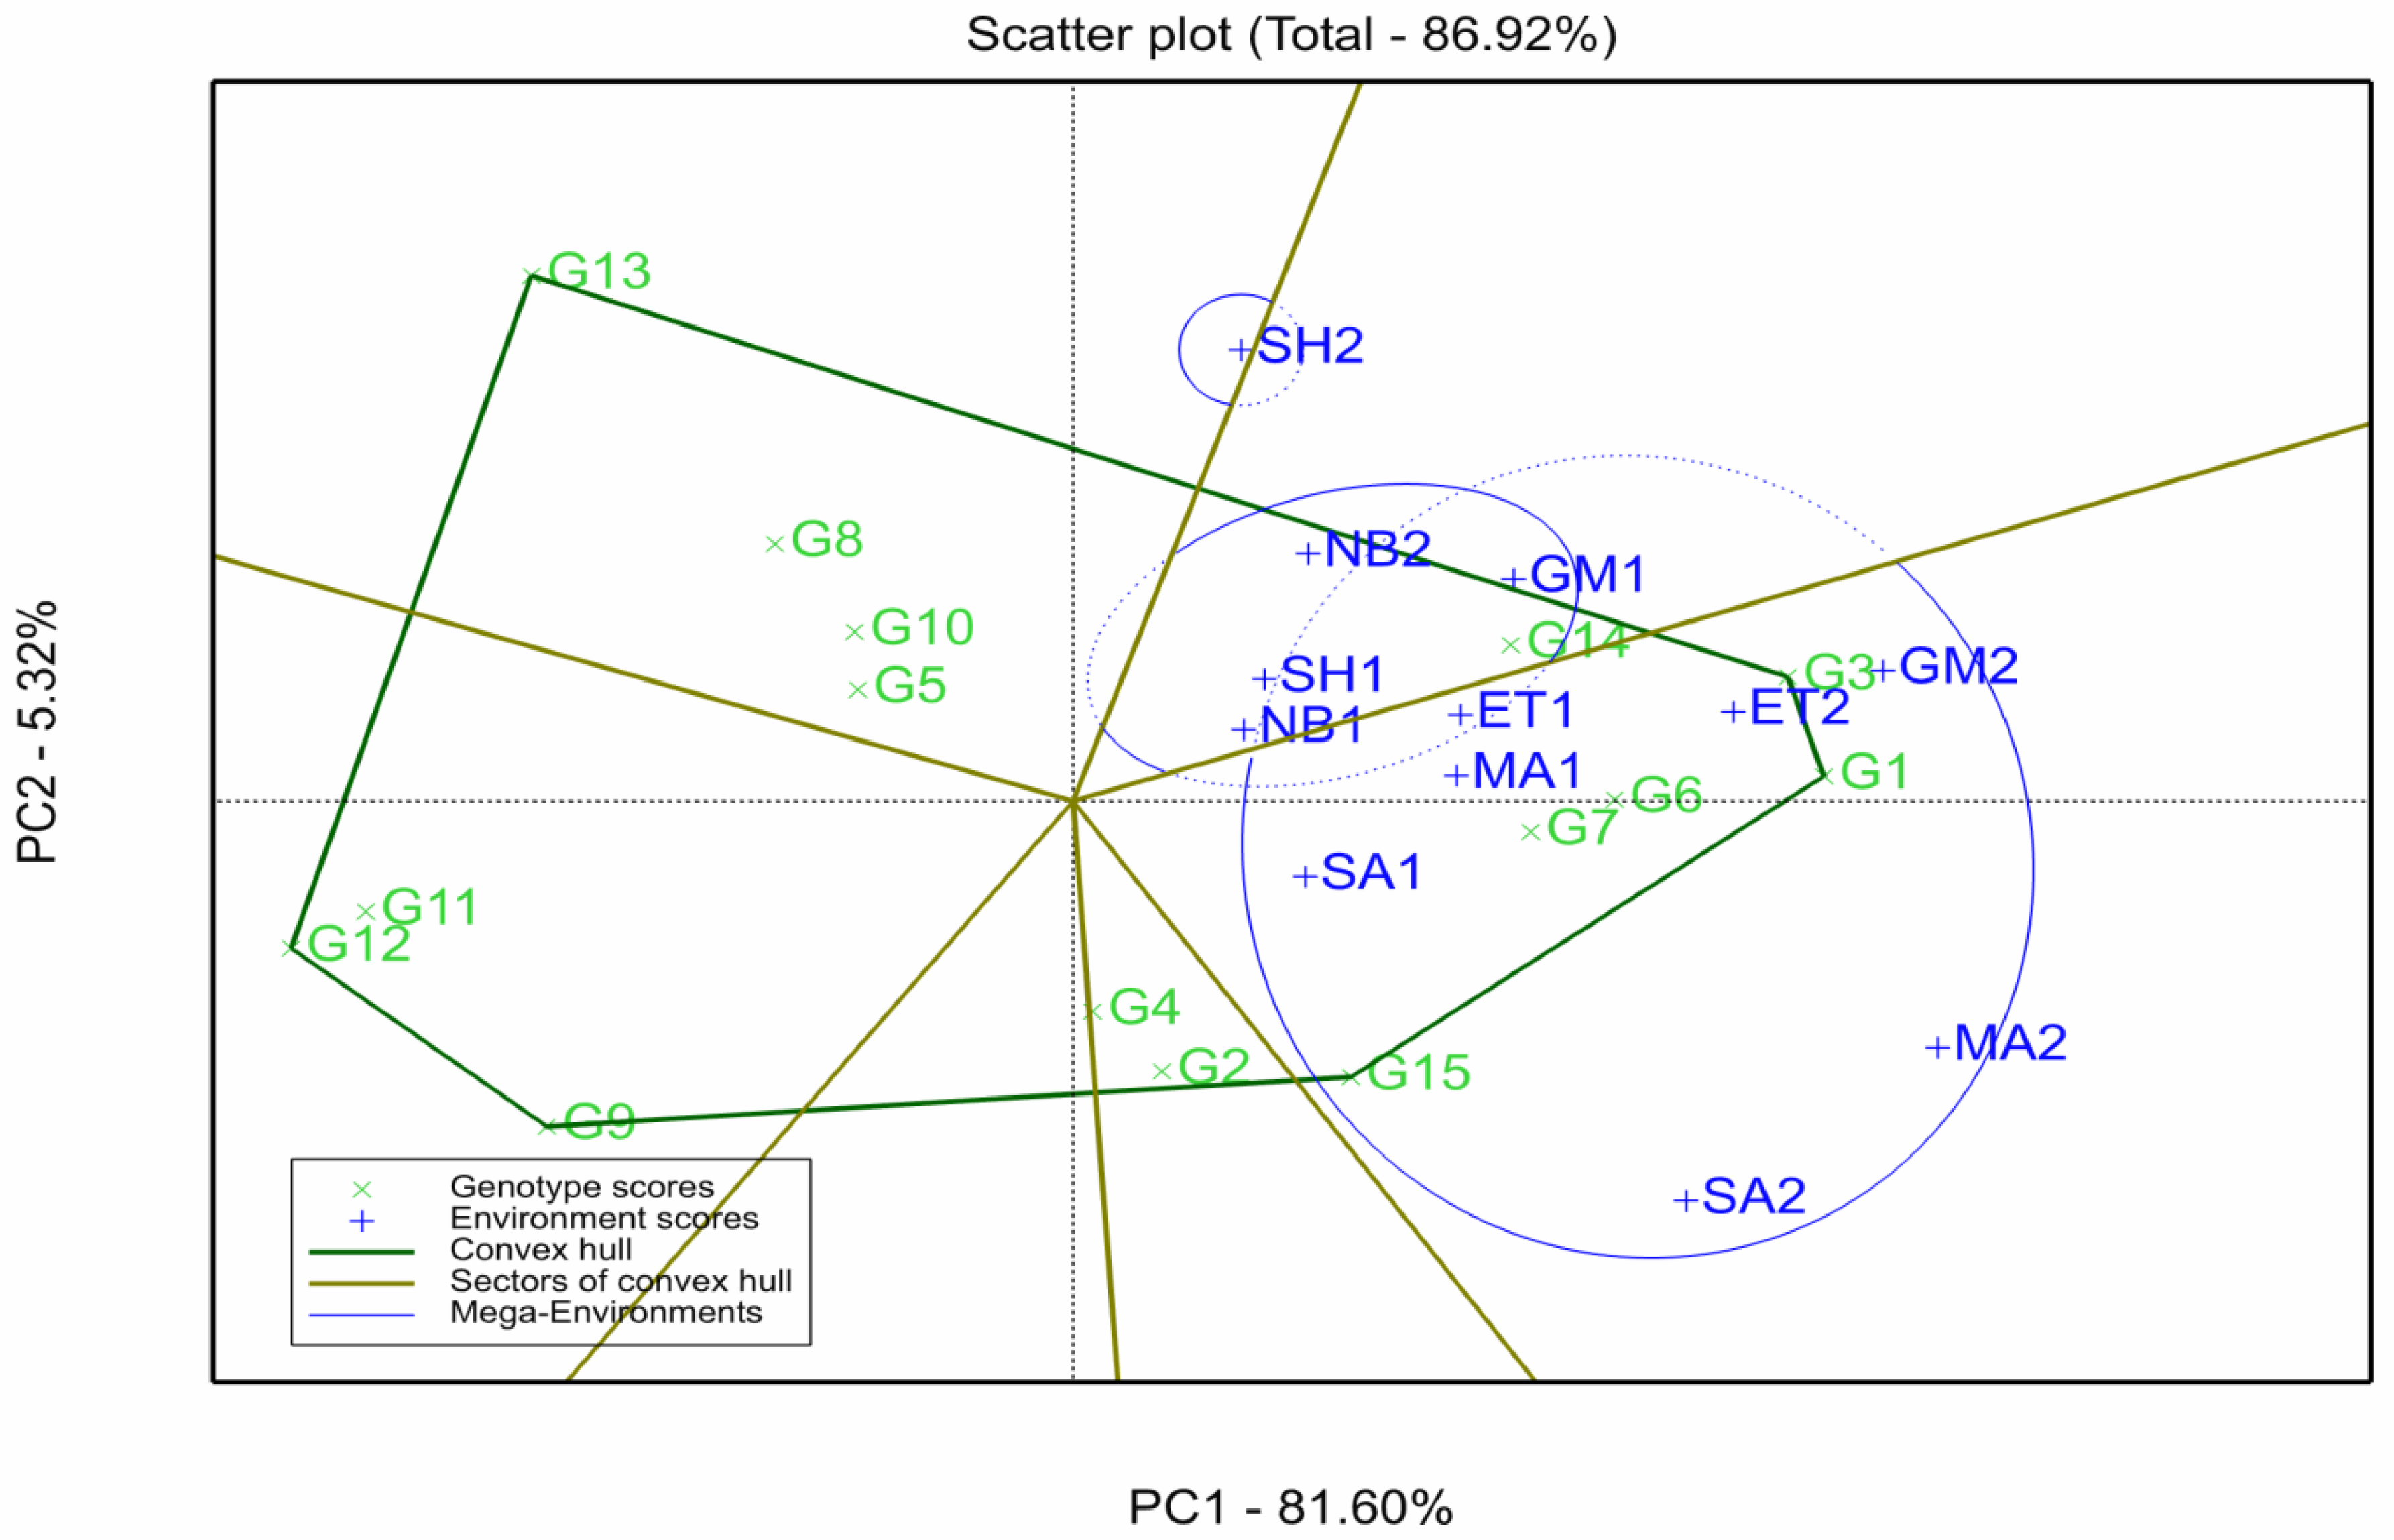
The scatter plot representation of the GGE biplot facilitates the identification of the top performing genotype within each environment and mega-environment. A mega-environment refers to a cluster of environments that consistently share the same group of superior genotypes [23,24]. In this context, the environments with different winning genotypes are positioned at the vertices of the GGE polygon, each occupying distinct sectors. The results from the six testing locations—Sakha (SA), Gemmeiza (GM), Etay El Baroud (ET), Nubaria (NB), Shandaweel (SH) and Malawy (MA)—across two growing seasons (1 and 2) were treated as distinct location-by-season environments. Accordingly, all environments (SA1, SA2, GM1, GM2, ET1, ET2, NB1, NB2, SH1, SH2, MA1 and MA2) were distributed among different sectors. The polygon view of the GGE biplot (Figure 2) enabled comparison among genotypes. Based on the genotypes positioned at the vertices of the polygon, G3, G1, G15, G9, G12 and G13 were the most responsive to the environment, each winning in its own sector. Genotypes positioned on the right side of the biplot exhibited higher mean grain yield, while those on the left side showed below-average performance. The polygon view indicated that the evaluated environments were grouped into three distinct mega-environments. Genotypes G3, G1, G6, G7 and G15 demonstrated the most positive responses and highest yields within mega-environment 1, which comprised GM2, ET1, ET2, MA1, MA2, SA1 and SA2 (Figure 2). In contrast, genotype G14 showed superior performance and the highest yield in mega-environment 2, including GM1, NB1, NB2, and SH1. Mega-environment 3 consisted solely of SH2. These findings align with the results reported by [23,25].
Furthermore, the polygon view of the GGE biplot clearly illustrated the “which-won-where” (scatter plot) pattern described by [22], where each sector’s vertex represented the winning genotype and the relative positions of all other genotypes reflected their responsiveness to the tested environments.

3.6. GGE Biplot for Falling Number Across Twelve Environments

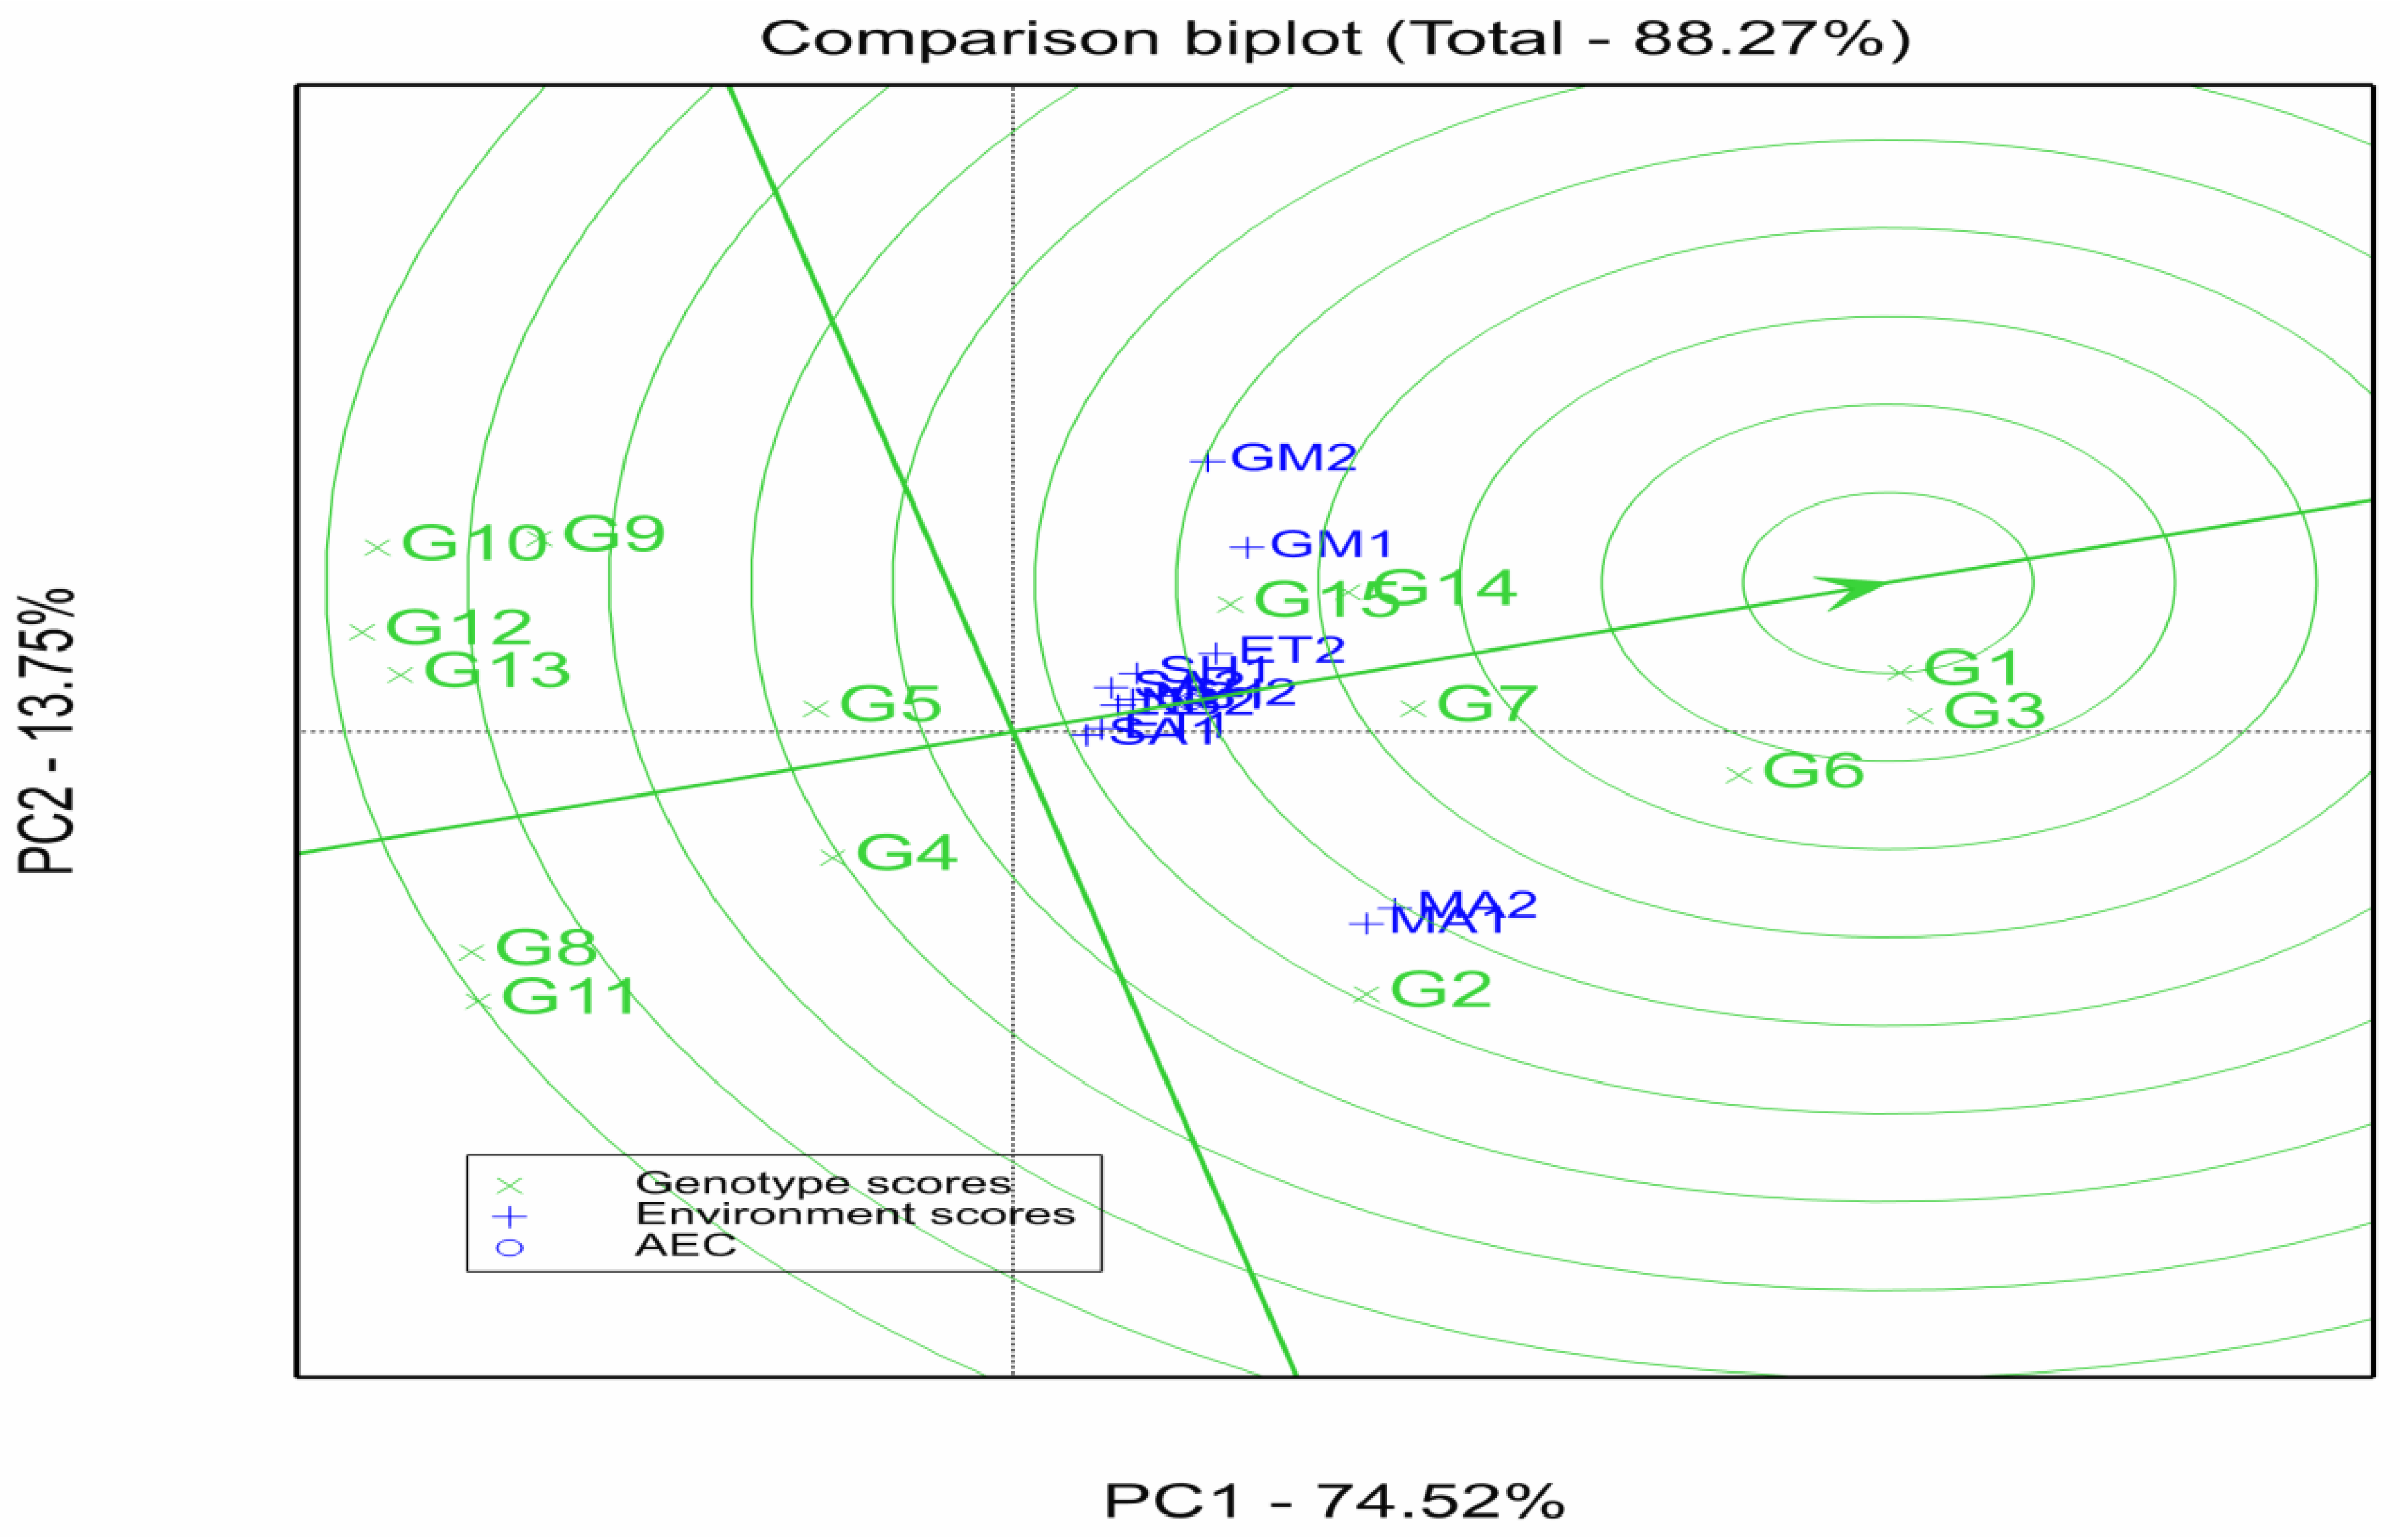
For the falling number trait, PC1 and PC2 accounted for 74.52% and 13.75% of the G + G × E variation for the falling number, respectively (88.27% in total; Figure 3). The extent of the genotype × environment interaction was illustrated by plotting IPCA1 against IPCA2 (Figure 3). Sakha 95 (G1), located on the central circle (middle center), was identified as the ideal genotype. Meanwhile, Misr 4 (G3), Sakha Line#1 (G6), Sakha Line#2 (G7) and Gemmeiza Line#2 (G14) were situated closest to the ideal genotype, indicating their desirable combination of high performance and stability. Sakha Line#2 (G7), Sakha Line#1 (G6), Misr 4 (G3) and Sakha 95 (G1), were near to zero IPCA 1, indicating low GE interaction for falling number trait than other genotypes. Sakha 95 (G1), Misr 3 (G2), Misr 4 (G3), Sakha Line#1 (G6), Sakha Line#2 (G7), Gemmeiza Line#2 (G14) and Gemmeiza Line#3 (G15) had higher falling numbers (more than general mean) (283.8 s) than those genotypes at all sites (Figure 3). Meanwhile other genotypes had lower falling numbers than general mean, and these genotypes were the farthest from the ideal genotype [7,23].
In general Sakha 95 (G1), Misr 4 (G3), Sakha Line#1 (G6), Sakha Line#2 (G7) and Gemmeiza Line#2 (G14) were the best genotypes and more favorable across environments, which indicated that they were highly stable (Figure 3).
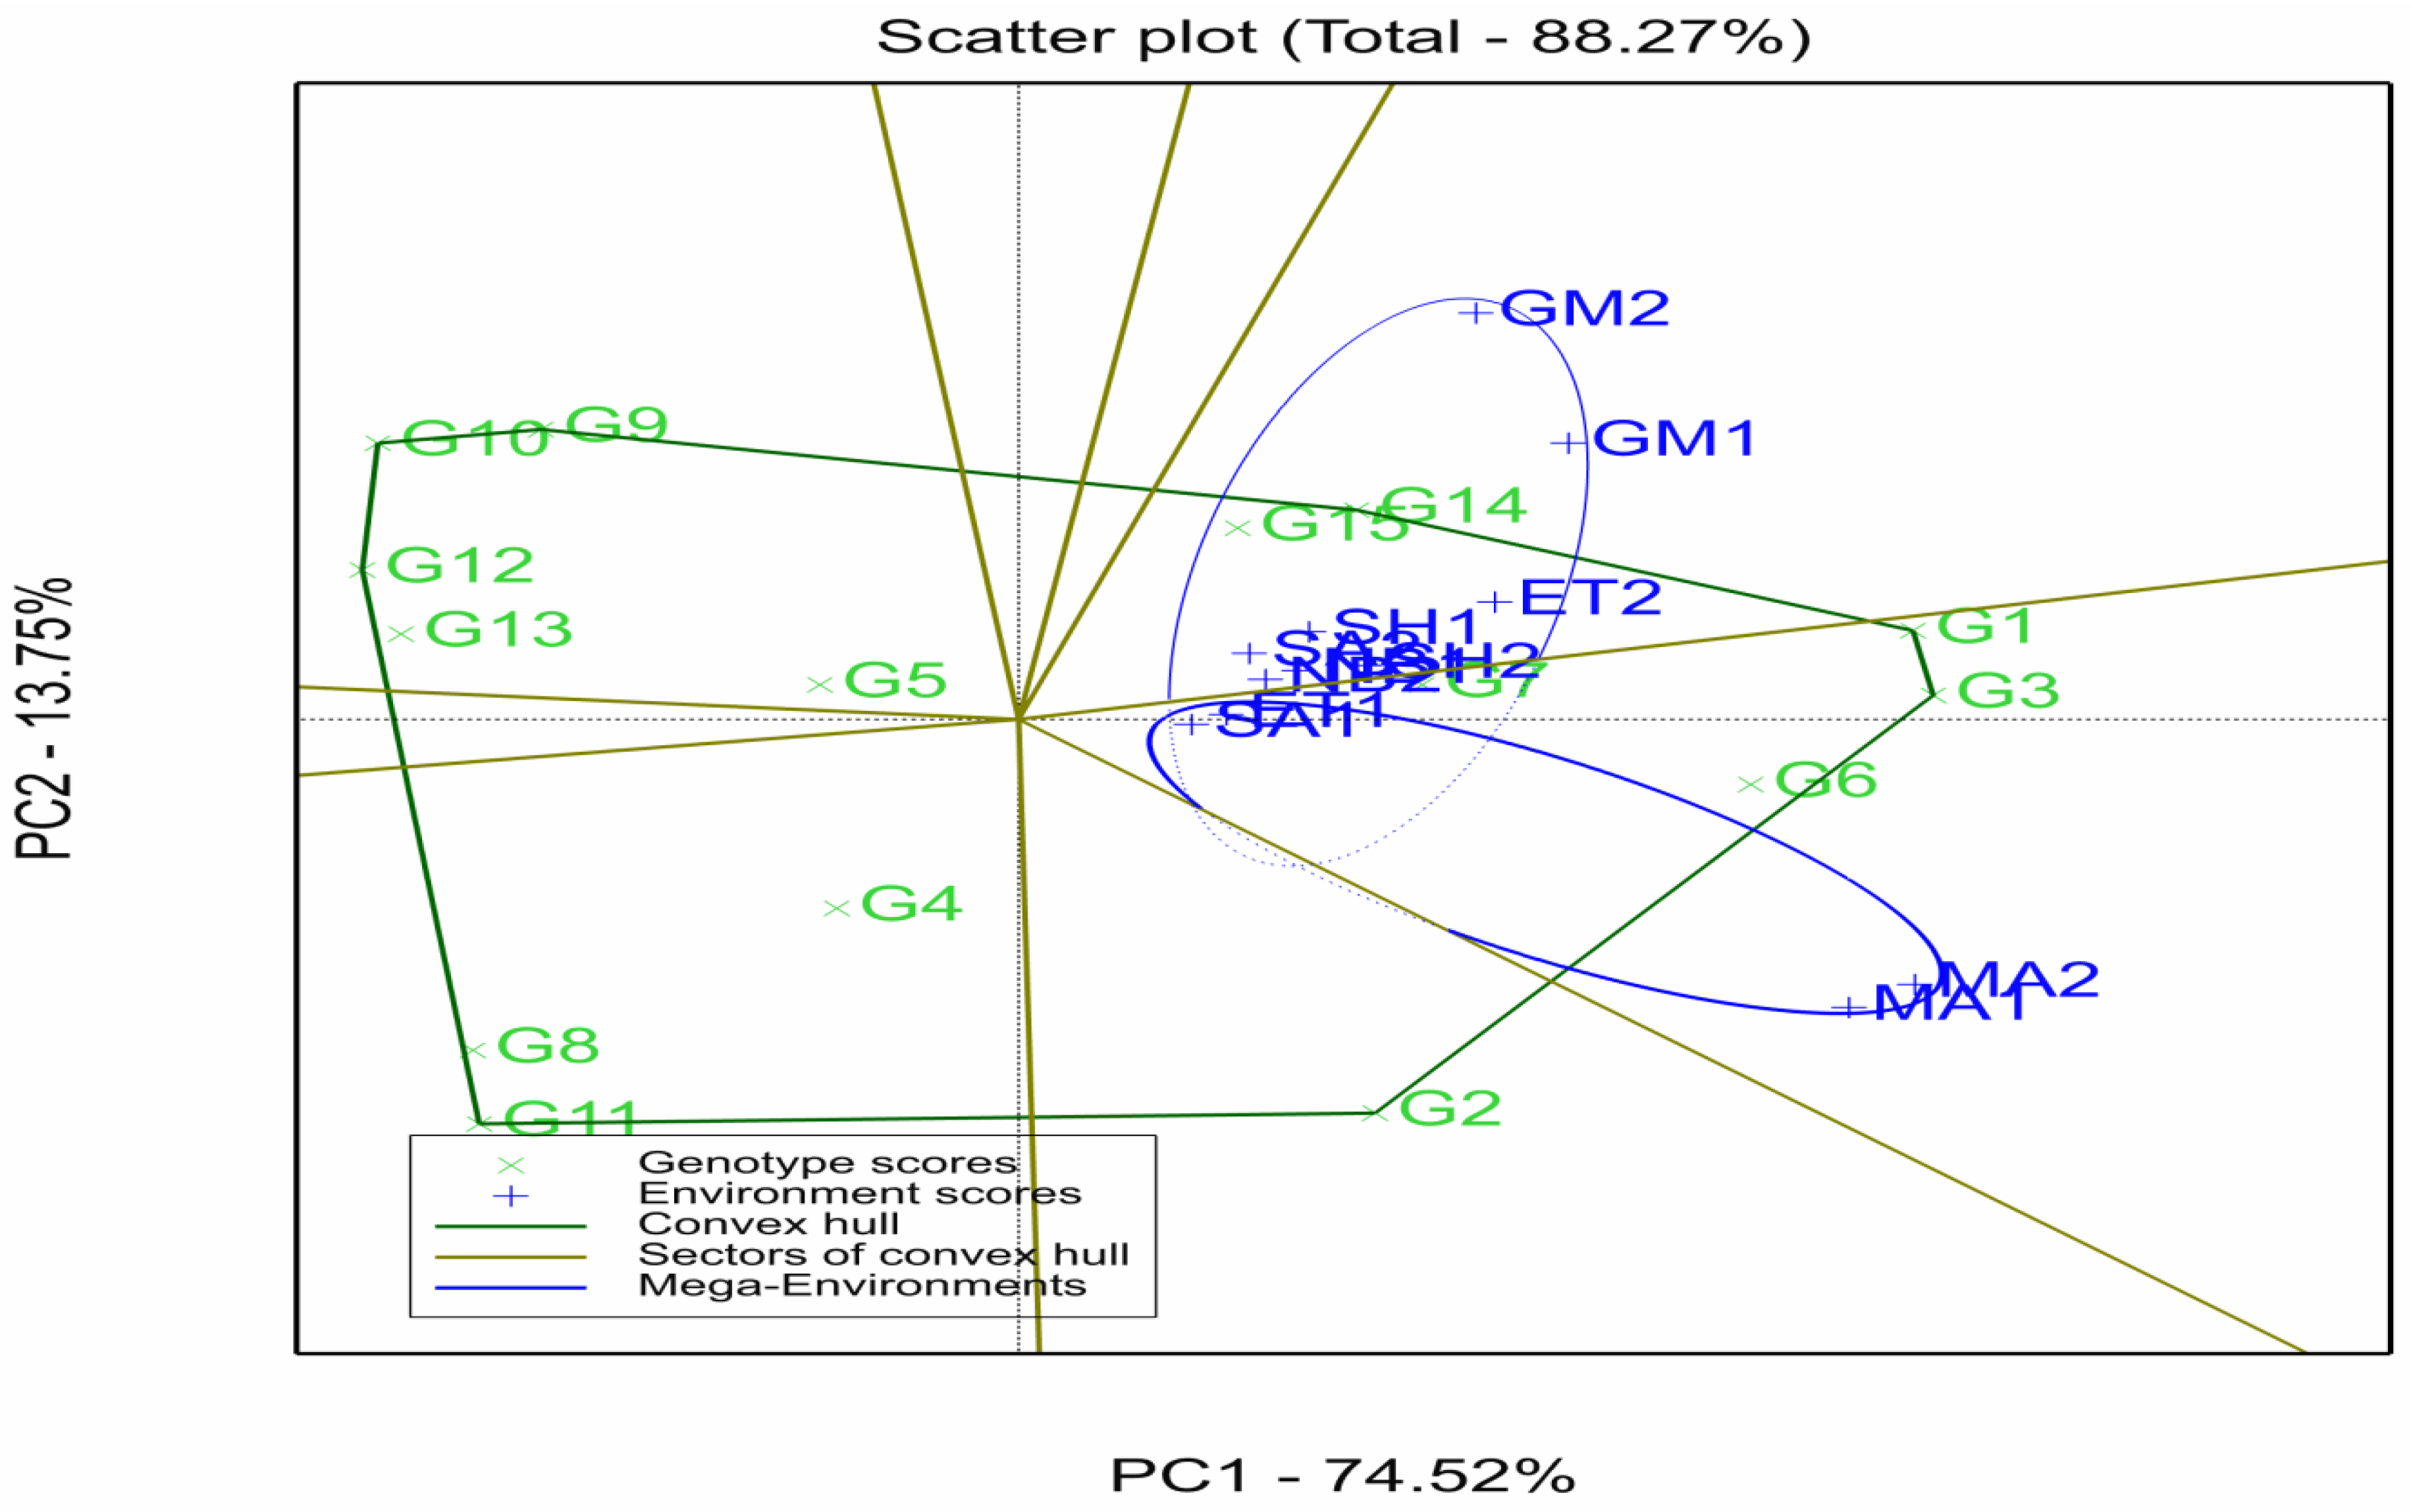
In the scatter plot, environments associated with different stable genotypes were located at the vertices of the GGE polygon, each occupying distinct sectors. The polygon view of the GGE biplot (Figure 4) facilitated the differentiation among genotypes. Based on the genotypes positioned at the polygon vertices, Sakha 95 (G1), Misr 4 (G3), Gemmeiza Line#2 (G14), Misr 3 (G2), Sakha Line#6 (G11), Sakha Line#7 (G12), Sakha Line#5 (G10) and Sakha Line#4 (G9) were the most responsive to the environment, each winning in its own sector. Genotypes situated on the right side of the biplot exhibited higher mean falling number, whereas those on the left side showed below-average values.
The polygon view also revealed that the tested environments were divided into two distinct mega-environments. Genotypes Sakha 95 (G1), Misr 4 (G3), Sakha Line#1 (G6) and Sakha Line#2 (G7) displayed the most favorable responses and highest falling number value in mega-environment 1, which included MA1, MA2, SA1 and ET1 (Figure 4). Conversely, genotypes Gemmeiza Line#2 (G14) and Gemmeiza Line#3 (G15) exhibited superior performance and the highest falling number in mega-environment 2, encompassing GM1, GM2, ET2, NB1, NB2, SA2, SH1 and SH2 [23,25].

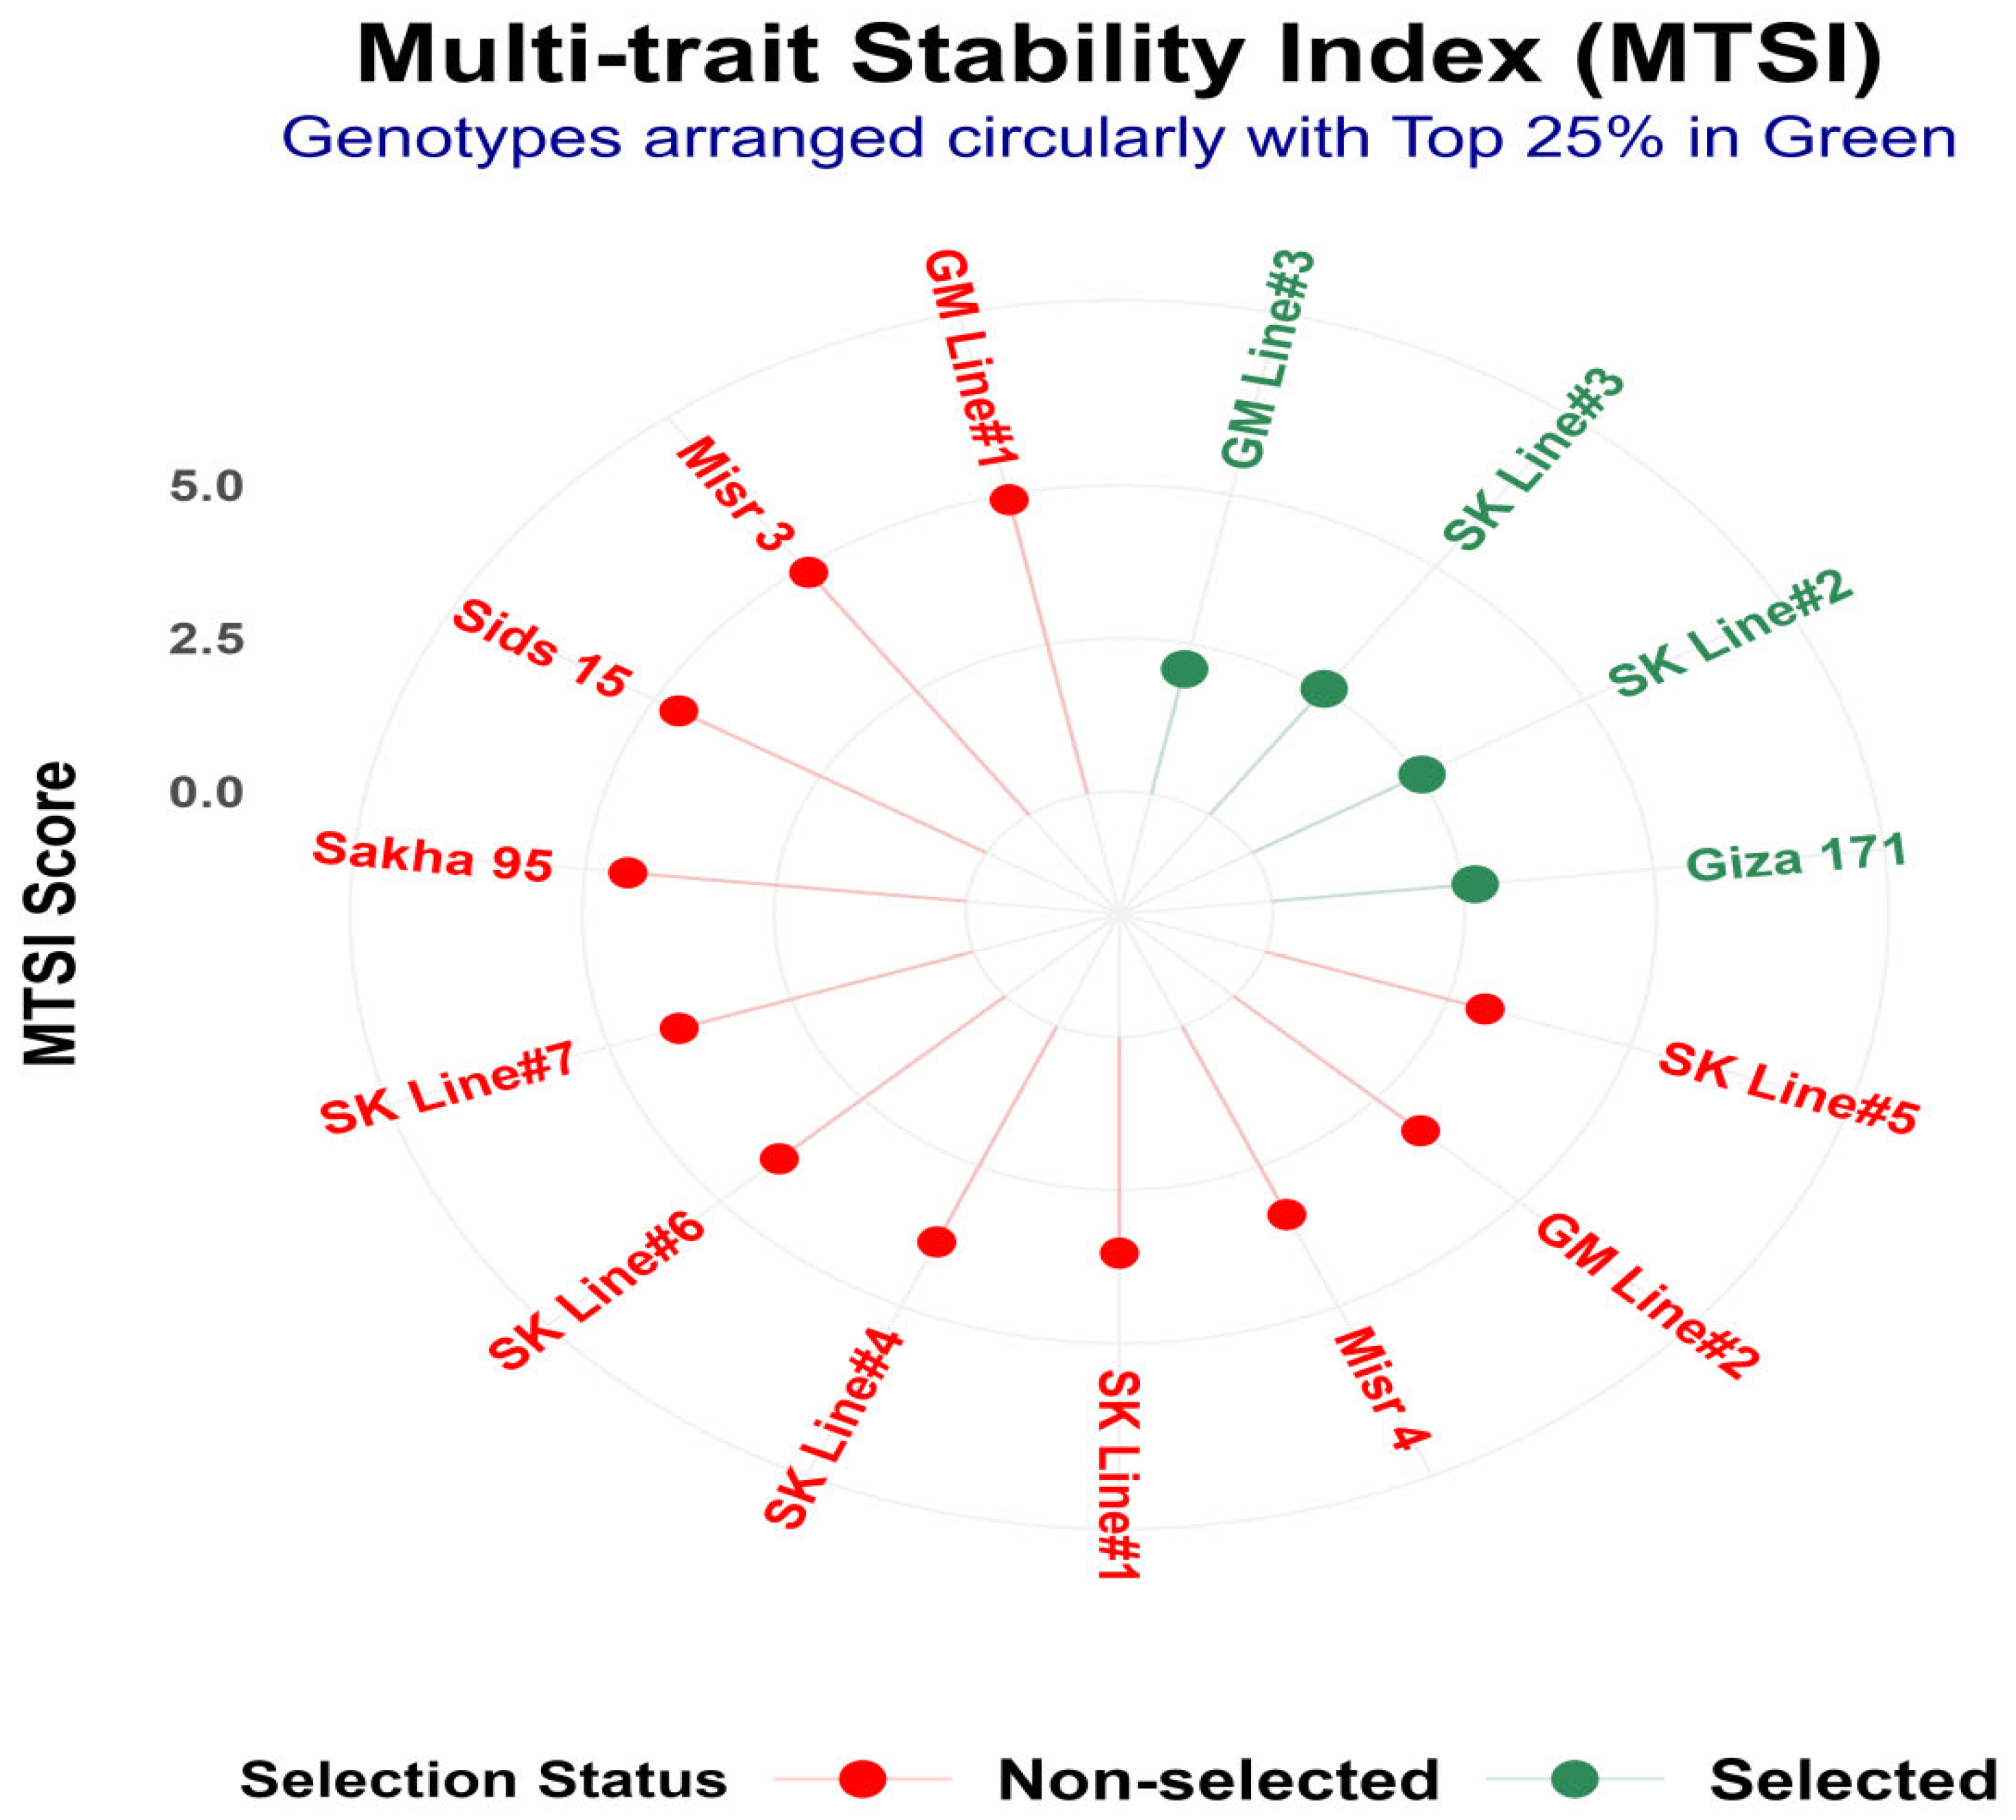
3.7. Multi-Trait Stability Index (MTSI) Analysis of Yield-Related and Quality Studied Traits

The multi-trait stability index (MTSI) was used to identify superior genotypes based on a combination of yield-related and quality traits, including number of spikes m−2, number of grains per spike, 1000-grain weight, grain yield per plot, crude protein, wet gluten, gluten index, and falling number. The MTSI analysis revealed substantial variation among genotypes in terms of overall performance and stability. Genotypes with lower MTSI values are considered more desirable, as they are closer to the ideotype that combines high performance across all evaluated traits (Figure 5).
Based on the selection intensity of 25%, four genotypes were identified as superior and are highlighted in green in the circular plot. These included Gemmeiza Line#3, Sakha Line#3, Sakha Line#2, and Giza 171 (Figure 5). These genotypes exhibited the lowest MTSI scores, indicating a favorable combination of high yield potential and desirable grain quality traits along with stability across the measured variables. In contrast, the remaining genotypes (shown in red) had relatively higher MTSI values, reflecting a greater distance from the ideotype and, therefore, less desirable performance when considering all traits simultaneously. Among these, genotypes such as Gemmeiza Line#1, Misr 3, and Sakha 95 showed comparatively higher MTSI scores (Figure 5), indicating lower overall desirability under the multi-trait selection criteria. The results support that MTSI integrated agronomic and quality traits and identified superior genotypes. The selected genotypes can be considered promising candidates for breeding programs aimed at improving both productivity and grain quality.

4. Discussion

4.1. Combined Analysis of Variance (ANOVA) over Two Seasons at Each Location

The highly significant genotypic differences observed for all studied yield and grain quality traits at each location demonstrate the presence of substantial phenotypic variation among the tested wheat genotypes, which is essential for successful selection and breeding progress. The consistently larger genotype mean squares compared with error variances indicate that most of the observed variation is primarily genetic rather than environmental [20]. The significant variation in yield components, particularly number of spikes m−2, number of grains spike−1, and 1000-grain weight, confirms their importance as major contributors to grain yield and suggests their suitability as effective selection criteria. Likewise, the significant differences detected for grain yield per plot reflect differences in productivity and adaptation among genotypes. For grain quality traits, the significant genotypic effects for crude protein, wet gluten, gluten index, and falling number indicate adequate genetic control and the possibility of improving technological quality through selection (Table 3). Overall, these findings highlight the value of multi-environment evaluation for identifying stable, high-yielding, and good quality wheat genotypes suitable for diverse growing conditions.

4.2. Mean Performance of Fifteen Bread Wheat Genotypes Combined over Two Seasons at Each Location

Identifying yield-related and quality traits in these bread wheat genotypes is crucial for developing a comprehensive evaluation system in Egypt. This approach could serve as a theoretical basis for improving the quality and enhancing the productivity of bread wheat cultivars.

4.2.1. Grain Yield and Yield Component Traits

The significant differences observed among genotypes and locations for yield and its related traits indicate substantial genetic variability and strong influence of environmental factors on bread wheat performance. The wide range in the number of spikes per square meter and number of grains per spike suggests that genotypes responded differently to the environmental conditions, reflecting variation in tillering capacity and grain-setting efficiency (Table 4). Genotypes G1, G3, G6, G7 and G14 consistently produced higher numbers of spikes and grains across most locations, suggesting stable performance. Similar findings were reported by [26,27], who noted that genotypic differences in spike density and grain number are key determinants of yield potential in bread wheat.
The variation in 1000-grain weight and grain yield among genotypes across the individual locations reflects differences in genotype performance and consistency across the two growing seasons. Genotypes G1, G3, and G6 exhibited superior grain weight and grain yield, indicating their favorable performance under the specific agro-environmental conditions of the respective locations (Table 5). Their relatively consistent expression across seasons at particular locations suggests their suitability for those specific environments. In contrast, G9, G11, G12 and G13 showed lower performance, suggesting comparatively poorer productivity under the corresponding local conditions. Grain weight is an important yield component that contributes directly to grain yield and may exhibit greater consistency than some other yield components under varying seasonal conditions [28].
The significant differences among genotypes for all studied grain traits within the individual locations indicate substantial genetic variation in genotype performance and provide opportunities for selection of superior genotypes under location-specific conditions. The observed genotype × season interactions further indicate that the relative performance of some genotypes varied between the two growing seasons within particular locations. Thus, the location-specific combined analyses provide useful information on genotype performance and seasonal consistency within each location.

4.2.2. Grain Quality Traits

The significant differences among genotypes within each location for all studied quality-related traits indicate the strong influence of genetic makeup on bread wheat grain quality. The superior performance of G1 and G3 for crude protein%, wet gluten%, gluten index%, and falling number (second) at several locations and across the two growing seasons suggests their high genetic potential for producing strong gluten and good baking quality, traits that are essential indicators of end-use value (Table 6 and Table 7). These genotypes showed relatively consistent performance between seasons within individual locations, suggesting favorable genetic potential for protein accumulation and gluten quality under the specific conditions of those locations. On the other hand, the lower values recorded for G11, G12, and G13 at several locations may reflect comparatively lower grain quality under the corresponding local conditions. Similar findings were reported by [29,30], who emphasized that protein content, gluten quality, and falling number are influenced by both genotype and growing environment.
Genotypes G1, G3, G6, G14, and G15 exhibited relatively high wet gluten content at several locations, with consistent performance between seasons within individual locations, with mean values exceeding 28.5%. This consistency across seasons within particular locations suggests favorable genetic potential for protein accumulation and gluten quality, making these genotypes promising candidates for bread-making or other high-quality bread wheat products under the corresponding local conditions. In contrast, genotypes G12 and G13 recorded the lowest average wet gluten values (27.7% and 27.8%, respectively), indicating a relatively weaker gluten network, which could limit their suitability for products requiring strong dough elasticity.
The significant variation in the falling number among the bread wheat genotypes within locations reflects differences in α-amylase activity and grain quality. Genotypes G1, G3, and G6 showed higher falling numbers, indicating resistance to starch breakdown and good baking quality under the conditions of the respective locations. Their relatively consistent performance between seasons at particular locations indicates favorable performance for the falling number under those specific environments. In contrast, G8 and G11 recorded lower values, suggesting higher enzyme activity and greater susceptibility to pre-harvest sprouting, which can reduce bread quality. These location-specific findings describe genotype performance and seasonal consistency within individual locations.
Overall, the combined results indicate that yield performance in bread wheat depends on both genetic potential and environmental conditions. Genotypes G1, G3, and G6 demonstrated superior performance across all studied traits, suggesting that these genotypes possess desirable yield component and quality traits and could be recommended as promising genotypes for high yields under Egyptian growing conditions. This balance between yield potential and grain quality makes them promising candidates for simultaneous improvement of quantity and quality in future bread wheat breeding strategies.

4.3. AMMI Combined Analysis for Grain Yield per Plot Across Twelve Environments

The pooled ANOVA revealed highly significant differences among genotypes, environments and their interactions for grain yield per plot and falling number (Table 8 and Table 10), indicating substantial genetic diversity and potential for trait improvement. The significant genotype × environment interaction underscores the importance of stability assessment to determine genotype performance under varying conditions. The strong environmental influence further reflects marked differences among genotypes, while the larger contribution of genotype (G) effects compared with genotype × environment (GE) interactions suggests the presence of diverse environments that favor specific high-yielding genotypes [8,31,32].
The AMMI analysis for grain yield per plot provided valuable insights into both the yield performance and stability of the evaluated bread wheat genotypes across multiple environments. The significant variation among genotypes for IPCA1 and IPCA2 scores reflects the existence of substantial genotype × environment interactions, indicating that the performance of genotypes was influenced by specific environmental conditions. The genotypes Misr 4, Sakha 95, Sakha Line#1, Sakha Line#2 and Gemmeiza Line#2 exhibited the highest mean grain yield (Table 9), suggesting their superior yield potential and adaptability under diverse growing conditions. In terms of stability, Misr 3, Giza 171, Sakha Line#3, Sids 15 and Gemmeiza Line#2 recorded the lowest AMMI Stability Values (ASVs), confirming their consistent performance across environments. The Genotype Selection Index (GSI) further supported these results by identifying Misr 3, Giza 171, Sakha Line#3, Sids 15 and Gemmeiza Line#2 as desirable genotypes due to their combination of high yield and stability. These genotypes are particularly valuable for breeding programs aiming to develop widely adapted cultivars with reliable performance under fluctuating environmental conditions [9].
Conversely, Sakha Line#7, Gemmeiza Line#1, Sakha Line#6 and Sakha Line#4 were characterized by high ASV and GSI values, indicating their greater sensitivity to environmental variations and unstable yield performance. Similar findings were reported by [8,33,34], who emphasized that genotypes with lower ASV and GSI values are more stable and exhibit greater adaptability across environments. Therefore, the combined AMMI and GSI analyses efficiently identified superior and stable genotypes such as Misr 3, Giza 171 and Gemmeiza Line#2, which could be recommended for both breeding purposes and large-scale cultivation under Egyptian conditions.

4.4. AMMI Combined Analysis for Falling Number Across Twelve Environments

The AMMI and GSI analyses for the falling number revealed clear differences among bread wheat genotypes, confirming the existence of substantial genotype × environment interactions for this key grain quality trait. Genotypes such as Gemmeiza Line#2, Giza 171, Gemmeiza Line#3, and Sakha Line#2 exhibited the lowest ASV and GSI values (Table 11), indicating high stability and consistent performance across environments. The superior performance of Gemmeiza Line#2 and Sakha Line#2, which combined high mean values with high stability, demonstrates their strong potential for producing flour of consistent quality under variable growing conditions. Conversely, genotypes such as Sakha Line#7, Sakha Line#5, Sakha Line#6 and Misr 3 were characterized by high ASV and GSI ranks, suggesting sensitivity to environmental fluctuations and poor stability of falling number. Such instability may be associated with inconsistent starch degradation or variable α-amylase activity under different environmental conditions, as also reported by [8,35].
Overall, the combined AMMI and GSI results demonstrated that Gemmeiza Line#2, followed by Gemmeiza Line#3 and Sakha Line#2, were the most desirable genotypes combining both stability and high falling number values. These genotypes could therefore be recommended for further use in bread wheat breeding and quality improvement programs targeting stable end-use quality under Egyptian conditions.

4.5. GGE Biplot Analysis for Grain Yield per Plot Across Twelve Environments

GGE biplot analysis, which combines genotype and genotype-by-environment interaction effects, was utilized to determine the top performing genotypes within each environment and to evaluate their stability [36]. The first two principal components’ combined variance was 86.92%, explained by the GGE biplot analysis. This high percentage indicates that the biplot effectively represents GEI patterns, enabling clear distinction among genotypes based on performance and stability. Such insight aids in identifying consistently superior or specifically adapted genotypes, supporting targeted breeding and selection strategies to enhance grain production efficiency across diverse environments. The ideal genotype is stable across locations and has the highest rank for both grain yield and stability percentage [37,38]. Genotypes or environments located to the right of the y-axis center displayed high grain yield, while those on the left showed lower grain yield. Genotypes near the origin point are less responsive to the environment. Genotypes that are near the “ideal genotype” are desirable for breeding programs (Figure 1), but those that are far from the “ideal genotype” are undesirable [39]. Misr 4 (G3) was found in the concentric circle of the biplot; it was deemed the “ideal genotype” for the current investigation. The findings of this study revealed that genotypes achieved higher yield performance, highlighting the positive impact of the yield components.
The polygon view demonstrated a clear separation among genotypes and environments, highlighting the existence of three distinct mega-environments. Mega-environments are defined by the similarity of genotype rankings among environments rather than by the physical resemblance of their conditions. This partition reflects substantial environmental variability across the testing sites, which impacted genotype performance. Genotypes positioned at the polygon vertices were the most responsive, winning within their particular environmental sectors. Sakha 95 (G1), Misr 4 (G3), Sakha Line#1 (G6), Sakha Line#2 (G7) and Gemmeiza Line#3 (G15) showed superior performance and high grain yield in mega-environment 1 (GM2, ET1, ET2, MA1, MA2, SA1 and SA2) (Figure 2). In contrast, genotype G14 (Gemmeiza Line#2) demonstrated exceptional performance in mega-environment 2 (GM1, NB1, NB2 and SH1), indicating its broad adaptability and stability under these conditions. The two seasons from the same location (Shandaweel), which are situated in different mega-environments, indicate that the genotypes exhibited different responses across seasons. In contrast, Sakha, Etay El Baroud, Nubaria, and Malawy were located in the same mega-environments, suggesting that the genotypes displayed similar responses in both seasons. The distinctions between the mega-environments suggest that environmental variables, including temperature, humidity and soil properties, played a vital role in shaping genotype responses related to grain yield.
This suggests that variation in stability arose not only from differences among locations but also from differences in seasonal conditions. These results are in line with those of Hossain et al. [25].

4.6. GGE Biplot Analysis for Falling Number Across Twelve Environments

The GGE biplot analysis provided a comprehensive understanding of the genotype × environment interaction (GEI) for the falling number among the evaluated bread wheat genotypes. The combined variance of the first two principal components was 88.27%, as explained by the GGE biplot analysis. The high percentage confirms the biplot’s reliability in distinguishing genotype performance and stability, helping breeders identify superior genotypes and improve grain quality across diverse environments. The ideal genotype is stable across environments and possesses a high mean falling number (Figure 3) [23,37]. Meanwhile genotypes near the ideal are also preferred; those far from it are considered undesirable [39]. Sakha 95 (G1) was located within the concentric circle of the biplot; it was identified as the “ideal” genotype with a stable and high falling number for this study. Genotypes closest to the ideal exhibit stability and a high falling number; conversely, genotypes farther from the ideal show less stability and a lower falling number (Figure 3).
The polygon view revealed clear differentiation among genotypes and environments, emphasizing the presence of two distinct mega-environments. Such division indicates considerable environmental diversity across testing locations, which influenced genotype performance. Sakha 95 (G1), Misr 4 (G3), Sakha Line#1 (G6) and Sakha Line#2 (G7) exhibited superior performance and high falling number in mega-environment 1 (MA1, MA2, SA1 and ET1), demonstrating broad adaptability and stability under these conditions. In contrast, Gemmeiza Line#2 (G14) and Gemmeiza Line#3 (G15) were the best performers in mega-environment 2 (GM1, GM2, ET2, NB1, NB2, SA2, SH1 and SH2) (Figure 4), suggesting specific adaptation to those environments. The observed differences among mega-environments indicate that environmental factors may have significantly contributed to genotype responses for falling number.
These findings emphasize the role of GEI in selecting bread wheat genotypes for stability and quality, with both broadly and specifically adapted genotypes supporting targeted breeding, consistent with [9,23]. The results demonstrate that GGE biplot analysis is an effective tool for visualizing genotype stability and guiding breeding programs toward the development of high-quality, stable bread wheat varieties.

4.7. Multi-Trait Stability Index (MTSI) Analysis of Yield-Related and Quality Studied Traits

The multi-trait stability index proved to be an effective and robust approach for the simultaneous selection of bread wheat genotypes based on multiple agronomic and quality traits. Unlike traditional selection strategies that rely on single-trait evaluation, MTSI integrates multiple variables into a unified framework, allowing for the identification of genotypes closest to an ideotype characterized by high yield, desirable quality, and overall stability. This ideotype-based selection approach has been widely recognized as a reliable method for improving breeding efficiency under complex trait interactions.
In the present study, the observed variability among genotypes reflects their differential ability to combine yield components and quality traits. The genotypes selected based on the lowest MTSI values demonstrated superior overall performance (Figure 5), indicating a balanced expression of productivity and quality traits. This agrees with recent findings showing that MTSI effectively identifies high-performing and stable genotypes across multiple environments and traits [40]. The superiority of selected genotypes can be explained by their reduced distance from the ideotype, meaning they require minimal improvement across all evaluated traits. This characteristic is particularly important in wheat breeding, where simultaneous improvement of yield and end-use quality is often constrained by negative correlations between traits. MTSI overcomes this limitation by considering the collective contribution of traits, thus enabling more balanced genetic gains. Similar conclusions were reported in recent studies where MTSI successfully identified genotypes combining high yield potential with desirable agronomic attributes under stress and non-stress conditions [41].
Moreover, MTSI offers a key advantage by accounting for trade-offs among traits, optimizing overall performance rather than focusing on a single trait. This approach improves decision making, reduces the risk of undesirable trait imbalances, and enhances the accuracy of genotype selection. It also simplifies complex multi-trait data into a single index, making it especially useful in breeding programs and effective for identifying superior genotypes under diverse conditions [42]. Studies conducted under diverse environmental conditions have demonstrated that MTSI enhances the identification of superior genotypes and improves selection gains, especially when traits are controlled by complex genetic architectures [43]. Recent applications of MTSI in wheat breeding under stress conditions further confirm its effectiveness in identifying stable and high-performing genotypes. For example, MTSI was successfully used to confirm superior genotypes that maintained productivity and stability under stress condition, highlighting its practical relevance in climate-resilient breeding programs [44].
The MTSI-selected genotypes, namely, Gemmeiza Line#3, Sakha Line#3, Sakha Line#2, and Giza 171, were distinguished by their overall balance across the evaluated yield and grain quality traits rather than by superiority in a single trait. The MTSI results indicated that the selected genotypes had relatively favorable performance for important yield components, including number of grains per spike, 1000-grain weight, and number of spikes m−2, together with desirable grain yield and quality attributes such as crude protein, wet gluten, gluten index, and falling number. This balanced trait combination resulted in their shorter distance from the defined ideotype and consequently lower MTSI values. Thus, the selected genotypes represent distinct multi-trait profiles that provide a favorable compromise between productivity, grain quality, and stability, which would be difficult to achieve through selection based on a single trait alone [45].
Overall, the results of this study reinforce the importance of adopting multi-trait selection indices such as MTSI in modern wheat breeding. The selected genotypes represent promising candidates for future breeding efforts aimed at achieving simultaneous improvements in yield and grain quality. The application of MTSI not only enhances selection efficiency but also supports the development of cultivars that meet the increasing demands of both producers and end-users under diverse and changing environmental conditions.
This study integrates AMMI, GGE biplot, and MTSI to simultaneously evaluate yield, stability, and grain quality of bread wheat across multiple environments. It uniquely combines multi-trait selection with classical stability analyses, enabling the identification of high-yielding, stable, and quality genotypes under variable climatic conditions.
The present study was designed to address three main questions: whether the evaluated bread wheat genotypes differ in grain yield and grain quality traits across contrasting environments, how genotype × environment interaction influences their performance and stability, and which genotypes can be identified as promising materials combining high yield, stability, and desirable grain quality. The results provided clear answers to these questions. Significant genotypic differences were observed for the evaluated yield and quality traits across locations, demonstrating considerable variation among the tested genotypes. Furthermore, the significant genotype × environment interaction indicated that genotype performance varied according to the testing environment, highlighting the importance of multi-environment evaluation for reliable genotype selection. The AMMI and GGE biplot analyses further identified genotypes with high and stable performance across environments, while the MTSI analysis enabled simultaneous selection based on yield, yield-related, and grain quality traits. Thus, the combined use of these approaches provided a comprehensive framework for identifying promising bread wheat genotypes with desirable performance and stability under diverse Egyptian environments.

5. Conclusions

The evaluated bread wheat genotypes showed considerable differences in performance among locations and between growing seasons, primarily due to genotype × environment interactions. The location-specific combined analyses provided information on genotype performance and consistency across seasons within individual locations, whereas the AMMI, GGE biplot, and MTSI analyses provided broader information on genotype performance, adaptability, stability, and multi-trait superiority across the 12 environments (6 locations × 2 seasons). Based on the location-specific combined analyses, genotypes G1, G3, and G6 generally exhibited superior yield performance at several locations and showed relatively consistent performance across seasons within particular locations, whereas G9, G11, and G12 generally exhibited lower yield performance under the corresponding location-specific conditions. For grain quality traits, G1, G3, G6, G14, and G15 demonstrated superior performance at several locations, with favorable consistency across seasons within individual locations, while G11, G12, and G13 showed comparatively lower grain quality values. These location-specific findings provide a basis for identifying genotypes suited to particular locations rather than making broad recommendations across all environments. For broader multi-environment evaluation, the AMMI and GGE biplot analyses identified Sakha 95 (G1), Misr 4 (G3), Sakha Line#1 (G6), Sakha Line#2 (G7), Gemmeiza Line#2 (G14), and Gemmeiza Line#3 (G15) as high-yielding and relatively stable genotypes across the 12 environments, with superior performance for yield and falling number traits. These genotypes therefore represent promising candidates for broader multi-environment cultivation and further multi-location and multi-year evaluation in Egypt. Under a 25% selection intensity, the MTSI analysis identified Gemmeiza Line#3, Sakha Line#3, Sakha Line#2, and Giza 171 as superior genotypes based on their overall performance across the evaluated yield and grain quality traits. Importantly, the genotypes identified by AMMI and GGE biplot were selected primarily for high grain yield and stability across the overall set of environments, whereas the MTSI-selected genotypes were identified based on their overall multi-trait performance and stability. Therefore, differences between the genotypes selected by these approaches reflect their complementary selection objectives rather than inconsistency among the methods. The identification of stable, high-performing, and quality-promising genotypes may contribute to the development of improved wheat cultivars adapted to diverse agro-ecological conditions in Egypt. Together, these complementary analytical approaches provide a more comprehensive framework for genotype evaluation and selection in modern wheat breeding programs.

Supplementary Materials

The following supporting information can be downloaded at: https://www.mdpi.com/article/10.3390/su18179010/s1, Table S1: Monthly and seasonal rainfall (mm) recorded at the six experimental locations during the 2023/24 and 2024/25 growing seasons; Table S2: Physical and chemical properties of soils at the six experimental locations at a depth of 0–30 cm across the two growing seasons; Table S3: Levene’s test for homogeneity of variances across growing seasons for the studied traits; Table S4: Combined analysis of variance of 15 wheat genotypes for studied traits evaluated at Sakha location; Table S5: at Gemmeiza location; Table S6: at Etay El Baroud location; Table S7: at Nubaria location; Table S8: at Shandaweel location; Table S9: at Malawy location (all combined over the 2023/2024 and 2024/2025 growing seasons).

Author Contributions

M.S.G.: conceptualization, methodology, data curation, and writing—review and editing. M.A.H.: data curation, methodology, investigation. A.R.I.: data curation, methodology, software, and validation. A.M.S.: investigation, data curation, and visualization. H.A.M.E.-S.: validation, review, and editing. R.N.F.A.: conceptualization, formal analysis, visualization, writing—original draft. E.R.M.: validation, review, and editing. All authors have read and agreed to the published version of the manuscript.

Funding

The authors did not receive any financial or institutional support for the submitted work.

Institutional Review Board Statement

Not applicable.

Informed Consent Statement

Not applicable.

Data Availability Statement

The data presented in this study are available on request from the corresponding author.

Acknowledgments

The authors gratefully acknowledge all staff for their contributions to the development of this research.

Conflicts of Interest

The authors declare no conflict of interest.

References

  1. Spina, A.; Dinelli, G.; Palumbo, M.; Whittaker, A.; Cambrea, M.; Negri, L.; Bosi, S. Evaluation of standard physico-chemical and rheological parameters in predicting bread-making quality of durum wheat (Triticum turgidum L. ssp. durum [Desf.] Husn.). Int. J. Food Sci. Technol. 2021, 56, 3278–3288. [Google Scholar] [CrossRef] [Scilit]
  2. Martínez-Moreno, F.; Ammar, K.; Solís, I. Global changes in cultivated area and breeding activities of durum wheat from 1800 to date: A historical review. Agronomy 2022, 12, 1135. [Google Scholar] [CrossRef] [Scilit]
  3. United States Department of Agriculture (USDA). Production, Supply and Distribution Database. Available online: https://fas.usda.gov/data/production/commodity/0410000 (accessed on 22 June 2026).
  4. USDA Foreign Agricultural Service. Egypt Grain and Feed Annual Report. Available online: https://www.fas.usda.gov (accessed on 22 June 2026).
  5. Asseng, S.; Kheir, A.M.; Kassie, B.T.; Hoogenboom, G.; Abdelaal, A.I.; Haman, D.Z.; Ruane, A.C. Can Egypt become self-sufficient in wheat? Environ. Res. Lett. 2018, 13, 094012. [Google Scholar] [CrossRef] [Scilit]
  6. Elbeltagi, A.; Aslam, M.R.; Malik, A.; Mehdinejadiani, B.; Srivastava, A.; Bhatia, A.S.; Deng, J. The impact of climate changes on the water footprint of wheat and maize production in the Nile Delta, Egypt. Sci. Total Environ. 2020, 743, 140770. [Google Scholar] [CrossRef] [Scilit]
  7. Mullualem, D.; Tsega, A.; Mengie, T.; Fentie, D.; Kassa, Z.; Fassil, A.; Wondaferew, D.; Gelaw, T.A.; Astatkie, T. Genotype-by-environment interaction and stability analysis of grain yield of bread wheat (Triticum aestivum L.) genotypes using AMMI and GGE biplot analyses. Heliyon 2024, 10, e32918. [Google Scholar] [CrossRef] [Scilit]
  8. Taherian, M.; Saeidnia, F.; Hamid, R.; Nazeri, S.M. Identification of high-yielding and stable cultivars of wheat under different sowing dates: Comparison of AMMI and GGE-biplot analyses. Heliyon 2024, 10, e39599. [Google Scholar] [CrossRef] [Scilit]
  9. Motawei, M.I.; Al-Ghumaiz, N.S.; Al-Otayk, S.M.; Abd-Elmoniem, E.M.; Aggag, A.M. Genotype × environment interaction and stability of grain micronutrients in wheat under organic and conventional systems: AMMI and GGE analysis. Front. Plant Sci. 2026, 17, 1785559. [Google Scholar] [CrossRef] [Scilit]
  10. Bjornsson, J. Stability Analysis towards Understanding Genotype × Environment Interaction; Plant Agriculture Department, University of Guelph: Ontario, ON, Canada, 2002; pp. 25–26. [Google Scholar]
  11. Roustaii, M.; Ahari, D.S.; Hesami, A.; Soleymani, K.; Pashapour, H.; Mahmoodi, K.N.; Poursiahbidi, M.M.; Ahmadi, M.M.; Hosni, M.H.; Abediasl, G. Study of adaptability and stability of grain yield of bread wheat genotypes in cold and moderate-cold dry land areas. Seed Plant Improv. J. 2003, 19, 263–280. [Google Scholar]
  12. AACC International. Approved Methods of Analysis, 11th ed.; Method 56-81B: Determination of Falling Number; AACC International: St. Paul, MN, USA, 2010. [Google Scholar]
  13. Levene, H. Robust Tests for Equality of Variances. In Contributions to Probability and Statistics; Olkin, I., Ed.; Stanford University Press: Stanford, CA, USA, 1960; pp. 278–292. [Google Scholar]
  14. Gomez, K.A.; Gomez, A.A. Statistical Procedures for Agricultural Research; John Wiley & Sons: New York, NY, USA, 1984. [Google Scholar]
  15. Crossa, J. Statistical analyses of multilocation trials. Adv. Agron. 1990, 44, 55–85. [Google Scholar] [CrossRef] [Scilit]
  16. Purchase, J.L.; Hatting, H.; Vandeventer, C.S. Genotype × environment interaction of winter wheat (Triticum aestivum L.) in South Africa: II. Stability analysis of yield performance. S. Afr. J. Plant Soil 2000, 17, 101–107. [Google Scholar] [CrossRef] [Scilit]
  17. Gabriel, K.R. The biplot graphic display of matrices with application to principal component analysis. Biometrika 1971, 58, 453–467. [Google Scholar] [CrossRef]
  18. VSN International Ltd. GenStat for Windows, 19th ed.; VSN International Ltd.: Hemel Hempstead, UK, 2017. [Google Scholar]
  19. R Core Team. R: A Language and Environment for Statistical Computing; R Foundation for Statistical Computing: Vienna, Austria, 2025; Available online: https://www.R-project.org/ (accessed on 22 June 2026).
  20. Abu-Ellail, F.F.; Bassiony, N.; Abdelkawy, R.N. Using multivariate analyses to evaluate the impact of proline on sugar and root yield traits in sugar beet under saline conditions. Bull. Natl. Res. Cent. 2025, 49, 46. [Google Scholar] [CrossRef] [Scilit]
  21. Feltaous, Y.M.; El-Hag, W.A.A. Adaptability of ten bread wheat genotypes under Delta, Middle, and Upper Egypt conditions. J. Plant Prod. Mansoura Univ. 2025, 16, 93–100. [Google Scholar] [CrossRef] [Scilit]
  22. Yan, W. Mega-environment analysis and test location evaluation based on unbalanced multiyear data. Crop Sci. 2015, 55, 113–122. [Google Scholar] [CrossRef] [Scilit]
  23. Abd Elhamid, E.A.M. GGE-biplot analysis of yield stability in multi-environments of some bread wheat genotypes in Egypt. Egypt J. Plant Breed. 2020, 24, 823–838. [Google Scholar]
  24. Yan, W.; Rajcan, I. Biplot evaluation of test sites and trait relations of soybean in Ontario. Crop Sci. 2002, 42, 11–20. [Google Scholar] [CrossRef]
  25. Hossain, M.A.; Jahan, J.; Timsina, J.; Teixeira da Silva, J.A.; Mahboob, M.G.; Farhad, M. Biplot yield analysis of heat-tolerant spring wheat genotypes (Triticum aestivum L.) in multiple growing environments. Open Agric. 2018, 3, 404–413. [Google Scholar] [CrossRef] [Scilit]
  26. Würschum, T.; Leiser, W.L.; Langer, S.M.; Tucker, M.R.; Longin, C.F.H. Phenotypic and genetic analysis of spike and kernel characteristics in wheat reveals long-term genetic trends of grain yield components. Theor. Appl. Genet. 2018, 131, 2071–2084. [Google Scholar] [CrossRef] [Scilit]
  27. Fischer, T.; Gonzalez, F.G.; Miralles, D.J. Breeding for increased grains m−2 in wheat crops through targeting critical period duration: A review. Field Crops Res. 2024, 316, 109497. [Google Scholar] [CrossRef] [Scilit]
  28. Elhadi, G.M.I.; Kamal, N.M.; Gorafi, Y.S.A.; Yamasaki, Y.; Takata, K.; Tahir, I.S.A.; Itam, M.O.; Tanaka, H.; Tsujimoto, H. Exploitation of tolerance of wheat kernel weight and shape-related traits from Aegilops tauschii under heat and combined heat-drought stresses. Int. J. Mol. Sci. 2021, 22, 1830. [Google Scholar] [CrossRef] [Scilit]
  29. Zhang, X.; Ma, X.; Li, Y.; Ju, H. Geographical detector-based wheat quality attribution under genotype, environment, and crop management frameworks. Front. Environ. Sci. 2022, 10, 1037979. [Google Scholar] [CrossRef] [Scilit]
  30. Ghafoor, A.Z.; Ceglińska, A.; Karim, H.; Wijata, M.; Sobczyński, G.; Derejko, A.; Studnicki, M.; Rozbicki, J.; Cacak-Pietrzak, G. Influence of genotype, environment, and crop management on the yield and bread-making quality in spring wheat cultivars. Agriculture 2024, 14, 2131. [Google Scholar] [CrossRef] [Scilit]
  31. Ali, A.N.; El Hosary, A.A.; Salwaa, M.I.; El-Badawy, M.; Gad, K. Genotype–environment interaction for grain yield in wheat. Ann. Agric. Sci. Moshtohor 2022, 60, 1035–1044. [Google Scholar] [CrossRef] [Scilit]
  32. Chaudhary, E.; Sharma, S.; Gautam, P.; Ghimire, S.; Sapkota, S.; Bhattarai, K.; Roka, P.; Poudel, R.; Timalsina, B.; Neupane, K.; et al. AMMI GGE biplot analysis of wheat genotypes under heat stress and heat drought environment. Arch. Agric. Environ. Sci. 2023, 8, 484–489. [Google Scholar] [CrossRef] [Scilit]
  33. Jędzura, S.; Bocianowski, J.; Matysik, P. The AMMI model application to analyze the genotype–environment interaction of spring wheat grain yield for the breeding program purposes. Cereal Res. Commun. 2023, 51, 197–205. [Google Scholar] [CrossRef] [Scilit]
  34. Darwish, M.A.; Zain, A.A.; Yassin, M.M.M.; Ahmed, E.G.G.; El Samahy, B.E.; Shalaby, N.E. Stability analysis for some agronomic and quality characters of new bread wheat genotypes under multi-environmental trials in Egypt. J. Plant Prod. Mansoura Univ. 2024, 15, 769–775. [Google Scholar] [CrossRef] [Scilit]
  35. Darwish, M.A.; Abd El-Rady, A.G.; Mohamed, M.M.; Ghalab, E.; Elfanah, A.M. Estimation of AMMI and GGE biplots for some bread and durum wheat genotypes. J. Plant Prod. Mansoura Univ. 2022, 13, 75–83. [Google Scholar] [CrossRef] [Scilit]
  36. Dalló, S.C.; Zdziarski, A.D.; Woyann, L.G.; Milioli, A.S.; Zanella, R.; Conte, J.; Benin, G. Across year and year-by-year GGE biplot analysis to evaluate soybean performance and stability in multi-environment trials. Euphytica 2019, 215, 1–12. [Google Scholar] [CrossRef] [Scilit]
  37. Farshadfar, E.; Mohammadi, R.; Aghaee, M.; Vaisi, Z. GGE biplot analysis of genotype × environment interaction in wheat-barley disomic addition lines. Aust. J. Crop Sci. 2012, 6, 1074–1079. [Google Scholar]
  38. Gitonga, H.W.; Ojwang, P.P.O.; Macharia, G.K.; Njau, P.N. Evaluation of advanced bread wheat genotypes for resistance to stem rust and yield stability. Afr. J. Plant Sci. 2016, 10, 111–120. [Google Scholar] [CrossRef] [Scilit][Green Version]
  39. Yan, W.; Tinker, N.A. Biplot analysis of multi-environment trial data: Principles and applications. Can. J. Plant Sci. 2006, 86, 623–645. [Google Scholar] [CrossRef] [Scilit]
  40. Kakanur, J.Y.; Navathe, S.; Krishnappa, G.; Ambati, D.; Baviskar, V.; Biradar, S.; Magar, N.; Mishra, C.N.; Mamrutha, H.M.; Govindan, V.; et al. Multi-environment analysis of nutritional and grain quality traits in relation to grain yield under drought and terminal heat stress in bread wheat and durum wheat. J. Agron. Crop Sci. 2024, 210, e12763. [Google Scholar] [CrossRef] [Scilit]
  41. Mohammadi, R.; Geravandi, M. Multi-trait selection for agronomic performance and drought tolerance among durum wheat genotypes evaluated under rainfed and irrigated environments. Exp. Agric. 2024, 60, e3. [Google Scholar] [CrossRef] [Scilit]
  42. Aruna, K.; Dushyantha Kumar, B.M.; Sridhara, S.; Sowjanya, B.A.; Naveen Kumar, K.L.; Moussa, I.M.; Elansary, H.O.; Olivoto, T. Multi-trait stability index for identification of stable genotypes under multiple conditions. Heliyon 2024, 10, e32763. [Google Scholar] [CrossRef] [Scilit]
  43. Pour-Aboughadareh, A.; Jamshidi, B.; Jadidi, O.; Bocianowski, J.; Niemann, J. Multi-trait stability index in the selection of high-yielding and stable barley genotypes. J. Appl. Genet. 2025, 1–7. [Google Scholar] [CrossRef] [Scilit]
  44. Andonissamy, D.A.; Shantikumar, L.; Sharma, S.; Tomar, T.; Khan, A.; Arivanandham, R.R.; Harikrishna; Anand, A.; Bentley, A.R.; Reynolds, M.P.; et al. Multi-environment stability analysis identifies wheat genotypes tolerant to terminal heat stress under varied nitrogen regimes. Plant Physiol. Rep. 2026, 1–11. [Google Scholar] [CrossRef] [Scilit]
  45. Olivoto, T.; Lúcio, A.D.C.; da Silva, J.A.G.; Sari, B.G.; Diel, M.I. Mean Performance and Stability in Multi-Environment Trials II: Selection Based on Multiple Traits. Agron. J. 2019, 111, 2961–2969. [Google Scholar] [CrossRef] [Scilit]
Figure 1. Comparison of GGE biplot diagram of interaction principal component axis (IPCA1) against (IPCA2) of 15 bread wheat genotypes in 12 environments for grain yield per plot. G1 (Sakha 95), G2 (Misr 3), G3 (Misr 4), G4 (Giza 171), G5 (Sids 15), G6 (Sakha Line#1), G7 (Sakha Line#2), G8 (Sakha Line#3), G9(Sakha Line#4), G10 (Sakha Line#5), G11 (Sakha Line#6), G12 (Sakha Line#7), G13 (Gemmeiza Line#1), G14 (Gemmeiza Line#2) and G15 (Gemmeiza Line#3), L1 (Sakha), L2 (Gemmeiza), L3 (Etay El Baroud), L4 (Nubaria), L5 (Shandaweel) and L6 (Malawy).
Sustainability 18 09010 g001
Figure 2. Polygon of GGE biplot diagram of interaction principal component axis (IPCA1) against (IPCA2) of 15 bread wheat genotypes in twelve environments for grain yield per plot. G1 (Sakha 95), G2 (Misr 3), G3 (Misr 4), G4 (Giza 171), G5 (Sids 15), G6 (Sakha Line#1), G7 (Sakha Line#2), G8 (Sakha Line#3), G9 (Sakha Line#4), G10 (Sakha Line#5), G11 (Sakha Line#6), G12 (Sakha Line#7), G13 (Gemmeiza Line#1), G14 (Gemmeiza Line#2) and G15 (Gemmeiza Line#3), L1 (Sakha), L2 (Gemmeiza), L3 (Etay El Baroud), L4 (Nubaria), L5 (Shandaweel) and L6 (Malawy).
Sustainability 18 09010 g002
Figure 3. Comparison of GGE biplot diagram of interaction principal component axis (IPCA1) against (IPCA2) of 15 bread wheat genotypes in twelve environments for falling number. G1 (Sakha 95), G2 (Misr 3), G3 (Misr 4), G4 (Giza 171), G5 (Sids 15), G6 (Sakha Line#1), G7 (Sakha Line#2), G8 (Sakha Line#3), G9 (Sakha Line#4), G10 (Sakha Line#5), G11 (Sakha Line#6), G12 (Sakha Line#7), G13 (Gemmeiza Line#1), G14 (Gemmeiza Line#2) and G15 (Gemmeiza Line#3), L1 (Sakha), L2 (Gemmeiza), L3 (Etay El Baroud), L4 (Nubaria), L5 (Shandaweel) and L6 (Malawy).
Sustainability 18 09010 g003
Figure 4. Polygon of GGE biplot diagram of interaction principal component axis (IPCA1) against (IPCA2) of 15 bread wheat genotypes in twelve environments for falling number. G1 (Sakha 95), G2 (Misr3), G3 (Misr 4), G4 (Giza 171), G5 (Sids 15), G6 (Sakha Line#1), G7 (Sakha Line#2), G8 (Sakha Line#3), G9 (Sakha Line#4), G10 (Sakha Line#5), G11 (Sakha Line#6), G12 (Sakha Line#7), G13 (Gemmeiza Line#1), G14 (Gemmeiza Line#2) and G15 (Gemmeiza Line#3), L1 (Sakha), L2 (Gemmeiza), L3 (Etay El Baroud), L4 (Nubaria), L5 (Shandaweel) and L6 (Malawy).
Sustainability 18 09010 g004
Figure 5. Multi-Trait Stability Index (MTSI) of fifteen bread wheat genotypes across environments. SK and GM refer to Sakha and Gemmeiza, respectively.
Sustainability 18 09010 g005
Table 1. Code, name, pedigree and selection history of the fifteen bread wheat genotypes.
Code GenotypePedigreeSelection History
G1Sakha 95PASTOR//SITE/MO/3/CHEN/AEGILOPS SQUARROSA (TAUS)//BCN/4/WBLL1.CMA01Y00158S-040POY-040M-030ZTM-040SY-26M-0Y-0SY-0S.
G2Misr 3ATTILA*2/PBW65*2/KACHUCMSS06Y00582T-099TOPM-099Y-099ZTM-099Y-099M-10WGY-0B-0EGY
G3Misr 4NS-732/HER/3/PRL/SARA//TSI/VEE # 5/4/FRET2/5/WHEAR/SOKOLLCMSA09Y00712S-050Y-050ZTM-0NJ-099NJ-4WGY-0B-0EG
G4Giza 171SAKHA 93/GEMMEIZA 9GZ 2003-101-1GZ-4GZ-1GZ-2GZ-0GZ.
G5Sids 15PRUS/PASTOR//FIDTY-20/3/PASTOR//MILAN/KAUZICW11.SD20063-2AP-0TR-1TR-0SD.
G6Sakha Line#1MUU/FRNCLN//FRANCOLIN #1/5/CHIBIA//PRLII/CM65531/3/SKAUZ/BAV92*2/4/QUAIUS.2015-2 -083S -018S-13S -0S
G7Sakha Line#2WBLL1*2/BRAMBLING//BECARD/12/OTUS/TOBA97/11/FLORKWA -2/10/MAYA/YD/6/HK/MDA38/4/4777/3/REI//Y/KT/5/YR/7/KOEL/8/MOR/BOW/9/SERI S.2015-15 -023S -016S-5S -0S
G8Sakha Line#3WBLL1*2/BRAMBLING//BECARD/3/UP2338*2/KKTS*2//YANACS.2015-18 -046S -032S-7S -0S
G9Sakha Line#4QUAIU #1/2*MUTUS/4/BAJ1/3/KIRITATI//ATTILA*2/PASTOR.S.2015-19 -014S -021S-3S -0S
G10Sakha Line#5UP2338*2/KKTS*2//YANA/3/KAUZ/PASTOR//PBW343S.2014-55-026S -022S-4S -0S
G11Sakha Line#6QUAIU #1/2*MUTUS/5/SW89.5193/KAUZ/4/VEE/PJN//2*TUI/3/GALVEZ/WEAVERS.2015-20 -061S -017S-5S -0S
G12Sakha Line#7PAURAQ*2/KBIRD/5/SW89.5193/KAUZ/4/VEE/PJN//2*TUI/3/GALVEZ/WEAVERS.2015-23 -065S -017S-7S -0S
G13Gemmeiza Line#1MP4010/MUNAL#1/5/BAVIS#1*2/4/PASTOR//HXL7573/2*BAU/3/SOKOLL/WBLL1CGM17-104730S-2GM-2GM-1GM-1GM
G14Gemmeiza Line#2GAN/AE.SOUARROSA(408)//2*OASIS/5*BOR95/3/…../4/Misr 3CGM17-104753-4GM-1GM-2GM
G15Gemmeiza Line#3PBW343/HUITES/4/YER/AE.SQUARROSA(783)//AILAN/3/BAV92/4/GEMMEIZA#11/5/SAKHA 95CGM18-104949T-1GM-1GM-1GM
Table 2. The studied locations and their agro-climatic conditions.
EnvironmentLocationGrowing SeasonSoil TypeLatitudeLongitudeRainfall (mm)Temperature (°C)
Min.Max.Ave.
E1Sakha2023/2024Clay31°5′ N30°56′ E66.717.4523.1920.32
E22024/202573.116.5422.3419.44
E3Gemmeiza2023/2024Clay31°07′ N 30°48′ E9.911.5324.6618.09
E42024/202512.412.8326.0919.46
E5Etay El
Baroud
2023/2024Clay30°65′ N30°89′ E5914.8923.7819.33
E62024/20256713.9823.6718.82
E7Nubaria2023/2024Calcareous sandy loam30°38′ N30°4′ E6213.0922.9818.03
E82024/20257312.1821.8717.02
E9Shandaweel2023/2024Clay26°33′ N31°42′ E-11.5226.2118.86
E102024/2025-10.8825.2618.07
E11Malawy2023/2024Loam30°83′ N27°73′ E2.411.1226.2518.68
E122024/20254.910.5125.8918.21
Table 3. Combined analysis of variance of 15 wheat genotypes for studied traits evaluated at each location (combined over 2023/2024 and 2024/2025 growing seasons).
TraitLocationSakhaGemmeizaEtay El BaroudNubariaShandaweelMalawy
S.O.VGMSEMSGMSEMSGMSEMSGMSEMSGMSEMSGMSEMS
d.f.145614561456145614561456
Number of spikes m−26975.4 **459.38194.3 **479.37726.7 **427.47664.1 **474.85287.9 **211.92966.1 **141.6
Number of grains spike−185.2 **3.4231.5 **5.5144.1 **4.235.1 **11.1107.1 **3.682.1 **13.2
1000-grain weight (g)144.9 **2.6259.1 **6.259.4 **2.995.8 **7.429.3 **2.044.9 **4.7
Grain yield plot−1 (kg)3.2 **0.26.3 **0.14.3 **0.11.3 **0.11.1 **0.16.2 **0.2
Crude protein (%)0.2 **0.11.3 **0.21.1 **0.10.6 **0.10.7 **0.11.0 **0.1
Wet gluten (%)2.9 **0.54.2 **0.64.8 **0.62.3 **0.22.0 **0.33.7 **0.4
Gluten index (%)14.1 **1.558.4 **4.915.1 **1.326.4 **2.021.0 **0.815.5 **1.0
Falling number (s)68.1 **10.0572.1 **31.5204.2 **30.0168.5 **15.7198.3 **8.91208.5 **55.0
GMS: genotype mean square, EMS: error mean square. **: significant at p ≤ 0.01.
Table 4. Mean performance of number of spikes m−2 and number of grains spike−1 traits of 15 bread wheat genotypes evaluated at six locations. (Combined over 2023/2024 and 2024/2025 growing seasons).
Code Number of Spikes m−2Number of Grains Spike−1
L1L2L3L4L5L6MeanL1L2L3L4L5L6Mean
G1460.0459.7506.0315.2391.5474.0434.464.273.266.253.267.370.765.8
G2425.5399.2412.8333.3351.7461.0397.360.657.355.455.063.369.560.2
G3451.8445.2510.5388.8389.8467.0442.263.272.663.856.268.770.665.9
G4379.3380.8466.3297.8341.3447.0385.455.259.457.953.758.063.758.0
G5389.3374.8464.3375.8405.3417.0404.455.558.158.855.364.063.159.1
G6434.5433.3484.7374.7436.3468.8438.762.970.362.955.260.769.763.6
G7431.5432.7466.7373.3342.0464.3418.460.765.861.358.869.069.464.2
G8423.0382.2442.5300.0383.5449.3396.855.964.052.951.564.865.159.0
G9397.3339.2387.5317.2343.7433.0369.658.658.151.451.760.864.257.5
G10425.8420.2457.0373.8381.8434.0415.458.064.751.952.266.265.459.7
G11358.3352.7409.3278.7333.3429.0360.252.757.555.356.255.562.356.6
G12363.3352.5425.7355.0397.3402.3382.753.056.755.554.261.560.256.9
G13350.2402.5423.0308.8347.3411.5373.953.759.351.753.570.059.558.0
G14421.8435.7471.8364.8358.0450.7417.160.171.762.560.067.865.664.6
G15424.8413.3475.0314.0358.3455.2406.859.069.161.755.764.068.062.9
Mean409.1401.6453.5338.1370.8444.3402.958.263.957.954.864.165.860.8
LSD(G)0.05 24.825.323.925.216.813.8 2.12.72.43.92.24.2
CV%5.25.54.66.53.92.7 3.23.73.56.13.05.5
G (genotype), CV (coefficient of variation), G1 (Sakha 95), G2 (Misr 3), G3 (Misr 4), G4 (Giza 171), G5 (Sids 15), G6 (Sakha Line#1), G7 (Sakha Line#2), G8 (Sakha Line#3), G9 (Sakha Line#4), G10 (Sakha Line#5), G11 (Sakha Line#6), G12 (Sakha Line#7), G13 (Gemmeiza Line#1), G14 (Gemmeiza Line#2) and G15 (Gemmeiza Line#3), L1 (Sakha), L2 (Gemmeiza), L3 (Etay El Baroud), L4 (Nubaria), L5 (Shandaweel) and L6 (Malawy).
Table 5. Mean performance of 1000-grain weight and grain yield per plot traits of 15 bread wheat genotypes evaluated at six locations. (Combined over 2023/2024 and 2024/2025 growing seasons).
Code 1000-Grain Weight (g)Grain Yield Per Plot (kg)
L1L2L3L4L5L6MeanL1L2L3L4L5L6Mean
G160.467.854.453.950.655.357.14.65.84.73.33.15.14.4
G255.455.248.457.653.152.453.74.04.03.23.42.44.53.6
G359.868.455.360.952.054.458.54.75.74.73.63.34.94.5
G451.756.848.664.350.351.053.83.94.53.12.72.63.93.4
G549.652.647.651.050.147.549.73.34.03.12.92.93.23.2
G659.567.454.554.256.553.957.74.35.04.33.03.44.84.1
G758.462.654.055.050.154.955.84.24.94.13.33.04.64.0
G853.955.549.653.949.051.752.32.74.13.02.62.63.33.0
G948.850.748.453.651.649.150.43.73.02.32.82.02.62.7
G1048.958.148.656.750.450.152.13.74.33.02.92.82.73.2
G1146.553.948.462.648.748.551.42.62.92.42.12.02.52.4
G1248.247.945.750.348.548.648.22.72.62.12.32.42.22.4
G1347.256.747.357.253.047.051.42.63.52.43.13.22.72.9
G1456.366.353.354.649.749.454.94.05.53.83.72.84.44.0
G1554.561.551.758.553.952.455.44.35.13.42.52.74.33.7
Mean53.358.850.456.351.251.153.53.74.33.32.92.73.73.4
LSD(G)0.051.92.92.03.21.62.5 0.50.40.30.40.30.5
CV%3.04.23.45.02.84.3 11.07.27.411.09.310.7
G (genotype), CV (coefficient of variation), G1 (Sakha 95), G2 (Misr 3), G3 (Misr 4), G4 (Giza 171), G5 (Sids 15), G6 (Sakha Line#1), G7 (Sakha Line#2), G8 (Sakha Line#3), G9 (Sakha Line#4), G10 (Sakha Line#5), G11 (Sakha Line#6), G12 (Sakha Line#7), G13 (Gemmeiza Line#1), G14 (Gemmeiza Line#2) and G15 (Gemmeiza Line#3), L1 (Sakha), L2 (Gemmeiza), L3 (Etay El Baroud), L4 (Nubaria), L5 (Shandaweel) and L6 (Malawy).
Table 6. Mean performance of protein% and wet gluten% traits of 15 bread wheat genotypes evaluated at six locations. (Combined over 2023/2024 and 2024/2025 growing seasons).
Code Crude Protein%Wet Gluten%
L1L2L3L4L5L6MeanL1L2L3L4L5L6Mean
G111.112.212.812.312.213.012.328.929.729.130.029.131.129.6
G211.211.012.211.511.512.511.728.328.227.128.728.629.928.5
G311.312.212.812.312.212.912.328.629.828.929.829.331.429.6
G410.911.512.011.611.512.411.627.027.527.029.128.529.328.0
G510.910.912.011.912.011.711.627.427.927.029.228.929.128.2
G611.211.812.612.112.112.712.128.329.328.429.529.230.629.2
G711.011.712.612.011.812.611.927.828.727.729.328.830.028.7
G811.011.412.311.411.612.411.727.027.427.428.927.629.728.0
G911.011.211.711.411.512.311.527.428.426.428.228.029.227.9
G1011.011.212.411.611.512.411.726.828.226.828.927.529.127.9
G1110.711.311.711.311.412.211.427.528.226.928.528.229.328.1
G1210.710.911.711.711.311.911.326.827.626.428.427.928.927.7
G1311.011.611.611.611.211.711.426.728.426.328.428.029.027.8
G1411.012.212.612.012.012.812.127.929.928.230.028.730.429.2
G1511.112.012.511.811.812.712.027.729.028.029.828.629.828.8
Mean11.011.512.211.811.712.411.827.628.527.429.128.529.828.5
LSD(G)0.050.30.60.30.40.30.4 0.80.90.90.50.60.8
CV %2.14.12.42.82.22.6 2.62.82.81.31.92.2
G (genotype), CV (coefficient of variation), G1 (Sakha 95), G2 (Misr 3), G3 (Misr 4), G4 (Giza 171), G5 (Sids 15), G6 (Sakha Line#1), G7 (Sakha Line#2), G8 (Sakha Line#3), G9 (Sakha Line#4), G10 (Sakha Line#5), G11 (Sakha Line#6), G12 (Sakha Line#7), G13 (Gemmeiza Line#1), G14 (Gemmeiza Line#2) and G15 (Gemmeiza Line#3), L1 (Sakha), L2 (Gemmeiza), L3 (Etay El Baroud), L4 (Nubaria), L5 (Shandaweel) and L6 (Malawy).
Table 7. Mean performance of gluten index and falling number traits of 15 bread wheat genotypes evaluated at six locations. (Combined over 2023/2024 and 2024/2025 growing seasons).
Code Gluten Index%Falling Number (s)
L1L2L3L4L5L6MeanL1L2L3L4L5L6Mean
G184.590.877.087.388.392.386.7287.5299.8289.5290.2289.8306.8293.9
G283.882.774.084.886.291.383.8284.2281.8285.3279.8279.3304.5285.8
G384.390.877.088.788.891.886.9287.5298.0288.5291.2290.3309.0294.1
G481.783.373.884.084.089.582.7282.8277.2281.3280.0279.3287.7281.4
G582.082.874.582.387.089.082.9280.0283.5277.5283.5282.7283.7281.8
G683.788.576.787.388.291.085.9286.7292.5287.5286.8290.2306.5291.7
G783.288.075.786.887.390.585.3284.7291.5286.2284.8285.2297.0288.2
G879.886.273.085.585.089.283.1278.7268.5273.0281.0279.0281.5276.9
G982.083.772.782.583.787.382.0281.5288.7282.5271.3273.2272.5278.3
G1081.285.872.785.885.888.283.3279.3281.5278.8280.7280.3266.7277.9
G1181.581.773.882.283.088.581.8278.3267.8276.5278.8273.7283.7276.5
G1280.783.073.083.585.288.082.2277.8279.3274.3281.3278.8270.8277.1
G1379.785.372.783.283.787.382.0282.2280.5272.5279.5276.8272.2277.3
G1483.290.075.386.887.590.585.6284.8293.7285.5287.7288.7290.8288.5
G1582.787.275.086.386.390.384.6285.3292.3286.2289.2281.8288.5287.2
Mean82.386.074.585.186.089.783.9282.8285.1281.7283.1281.9288.1283.8
LSD(G)0.051.42.61.31.61.11.2 3.66.56.34.63.58.6
CV%1.52.61.51.71.11.1 1.12.02.01.41.12.6
G (genotype), CV (coefficient of variation), G1 (Sakha 95), G2 (Misr 3), G3 (Misr 4), G4 (Giza 171), G5 (Sids 15), G6 (Sakha Line#1), G7 (Sakha Line#2), G8 (Sakha Line#3), G9 (Sakha Line#4), G10 (Sakha Line#5), G11 (Sakha Line#6), G12 (Sakha Line#7), G13 (Gemmeiza Line#1), G14 (Gemmeiza Line#2) and G15 (Gemmeiza Line#3), L1 (Sakha), L2 (Gemmeiza), L3 (Etay El Baroud), L4 (Nubaria), L5 (Shandaweel) and L6 (Malawy).
Table 8. Additive Main effect and Multiplicative Interaction (AMMI) analysis of variance for grain yield per plot.
SourceD.F.S.S.M.S.Explained%GEI%
Total539599.701.11
Treatments179559.703.13 **93.33 **
Genotypes14233.0016.64 **38.85 **
Environments11188.8017.17 **31.48 **
Block244.400.19 *0.73 *
Interactions154137.900.90 **22.99 **
IPCA 1 2480.503.35 ** 58.38 **
IPCA 2 2217.600.80 ** 12.76 **
Residuals 10839.900.37 ** 28.93 **
Error33635.600.115.94
* and ** significant at the 5% and 1% level of significance. D.F. = degree of freedom; S.S. = sum of squares; M.S. = mean squares; GEI = genotype × environment interaction; IPCA1 and IPCA2 = interaction principal component axis one and two, respectively.
Table 9. IPCAg1, IPCAg2 scores, AMMI stability value and genotype selection index of grain yield per plot for 15 bread wheat genotypes combined over environments.
CodeGenotypesMean GYPGYP RankIPCAg1IPCAg2ASVRASVGSI
G1Sakha 954.42−0.870.073.981416
G2Misr 33.67−0.120.550.7718
G3Misr 44.51−0.58−0.182.681011
G4Giza 1713.48−0.17−0.170.78210
G5Sids 153.290.410.551.94413
G6Sakha Line#14.13−0.640.122.931215
G7Sakha Line#24.04−0.550.062.52913
G8Sakha Line#33.0110.340.151.55314
G9Sakha Line#42.7130.50−0.702.38821
G10Sakha Line#53.2100.43−1.002.20616
G11Sakha Line#62.4140.510.302.36721
G12Sakha Line#72.4150.750.083.431328
G13Gemmeiza Line#12.9121.090.285.001527
G14Gemmeiza Line#24.05−0.450.062.07510
G15Gemmeiza Line#33.76−0.64−0.182.921117
GYP = grain yield per plot; GYP Rank = rank of grain yield per plot; IPCA1, 2 = interaction principal component axis 1 and 2; ASVi = AMMI stability value; RASVi = rank of AMMI stability value; GSIi = genotype selection index.
Table 10. Additive Main Effect and Multiplicative Interaction (AMMI) analysis of variance for falling number.
SourceD.F.S.S.M.S.Explained%GEI%
Total53950,445.0093.60
Treatments17940,326.00225.30 **79.94 **
Genotypes1421,323.001523.10 **42.27 **
Environments113661.00332.80 **7.26 **
Block241663.0069.30 **3.30 **
Interactions15415,342.0099.60 **30.41 **
IPCA 1 248299.00345.80 54.09 **
IPCA 2 223412.00155.10 22.24 **
Residuals 1083632.0033.60 * 23.67
Error3368456.0025.20
* and ** significant at the 5% and 1% level of significance. D.F. = degree of freedom; S.S. = sum of squares; M.S. = mean squares; GEI = genotype × environment interaction; IPCA1 and IPCA2 = interaction principal component axis one and two, respectively.
Table 11. IPCAg1, IPCAg2 scores, AMMI stability value and genotype selection index of 15 bread wheat genotypes for falling number.
Code GenotypesMean FN FN RankIPCAg1IPCAg2ASVRASVGSI
G1Sakha 95293.92−2.03−1.565.19911
G2Misr 3285.87−3.260.417.951522
G3Misr 4294.11−2.28−0.855.611213
G4Giza 171281.49−0.271.301.46211
G5Sids 15281.880.830.632.12412
G6Sakha Line#1291.73−2.27−0.385.531114
G7Sakha Line#2288.25−1.03−0.822.63510
G8Sakha Line#3276.9140.152.882.90620
G9Sakha Line#4278.3101.83−3.005.361020
G10Sakha Line#5277.9113.22−0.417.841425
G11Sakha Line#6276.515−0.432.712.91722
G12Sakha Line#7277.1132.620.766.431326
G13Gemmeiza Line#1277.3122.120.335.16820
G14Gemmeiza Line#2288.540.27−1.101.2815
G15Gemmeiza Line#3287.260.53−0.911.5939
FN = falling number; FN Rank = rank of falling number; IPCA1, 2 = interaction principal component axis 1 and 2; ASVi = AMMI stability value; RASVi = rank of AMMI stability value; GSIi = genotype selection index.
Disclaimer/Publisher’s Note: The statements, opinions and data contained in all publications are solely those of the individual author(s) and contributor(s) and not of MDPI and/or the editor(s). MDPI and/or the editor(s) disclaim responsibility for any injury to people or property resulting from any ideas, methods, instructions or products referred to in the content.