Effect of Evolution of Electricity Emission Factor on Evaluation of Effectiveness of Decarbonization Measures in European Countries



Abstract
1. Introduction
Scope and Novelty of This Study
2. Materials and Methods
2.1. Description of CCHP+HTHP System
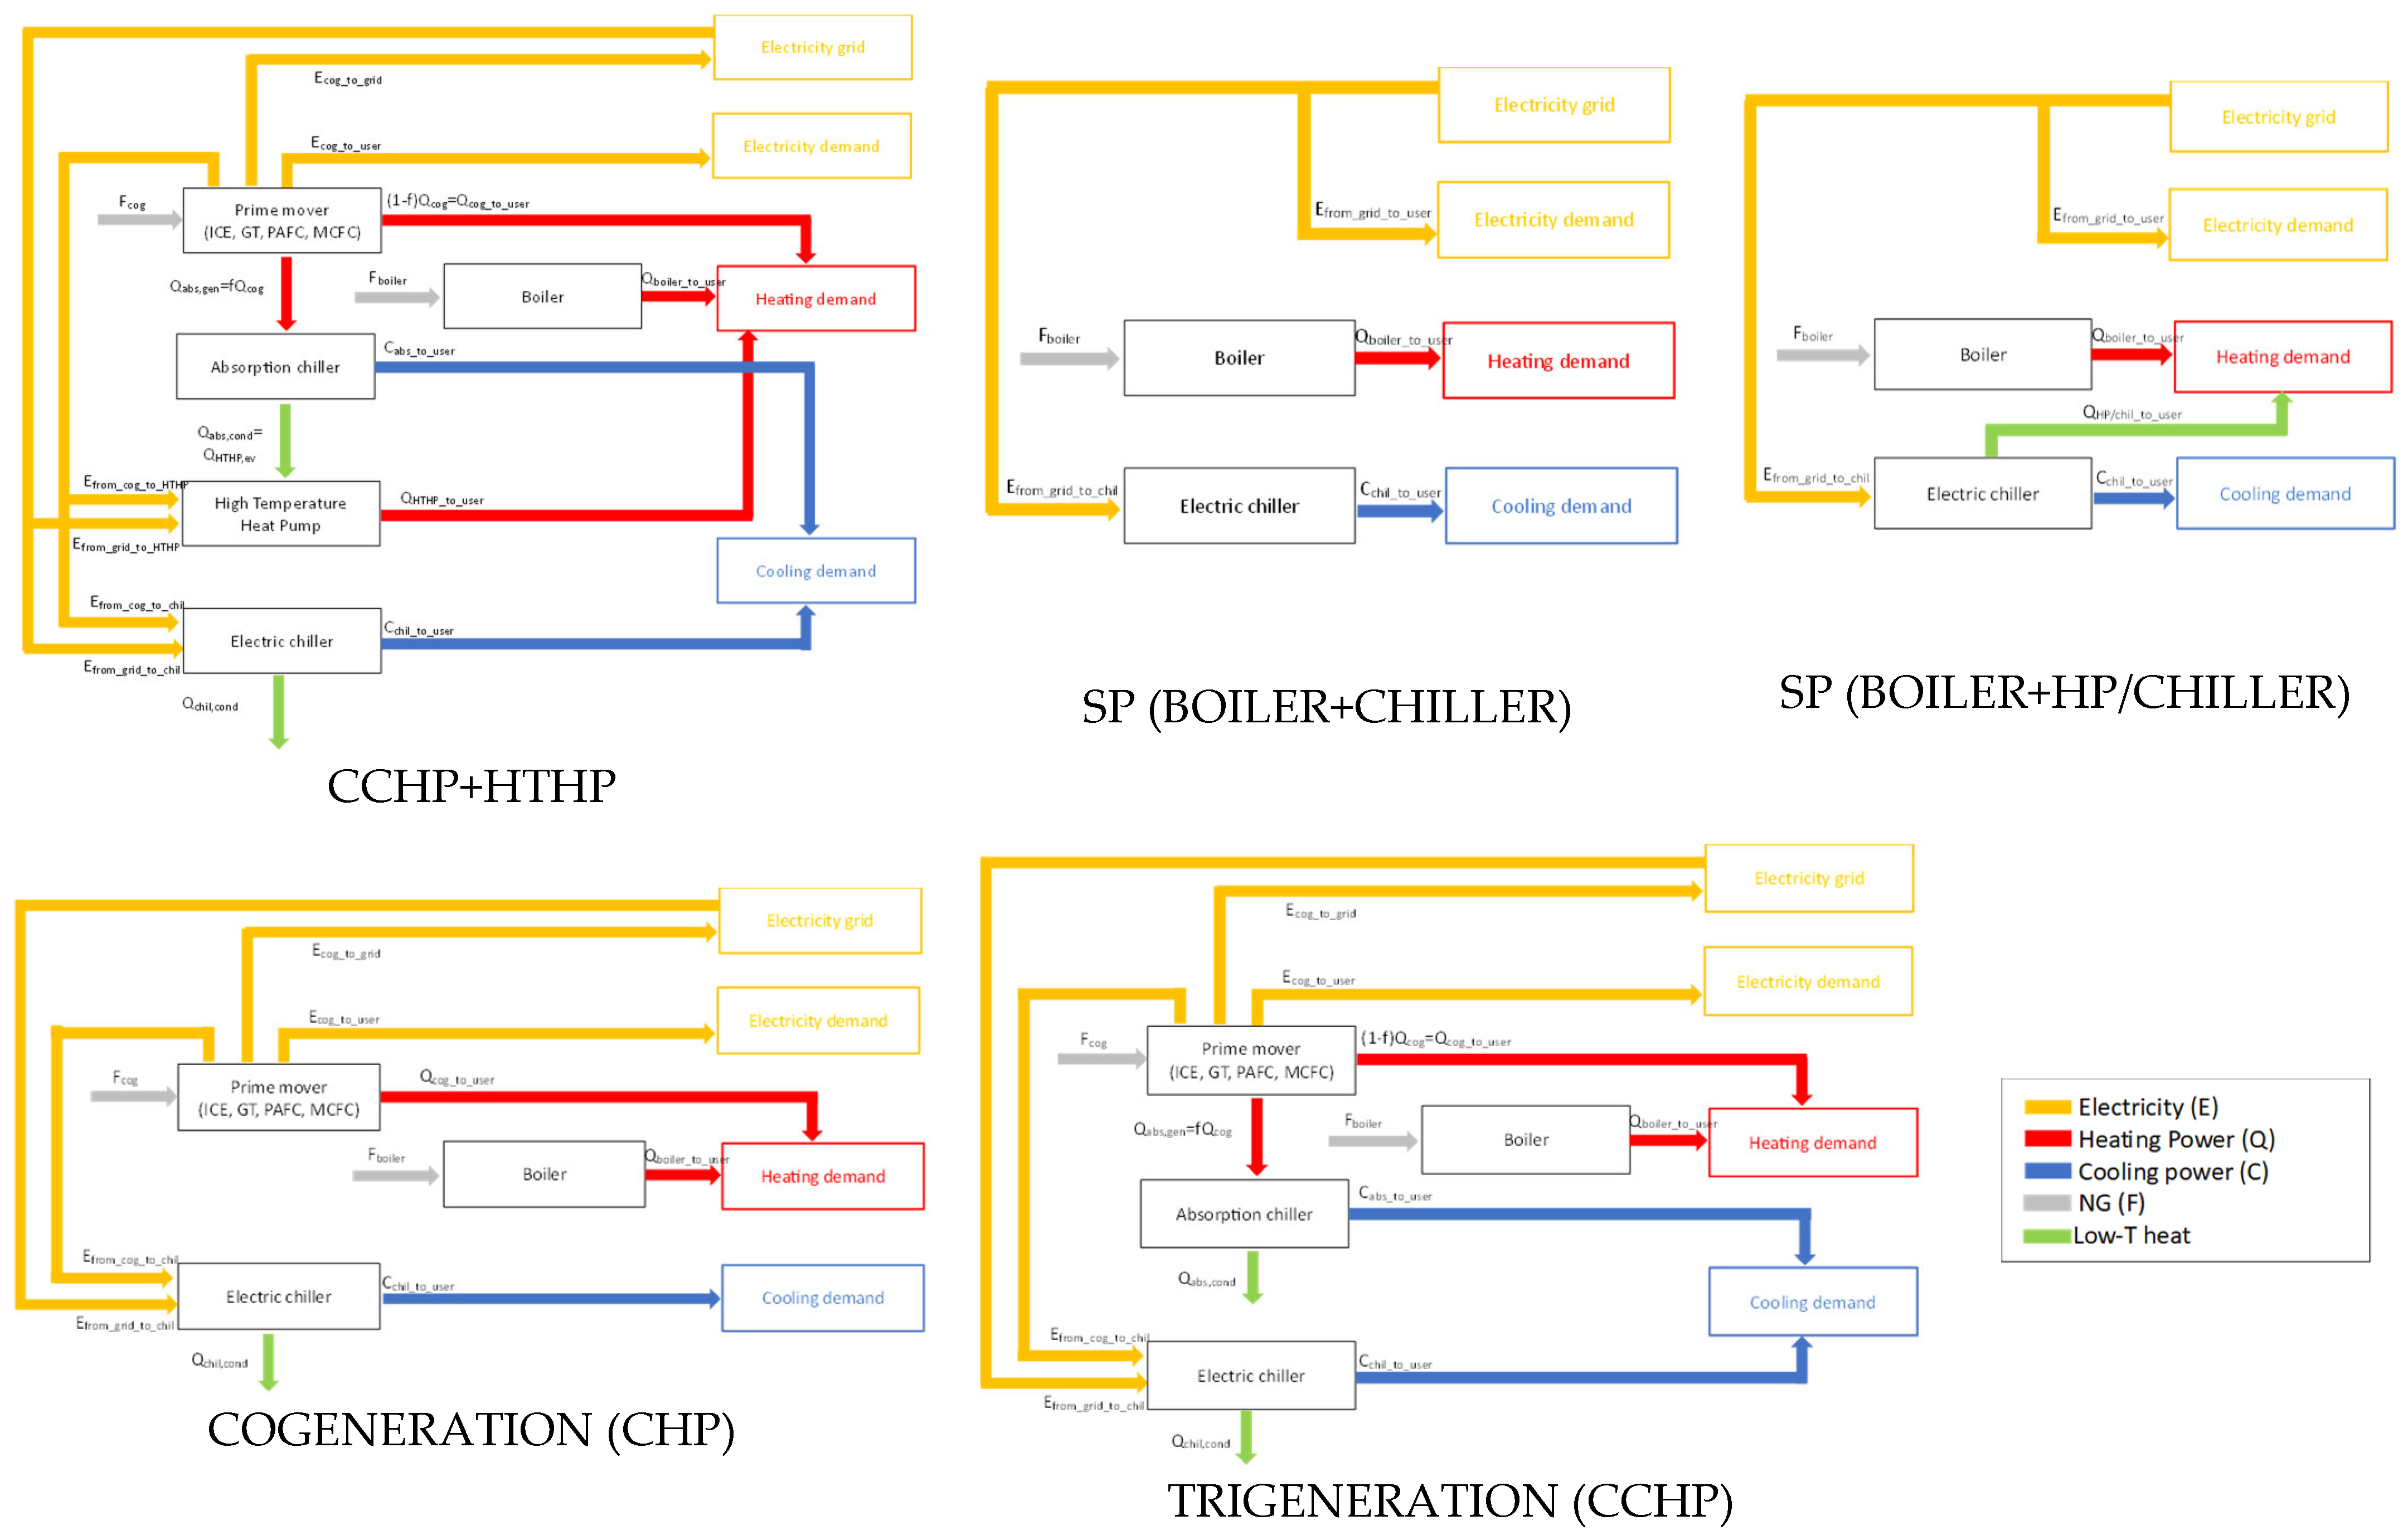
- The prime mover, which may consist of a fuel cell generator (phosphoric acid fuel cell (PAFC) or molten carbonate fuel cell (MCFC)), a gas turbine (GT) or an internal combustion engine (ICE). This component converts the primary chemical energy of natural gas (Fcog) into electricity (Ecog), a fraction of which is directed toward satisfying the electrical demand of the end user (Euser). Through an appropriate heat recovery system, the prime mover also yields useful thermal energy (Qcog).
- A variable fraction (f) of the latter is allocated to drive the absorption chiller (Qabs,gen), while the remaining portion (1 − f)Qcog is supplied directly to the user for heating purposes. A minor fraction of the input energy is dissipated as non-recoverable thermal losses (Qwasted).
- The absorption chiller (abs) is driven by a variable share of Qcog, modulated by parameter f, and delivers cooling power at the evaporator (Qabs,ev).
- The high-temperature heat pump (HTHP) takes advantage of the low-grade thermal energy recovered from the absorption chiller (Qabs,cond) as the heat source in its evaporator, delivering hot water at 90 °C in its condenser (QHTHP,cond). The output of the HTHP contributes to meeting the user’s heating demand (Quser).
2.2. Description of Benchmark Systems
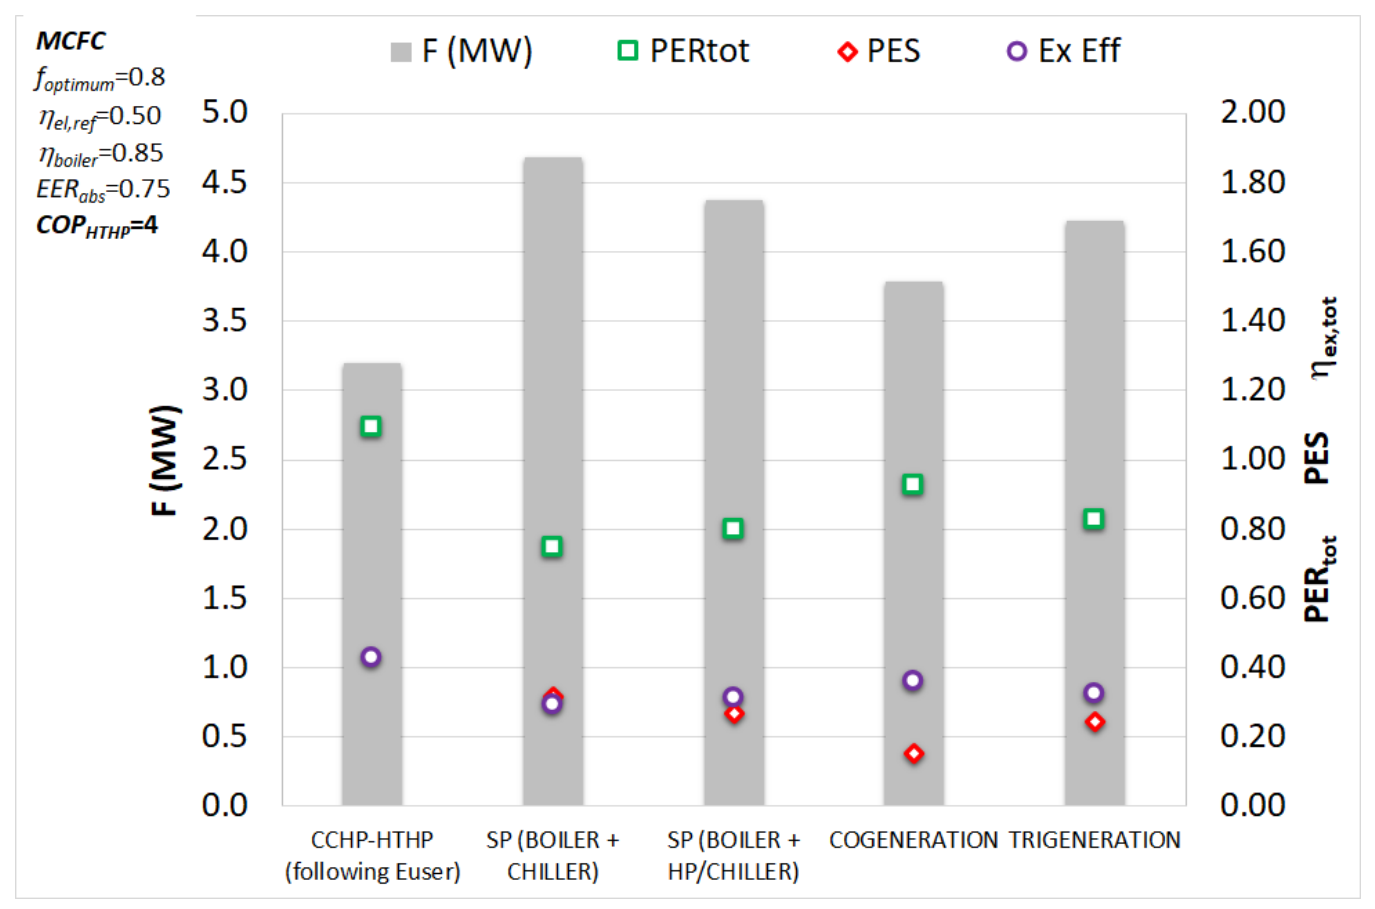
- Separate production with boiler and electric (water–water) chiller (SP Boiler+Chiller) with ηboiler = 0.85 and EERchil = 3, assumed constant;
- The same configuration as above with the addition of condenser heat recovery from the electric chiller to preheat the hot water supply;
- Cogeneration system (CHP) with the same prime mover as in the proposed CCHP+HTHP system, coupled with an electric water–water chiller (EERchil = 3, assumed constant) and an auxiliary boiler (ηboiler = 0.85);
- Conventional trigeneration system (CCHP): identical to the CCHP+HTHP configuration but without the integration of the high-temperature heat pump.
2.3. Assessment of Greenhouse Gas Emissions
- e0 is the emission factor in the first year of operation;
- r is the initial linear growth rate, assumed herein to be r = 0;
- m is the decay parameter.
3. Results and Discussion
3.1. Energy Analysis Under Fixed Operating Conditions
3.2. Annual Energy Performance
3.3. Annual and Specific CO2 Emissions
3.4. Annual and Cumulative CO2 Emissions
4. Conclusions
Author Contributions
Funding
Institutional Review Board Statement
Informed Consent Statement
Data Availability Statement
Conflicts of Interest
Abbreviations and Symbols
| abs | absorption chiller |
| C | cooling power (MW), cooling energy (MWh) |
| CHP | combined heat and power (cogeneration) |
| CCHP | combined cooling, heating and power (trigeneration) |
| COP | coefficient of performance |
| E | electric power (MW), electric energy (MWh) |
| EER | energy efficiency ratio |
| F | input fuel (power, MW or energy, MWh) |
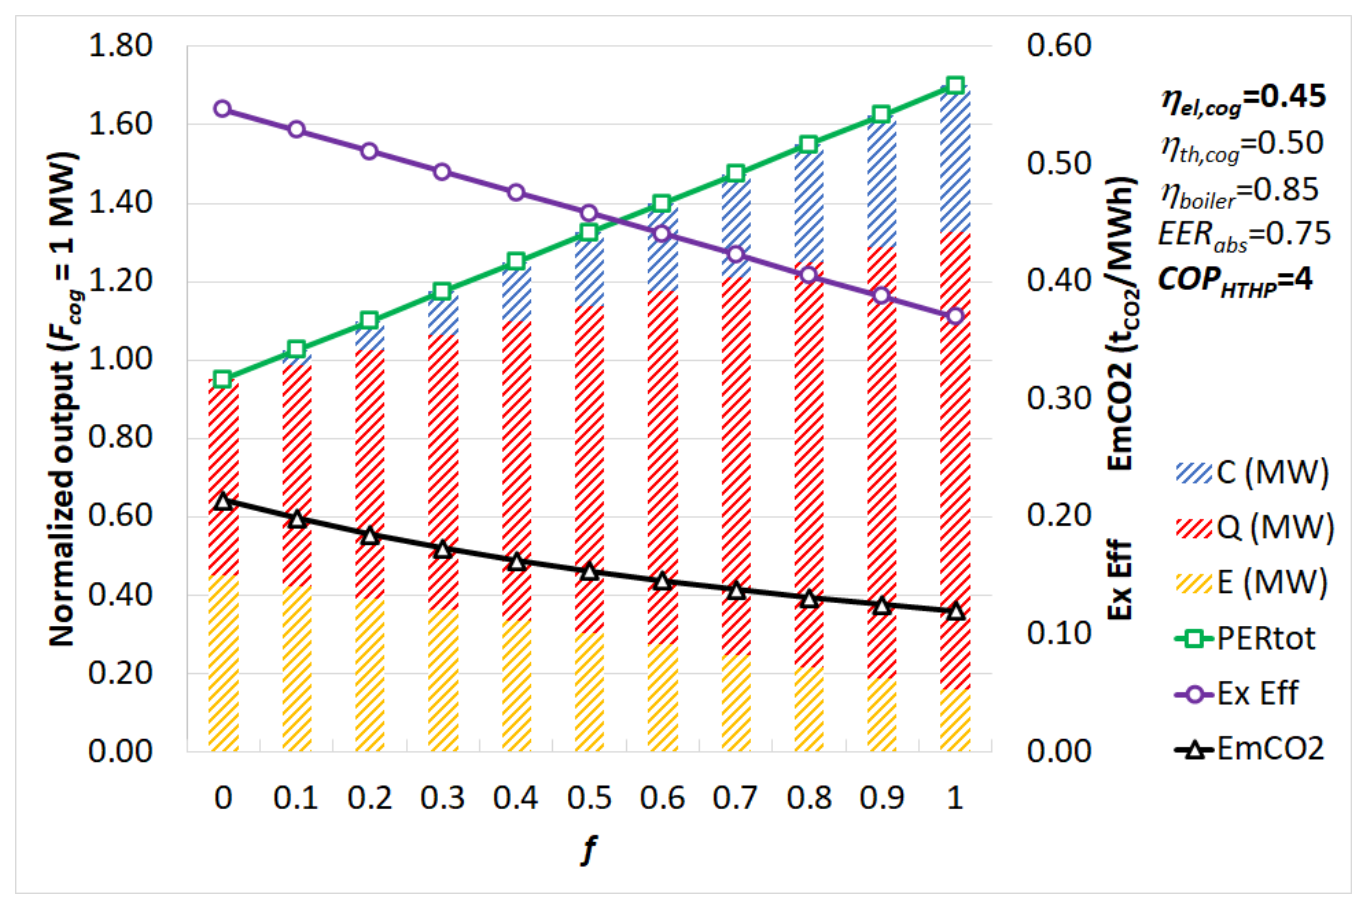
| f | fraction of cogeneration heat to feed absorption chiller |
| GT | gas turbine |
| HP | heat pump |
| HTHP | high-temperature heat pump |
| MCFC | molten carbonate fuel cell |
| PAFC | phosphoric acid fuel cell |
| PER | primary energy ratio |
| PES | primary energy saving |
| Q | thermal power (MW), thermal energy (MWh) |
| SP | separate production |
| T | temperature (K) |
| Greek symbols | |
| η | efficiency |
| Subscripts | |
| 0 | initial year |
| abs | absorption chiller |
| boiler | boiler |
| C | cooling temperature |
| chil | electric chiller |
| el | electric |
| ex | exergy |
| grid | electric grid |
| HTHP | high-temperature heat pump |
| Q | heating temperature |
| ref | reference |
| th | thermal |
| user | user |
References
- Dallali, A.; Jebli, M.B. Economic activities and CO2 emissions: Evaluating the impacts of renewable energy, industrial growth, and financial development in CO2-intensive economies. Int. J. Renew. Energy Dev. 2025, 14, 1235–1249. [Google Scholar] [CrossRef] [Scilit]
- Salari, M.; Javid, R.J.; Noghanibehambari, H. The nexus between CO2 emissions, energy consumption, and economic growth in the U.S. Econ. Anal. Policy 2021, 69, 182–194. [Google Scholar] [CrossRef] [Scilit]
- Puntoon, W.; Tarkhamtham, P.; Tansuchat, R. The impacts of economic growth, industrial production, and energy consumption on CO2 emissions: A case study of leading CO2 emitting countries. Energy Rep. 2022, 16, 414–419. [Google Scholar] [CrossRef] [Scilit]
- Wang, X.; Bilal, R.; Ur Rehman, J. Economic development and carbon emissions across world regions: Exploring heterogeneous drivers. J. Environ. Manag. 2025, 396, 128048. [Google Scholar] [CrossRef] [Scilit] [PubMed]
- European Commission. Directive (EU) 2018/2002 of the European Parliament and of the Council of 11 December 2018 Amending Directive 2012/27/EU on Energy Efficiency; European Commission: Brussels, Belgium, 2018; Available online: https://eur-lex.europa.eu/legal-content/EN/TXT/?uri=CELEX%3A32018L2002 (accessed on 15 March 2026).
- European Commission. Directive (EU) 2023/1791 of the European Parliament and of the Council of 13 September 2023 on Energy Efficiency and Amending REGULATION (EU) 2023/955 (Recast); European Commission: Brussels, Belgium, 2023; Available online: https://eur-lex.europa.eu/eli/dir/2023/1791/oj/eng (accessed on 15 March 2026).
- European Commission. Commission Recommendation (EU) 2021/1749 of 28 September 2021 on Energy Efficiency First: From Principles to Practice—Guidelines and Examples for Its Implementation in Decision-Making in the Energy Sector and Beyond; European Commission: Brussels, Belgium, 2021; Available online: https://eur-lex.europa.eu/eli/reco/2021/1749/oj/eng (accessed on 15 March 2026).
- Solangi, Y.A.; Magazzino, C. Evaluating financial implications of renewable energy for climate action and sustainable development goals. Renew. Sustain. Energy Rev. 2025, 212, 115390. [Google Scholar] [CrossRef] [Scilit]
- He, Y. Energy policy strategies for cleaner production: The roles of renewable energy and green innovation. Energy Policy 2026, 213, 115214. [Google Scholar] [CrossRef] [Scilit]
- Li, Y.; Liu, X.; Han, Y.; Xue, X. Emissions Reductions and Economic Feasibility of China’s Solar Thermal Power Industry After the Introduction of Chinese Certified Emission Reduction Policy. Energy Sci. Eng. 2026, 14, 1700–1712. [Google Scholar] [CrossRef] [Scilit]
- Noro, M. High temperature heat pump with combined cooling, heat and power plant in industrial buildings: An energy analysis. Int. J. Heat Technol. 2023, 41, 489–497. [Google Scholar] [CrossRef] [Scilit]
- Urbanucci, L.; Bruno, J.C.; Testi, D. Thermodynamic and economic analysis of the integration of high temperature heat pumps in trigeneration systems. Appl. Energy 2019, 238, 516–533. [Google Scholar] [CrossRef] [Scilit]
- Friedlingstein, P.; O’Sullivan, M.; Jones, M.W.; Andrew, R.M.; Bakker, D.C.; Hauck, J.; Landschützer, P.; Le Quéré, C.; Li, H.; Luijkx, I.T.; et al. Global Carbon Budget 2025. Earth Syst. Sci. Data 2026, 18, 3211–3288. [Google Scholar] [CrossRef] [Scilit]
- Ma, R.; Chai, X.; Geng, R.; Xu, L.; Xie, R.; Zhou, Y.; Wang, Y.; Li, Q.; Jiao, K.; Gao, F. Recent progress and challenges of multi-stack fuel cell systems: Fault detection and reconfiguration, energy management strategies, and applications. Energy Convers. Manag. 2023, 285, 117015. [Google Scholar] [CrossRef] [Scilit]
- Yoo, J.; Estrada-Perez, C.E.; Choi, B.-H. Investigation of heat pump technologies for high-temperature applications above 250 °C. Appl. Energy 2025, 384, 125384. [Google Scholar] [CrossRef] [Scilit]
- Famiglietti, J.; Acconito, L.; Arpagaus, C.; Toppi, T. Environmental life cycle assessment of industrial high-temperature to residential small-size heat Pumps: A critical review. Energy Convers. Manag. X 2025, 26, 100947. [Google Scholar] [CrossRef] [Scilit]
- Bertolini, M.; Duttilo, P.; Lisi, F. Accounting carbon emissions from electricity generation: A review and comparison of emission factor-based methods. Appl. Energy 2025, 392, 125992. [Google Scholar] [CrossRef] [Scilit]
- Elio, J.; Milcarek, R.J. Multi-objective electricity cost and indirect CO2 emissions minimization in commercial and industrial buildings utilizing stand-alone battery energy storage systems. J. Clean. Prod. 2023, 417, 137987. [Google Scholar] [CrossRef] [Scilit]
- Sun, X.; Ding, Y.; Bao, M.; Ouyang, X.; Song, Y.; Zheng, C.; Gao, X. Strategic bidding model for multi-energy industrial parks considering spatio-temporal carbon emission factors in carbon and electricity markets. Renew. Sustain. Energy Rev. 2025, 219, 115764. [Google Scholar] [CrossRef] [Scilit]
- Geis, J.; Brown, T.; Hartel, P. Price Formation in a Sector-Coupled Climate-Neutral Energy System. In Proceedings of the International Conference on the European Energy Market EEM, Lisbon, Portugal, 27–29 May 2025. [Google Scholar] [CrossRef] [Scilit]
- Myopic Transition Path. Available online: https://pypsa-eur-sec.readthedocs.io/en/latest/myopic.html (accessed on 15 March 2026).
- Victoria, M.; Zhu, K.; Brown, T.; Andresen, G.B.; Greiner, M. Early decarbonisation of the European energy system pays off. Nat. Commun. 2020, 11, 6223. [Google Scholar] [CrossRef] [Scilit] [PubMed]
- Victoria, M.; Zeyen, E.; Brown, T. Speed of technological transformations required in Europe to achieve different climate goals. Joule 2022, 6, 1066–1086. [Google Scholar] [CrossRef] [Scilit]
- Lifecycle Carbon Intensity of Electricity. 2025. Available online: https://ourworldindata.org/grapher/electricity-mix?source=total&metric=carbon_intensity&frequency=annual (accessed on 16 August 2026).


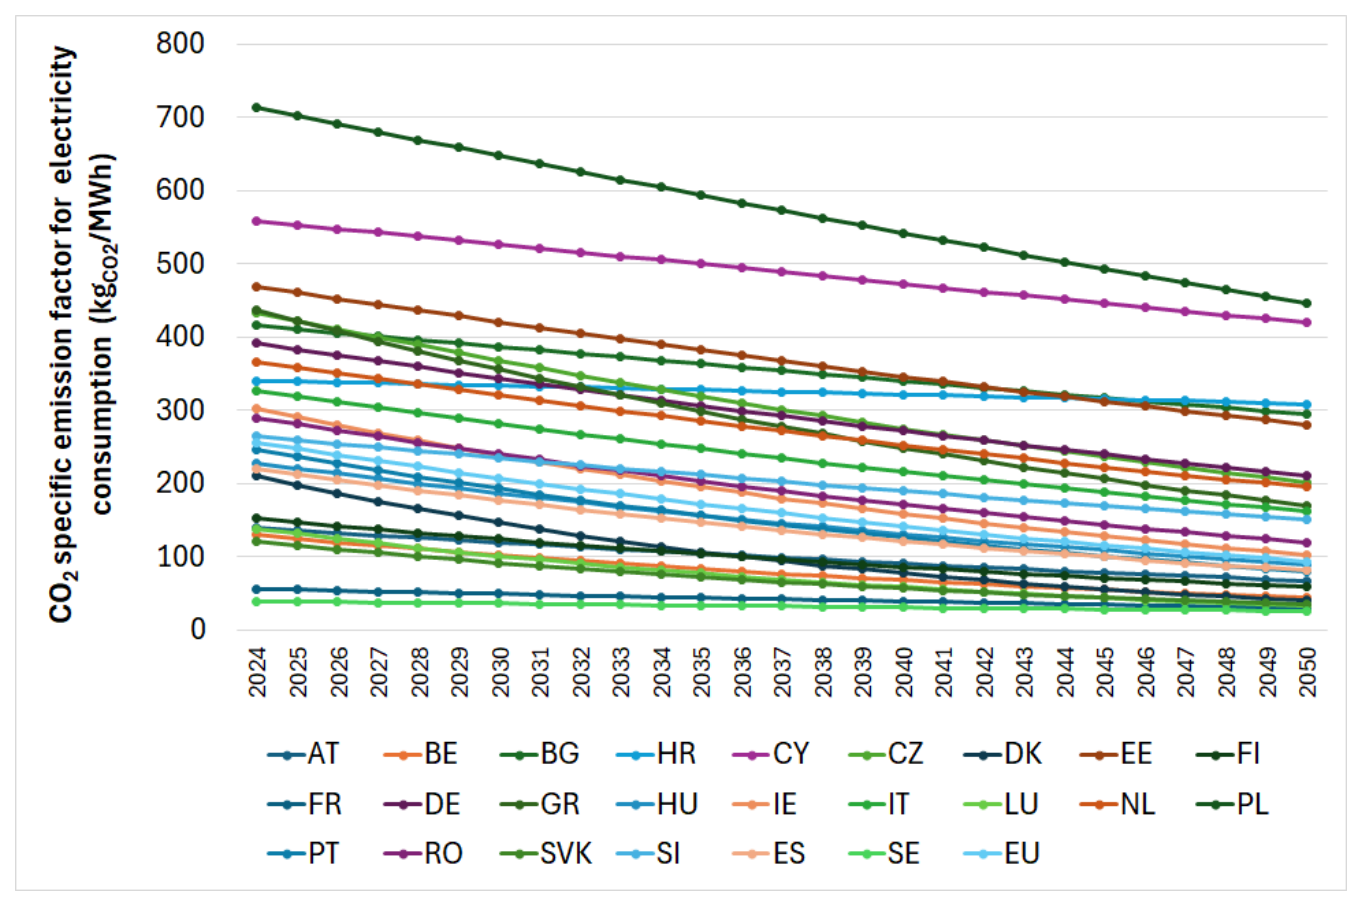


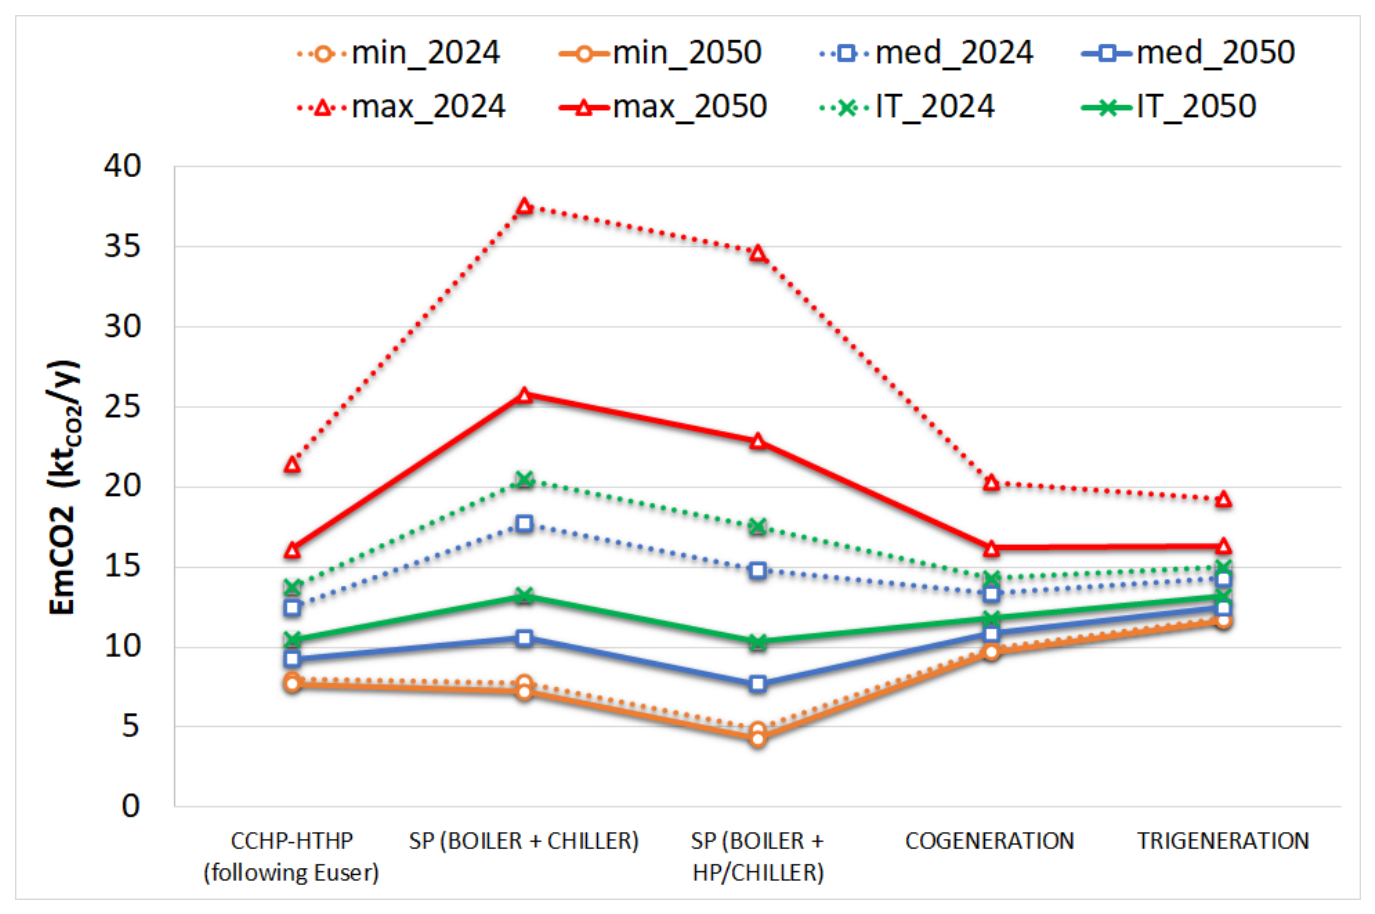


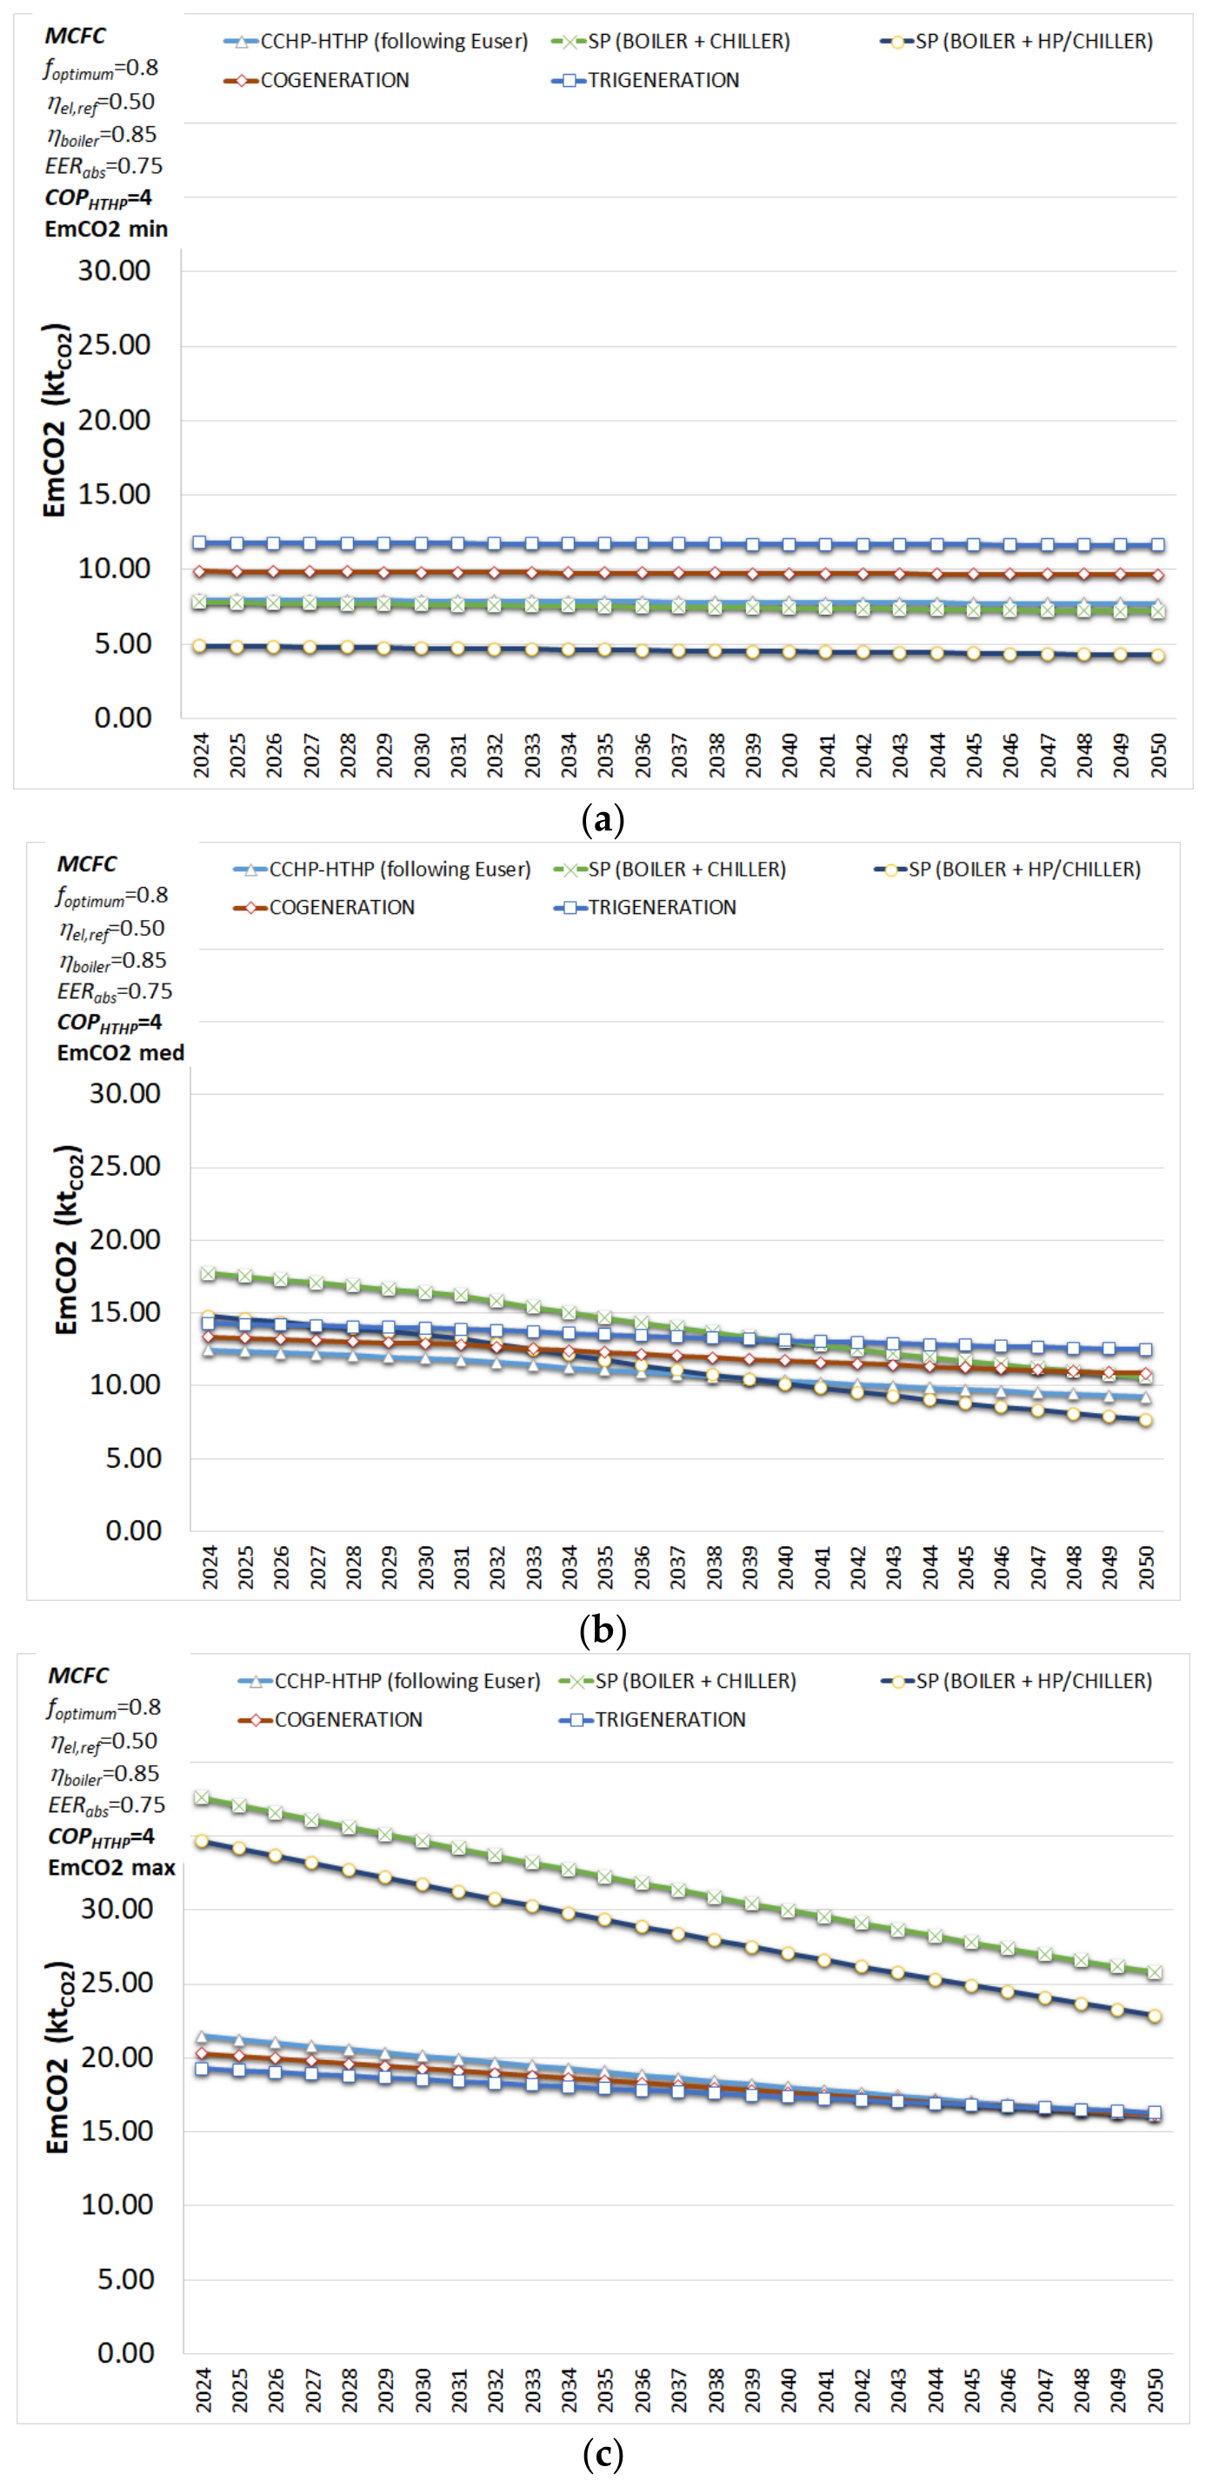
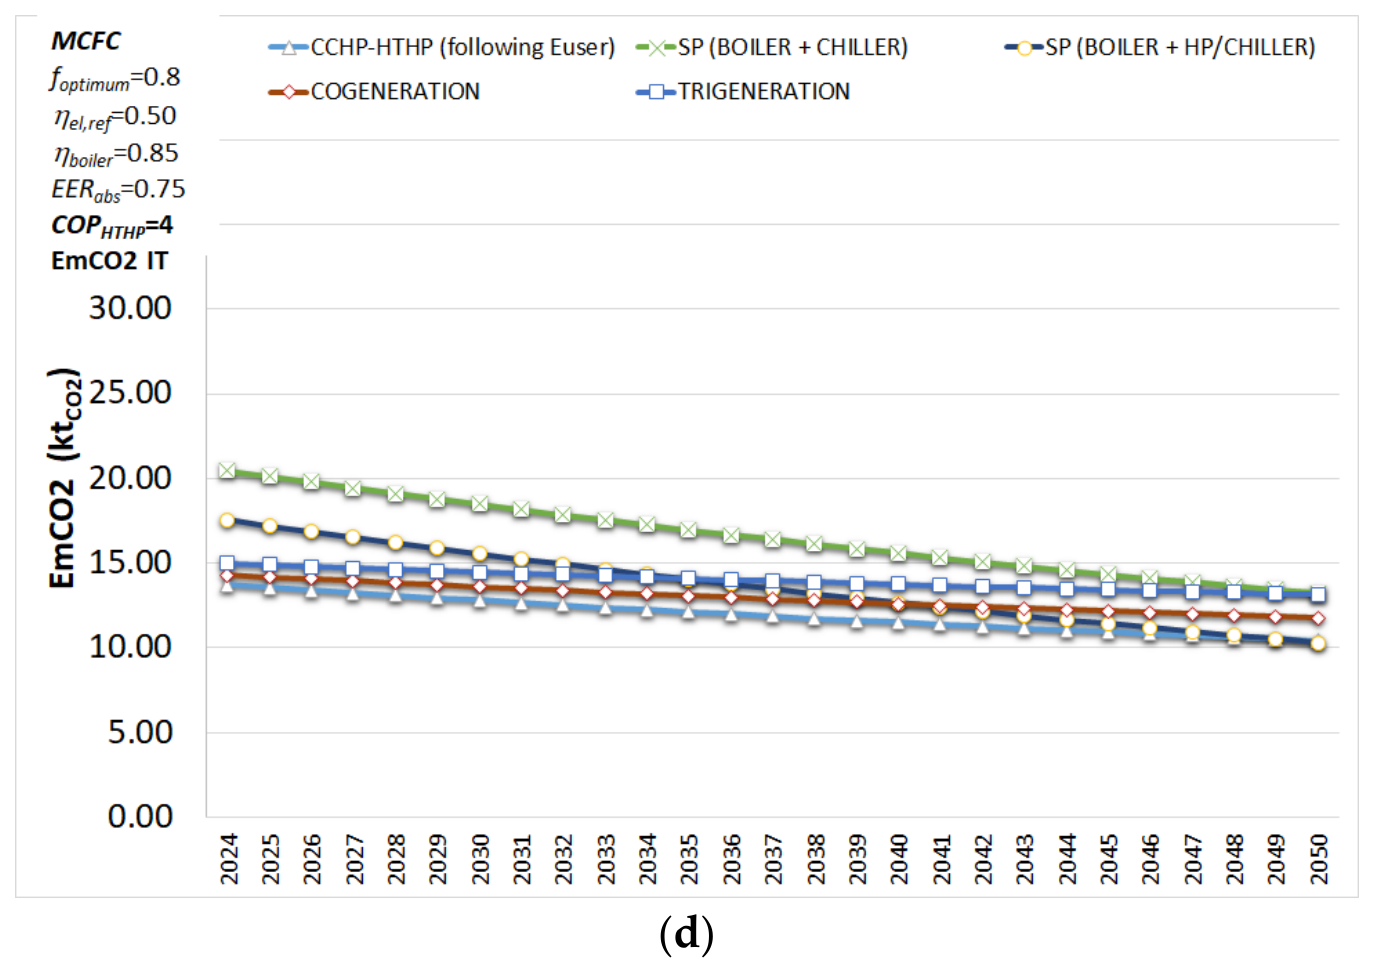


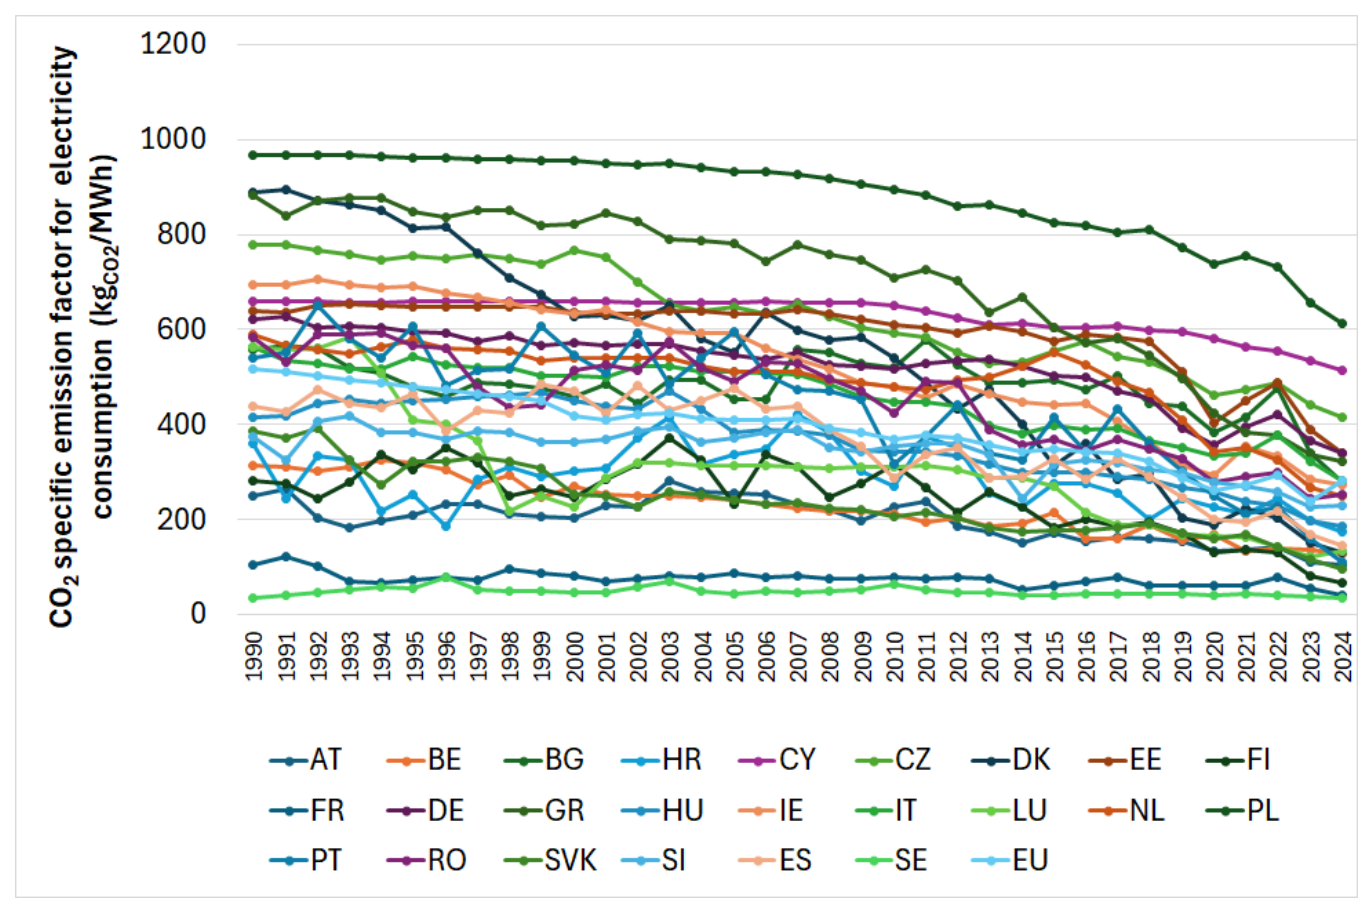
| Country | ΔCO2 Emission Factor 1990–2024 | Country | ΔCO2 Emission Factor 1990–2024 |
|---|---|---|---|
| AT, Austria | 58.70% | IE, Ireland | 60.70% |
| BE, Belgium | 59.40% | IT, Italy | 50.10% |
| BG, Bulgaria | 50.10% | LU, Luxembourg | 76.40% |
| HR, Croatia | 52.20% | NL, The Netherlands | 57.40% |
| CY, Cyprus | 22.10% | PL, Poland | 36.70% |
| CZ, Czechia | 46.70% | PT, Portugal | 79.50% |
| DK, Denmark | 85.20% | RO, Romania | 57.00% |
| EE, Estonia | 46.80% | SVK, Slovakia | 75.10% |
| FI, Finland | 76.30% | SI, Slovenia | 38.60% |
| FR, France | 60.80% | ES-Spain | 66.60% |
| DE, Germany | 45.60% | SE, Sweden | −4.80% |
| GR, Greece | 63.60% | EU, European Union | 45.50% |
| HU, Hungary | 55.50% |
| Country | R2 Value | Country | R2 Value |
|---|---|---|---|
| AT, Austria | 52.3% | IE, Ireland | 95.5% |
| BE, Belgium | 96.4% | IT, Italy | 89.2% |
| BG, Bulgaria | 30.8% | LU, Luxembourg | 72.0% |
| HR, Croatia | 0.9% | NL, The Netherlands | 66.1% |
| CY, Cyprus | 82.5% | PL, Poland | 87.4% |
| CZ, Czechia | 96.7% | PT, Portugal | 73.2% |
| DK, Denmark | 90.5% | RO, Romania | 77.8% |
| EE, Estonia | 66.6% | SVK, Slovakia | 92.9% |
| FI, Finland | 53.7% | SI, Slovenia | 69.5% |
| FR, France | 44.1% | ES, Spain | 73.8% |
| DE, Germany | 85.3% | SE, Sweden | 21.9% |
| GR, Greece | 82.8% | EU, European Union | 92.1% |
| HU, Hungary | 86.9% |
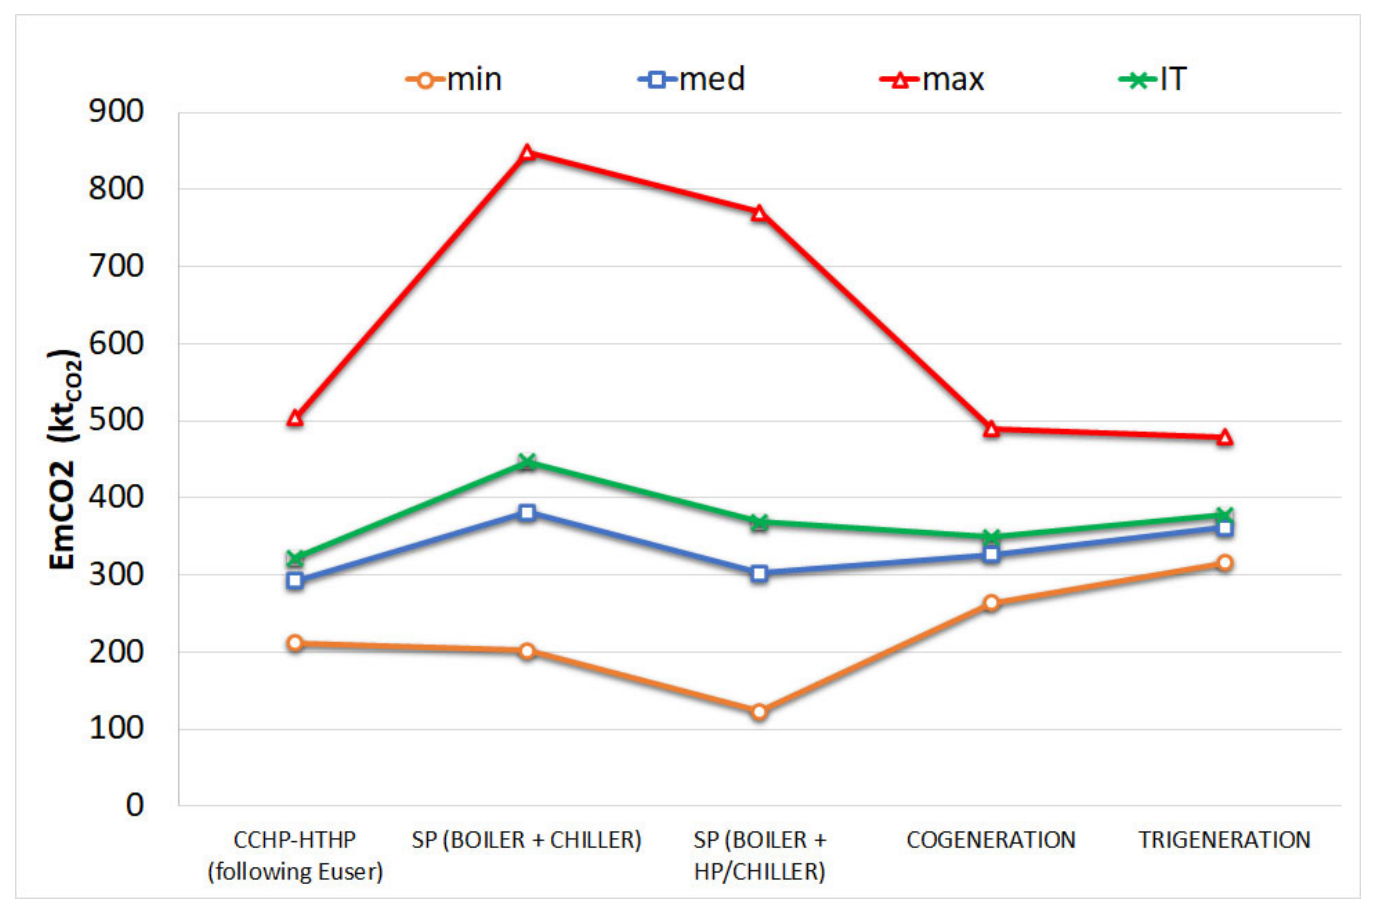
| Cumulative 2024–2050 (ktCO2) | Cumulative 2024–2050 with Fixed 2024 CO2 Emission Factor (ktCO2) | Delta% | ||||||||||
|---|---|---|---|---|---|---|---|---|---|---|---|---|
| Min | Med | Max | IT | Min | Med | Max | IT | Min | Med | Max | IT | |
| CCHP-HTHP (following Euser) | 211.7 | 292.8 | 504.7 | 322.6 | 215.4 | 336.8 | 579.4 | 370.4 | 1.7% | 13.1% | 12.9% | 12.9% |
| SP (BOILER+CHILLER) | 202.3 | 381.4 | 849.2 | 447.3 | 210.6 | 478.5 | 1014.1 | 552.6 | 3.9% | 20.3% | 16.3% | 19.1% |
| SP (BOILER+HP/CHILLER) | 123.6 | 302.7 | 770.5 | 368.6 | 131.9 | 399.8 | 935.4 | 473.9 | 6.3% | 24.3% | 17.6% | 22.2% |
| COGENERATION | 263.8 | 326.5 | 490.4 | 349.6 | 266.7 | 360.5 | 548.2 | 386.5 | 1.1% | 9.4% | 10.5% | 9.5% |
| TRIGENERATION | 316.4 | 361.4 | 478.9 | 378.0 | 318.5 | 385.8 | 520.4 | 404.4 | 0.7% | 6.3% | 8.0% | 6.5% |
Disclaimer/Publisher’s Note: The statements, opinions and data contained in all publications are solely those of the individual author(s) and contributor(s) and not of MDPI and/or the editor(s). MDPI and/or the editor(s) disclaim responsibility for any injury to people or property resulting from any ideas, methods, instructions or products referred to in the content. |
© 2026 by the authors. Licensee MDPI, Basel, Switzerland. This article is an open access article distributed under the terms and conditions of the Creative Commons Attribution (CC BY) license.
Share and Cite
Busato, F.; Noro, M. Effect of Evolution of Electricity Emission Factor on Evaluation of Effectiveness of Decarbonization Measures in European Countries. Sustainability 2026, 18, 8861. https://doi.org/10.3390/su18178861
Busato F, Noro M. Effect of Evolution of Electricity Emission Factor on Evaluation of Effectiveness of Decarbonization Measures in European Countries. Sustainability. 2026; 18(17):8861. https://doi.org/10.3390/su18178861
Chicago/Turabian StyleBusato, Filippo, and Marco Noro. 2026. "Effect of Evolution of Electricity Emission Factor on Evaluation of Effectiveness of Decarbonization Measures in European Countries" Sustainability 18, no. 17: 8861. https://doi.org/10.3390/su18178861
APA StyleBusato, F., & Noro, M. (2026). Effect of Evolution of Electricity Emission Factor on Evaluation of Effectiveness of Decarbonization Measures in European Countries. Sustainability, 18(17), 8861. https://doi.org/10.3390/su18178861