1. Introduction
Environmental, social, and governance (ESG) performance has become one of the most important indicators in recent years for evaluating firms’ understanding of sustainability, long-term resilience, and non-financial performance. Increased investor pressure, sustainability-focused regulations, stakeholder expectations, and demands for corporate transparency have significantly increased companies’ interest in ESG practices. Nowadays, ESG practices are not only considered voluntary social responsibility activities but also regarded as strategic factors that affect company value, corporate reputation, risk management, and investment attractiveness.
Numerous studies in the literature examine the relationship between ESG performance and firm performance. It was argued that companies that place particular emphasis on sustainability practices may show higher performance in the long run [
1]. Similarly, it was asserted that there are mostly positive associations between ESG performance and financial performance [
2]. Furthermore, studies examining the impact of ESG disclosure levels on firm value showed that ESG performance is crucial to investor perceptions [
3].
Much of the current ESG literature, however, treats ESG performance as a static variable. The studies mostly use panel data models, fixed-effects models, or classical regression methods to analyze firms’ ESG levels over specific periods. Nevertheless, this approach cannot sufficiently explain the temporal dynamics of firms’ ESG transformation processes. In other words, existing studies generally examine whether firms have high ESG performance but do not consider how long it takes for firms to reach that level.
However, ESG transformation is a dynamic process that occurs over time. Firms may differ significantly in terms of how quickly they adopt sustainability practices. While some firms achieve high ESG performance more quickly due to their financial strength, organizational structure, or stakeholder pressure, this process may take longer for others. Therefore, examining ESG performance while accounting for the time dimension can offer a different perspective to the literature.
Another important limitation of the current studies is the lack of analysis of firms that did not achieve high ESG performance during the observation period. Traditional regression models are insufficient in adequately addressing such missing observations. However, some firms may not have met the ESG threshold set during the study period, but they may have the potential to meet it in the future. This situation reveals the structure of censored data.
In this study, the Stratified Cox Proportional Hazards Model was utilized to overcome these limitations. The Cox model is widely used in survival analysis for its suitability to censored data and its ability to analyze event duration. In this study, the event was defined as the first time the firm reached the specified high ESG performance threshold.
This study differs from the existing ESG literature in several respects. Firstly, ESG performance is treated not as a static outcome variable, but as a transition process that occurs over time. Secondly, the study examines not only overall ESG performance but also environmental, social, and governance dimensions through separate models. This approach is significant because previous studies highlighted that the dimensions of ESG can have different dynamics [
4,
5]. Furthermore, it was noted that the effects of ESG dimensions on firm performance may vary [
6].
Another contribution of the study is the consideration of structural distinctions among sectors. ESG transition processes can vary significantly, depending on the sector. For example, environmental pressures may be higher in the energy sector, while governance practices may evolve more rapidly in the financial sector. Therefore, a stratified Cox model was used in this study to control for sector differences, allowing a separate baseline hazard function for each sector [
7].
In this context, the study offers three main contributions. Firstly, it introduces the time dimension to the ESG literature by examining how long it takes firms to achieve high ESG performance. Secondly, it applies survival analysis and a censored data approach to the field of ESG. Thirdly, it offers a more comprehensive assessment of ESG transition dynamics by examining the environmental, social, and governance dimensions of ESG separately.
2. Literature
In recent years, there has been a significant increase in studies examining the relationship between ESG performance and firm characteristics. In particular, the impact of sustainability practices on investor behavior, firm value, and corporate performance has become a key research area in the ESG literature. It was frequently emphasized that ESG practices can support firms’ long-term accounting and market performance and strengthen their risk management [
1].
Firm characteristics are key variables that describe the financial, structural, and managerial aspects of businesses and are commonly used to explain ESG performance. In the sustainability and ESG literature, variables such as firm size, firm age, profitability, financial leverage, growth opportunities, firm value, and corporate governance structure are recognized as significant determinants of environmental, social, and governance performance [
8,
9]. These variables determine businesses’ resource capacity, their levels of exposure to stakeholder pressure, and their ability to implement sustainability activities. The studies aimed at explaining the effect of firm characteristics on ESG performance make significant contributions to understanding the internal factors that shape sustainability implementations in businesses. Within this context, the variables in question and their relationships with ESG performance are discussed separately below.
In the literature, firm size is cited as one of the most significant variables affecting ESG performance. It was argued that large-scale firms can adapt to ESG practices more quickly because they are more visible, under more intense regulatory pressure, and have more financial resources [
3,
10,
11]. When evaluated within the framework of stakeholder theory, it was emphasized that large-scale firms tend to increase stakeholder satisfaction and protect their corporate reputations because they have to respond to the expectations of numerous stakeholder groups [
12]. Another important theoretical approach explaining the relationship between firm size and ESG performance is legitimacy theory, which posits that large-scale businesses are more closely scrutinized by the public since their environmental and social activities and impacts are more visible. Therefore, to maintain their social legitimacy, companies invest more in sustainability activities and improve their ESG performance [
13].
Most studies in the literature examining the relationship between ESG performance and firm characteristics reveal that firm size also has a positive effect on ESG scores. Specifically, it was emphasized that large-scale firms are more advanced in terms of sustainability reporting systems, corporate governance structures, and stakeholder communication mechanisms [
5]; it was stated that they have more comprehensive ESG disclosures because they have a higher capacity to implement international sustainability standards [
14]. In recent years, studies using data from ESG rating agencies have also indicated that firm size is a strong variable influencing ESG performance. It was determined that companies with a high asset structure implement ESG activities more systematically and achieve greater sustainability performance [
15], while large-scale firms are observed to implement ESG practices more effectively [
2]. However, the literature reveals that, particularly in developing economies, factors such as regulatory frameworks, industry characteristics, quality of corporate governance, and the level of capital market development can positively or negatively influence the impact of firm size on ESG performance [
16].
The relationship between profitability indicators and ESG performance has also been frequently studied in the literature. Profitability is considered one of the most important criteria determining a company’s capacity to allocate resources to ESG activities. Therefore, accounting-based financial performance indicators such as return on assets (ROA), return on equity (ROE), and net profit margin (NPM), which reflect firm profitability, are considered important determinants of ESG performance. When the findings in the literature are assessed, it is seen that high profitability levels enable firms to allocate more resources to ESG activities, and in turn, strong ESG performance supports financial performance in the long term [
17,
18]. Accordingly, it was argued that the relationship between firms’ profitability and ESG performance is bidirectional and mutually reinforcing [
19]. Recent studies, in particular, have shown a positive correlation between firms’ return on assets, return on equity, and ESG scores [
2,
3].
Among the firm characteristics that affect ESG performance, financial leverage is a key financial indicator. It is a key metric that reflects the extent of external financing and the capital structure firms use to finance their assets. In the literature, the relationship between financial leverage and firms’ ESG performance is generally explained through the lens of stakeholder, legitimacy, resource dependency, and agency theories.
One of these approaches, stakeholder theory, suggests that firms with high debt levels are more closely monitored by credit institutions, investors, and regulatory bodies. This situation can prompt firms to improve their sustainability activities and increase their ESG disclosures. With the increasing availability of sustainable financing tools today, the inclusion of ESG risk assessments by credit institutions in their evaluation processes can create a positive relationship between financial leverage and ESG performance [
2,
11].
According to resource dependence theory, high financial leverage can reduce firms’ financial flexibility, limiting the resources available for environmental and social investments. Especially companies operating under high debt burdens might allocate fewer resources to ESG activities by prioritizing the fulfillment of their short-term financial obligations. It was therefore noted that high leverage ratios can negatively impact ESG performance [
3,
17].
A review of the literature shows varying conclusions regarding the direction of the relationship between financial leverage and ESG performance. In developing countries, in particular, high levels of indebtedness can limit ESG investments, whereas in developed markets, the influence of sustainable financing practices can lead to a positive relationship [
20].
Another variable used to determine ESG performance is company age. The age of a firm is directly associated with its level of institutionalization, learning capacity, and the development level of its stakeholder relationships. According to institutional theory, as companies age, they generally develop stronger organizational structures and more sophisticated reporting systems. It particularly improves the transparency, accountability, and sustainability dimensions of ESG performance [
1,
10]. On the other hand, according to the organizational inertia approach, as a firm ages, it becomes more dependent on its existing routines; therefore, it may adapt to changing environmental and social expectations less quickly. In this context, older companies tend to respond more slowly to new regulations and stakeholder pressures, especially regarding sustainability [
21].
In contrast, it is stated that younger firms, being more dynamic, adopt sustainability practices more quickly due to their motivation to increase market visibility and attract investors, and try to gain a competitive advantage by integrating ESG strategies into their corporate identity at an early stage. Older firms with institutionalized structures and extensive resource bases can have an advantage in financing ESG investments; however, age can be a limiting factor in adapting to change [
22]. When the association between ESG performance and firm age was examined in the literature, it was found to be nonlinear, with results that may be positive, negative, or statistically insignificant. Therefore, it is emphasized that this relationship should be evaluated not only based on the age variable but also from a holistic perspective that incorporates institutionalization, organizational inertia, and a resource-based approach.
In addition to traditional firm characteristics such as firm size and profitability, growth performance is also a key variable explaining businesses’ ESG performance. Growth performance refers to a company’s ability to increase its operational volume, market share, and economic capacity over time. It is typically measured by indicators such as sales growth, asset growth, increases in employee numbers, and market value growth. The literature shows that the relationship between growth performance and ESG performance can be explained within the framework of both resource-based approaches and stakeholder theory.
According to the Resource-Based View, companies’ ability to gain a competitive advantage depends on the strategic resources and capabilities they possess [
23]. It was stated that, in general, growing firms with higher cash flows, strong investment capacity, and advanced corporate structures can implement ESG practices faster because they can allocate more resources to sustainability activities [
24,
25]. In stakeholder theory, it is argued that companies have responsibilities not only to their shareholders but also to various stakeholder groups [
26]. In this context, growing firms are increasingly exposed to stakeholder pressure due to their growing visibility, and they need to protect their corporate legitimacy. Thus, rapidly growing companies utilize sustainability practices as a strategic tool to both increase potential investors’ trust and strengthen their own corporate reputation [
13,
27]. Therefore, for companies, ESG practices are not only a social responsibility instrument today but also an important strategic determinant of sustainable growth.
The literature shows a generally positive and mutual relationship between growth performance and ESG performance; it is stated that especially companies growing in terms of sales volume, asset size, and market value can improve their ESG activities because they have more resources. It is stated that, as a result, companies with strong ESG performance can support long-term growth by increasing investor trust and competitive advantage. Some studies on this subject suggest that while growth performance increases ESG performance, a reverse relationship is also possible. Sustainability practices are said to enhance businesses’ brand value, corporate reputation, and customer loyalty; support growth performance in the long term [
28]; encourage innovation, improve operational efficiency, and enable firms to access new markets [
29].
The relationship between ESG performance and firm value is also frequently examined in the literature. Firm value is the total economic value of a business as perceived by the market and typically measured using market-based performance indicators such as market capitalization, Tobin’s Q, and enterprise value. Companies with high ESG performance can manage environmental and social risks more effectively, increase investor trust, and reduce capital costs, thereby contributing to higher firm value over the long run. Studies conducted in recent years have shown that ESG performance has a more observable impact, particularly on market-based performance indicators. ESG activities can positively impact investors’ future growth expectations, leading to increases in indicators such as Tobin’s Q and market capitalization. Furthermore, it was argued that ESG performance reduces firm risk, thereby lowering the cost of capital and consequently increasing firm value [
30,
31].
Corporate governance structure is another component that affects companies’ ESG performance. Corporate governance encompasses elements such as board structure, independent board members, ownership structure, audit mechanisms, shareholder rights, and directors’ accountability. It is stated that companies with strong corporate governance structures have increased quality and transparency in their ESG reporting. The presence of sustainability committees on company boards of directors, the regular monitoring of ESG performance indicators, and the linking of senior management to sustainability goals broaden the scope of ESG disclosures [
32,
33]. In addition, it was stated that companies with sustainability committees have higher ESG scores and sustainability reporting levels [
34].
Although ESG performance is often treated as a single integrated indicator in most studies, it is increasingly acknowledged that the environmental, social, and governance dimensions have distinct dynamics. Thus, evaluating ESG solely on the total score could lead to overlooking some important differences.
Velte stated that the dimensions of ESG do not exhibit a homogeneous structure and that the impact of each dimension on firm performance may differ [
5]. Similarly, Buallay noted that ESG dimensions can produce different effects, especially across sectors [
4]. Furthermore, Broadstock et al. showed that ESG dimensions may exhibit distinct behavioral patterns during times of crisis [
6]. Following their systematic review of the ESG literature, Jámbor and Zanócz expressed that the ESG dimensions address different stakeholder groups and are measured using different performance indicators [
35]. Berg, Koelbel, and Rigobon found that a primary reason for differences in scores across ESG rating agencies is the variation in weights assigned to the ESG dimensions [
36]. Che, Song, and Li established that specifically the environmental dimension increases firm value and operational efficiency, and that sustainable production strategies improve companies’ financial structures in the long run [
37]. Jin, while identifying the environmental dimension as the strongest explanatory variable, concluded in their study of emerging markets that the governance dimension has a more dominant effect on financial performance [
38].
In this context, there is a strong consensus in the literature that the dimensions of ESG have different characteristics. These dimensions address different stakeholder groups, are measured using different performance indicators, and affect firm performance through different mechanisms. Recent studies on this topic show that the total ESG score alone is insufficient and that examining the ESG dimensions individually yields more meaningful results. Research, particularly in financial performance, firm value, risk management, and corporate sustainability, highlights the importance of dimension-based analysis. Therefore, in the study, in addition to Overall ESG performance, the Environmental, Social, and Governance dimensions were analyzed through separate models.
The selection of the explanatory variables is grounded in well-established theoretical perspectives and prior ESG literature. Firm size (Revenue) was included because larger firms generally possess greater organizational resources, are subject to stronger stakeholder pressure, and face greater legitimacy concerns, enabling them to adopt sustainability practices more rapidly [
3,
10,
11,
12,
13,
14,
15,
16]. Profitability (Profit Margin) reflects firms’ internal financial capacity to allocate resources to ESG-related investments; however, the literature also suggests that short-term profitability objectives may constrain sustainability expenditures, leading to mixed effects on ESG performance [
2,
3,
17,
18,
19,
20]. Market capitalization (logMarketCap) was selected as a proxy for firm value because firms with higher market valuations generally have better access to financial resources and lower capital costs, which may facilitate investments in ESG transformation [
30,
31]. Finally, Growth Rate was included because expanding firms typically possess stronger investment capacity and greater incentives to adopt ESG practices in response to increasing stakeholder expectations and competitive pressures, although rapid growth may also divert resources toward operational expansion [
23,
24,
25,
26,
27,
28,
29]. Accordingly, these variables were selected not merely as conventional control variables but as theoretically justified determinants that may influence the time required for firms to achieve high ESG performance.
Despite extensive evidence on the relationship between firm characteristics and ESG performance, comparatively limited attention has been given to the time required for firms to attain high ESG performance. This study addresses this gap by modeling ESG attainment as a time-to-event outcome while accounting for right-censoring and heterogeneity across ESG dimensions and sectors.
3. Methodology
3.1. Survival Analysis
Survival analysis is the examination of data on the time until a specific or interesting event occurs. In this analysis, the response variable is the time until the event occurs, and is often referred to as failure time, survival time, or event duration. Although commonly used in healthcare, it is also used in research in social sciences, economics, business administration, finance, engineering, and other areas. In many cases, the subject of interest for researchers, or the dependent variable, may be variables such as deaths, births, marriages, divorces, promotions, earthquakes, traffic accidents, workplace accidents, retirements, arrests, the onset of a disease, relapse, equipment malfunctions, company bankruptcies, revolutions, or employee dismissals. Researchers may want to examine the distributions of the times these events occur. Statistical methods used to examine the relationships between an event of interest and the likelihood of its occurrence are generally known as survival analyses.
Survival analysis has two main objectives: to estimate and interpret survival time or hazard/risk functions using data on survival time, and to assess the impact of independent variables on survival time [
39].
Survival analysis is a set of statistical methods focused on examining the time until a specific event occurs. Survival analysis offers significant advantages, especially when the timing of the event is critical, and some observations do not experience the event during the study period.
One of the most important features of survival analysis is its ability to handle censored data structures. Censored data refers to situations in which an event does not occur during the observation period, but it may still occur in the future [
40]. When the research unit is unable to observe the event of interest within the observation period, the data are described as right-censored. Right-censored data occur when the research unit either experiences the event of interest after the observation period ends or drops out. For example, a company going bankrupt or closing down can be a reason to drop out of the observation period. If the research unit obtains the defined event before the observation process begins, then it is called left-censored data. If the research unit experiences the event of interest during a specific time interval rather than at a precise moment in the observation period, the data are interval-censored. If the research unit experiences the event of interest at a specific point in the observation period, the data are considered normal/standard [
40].
In survival analysis, let (T) denote a non-negative random variable representing the time until the occurrence of an event of interest. Depending on the research context, the event may refer to death, failure, recovery, bankruptcy, promotion, or any other well-defined outcome. The primary objective of survival analysis is to model the probability distribution of (T) and to examine the factors influencing the timing of the event.
The three basic functions utilized in survival analysis [
41] are the probability density function denoted below:
the survival function signified below:
and the hazard function formulated below:
, is the risk that a unit that has survived up to time
t will fail or die by time
; in other words, it is a measure of the unit’s tendency to fail with respect to the characteristic of interest. These three functions are interrelated. For example, the hazard function for a random variable can be expressed as the ratio of its density function to its survival function [
39].
Survival analysis generally relies on three approaches. These are: Survival Tables, which analyze the distribution of time until a specific event occurs; the non-parametric Kaplan–Meier method, used to determine the time from any specified time to the occurrence of the event of interest; and the semi-parametric Cox regression method, used to model the time elapsed until the occurrence of an event of interest, based on independent variables. The Kaplan–Meier method and the Cox Proportional Hazards Regression Model utilized in this study are briefly explained.
3.2. Kaplan–Meier Method
Since the true distribution of survival times is rarely known, the Kaplan–Meier method can be used to estimate survival probabilities without assuming a specific probability distribution [
42]. The Kaplan–Meier method is a non-parametric method used to estimate the probability of a specific event occurring over time and to evaluate the statistical significance between survival curves for different factors [
43]. Censored data are also taken into account when calculating survival times, and survival probabilities are assumed to be homogeneous across units [
44]. To explain this concept, it is assumed that, firstly, units removed from surveillance at any time have the same probability of survival as units that continue to be pursued; secondly, units included in the study at the beginning and end have the same probability of survival; thirdly, the event occurred at the specified time. Estimated survival time can be calculated more accurately by monitoring units over shorter time intervals. The Kaplan–Meier estimator is also referred to as the “Kaplan–Meier Product-Limit Estimator”.
For data sets with strict censoring and event times, the Kaplan–Meier (K-M) Product-Limit Method is useful for obtaining an initial indication of the shape of the event time curve before fitting more complex models. The Kaplan–Meier method involves computing the probabilities of an event occurring at specific points in time. To obtain the final estimate, these successive probabilities must be multiplied by the previously calculated probabilities.
The Kaplan–Meier survival function is represented as follows:
When the multiplicatively bounded formula for the Kaplan–Meier survival function estimation is expanded, it can be shown in the following ways:
or
Formula breakdown is as follows:
: the estimated survival probability at a specific time t;
: the estimated survival probability at a specific time t − 1;
: any specific time point when an event of interest occurs;
: the number of subjects at risk just before time t;
: the exact number of events that occurred at time.
Differences between Kaplan–Meier survival curves are investigated using the Log-Rank test. The Log-Rank test examines the null hypothesis that there are no differences between survival functions. The Log-Rank test statistic shows a Chi-square distribution with the number of groups −1 degrees of freedom under this null hypothesis [
40].
In this study, S(t) represents the probability of the firm staying above the relevant ESG threshold value at a specific time; T represents the time-to-event random variable until the ESG transformation event occurs; and t represents a specific point in time within the observation period. A downward trend in the curve indicates that firms have reached high levels of ESG performance; a horizontal trend indicates that no new ESG transformation events occurred during the relevant period.
3.3. Cox Proportional Hazards Regression Model
One of the most widely used methods in survival analysis is the Cox proportional hazards model. This model enables estimation of the instantaneous rate at which an event occurs. A key advantage of the model is that it does not require strong parametric assumptions about the distribution of the baseline hazard function.
This study utilizes the Cox Proportional Hazards Model to examine the time to achieve high ESG performance for firms. The Cox model is a semi-parametric survival analysis method that examines the rate at which a specific event occurs [
45].
The model is formulated as follows [
40]:
or
In the model, representations of the components are as follows:
: Hazard Function (instantaneous rate of an event);
: baseline hazard function;
: explanatory/predictor/independent variables;
: the coefficients of the model [
40].
The Cox PH model is usually written as shown above. It expresses the instantaneous risk at time t for a firm with a specific value of the explanatory variables, denoted by in the model. In other words, they are independent variables used to estimate a firm’s risk.
When the Cox model is examined, it appears that the hazard at time
t is represented as the product of two components. The first of these is the
baseline hazard function. Since this function is not specifically defined, the Cox model is semi-parametric. The second component is included in the model as an exponential, which is the linear sum of the
values of the
k quantity of explanatory variables
X [
40].
The
values, which are the coefficients of the explanatory variables in the Cox PH model, are estimated using the Maximum Likelihood Method. In this method, it is obtained by maximizing the Maximum Likelihood Function given below [
46].
The hazard ratio is calculated as follows:
A hazard ratio greater than 1 indicates that the variable in question accelerates the process by which firms achieve high ESG performance.
Considering that structural differences between sectors can affect ESG transition dynamics, the models were stratified on a sector basis. Thus, a different baseline hazard function was allowed for each sector [
7].
The stratified Cox model was preferred because ESG transition processes may exhibit different baseline hazards across sectors. This specification accommodates sectoral heterogeneity without imposing a specific parametric distribution, while retaining common effects for the firm-level covariates.
3.4. Data Set and Variables
The dataset used in this study was obtained from the ESG & Financial Performance Dataset developed by Shriyash Jagtap and hosted on the Kaggle platform (
https://www.kaggle.com/datasets/shriyashjagtap/esg-and-financial-performance-dataset, accessed on 23 July 2026). The dataset consists of 11,000 firm-year observations from 1000 firms covering the period 2015–2025. It includes ESG performance indicators together with firm-level financial, sectoral, and regional variables across different industries and geographic regions. The dataset was selected because its longitudinal panel structure enables the construction of time-to-event variables and right-censored observations required for survival analysis, making it suitable for examining the determinants of the time required to achieve high ESG performance.
In this study, ESG transformation processes were treated as dependent variables. ESG performance was evaluated through the dimensions of Overall ESG, Environmental ESG, Social ESG, and Governance ESG. Each ESG dimension is presented as a normalized composite score on a scale of 0–100. An ESG transformation event is defined as the first time the upper quartile (75th percentile) threshold is reached in the relevant ESG dimension of the data set.
Firm-level financial indicators were used as independent variables. These variables are: Revenue, which represents firm size; Profit Margin, which shows profitability; Market Capitalization, which represents market value; and Growth Rate, which expresses growth performance. The Revenue and Market Capitalization variables were transformed using the natural logarithm to reduce the pronounced right skewness commonly observed in financial data, limit the effect of outliers, and make model estimates more stable by balancing scale differences between variables (logRevenue and logMarketCap).
To control for sectoral heterogeneity in ESG transformation processes, the Sector variable has been included in Cox proportional hazards models as a stratification variable. In addition, the Region variable was used in Kaplan–Meier curves and log-rank tests to examine geographical differences.
Since the data set was a secondary source, ready-made data set, the detailed weighting methodology used to generate the ESG composite scores was not explicitly reported in the data source. Therefore, the ESG indicators were considered as ready-made composite performance metrics, and this was accepted as one of the methodological limitations of the study.
In the study, high ESG performance was defined as the relevant ESG score exceeding the 75th percentile in the sample distribution. Firms that did not reach the relevant ESG level during the observation period were considered right-censored observations.
All statistical analyses were performed using R (version 4.6.1, R Foundation for Statistical Computing, Vienna, Austria). Survival analyses were conducted using the survival package, KaplanMeier curves were generated using the survminer package, and the proportional hazards assumption was evaluated using Schoenfeld residuals implemented in the survival package.
4. Results
4.1. Descriptive Statistics
The statistics in
Table 1 show that ESG performance is heterogeneous across its sub-dimensions. While the average Overall ESG score is 54.62, the highest average scores among the sub-dimensions are in the Environmental (56.42) and Social dimensions. The Governance dimension has a relatively lower average (51.77). High standard deviations in the Environmental (26.77), Governance (25.32), and Social (23.36) dimensions indicate significant differences among firms in terms of ESG performance. The wide ranges between the quartile values also support this heterogeneous structure. These findings indicate that ESG performance is not homogeneously distributed among firms.
Table 2 presents the average scores for ESG Overall and its sub-dimensions, categorized by region.
When ESG scores are examined by region, Europe stands out as the region with the highest performance across all dimensions. Oceania and North America also have high ESG scores. In contrast, Africa and the Middle East have the lowest scores, particularly in the social and governance dimensions. In terms of environmental performance, regional differences are more limited, with Latin America, Europe, and the Middle East achieving similarly high environmental scores. Overall, developed regions tend to have higher ESG performance, while developing regions have lower performance.
“Environmental” scores appear to cluster within a very narrow range (between 52.97 and 58.27) worldwide. Regions that are strong in the “Social” area invariably also appear to be strong in the “Governance” area as well. In North America, although corporate governance culture is well-developed, environmental policies (carbon emissions, etc.) seem to lag behind the former. Asia, with scores between 49.58 and 54.47 across all sub-metrics, has the most homogeneous/balanced distribution within itself in the table; however, it exhibits a profile that remains in the middle in terms of global competition.
The ESG performances seem to show significant differences across sectors as well. (
Table 3).
When ESG scores are examined by sector, it is seen that the Finance and Technology sectors have the highest overall ESG performance. This is because the physical production process is less prevalent in these sectors compared to others. However, the reverse of the medal, the lowest Governance scores in the table, belong to these two (Finance: 47.54, Technology: 48.29) as well. In conclusion, the table indicates that while finance and technology companies possess exceptional environmental advantages, they also exhibit profound governance weaknesses, including data privacy, monopolistic practices, executive pay inequality, and a lack of transparency. Industries whose business models rely directly on the physical world and fossil fuels inevitably rate the lowest on environmental metrics, dragging down their overall scores. Consumer Goods and Retail are the most stable profiles in the table. All their metrics are stuck between 52.08 and 58.29. Social scores fall within a relatively narrow range (51.64 to 58.29) across all sectors. This pattern indicates that “Social” concepts such as workers’ rights, occupational health and safety, and employee diversity have now reached a global standard across industries, and that sectors cannot diverge significantly in this area.
4.2. Survival Analysis Results of the ESG Transformation Process
Within the scope of survival analysis, an ESG transformation event is defined as the first time a firm reaches the defined threshold value in the relevant ESG dimensions. The threshold values were determined based on third-quarter ESG scores, as they would enable assessment of firms’ transition to higher levels of sustainability maturity. This approach allowed identification of firms that achieved relatively higher levels of sustainability maturity in their ESG performance.
Accordingly, the Overall, Environmental, Social, and Governance ESG threshold values were 65.60, 79.00, 73.80, and 73.00, respectively.
In this structure, the event was specified as the first time the company exceeded the relevant threshold value. The firms that did not reach the threshold value within the specified observation period (2015–2025) were classified as right-censored observations.
Table 4 presents descriptive findings for ESG transformation events and the time to reach the ESG threshold value. The ESG transformation event is defined as the first time when firms reach the upper quartile (75th percentile) threshold in the relevant ESG dimension. The threshold values reported in
Table 4 represent the 75th percentile (third quartile) of the ESG scores measured on a 0–100 scale. Accordingly, firms with ESG scores exceeding these threshold values were classified as having achieved high ESG performance in the corresponding dimension.
The results show that firms’ overall ESG and sub-dimension scores are limited in their ability to reach high performance thresholds. While 330 companies reached the threshold in the Overall ESG dimension, these numbers were 306, 305, and 309 in the Environmental, Social, and Governance dimensions, respectively. In contrast, a significant number of firms failed to reach the relevant thresholds during the observation period and remained as right-censored observations. The pattern indicates that ESG transformation is not a process that can be completed in the short term.
When the times to reach the ESG threshold are examined, it is seen that the average transformation times are quite similar (Overall: 8.49 years; Environmental: 8.50 years; Social: 8.38 years; Governance: 8.35 years).
4.3. Kaplan–Meier Survival Curves and Interpretations
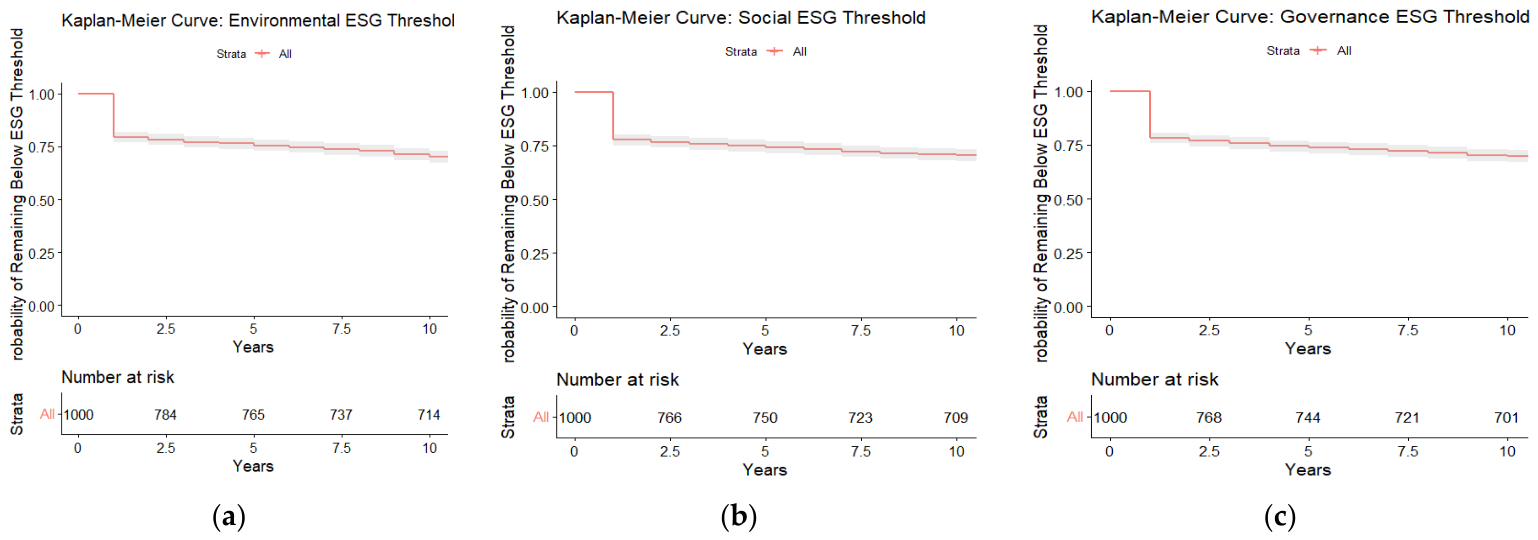
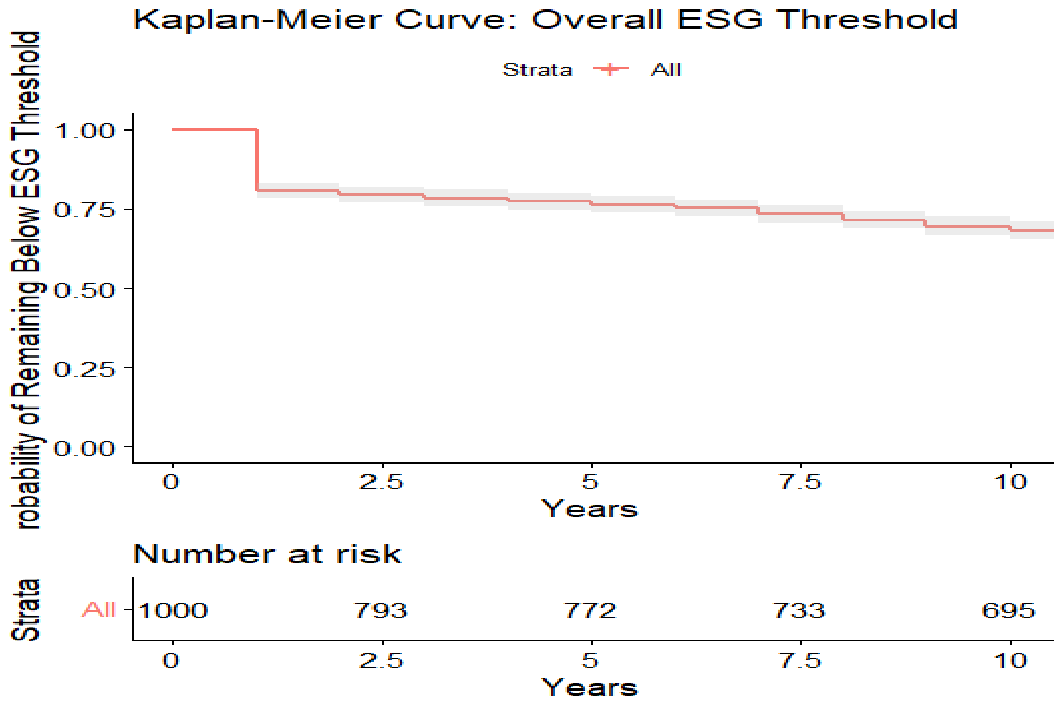
In the study, Kaplan–Meier survival curves were constructed to examine the time-dependent processes by which companies reach high ESG performance thresholds. The Kaplan–Meier approach shows the probability of firms falling below a specific ESG threshold over time, taking into account the timing of a specific event. In the present study, since the event is defined as the firm reaching the threshold value determined in the relevant ESG dimension for the first time, the life curves show the possibility that firms may not yet have reached the high ESG performance level.
A downward trend in the curve indicates that firms have reached a high level of ESG performance, while a horizontal trend indicates that no new ESG transformation event occurred during the relevant period.
Figure 1 and
Figure 2 show the Kaplan–Meier survival curves for the Overall, Environmental, Social, and Governance ESG dimensions, respectively. The “Number at risk” tables below the graphs (referring to companies that have not yet reached their targets) demonstrate how similar the performance of Environmental, Social, and Governance areas has become over time. Examination of the curves reveals that ESG conversion events occur primarily in the early stages of the observation period, but as time progresses, the curves flatten, and the conversion rate decreases. This demonstrates that achieving high ESG performance is a long-term organizational transformation process, not a short-term one.
When the dimensions are compared, it shows that the Environmental ESG curve is higher than the other dimensions; in other words, achieving a high ESG level in environmental performance is relatively more difficult. This situation is partly related to the fact that the threshold value used in the Environmental dimension (79.0) is higher than in other dimensions. The Social and Governance ESG curves lie quite close to each other, exhibiting similar transformation dynamics. The overall ESG curve shows that, due to the lower threshold value (65.6), more firms were able to reach this level, but this transformation progresses over the long term.
In general, the Kaplan–Meier results indicate that ESG transformation is not homogeneous across firms and reflects a multi-layered organizational transformation process spanning the long term, both in terms of overall ESG performance and its sub-dimensions.
4.4. ESG Transformation Dynamics by Regions and Sectors
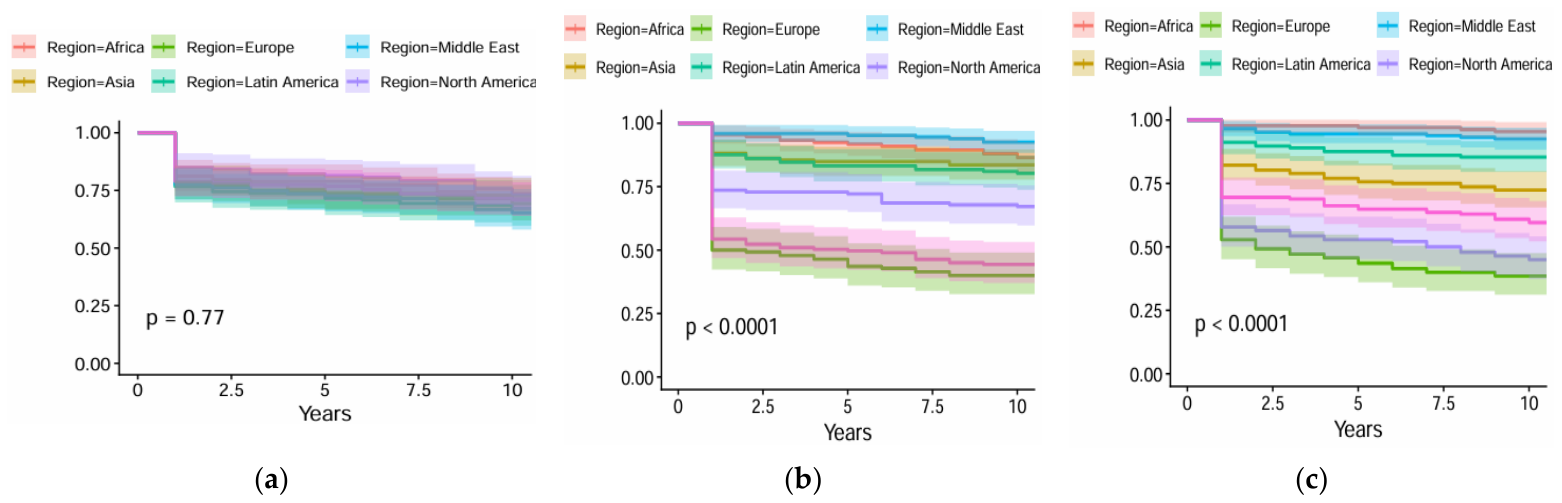
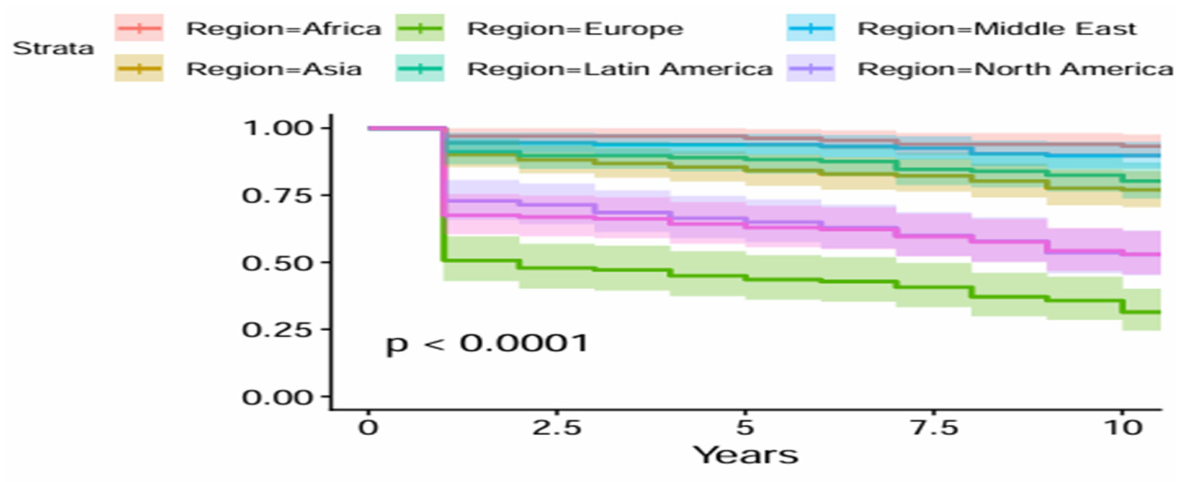
To evaluate the effects of the geographic regions in which companies operate on their ESG transformation processes, regional Kaplan–Meier survival curves were plotted, and the results of log-rank tests are presented (
Figure 3 and
Figure 4).
Kaplan–Meier curves demonstrate that ESG transformation processes differ by region (The pink line in the figures represents the average of all scores). While significant divergences are observed between the curves in the Overall ESG, Social, and Governance dimensions, the curves are closer together in the Environmental ESG dimension, displaying limited regional differences in the Environment dimension. Log-rank test results also support this finding: while there were no significant differences between regions in the Environmental dimension (p = 0.77), statistically significant differences were found between regions in the Overall ESG and Social and Governance dimensions (p < 0.0001).
ESG high-performance thresholds are reached more quickly, particularly in Europe, North America, and Oceania, whereas the transformation processes progress more slowly in Africa and the Middle East. Overall, the results reveal that environmental transformation is more homogeneous, while social, governance, and overall ESG transformations are more sensitive to regional conditions.
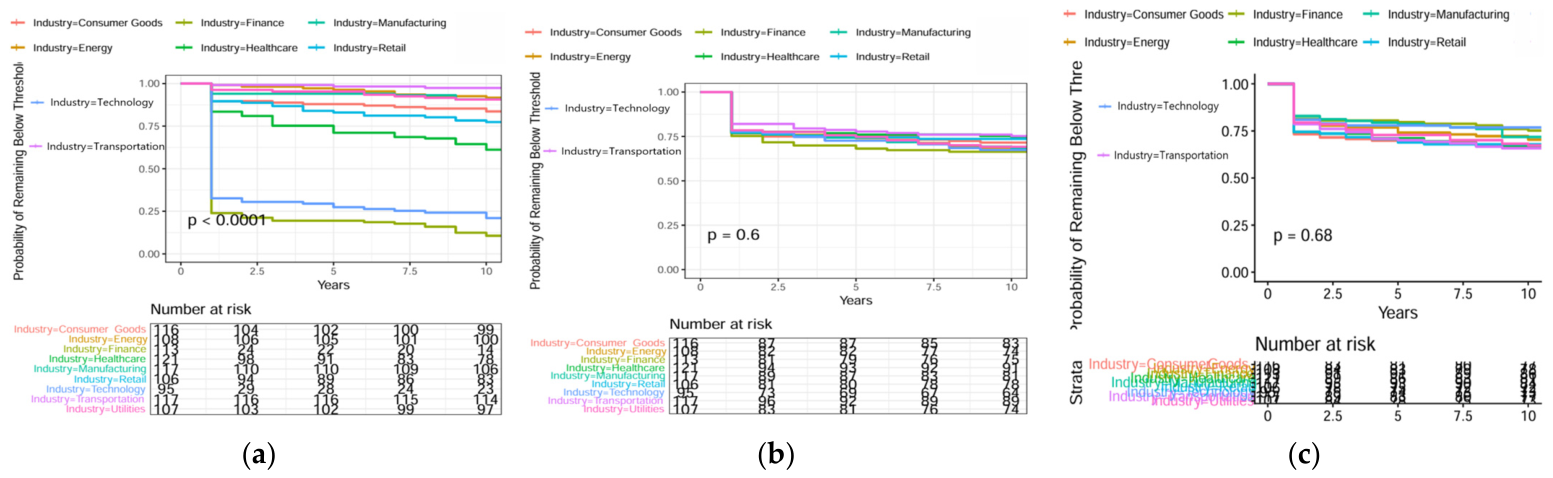
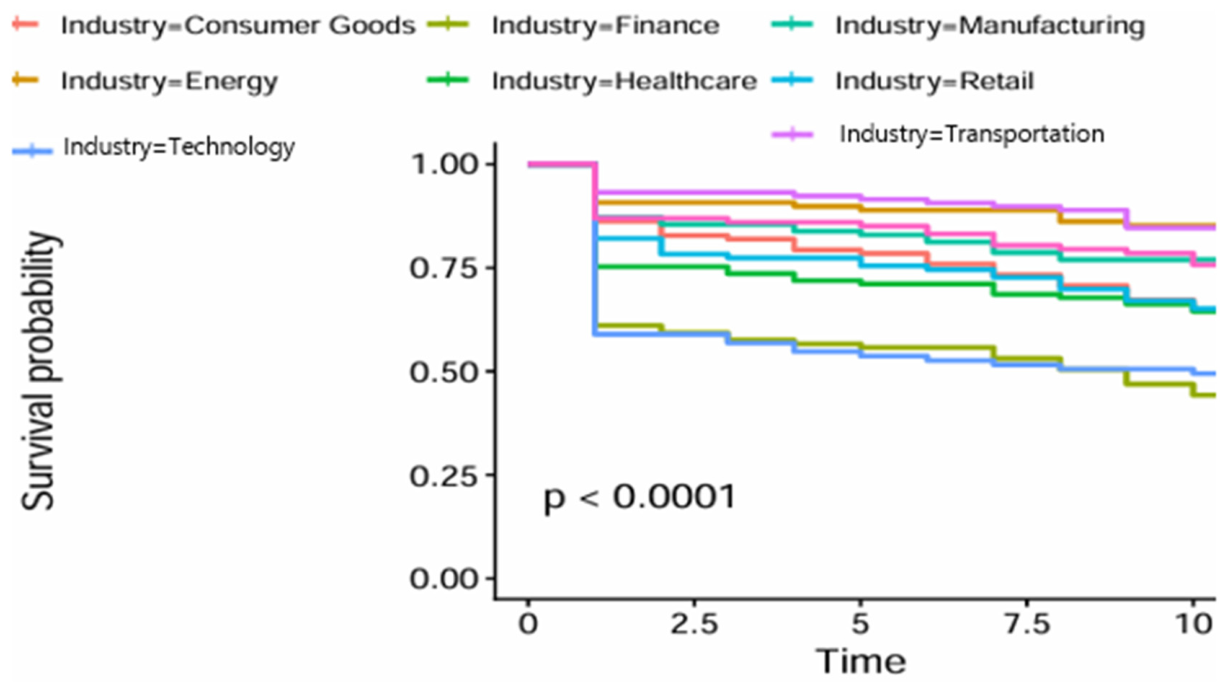
To evaluate the impacts of the sectors in which companies operate on ESG transformation processes, regional Kaplan–Meier survival curves were plotted, and log-rank tests were applied (
Figure 5 and
Figure 6).
Sectoral Kaplan Meier analyses indicate that ESG transformation processes exhibit distinct dynamics across dimensions. Sectoral disparities observed in the Overall ESG and Environmental ESG dimensions were also identified in the log-rank test results (p < 0.0001). This shows that both overall ESG performance and environmental ESG transformation are affected by industries’ structural characteristics. In particular, companies in the Finance, Technology, and Healthcare sectors reach high ESG performance thresholds faster, while transformation processes progress more slowly in the Energy and Transportation sectors. This distinction in the environmental ESG dimension is thought to stem from sectoral carbon intensity and operational environmental impacts.
Conversely, there are no statistically significant differences between sectors in the Social (p = 0.60) and Governance (p = 0.68) dimensions. This finding suggests that social and governance transformation processes are shaped by firm-level corporate practices and management structures rather than sectoral dynamics.
4.5. Evaluation of the Proportional Hazards (PH) Assumption
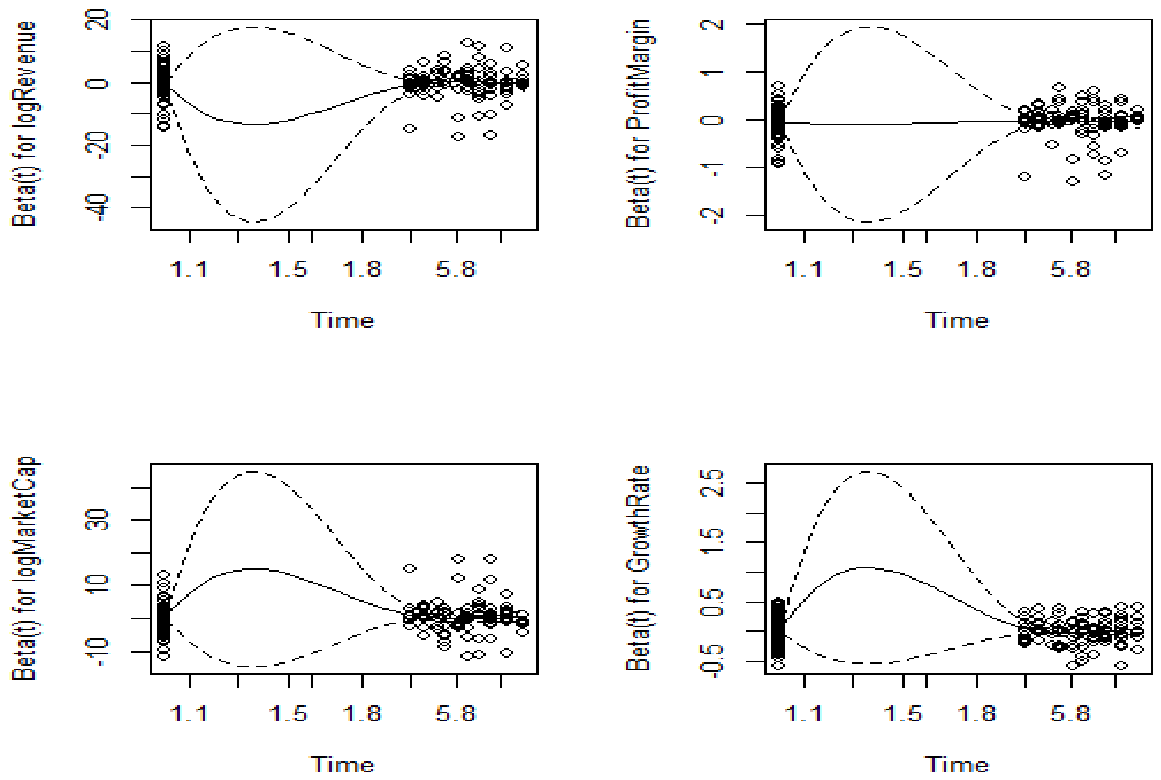
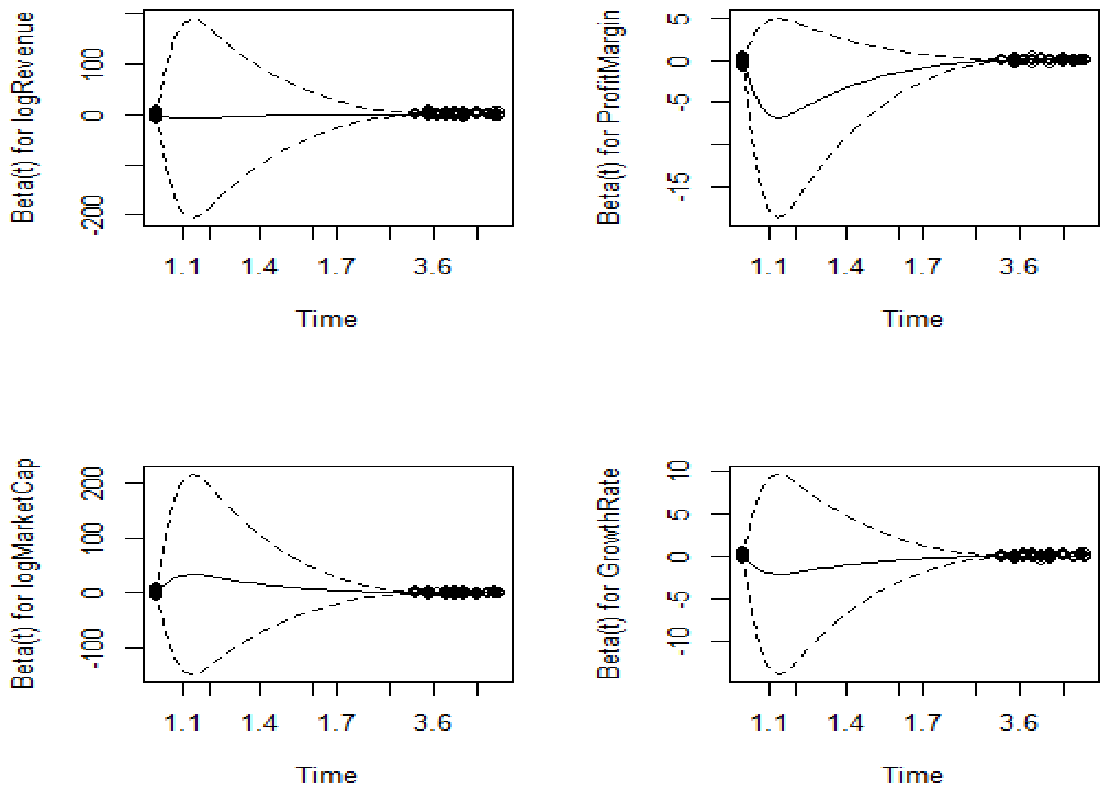
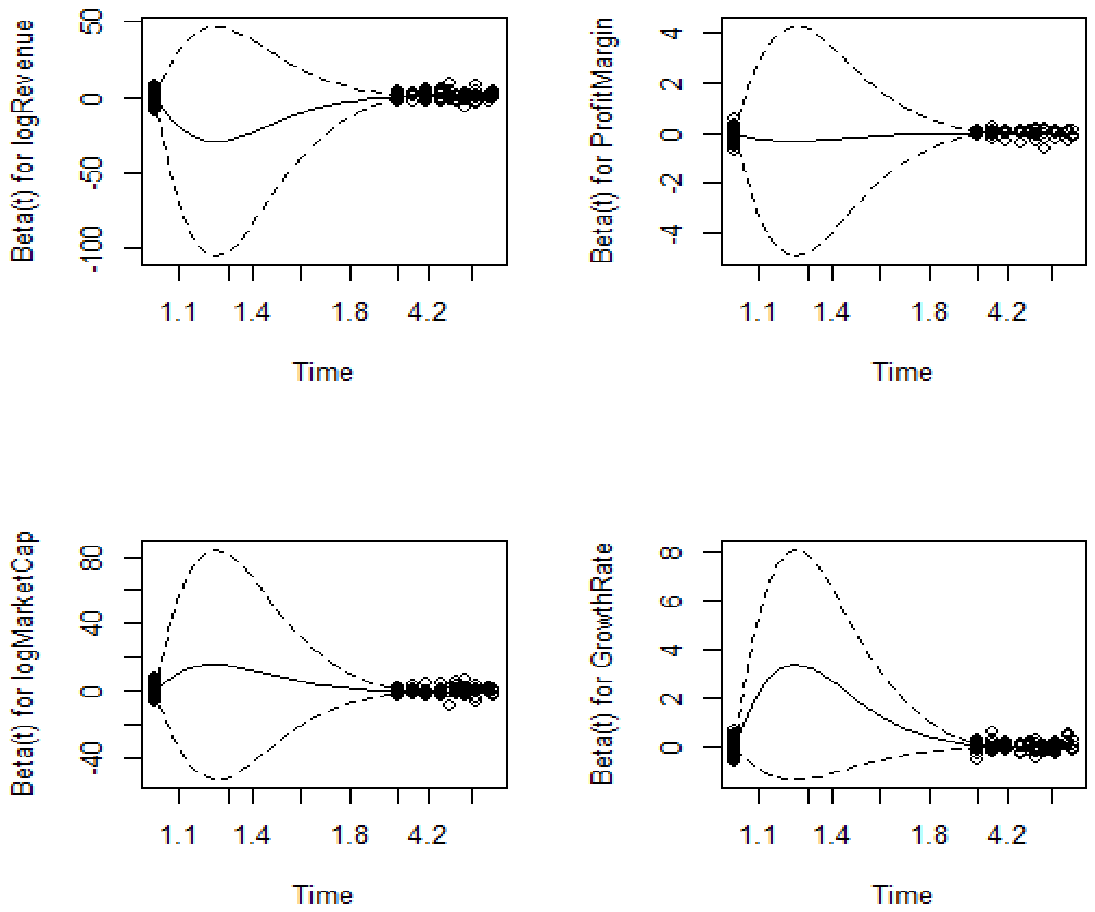
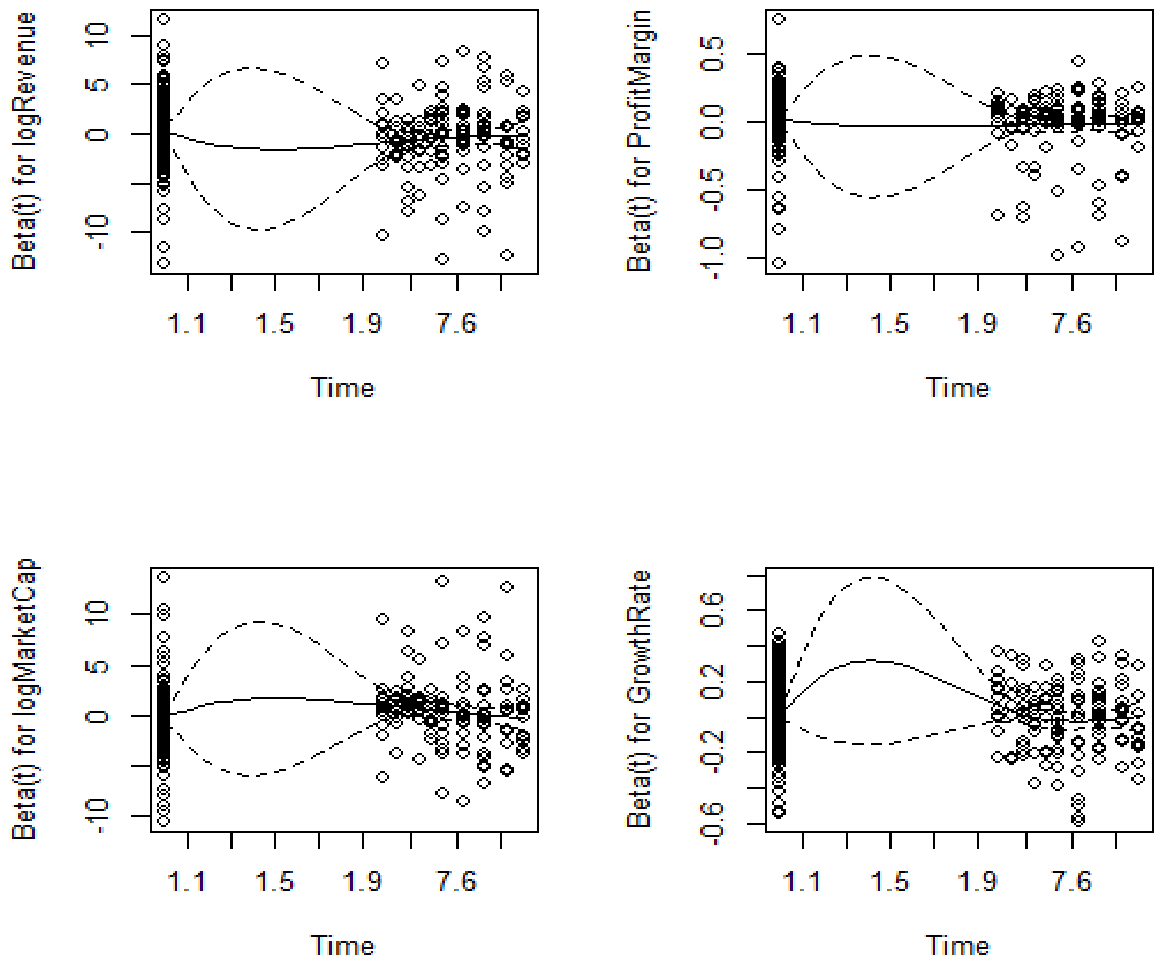
Before assessing the findings of the Cox proportional hazards model, the Proportional Hazards (PH) assumption, one of the model’s fundamental assumptions, was tested. This assumption presupposes that the effect of independent variables on the occurrence risk of an event remains constant over time and that hazard ratios do not change over time. Schoenfeld residuals-based graphs and the Grambsch–Therneau test were utilized to evaluate the hypothesis (
Table 5).
Global test results regarding the PH assumption show that the proportional hazards assumption is satisfied in the Overall, Environmental, and Social ESG models (
p > 0.05). In the governance dimension, the borderline significance of the global test result (
p = 0.0498) indicates a limited deviation from the proportional hazards assumption. Schoenfeld residuals plots were also utilized to support the appropriateness of the assumption for each dimension (
Figure 7,
Figure 8,
Figure 9 and
Figure 10). Given the marginal global PH test result for the Governance model (
p = 0.0498), a Weibull AFT model was estimated as a robustness check. None of the financial covariates was statistically significant (logRevenue: TR = 0.765,
p = 0.420; Profit Margin: TR = 0.992,
p = 0.952; logMarketCap: TR = 1.252,
p = 0.559; Growth Rate: TR = 0.840,
p = 0.123). Thus, the alternative specification supports the substantive conclusion of the Cox model for the Governance dimension.
Schoenfeld residuals plots show that covariate effects remain constant in the Overall, Environmental, Social, and Governance ESG models. The curves are generally nearly flat, with no distinct monotonic trends over the examined time period, supporting the proportional hazards hypothesis. Especially in the Overall ESG model, the curves of the variables logRevenue, Profit Margin, logMarketCap, and Growth Rate do not show strong, persistent trends over time, which supports the test results.
4.6. Cox Proportional Hazard Model Results
Cox proportional hazards models were estimated to evaluate firm-level financial determinants that affect the speed at which firms reach high ESG performance thresholds. In the analyses, to control for sectoral heterogeneity, the sector variable was included in the model utilizing a stratification approach.
Table 6 presents the results of the Cox proportional hazards model regarding ESG transformation processes.
The Cox proportional hazards model results show that the impact of financial variables on ESG transformation processes differs according to the ESG dimensions. In the Overall ESG model, no financial variable has a statistically significant effect. The fact that hazard ratios are very close to 1 and confidence intervals include 1 indicates that firm size, profitability, market value, and growth rate do not significantly explain the speed at which the overall ESG reaches the high-performance threshold. This pattern may reflect counterbalancing effects across the Environmental, Social, and Governance dimensions within the Overall ESG structure.
In the environmental ESG model, financial variables show a more significant impact. In particular, the positive and significant effect of the logMarketCap variable (HR = 1.62, p < 0.05) indicates that firms with higher market capitalization reach the high environmental ESG performance threshold faster. In contrast, the negative and significant effect of the Profit Margin variable (HR = 0.97, p < 0.05) indicates that firms with higher profitability implement environmental ESG transformation more slowly. This situation is related to the fact that short-term financial performance pressures can delay investments in environmental sustainability.
In contrast, none of the financial variables examined in the Social and Governance ESG models had a statistically significant effect (p > 0.05). The hazard ratios are largely close to 1, and the confidence intervals include 1, suggesting that transformation processes in these dimensions may be more affected by corporate structure, management practices, and organizational factors than by financial indicators. In general, the findings indicate that financial resources are more decisive, especially in environmental ESG transformation; however, overall ESG and the transformation in the social and governance dimensions are shaped by more complex, multidimensional dynamics.
As a sensitivity analysis, the Cox models were re-estimated using the 70th and 80th percentile thresholds for defining high ESG performance. The main findings remained substantively stable across alternative thresholds. No financial covariate was statistically significant in the Overall, Social, or Governance models. In the Environmental model, Profit Margin consistently showed a negative association and Market Capitalization a positive association with the rate of attaining high ESG performance. At the 70th percentile threshold, the effects were marginally significant (Profit Margin: HR = 0.976, p = 0.061; Market Capitalization: HR = 1.440, p = 0.054), whereas both effects remained statistically significant at the 80th percentile threshold (Profit Margin: HR = 0.964, p = 0.024; Market Capitalization: HR = 1.666, p = 0.029). These results indicate that the main conclusions are not driven solely by the choice of the 75th-percentile threshold.
5. Discussion
This study treats firms’ ESG performance not as a static output variable, but as a dynamic transformation process that evolves in time. In the study, Survival Analysis was used to examine the duration it takes for firms to reach a high ESG performance threshold. It has been determined that the process of achieving high ESG performance shows differences across the overall, environmental, social, and governance dimensions of ESG.
The results indicate that a substantial proportion of firms failed to reach the high ESG performance threshold during the observation period (2015–2025). Regional analyses show that ESG transformation processes advance faster in Europe, North America, and Oceania; however, they progress more slowly in Africa and the Middle East. The significant regional differences found, particularly in the Overall ESG, Social, and Governance dimensions, indicate that ESG performance is shaped not only by internal firm resources but also by investor pressure and the sustainability ecosystem.
The sectoral analyses reveal that ESG transformation is sensitive to the industrial structure. Significant sectoral differences are identified in the Overall and Environmental ESG dimensions; the Finance, Technology, and Healthcare sectors show faster ESG transformation, whereas the Energy and Transportation sectors progress more slowly. This situation shows that especially investments in environmental sustainability are associated with the carbon intensity and operational structures of industries.
The Cox model results reveal that the impact of financial variables on ESG transformation is limited but size-dependent. While financial indicators do not significantly affect the Overall ESG model, the Environmental ESG model indicates that firms with high market value implement ESG transformation faster, whereas firms with high profitability progress more slowly in environmental transformation. The lack of significance of financial variables in the Social and Governance dimensions suggests that transformation in these areas may be more related to corporate governance structures, organizational practices, and stakeholder pressures.
From resource-based and stakeholder perspectives, the differential effects of financial variables across ESG dimensions may reflect the distinct resource requirements and stakeholder pressures associated with each dimension. Environmental improvements often require substantial capital investments in cleaner technologies and sustainable production processes; therefore, firms with higher market capitalization may achieve environmental ESG targets more rapidly [
24,
25,
30,
31]. In contrast, the Social and Governance dimensions are more closely related to organizational practices, corporate culture, and governance structures than to financial capacity alone, which may explain why financial variables were not statistically significant in these models [
4,
5,
32,
33,
34,
35,
36,
37,
38].
This study extends the temporal perspective in ESG research by examining high ESG attainment as a time-to-event process. Furthermore, the study applies a Survival Analysis approach suitable for censored data structures and examines transformation dynamics separately across ESG dimensions.
All these results establish that ESG transformation strategies cannot be managed with uniform approaches. Financial capacity appears critical, particularly in environmental ESG transformation, whereas institutional structure and managerial mechanisms can be more decisive in the social and governance areas. The findings also have practical implications for different stakeholders. Firms, particularly in environmentally intensive sectors, may prioritize long-term resource allocation for environmental investments rather than short-term profitability objectives. Investors may consider the different transition dynamics of Environmental, Social, and Governance performance when evaluating firms’ sustainability trajectories. Policymakers may support slower-transitioning regions and sectors through targeted regulatory incentives and mechanisms that facilitate access to financial and technological resources. A relatively high proportion of right-censored observations was observed across all ESG dimensions. However, this does not invalidate the analysis, as the Cox proportional hazards model is specifically designed to accommodate right-censored data. Nevertheless, a high censoring rate may reduce statistical power and limit the precision of hazard ratio estimates. Therefore, the findings should be interpreted with appropriate caution.
The study is subject to some constraints. The limitations of the research are that the data set is based on the scores of secondary and ready-made composite ESG indices, and the model structure is limited to financial variables. In addition, potential endogeneity between ESG performance and firm-level financial characteristics cannot be fully ruled out. Therefore, the findings should be interpreted as associations with the timing of high ESG attainment rather than as causal effects. Future research may address this issue using lagged covariates or instrumental-variable approaches.