1. Introduction
Vietnam has a long continental shelf and substantial offshore wind resources. National power-development planning identifies offshore wind as an important component of the country’s future electricity supply [
1,
2,
3,
4,
5], as part of a broader global expansion of offshore wind capacity [
6]. Responsible deployment requires environmental information that supports site-specific siting decisions before construction and helps avoid committing to unsuitable sites. The Gulf of Tonkin is a semi-enclosed, monsoon-dominated basin. Seasonal wind reversal, coastline geometry, and interaction with the East Vietnam Sea produce marked spatial and seasonal variability [
7]. Its shallow-to-moderate water depths make several areas relevant for preliminary fixed-bottom development screening.
Most offshore-wind studies in Vietnam have focused on wind-resource mapping, technical potential, annual energy yield, or broad siting metrics [
8,
9,
10]. A recent 32-year assessment of the Binh Thuan–Phu Quy domain advanced this literature by integrating ERA5 wind and wave climate, bathymetry, and gross energy-yield screening across fixed-bottom and floating-depth classes [
11]. That study demonstrated the value of multivariable early-stage screening but did not address currents, wind–wave directional dependence, wind-conditioned sea states, or uncertainty-quantified extremes. Such assessments are valuable for regional planning, but wind-resource quality alone is insufficient for structural design. Offshore wind turbines and their support structures respond to combined wind, wave, and current loading. The environmental inputs required for load simulations must therefore describe not only mean conditions but also conditional sea states, directional relationships, extreme values, and uncertainty [
12,
13,
14].
Wind, wave, and current directions are not generally collinear, and their misalignment varies with season, location, and event type. The assumed dependence between environmental variables can materially affect calculated extreme responses [
15,
16,
17]. A related but distinct issue concerns extreme values. Independently estimated marginal extremes cannot automatically be interpreted as simultaneous joint-return-period conditions. This distinction is particularly important for reanalysis data because strong-wind values may be underestimated, and the averaging convention does not directly establish an IEC 10 min extreme wind speed [
18].
IEC 61400-1 and IEC 61400-3-1 define design-load-case frameworks for wind turbines and fixed-bottom offshore wind turbines, respectively [
19,
20]. The standards specify wind models, turbine states, and load-case requirements. However, site-specific numerical inputs, including wind-conditioned sea states, current conditions, directional combinations, and marginal return levels, must still be derived from environmental data. Operational, extreme, and event-associated conditions must remain conceptually separate rather than being collapsed into a single figure.
Previous Gulf of Tonkin studies have described seasonal circulation or regional wind resources. However, none has combined wind, wave, and current characterisation at three sites with wind-conditioned representative and upper-tail sea states, marginal extreme-value analysis with uncertainty, event-associated conditions, and IEC-oriented environmental screening. This paper addresses that gap.
The principal contribution of this paper is a method that converts long-term ERA5 and CMEMS records into site-specific statistics. These statistics are organised around the environmental information relevant to DLC 1.1, 1.3, 1.6, 6.1, and 6.3. The method is demonstrated at northern, central, and southern Gulf of Tonkin sites using a 150 m reference hub height. It provides long-term and seasonal metocean characterisation and directional misalignment statistics. It also provides conditional-mean sea states with median robustness checks and peak-period ranges, in addition to conditional upper-tail states with independent-event support. Extreme-condition outputs include POT–GPD marginal wind and wave return levels with bootstrap uncertainty and a GEV sensitivity check, event-associated wave-period estimates, and deliberately severe, explicitly non-joint marginal combinations for parked-condition sensitivity screening. These products are preparatory statistics for IEC-oriented screening. They are not completed SSS, ESS, or DLC simulation inputs and are not intended for certification or direct structural design.
The remainder of the paper is organised as follows.
Section 2 describes the study area, datasets, and evidence boundaries.
Section 3 presents the metocean, conditional-state, extreme-value, and IEC-oriented screening methodology.
Section 4 reports the site-level and screening-related results.
Section 5 discusses their physical and engineering implications and principal limitations, and
Section 6 summarises the conclusions.
3. Methodology
3.1. Study Design and Representative Sites
This study characterised long-term environmental conditions and prepared site-specific statistics for fixed-bottom offshore wind design-load-case screening in the Gulf of Tonkin. The method combined normal-condition statistics, wind-conditioned environmental states, marginal extreme-value analysis, and event-associated metocean conditions. These outputs were then organised according to their relevance to DLC 1.1, 1.3, 1.6, 6.1, and 6.3 at a 150 m reference hub height.
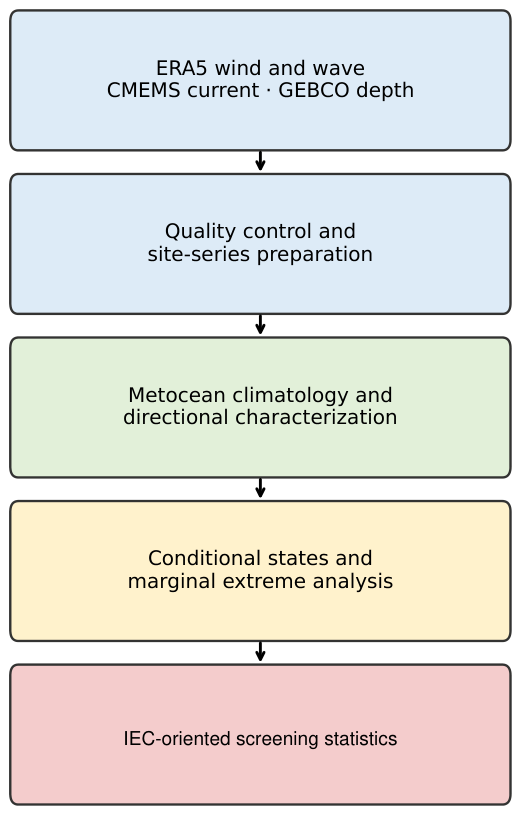
Figure 2 summarises this processing path. The statistics support comparative screening only; they are not completed IEC environmental-state definitions or load-simulation inputs.
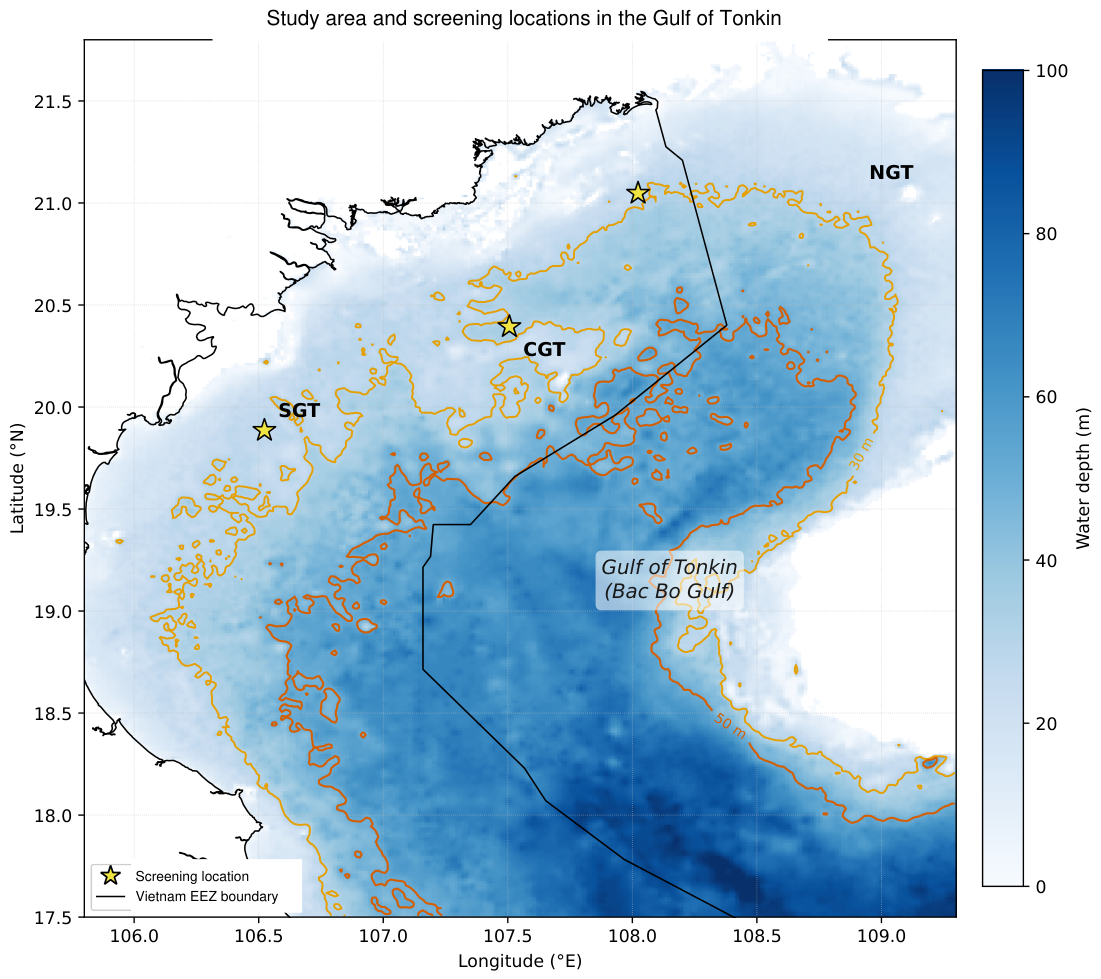
Three spatially separated locations were selected to sample northern, central, and southern Gulf environments (
Table 1). NGT lies in the northeastern offshore sector, CGT represents the central sector, and SGT represents the southern Gulf sector. They are screening archetypes rather than announced project sites. Their 26–35 m water depths are treated uniformly as fixed-bottom screening locations; no universal “shallow/deep” label or foundation-suitability inference is attached to that range.
Before analysis, the selected atmospheric, wave, current, and bathymetric grid cells were checked for spatial consistency, offshore location, coordinate convention, variable definition, units, temporal coverage, and missing values. Particular attention was given to the distance between the nominal site coordinates and the corresponding reanalysis grid cells. This distance varies because the wind, wave, and current products do not necessarily have the same spatial resolution.
The nearest valid ERA5 wave cell to NGT is 27.67 km from the nominal site, and masked land cells preclude ordinary bilinear interpolation. Spatial sensitivity was therefore evaluated using each of the four nearest valid ocean cells and an inverse-distance-weighted (IDW) combination of those cells. Annual mean and P90 Hs, wind–wave rank correlation and misalignment, wind-conditioned Hs, and 50-year Hs were recomputed. The nearest-cell series remains the primary, reproducible extraction. Conclusions that change under the ocean-only alternatives are explicitly qualified.
3.2. Metocean Datasets and Data Preparation
Hourly ERA5 wind and wave fields for 1993–2024 were used to characterise atmospheric and wave conditions [
21]. Wave-period variables retained their documented distinction between mean and peak period. Daily near-surface CMEMS currents described background circulation and were paired with ERA5 by UTC calendar day. They do not resolve tidal or storm-driven current extremes. GEBCO 2026 supplied bathymetry at the nominal site coordinates [
22].
ERA5 values are analysis fields sampled hourly, not measured 10 min or one-hour means. Wind and wave records were paired at common UTC timestamps, while current records were paired by calendar date. The extracted records were complete for every reported variable.
Supplementary Table S3 reports the native resolution, exact product and variable identifiers, selected grid coordinates, current depth, retrieval information, software versions, and extraction rules.
3.3. Wind-Field Processing and Hub-Height Extrapolation
Wind speed at 100 m was calculated from the ERA5 vector components as follows:
The meteorological wind direction
, defined as the direction from which the wind blows, was determined from
A reference hub height of 150 m was adopted, corresponding to the IEA 15 MW reference offshore wind turbine considered in this study. For climatological analysis and operational DLC screening, the ERA5 wind speed was extrapolated from 100 to 150 m using the power law
where
is the normal-condition shear exponent adopted for normal operating conditions. The value
is a screening-level assumption, not a measured site-specific or IEC-mandated value. It does not resolve variations in atmospheric stability, vertical shear, marine boundary-layer structure, or low-level jets. These processes would require site-specific multiheight observations or validated high-resolution atmospheric modelling.
Extreme-value analysis was conducted using the original
series. After estimating the
T-year return level at 100 m, the result was extrapolated to 150 m using
where
is the adopted extreme-wind profile assumption used only for post-fit extrapolation of the extreme return levels. It is not a measured site shear coefficient. Separating normal and extreme extrapolation avoided application of the extreme-wind profile to the complete operational time series and prevented double extrapolation.
The estimated extreme winds are return levels derived from ERA5 analysis fields sampled at hourly intervals. They are not automatically equivalent to IEC 10 min mean extreme wind speeds. Because the effective averaging period of ERA5 has not been established for the study sites, no fixed temporal conversion factor was applied in the baseline analysis.
3.4. Long-Term Metocean Characterisation
Long-term wind, wave, and current conditions were characterised for the complete 1993–2024 period and separately by month and monsoon season. A multidecade record was used because wind and wave climates can exhibit substantial interannual variability that shorter records may not adequately capture [
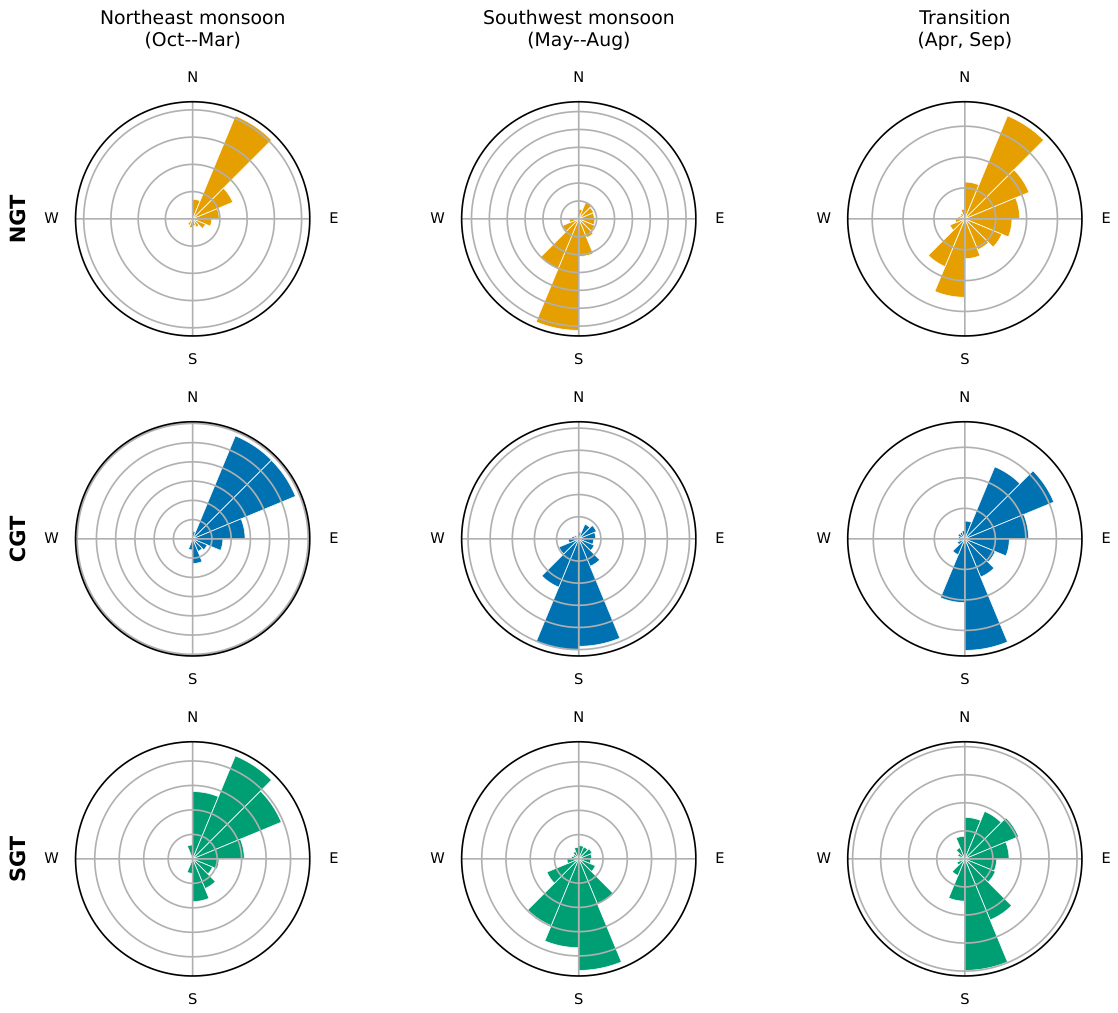
23]. The seasonal grouping was diagnosed from monthly wind-direction roses at all three Gulf of Tonkin sites rather than transferred from southern Vietnamese waters. Months with a persistent northeasterly wind regime were grouped into the northeast monsoon (October–March). Months with a persistent southwesterly regime were grouped into the southwest monsoon (May–August), while the directional reversal months of April and September were treated as transition periods. The analysis included means, medians, standard deviations, selected percentiles, occurrence probabilities, and directional distributions.
Wind–wave, wind–current, and wave–current misalignment were evaluated using the physical convention of each variable: wind and wave directions are “from”, whereas current direction is “toward”, all clockwise from true north. Current headings were rotated by 180° only when a common “from” convention was required for a directional comparison.
For two consistently defined directions
and
, the minimum absolute angular separation was calculated as follows:
Small values indicate approximate directional alignment under the adopted convention, whereas values approaching 180° indicate opposing directions.
Misalignment was examined for the complete record, individual seasons, operational wind-speed bins, and independent extreme-wind and extreme-wave events. These empirical distributions describe the site-specific environmental directionality.
3.5. Wind-Conditioned Environmental States
Operational environmental conditions were classified using 2 m s
−1-wide hub-height wind-speed bins centred at
For a bin centred at
, observations satisfying
were selected. Each bin was characterised by its occurrence probability, sample size, significant-wave-height distribution, associated wave-period distribution, background current condition, and directional misalignment.
The conditional representative sea state was derived from the following empirical conditional distribution:
where
denotes wind-speed bin
j. Here, P10, P50, P90, P95, and P99 denote empirical 10th, 50th, 90th, 95th, and 99th percentiles, respectively. Conditional means
and
were calculated as the IEC-oriented central estimates. Conditional medians were retained to quantify robustness to positive skew. The conditional
distribution was further summarised by P10, P50, and P90. Current and misalignment statistics were obtained from the same wind-conditioned subsets. Because currents are daily, the corresponding bin was assigned from the daily maximum
before
P90 was calculated.
For upper-tail operating-condition screening, the conditional distribution of
was evaluated for 2 m s
−1 wind bins centred between 4 and 24 m s
−1. The conditional upper-tail sea state was defined by
and one representative
was selected within the same wind bin. Records were ranked by
. The median
of the 20 nearest simultaneous hourly records was then retained. These records were not declustered and represent a local conditional sample rather than independent storms. The primary
choice was evaluated against
and 30. This period is descriptive and is not asserted to be load-critical. The wind-bin-conditioned daily background-current P90 was retained only as a background-circulation descriptor. Aligned headings provide a reference combination, while empirical site-specific misalignment defines additional directional cases. The conditional P90 statistics have no assigned recurrence period and are therefore not designated an IEC SSS.
Hourly sample counts and independent-event counts were retained as descriptive indicators of data support within each wind-speed bin. A 1000-replicate moving-block bootstrap supplied 95% intervals for conditional P90 and representative where available; 24 h blocks were primary and 12/48 h blocks were sensitivities.
3.6. Marginal Extreme-Value Analysis
Wind and
marginals were fitted separately using peaks over threshold (POT), in which independent exceedances above a high threshold are modelled by a generalised Pareto distribution (GPD) [
24]. This differs from the generalised extreme value (GEV) model, which was fitted to one maximum per year as a secondary model-form check. Candidate POT thresholds at the 95th–98th empirical percentiles were examined.
Because consecutive threshold exceedances may belong to the same meteorological event, exceedances were runs-declustered. One maximum value per cluster was retained as an independent event peak. The primary separation window was 72 h, with 48/96 h used as sensitivities. The 72 h separation was selected as a practical synoptic-scale storm-event separation, while 48 and 96 h provided shorter and longer sensitivity cases. Threshold selection jointly considered mean-excess (mean residual-life) behaviour, stability of the GPD shape and modified-scale parameters, quantile–quantile diagnostics, return-level stability, Kolmogorov–Smirnov (KS) goodness-of-fit, and the number of independent clusters. A composite stability score ranked candidates after the KS goodness-of-fit screen. Threshold selection was therefore based on the overall stability of the tail model rather than on a single diagnostic plot.
For an excess
above threshold
u, the GPD cumulative distribution is
where
and
are the scale and shape parameters, respectively. If
denotes the mean annual occurrence rate of independent threshold-exceedance clusters, the
T-year return level was calculated as
and
Thus,
is defined by the expected exceedance rate
, not by the annual-maxima non-exceedance expression
. Return levels were calculated for 1, 10, and 50 years. Each 95% interval used 1000 bootstrap replicates. The event count was Poisson-resampled, and independent cluster excesses were sampled with replacement before the GPD was refitted.
An annual-maxima GEV analysis was performed at 10 and 50 years as a secondary model check, also using 1000 bootstrap replicates. POT and GEV estimates were not averaged, and the larger estimate was not automatically considered preferable. The full
POT threshold–declustering grid is reported in
Supplementary Table S7. As a stationarity screen, annual means and maxima of
and
were tested for monotonic trends using Mann–Kendall tests and Theil–Sen slopes (
Supplementary Table S8). The absence of a significant trend was not interpreted as proof of stationarity.
3.7. Event-Associated Metocean Conditions
Marginal return levels do not describe the physical dependence among wind, waves, currents, and directions. Two complementary event populations were therefore constructed to characterise metocean conditions associated with independent extreme events.
For each independent extreme-wind cluster, the wave height, wave period, wind–wave misalignment, and corresponding background current were extracted at the wind-event peak. These observations formed the wind-driven associated-state population. Similarly, wind speed, wave period, directional misalignment, and background current were extracted at each independent extreme- peak to form the wave-driven population.
The environmental parameters extracted at an event peak were treated as associated conditions rather than marginal extremes. For example, a wave height observed during an estimated 50-year wind event was not assigned a 50-year return period.
The wave period associated with a target extreme wave height was derived from independent wave-event peaks located near the estimated . For each return level, the nearest k wave-event peaks in -space were selected. The corresponding period distribution was then summarised using its median and percentile range. The primary estimate used , with and 30 as sensitivities. The resulting quantity was termed an associated wave period, not a wave-period return level.
These event-associated populations supplemented the deliberately severe marginal combinations used in preliminary sensitivity screening. They also retained information about the observed physical dependence between environmental variables. Same-timestamp extraction does not resolve wind–wave peak lag within a storm window, and no meteorological classification of monsoon and tropical-cyclone events was attempted. The synthetic tropical-cyclone catalogue was not combined with ERA5, extrapolated to 150 m, or used to infer storm waves.
3.8. Organisation for IEC-Oriented DLC Screening
The long-term, conditional, and extreme metocean statistics were organised by their relevance to DLC 1.1, 1.3, 1.6, 6.1, and 6.3 [
14,
19,
20].
Table 3 combines the evidence supplied by this study with the principal information still required for formal implementation.
For DLC 1.1 and 1.3, conditional means of and provide central sea-state statistics. Medians and the P10–P90 range describe robustness and period variability. The associated IEC Normal and Extreme Turbulence Models remain externally defined. ERA5 wind variability was not used as a substitute for IEC turbulence.
For DLC 1.6, conditional statistics across the analysed 4–24 wind-bin range include P90, the conditional range, daily background-current P90, and aligned, median, and P90 wind–wave directional cases. The conditional P90 has no 50-year recurrence interpretation. It is not an IEC Severe Sea State.
For DLC 6.1 and 6.3, separately estimated marginal wind and wave return levels were combined as deliberately severe pairs, and . These are not joint return-period states. Event-associated conditions provide companion-state context, while water levels and tidal/storm-current extremes remain unavailable.
ERA5 wind-bin centres were used directly as background mean-wind inputs without temporal conversion. No fixed factor was applied to the extreme return levels because the relationship between ERA5 fields sampled hourly and IEC 10 min means is unverified. IEC wind fields, load-critical periods, joint environmental states, turbine simulations, and safety factors remain outside the analysis.
3.9. Uncertainty and Methodological Scope
Sensitivity to POT threshold, declustering window, extreme-value model, conditional bootstrap settings, and neighbouring-event count was evaluated. Sample and independent-event counts were reported descriptively for each wind bin and extreme-event population. The principal interpretation limits are discussed in
Section 5.9.
3.10. Reference Configuration
The IEA 15 MW reference turbine is used to define the 150 m reference hub height and the operating/parked context for the IEC-oriented screening [
25]. No power-curve or energy-yield calculation is performed.
4. Results
4.1. Site and Data Integrity
The three sites have complete hourly wind and wave records and complete daily current records for 1993–2024. These records comprise 280,512 hourly and 11,688 daily observations per site. The audited missing fraction is 0.000 for every reported wind, wave, and current variable. Water depth ranges from 26 m at SGT to 35 m at CGT (
Table 1). All three sites are treated uniformly as fixed-bottom screening locations, without a binary shallow/deep classification.
No in situ wind, wave, or current measurements are available at the three sites; the reported statistics therefore characterise the selected reanalysis products rather than providing observational validation.
4.2. Long-Term Wind Climate
Mean wind speed at the 150 m reference height does not rank the sites in a monotonic north-to-south order. CGT has the highest annual mean (7.972
), followed by SGT (7.144
) and NGT (7.078
), even though CGT lies geographically between the other two sites (
Table 4). The differences between sites are greater in the upper tail than at the centre of the distribution. The 99th percentile of
is 17.05
at NGT, 17.28
at CGT, and 15.35
at SGT. The standard deviation is essentially equal at NGT and CGT (3.94
each) and lower at SGT (3.42
).
The monthly cycle (
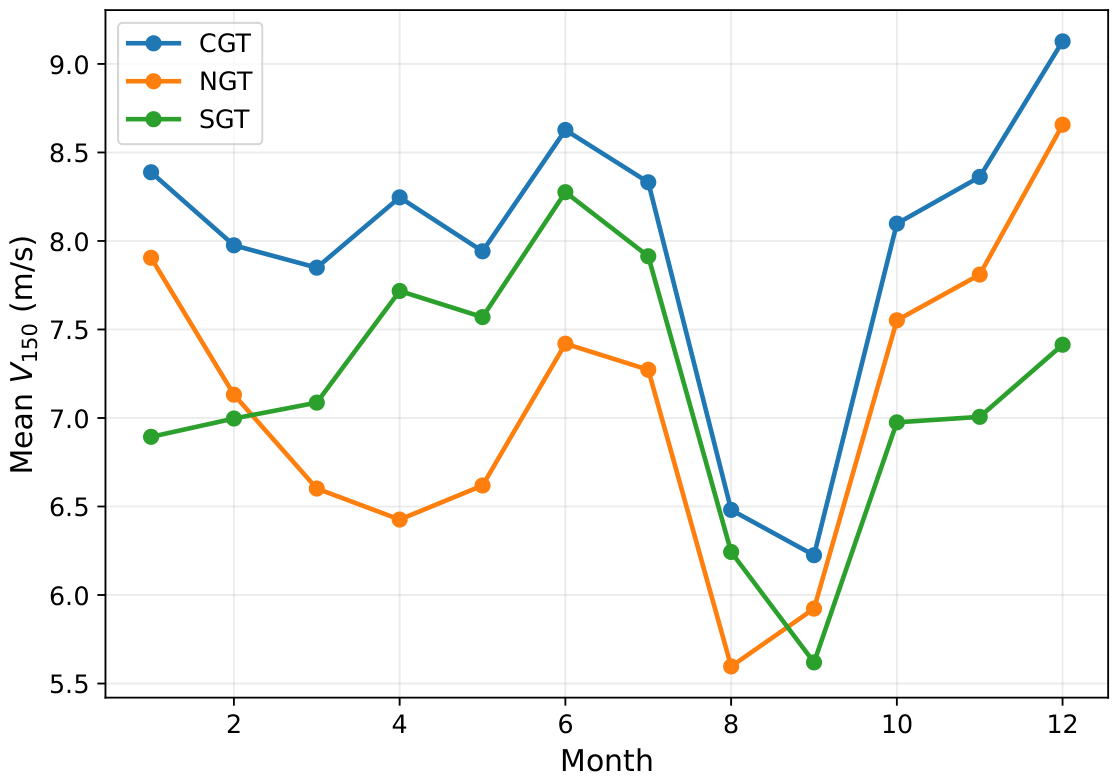
Figure 3) peaks in December at all three sites: 8.66, 9.13, and 7.41
at NGT, CGT, and SGT. It reaches its minimum in August at NGT (5.60
) and in September at CGT and SGT (6.23 and 5.62
). Monthly direction roses (
Figure 4) show a coherent northeasterly regime from October through March, a southwesterly regime from May through August, and directional transitions in April and September. Under this locally diagnosed grouping, the northeast- and southwest-monsoon mean wind speeds are 7.62 and 6.72
at NGT, 8.30 and 7.84
at CGT, and 7.06 and 7.49
at SGT. Thus, the northern and central sites have stronger winds during the northeast monsoon, whereas SGT has moderately stronger winds during the southwest monsoon. These statistics characterise the sites and provide the conditioning variable for operating DLCs; no energy-yield calculation is made.
The monthly roses also show that directional persistence weakens during the two transition months, particularly in September, whereas December–February and June–July have the clearest seasonally opposed directional modes (
Figure 4).
4.3. Wave and Current Climate
Significant wave height follows a site ordering similar to that of wind speed, but the relative difference increases towards the upper tail. Mean
is 0.936 m at CGT, compared with 0.863 m at NGT and 0.811 m at SGT. The 99th percentile is 2.86 m at CGT and 2.74 m at NGT but only 2.28 m at SGT (
Table 4). Peak wave period shows the opposite pattern to wave height. Despite having the lowest waves, SGT records the longest mean
(4.95 s), compared with 4.75 s at NGT and 4.90 s at CGT. Mean wave period follows the same ordering (4.35, 4.15, and 4.31 s at SGT, NGT, and CGT). Unlike wind seasonality, wave-height seasonality is consistent across the sites. Mean
peaks during the northeast monsoon at all sites—0.92 m at NGT, 1.02 m at CGT, 0.89 m at SGT—and is lowest during the southwest monsoon or transition months.
Background current speed distinguishes SGT from the other two sites at every level of aggregation examined. The annual mean is 0.129
at SGT, compared with 0.109
at NGT and 0.108
at CGT. The 99th percentile is 0.311
at SGT, compared with 0.269 and 0.266
elsewhere. Monthly means span 0.094–0.146
at NGT, 0.091–0.119
at CGT, and 0.103–0.158
at SGT. The northeast/southwest/transition means are 0.115/0.101/0.103
at NGT, 0.110/0.110/0.100
at CGT, and 0.133/0.130/0.112
at SGT (
Supplementary Table S5).
At NGT, replacing the primary nearest wave cell with the four-ocean-cell IDW changes annual mean
from 0.863 to 0.799 m, P90 from 1.636 to 1.505 m, and the 50-year marginal level from 6.66 to 5.96 m. The Spearman wind–wave correlation remains 0.85. CGT remains the most energetic wave site under all alternatives, but IDW places SGT above NGT for annual mean and 50-year
. Thus, the conclusion that CGT is the most energetic site is robust, whereas the NGT–SGT wave ranking is resolution-sensitive (
Supplementary Table S6).
4.4. Environmental Directionality and Misalignment
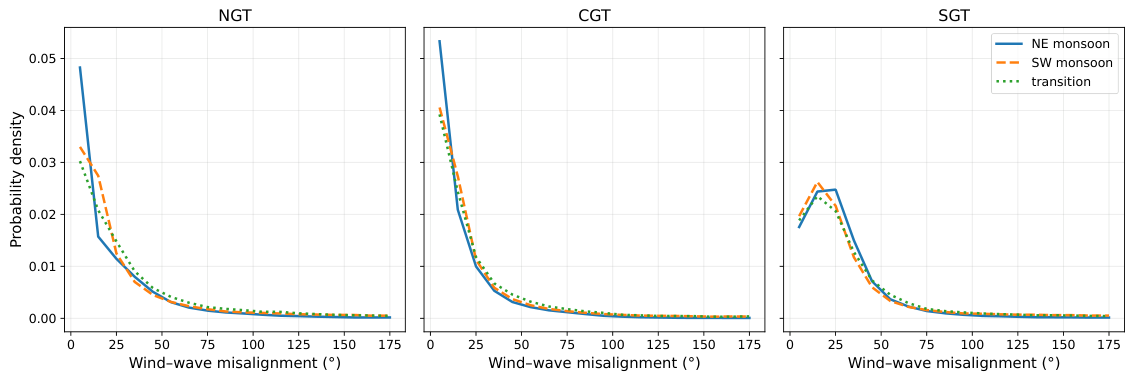
At every conditioning level examined, wind and wave directions are least separated at CGT and most separated at SGT. Annually, mean wind–wave misalignment is 19.9° at CGT, 25.3° at NGT, and 29.5° at SGT. The 95th-percentile misalignment reaches 94.6° at NGT and 85.5° at SGT, compared with 72.7° at CGT (
Table 5). Wind–current and wave–current misalignment is larger at all three sites (40–47° on average;
Table 5). This result indicates that, on average, the background current is less locally wind-driven than the wave field.
The contrast between CGT/NGT and SGT persists across the operating bins. In the 10 and 12
bins, median wind–wave misalignment is 7.1° and 5.5° at NGT and 7.1° and 6.5° at CGT. At SGT, it remains at 20.5° and 19.8°. The same pattern occurs among independent extreme events. At the peak of an extreme-wind event, median misalignment is 4.4° at NGT and 4.9° at CGT but 15.5° at SGT. At the peak of an extreme-
event, it is 3.9° at NGT, 4.0° at CGT, and 20.4° at SGT. Seasonally, mean wind–wave misalignment is lower during the northeast monsoon than during the southwest monsoon at every site: 21.6° versus 27.8° at NGT, 16.7° versus 22.5° at CGT, and 27.8° versus 30.7° at SGT.
Figure 4 and
Figure 5 show the monthly directional basis and the resulting seasonal variation.
4.5. Wind-Conditioned Representative and Upper-Tail Sea States
All eleven 2
wide wind-speed bins centred from 4 to 24
were retained in the conditional analysis. As expected, the number of observations decreases towards the highest wind-speed bins (
Supplementary Tables S1 and S2).
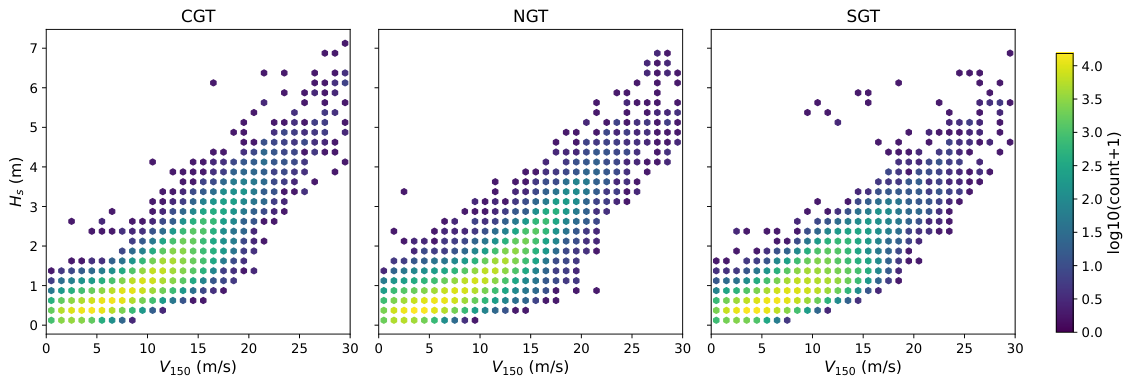
Conditional mean
increases monotonically with wind bin at all sites, from 0.46–0.47 m at 4
to 4.09–4.34 m at 24
(
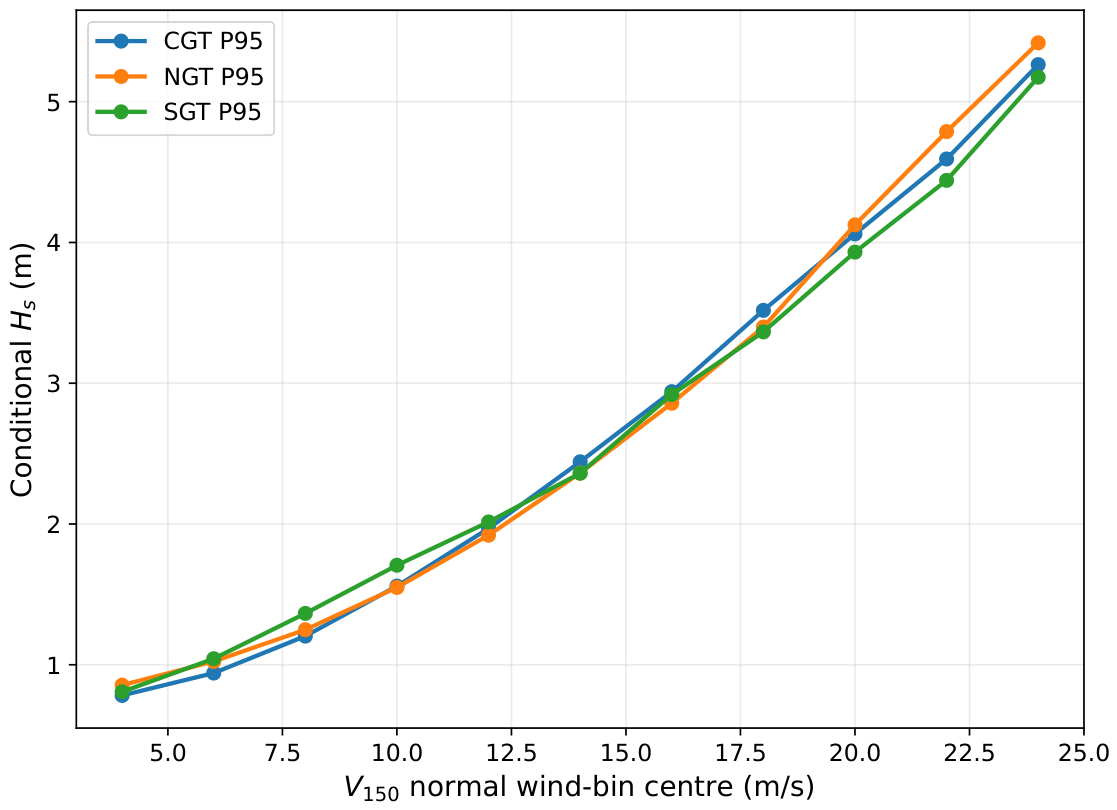
Supplementary Table S1). The corresponding medians are 0.43–0.44 and 4.16–4.32 m, respectively. Mean–median differences are below 5% in most bins and reach 8.5% in the SGT 14
bin. CGT and NGT track closely across the bin range, while SGT falls below both at wind speeds above roughly 14
(
Figure 6 and
Figure 7).
Conditional
means and medians differ by at most 1.3% (
Supplementary Table S1), whereas the P10–P90 range broadens at high wind speed and is particularly wide at SGT (5.66–9.89 s at 20
and 5.77–10.23 s at 22
). One period is therefore inadequate for response-sensitive applications.
For DLC 1.6-oriented screening, each wind bin includes conditional
P90 and wind-conditioned daily background-current P90. The current ranges are 0.153–0.324
at NGT, 0.128–0.407
at CGT, and 0.163–0.363
at SGT (
Supplementary Table S1).
Hourly sample counts and independent-event counts decrease towards the highest wind-speed bins and are reported descriptively alongside the available high-wind bootstrap intervals and neighbouring-record sensitivity results in
Supplementary Table S2.
4.6. Marginal Extreme Wind and Wave Conditions
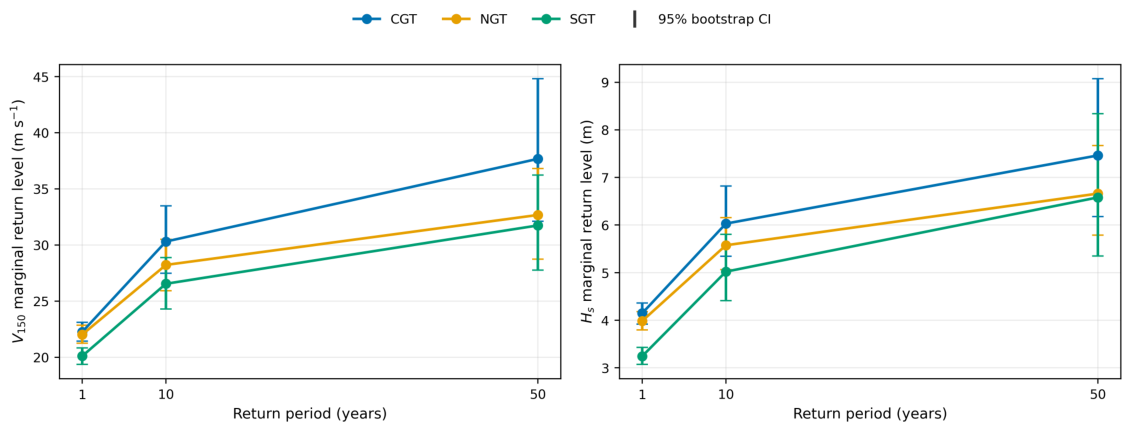
The primary nearest-cell POT–GPD fits rank CGT highest for both variables. NGT and SGT are sufficiently close that the wave ordering is spatially sensitive. At 150 m, the 1/10/50-year wind return levels are 22.02/28.23/32.68
at NGT, 22.26/30.31/37.67
at CGT, and 20.11/26.55/31.74
at SGT. The corresponding
levels are 3.99/5.57/6.66 m, 4.15/6.03/7.46 m, and 3.24/5.02/6.58 m (
Table 6 and
Figure 8). The 95% interval for the 50-year wind level is widest at CGT (32.1–44.8
), compared with 28.7–36.8
at NGT and 27.8–36.2
at SGT.
An annual-maxima GEV fit was retained as a secondary sensitivity check based on only 32 annual maxima per site and variable. Its divergence from the POT–GPD estimate increases at longer recurrence periods. At 50 years, the GEV/POT ratio is 1.45, 1.15, and 1.22 for 100 m wind speed and 1.23, 1.30, and 1.48 for at NGT, CGT, and SGT. SGT shows the largest divergence of any site–variable pair. Its 50-year GEV confidence interval (5.35–30.14 m) is much wider than the corresponding POT–GPD interval (5.35–8.34 m). The two models are reported side by side, and neither is treated as superseding the other.
Across all 95th–98th-percentile thresholds and 48/72/96 h declustering windows, 50-year
spans 31.98–35.15
at NGT, 34.18–42.12
at CGT, and 30.59–35.51
at SGT; 50-year
spans 6.66–7.36, 7.24–7.95, and 6.38–7.18 m, respectively (
Supplementary Table S7). No annual mean or maximum series shows a significant monotonic trend at
; all Theil–Sen confidence intervals include zero (
Supplementary Table S8). These checks do not prove stationarity or eliminate ERA5 tropical-cyclone under-resolution.
The fitted return levels are derived from ERA5 fields whose effective averaging period has not been established against offshore measurements. They are therefore reported as preliminary marginal wind and wave return levels, not as IEC 10 min mean extreme wind speeds. For contextual numerical comparison only, the ERA5-derived values were placed alongside the IEC I/II/III 10 min reference wind speeds of 50/42.5/37.5 . The CGT 50-year point estimate is 37.67 , with a 32.1–44.8 confidence interval, while the NGT and SGT estimates are 32.68 and 31.74 . These quantities have different averaging definitions, so the comparison does not constitute a preliminary turbine-class assignment. The underlying field is not a certified IEC 10 min mean, and no IEC wind class is assigned to any site.
4.7. Event-Associated Environmental States
At every site, environmental conditions extracted at the peak of an independent extreme event are less severe than the marginal return levels in
Section 4.6. At the peak of an independent extreme-wind event, median associated
is 2.31 m at NGT, 2.43 m at CGT, and 1.49 m at SGT. Each value is well below the corresponding 50-year marginal
of 6.66, 7.46, and 6.58 m (
Table 6). The relationship also holds in the other direction. At the peak of an independent extreme-
event, median associated
is 16.2, 16.4, and 13.1
at NGT, CGT, and SGT, again well below the corresponding 50-year marginal wind levels. The wind-driven event population comprises 602, 539, and 683 independent clusters at NGT, CGT, and SGT. The wave-driven population comprises 533, 467, and 517 clusters, matching the cluster counts underlying
Table 6.
The wave period associated with a target extreme was taken as the median period of the nearest independent wave-event peaks in -space. At the 50-year level, it is 8.5–9.6 s across sites for neighbour counts of 20 or 30. Sensitivity to the number of neighbouring peaks is small at NGT and CGT but greater at SGT, where the associated period rises to 10.48 s when only the 10 nearest peaks are used. These values are associated wave periods rather than wave-period return levels.
4.8. IEC-Oriented Environmental Screening Matrix
The screening matrix draws on the conditional wind-bin statistics across the analysed range in
Section 4.5. Conditional means, medians, and
P10/P50/P90 support DLC 1.1/1.3 comparisons, while empirical
P90, conditional
, daily background-current P90, and directional sensitivity support DLC 1.6 comparisons.
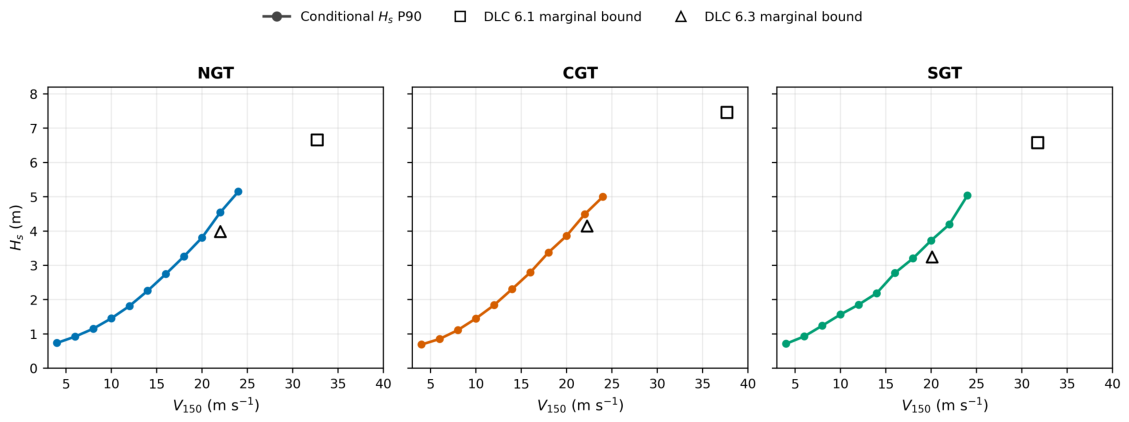
For DLC 6.1 and 6.3, the 50-year and 1-year marginal wind and wave levels of
Table 6 are shown as deliberately severe combinations in
Figure 9; event-associated states provide companion-condition context.
5. Discussion
5.1. North–South Environmental Variability
The site comparison in
Section 4.2,
Section 4.3 and
Section 4.6 does not show a monotonic north-to-south gradient. CGT is the most energetic site according to the principal wind and wave metrics, while NGT and SGT are more similar. The NGT ocean-cell sensitivity preserves CGT’s leading position but reverses the NGT–SGT wave ranking. Thus, only the conclusion that CGT is the most energetic site is robust to the tested wave extraction. The Gulf’s semi-enclosed geometry and limited fetch may contribute to this pattern, but observations or higher-resolution modelling are needed to distinguish these effects from grid placement.
5.2. Physical Interpretation of Seasonal Wind, Wave, and Current Patterns
Wave-height seasonality is dominated by the northeast monsoon at all three sites. In contrast, the locally diagnosed wind seasons show a northeast-monsoon maximum at NGT and CGT and a southwest-monsoon maximum at SGT (
Section 4.2 and
Section 4.3); (
Figure 3 and
Figure 4). One physically consistent interpretation is that significant wave height at these fetch-limited, semi-enclosed sites responds to Gulf-scale monsoon wind forcing that is broadly shared across the three sites. Local wind speed may be more sensitive to position within the sub-basin. SGT has a more southerly and open exposure towards the wider East Vietnam Sea, which may sustain wind speed more evenly across both monsoon phases. The more enclosed NGT and CGT positions experience a stronger seasonal contrast between the reinforcing northeast monsoon and the opposing southwest monsoon.
Wind and background-current directions also diverge more persistently at SGT than at NGT or CGT (
Section 4.4). This finding is qualitatively consistent with the broader regional pattern of directional and interannual decoupling between wind-driven circulation and background ocean currents [
15,
16]. However, those studies examine a different, more southerly upwelling system. They are cited only as regional evidence that wind–current decoupling is physically plausible in this basin, not as a direct explanation of the specific current regime at SGT. The present data cannot attribute SGT’s persistent misalignment to a particular circulation mechanism. Such attribution would reach beyond what a comparison of ERA5 and CMEMS products can support.
5.3. Typhoon and Marginal-Extreme Implications
The marginal wind and wave return levels reported in
Section 4.6 are statistical POT–GPD estimates based on the full 1993–2024 ERA5 record. They carry no storm attribution, and the synthetic tropical-cyclone catalogue was intentionally excluded from this baseline (
Section 4.3 and
Section 4.6). The estimates therefore do not directly characterise typhoon-driven extremes, and the return levels in
Table 6 should not be interpreted as typhoon-specific design values. The Gulf of Tonkin is subject to typhoon-influenced events. ERA5 has underestimated strong offshore winds in some independently evaluated regions, particularly during intense storms [
18]. However, no observations are available at the present sites to determine whether such a bias applies locally. Neither its magnitude nor its sign can be assumed. The reported return levels should therefore be treated as reanalysis-based screening estimates with unquantified local bias, rather than as lower or upper bounds.
5.4. Marginal Versus Event-Associated Environmental States
Section 4.7 shows that same-timestamp companion conditions at independent extreme-event peaks are less severe than the deliberately severe marginal combinations (
Section 4.8;
Figure 9). This difference is expected when typical companion values are compared with two separately extrapolated marginals. A 50-year wind return level and a 50-year wave-height return level are each defined by the exceedance rate of their own variable. Their definitions do not require simultaneous occurrence. The extracted populations show that wind and wave peaks do not generally coincide at the same timestamp. However, they do not establish that the events arise from different meteorological mechanisms because storm-window association, wind–wave peak lag, and monsoon/cyclone classification were not analysed. The marginal pairs are therefore deliberately severe sensitivity cases. They are neither typical joint states nor proven response-conservative bounds. Event-associated states provide context for observed companion conditions but are not return-period estimates.
5.5. Implications for IEC Turbine Class and Class S Treatment
IEC 61400-1 assigns wind turbines to a small set of standard wind classes based on a reference wind speed and turbulence category. It also includes a separate “Class S” provision for sites with conditions outside a standard class [
19]. The contextual comparison in
Section 4.6 is presented only to indicate scale because the ERA5-derived estimates and IEC reference values use different averaging definitions. No class is assigned or implied for any site. The comparison supports only a narrower practical point. CGT has a wider bootstrap interval and a larger fitted GPD shape parameter than the other two sites (
Section 4.6). Its extreme-wind conditions therefore warrant closer site-specific scrutiny before a standard-class assumption is adopted at the certification stage.
5.6. Implications for DLC 1.1, 1.3, 1.6, 6.1, and 6.3
The conditional and marginal statistics distinguish the sites across the analysed wind-bin range. However, they remain screening evidence rather than complete design states. Conditional P90 has no 50-year recurrence interpretation, and the parked-condition marginal pairs do not define complete DLC 6.1/6.3 states. Site measurements, joint environmental modelling, water levels, tidal and storm currents, IEC wind fields, and load simulations are still required for design and certification.
5.7. Design and Development Implications
The three sites provide distinct environmental starting points for early-stage screening. CGT combines the highest mean wind and wave conditions with the highest primary extreme-wind estimate. SGT shows the most persistent wind–wave misalignment and the strongest background current, while NGT exhibits the largest seasonal wind contrast. These differences argue against applying a single generic environmental assumption across the three locations. Installation logistics, including vessel availability, port distance, and weather-window planning, are outside the scope of this study. Foundation design and geotechnical assessment are also outside its scope. The environmental screening reported here is a necessary input to later site investigation, not a substitute for it.
5.8. Comparison with Previous Studies
The existing Vietnam-focused offshore wind literature has concentrated on wind-resource screening, including mean speed, technical potential, downscaled climatology, and siting metrics. These studies generally do not treat wave, current, and directional structure in parallel [
1,
2,
3,
8,
9,
10]. A separate strand of Vietnamese coastal research has assessed wave conditions as a wave-energy resource rather than as a design-load input [
26]. Thus, wave characterisation oriented towards turbine design loads remains largely unaddressed in the national literature. The present results are broadly consistent with the wind-speed ranges reported in that literature. They extend the analysis to conditional, extreme, directional, and event-associated aspects that those studies do not report.
A dedicated oceanographic study of the Gulf of Tonkin used coupled modelling tools to characterise seasonal wind and circulation forcing [
7]. It provides useful independent confirmation that monsoon-driven seasonal reversal is a first-order control on the basin’s circulation, consistent with the seasonal contrasts discussed in
Section 5.2. However, that study was not designed around turbine design-load requirements and does not report wind-conditioned sea states, marginal extremes, or DLC-structured environmental inputs. These missing elements form the gap addressed here. Regional wave-extreme studies based on long ERA5 wave reanalyses in the East Vietnam Sea have reported site- and basin-specific extreme-value structures using broadly comparable POT/extreme-value approaches [
27,
28]. These studies support the general applicability of an ERA5-based extreme-value approach in the region but do not directly validate the Gulf of Tonkin-specific values reported here. Elsewhere, site-specific metocean characterisation studies for offshore wind developments have followed a broadly similar principle: metocean description is treated as a design-input product distinct from resource assessment [
13,
29]. This study adopts the same organising principle for the Gulf of Tonkin.
5.9. Limitations and Future Work
Several sources of uncertainty must be considered when interpreting these results. ERA5 is a spatially resolved reanalysis product rather than a point observation. Reanalysis wind fields carry non-trivial uncertainty in wind-resource and extreme-value applications, depending on the region and application [
30]. ERA5 may therefore smooth locally severe conditions in ways that the present data cannot quantify. Its effective temporal averaging period relative to an IEC 10 min mean has also not been established for these sites. Consequently, the marginal wind return levels in
Table 6 remain preliminary screening estimates rather than certified IEC extreme wind speeds (
Section 5.3).
The constant shear exponents used to extrapolate wind speed from 100 to 150 m (
normal,
extreme) are screening-level assumptions rather than site-validated values. The power-law exponent varies with location, stability, and averaging conditions and is not a universal constant [
31]. The true site-specific shear at NGT, CGT, and SGT could therefore differ from these values in either direction.
The extreme-value methodology carries unresolved threshold, declustering, and model-form uncertainty. Across the full sensitivity grid, some 50-year levels move by about 10%, which is comparable to close inter-site differences. The annual-maxima GEV cross-check diverges increasingly at longer return periods and rests on only 32 maxima. No significant monotonic annual trend was detected, but that screen neither proves stationarity nor captures non-monotonic climate variability.
Two further limitations concern the physical processes represented by the data. The CMEMS current product describes daily background circulation. Every current statistic in this study, including the elevated SGT current discussed in
Section 5.2, therefore characterises this background field. These statistics do not represent tidal or storm-driven current peaks, which can be as important as the mean flow for a fixed-bottom, mooring-free structure. In addition, the marginal wind and wave extremes were fitted independently rather than with a validated joint or conditional extreme-value model. The event-associated states in
Section 4.7 partially address this limitation by showing what co-occurs with an extreme in the other variable. However, they do not replace a formally fitted joint model, which was not constructed here.
Moving towards a certifiable basis requires the measurements and modelling identified above, together with storm-window and peak-lag analysis and geotechnical investigation.




 ,
,