Article

A Prospect-Theoretic Tripartite Evolutionary Game Analysis of Phosphogypsum Governance from the Technology–Organization–Environment Perspective


School of Public Administration, South China University of Technology, Guangzhou 510641, China
*
Author to whom correspondence should be addressed.
Sustainability 2026, 18(17), 8753; https://doi.org/10.3390/su18178753
Submission received: 7 August 2026 / Revised: 24 August 2026 / Accepted: 24 August 2026 / Published: 26 August 2026

Abstract

Phosphogypsum (PG) governance is a persistent challenge in industrial solid waste management, particularly in regions where large-scale stockpiling, uneven resource-utilization capacity, and policy implementation pressures coexist. Existing studies have paid considerable attention to regulatory instruments and recycling technologies, but less is known about how governments, waste-generating enterprises, and waste-utilizing enterprises adjust their strategies under bounded rationality. This study develops a tripartite evolutionary game model incorporating prospect theory. The technology–organization–environment (TOE) perspective is used as a parameter-identification lens to capture three external conditions: policy incentive intensity, enterprise governance input, and resource-utilization technology maturity. Based on case-informed parameter calibration from Guizhou and related policy-industrial evidence, numerical simulations are conducted to examine evolutionary paths, equilibrium conditions, and parameter sensitivity. The results show that PG governance may evolve from systemic inaction to policy-driven transformation and then to market-oriented sustainability. Technological maturity plays a threshold role, while excessive loss aversion can destabilize cooperative evolution. The interaction analysis further indicates that policy incentives are effective only when they are aligned with enterprise treatment behavior and viable market-entry conditions. These findings suggest that PG governance should move beyond short-term administrative intervention toward staged policy support, technical standardization, and market cultivation.

1. Introduction

Industrial solid waste (ISW) governance has become a central issue in the transition toward cleaner production and a circular economy [1]. Unlike municipal waste, ISW is usually generated in large quantities, concentrated in specific industrial chains, and closely tied to environmental and resource security [2]. These features make its governance more than a technical disposal problem. It is also an institutional and behavioral problem in which regulatory pressure, enterprise compliance, and market-based resource utilization must be coordinated over time. Although China has promoted waste reduction, resource recycling, and zero-waste city construction under the broader policy agenda of green development and the Dual Carbon strategy, the gap between policy targets and actual governance outcomes remains substantial [3,4].
Phosphogypsum (PG), a major by-product of the phosphorus chemical industry, provides a typical and policy-relevant case for examining this problem [5]. Globally, historical PG stockpiles have exceeded 6 billion tons, and China, as one of the world’s largest phosphate producers, faces particularly severe pressure from both legacy accumulation and newly generated waste [6,7]. Existing studies report that China’s accumulated PG stockpile has reached approximately 870 million tons, and this problem is also spatially concentrated [8]. More than 80% of China’s PG production is located in the Yangtze River Economic Belt (YREB), especially in Hubei, Guizhou, Sichuan, and Yunnan, where phosphate mining and phosphorus chemical industries are heavily clustered. As a result, PG governance in the YREB is not only a regional environmental task, but also a key component of national ecological security and industrial sustainability [9].
The difficulty of PG governance lies in the fact that no single actor can complete the governance process independently. Contemporary consensus holds that modern environmental governance emphasizes interaction and cooperation among multiple stakeholders [10], specifically among local governments (LGs), waste-generating enterprises (WGEs), and waste-utilizing enterprises (WUEs), to overcome cooperation and conflict issues arising from disparities in resources, information, and interests among different entities [11]. LGs are responsible for setting incentive policies, enforcing environmental regulation, and bearing political accountability for governance failures. WGEs decide whether to invest in proactive treatment or maintain only a low level of compliance, depending on expected costs, subsidies and penalties. WUEs determine whether to enter the resource recovery market, a decision affected by technology maturity, market demand, entry costs, and policy support. In practice, these three actors often face misaligned incentives. Stronger regulation may increase compliance pressure but also raise fiscal and administrative burdens. WGEs may prefer passive compliance when treatment costs are certain and resource recovery benefits remain uncertain. WUEs may hesitate to enter the market when feedstock quality, supply stability, and downstream product markets are not yet reliable. These interactions help explain why illegal disposal, insufficient treatment capacity, and weak resource-utilization participation still appear despite repeated policy intervention [12].
Existing research has improved understanding of ISW and PG governance from several angles, including regulatory policy, resource utilization technology, enterprise compliance, and circular economy transition [13,14]. However, three issues remain insufficiently addressed. First, many studies identify important external determinants of governance performance, but pay less attention to how different actors strategically respond to these determinants. Second, existing evolutionary game studies often model stakeholder interaction through objective payoffs, leaving limited room for subjective risk perception. Third, although prospect theory (PT) has been introduced into environmental behavior research, its connection with the institutional and technological conditions of PG governance remains underdeveloped. In this setting, actors do not simply compare objective costs and benefits. They perceive subsidies, penalties, treatment costs, market-entry risks, and accountability losses differently under uncertainty.
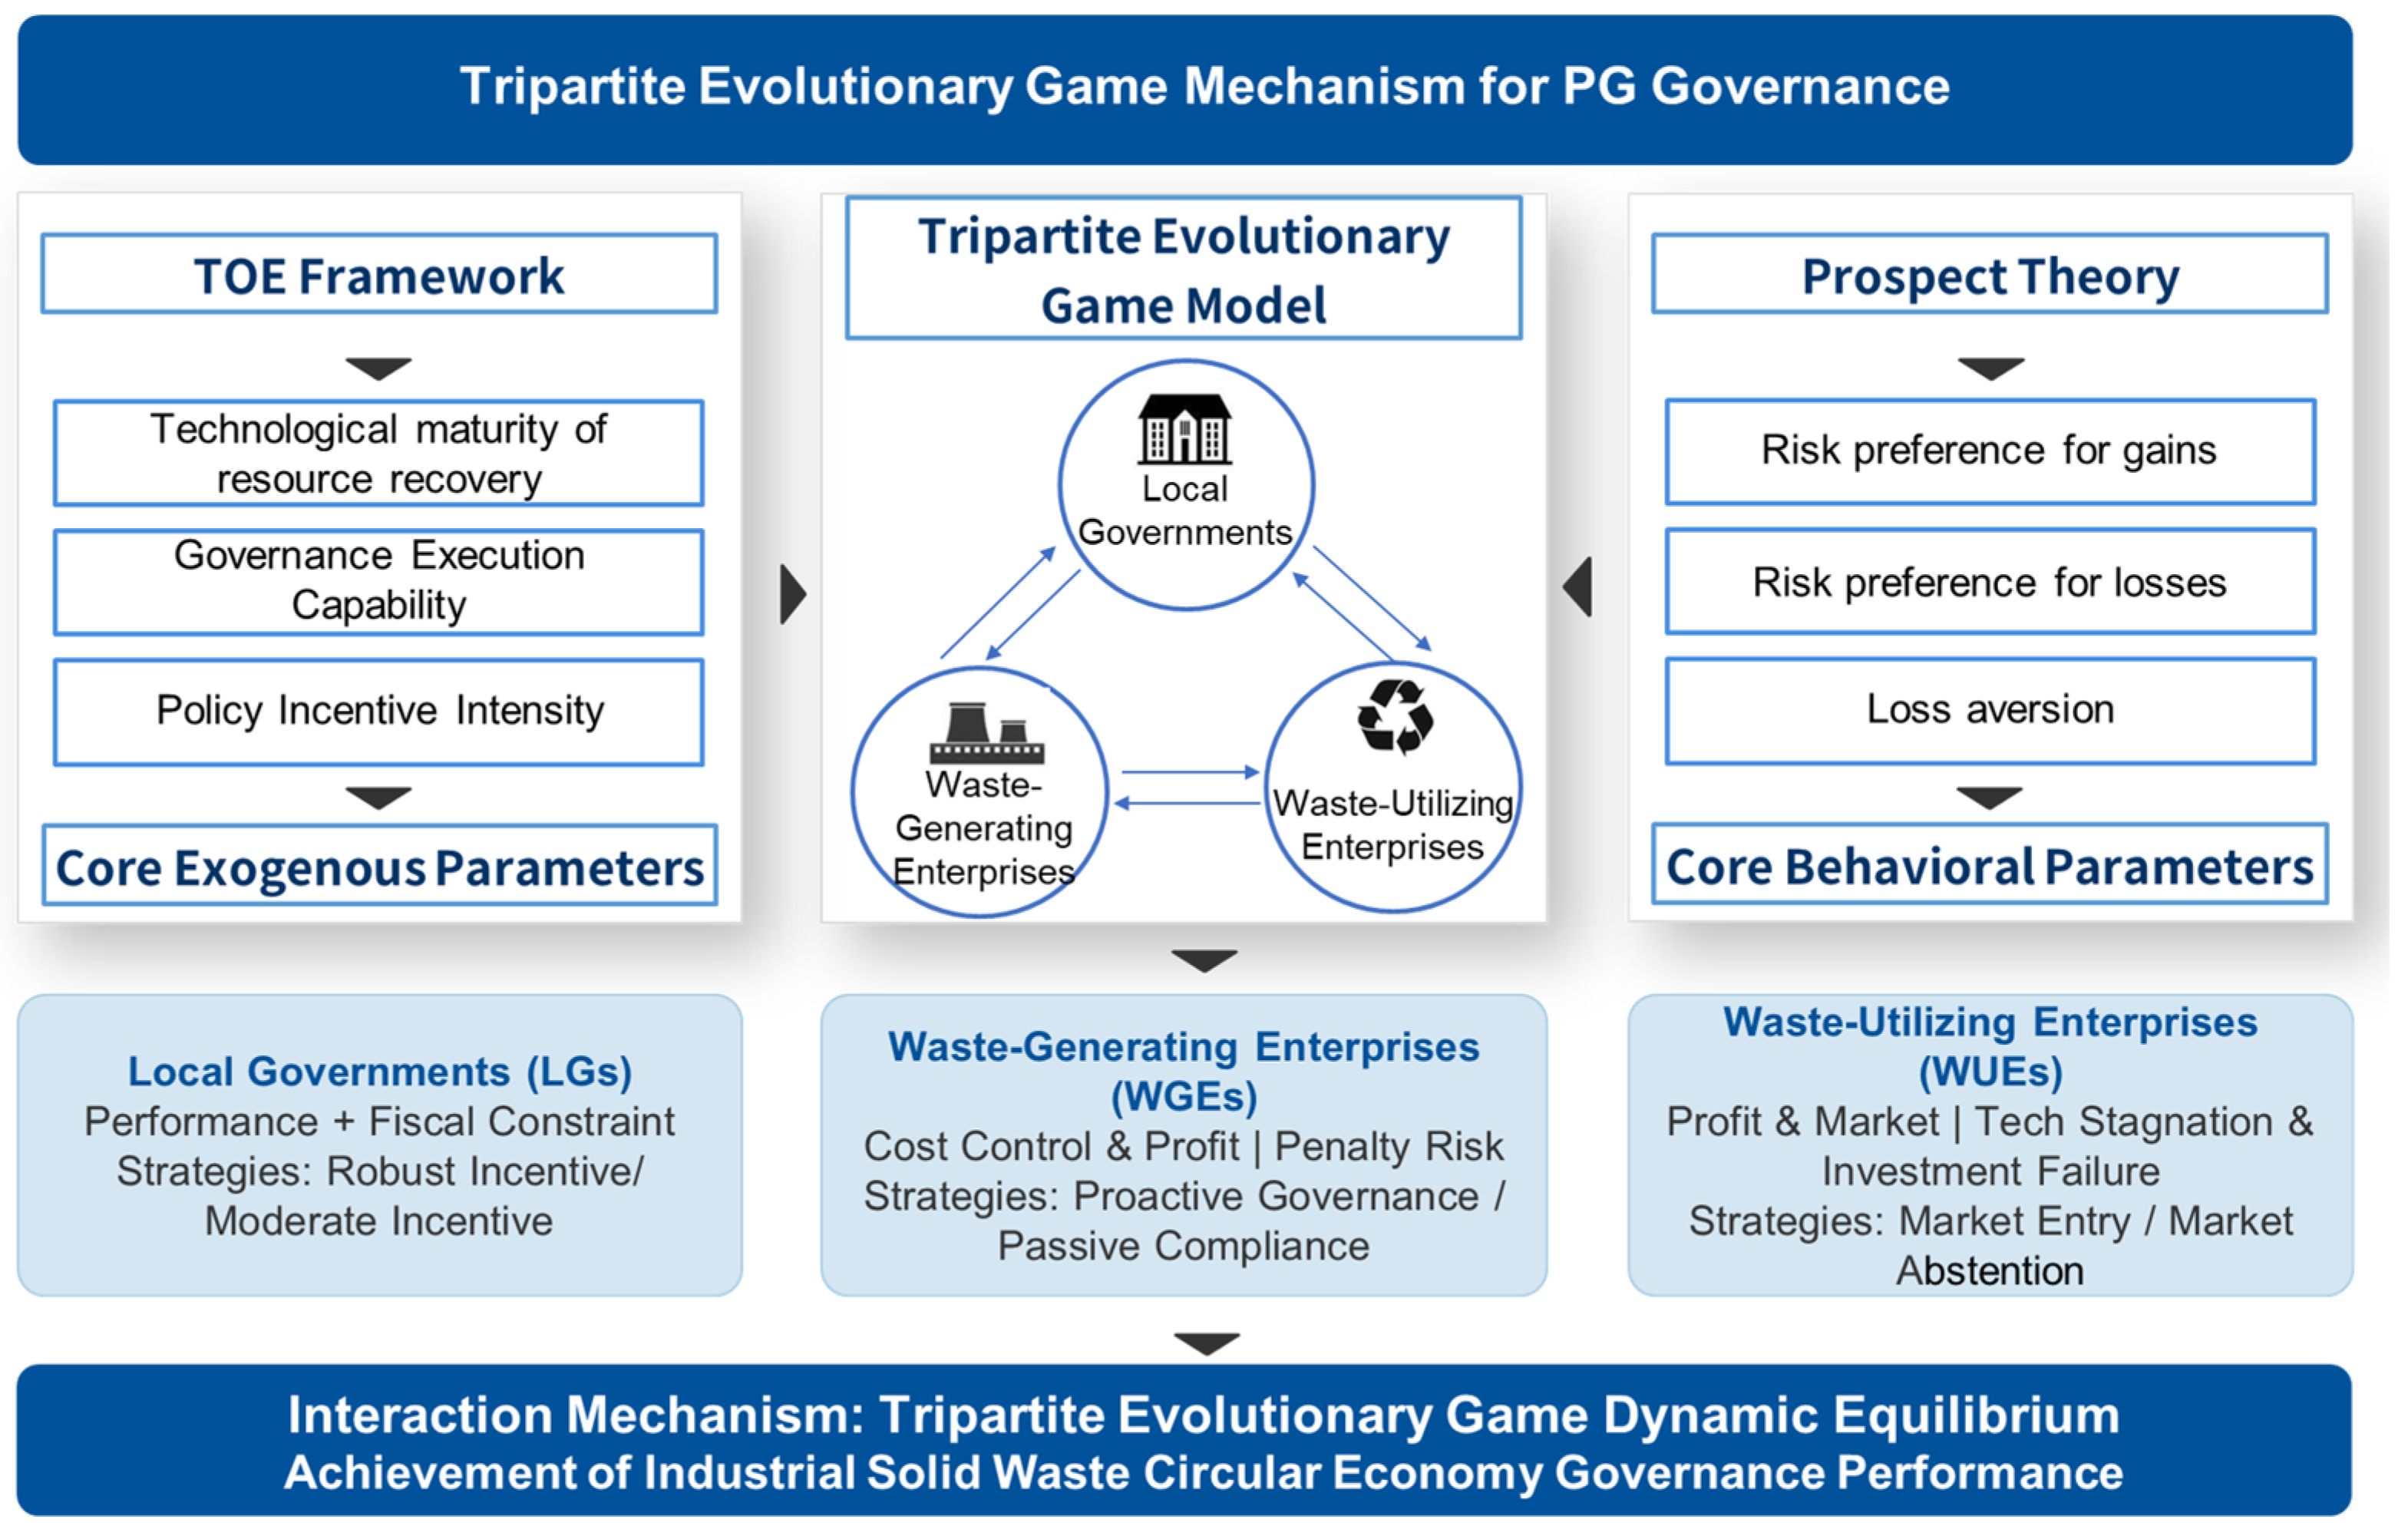
To address this gap, this study extends existing evolutionary game studies on solid waste governance by incorporating PT to model how perceived gains, perceived losses, and loss aversion shape the behavioral dynamics of the LGs, WGEs, and WUEs in PG governance. The technology–organization–environment (TOE) perspective is used in a limited and instrumental sense. It is not treated as a complete explanatory framework or an additional theoretical layer. Instead, it helps identify the contextual parameters that structure the game: policy incentive intensity, enterprise governance effort, and resource-utilization technology maturity. PT is used to transform objective gains and losses into perceived payoffs, while evolutionary game theory (EGT) models the dynamic adjustment of stakeholder strategies over time.
This study makes three main contributions:
  • It develops a behavioral game framework for PG governance that links policy incentives, enterprise governance input, and resource-utilization technology maturity with the perceived payoffs of three interdependent actors;
  • It examines how changes in core situational and behavioral parameters may shift the system from low-level compliance toward more stable collaborative governance;
  • This study anchors the simulation in Guizhou Province, a policy-salient PG governance case within the YREB. This case-based calibration strengthens the empirical plausibility of the parameter settings and allows the simulation results to be interpreted within a concrete provincial governance context.

2. Literature Review

2.1. Contextual Determinants of ISW Governance: The Limited Role of the TOE Perspective

Research on ISW governance has long emphasized the importance of technological capacity, organizational response, and external policy conditions. The TOE perspective is widely used to examine how technological innovation and adoption are shaped by the interaction between technical attributes, organizational characteristics, and the external environment [15]. In environmental governance studies, this perspective has been applied to issues such as green technology adoption, digital environmental management, waste reduction technologies, and circular economy practices [16,17]. These studies show that environmental governance outcomes are rarely determined by a single factor. Instead, they emerge from the combined effects of technology availability, enterprise capability, regulatory pressure, and market conditions.
The TOE perspective is useful for identifying the external conditions that shape ISW governance, but its explanatory scope remains limited for the purposes of this study. The TOE perspective is primarily a classificatory and diagnostic tool. It helps organize external determinants, but it does not explain how different stakeholders adjust their strategies when they face conflicting incentives, uncertain returns, or regulatory pressure. This limitation is particularly relevant to PG governance, where LGs, WGEs, and WUEs respond to the same policy and technological context in different ways. Similar external conditions may therefore produce different governance outcomes [18]. For this reason, this study uses the TOE perspective in a limited sense: it informs the selection of key situational parameters, including policy incentive intensity, enterprise governance effort, and resource-utilization technology maturity. The strategic adjustment mechanism itself is modeled through evolutionary game analysis.

2.2. Strategic Interaction in Waste Governance: Insights from Evolutionary Game Theory

EGT has become an important tool for analyzing multi-stakeholder conflicts in waste management and environmental governance. Unlike static optimization models, EGT allows researchers to examine how boundedly rational actors adjust their strategies through repeated interaction. It has been used to study ISW recycling, resource utilization, management transitions, cooperation strategy selection, and public–private collaboration in environmental governance [19,20,21,22]. In these models, government intervention is often treated as a central driver of system evolution.
Existing EGT studies provide a strong basis for analyzing the interaction among LGs, WGEs, and WUEs. They show that the stability of a collaborative governance system depends on the balance between governance costs, resource recovery benefits, subsidies, penalties, and reputational effects [23,24]. However, many models still rely on objective payoff assumptions. They typically assume that actors evaluate costs and benefits in a consistent and fully comparable way. This assumption is restrictive in PG governance. WGEs may overreact to immediate treatment costs while underestimating long-term regulatory risks. WUEs may be reluctant to enter the resource recovery market when technology adaptation costs are uncertain. LGs may balance regulatory performance against fiscal pressure and accountability risks. These behavioral features suggest that a purely objective payoff structure may not adequately capture the decision environment faced by the three actors.

2.3. Perceived Gains and Losses: The Role of Prospect Theory

PT provides a behavioral foundation for modeling decisions under risk and uncertainty. It argues that decision-makers evaluate gains and losses relative to a reference point, rather than responding only to final wealth or objective utility. Loss aversion, diminishing sensitivity, and asymmetric responses to gains and losses can therefore affect strategic choices [25]. In environmental governance, this perspective is useful because stakeholders often face uncertain policy enforcement, uncertain market returns, and irreversible investment costs. For example, enterprises may prefer short-term economic gains even when non-compliance increases the risk of future penalties or reputational losses [26]. Governments may also adjust policy intensity when the perceived cost of intervention differs from the perceived loss of governance failure [27].
Recent studies have introduced PT into evolutionary game models to examine incentive mechanisms and cooperation stability [28]. These studies suggest that risk preference parameters and loss aversion coefficients can significantly affect cooperation willingness and equilibrium outcomes. Increasing the perceived loss associated with non-cooperative behavior, reducing the perceived benefit of opportunistic choices, and strengthening the perceived value of rewards and penalties may all improve the stability of collaborative governance [29]. Nevertheless, PT has not been fully connected with the contextual determinants of PG governance. Many applications focus on individual behavioral bias or a single decision scenario, while paying less attention to how psychological perception interacts with policy incentives, enterprise governance effort, and technology maturity in a multi-agent governance system.

2.4. Research Gaps and Analytical Positioning

The literature points to three unresolved issues. First, studies using the TOE framework clarify the external conditions of ISW governance, but they do not sufficiently explain how stakeholders adjust their strategies under those conditions. Second, EGT studies capture dynamic interaction, but many still rely on objective payoff structures and do not fully reflect perceived gains and losses under uncertainty. Third, PT-based studies explain behavioral bias, but they are often insufficiently embedded in the practical governance context of ISW and PG resource utilization.
This study addresses these gaps by assigning each analytical component a distinct function. The TOE perspective is used to identify the situational parameters that shape the game, including policy incentive intensity, enterprise governance effort, and technology maturity. PT is used to transform objective cost–benefit items into perceived payoffs, thereby reflecting bounded rationality and loss aversion. EGT provides the dynamic structure through which LGs, WGEs, and WUEs adjust their strategies over time. In this way, the study does not simply combine three theories in parallel. Instead, it builds a layered analytical logic in which contextual conditions enter the payoff structure, perceived payoffs shape strategic preference, and repeated interaction determines evolutionary stability.
This layered framework further clarifies why similar policy and technological conditions may lead to different governance outcomes once perceived gains, perceived losses, and loss aversion are considered. It therefore extends existing evolutionary-game studies of solid waste governance by linking external governance conditions with subjective payoff evaluation and dynamic strategic adjustment in the specific context of PG resource utilization.

3. Theoretical Framework and Model Formulation

3.1. A Prospect-Theoretic Game Model Informed by the TOE Perspective

Building on the research gaps identified above, this study develops a TOE-informed prospect-theoretic game framework to describe strategic interaction in PG governance. The first step is to translate the governance context into model parameters. From the technological dimension, resource-utilization technology maturity is denoted by ε. A higher level of ε indicates that PG can be transformed into usable products with lower adaptation barriers and greater market value. It therefore affects the expected revenue of WUEs and the treatment cost borne by WGEs. From the organizational dimension, the governance effort of WGEs is represented by θ, which captures the extent to which firms reduce treatment input under passive compliance relative to proactive governance. From the environmental dimension, government incentive intensity is represented by μ, indicating the relative strength of penalties and regulatory implementation under moderate incentives. These parameters are not introduced as independent explanatory blocks. They enter the payoff matrix directly and shape the cost–benefit conditions under which the three actors choose their strategies.
The second step is to account for subjective evaluation. In PG governance, stakeholders do not respond to objective payoffs in a purely rational or linear manner. LGs may be more sensitive to accountability losses than to equivalent performance gains. WGEs may overvalue immediate cost savings and undervalue uncertain long-term benefits. WUEs may hesitate to enter the resource-utilization market when technology adaptation costs and market returns are perceived as risky. To capture this behavioral feature, objective gains and losses are transformed through the PT value function. The gain and loss sensitivity coefficients, α and β, describe diminishing sensitivity in the gain and loss domains, while λ represents the degree of loss aversion. Through this transformation, each payoff item in the game is evaluated as perceived utility rather than as a simple objective amount.
Figure 1 summarizes the logic of the framework. It connects the external governance environment with boundedly rational decision-making, and also prepares the analytical basis for the payoff matrix and replication dynamic equations developed in the following sections. Within this framework, the three stakeholders face different but connected decision problems. LGs choose between robust and moderate incentive strategies by weighing governance performance, regulatory costs, fiscal burdens, and accountability risks. WGEs choose between proactive governance and passive compliance according to treatment costs, resource recovery benefits, subsidies, penalties, and the perceived consequences of insufficient treatment. WUEs decide whether to enter the resource-utilization market by comparing expected resource recovery revenue with technology-adaptation costs and potential losses from market abstention. The interdependence of decision-making is the reason why a tripartite evolutionary game is needed after the TOE-informed and PT-based payoff structure has been specified.

3.2. Model Assumptions and Strategic Setup

According to the theoretical framework, the following assumptions are proposed:
Assumption 1.
LGs, WGEs, and WUEs are all bounded rational. This interdependency, which is full of uncertainty and non-symmetric information. Under circumstances of incomplete information, every agent dynamically carries out adjustments to its strategy on the basis of observed behaviors of other individuals, therefore aiming to maximize its own perceived utility.
Assumption 2.
The perceived value function of PT is adopted:
v Δ π i = Δ π i ,   Δ π i 0 λ Δ π i β ,   Δ π i < 0
where  Δ π i  means profit and loss relative to the reference point  π 0 = 0 . To simplify model derivation and numerical simulation for this repeated long-term PG governance game, we fix the probability decision weight function to 1 [30,31]. Thinking of the stable interaction scenarios, the core focus of this study lies in the value function characteristics including loss aversion and diminishing sensitivity to gains and losses, rather than subjective distortion of event occurrence probabilities.
Assumption 3.
LGs adopt a robust incentive (G1) strategy with probability   x [ 0 , 1 ] . Under G1, LGs bear full regulatory costs   C 0   and obtain governance performance benefits   D . They provide subsidies   B 1   to proactive WGEs and   B 2   to market-entering WUEs, while imposing a penalty   F   on non-compliant WGEs. Alternatively, with probability   1 x , they implement moderate incentives (G2) characterized by incentive intensity   μ ( 0 , 1 ) . Under G2, regulatory costs andpenalty enforcement are reduced to   μ C 0   and   μ F , respectively. However, it also triggers comprehensive governance performance losses   H   due to perceived governance inadequacy.
Assumption 4.
WGEs select proactive waste governance strategies (W1) with probability   y [ 0 , 1 ] , undertaking full waste treatment costs  C 1 to secure resource recovery revenue  R 1 . When opting for passive compliance (W2) strategies, they put effort  θ ( 0 , 1 ) , lowering costs to  θ C 1 while gaining short-term benefit  R 4 .
Assumption 5.
WUEs enter the resource recovery market (M1) with probability   z [ 0 , 1 ] , incurring a technology-adaptation cost  ( 1 ε ) C 2 , while obtaining resource recovery revenue  ε R 2 , where  ε ( 0 , 1 ) . Their participation also improves the compatibility between PG supply and resource-utilization capacity, thereby reducing the effective governance cost of proactive WGEs from  C 1  to  ( 1 ε ) C 1  through technological spillovers and standardized utilization channels. Conversely, WUEs choose market abstention (M2) with probability 1 − z, which leads to market-abstention loss  ε L 2 . This loss captures both unrecoverable pre-entry investments, such as technology development, equipment adaptation, and certification costs, and the unrealized opportunity value of resource recovery, policy support, and market expansion.
All parameters and descriptions are shown in Table 1.

3.3. Stability Analysis of Tripartite Evolutionary Equilibrium

Given the defined perceived payoff matrix for all strategy profiles (Table 2), we now derive the expected prospect values for LGs, WGEs and WUEs under different strategies. The expected prospect value for LGs adopting a G1 strategy  U 11 , a G2 strategy  U 12 , and the overall mean expected prospect value  U 1 are respectively given by:
U 11 = V D + V C 0 + V B 1 + V B 2 y z + V D + V C 0 + V F + V B 2 1 y z + V D + V C 0 + V B 1 y 1 z + V μ C 0 + V ( H ) + V μ F 1 y 1 z
U 12 = V μ C 0 + V ( H ) y z + V ( H ) + V μ C 0 + V μ F 1 y z + V μ C 0 + V ( H ) y 1 z + V μ C 0 + V ( H ) + V μ F 1 y 1 z
U 1 = x U 11 + 1 x U 12
The expected prospect value for WGEs adopting a W1 strategy  U 21 , a W2 strategy  U 22 , and the overall mean expected prospect value  U 2 are respectively given by:
U 21 = V 1 ε C 1 + V R 1 +   V ( B 1 ) x z + V R 1 + V C 1 + V B 1 x 1 z + V R 1 + V 1 ε C 1 1 x z + V R 1 + V C 1 1 x 1 z
U 22 = V R 4 + V F + V θ C 1 x z + V R 4 + V F + V θ C 1 x 1 z + V R 4 + V μ F + V θ C 1 1 x z + V R 4 + V μ F + V θ C 1 1 x 1 z
U 2 = y U 21 + 1 y U 22
The expected prospect value for WUEs adopting a M1 strategy  U 31 , a M2 strategy  U 32 , and the overall mean expected prospect value  U 3 are respectively given by:
U 31 = V ε R 2 + V B 2 + V 1 ε C 2 x y + V ε R 2 +   V B 2 + V 1 ε C 2 x 1 y + V ε R 2 + V ( 1 ε ) C 2 1 x y + V ε R 2 + V ( 1 ε ) C 2 1 x 1 y
U 32 = V ε L 2 x y + V ε L 2 x 1 y + V ε L 2 1 x y + V ε L 2 1 x 1 y
U 3 = z U 31 + 1 z U 32
Building upon the expected prospect values  ( U 1 , U 2 , U 3 ) , we now derive the replicator dynamics governing strategic adaptation among agents. This system of differential equations captures how strategy probabilities  ( x ,   y ,   z ) evolve based on perceived payoff differentials.

3.3.1. Stability Conditions for LGs

The replicator dynamics for LGs are:
F x = d x d t = x U 11 U 1 = x 1 x U 11 U 12 = x 1 x [ V D + V C 0 V H V μ C 0 + y V B 1 + z V B 2 + V ( 1 μ ) F y V ( 1 μ ) F ]
Based on the stability criterion of differential equations, an equilibrium x constitutes an evolutionarily stable strategy (ESS) when  F x = 0 and  d F ( x ) d x < 0 . Solving  F x = 0 for a given z, the three critical points are:
x * = 0 ,   x * = 1 ,   y * = V D + V ( 1 μ ) C 0 V H + z V B 2 + V ( 1 μ ) F V B 1 + V ( 1 μ ) F
Case 1: y = y, all values of x represent stable states.
Case 2: 0 < y < y d F ( x ) d x x = 0 > 0 d F ( x ) d x x = 1 < 0 , implying x = 1 is the ESS. In this case, when WGEs exhibit low W1 probability (y < y), LGs choose to adopt the G1 strategy to mitigate risk.
Case 3: y > y > 0,  d F ( x ) d x x = 0 < 0 d F ( x ) d x x = 1 > 0 , implying x∗ = 0 is the ESS. High WGEs’ compliance (y > y) triggers LGs’ loss aversion, favoring the G2 strategy to reduce costs.

3.3.2. Stability Conditions for WGEs

The replicator dynamics for WGEs are:
F y = d y d t = y U 21 U 2 = y 1 y U 21 U 22 = y 1 y [ V μ F + V 1 θ C 1 + V R 1 V R 4 + x V B 1 z V ε C 1 x V ( 1 μ ) F ]
The ESS y∗ requires  F y = 0 and  d F ( y ) d y < 0 . Solutions are:
y * = 0 ,   y * = 1 ,   z * = V μ F + V 1 θ C 1 + V R 1 V R 4 + x V B 1 x V ( 1 μ ) F ε V C 1
Case 1: z = z, all values of y are stable.
Case 2: 0 < z < z d F ( y ) d y y = 0 < 0 d F ( y ) d y y = 1 > 0 , implying y = 0 is the ESS.
Case 3: z > z > 0,  d F ( y ) d y y = 0 > 0 d F ( y ) d y y = 1 < 0 , implying y∗ = 1 is the ESS. High WUEs’ participation (z > z) triggers risk-seeking behavior, incentivizing WGEs to move toward the W2 strategy.

3.3.3. Stability Conditions for WUEs

The replicator dynamics for WUEs are:
F z = d z d t = z U 31 U 3 = z 1 z U 31 U 32 = z 1 z [ V ( 1 ε ) C 2 + V ε R 2 V ε L 2 + x V B 2 ]
The ESS z requires  F z = 0 and  d F ( z ) d z < 0 .
Solutions   are :   z * = 0 ,   z * = 1 ,   x * = V 1 ε C 2 V ε R 2 + V ε L 2 V B 2
Case 1: x = x, all values of z represent stable states.
Case 2: When  V 1 ε C 2 V ε R 2 + V ε L 2 < 0 d F ( z ) d z z = 0 < 0 d F ( z ) d z z = 0 > 0 , z = 0 is the ESS. Low expected net benefits trigger loss aversion, causing WUEs to choose the M2 strategy.
Case 3: When  V 1 ε C 2 V ε R 2 + V ε L 2 > 0 ,   d F ( z ) d z z = 0 > 0 d F ( z ) d z z = 1 < 0 , z = 1 is the ESS. Positive net benefits induce risk-seeking behavior, incentivizing WUEs to choose the M1 strategy.

3.4. Stability Strategies of Equilibrium Points in Evolutionary Game Model

To investigate the evolutionarily stable states among the three agents, we solve the system F(x) = 0, F(y) = 0, and F(z) = 0. In multi-population evolutionary games, ESS profiles must be pure strategies [32], as mixed strategies cannot satisfy the strict Nash equilibrium requirement under asymmetric payoff structures. We analyze the stability of eight pure strategy equilibrium points: E1(0,0,0), E2(1,0,0), E3(0,1,0), E4(0,0,1), E5(1,1,0), E6(1,0,1), E7(0,1,1), E8(1,1,1). Employing Lyapunov’s first method by indirect approach [33], we construct the Jacobian matrix J of the replicator dynamics system:
J = F x x F x y F x z F y x F y y F y z F z x F z y F z z
To compute the Jacobian matrix for stability analysis, we substitute the replicator dynamics equations into the partial derivative framework, thereby populating each element of the Jacobian matrix with the corresponding dynamic terms. An equilibrium is asymptotically stable if all eigenvalues have strictly negative real parts [34]. The complete eigenvalue calculations  λ 1 , λ 2 , λ 3 for all eight equilibria are summarized in Table 3.
Theoretically, the ESS conditions imply three possible evolutionary phases of PG governance.
Phase 1: When  V D + V 1 μ C 0   V H + V 1 μ F < 0 V μ F + V 1 θ C 1 + V R 1 V R 4 < 0 V 1 ε C 2 + V ε R 2 V ε L 2 < 0 E 1 ( 0 , 0 , 0 ) is the ESS. Proved by the instability of  E 2   E 3   E 4 , separate actions taken by each agent could not break the system’s existing inertia. Therefore, under this phase, the system is locked in a stable but not ideal condition of (G2, W2, M2) strategy combination.
Phase 2: When  V D + V 1 μ C 0 + V B 1 + V B 2   V H < 0 V   μ F V 1 θ ε C 1 V R 1 + V R 4 < 0 ,   V ε L 2   V 1 ε C 2 V ε R 2 < 0   E 8   ( 1 , 1 , 1 ) is the ESS. LGs, WGEs and WUEs all change their strategies to the combination (G1, W1, M1).
Phase 3: When  V D + V ( 1 μ ) C 0 + V B 1 + V B 2   V H < 0 μ V F V 1 θ ε C 1 V R 1 + V R 4 < 0 V 1 ε C 2 V ε R 2 + V ε L 2 < 0 E   7 ( 0 , 1 , 1 ) is the ESS. This system evolves toward the equilibrium composed of (G2, W1, M1) strategy combination.

4. Results

4.1. Data and Parameter Setting

Numerical analysis in evolutionary game research can be conducted in two ways [28]. One approach calibrates the model directly from real-case data, while the other uses theoretically constrained parameter settings to explore how changes in key variables affect system evolution. Given the characteristics of PG governance, this study adopts a hybrid strategy. Guizhou is selected as a case-informed context because it faces substantial PG governance pressure and has introduced explicit policy instruments for PG disposal and utilization. Its large historical stockpile, output-linked disposal regulation, fiscal incentives, and emerging resource-utilization projects provide a policy-salient and information-rich basis for parameter setting. Specifically, observable parameters, such as subsidies, penalties, treatment costs, and market-entry costs, are calibrated with reference to Guizhou’s policy documents, industrial practices, and publicly available information. Prospect-theoretic cognitive parameters are set according to prior literature.
Parameters that are difficult to observe directly, including governance performance benefits, accountability losses, and market-abstention losses, are set according to theoretical payoff relationships and case-informed governance logic rather than direct accounting estimates. Specifically, D is set lower than the full regulatory and implementation cost C0, reflecting the fiscal burden of G1, but higher than H, reflecting the positive governance value of improved PG treatment. L2 is set with reference to the minimum opportunity loss associated with foregone utilization-promotion subsidies and unrealized ME benefits. These settings are intended to preserve the relative payoff relationships among strategies and maintain consistency with the Guizhou governance context, rather than to provide statistically estimated parameter values. Therefore, the simulation results should be interpreted primarily in terms of evolutionary direction, threshold patterns, and comparative sensitivity rather than exact numerical prediction.
The baseline values used in the main simulation are summarized in Table 4. Detailed calibration sources are provided in Appendix A. To maintain comparability within the payoff matrix, all values are expressed as comparable payoff units rather than direct accounting values. The numerical simulations are conducted in MATLAB R2024b. The initial strategy probabilities are set as (x0, y0, z0) = (0.5, 0.5, 0.5), indicating that the three actors have no dominant initial strategic preference.

4.2. Evolutionary Phases of PG Governance

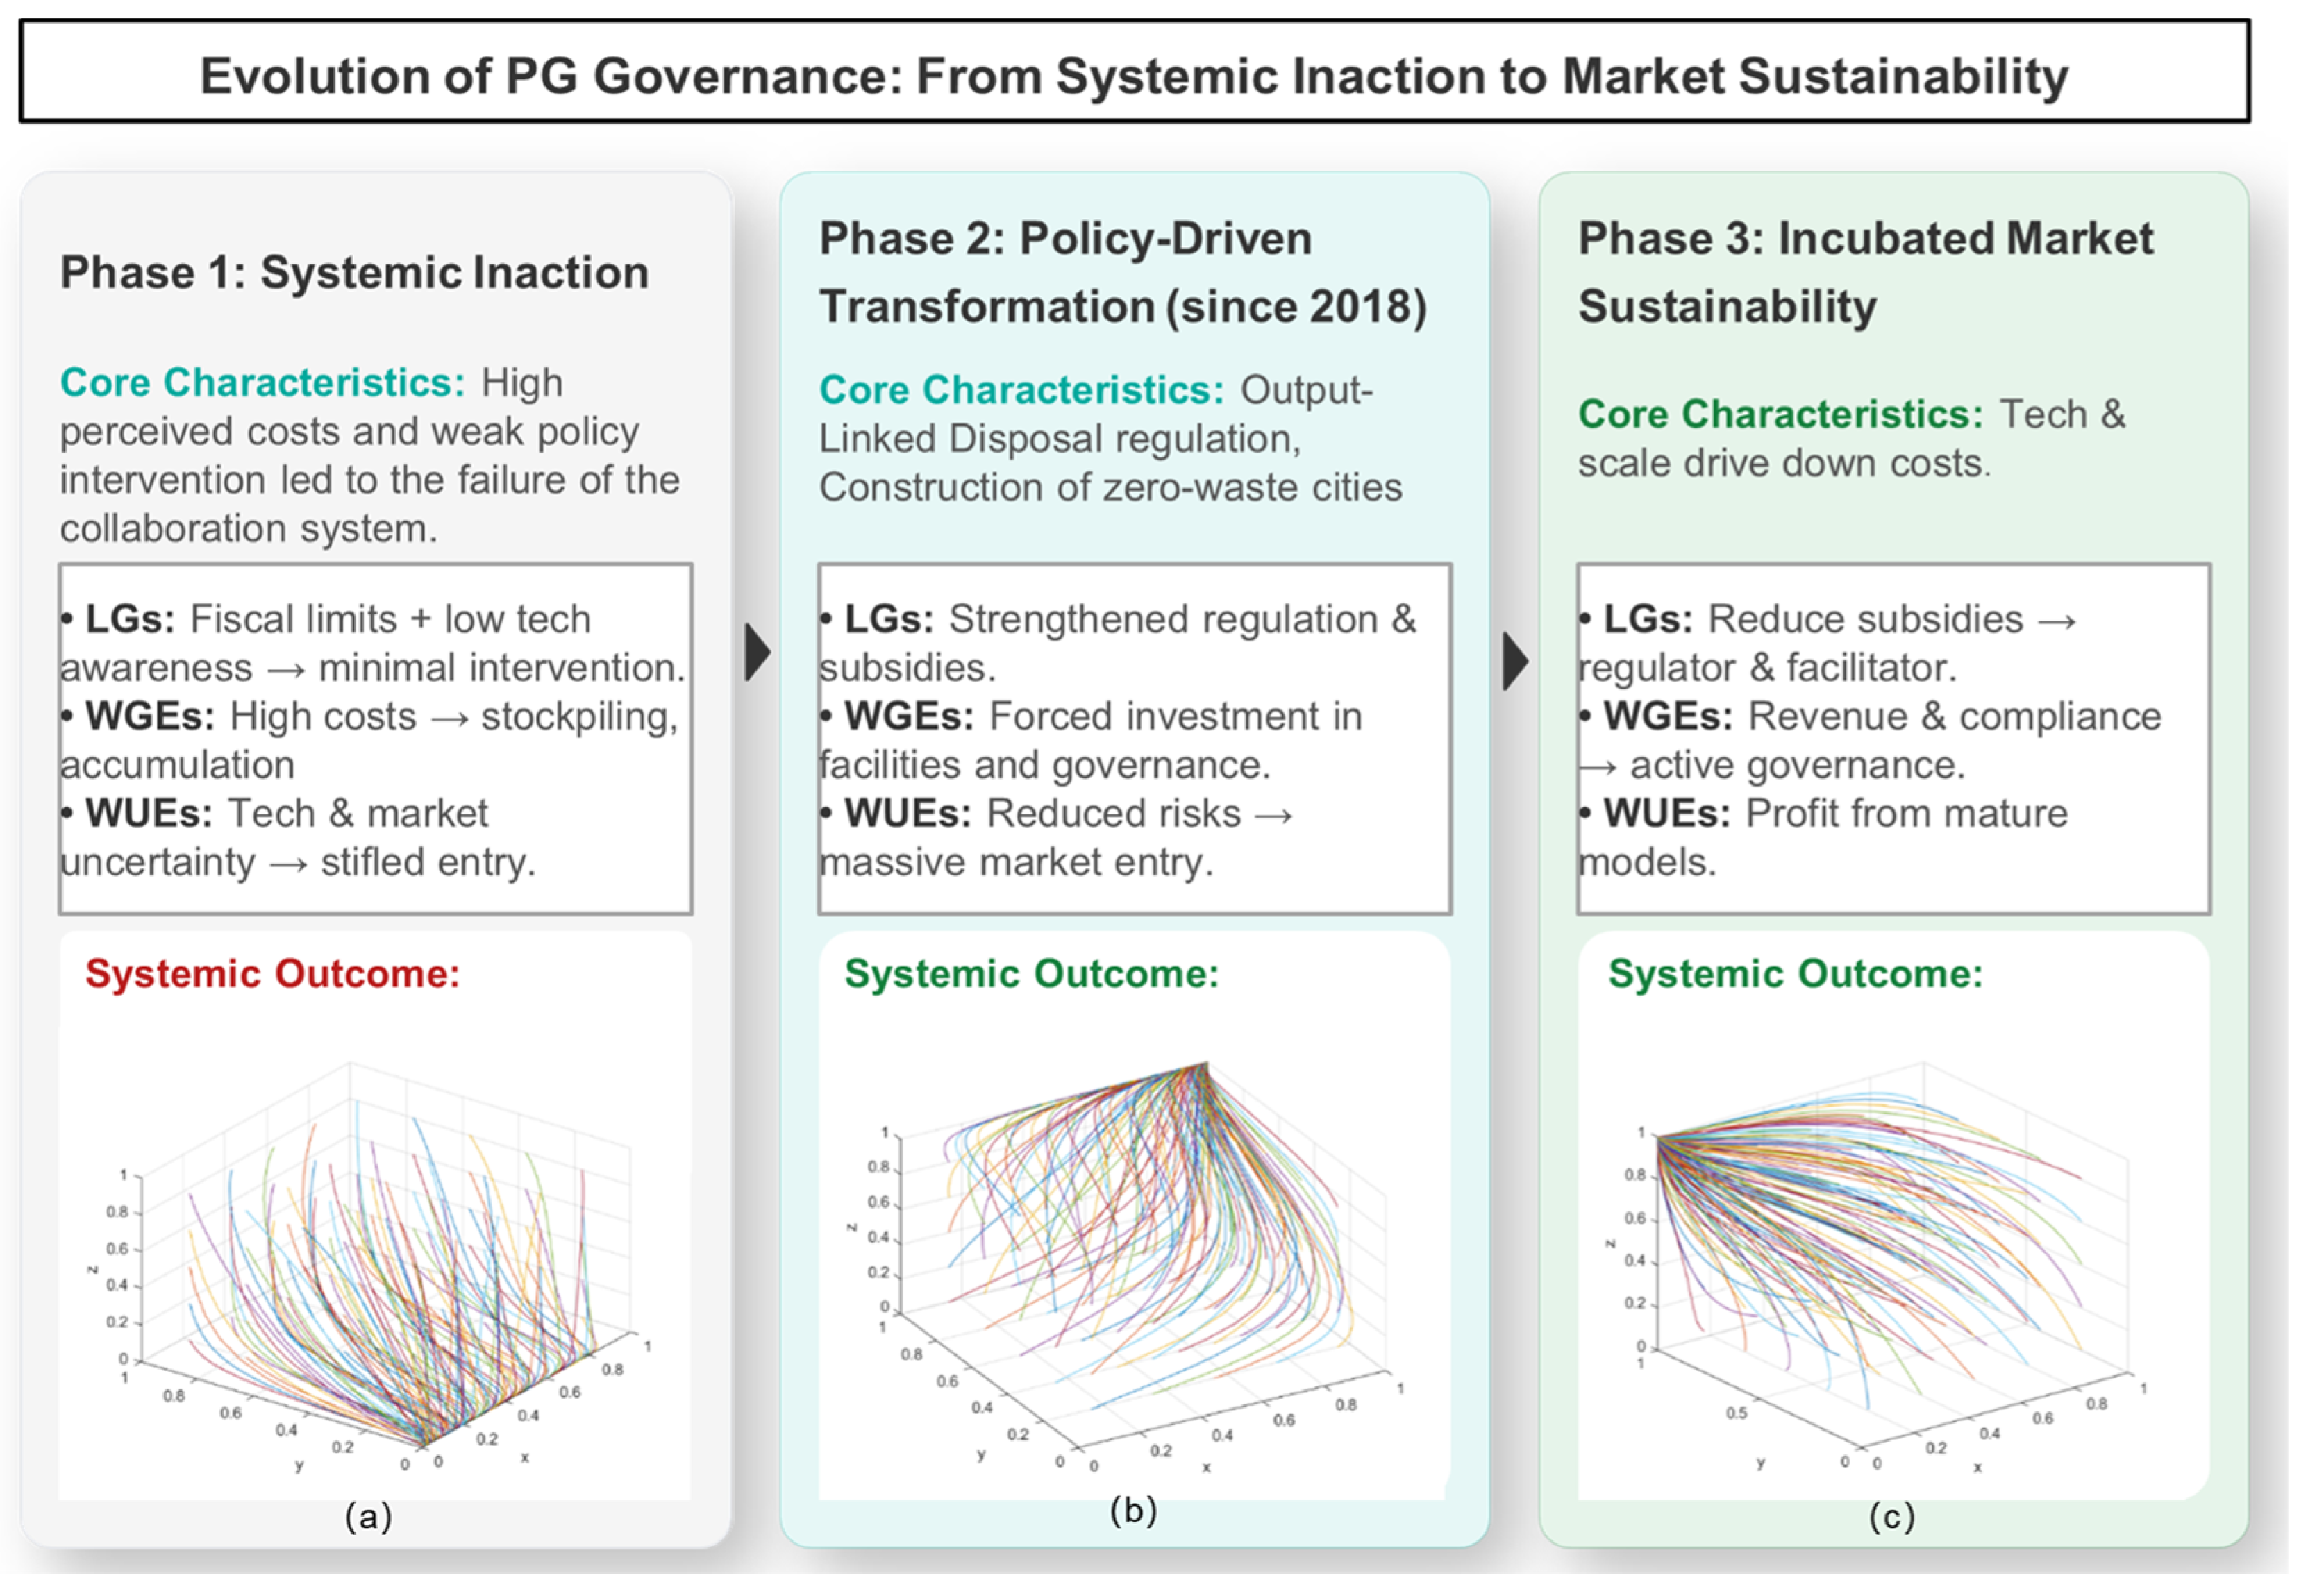
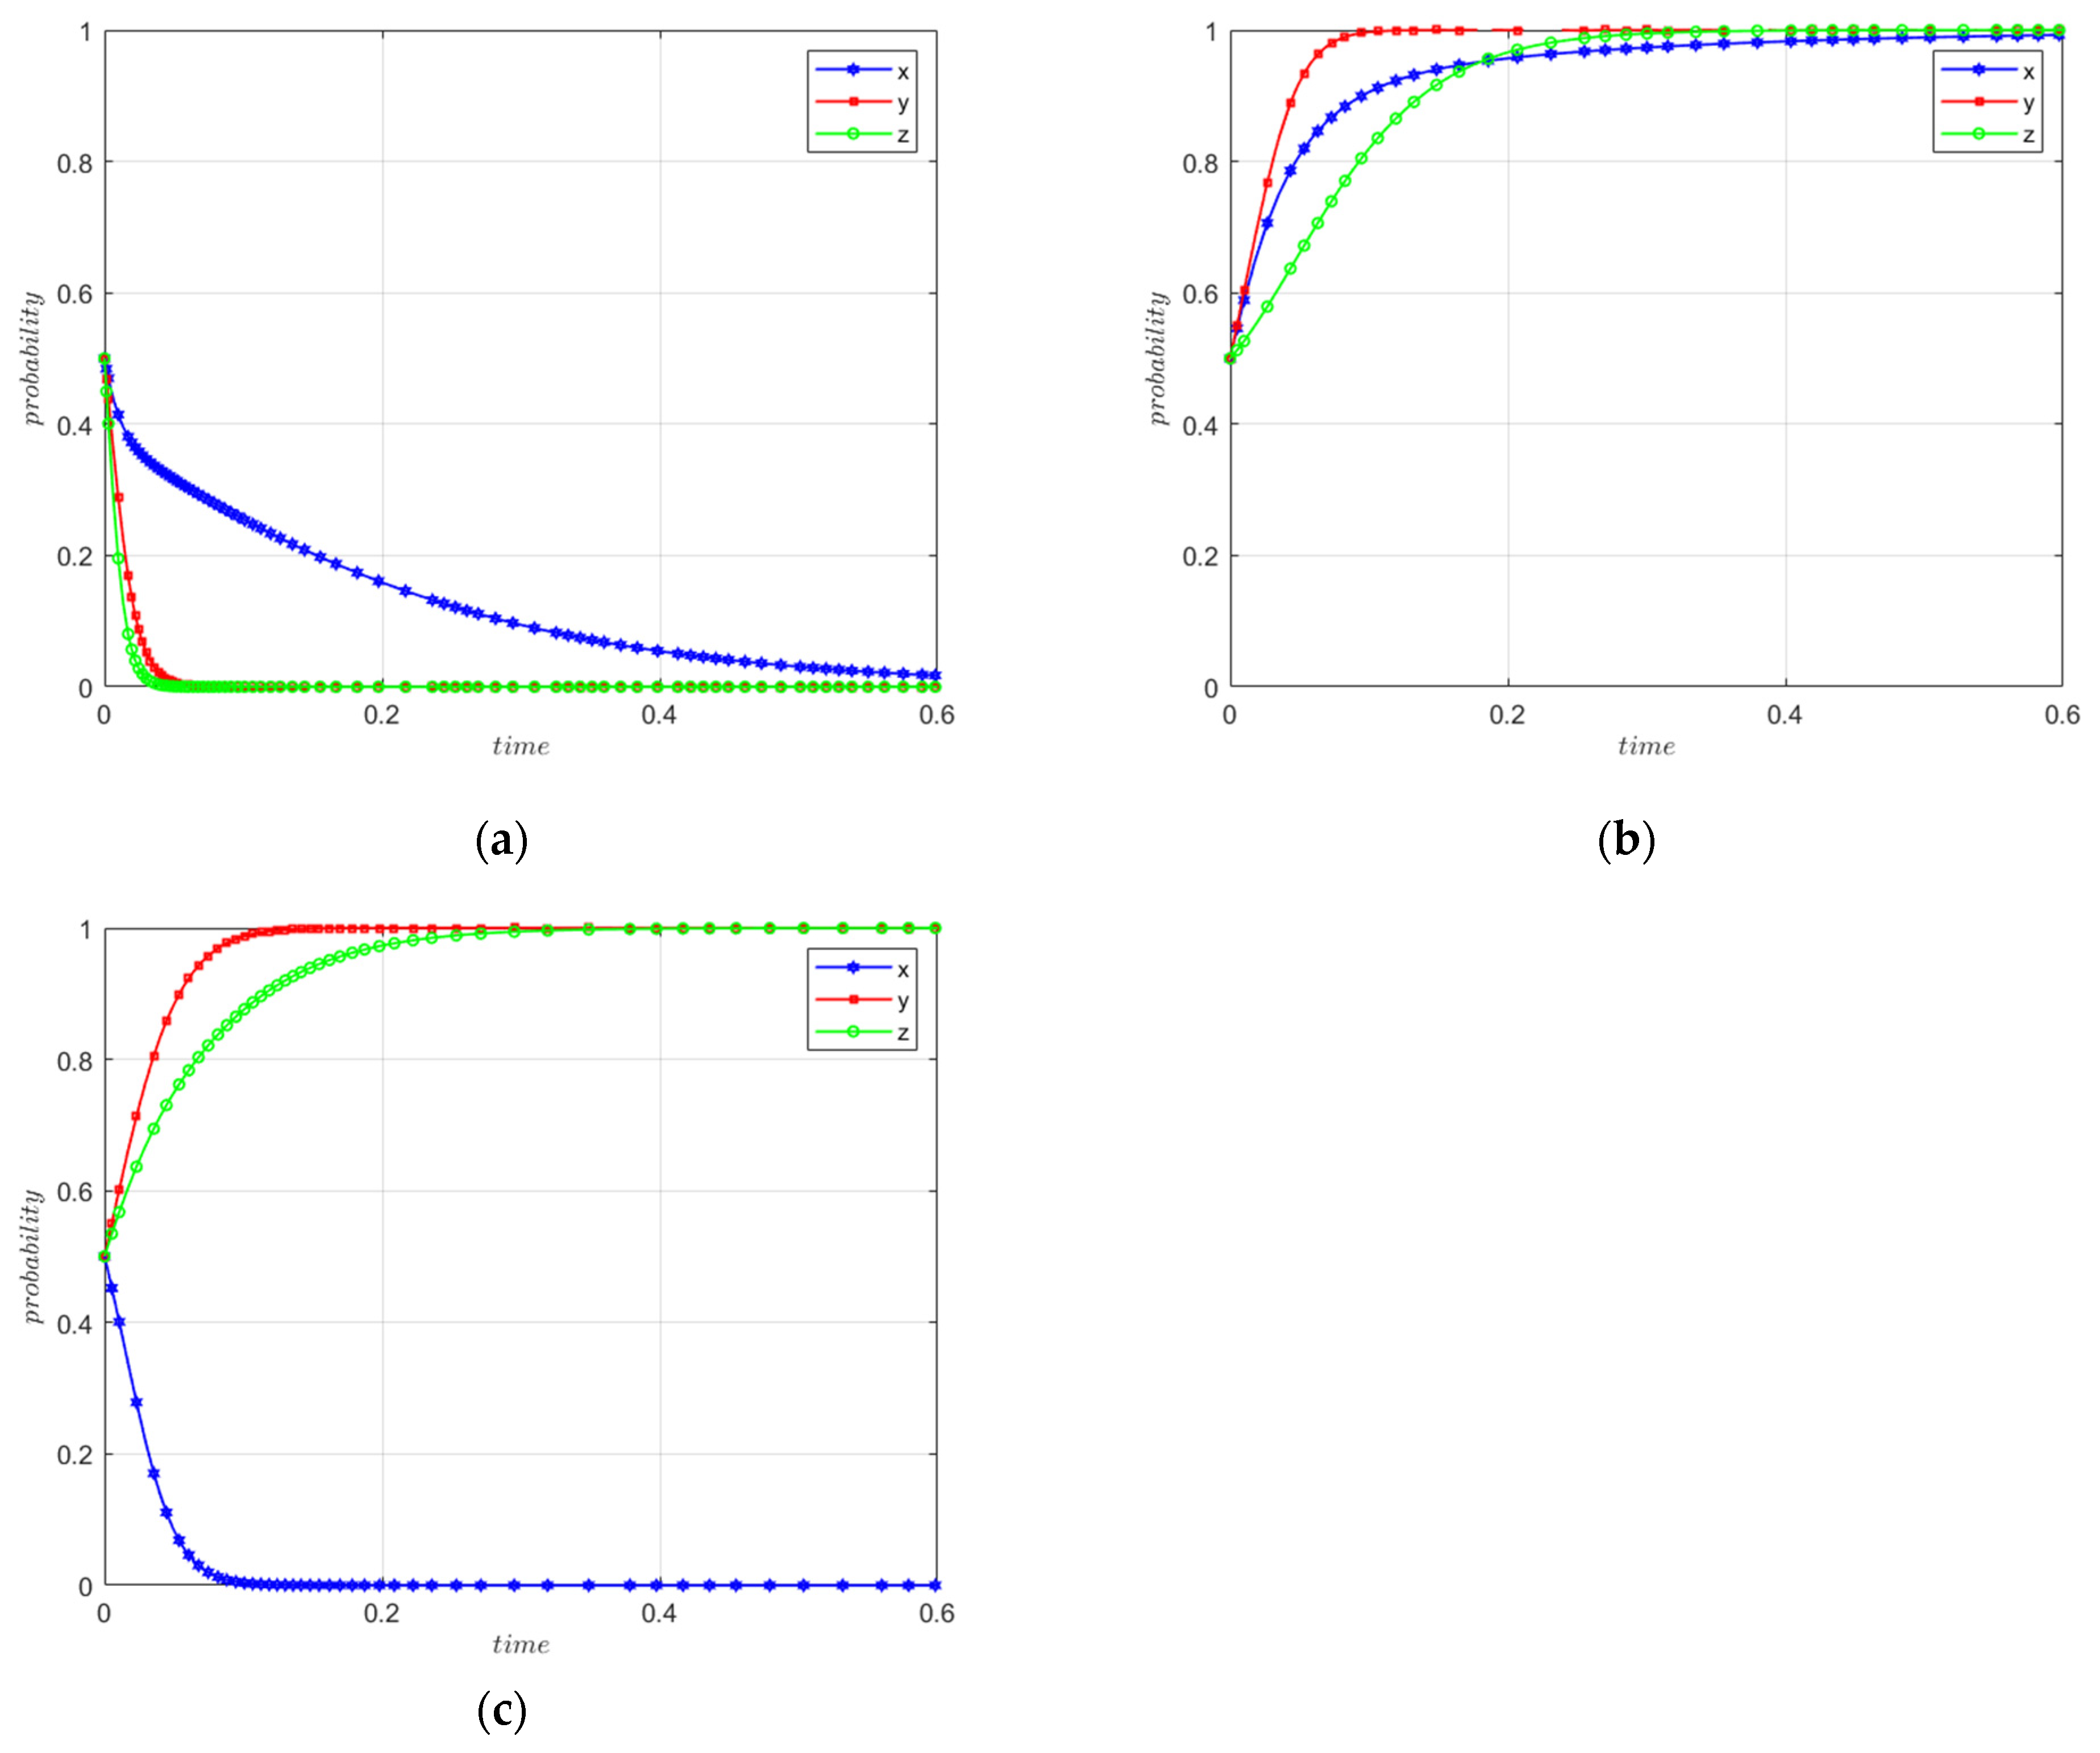
The equilibrium analysis identified three stable outcomes that were particularly relevant to the evolution of PG governance: systemic inaction, policy-driven transformation, and market-oriented sustainability. These outcomes provide stylized governance phases through which the strategic interaction among LGs, WGEs, and WUEs can be connected with observable changes in policy intensity, enterprise treatment effort, and resource-utilization technology. Figure 2 presents the initial evolutionary paths under three representative parameter settings.
Phase 1: Systemic Inaction under Nascent Institutional Conditions  ( E 1 ( 0 , 0 , 0 ) )
In the initial stage, the system was characterized by weak multi-stakeholder coordination. The parameter setting (μ = 0.1, θ = 0.1, ε = 0.1) represented low policy incentive intensity, weak enterprise governance input, and immature resource-utilization technology. This simulated trajectory is broadly consistent with the governance conditions observed in the YREB before 2017, when PG governance was associated with low utilization rates and frequent illegal disposal. At that time, unified and mandatory disposal regulations were still underdeveloped at both national and regional levels. LGs tended to adopt moderate supervision because of fiscal constraints and local industrial development concerns, which corresponds to the G2 strategy in the model. WGEs were mainly driven by short-term cost considerations and therefore tended to adopt W2 strategies. Meanwhile, technical barriers and immature resource-utilization markets weakened the expected return from market entry for WUEs.
The governance implication of this stage is that spontaneous market adjustment is unlikely to break the stagnation trap when policy incentives, enterprise treatment input, and technology maturity are all weak. Strong external intervention is therefore needed to help the system cross the initial threshold. This result is consistent with previous research [43] and further indicates that subjective risk perception can amplify the negative effects of unfavorable external conditions.
Phase 2: Policy-Driven Systemic Transformation  ( E 8 ( 1 , 1 , 1 ) )
When incentive intensity, enterprise governance input, and technology maturity increased to medium-high levels (μ = 0.8, θ = 0.6, ε = 0.55), the system moved toward an initially cooperative governance pattern. This stage corresponds to the policy-driven transformation of PG governance, especially after Guizhou linked phosphorus production quotas with waste disposal performance in 2018. Under the calibrated parameter setting, stronger policy incentives and improved utilization conditions changed the payoff structure for all three actors. LGs tended to adopt the G1 strategy and maintained a more active intervention role. WGEs shifted toward W1 because proactive governance helped them avoid penalties and obtain policy support. For WUEs, the improvement in technology maturity increased expected returns and reduced perceived entry risks, making M1 a more attractive strategy.
The convergence observed in this stage still depended heavily on sustained government intervention. If policy incentives were withdrawn before enterprise compliance and market participation became self-reinforcing, the system could return to a low-cooperation state [44]. This helps explain why subsidy and regulatory support often need to be maintained during the transition period rather than removed immediately after initial improvement.
Phase 3: Sustained Market-Driven Governance  ( E 7 ( 0 , 1 , 1 ) )
When government incentive intensity was reduced to a moderate level (μ = 0.3), while enterprise governance input and technology maturity remained relatively high (θ = 0.65, ε = 0.6), the system moved toward a self-reinforcing equilibrium. At this stage, LGs no longer relied on intensive financial intervention, but retained basic regulatory standards and enforcement capacity. This pattern corresponds to the G2 strategy in the model. WGEs continued to adopt W1 because treatment routines, compliance requirements, and scale-related benefits had gradually made proactive governance more cost-effective. WUEs also remained in the market as resource-utilization operations became more commercially viable. The resulting state can be interpreted as the desired long-term governance configuration.
This stage is consistent with the policy objective of building an endogenous coordination mechanism among regulation, enterprise responsibility, and market-based resource recovery. In practice, such a transition depends on more than the maturity of individual utilization technologies, such as cement retarders, gypsum boards, and underground backfilling. It also requires stable product standards, reliable demand, and resource-utilization channels that can absorb PG output on a sustained basis.
Taken together, the three simulations show a staged transition from low-level lock-in to government-led transformation and then to market-supported sustainability. The transition was not driven by any single parameter. Instead, it depended on the joint improvement of policy incentives, enterprise governance effort, and technology maturity. The comparison also clarifies the role of government intervention. Robust incentives are important for breaking early-stage inertia, but they are costly and may not be necessary once enterprise behavior and market participation become self-reinforcing. The ideal pathway is therefore not permanent high-intensity regulation, but a gradual shift from policy-driven correction to market-oriented collaborative governance. Different from most existing studies, this paper explores the evolution path after policy withdrawal.

4.3. Heterogeneous Evolutionary Trajectories Under Initial Scenarios

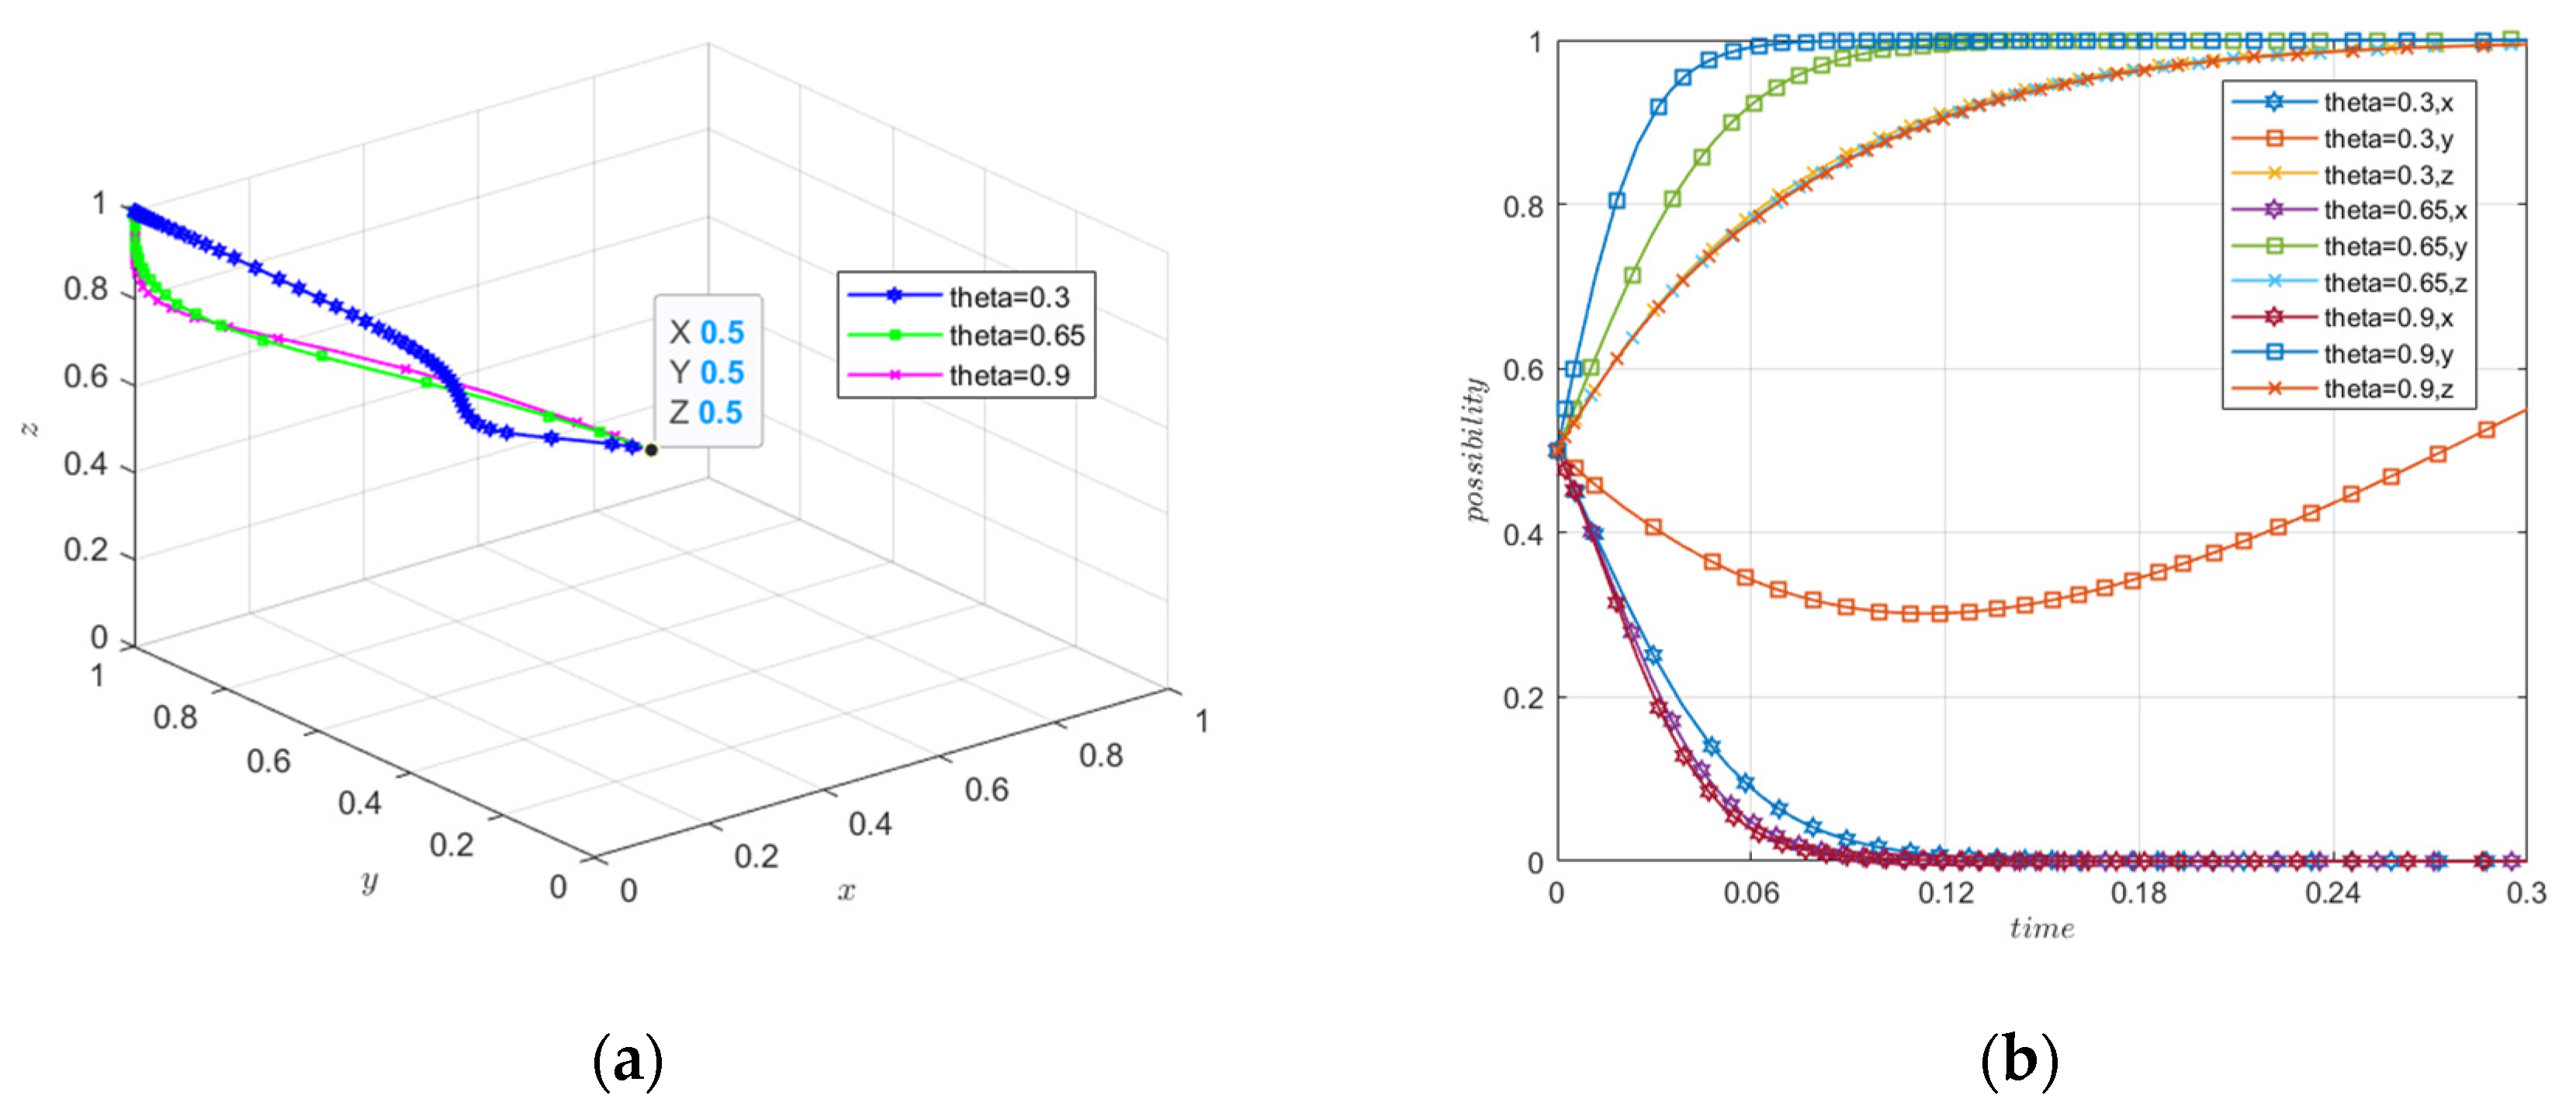
Figure 3 further compares the time-series trajectories of the three stakeholders under the three representative initial scenarios. Although all scenarios eventually converged to their corresponding stable equilibria, the speed and direction of adjustment differed across LGs, WGEs, and WUEs. This heterogeneity indicates that the three actors did not respond to contextual changes in the same way. Their adjustment paths were shaped by different cost structures, risk exposure, and dependence on external conditions.
In the systemic inaction scenario, all three strategy probabilities declined toward zero, but the decline was not synchronous. The M1 probability of WUEs, z, fell most rapidly, followed by the W1 probability of WGEs, y. The G1 probability of LGs, x, decreased more gradually. This pattern is consistent with the payoff structure of the model. When policy incentives, enterprise governance effort, and technology maturity are all weak, WUEs face high entry uncertainty and limited expected resource-utilization returns. Market abstention therefore becomes the fastest adjustment response. WGEs also move toward passive compliance, but their adjustment is slightly slower because they still face treatment obligations and potential regulatory pressure. LGs show the slowest decline, reflecting the fact that policy adjustment involves administrative inertia and fiscal considerations rather than an immediate exit from governance responsibility.
In the policy-driven transformation scenario, y rose first and reached a high level most quickly, while z approached one more gradually. This trajectory suggests that strengthened regulation and incentives first changed the payoff comparison faced by WGEs. Once penalties, subsidies, and treatment obligations became more salient, passive compliance quickly lost attractiveness. By contrast, WUEs needed more time to respond because market entry depends not only on policy support, but also on technology maturity, feedstock stability, and expected market returns. The result shows that policy pressure can rapidly reshape the behavior of WGEs, but the formation of a resource-utilization market requires a longer adjustment process.
In the market-oriented sustainability scenario, the trajectory is different from the previous two cases because x declined toward zero while y and z increased toward one. WGEs quickly stabilized around proactive governance, suggesting that active treatment had become more attractive than passive compliance under the given payoff structure. WUEs also maintained market entry, although their convergence was more gradual than that of WGEs. This slower adjustment is reasonable because WUEs still need to evaluate technology-adaptation costs, market revenue, and utilization capacity before committing to sustained participation.

4.4. Sensitivity Analysis

To examine the robustness and policy feasibility of E7(0,1,1), we varied key behavioral and situational parameters while holding the remaining parameters at baseline values. On this basis, we further explore the interaction effects between typical behavioral parameters and situational parameters.

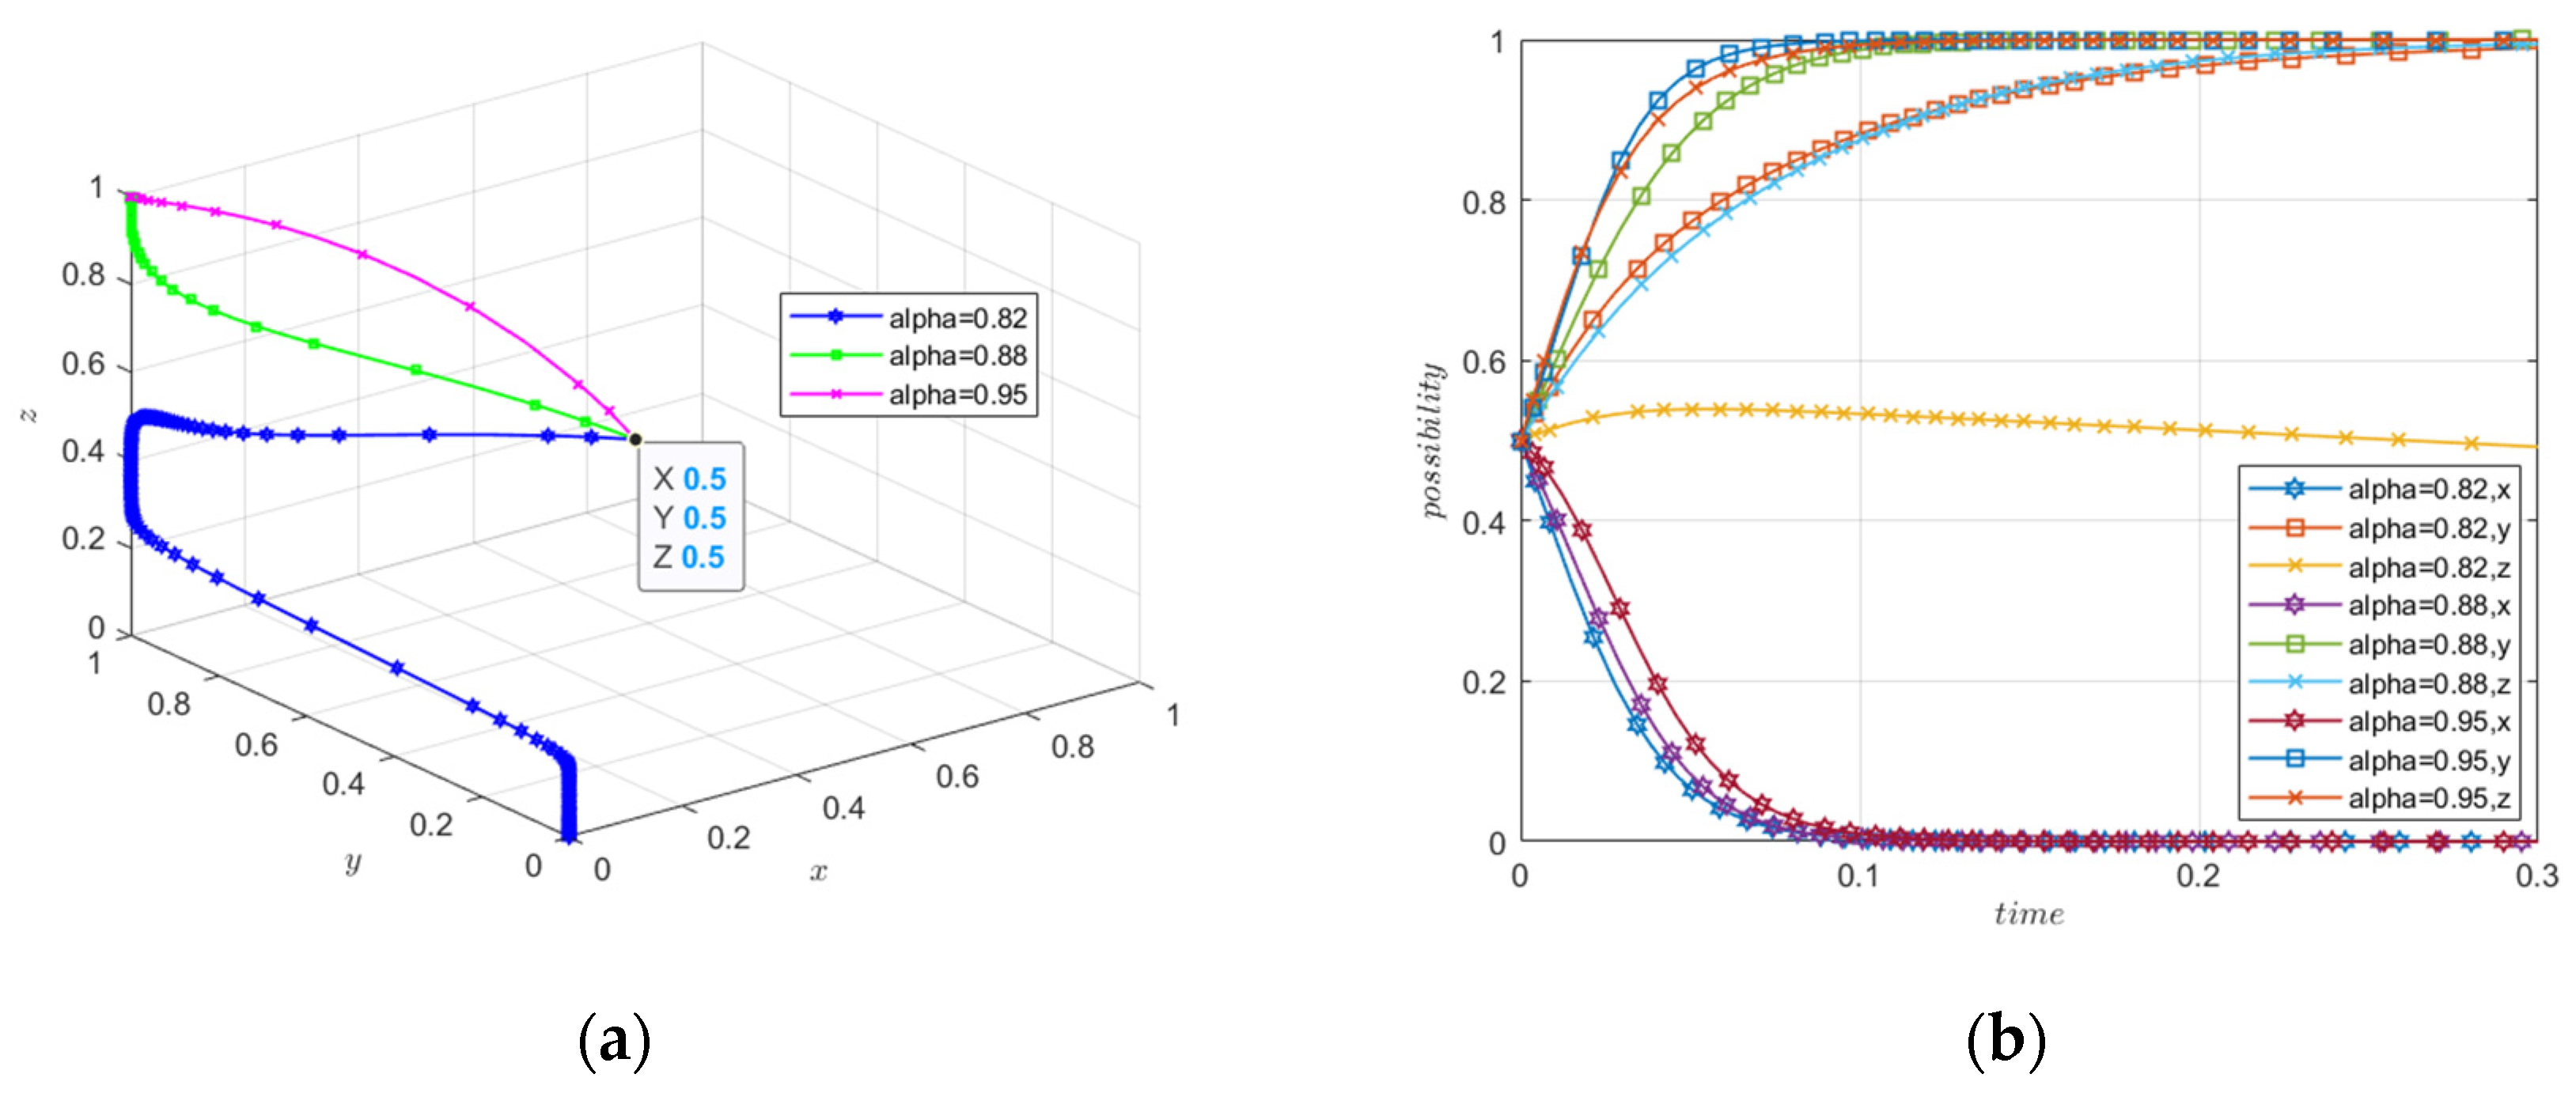
4.4.1. Sensitivity to the Gain Sensitivity Coefficient α

Figure 4 reports the effect of the gain sensitivity coefficient α on the evolutionary trajectories. In the prospect-theoretic payoff structure, α determines how strongly actors respond to gains. A higher value of α means that gains from subsidies, resource recovery, and market participation are perceived more sensitively. A lower value weakens the subjective weight of potential gains, even when the objective payoff structure remains unchanged. The simulation results revealed a threshold effect around α = 0.82. When α was set at 0.82, the system did not fully converge to the ideal market-oriented equilibrium. In particular, z remained substantially below one, indicating that perceived resource-utilization gains were not strong enough to support stable market participation. When α increased to 0.88, the system converged to E7(0,1,1). WGEs moved rapidly toward proactive governance, WUEs gradually strengthened market entry, and LGs reduced robust intervention as the market-oriented mechanism became more stable. A further increase to α = 0.95 accelerated convergence, especially for WGEs and WUEs. This suggests that once the perceived value of gains exceeds the threshold required for cooperation, higher gain sensitivity mainly shortens the transition process. The stakeholder trajectories also showed that α affected WUEs more strongly than WGEs. By contrast, LGs are influenced more indirectly.
These findings indicate that market-oriented PG governance cannot be sustained only by the existence of objective resource-utilization benefits. The benefits must also be sufficiently credible and salient to the actors who bear investment and treatment risks [27]. This threshold effect is consistent with Guizhou’s governance experience. Supported by local standards such as the Guizhou Technical Standard for Phosphogypsum Building Materials, the perceived gains from resource utilization grew stronger, enabling WUEs to commit to market entry more confidently. This helps explain why expectation management regarding gain-side incentives becomes more important after the system has moved beyond the initial stagnation stage.

4.4.2. Sensitivity to the Loss Sensitivity Coefficient β

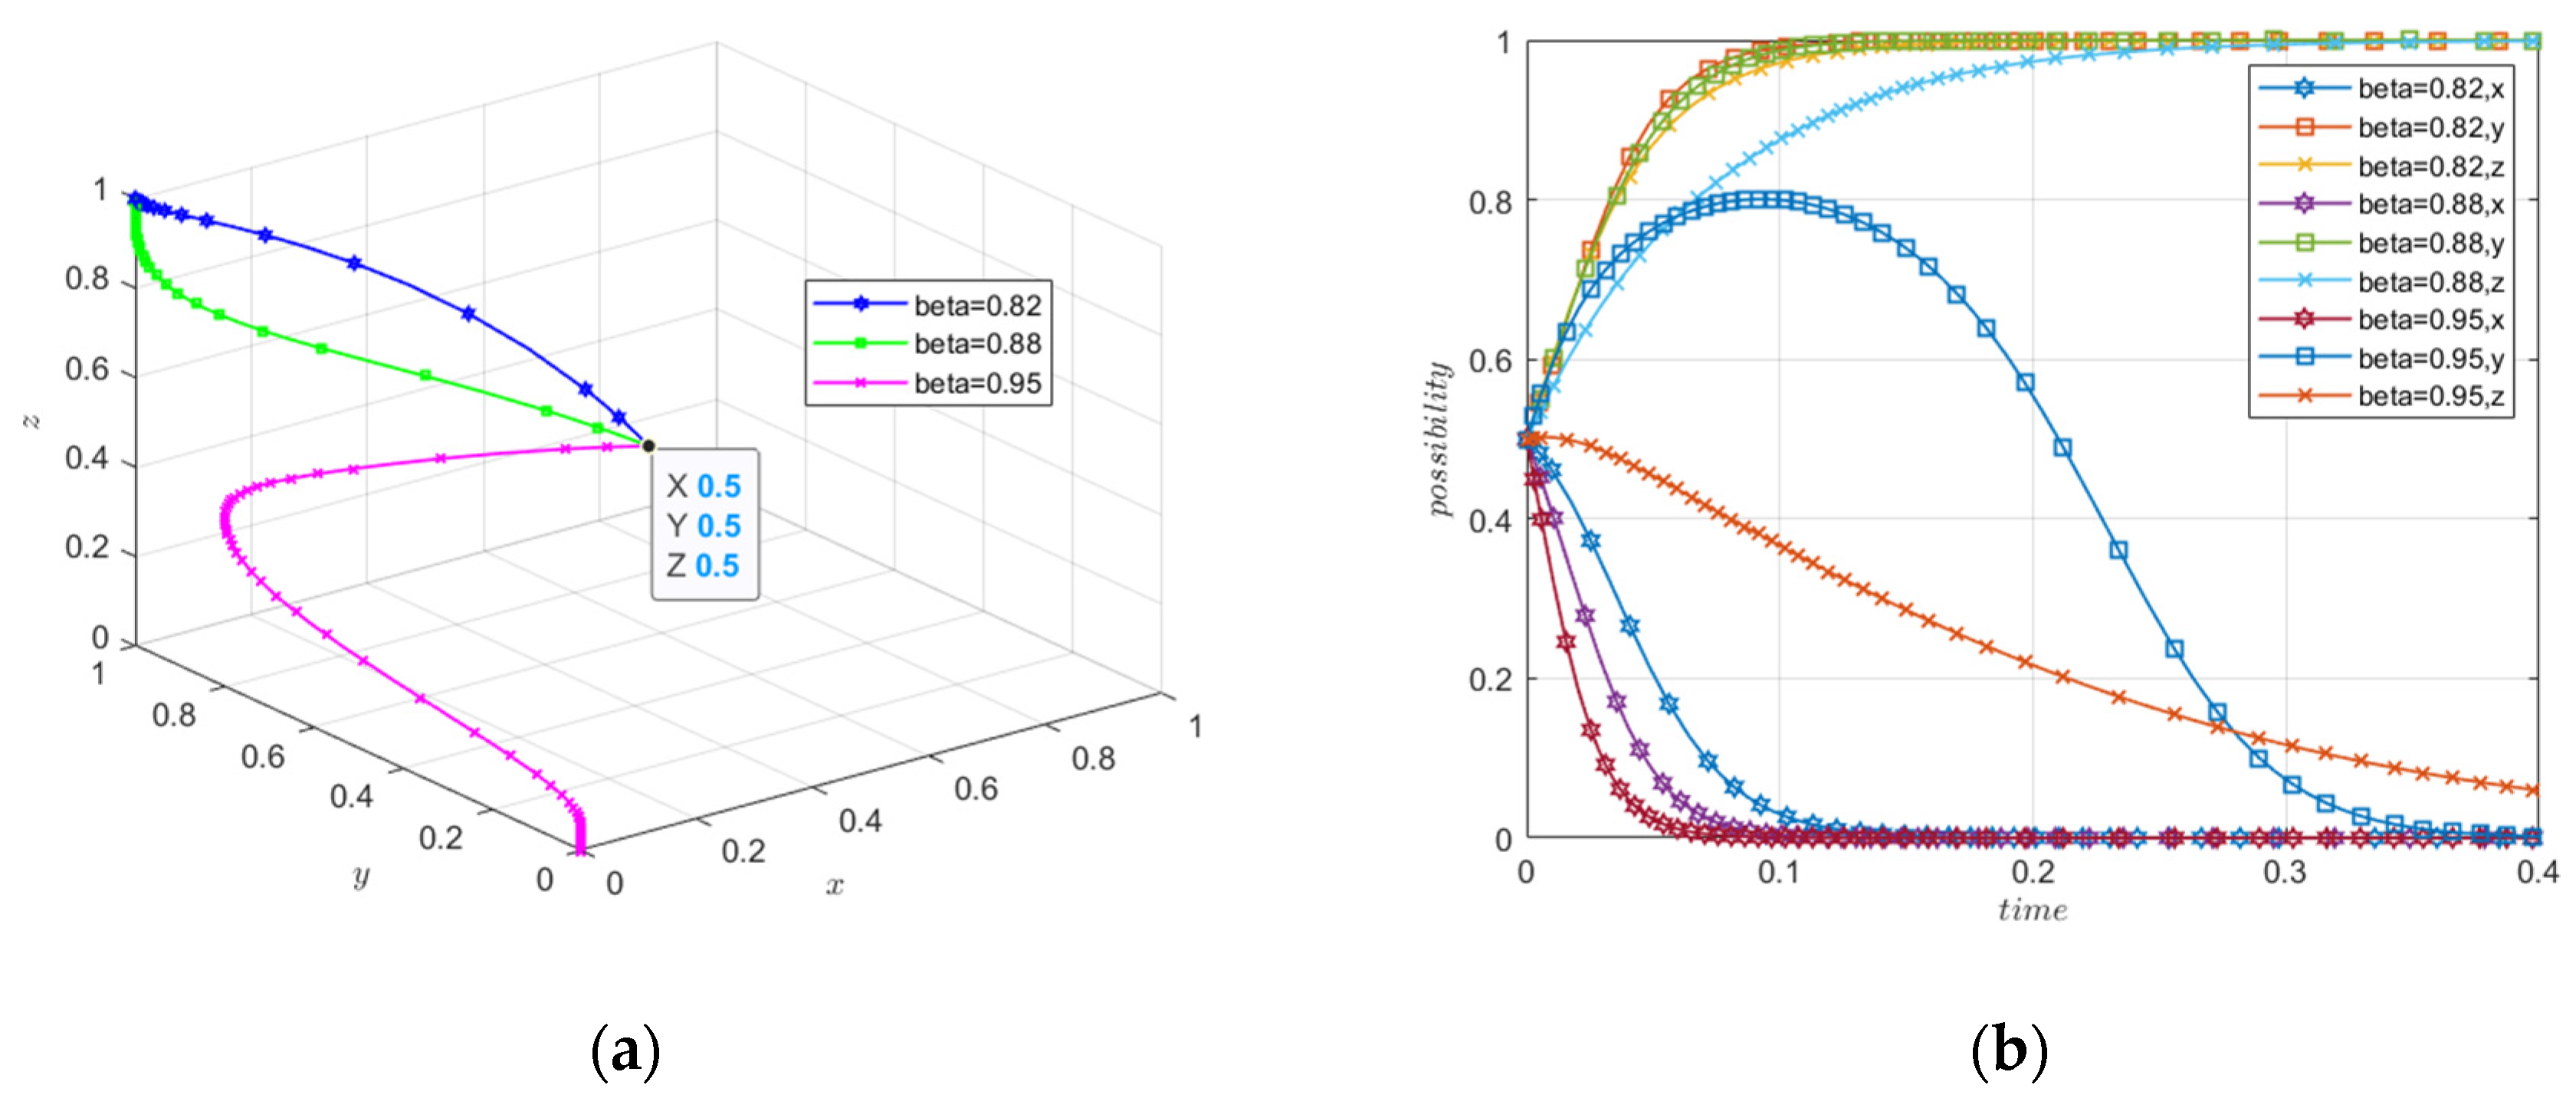
The second test examined the sensitivity of the system to the loss sensitivity coefficient β. In the prospect-theoretic value function, β determines how perceived losses change with the magnitude of objective losses. A higher β indicates that actors respond more strongly to increases in loss-related items, such as penalties, treatment failures, market-entry losses, and investment uncertainty. As shown in Figure 5, changes in β had a marked effect on both convergence direction and convergence speed. When β was set at 0.82 or 0.88, the system still converged to the market-oriented equilibrium E7(0,1,1). Under these two settings, LGs gradually reduced robust intervention, while WGEs and WUEs moved toward W1 and M1. The convergence under β = 0.88 was slower than that under β = 0.82, especially for WUEs, suggesting that stronger sensitivity to potential losses delays market participation even when the final equilibrium remains unchanged. Additionally, a different pattern appeared when β increased to 0.95. The system no longer maintained the ideal trajectory.
These results reveal a threshold effect in the loss domain. Moderate loss sensitivity does not necessarily prevent collaborative governance, but excessive loss sensitivity can destabilize the transition toward E7(0,1,1). The mechanism differs from the effect of α. A low gain sensitivity coefficient mainly weakens the attractiveness of cooperation, whereas a high loss sensitivity coefficient amplifies the perceived risks associated with cooperation. For WUEs, this risk comes from technology-adaptation costs and uncertain market returns. For WGEs, the risk is more indirect: once WUEs hesitate to enter the market, proactive governance loses part of its resource-utilization payoff. The practical implication is that stable PG governance requires not only stronger incentives, but also a reduction in perceived downside uncertainty. Frequent policy changes, unclear enforcement standards, or unstable market-access rules may increase perceived exposure to losses [45], even when objective subsidies are available. A more predictable regulatory environment, clearer compliance pathways, and more stable demand for PG-based products in Guizhou can reduce this risk perception and help maintain the market-oriented equilibrium.

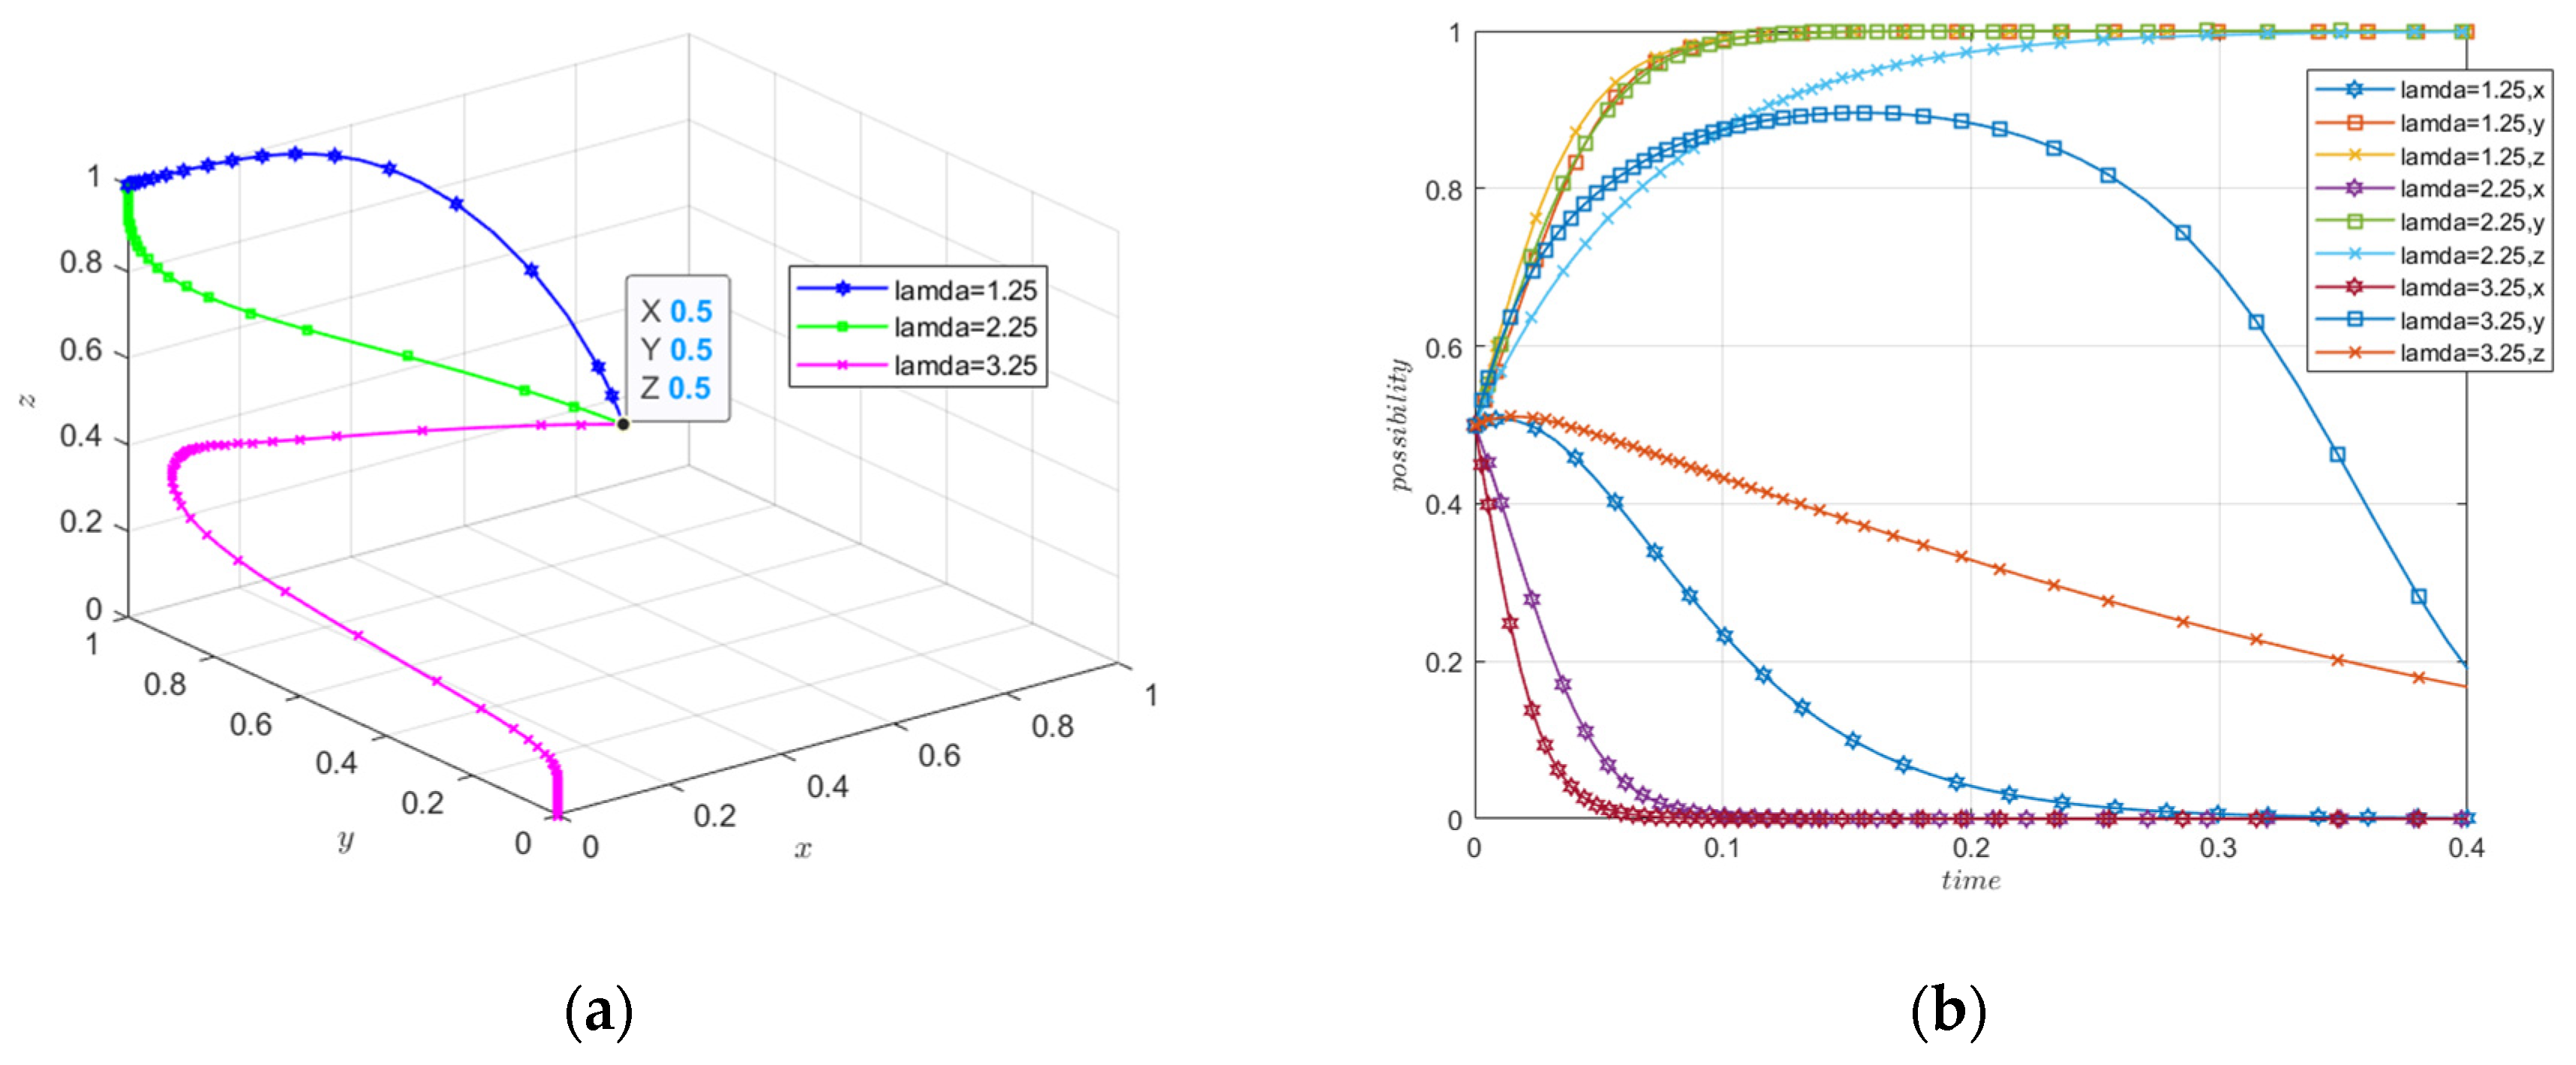
4.4.3. Sensitivity to the Loss-Aversion Coefficient λ

The third test examined the effect of the loss-aversion coefficient λ. Unlike β, which describes sensitivity to changes in the magnitude of losses, λ captures the overall psychological weight assigned to losses relative to gains. In the PG governance context, this parameter reflects how strongly LGs, WGEs, and WUEs react to potential governance failure, treatment costs, penalties, investment losses, and market-entry risks.
Figure 6 shows that λ had a non-linear effect on system evolution. When λ increased from 1.25 to 2.25, the system still converged to the market-oriented equilibrium E7(0,1,1), but the convergence became faster. This result indicates that moderate loss aversion can strengthen the perceived cost of non-cooperation. WGEs became more willing to maintain proactive governance, and WUEs were more likely to remain in the resource-utilization market when the losses associated with abstention or missed opportunities were perceived more strongly. LGs also reduced robust intervention more quickly once enterprise governance and market entry became self-reinforcing. However, the system changed sharply when λ increased to 3.25. Under this setting, z declined rather than converging to one, while y initially increased but later weakened, showing that enterprise cooperation could not be sustained once market participation became unstable. This trajectory suggests that excessive loss aversion does not simply accelerate adjustment. It can reverse the evolutionary direction by amplifying perceived treatment costs, technology-adaptation losses, and investment risks beyond the perceived gains from cooperation.
The effect of λ was therefore conditional. At a moderate level, loss aversion encouraged actors to avoid the losses associated with passive compliance, market abstention, and governance failure. At an excessive level, the same psychological mechanism amplified the risks of taking action. WUEs were especially affected because market entry involves upfront investment and uncertain returns. LGs were also sensitive to λ, as high perceived losses may make them reluctant to withdraw from robust intervention or, conversely, overly cautious about continuing costly incentives. These results indicate that loss aversion is both a governance lever and a potential constraint. Policy design can use loss perception [46] to strengthen deterrence against illegal disposal and passive compliance. Yet if regulatory uncertainty, fiscal pressure, or investment risk becomes too salient, the system may shift away from market-oriented sustainability. The production quota linked to waste disposal policy provides not only credible penalties, but also predictable enforcement standards, clear compliance pathways, and mechanisms that reduce the perceived downside of resource-utilization investment.

4.4.4. Sensitivity of Evolutionary Trajectories to Incentive Intensity μ

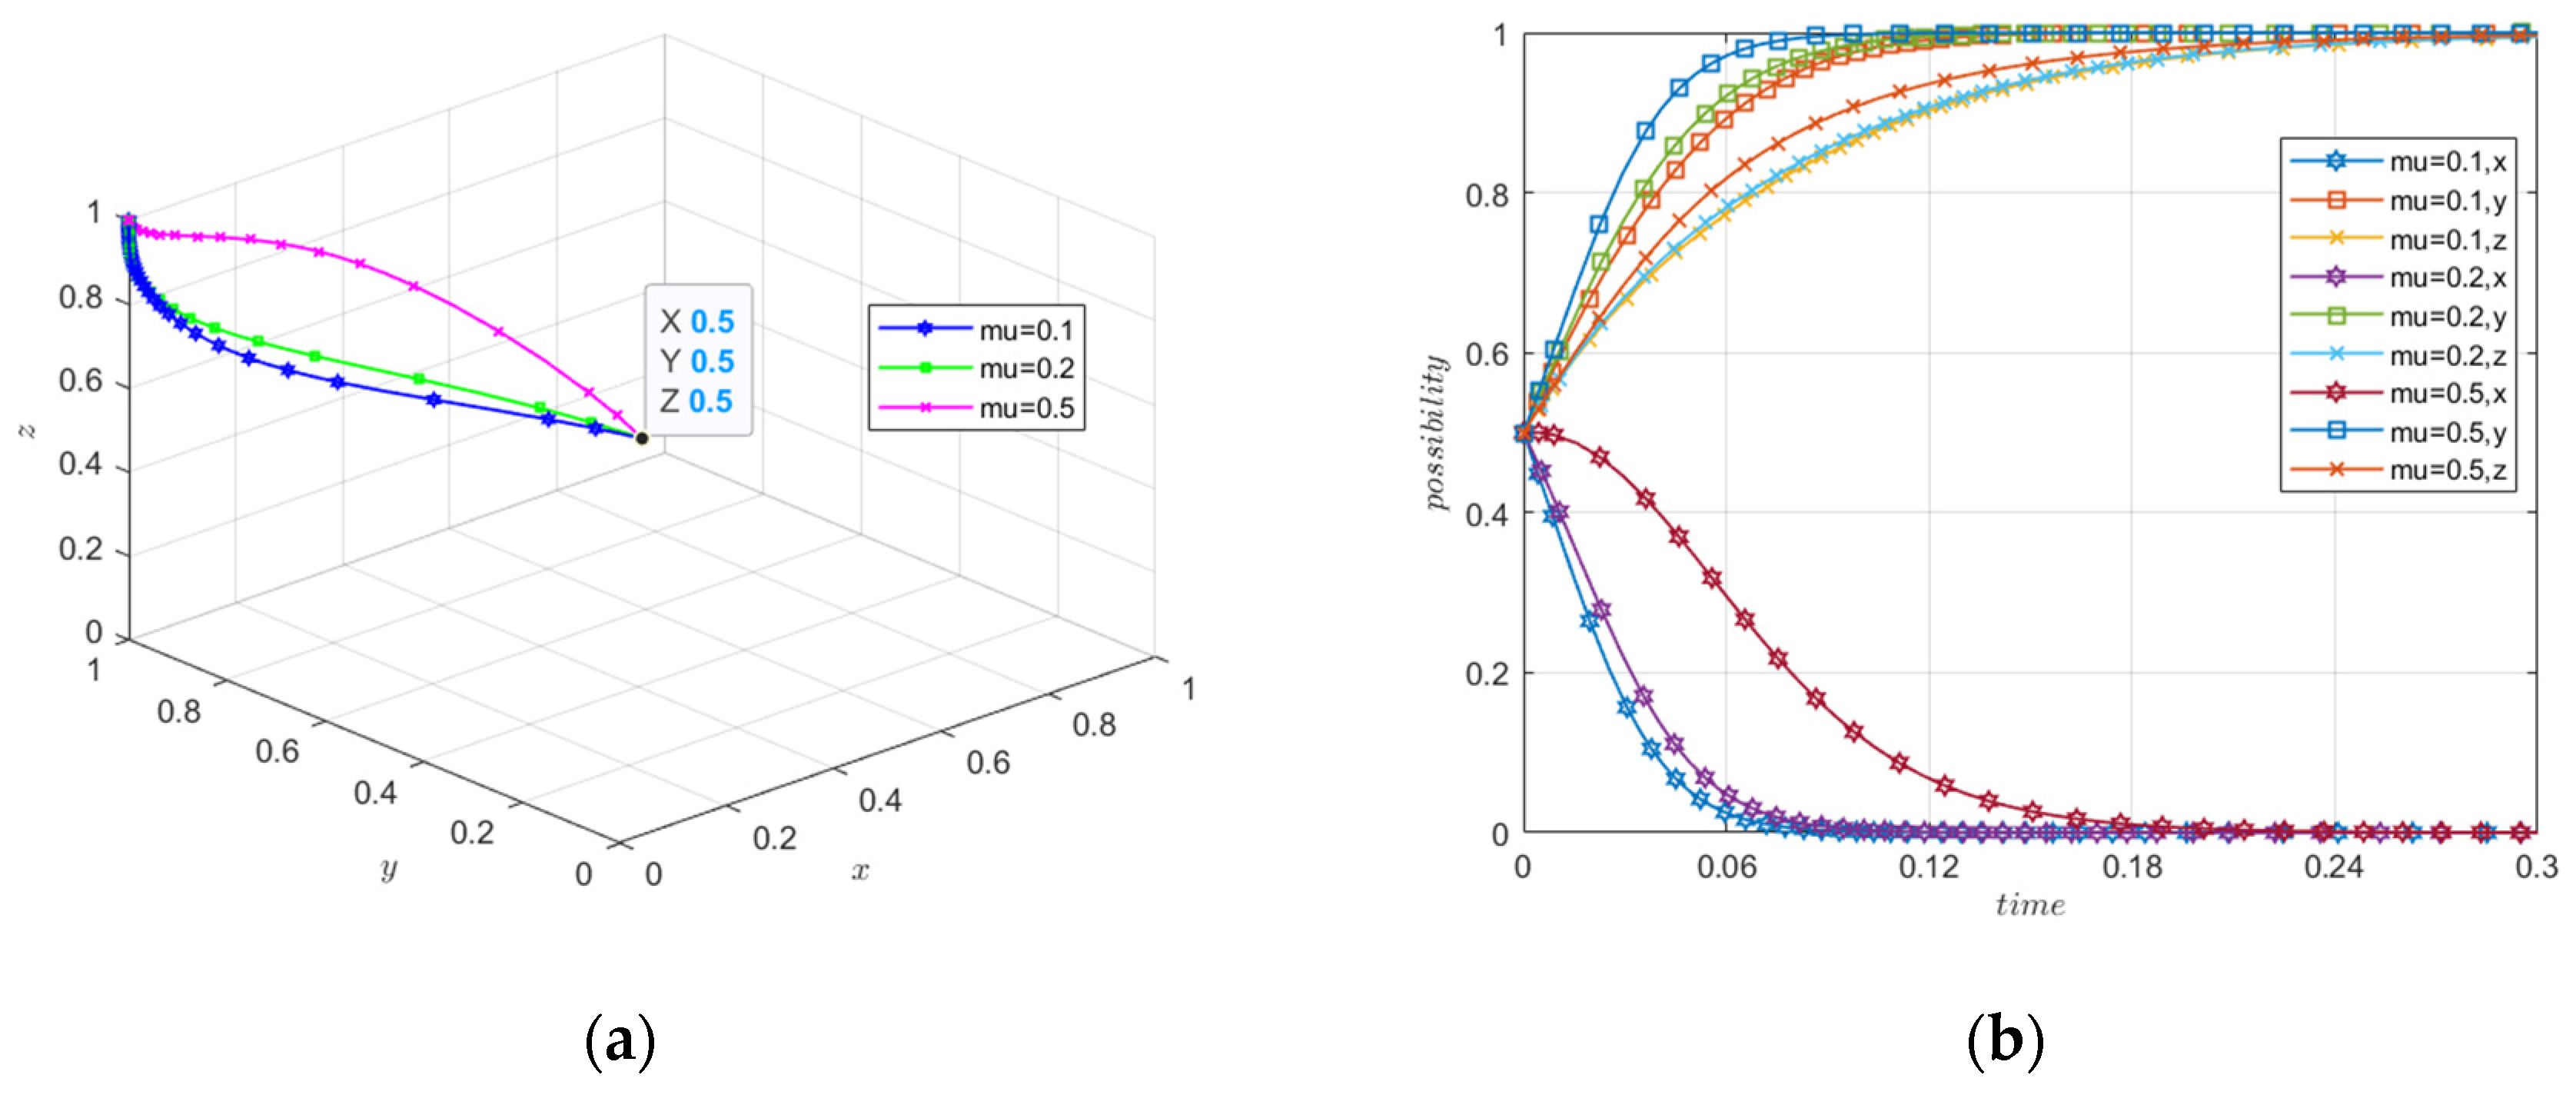
After examining the prospect-theoretic parameters, we further tested the sensitivity of the system to three externally adjustable governance parameters: incentive intensity μ, WGE governance effort θ, and resource-utilization technology maturity ε. These variables are more directly related to policy design and industrial intervention.
Figure 7 reports the sensitivity results for μ. In the model, μ captures the relative strength of subsidies, penalties, and regulatory implementation under moderate incentives. A larger μ means that moderate incentives become closer to robust incentives in terms of policy intensity, while a smaller μ represents a more relaxed incentive and enforcement environment. The results show that μ affected the convergence speed of all three actors, but its effect was not uniform.
As μ increased from 0.10 to 0.50, WGEs and WUEs moved more rapidly toward W1 and M1. This pattern indicates that stronger policy incentives improved the expected payoff of cooperation and reduced the attractiveness of passive compliance or market abstention. The trajectory of LGs showed a different pattern. Stronger incentives can help induce enterprise cooperation, but they also make robust intervention less costly to maintain from the government’s perspective. As a result, LGs may withdraw more slowly from high-intensity intervention when μ is relatively high.
These findings suggest that μ has a dual effect. At the early stage of governance, increasing μ can help break the low-cooperation trap by improving the payoff of proactive governance and market entry. Once WGEs and WUEs have formed stable cooperative strategies, however, maintaining excessive incentive intensity may delay the transition from government-led correction to market-oriented coordination. The policy implication is not that μ should be minimized, but that it should be adjusted dynamically. A higher level of incentive intensity is useful for crossing the initial threshold, whereas a moderate and more targeted incentive regime is more consistent with the long-term objective of reducing subsidy dependence [47] and sustaining market-based resource utilization.

4.4.5. Sensitivity of Evolutionary Trajectories to WGE Governance Effort θ

The next test examined the effect of WGE governance effort θ. In the model, θ represents the proportion of treatment input retained by WGEs under W2. As shown in Figure 8, θ had a clear effect on the evolutionary path of WGEs and the overall stability of the system. When θ was set at 0.30, y first declined and then recovered slowly. This non-monotonic trajectory indicates that a low basic treatment effort weakens the immediate attractiveness of W1. Under this condition, WGEs may initially prefer W2 because the short-term cost advantage remains substantial. The later recovery of y suggests that W1 can still become viable, but only after market-entry behavior by WUEs and moderate policy incentives jointly improve the payoff of resource-oriented treatment. When θ increased to 0.65, the system converged more smoothly toward E7(0,1,1). At θ = 0.90, WGEs converged most rapidly to proactive governance, and the trajectories of the three actors became more stable. A high θ means that enterprises have already internalized a large part of the treatment requirement, even when they are not fully proactive. Under this condition, the additional cost of shifting from passive compliance to proactive governance becomes smaller, while resource recovery benefits and policy incentives become easier to realize. The system therefore reaches the market-oriented equilibrium more efficiently.
These findings indicate that θ works as an organizational foundation for collaborative PG governance. Unlike μ, which operates through external incentives and enforcement, θ reflects whether WGEs have developed stable treatment capacity and compliance routines. Improving θ can reduce the system’s reliance on continuous high-intensity government intervention. In practice, policies such as extended producer responsibility, output-linked disposal requirements, standardized storage, and mandatory harmless treatment can be understood as mechanisms that raise the baseline level of enterprise governance effort [48]. Once this organizational foundation is established, market-oriented resource utilization becomes easier to sustain under moderate supervision.

4.4.6. Sensitivity of Evolutionary Trajectories to Technology Maturity ε

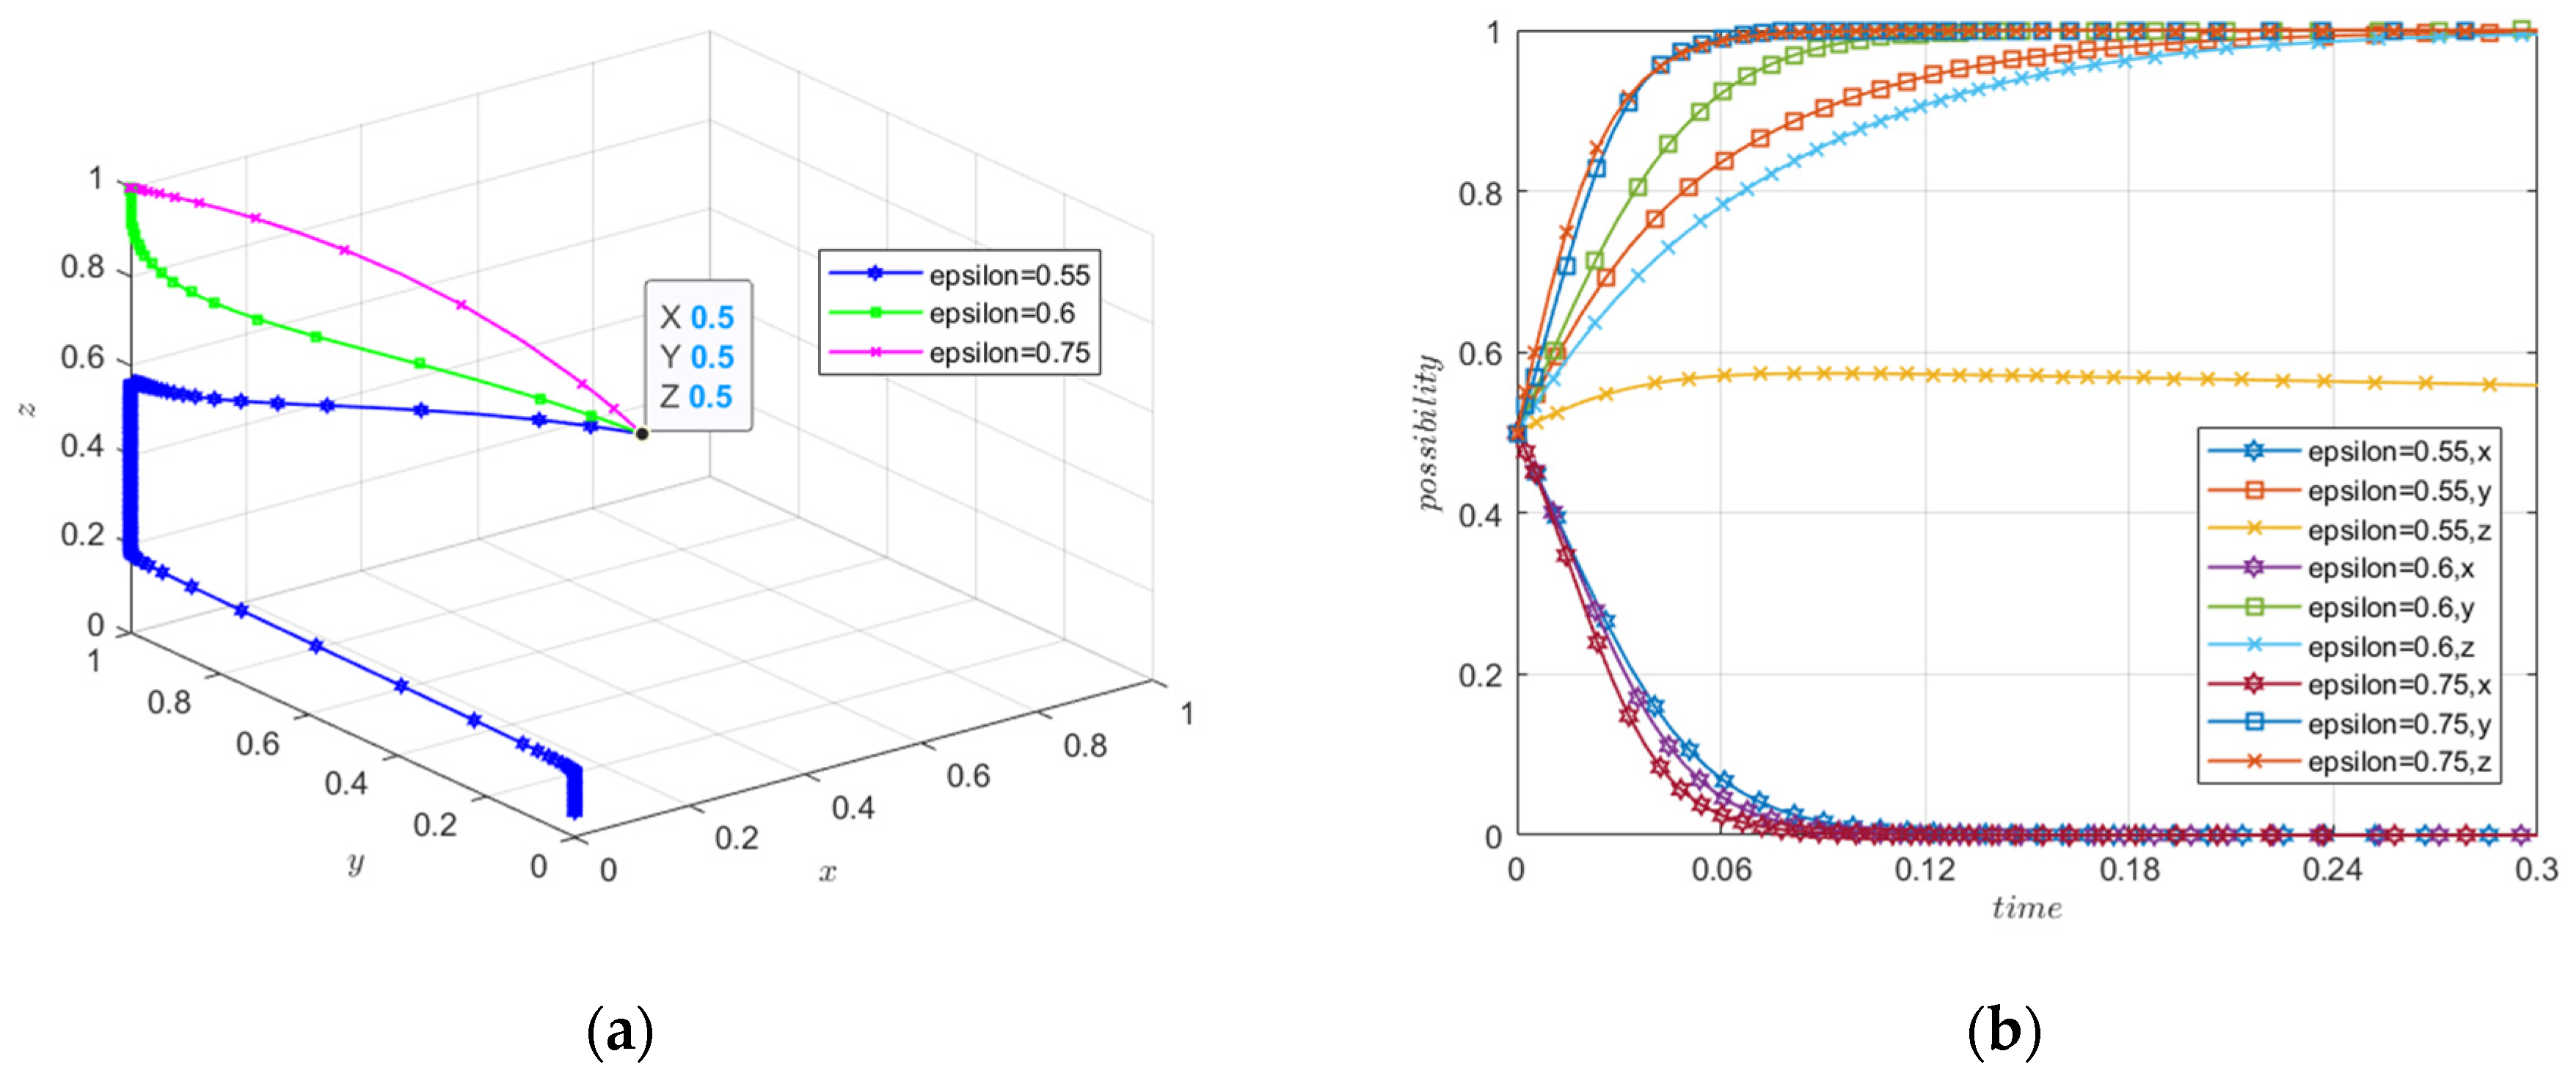
This parameter reflects the industrialization level of PG recovery technologies, the stability of recycled product quality, and the degree of market acceptance. It corresponds to the technological dimension of the TOE perspective and directly affects the market-entry decision of WUEs. Figure 9 shows that ε had a threshold effect on the evolution of the system. When ε was set at 0.55, the system did not fully converge to the ideal equilibrium. This result indicates that a marginal level of technology maturity may be sufficient to support some enterprise treatment effort, but not enough to generate stable market participation by WUEs. When ε increased to 0.60, the system converged more clearly toward E7(0,1,1). A further increase to ε = 0.75 shortened the convergence path and accelerated the movement of both y and z toward one. The effect was especially visible for WUEs, whose strategy depends directly on whether technology maturity can reduce adaptation costs and improve the expected return from resource utilization.
The results suggest that technology maturity is a necessary condition for market-oriented PG governance, but its effect is not linear at low levels. Below or near the viability threshold, policy incentives and enterprise treatment effort may improve the system only partially, because the resource-utilization market has not yet become sufficiently attractive for WUEs. Once ε passes the threshold, technology begins to reinforce both sides of the market: WUEs have stronger incentives to enter, and WGEs face lower effective treatment costs when resource-utilization channels become available. This finding refines the role of policy intervention. Subsidies and penalties can change short-term strategic payoffs, but they cannot fully substitute for technological maturity [49]. For large-scale PG resource utilization, public support for technology upgrading, product standardization, application expansion, and downstream market development should be treated as a precondition for durable policy effectiveness. In this sense, ε is not only a technical parameter. It is also the foundation that allows the system to move from administratively induced cooperation to self-sustaining market coordination.

4.4.7. Parameter Interaction Effects

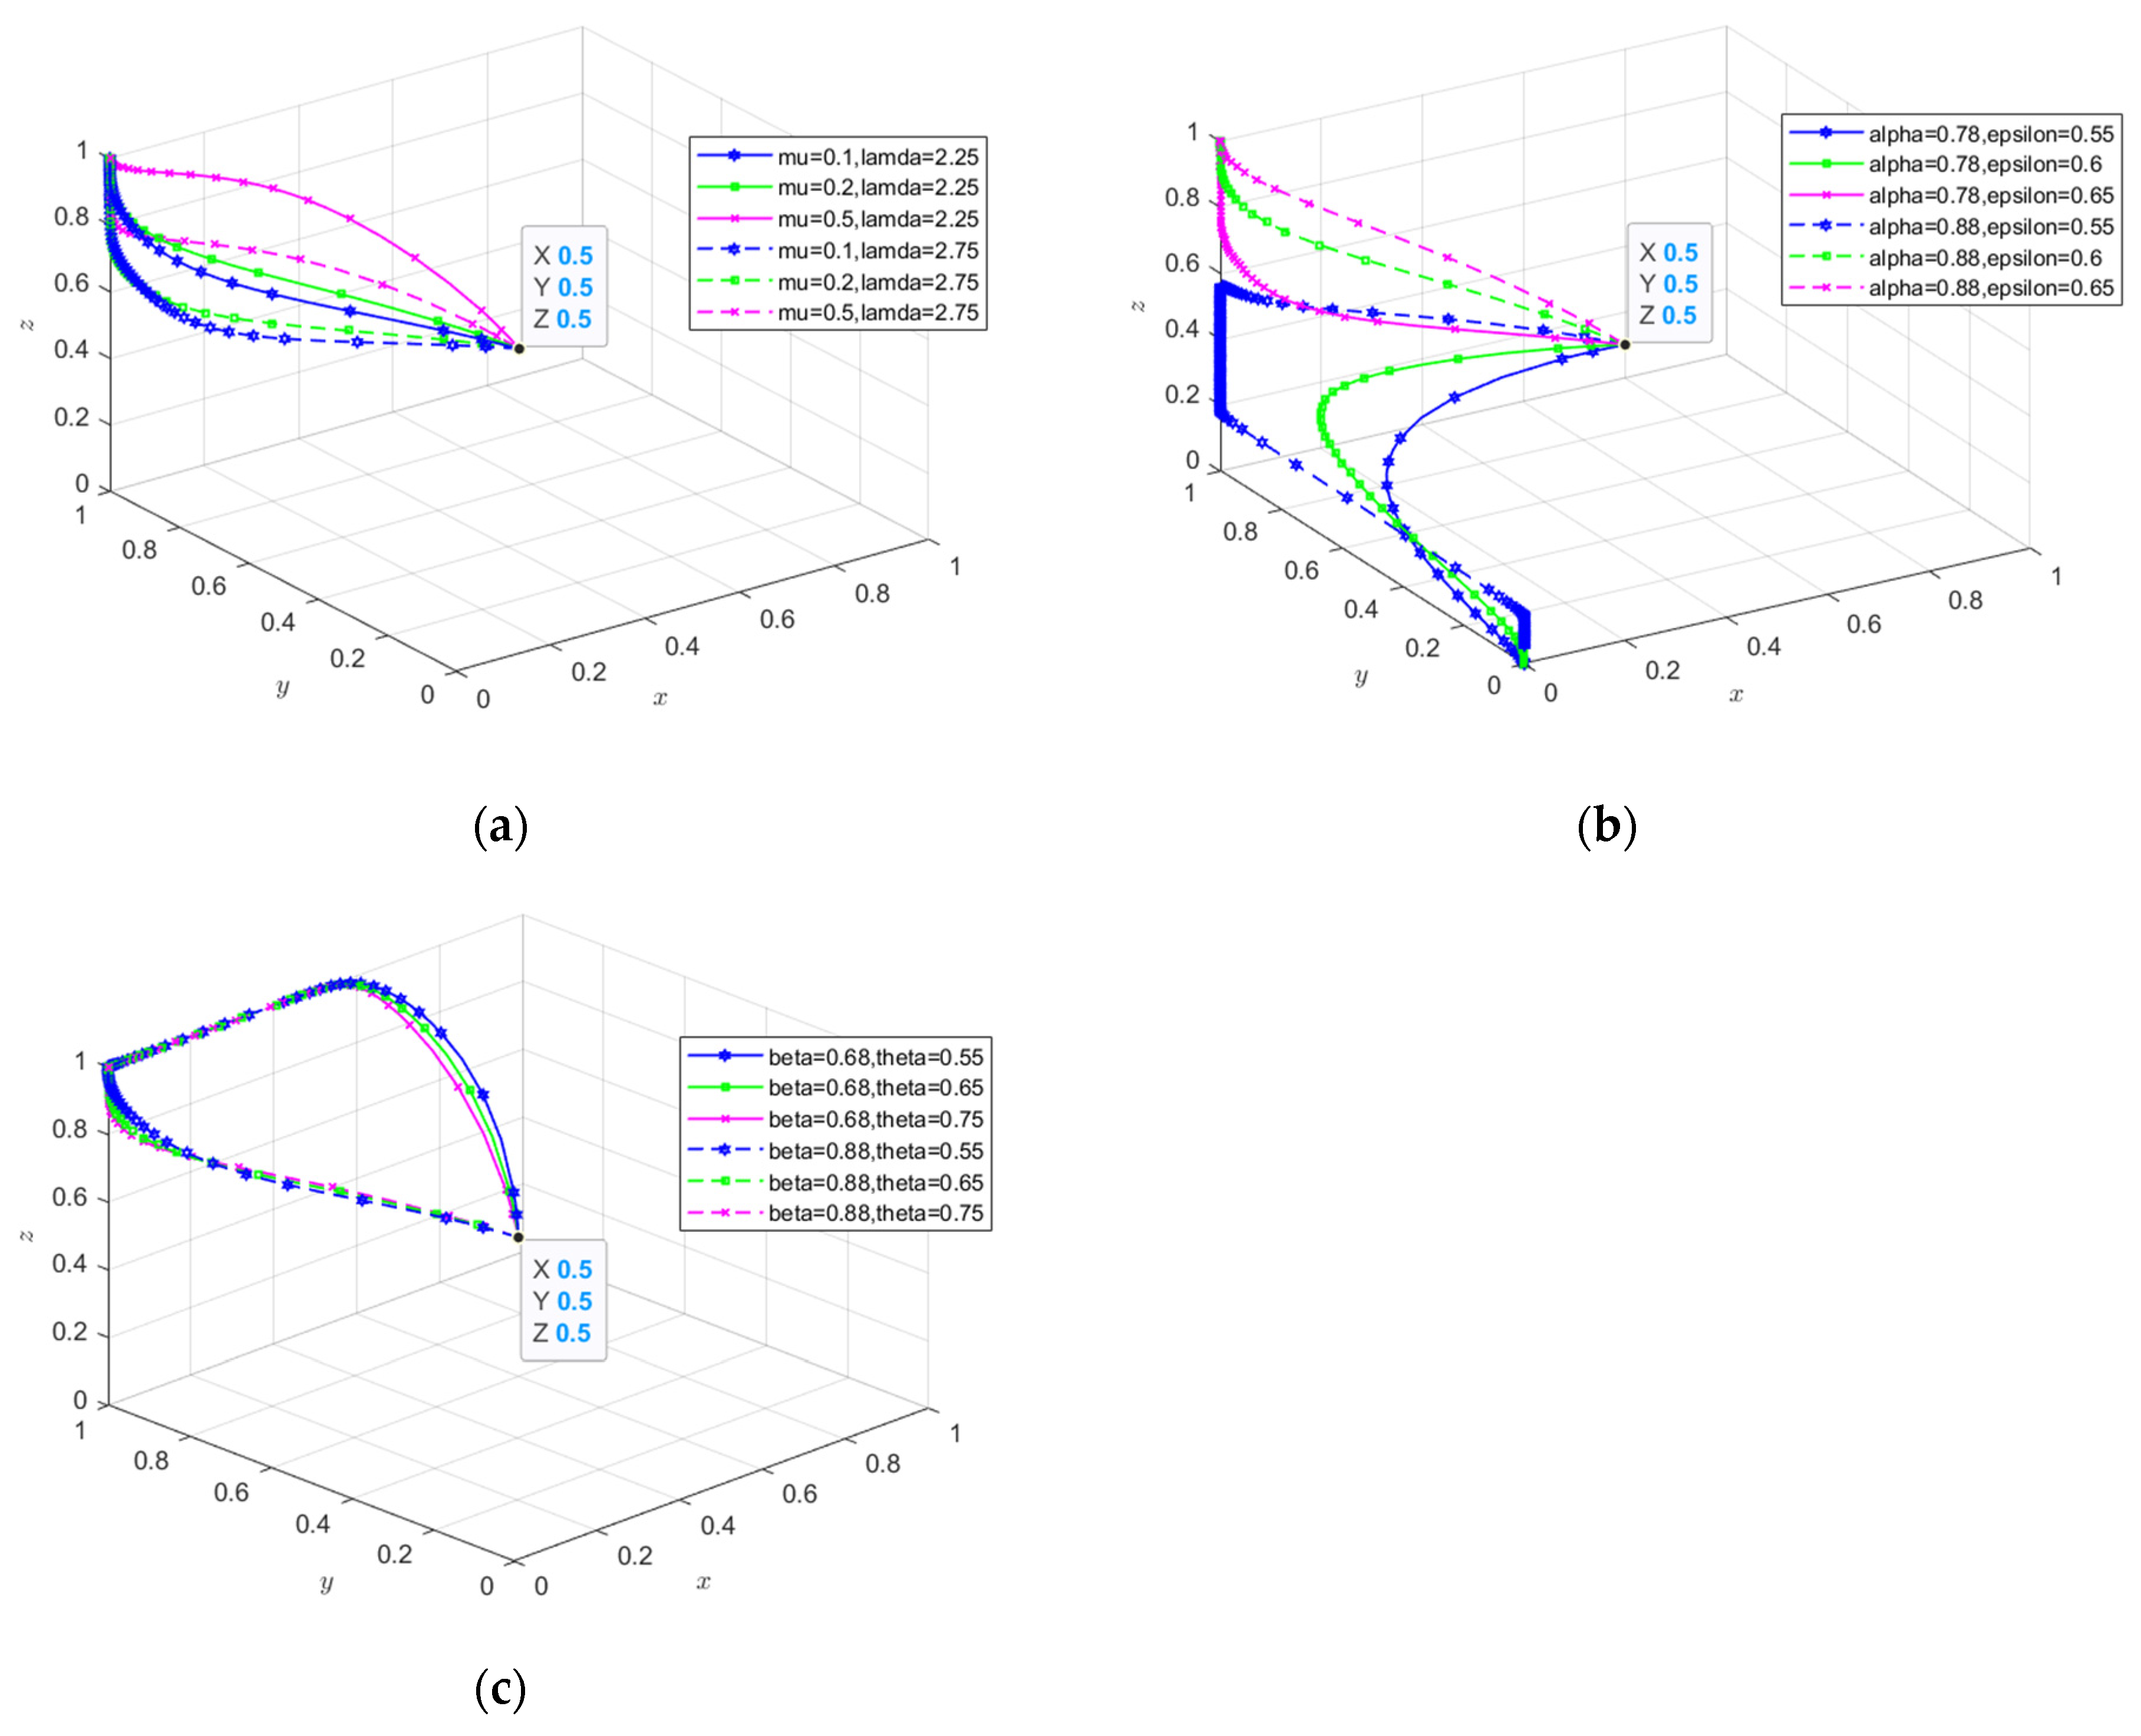
The single-parameter sensitivity analysis showed how each behavioral or situational parameter affected the stability of E7(0,1,1). However, PG governance is unlikely to be shaped by isolated parameters. A policy instrument may work differently when enterprises are highly loss-averse. A technological improvement may fail to induce market entry if actors are insensitive to potential gains. Likewise, the effect of enterprise governance effort may depend on how strongly firms perceive the losses associated with passive compliance. To capture these conditional effects, this section examines three interaction pairs: λ-μ, α-ε, and β-θ. The results are shown in Figure 10.
The interaction between loss aversion λ and government incentive intensity μ shows that policy incentives are filtered through actors’ loss perception. When λ was higher, the evolutionary path became more conservative and the adjustment process was less direct. This pattern indicates that highly loss-averse actors pay greater attention to possible policy failure, investment loss, and market uncertainty. Under such conditions, a stronger μ helped stabilize cooperation by reducing the perceived downside of proactive governance and market entry. In contrast, when λ was relatively low, increasing μ produced a weaker marginal effect because actors were less responsive to the losses associated with non-cooperation. This result suggests that the same incentive policy may have different effects across regions or industries with different levels of risk aversion [50].
The α-ε interaction further shows that technological maturity alone is not sufficient to sustain collaboration. When α was low, even a moderate level of ε produced a more non-linear trajectory and weaker convergence toward the ideal equilibrium. This means that actors did not fully respond to the objective improvement in resource-utilization technology because potential gains were not perceived strongly enough. When α increased, the same level of ε generated a more direct movement toward cooperation. The mechanism is straightforward: technological maturity improves the objective payoff of resource utilization, but gain sensitivity determines whether those benefits are salient enough to change strategy. Therefore, technology upgrading and market expectation formation need to reinforce each other [51]. Product standards, stable downstream applications, and credible demand signals can make the benefits of technological progress more visible to WGEs and WUEs.
The β-θ interaction further clarified why enterprise governance cannot be improved by formal requirements alone. When θ was low, WGEs retained only a small share of the treatment input under W2. Passive compliance therefore remained attractive because it allowed firms to avoid a large part of the full governance cost. The transition toward W1 became slower and depended more strongly on external incentives. This effect was amplified when β was also low. Under this setting, WGEs were less sensitive to the losses associated with insufficient treatment. As a result, the system followed a more indirect trajectory before moving toward cooperation. By contrast, a moderate β combined with a higher θ produced a smoother adjustment path. The result indicates that enterprise governance capacity and loss perception should be aligned. Raising formal treatment requirements without improving perception of non-compliance costs may increase coordination friction rather than accelerate cooperation.
Taken together, the interaction analysis confirms the central logic of the TOE-informed prospect-theoretic framework. Situational parameters such as μ, θ, and ε do not operate mechanically. Their effects depend on how actors perceive gains and losses under uncertainty. High policy incentives are more effective when loss-averse actors need assurance against downside risks. Technological maturity matters more when resource-utilization gains are credible and salient. Enterprise governance effort becomes more effective when firms also recognize the losses associated with passive compliance. This finding supports a differentiated policy logic: PG governance should not rely on uniformly stronger intervention, but should match incentive intensity, technological support, and compliance requirements with the behavioral conditions of the targeted actors. In practice, this implies that treatment standards, enforcement expectations, and enterprise capacity-building need to be advanced together. Therefore, the interaction results reflect a staged governance mechanism in which policy incentives, technological upgrading, enterprise treatment effort, and risk perception jointly shape the transition from administrative intervention to market-oriented PG utilization.

5. Discussion

This study offers a behavioral interpretation of PG governance as a staged coordination problem among LGs, WGEs, and WUEs. Existing evolutionary game studies on environmental governance have generally shown that subsidies, penalties, and regulatory pressure can improve cooperative behavior [52,53,54]. Our results are consistent with this broad conclusion, but they also qualify it. Robust intervention is useful when market demand, technical capability, and enterprise compliance norms are still weak. Yet the desirable long-term state is not permanent high-intensity intervention. The stable configuration represented by moderate government incentives, proactive waste governance, and market entry suggests a shift in government function: from direct subsidizer and intensive enforcer to rule setter, standard provider, market coordinator, and risk reducer. This finding extends previous game-theoretic work by showing that the effectiveness of government intervention depends not only on its intensity, but also on the stage of market and technological development.
The results also speak to studies on circular economy and resource utilization technologies. Much of this literature emphasizes technological feasibility, product substitution, and utilization capacity [55]. These factors are important, but the model indicates that technology maturity is not merely a technical background condition. It changes the payoff structure of both WGEs and WUEs by affecting expected returns, treatment burdens, and market-entry risks. This helps explain why subsidy policies may have limited effects when product quality, utilization channels, and downstream demand remain uncertain. The threshold effect of technology maturity further suggests that policy support should not be limited to direct subsidies or penalties. For PG-producing regions such as Guizhou, policy support should therefore move beyond project-level subsidies and give greater attention to technical standards, stable application scenarios, product certification, and demand-side market creation.
The prospect-theoretic results further complement existing behavioral studies in environmental governance. Previous PT-based studies have shown that loss aversion and risk perception can influence environmental compliance or participation decisions. This study adds that such cognitive parameters do not operate in isolation. Their effects are filtered through concrete governance conditions, including policy intensity, enterprise treatment input, and technology maturity. Similar policy and technological conditions may therefore produce different evolutionary outcomes when actors evaluate gains and losses differently. This finding helps explain why some technically feasible utilization routes still diffuse slowly in practice [56]. Policy design should not only increase objective returns, but also make those returns visible, credible, and predictable. Regulatory penalties should deter passive compliance without creating excessive uncertainty.
The study also clarifies the role of the TOE perspective. In adoption studies, TOE is often used as a general framework for explaining how technological, organizational, and environmental factors affect innovation decisions. In this paper, however, TOE is used more narrowly. It provides a structured lens for identifying the external conditions that enter the game model: policy incentive intensity, enterprise governance input, and technological maturity. This limited use avoids treating TOE and prospect theory as mechanically stacked frameworks. The former specifies the objective governance conditions, while the latter explains how actors subjectively evaluate the payoffs generated under those conditions.
Several limitations should be acknowledged. The parameter setting is case-informed and theory-constrained rather than statistically estimated. Guizhou provides a policy-relevant case for simulation because of its large PG governance pressure and explicit policy instruments, but it should not be interpreted as representing all provinces in the YREB. The model simplifies actors into three representative groups and does not explicitly include central government supervision, financial institutions, public participation, or cross-regional material flows. Future research could combine enterprise-level survey data, project-level cost information, and multi-provincial comparisons to test whether the identified thresholds remain stable across different industrial and institutional contexts. Accordingly, the exact values of the identified thresholds should not be interpreted as universally applicable quantitative standards. These values may shift with changes in parameter calibration, regional conditions, and industrial contexts. Their main value lies in revealing directional effects and threshold patterns. Additionally, to maintain model tractability and focus on subjective value transformation, the probability decision weight is set to 1 in the present model. This treatment allows the analysis to concentrate on perceived gains, perceived losses, and loss aversion, rather than probability distortion. Future studies may extend the model by incorporating probability weighting under uncertain policy or market outcomes.

6. Conclusions

This study develops a prospect-theoretic tripartite evolutionary game model to examine how LGs, WGEs, and WUEs coordinate in PG governance. By treating policy incentive intensity, enterprise governance input, and technological maturity as context-specific parameters, the model captures both the external conditions and the boundedly rational perceptions that shape stakeholder strategies. The analysis shows that PG governance is unlikely to become stable through a single policy instrument. Low policy intensity, weak enterprise treatment input, and immature utilization technology tend to reinforce non-cooperation. A cooperative transition becomes possible only when regulatory incentives, enterprise compliance behavior, and market-entry conditions improve together. The preferable long-term outcome is not continued dependence on strong government intervention, but a more self-sustaining configuration in which enterprises maintain proactive governance and utilization firms remain willing to enter the market under moderate policy support.
For policy practice, the findings imply that PG-producing regions should adopt a phased governance strategy. Stronger intervention is needed when the market is immature, but policy should gradually shift toward standard setting, stable enforcement, technology upgrading, and market cultivation once resource-utilization capacity improves. In this sense, the key challenge is not simply to increase subsidies or penalties, but to create conditions under which cooperative strategies become economically credible and behaviorally acceptable.

Author Contributions

Conceptualization, X.B. and Y.L.; methodology, X.B. and Y.L.; software, X.B.; validation, X.B.; formal analysis, X.B.; investigation, X.B.; resources, Y.L.; data curation, X.B.; writing—original draft preparation, X.B.; writing—review and editing, Y.L.; visualization, X.B.; supervision, Y.L.; project administration, Y.L.; funding acquisition, Y.L. All authors have read and agreed to the published version of the manuscript.

Funding

This research was funded by the Ministry of Education of China (Youth Foundation of Humanities and Social Sciences, grant number 23YJC630211) and the Fundamental Research Funds for the Central Universities, South China University of Technology (grant number QNZD2505).

Institutional Review Board Statement

Not applicable.

Informed Consent Statement

Not applicable.

Data Availability Statement

The data presented in this study are available on request from the corresponding author.

Conflicts of Interest

The authors declare no conflicts of interest.

Abbreviations

The following abbreviations are used in this manuscript:
ISWIndustrial solid waste
PGPhosphogypsum
TOETechnology–organization–environment
PTProspect theory
EGTEvolutionary game theory
ESSEvolutionarily stable strategy
LGsLocal governments
WGEsWaste-generating enterprises
WUEsWaste-utilizing enterprises
xProbability of LGs adopting G1 strategy
yProbability of WGEs adopting W1 strategy
zProbability of WUEs adopting M1 strategy

Appendix A

Table A1. Data Sources and Parameter Calibration.
No.ParametersData SourcesCalibration Basis
1B1, B2Guizhou Provincial Measures for the Management of Special Funds for Comprehensive Utilization of Phosphogypsum [37].Production-side reward of 10 yuan/t and a building-material promotion subsidy of 30 yuan/t based on actual absorption volume.
2FWeng’an PG public-interest litigation case jointly released by the Supreme People’s Procuratorate and Ministry of Ecology and Environment [38].Approximately 48,000 t of illegally stockpiled PG; administrative fine of 846,000 yuan; ecological service-function loss compensation of 940,000 yuan; The corresponding comprehensive non-compliance liability is about 37 yuan/t. Considering regional variation in enforcement intensity, F is set at 30.
3C0Official reports by Guizhou government [36].800 million yuan of provincial fiscal funds and 200 million yuan of prefecture-level fiscal funds for PG comprehensive utilization/14 million t; C0 is normalized to 100 as a reference-scale value after considering fiscal input, administrative coordination, monitoring, and implementation costs.
4C1Enterprise-investment [39,42]Proactive PG governance by WGEs includes compliant storage costs of 45–60 yuan/t, harmless pretreatment costs of 12–25 yuan/t, and supporting treatment costs in wet-process phosphoric acid production lines of 40–50 yuan/t. The resulting cost range is 97–135 yuan/t, and the baseline value is set at 120.
5C2Guizhou Phosphate Group and related firms invested about 3.00 billion yuan and built more than 20 PG utilization projects. Based on the increase in annual utilization capacity from about 3.00 million t to 14.60 million t, the implied enterprise investment intensity was approximately 258.62 yuan/t of added capacity. Since C2 represents annualized market-entry and technology-adaptation cost rather than total fixed investment, the baseline value is set below this full investment intensity.
6R1Official reports by Guizhou government [40].The ordinary building-material utilization pathway generates a value range of 80–180 yuan/t. R1 is interpreted as the WGE-side benefit from proactive governance, including standardized PG transfer value, avoided storage/disposal costs, and compliance-related benefits. The baseline value is set at 150 within the observed range.
7R2In 2025, Guizhou Phosphate Green Environmental Protection Co., Ltd. absorbed about 1.20 million t of PG and generated an output value exceeding 300 million yuan, corresponding to more than 250 yuan/t. Since this figure reflects gross output rather than net profit, the baseline value of R2 is conservatively set at 200.
8R4Pre-2018 governance context in Guizhou [41]. Before the output-linked disposal policy was introduced in 2018, the historical PG stockpile in Guizhou exceeded 100 million t, and many firms mainly relied on storage facilities without supporting resource-utilization lines. In the model, R4 does not represent legitimate resource-recovery revenue. It captures the short-term cost savings obtained by delaying proactive treatment, harmless pretreatment, and resource-utilization investment.

References

  1. Ling, Z.S.; Jaafar, M.H.; Ismail, N. The Knowledge, Attitudes and Practices in Circular Economy: A Review of Industrial Waste Management in China. Clean. Waste Syst. 2025, 11, 100276. [Google Scholar] [CrossRef] [Scilit]
  2. Zou, Q.; Yang, Z.; Zhou, Q.; Wang, X.; Hou, H.; Shi, X.; Deng, Y.; Duan, H.; Yang, J. Industrial Solid Waste Management Systems: Model Development and Strategic Implementation. Circ. Econ. 2026, 5, 100192. [Google Scholar] [CrossRef] [Scilit]
  3. Baykova, O.V.; Pugach, V.N.; Kazakov, A.V. Model Drivers-Pressures-State-Impact-Response as a method for analyzing hazardous waste management in the People’s Republic of China: A review of international experience. Theor. Appl. Ecol. 2025, 2025, 66–75. [Google Scholar] [CrossRef] [Scilit]
  4. Ma, W.; de Jong, M.; Zisopoulos, F.; Hoppe, T. Introducing a Classification Framework to Urban Waste Policy: Analysis of Sixteen Zero-Waste Cities in China. Waste Manag. 2023, 165, 94–107. [Google Scholar] [CrossRef] [Scilit]
  5. Maina, L.; Kiegiel, K.; Zakrzewska-Koltuniewicz, G. Challenges and Strategies for the Sustainable Environmental Management of Phosphogypsum. Sustainability 2025, 17, 3473. [Google Scholar] [CrossRef] [Scilit]
  6. Chen, L.; Luan, X.; Han, F.; Zhao, Y.; Yang, H.; Zhang, L.; Yin, Y.; Liu, W.; Cui, Z. Life Cycle Environmental and Economic Assessment of Phosphogypsum Utilization in China. Resour. Conserv. Recycl. 2025, 212, 107938. [Google Scholar] [CrossRef] [Scilit]
  7. Wang, T.; Chen, C.; Jiang, X.; Zhao, Y.; Zhao, Y.; Li, X.; Wang, L.; Wang, H.; Ma, W.; Liu, Z. Current Research Status and Emerging Trends of Phosphogypsum Resource Utilization: A Review Combined with Bibliometric Analysis. J. Environ. Chem. Eng. 2026, 14, 121807. [Google Scholar] [CrossRef] [Scilit]
  8. Wang, H.; He, W.; Zhang, Z.; Liu, X.; Yang, Y.; Xue, H.; Xu, T.; Liu, K.; Xian, Y.; Liu, S.; et al. Spatio-Temporal Evolution Mechanism and Dynamic Simulation of Nitrogen and Phosphorus Pollution of the Yangtze River Economic Belt in China. Environ. Pollut. 2024, 357, 124402. [Google Scholar] [CrossRef] [Scilit]
  9. Ren, F.; Chen, K.; Tian, Z.; Zhang, Y. The Investment and Treatment Efficiencies of Industrial Solid Waste in China’s Yangtze and Non-Yangtze River Economic Belts. J. Mater. Cycles Waste Manag. 2022, 24, 900–916. [Google Scholar] [CrossRef] [Scilit]
  10. Lin, M.; Liu, S.Q.; Luo, K.; Zhu, L. A Prospect-Theory Evolutionary Game Model to Analyse Cooperation of Long-Term Energy Contracts. Energy 2025, 330, 136855. [Google Scholar] [CrossRef] [Scilit]
  11. Li, P.; Lu, Y.; Peng, L.; Wang, J. Information, Incentives, and Environmental Governance: Evidence from China’s Ambient Air Quality Standards. J. Environ. Econ. Manag. 2024, 128, 103066. [Google Scholar] [CrossRef] [Scilit]
  12. Wang, Z.; Huo, J. Do Government Intervention Measures Promote E-Waste Recycling in China? J. Environ. Manag. 2023, 342, 118138. [Google Scholar] [CrossRef] [Scilit]
  13. Wang, X.; Tang, Y.; Li, J. China’s Urban Waste Resource Management Systems: A Case of the Yangtze River Basin. J. Urban Technol. 2024, 31, 21–43. [Google Scholar] [CrossRef] [Scilit]
  14. Cui, Y.; Chang, I.-S.; Yang, S.; Yu, X.; Cao, Y.; Wu, J. A Novel Dynamic Business Model to Quantify the Effects of Policy Intervention on Solid Waste Recycling Industry: A Case Study on Phosphogypsum Recycling in Yichang, China. J. Clean. Prod. 2022, 355, 131779. [Google Scholar] [CrossRef] [Scilit]
  15. Jiang, H.; Lu, J.; Zhang, R.; Xiao, X. Investigation of Diverse Urban Carbon Emission Reduction Pathways in China: Based on the Technology–Organization–Environment Framework for Promoting Socio-Environmental Sustainability. Land 2025, 14, 260. [Google Scholar] [CrossRef] [Scilit]
  16. Ullah, F.; Qayyum, S.; Thaheem, M.J.; Al-Turjman, F.; Sepasgozar, S.M.E. Risk Management in Sustainable Smart Cities Governance: A TOE Framework. Technol. Forecast. Soc. Change 2021, 167, 120743. [Google Scholar] [CrossRef] [Scilit]
  17. Senna, P.P.; Barros, A.C.; Roca, J.B.; Azevedo, A. Development of a Digital Maturity Model for Industry 4.0 Based on the Technology-Organization-Environment Framework. Comput. Ind. Eng. 2023, 185, 109645. [Google Scholar] [CrossRef] [Scilit]
  18. Satyro, W.C.; Contador, J.C.; Gomes, J.A.; de Monken, S.F.; Barbosa, A.P.; Bizarrias, F.S.; Contador, J.L.; Silva, L.S.; Prado, R.G. Technology-Organization-External-Sustainability (TOES) Framework for Technology Adoption: Critical Analysis of Models for Industry 4.0 Implementation Projects. Sustainability 2024, 16, 11064. [Google Scholar] [CrossRef] [Scilit]
  19. Yu, J. Revolutionizing Industrial Park Waste Classification with Artificial Intelligence: A Behavioral Economics and Evolutionary Game Theory Perspective. Process Saf. Environ. Prot. 2025, 197, 107043. [Google Scholar] [CrossRef] [Scilit]
  20. Song, W.; Elahi, E.; Hou, G.; Wang, P. Collaborative Governance for Urban Waste Management: A Case Study Using Evolutionary Game Theory. Sust. Cities Soc. 2025, 126, 106380. [Google Scholar] [CrossRef] [Scilit]
  21. Li, B.; Li, J. Public Participation in Governance of E-Waste Recycling: A Tripartite Evolutionary Game Analysis. Sustain. Futures 2024, 8, 100323. [Google Scholar] [CrossRef] [Scilit]
  22. Sun, C.; Di, Y.; Liao, R. Game Analysis and Strategy Suggestions on Waste Sorting Management with Third-Party Supervision. Pol. J. Environ. Stud. 2022, 31, 3297–3307. [Google Scholar] [CrossRef] [Scilit]
  23. Palafox-Alcantar, P.G.; Hunt, D.V.L.; Rogers, C.D.F. The Complementary Use of Game Theory for the Circular Economy: A Review of Waste Management Decision-Making Methods in Civil Engineering. Waste Manag. 2020, 102, 598–612. [Google Scholar] [CrossRef] [Scilit]
  24. Jato-Espino, D.; Ruiz-Puente, C. Bringing Facilitated Industrial Symbiosis and Game Theory Together to Strengthen Waste Exchange in Industrial Parks. Sci. Total Environ. 2021, 771, 145400. [Google Scholar] [CrossRef] [Scilit]
  25. Barberis, N.C. Thirty Years of Prospect Theory in Economics: A Review and Assessment. J. Econ. Perspect. 2013, 27, 173–196. [Google Scholar] [CrossRef] [Scilit]
  26. Qiao, X.; Lee, H.; Shen, Q.; Li, Y. Research on the Tripartite Evolutionary Game of Zero-Waste City Construction in China. Sustainability 2023, 15, 10507. [Google Scholar] [CrossRef] [Scilit]
  27. Qiao, X.; Fan, X.; Sun, J.; Li, Y.; Zhao, Y. Intergovernmental Cooperation in Zero-Waste City Development in China: An Evolutionary Game Analysis Under Prospect Theory. Sustainability 2026, 18, 2636. [Google Scholar] [CrossRef] [Scilit]
  28. Cai, W.; Xie, C.; Gu, Y. Enhancing Inland River Shore Power Utilization: A Game Theory and Prospect Theory Approach to Optimizing Incentive Mechanisms. Sustainability 2025, 17, 1964. [Google Scholar] [CrossRef] [Scilit]
  29. Zhang, L.; Jiang, Y.; Wu, J. Evolutionary Game Analysis of Government and Residents’ Participation in Waste Separation Based on Cumulative Prospect Theory. Int. J. Environ. Res. Public Health 2022, 19, 14589. [Google Scholar] [CrossRef] [Scilit]
  30. Jiang, K.; Zhang, X.; Leng, M.; Zhang, W.; Wang, F. Balancing Incentives and Sanctions: A Prospect Theory-Based Tripartite Game on Carbon Tax Dynamics. Energy 2025, 340, 139170. [Google Scholar] [CrossRef] [Scilit]
  31. Liu, X.; Yue, J.; Luo, L.; Liu, C.; Zhu, T. Evolutionary Analysis of Nuclear Wastewater Collaborative Governance Based on Prospect Theory. J. Clean. Prod. 2024, 465, 142856. [Google Scholar] [CrossRef] [Scilit]
  32. Ritzberger, K.; Weibull, J. Evolutionary Selection in Normal-Form Games. Econometrica 1995, 63, 1371–1399. [Google Scholar] [CrossRef] [Scilit]
  33. Branicky, M.S. Multiple Lyapunov Functions and Other Analysis Tools for Switched and Hybrid Systems. IEEE Trans. Autom. Control 1998, 43, 475–482. [Google Scholar] [CrossRef] [Scilit]
  34. Sastry, S. Lyapunov Stability Theory. In Nonlinear Systems; Interdisciplinary Applied Mathematics; Springer: New York, NY, USA, 1999; Volume 10, pp. 182–234. ISBN 978-1-4419-3132-0. [Google Scholar]
  35. Kahneman, D.; Tversky, A. Prospect Theory-Analysis of Decision Under Risk. Econometrica 1979, 47, 263–291. [Google Scholar] [CrossRef] [Scilit]
  36. Guizhou’s Annual Phosphogypsum Utilization Capacity Significantly Improved. Available online: https://www.guizhou.gov.cn/ztzl/zcyzxmzzs/202501/t20250114_86618695.html (accessed on 7 August 2026).
  37. Notice of the Office of the People’s Government of Qiannan Prefecture on Issuing the Incentive Scheme for Supporting Comprehensive Utilization of Phosphogypsum in Qiannan Prefecture. Available online: https://www.qiannan.gov.cn/zwgk/jcxxgk/zcwj/qnfbh/202204/t20220425_74390705.html (accessed on 7 August 2026).
  38. Supreme People’s Procuratorate. Procuratorial Supervision and Ecological Environment Enforcement Cooperate to Serve the Green Development of the Yangtze River Economic Belt: Typical Cases. Available online: https://www.spp.gov.cn/spp/xwfbh/dxal/202605/t20260521_727825.shtml (accessed on 7 August 2026).
  39. People’s Daily Full-Page Report: Guizhou Phosphogypsum Group Deepens “Refined Mining” to Empower High-Quality Development with New Quality Productivity. Available online: https://gzw.guizhou.gov.cn/xwzx/qyzc/202512/t20251218_89069410.html (accessed on 7 August 2026).
  40. Latest Updates-Accelerating the Construction of “Six Major Industrial Bases” to Promote High-Quality Development of New Industrialization. Available online: https://www.guizhou.gov.cn/ztzl/ssgybzxdflsxgydtp/zxdt/ (accessed on 7 August 2026).
  41. Qiannan Prefecture Phosphogypsum Comprehensive Utilization Report (2017). Available online: https://gxj.qiannan.gov.cn/cyfz_100/201905/t20190521_2566985.html (accessed on 7 August 2026).
  42. Xu, X.; Wu, P. Evolutionary Game between Local Government and Enterprise under Green Development of Phosphorus Chemical Industry-Experience from Guizhou “Determining the Production by Slag” Policy. J. Southwest Univ. 2023, 45, 152–163. [Google Scholar] [CrossRef]
  43. Zhou, C.; Han, Y.; Zhang, R. Can Command-and-Control Policy Drive Low-Carbon Transition in Energy-Intensive Enterprises?—A Study Based on Evolutionary Game Theory. Front. Energy Res. 2023, 11, 1247780. [Google Scholar] [CrossRef] [Scilit]
  44. Jin, Y.; Tang, Z.; Zhou, Q.; Zeng, H.; Mo, S. A Government Value Compensation Model of Waste Recycling in an Industrial Park: A Game Theory Approach. J. Clean. Prod. 2020, 275, 122976. [Google Scholar] [CrossRef] [Scilit]
  45. Hu, Y.; Chi, Y.; Zhou, W.; Li, J.; Wang, Z.; Yuan, Y. The Interactions between Renewable Portfolio Standards and Carbon Emission Trading in China: An Evolutionary Game Theory Perspective. Energy 2023, 271, 127047. [Google Scholar] [CrossRef] [Scilit]
  46. Xu, P.; Cao, Y.; Li, J. Green Paradox in the Carbon Neutrality Process: A Strategic Game About the Shipping Industry. Sustainability 2025, 17, 5970. [Google Scholar] [CrossRef] [Scilit]
  47. Shao, J.; Hua, L. Research on Government Subsidy Policy for Firms’ R&D Investment Considering Spillover Effects: A Stackelberg Game Approach. Financ. Res. Lett. 2023, 58, 104415. [Google Scholar] [CrossRef] [Scilit]
  48. Peng, B.; Wang, Y.; Elahi, E.; Wei, G. Behavioral Game and Simulation Analysis of Extended Producer Responsibility System’s Implementation under Environmental Regulations. Environ. Sci. Pollut. Res. 2019, 26, 17644–17654. [Google Scholar] [CrossRef] [Scilit]
  49. Qian, Y.; Yu, X.; Shen, Z.; Song, M. Complexity Analysis and Control of Game Behavior of Subjects in Green Building Materials Supply Chain Considering Technology Subsidies. Expert Syst. Appl. 2023, 214, 119052. [Google Scholar] [CrossRef] [Scilit]
  50. Tian, Z.; Wang, W.; Tan, Q.; Huang, X. Perception of Economic Policy Uncertainty and Inefficient Investment. Financ. Res. Lett. 2025, 86, 108706. [Google Scholar] [CrossRef] [Scilit]
  51. Cui, Y.; Cao, Y.; Ji, Y.; Chang, I.-S.; Wu, J. Determinant Factors and Business Strategy in a Sustainable Business Model: An Explorative Analysis for the Promotion of Solid Waste Recycling Technologies. Bus. Strateg. Environ. 2022, 31, 2533–2545. [Google Scholar] [CrossRef] [Scilit]
  52. Zhou, K.; Wang, Q.; Tang, J. Evolutionary Game Analysis of Environmental Pollution Control under the Government Regulation. Sci. Rep. 2022, 12, 474. [Google Scholar] [CrossRef] [Scilit]
  53. Jiao, Y.; Tang, H.; Tu, D.; Liu, H. Market Competition, Environmental Governance Subsidies, and Environmental Penalty Risks. Financ. Res. Lett. 2025, 79, 107224. [Google Scholar] [CrossRef] [Scilit]
  54. Zhang, L.; Song, Y.; Zhang, M. Strategic Environmental Investment under Intergovernmental Regulatory Competition: An Evolutionary Game Approach. Sustain. Futures 2026, 11, 101646. [Google Scholar] [CrossRef] [Scilit]
  55. Huang, Q.; Zhao, T.; Lin, M.; Li, W.; Zhou, Q.; Chen, C. Insights and Practices for Industrial Solid Waste Management under “Zero-Waste City” Construction in China. Circ. Econ. 2025, 4, 100155. [Google Scholar] [CrossRef] [Scilit]
  56. Purchase, C.K.; Al Zulayq, D.M.; O’Brien, B.T.; Kowalewski, M.J.; Berenjian, A.; Tarighaleslami, A.H.; Seifan, M. Circular Economy of Construction and Demolition Waste: A Literature Review on Lessons, Challenges, and Benefits. Materials 2022, 15, 76. [Google Scholar] [CrossRef] [Scilit]
Figure 1. Tripartite interaction mechanism of PG governance.
Sustainability 18 08753 g001
Figure 2. Evolutionary paths of PG governance under three stylized governance phases. (a) Three-dimensional phase portraits under E1 (0,0,0); (b) Three-dimensional phase portraits under E8 (1,1,1); (c) Three-dimensional phase portraits under E7 (0,1,1). (Sampled from 0.1 to 0.9 in steps of 0.2, 125 evolutionary trajectories are made through simulation, and each colored curve represents one evolutionary trajectory from a distinct initial condition).
Sustainability 18 08753 g002
Figure 3. Time-series evolution of LGs, WGEs, and WUEs under three initial governance scenarios. (a) Evolution paths of x, y, and z under E1 (0,0,0); (b) Evolution paths of x, y, and z under E8 (1,1,1); (c) Evolution paths of x, y, and z under E7 (0,1,1).
Sustainability 18 08753 g003
Figure 4. Sensitivity of evolutionary trajectories to the gain sensitivity coefficient α. (a) Three-dimensional phase portraits under α = 0.82, 0.88, and 0.95, with all other parameters held constant. (b) Corresponding time-series trajectories of x, y, and z under the same α settings.
Sustainability 18 08753 g004
Figure 5. Sensitivity of evolutionary trajectories to the loss sensitivity coefficient β. (a) Three-dimensional phase portraits under β = 0.82, 0.88, and 0.95, with all other parameters held constant. (b) Corresponding time-series trajectories of x, y, and z under the same β settings.
Sustainability 18 08753 g005
Figure 6. Sensitivity of evolutionary trajectories to the loss-aversion coefficient λ. (a) Three-dimensional phase portraits under λ = 1.25, 2.25, and 3.25, with all other parameters held constant. (b) Corresponding time-series trajectories of x, y, and z under the same λ settings.
Sustainability 18 08753 g006
Figure 7. Sensitivity of evolutionary trajectories to government incentive intensity μ. (a) Three-dimensional phase portraits under μ = 0.1, 0.2, and 0.5, with all other parameters held constant. (b) Corresponding time-series trajectories of x, y, and z under the same μ settings.
Sustainability 18 08753 g007
Figure 8. Sensitivity of evolutionary trajectories to WGE governance effort θ. (a) Three-dimensional phase portraits under θ = 0.3, 0.65, and 0.9, with all other parameters held constant. (b) Corresponding time-series trajectories of x, y, and z under the same θ settings.
Sustainability 18 08753 g008
Figure 9. Sensitivity of evolutionary trajectories to resource-utilization technology maturity ε. (a) Three-dimensional phase portraits under ε = 0.55, 0.60, and 0.75, with all other parameters held constant. (b) Corresponding time-series trajectories of x, y, and z under the same ε settings.
Sustainability 18 08753 g009
Figure 10. Interaction effects between behavioral and situational parameters on evolutionary trajectories. (a) Interaction between government incentive intensity μ and loss aversion λ. (b) Interaction between gain sensitivity α and technology maturity ε. (c) Interaction between loss sensitivity β and WGE governance effort θ.
Sustainability 18 08753 g010
Table 1. Parameters and descriptions.
ParameterDefinition
xProbability of LGs adopting G1 strategy
yProbability of WGEs adopting W1 strategy
zProbability of WUEs adopting M1 strategy
αGain sensitivity coefficient in the prospect-theoretic value function
βLoss sensitivity coefficient in the prospect-theoretic value function
λLoss aversion coefficient
μIncentive intensity of LGs
θRetained governance-input coefficient of WGEs
εTechnological maturity of PG resource utilization
C0Regulatory and policy implementation cost of LGs under G1
C1Full proactive governance cost borne by WGEs
C2Technology-adaptation and market-entry cost borne by WUEs
DGovernance performance benefit obtained by LGs under G1
R1Benefit obtained by WGEs under W1
R2Benefit obtained by WUEs under M1
R4Short-term benefit obtained by WGEs under W2
FPenalty imposed by LGs on WGEs under W2
HPerformance and accountability loss borne by LGs under G2
B1Subsidy provided by LGs to WGEs under W1 and G1
B2Subsidy provided by LGs to WUEs under M1 and G1
L2Market-abstention loss of WUEs under M2
Table 2. Perceived payoff matrix of all strategies.
No.Strategy
Combination
Perceived Payoff
of LGs
Perceived Payoff
of WGEs
Perceived Payoff
of WUEs
1G1 (x) V D + V C 0 + V B 1 + V B 2   V 1 ε C 1 + V R 1 + V ( B 1 )   V ε R 2 + V B 2 + V 1 ε C 2  
W1 (y)
M1 (z)
2G1 (x) V D + V C 0 + V F + V B 2   V θ C 1 + V R 4 + V F   V ε R 2 + V B 2 + V 1 ε C 2  
W2 (1 − y)
M1 (z)
3G1 (x) V D + V C 0 + V B 1   V C 1 + V R 1 + V ( B 1 )   V ( ε L 2 )  
W1 (y)
M2 (1 − z)
4G1 (x) V D + V C 0 + V F   V θ C 1 + V R 4 + V F   V ( ε L 2 )  
W2 (1 − y)
M2 (1 − z)
5G2 (1 − x)   V μ C 0 + V ( H )   V 1 ε C 1 + V R 1   V 1 ε C 2 + V ε R 2  
W1 (y)
M1 (z)
6G2 (1 − x)   V μ C 0 + V   μ F + V ( H )     V θ C 1 + V R 4 + μ V F   1 ε V C 2 + V ε R 2  
W2 (1 − y)
M1 (z)
7G2 (1 − x)   V μ C 0 + V ( H )     V C 1 + V R 1   V ( ε L 2 )  
W1 (y)
M2 (1 − z)
8G2 (1 − x) V μ C 0 + V ( H ) + V μ F   V θ C 1 + V R 4 + V μ F   V ( ε L 2 )  
W2 (1 − y)
M2 (1 − z)
Table 3. Eigenvalues of Equilibrium Points.
Equilibrium Point   λ 1     λ 2     λ 3  
E 1 ( 0 , 0 , 0 )     V 1 μ C 0 + V D + V 1 μ F V H   V 1 θ C 1 + V R 1 V R 4 V μ F   V 1 ε C 2 + V ε R 2 V ε L 2  
E 2 ( 1 , 0 , 0 )   V H V 1 μ F V 1 μ C 0 V D   V 1 θ C 1 + V R 1 V R 4 V F + V B 1   V 1 ε C 2 + V ε R 2 V ε L 2 + V B 2  
E 3 ( 0 , 1 , 0 )   V 1 μ C 0 + V D + V B 1 V H   V μ F V 1 θ C 1 V R 1 + V R 4   V 1 ε C 2 + V ε R 2 V ε L 2  
E 4 ( 0 , 0 , 1 )   V 1 μ C 0 + V D + V 1 μ F V H + V B 2   V 1 θ ε C 1 + V R 1 V R 4 V μ F   V 1 ε C 2 V ε R 2 + V ε L 2  
E 5 ( 1 , 1 , 0 )   V H V B 1 V 1 μ C 0 V D   V F V 1 θ C 1 V R 1 + V R 4 V B 1   V 1 ε C 2 + V ε R 2 V ε L 2 + V B 2  
E 6 ( 1 , 0 , 1 )   V H V 1 μ F V 1 μ C 0 V D V B 2   V 1 θ ε C 1 + V R 1 V R 4 V F + V B 1   V 1 ε C 2 V ε R 2 + V ε L 2 V B 2  
E 7 ( 0 , 1 , 1 )   V 1 μ C 0 + V D + V B 1 V H + V B 2   V R 4 + V μ F V 1 θ ε C 1 V R 1   V 1 ε C 2 V ε R 2 + V ε L 2  
E 8 ( 1 , 1 , 1 )   V H V B 1 V B 2 V 1 μ C 0 V D   R 4 + V F V 1 θ ε C 1 V R 1 V B 1   V 1 ε C 2 V ε R 2 + V ε L 2 V B 2  
Table 4. Parameter Setting for Evolutionary Game Model.
ParameterBaseline ValueCalibration Type
α 0.88Literature-based [35]
β0.88
λ2.25
C0100Public-input anchored [36]
B110Policy-anchored [37]
B230
F30Case-anchored [38]
C1120Enterprise-investment anchored [39,40,41,42]
C2150
R1150
R2200
R4100
D80Theory-constrained
H30
L230
Note: All baseline values are expressed as comparable payoff units in the evolutionary game model. Parameters with observable monetary anchors were calibrated from yuan/t-based policy, case, survey, or enterprise evidence, while non-market parameters were normalized to the same payoff scale according to payoff-ordering restrictions.
Disclaimer/Publisher’s Note: The statements, opinions and data contained in all publications are solely those of the individual author(s) and contributor(s) and not of MDPI and/or the editor(s). MDPI and/or the editor(s) disclaim responsibility for any injury to people or property resulting from any ideas, methods, instructions or products referred to in the content.