Article

PBAT-Based Biodegradable Foams as Lightweight Alternatives to Expanded Polystyrene: Effect of Blend Composition on Rheology, Foaming Behavior and Cellular Morphology

by
Desole Maria Pia
1,
Palangio Gianluca
2,
Gisario Annamaria
1,* and
Barletta Massimiliano
2
1
Department of Mechanical and Aerospace Engineering, Sapienza University of Rome, Via Eudossiana 18, 00184 Rome, Italy
2
Department of Industrial, Electronic and Mechanical Engineering, Via Vito Volterra 62, 00146 Rome, Italy
*
Author to whom correspondence should be addressed.
Sustainability 2026, 18(17), 8748; https://doi.org/10.3390/su18178748
Submission received: 29 June 2026 / Revised: 28 July 2026 / Accepted: 1 August 2026 / Published: 26 August 2026

Abstract

Growing environmental concerns and the need to replace fossil-based plastics have accelerated the development of biodegradable foamed materials for lightweight packaging. However, the limited melt strength and poor foamability of biodegradable polymers remain major challenges. This work proposes and systematically investigates novel multiphase biodegradable blend compositions based on PBAT, PLA, PBSA, and thermoplastic starch (TPS), specifically engineered to exploit the complementary properties of each component and improve foamability without compromising processability. The formulations were compounded by co-rotating twin-screw extrusion, processed into films by cast extrusion, and foamed using nitrogen as the blowing agent. Rheological, thermal, mechanical, and morphological characterizations were performed to evaluate the effect of polymer composition. F2 exhibited the highest melt flow rate (5.42 ± 0.10 g/10 min), whereas F1 showed superior melt stability and ductility. Foaming experiments revealed that blend composition significantly affected the cellular structure. F1 produced the most homogeneous cellular structure, exhibiting the highest cell circularity (0.826 ± 0.04). Independent density measurements also showed that F1 exhibited the lowest foam density (0.786 ± 0.02 g/cm3), whereas the TPS-containing formulation (F3) exhibited greater cell coalescence and partial cell collapse. The findings demonstrate that tailoring biodegradable blend composition, in combination with nucleating and chain-extending masterbatches, is an effective strategy to control foam morphology and enhance processing performance. The proposed formulation represents a promising alternative to expanded polystyrene for sustainable lightweight packaging applications.

1. Introduction

The production of polymeric foams holds considerable industrial relevance. In Italy, EPS consumption reached approximately 120,000 tons in 2024 [1], with a large proportion being employed in food packaging [2,3,4]. Expanded polystyrene (EPS) is widely used in the packaging sector owing to its low density [5,6], low cost [7,8], and favorable mechanical properties [9,10]. The high volume of waste generated, and the associated end-of-life management challenges have raised growing environmental concerns [11,12,13,14]. Furthermore, the introduction of EU Directive 2019/904 on single-use plastics has further stimulated the development of sustainable biodegradable alternatives for lightweight packaging applications [15,16,17,18].
Expandable biodegradable materials have attracted increasing attention as promising alternatives to conventional petroleum-based foams, particularly expanded polystyrene (EPS), in packaging applications, owing to their potential to reduce plastic waste and dependence on fossil resources while meeting the growing demand for sustainable materials [19]. However, despite their environmental advantages, their widespread industrial adoption remains limited by insufficient melt strength and difficulties in achieving stable cellular structures during foaming [20].
A potentially viable alternative is represented by bioplastics, which have attracted increasing interest due to their reduced environmental impact [21,22] and more manageable end-of-life options [23], linked to their biodegradability and compostability [24,25]. Despite their environmental advantages, biodegradable polymers still present important limitations for foaming applications. Compared with conventional plastics, they generally exhibit lower mechanical strength and reduced thermal stability [26,27,28,29,30], limited melt strength [31,32,33], and narrow processing windows [34,35,36]. From a rheological standpoint, parameters such as melt strength, extensional viscosity, and strain hardening behavior play a fundamental role in controlling nucleation, growth, and cell stabilization during polymeric foaming processes [37]. The foaming of bioplastics presents structural limitations arising primarily from low melt strength [38], narrow processing windows, and poor dimensional stability of the most widely used bio-based polymers [39]. Moreover, most studies in the literature have focused on single-component systems or on foaming processes conducted exclusively at the laboratory scale, whereas studies on multiphase blends processed via industrially relevant extrusion technologies remain limited. Materials such as PLA, PBAT, and TPS typically exhibit insufficient extensional viscosities to sustain cell growth, resulting in premature collapse or inadequate density reduction [40]. In PLA, accelerated crystallization during CO2 saturation further restricts the processing window, while sensitivity to moisture and temperature leads to hydrolytic degradation and molecular weight reduction during processing [41]. Bioplastic blends are often immiscible, generating unstable morphologies in the absence of compatibilization [42]. In the literature, these limitations are addressed, for example, in studies on PLA foaming via supercritical CO2 [43,44], the rheological weaknesses of PBAT during expansion [45,46], and the difficulties of stabilizing TPS foams without crosslinking or reinforcement [44,47]. These works converge in demonstrating that the effective expansion of bioplastics requires rheological modification, controlled nucleation, and the precise management of process thermodynamics [28,48]. A further relevant aspect concerns the use of reactive chain-extending systems, employed to improve the rheological stability and processability of biodegradable blends during thermomechanical processing. By reacting with the functional end groups of the polyester chains, these additives promote a partial restoration of the macromolecular structure (a “regrading” effect) achieved through chain extension and branching. Multifunctional epoxy-based chain extenders can promote chain extension, branching, and interfacial compatibilization through interaction with the functional end groups of biodegradable polyesters, thereby partially restoring the macromolecular structure. These effects contribute to increasing the apparent melt viscosity, melt strength, and cell structure stability during the foaming process, proving particularly important in multiphase biodegradable systems characterized by limited rheological stability and reduced controllability of cell growth. Despite the considerable body of work on biodegradable polymer foams, several critical limitations of previous studies remain unresolved and continue to hinder the industrial translation of these materials. First, the vast majority of investigations focused on single-polymer systems—most notably neat PLA or PLA-based binary blends foamed with supercritical CO2—while multiphase blends combining PBAT, PLA, PBSA, and TPS within a single formulation remain comparatively underexplored, despite their potential to simultaneously address ductility, thermal stability, bio-based content, and cost [49]. Second, although chain extenders and nucleating agents have been individually studied as rheological modifiers or cell-structure controllers, their combined and tailored use within multiphase biodegradable systems has not been systematically investigated, and the interaction between blend composition and additive strategy in determining cellular morphology is still poorly understood [50,51]. Third, most literature studies report foaming trials conducted exclusively at laboratory scale with limited rheological characterization, and very few works have integrated plastograph-based optimization of melt stability with subsequent foaming experiments to rationally link rheological behavior to cellular structure [52]. Finally, although TPS is increasingly incorporated to raise the bio-based fraction of biodegradable blends, its detrimental effect on melt strength and on the homogeneity of the cellular structure during expansion is well-documented but only partially mitigated, and comparative studies on TPS-containing versus TPS-free multiphase systems processed under identical foaming conditions are scarce [53]. These gaps collectively indicate that a coherent strategy capable of simultaneously tailoring blend composition, nucleating efficiency, and chain-extension behavior while providing an integrated rheological, thermal, and morphological assessment is still lacking. The present work addresses this gap by proposing and systematically investigating three novel multiphase biodegradable formulations based on PBAT/PLA, PBAT/PBSA/PLA, and PBAT/TPS, combined with specifically designed nucleating and reactive chain-extending masterbatches. The formulations were designed to provide different balances of stiffness, ductility, thermal stability, and melt processability by varying the proportions of PBAT, PLA, PBSA, and TPS. The integrated evaluation of blend composition, rheological optimization through plastograph analysis, thermal and mechanical characterization, and quantitative foam morphology provides new processing–structure–property relationships for nitrogen-foamed biodegradable materials. Unlike previous studies, which have mainly focused on single polymers or isolated additives, the present work demonstrates how the combined optimization of blend composition and reactive modification can improve melt stability, processability, and cellular morphology, providing a promising strategy for the development of expandable biodegradable alternatives to expanded polystyrene.

2. Materials and Methods

2.1. Materials

Table 1 shows the compositions of Formulation 1 (F1), Formulation 2 (F2), and Formulation 3 (F3) investigated in the present study. In all formulations developed, both the primary and secondary matrices were composed of biodegradable and compostable polymers [54,55]. In Formulation F2, a third biodegradable polymeric phase (PLA Luminy LX 175) was incorporated together with PBAT at a 1:1 weight ratio (29.35 wt.% each), while BioPBS was used as the primary matrix. This composition was selected to tailor the rheological behavior and mechanical properties of the blend. The materials used include PBAT TH 801/2 Resin (Novamont S.p.A., Novara, Italy), PLA Ingeo Biopolymer 2003D (NatureWorks LLC, Minnetonka, MN, USA), BioPBS FM92PM (Mitsubishi Chemical Corporation, Tokyo, Japan) (PBSA), PLA Luminy LX 175 (TotalEnergies Corbion, Gorinchem, The Netherlands), and TPS Amitroplast 8945 (AMITROPLAST GmbH, Gmünd, Austria). An additive package consisting of processing additives, reactive modifiers, and thermo-oxidative stabilizers was also incorporated into the formulations to improve melt processability, enhance compatibility among the different polymer matrices, and ensure thermo-mechanical stability during the extrusion and foaming processes. Specifically, the additive package was designed to promote melt dispersion, increase the rheological stability of the system, and minimize degradation phenomena during the thermo-mechanical processing of the biodegradable blends investigated in this study.
Subsequently, nucleating and chain-extending masterbatches were produced by twin-screw extrusion and used to modify the investigated biodegradable formulations. The nucleating masterbatches were developed to improve melt stability and facilitate the control of cellular morphology during the foaming process, whereas the chain-extender masterbatches were developed to modulate the rheological behavior of blends and to optimize processability. For the nucleating masterbatches, the additive was introduced at a fixed concentration of 5 wt.% in all final formulations. In contrast, the concentration of the chain-extending masterbatch was varied (2, 3.5, and 5 wt.%) to evaluate its effect on the rheological behavior and plastograph response of the biodegradable blends. Based on the plastograph results, the 5 wt.% chain-extending masterbatch was selected for the subsequent foaming experiments as it provided the highest maximum torque values and the strongest rheological reinforcement of the investigated biodegradable blends. The selected concentration represented the best compromise between rheological reinforcement and melt processability and was therefore adopted for all subsequent foaming experiments. Table 2 shows the composition of the nucleating masterbatches developed for the F1, F2, F3 formulations, containing various combinations of PBAT, PLA, PBSA, TPS, and a nucleating agent. The nucleating additive, used in the masterbatches, belongs to the class of inorganic mineral-based nucleating agents and was designed to promote heterogeneous nucleation by increasing the number of nucleation sites, thereby improving cell density, cell uniformity, and the control of cellular morphology during the foaming process. In particular, the nucleating additive was used at a weight concentration of 20 wt.% in all formulations of nucleating masterbatches. Table 3, instead, shows the composition of chain-extending masterbatches developed for the F1, F2, F3 formulations. In this case, a reactive additive was used at a weight fixed concentration of 10 wt.%, whereas the remaining portion of the formulation consisted of the different biodegradable polymer matrices investigated. The reactive additive employed in the chain-extending masterbatches belongs to the class of multifunctional chain extenders and is designed to react with the hydroxyl and carboxyl end groups of biodegradable polyesters, promoting chain extension, long-chain branching, and interfacial compatibilization. These reactions increase melt strength, improve rheological stability, and enhance the stability of the cellular structure during foaming. In particular, the additive was used to promote the intermolecular interactions between the various biodegradable polymer phases to improve the melt stability and the rheological behavior during the thermo-mechanical processing. Such effects may help limit the excessive reduction in system viscosity during the melting process, promoting greater stability of both the polymer structure and the cellular morphology during foaming. Overall, the developed masterbatches were designed to improve rheological stability, melt processability, and control of the cellular structure during the foaming process. The commercial identities of the reactive chain extender and nucleating masterbatch cannot be disclosed due to industrial confidentiality agreements. Nevertheless, their chemical class, functional role, and concentration are reported to ensure the scientific interpretation of the results and to enable reproducibility of the experimental methodology. Furthermore, the mechanisms by which these additives influence melt rheology, interfacial compatibilization, and cell nucleation are discussed based on their known chemical functionality rather than on proprietary product identities.

2.2. Extrusion Process

2.2.1. Twin Extrusion Process

All formulations were compounded using a Comac 26 co-rotating twin-screw extruder, with a screw diameter of 26 mm and L/D ratio of 48. The co-rotating twin-screw has 12 thermoregulated zones. Table 4 reports the extrusion process parameters for the three formulations. For all extrusion processes, a humpback temperature profile was adopted, which was chosen as it allows for gradual and controlled melting of the compound. In particular, the increase in temperature in the central zone promotes complete melting of the material and a better homogenization of the polymer melt; subsequently, the decrease in temperature in the final zones reduces polymer thermal degradation and contributes to increasing melt strength [56].
Furthermore, Table 4 reports further key extrusion process parameters:
  • the screw rotation speed, which varies as a function of the formulation (ranging from 280 rpm for the first formulation to 330 rpm for the third);
  • the melt temperature of the polymer, which remained consistently lower than the maximum temperature set in the central zone;
  • the pressure exerted by the melt during the extrusion process.

2.2.2. Cast Extrusion Process

Cast extrusion trials were performed using a MiniCast 20 laboratory line (Eurexma S.r.l., Castano Primo, Italy). The system features a single-screw extruder with a screw diameter of 20 mm, coupled with a 200 mm wide flat die equipped with adjustable lips, and a thermoregulated chill-roll calendering system. The extruded melt was collected on a chill roll maintained at a controlled temperature to ensure rapid and uniform cooling of the film. Process parameters were optimized for each formulation to obtain homogeneous films with consistent thickness and good surface quality. The processing parameters were selected through preliminary extrusion trials to obtain continuous films with uniform thickness, stable melt flow, and defect-free surfaces while minimizing thermal degradation of the biodegradable polymers. The barrel temperature profile was set according to the thermal characteristics of each blend, following a gradual increase from the feed zone to the die to ensure complete melting and adequate melt homogeneity [57]. The chill roll temperature and line speed were adjusted to minimize defects such as wrinkles, thickness variations, and surface irregularities.
Table 5, Table 6 and Table 7 report the main process parameters adopted for the three formulations during cast extrusion.

2.3. Pellet Characterization

2.3.1. Rheological Characterization

The rheological properties of the materials were evaluated using melt flow rate (MFR) tests and capillary rheometry. MFR measurements were carried out using an AMSE MFI-1221 XNR-400 apparatus in compliance with the ISO 1133 standard [58]. The tests were performed at a temperature of 190 °C under a 2.16 kg load. This temperature was selected as a trade-off condition to ensure the complete melting of all polymer components while preventing thermal degradation, particularly of the PLA- and TPS-based phases. Capillary rheometry analyses were performed using an Instron CEAST SmartRHEO R20 capillary rheometer. The formulations were tested at temperatures of 160, 165, and 170 °C, which were selected to guarantee the complete melting of the materials while minimizing the risk of thermal degradation.

2.3.2. Thermal Characterization

Differential scanning calorimetry analyses were conducted by DSC3 (Mettler Toledo, Columbus, OH, USA) in compliance with the standard ISO 11357 [59]. For the first formulation, the heating scan was performed from −70 to 210 °C, whereas the temperature range adopted for the third formulation was between −70 and 190 °C; for the second formulation, the ramp spanned from −90 to 210 °C. The degree of crystallinity was calculated using Equation (1):
X C = Δ H mi Δ H ci w i     Δ H mi 0   ×   100
Table 8 describes the parameters used in Equation (1).
Where Δ H m i and Δ H c i are the melting and cold-crystallization enthalpies, respectively, Δ H m i 0 is the enthalpy of fusion of a 100% crystalline polymer, and w i is the weight fraction of polymer i in the blend. Since no cold crystallization peak was detected in the analyzed samples, the value of Δ H c i was assumed to be zero, and the crystallinity calculation was performed exclusively considering the enthalpy contribution of melting.

2.3.3. Fourier Transform Infrared Spectroscopy (FTIR)

FTIR spectroscopic characterization was carried out via an FT/IR-6600 spectrometer (JASCO Europe s.r.l., Cremella, Italy) equipped with an attenuated total reflectance (ATR) accessory. Three independent samples were analyzed for each formulation. The spectra were recorded over the 600–4000 cm−1 wavenumber range, utilizing a spectral resolution of 0.4 cm−1 and averaging 128 scans for each spectrum. All analyses were performed directly on the pellets of each formulation.

2.3.4. Mechanical Characterization

Mechanical characterization was performed on dog-bone specimens designed to ensure a uniform stress distribution during testing. Tensile tests were carried out using a Shimadzu AGS-X universal testing machine (Shimadzu Corporation, Tokyo, Japan) in accordance with ISO 527-1 and ISO 527-2, at a crosshead speed of 50 mm/min. The tensile strength, Young’s modulus, and elongation at break were determined from the stress–strain curves. Impact tests were performed using an AMSE instrumented pendulum impact tester (Turin, Italy) equipped with a 5.5 J pendulum.

2.4. Film Characterization

Tensile Test and FTIR Analysis

The mechanical properties of the films obtained by the cast extrusion process were evaluated through tensile tests performed in accordance with the ASTM D882 [60] standard, specifically designated for determining the tensile properties of thin plastic sheeting. The tests were conducted using a Shimadzu AGS-X universal testing machine (Shimadzu Corporation, Tokyo, Japan) equipped with a load cell suitable for the low thickness of the samples. The tests were carried out at room temperature with a crosshead speed of 10 mm/min. For each formulation, at least five specimens were tested to ensure the reproducibility of the results. The main mechanical parameters, including elastic modulus, tensile strength, yield strength, and elongation at break, were determined from the tests.
FTIR spectroscopic characterizations of the films were performed using an FTIR-6600 spectrometer (JASCO Europe s.r.l., Cremella, Italy) operating in attenuated total reflectance (ATR) mode. Spectra were acquired in the range between 600 and 4000 cm−1 with a resolution of 0.4 cm−1, accumulating 128 scans per sample. FTIR analyses were utilized to evaluate any chemical modifications induced by the extrusion process and by the presence of rheological and chain-extending additives in the different film formulations.

2.5. Process Optimization

Plastograph tests were performed using a HAAKE™ PolyLab HAPRO plastograph, (Thermo Fisher Scientific, Karlsruhe, Germany), equipped with an internal mixing chamber. The plastograph tests were conducted to monitor torque evolution during mixing and assess the influence of the chain-extending additive on the rheological behavior of the biodegradable blends. All tests were conducted at a constant rotation speed of 50 rpm, continuously monitoring torque (Tq), rotation speed (Sp), mixing chamber temperature (Tm1), and the temperatures of the different control zones (T1, T2, T3) as a function of time. During the tests, an initial thermal profile of approximately 160 °C was adopted for the various control zones, while the melt temperature inside the mixing chamber progressively increased, reaching values between 170 and 175 °C. The chain-extending additive was introduced after approximately 300 s of mixing at weight concentrations of 2%, 3.5%, and 5 wt.% to analyze its effect on the evolution of melt viscosity and the rheological stability of the system. The total duration of each test was 1200 s.

2.6. Foaming Process

The foaming process was conducted using a laboratory reactor equipped with a control system for temperature, pressure, and mixing speed. For this purpose, a PressureSyn vessel (Asynt Ltd., Isleham, Cambridgeshire, UK) was employed, operated at an initial pressure of 40 bar, which increased to approximately 60 bar upon reaching the saturation temperature of 165 °C. The polymeric material was introduced into the process chamber and brought to complete melting under controlled conditions; subsequently, nitrogen was introduced as the blowing agent. The saturation phase was maintained for approximately 1 h to promote nitrogen diffusion into the polymer melt. Following the saturation phase, the temperature was lowered to 145 °C for about 30 min to allow the polymer melt to resolidify; thereafter, a rapid pressure release induced cell nucleation and growth, leading to the formation of the foamed structure. The foaming process was performed under static conditions, without mechanical agitation. The main processing parameters considered were saturation temperature, saturation pressure, residence time, and depressurization rate. The selected foaming conditions were established through preliminary optimization trials aimed at maximizing nitrogen dissolution while preserving melt stability and preventing premature thermal degradation of the biodegradable blends. A saturation temperature of 165 °C ensured the complete melting of all investigated formulations, whereas the subsequent cooling step to 145 °C increased the melting strength before depressurization, thereby promoting more stable cell nucleation and growth. Similarly, the selected saturation pressure and residence time provided sufficient nitrogen diffusion into the polymer melt while minimizing processing-induced degradation.

Optical Microscopy and Image Analysis

The cellular morphology of the foamed biodegradable formulations was evaluated via optical microscopy using an optical microscope operated at a magnification of approximately 20× with a 1 mm scale bar. Representative images of the cross-sections of the foamed samples were acquired, maintaining constant illumination and acquisition conditions. The obtained micrographs were subsequently processed through image analysis using ImageJ v1.54 software (Asynt Ltd., Isleham, Cambridgeshire, UK). The images were converted to 8-bit grayscale format and processed via threshold segmentation to distinguish the cellular regions from the polymer matrix. Subsequent morphological filtering operations were applied to improve cell identification and reduce image noise. The quantitative image analysis included cell area, equivalent cell diameter, apparent porosity, circularity, and two-dimensional areal cell density. The equivalent cell diameter, D e q , was calculated from the measured projected cell area assuming an equivalent circular geometry, according to Equation (2):
D eq =   2 A c π  
where A c is the projected area of the individual cell. The two-dimensional areal cell density,   N A , was calculated according to Equation (3):
N A =   N C A img  
where N c   is the number of cells identified within the analyzed region and A img   is the corresponding image area. The areal cell density was expressed as cells/mm2 [61].
The analysis allowed for a semi-quantitative comparative evaluation of the cellular morphology of the investigated compounds, including average cell area, equivalent cell diameter, apparent porosity, circularity, and two-dimensional areal cell density. Since the analysis was performed via optical microscopy, the obtained results were primarily used for the relative comparison of the cellular structure developed during the foaming process.

2.7. Statistical Analysis

Statistical analysis was performed using OriginPro 2025 (OriginLab Corporation, Northampton, MA, USA). Experimental results are reported as the mean ± standard deviation (SD). Differences among the investigated formulations were evaluated by one-way analysis of variance (ANOVA). When statistically significant differences were detected (p < 0.05), Tukey’s honestly significant difference (HSD) post hoc test was applied for pairwise comparisons. Different lowercase letters within the same row or column (where applicable) indicate statistically significant differences among formulations according to Tukey’s HSD test (p < 0.05). Values sharing the same letter are not significantly different. Statistical analysis was performed only for datasets representing the same response variable across all formulations. The DSC crystallinity values were not statistically compared because they were calculated for different polymeric phases (PBAT, PBSA, and PLA), each using its own reference melting enthalpy, and therefore do not represent the same response variable.

2.8. Experimental Workflow

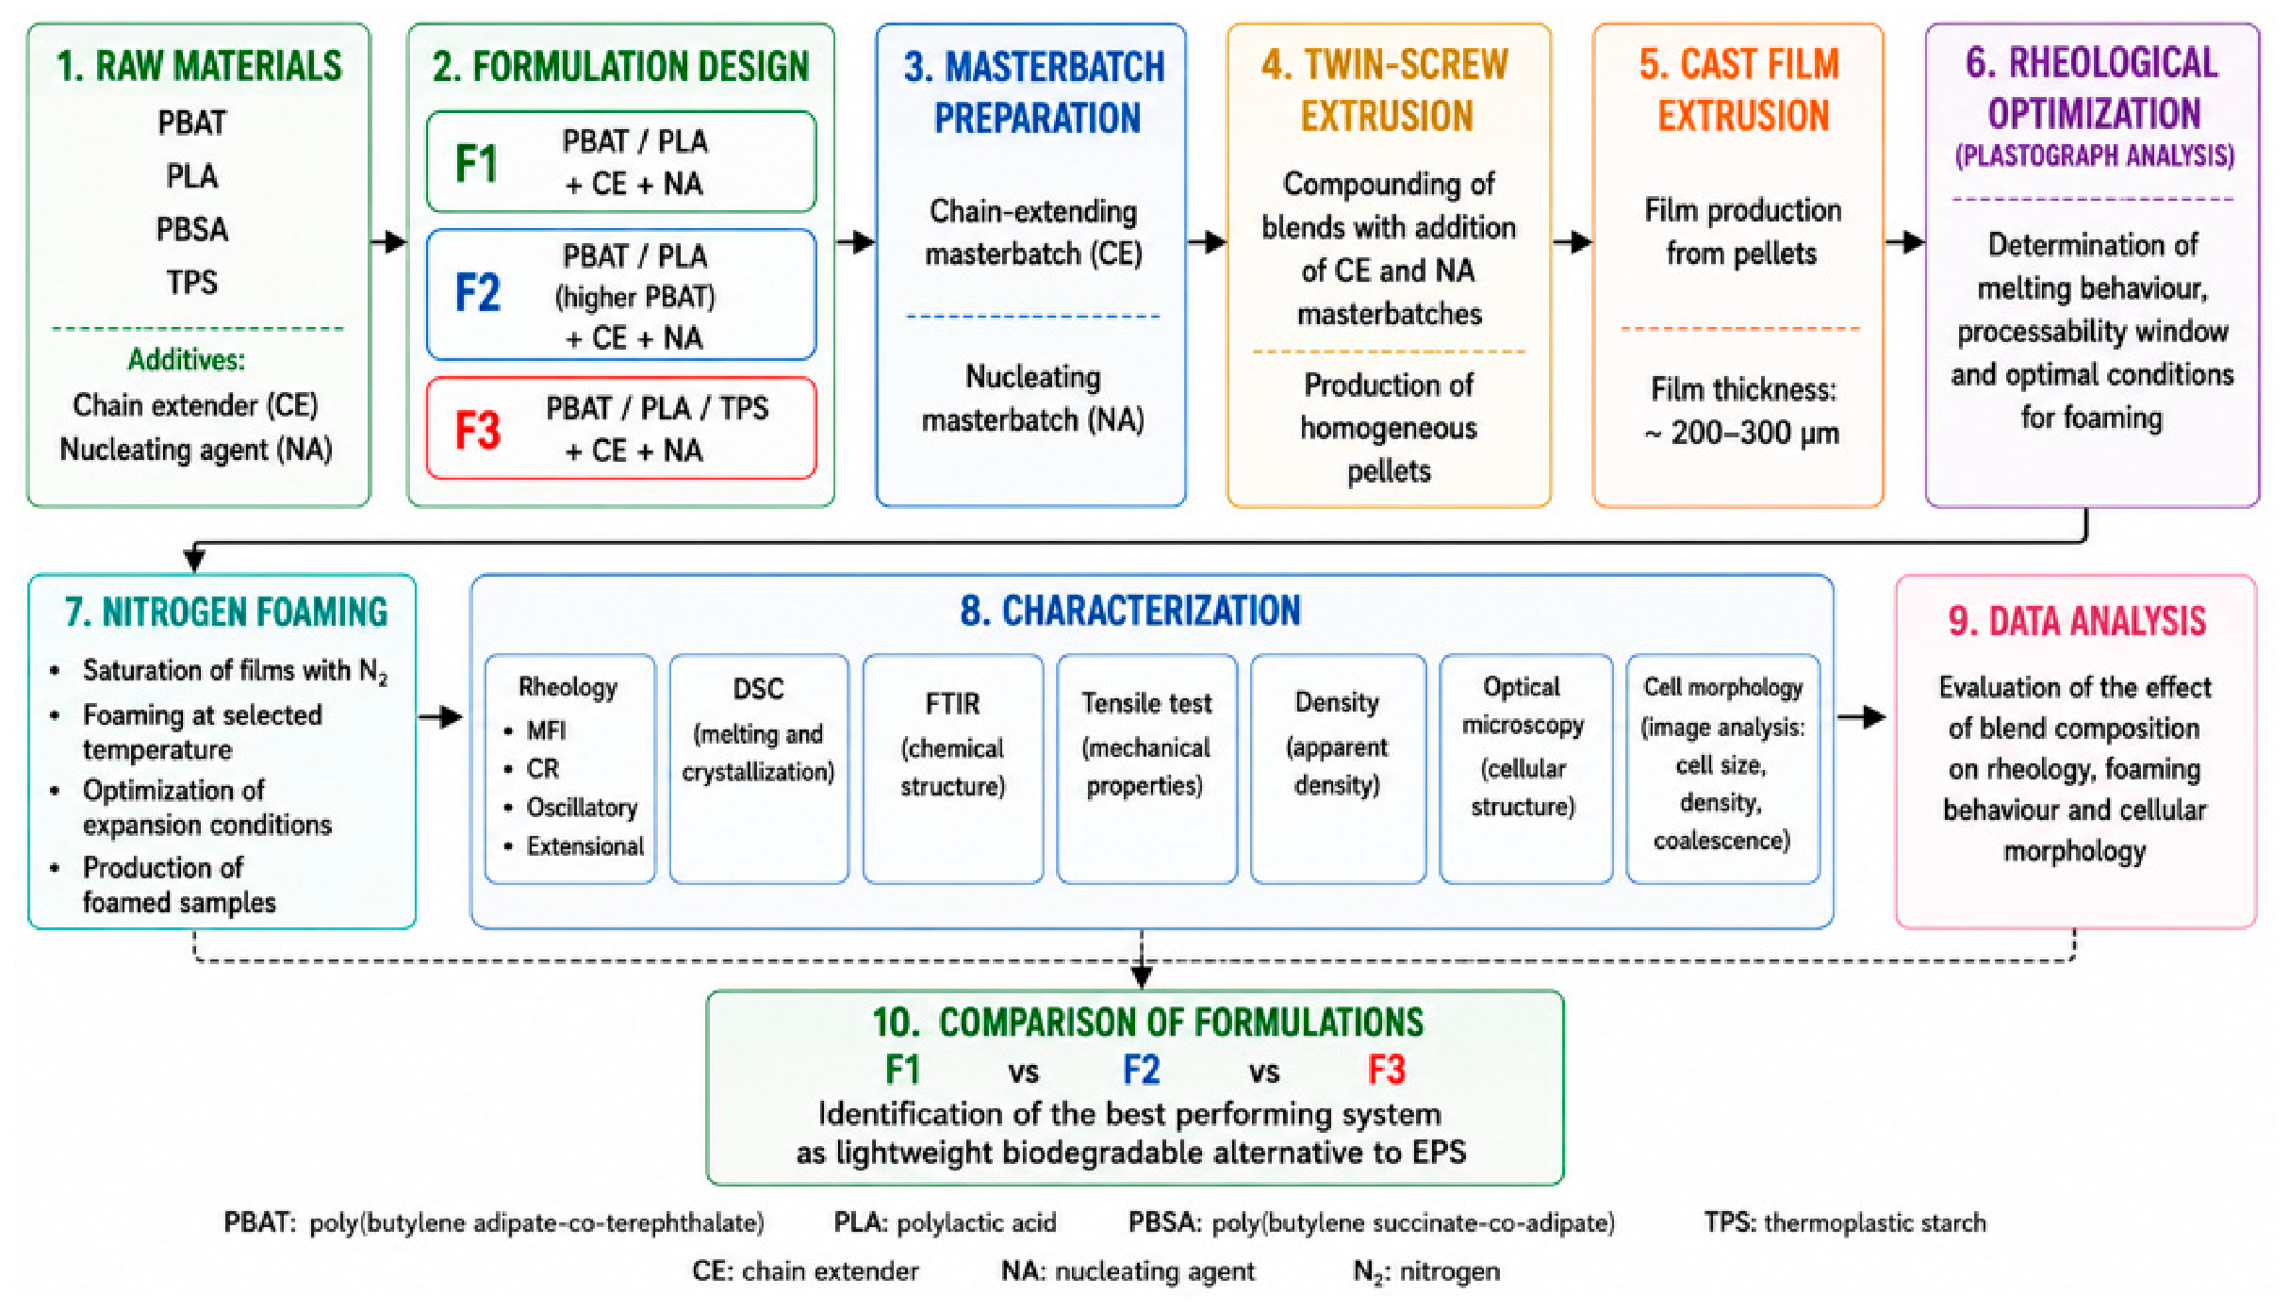
In the first phase, the base formulations (without the nucleating and chain—extender additive) and their corresponding films were produced and characterized by twin-screw extrusion and cast extrusion processes. Subsequently, nucleating and chain-extending masterbatches were developed and used to modify the rheological behavior of the blends. The formulation containing 5 wt.% chain-extending masterbatch was subsequently selected for the foaming stage to evaluate the effect of the additives on processability and melt stability. Figure 1 summarizes the overall experimental workflow adopted in this study. Three biodegradable formulations were prepared and processed following the same experimental procedure to evaluate the influence of blend composition on rheological behavior, foaming performance, and cellular morphology. The workflow includes formulation design, preparation of the masterbatches, melt compounding, cast film extrusion, rheological optimization, nitrogen-assisted foaming, and the subsequent thermal, rheological, mechanical, and morphological characterization.
The experimental design was conceived to investigate the influence of blend composition on the processing behavior and final properties of biodegradable foams. The variables investigated, the controlled processing parameters, and the response variables considered in this study are summarized in Table 9. Blend composition (F1–F3) was defined as the primary independent variable, whereas the foaming conditions (saturation temperature, saturation pressure, residence time, and depressurization procedure), together with the nucleating masterbatch content (5 wt.%) and the chain-extending masterbatch content selected for the foaming stage (5 wt.%), were maintained constant throughout the foaming experiments. In contrast, the extrusion processing parameters were adjusted for each formulation to ensure stable processing and the production of homogeneous films prior to foaming. The effects of blend composition were subsequently evaluated through rheological, thermal, mechanical, and morphological characterization.

3. Results and Discussion

3.1. Twin Extrusion Process

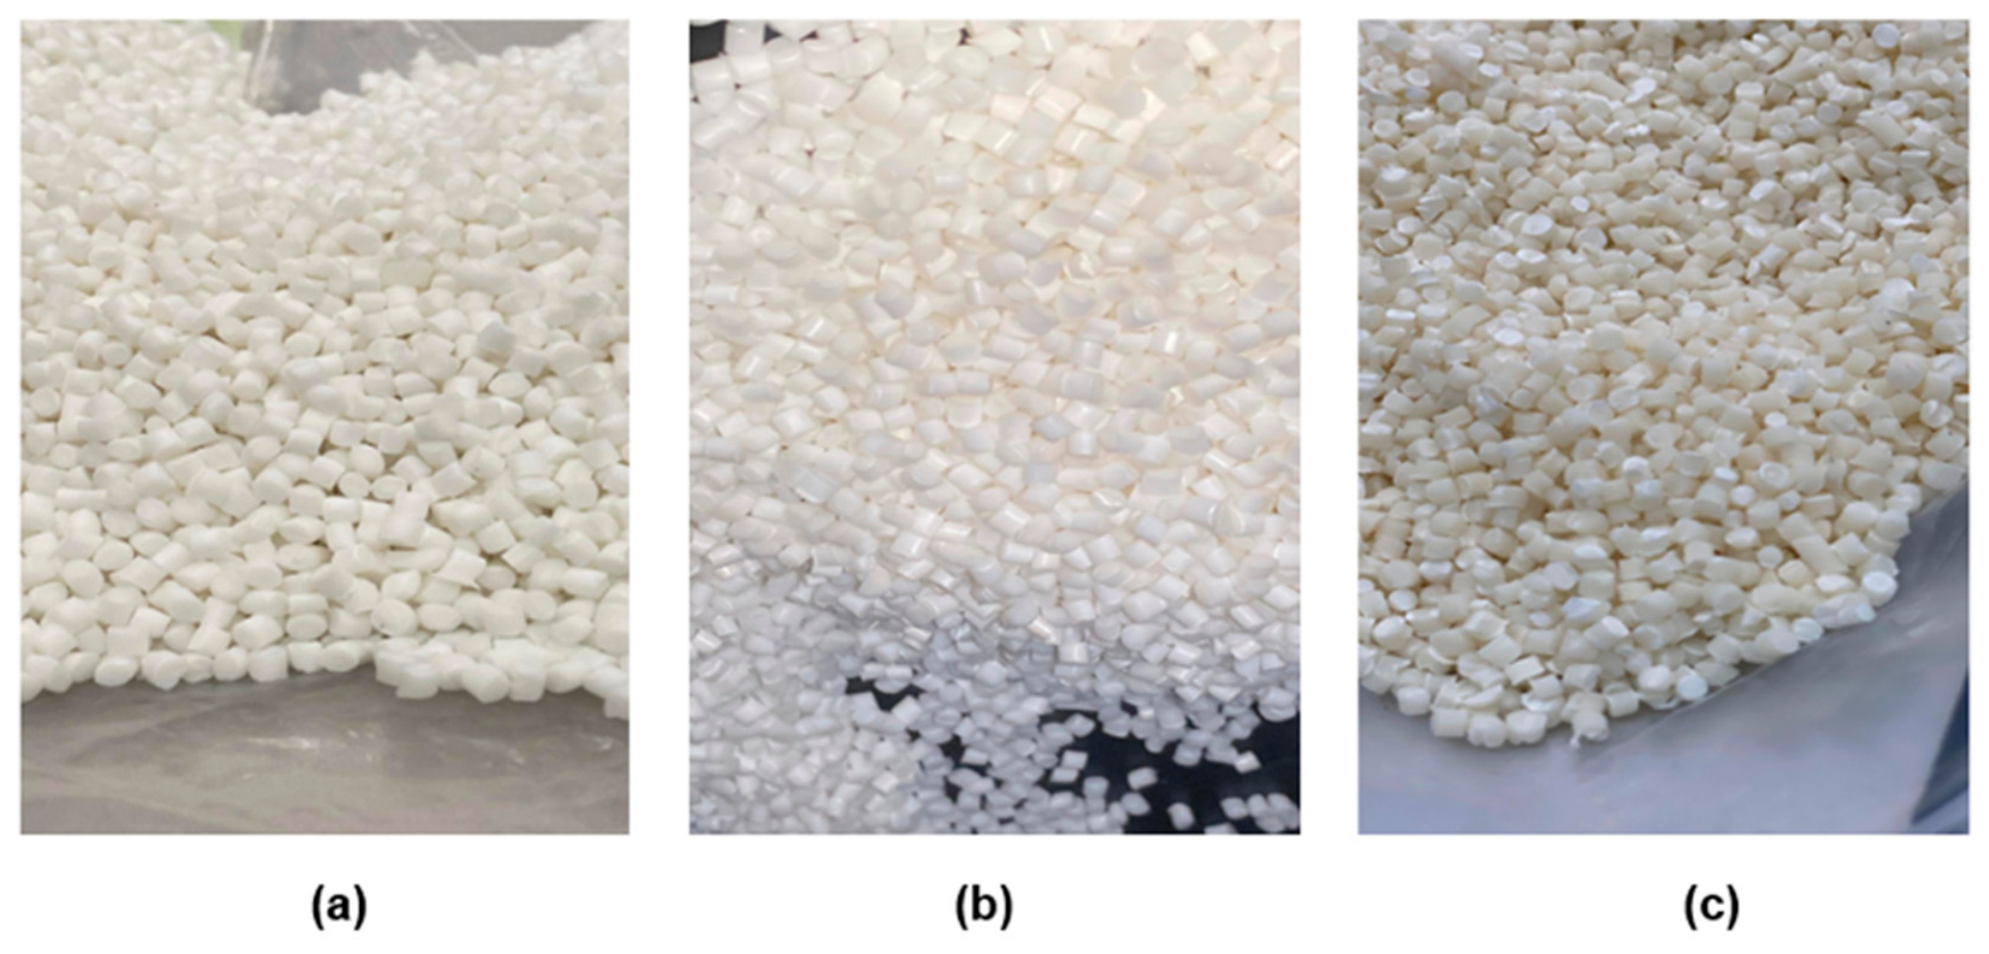
Twin-screw extrusion trials enabled the production of the biodegradable compounds F1, F2, and F3 through melt blending, highlighting distinct processing behaviors as a function of polymer composition. For all blends, a “humpback” thermal profile was adopted, which promoted gradual melting of the material, thereby enhancing melt homogenization and limiting thermo-oxidative degradation phenomena. F1 exhibited good processing stability and a steady melt flow during extrusion. F2 showed the highest fluidity and processability among the analyzed formulations, consistent with subsequent rheological results. Conversely, formulation F3, containing TPS, exhibited lower melt stability and lower pressure values, suggesting higher sensitivity of the system to the thermo-mechanical processing conditions. Figure 2 shows the final pellets obtained via the twin-screw extrusion process for the biodegradable formulations F1, F2, and F3, which are characterized by a relatively homogeneous morphology and good dimensional uniformity.
These differences may be related to the distinct rheological and thermal responses of the polymer phases in each formulation. The higher processability of F2 is consistent with its higher MFR and lower apparent viscosity, whereas the TPS-containing F3 may be more sensitive to moisture and thermo-mechanical history, contributing to its lower melt pressure and reduced processing stability [62].

3.2. Cast Extrusion Process

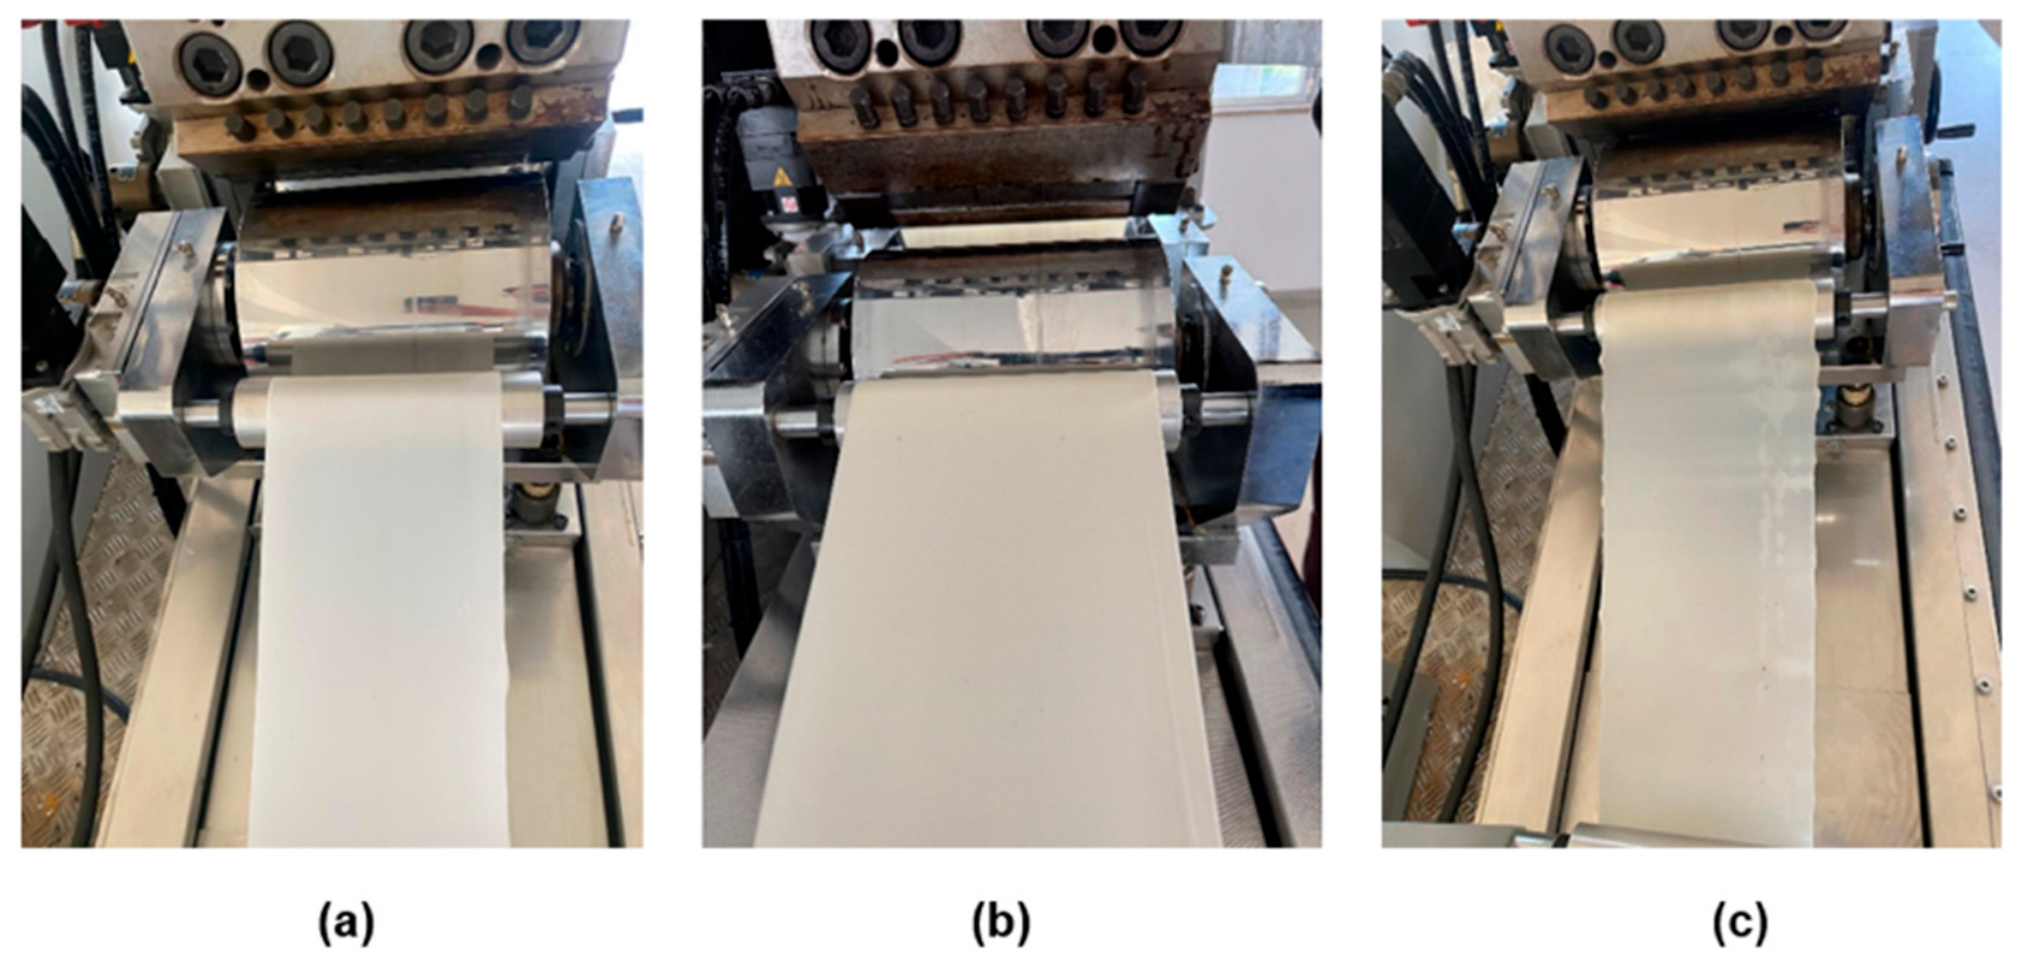
Figure 3 shows the films obtained by the cast extrusion process from the investigated biodegradable formulations. Specifically, formulations F1 and F2 exhibited a similar processing behavior, allowing to produce continuous, homogeneous films characterized by good stability during winding. Both films showed a relatively uniform surface and good behavior when passing through the calender rolls, indicating adequate melt processability under the adopted operating conditions. In contrast, formulation F3 displayed lower stability during the cast extrusion process, resulting in the formation of surface irregularities and reduced uniformity of the produced film. This behavior can be associated with the different blend composition and the distinct rheological behavior of the blend, which affects melt stability and thickness control during film cooling and winding. The different stability and uniformity conditions observed during the cast extrusion process also influenced the subsequent foaming behavior.
Stable film formation requires an appropriate balance between melt resistance, deformability, and relaxation during drawing and cooling. The more stable behavior of F1 and F2 suggests that these blends were better able to withstand the tensile stresses generated during haul-off and calendering [63].

3.3. Pellet Characterization

3.3.1. Melt Flow Rate (MFR)

The melt flow rate values show a clear effect of polymer composition on the rheological behavior of the three formulations. F1 exhibited an MFR of 3.56 ± 0.10 g/10 min, consistent with its high PBAT and PLA content, which resulted in relatively high melt viscosity, as shown in Table 10. F2 reached the highest MFR (5.42 ± 0.10 g/10 min), which can be attributed to the combined presence of BioPBS and PLA Luminy, materials characterized by lower melt viscosity and improved flowability under load. F3 exhibited an intermediate MFR (4.36 ± 0.28 g/10 min), influenced by the predominance of PBAT and the incorporation of TPS. This behavior may be explained by the combined rheological response and phase morphology of the PBSA/PBAT/PLA system. Conversely, the lower MFR of F1 indicates greater resistance to melt flow, whereas the intermediate MFR of F3 may reflect the heterogeneous nature and moisture sensitivity of the PBAT/TPS blend.
These findings are consistent with the rheological trends observed by capillary rheometry [3]. One-way ANOVA indicated a statistically significant effect of formulation on the MFR (F(2,6) = 77.31, p < 0.0001). Tukey’s HSD post hoc test showed that the MFR values of all three formulations were significantly different from each other (p < 0.05), confirming that polymer composition significantly affects melt flow behavior. The observed differences highlight the crucial role of polymer composition in determining melt fluidity, and consequently, the processability of the investigated formulations.

3.3.2. Capillary Rheometry

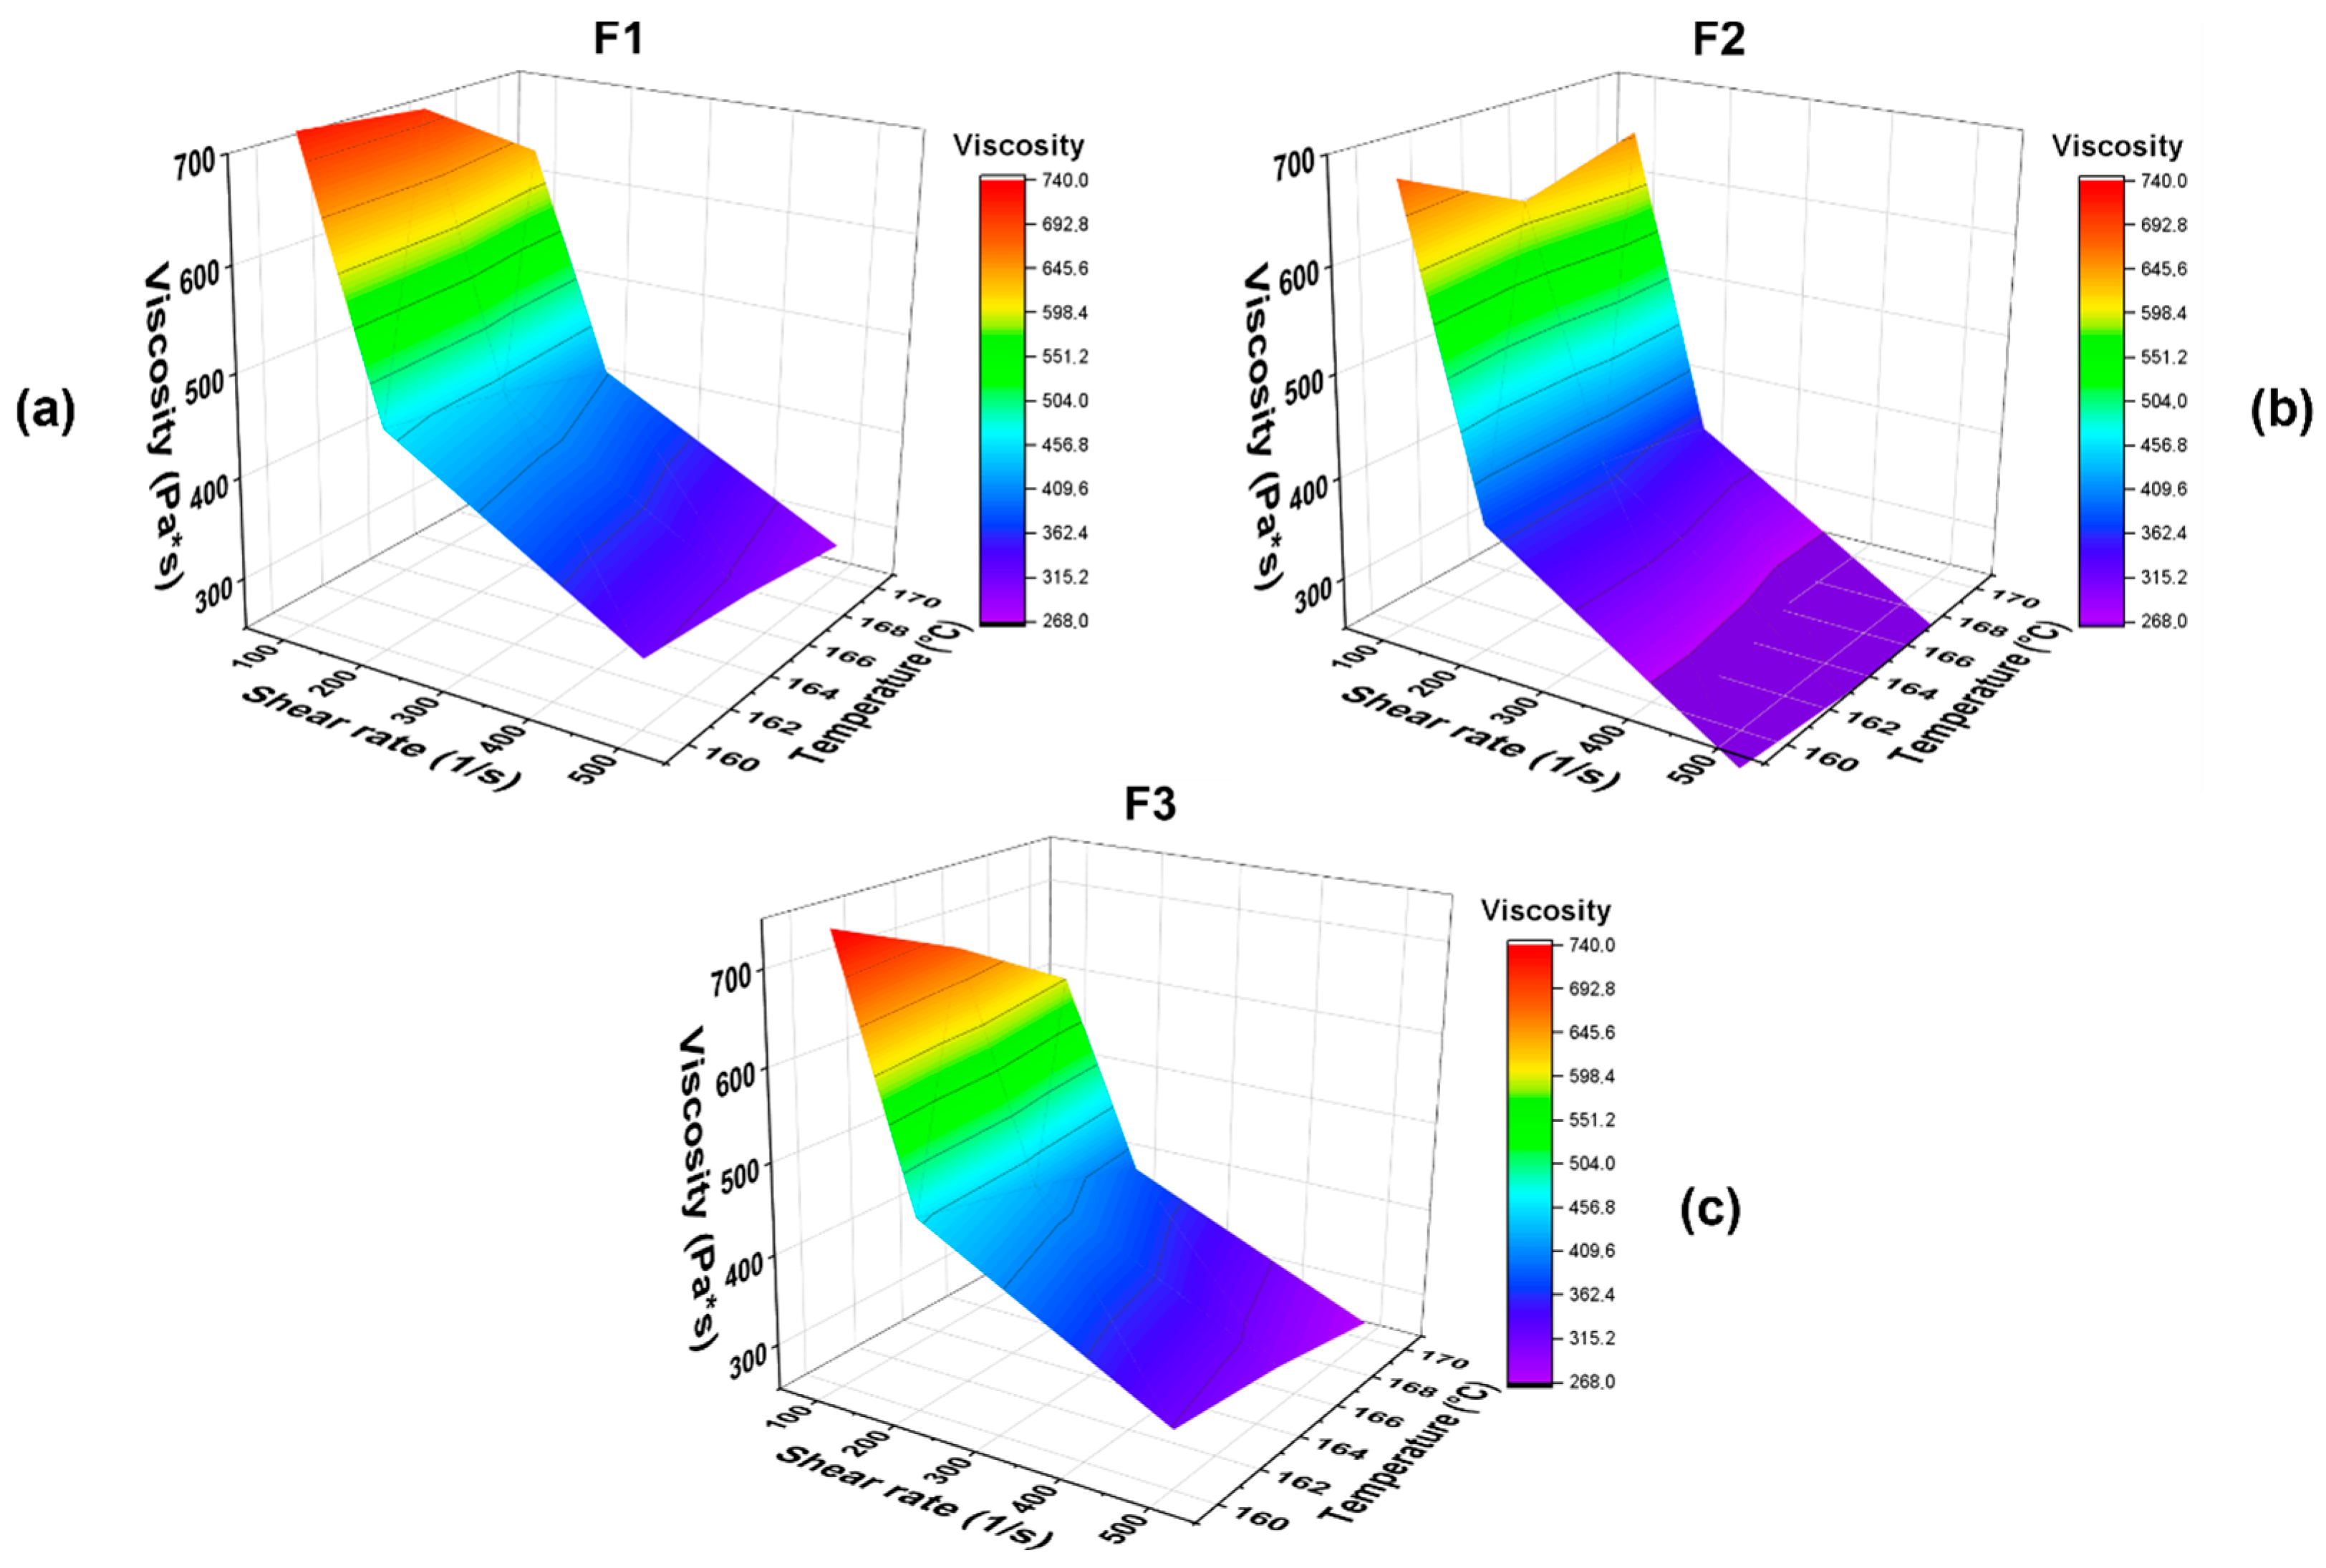
The three-dimensional rheological maps shown in Figure 4 display the combined effect of temperature and shear rate on the apparent viscosity of the biodegradable formulations F1, F2, and F3. In all systems, a progressive decrease in viscosity was observed with increasing both temperature and shear rate, highlighting a pseudoplastic behavior typical of polymer melts [64]. At low shear rates, all formulations exhibited high viscosities, associated with a greater resistance of the melt to flow. With increasing shear rate, a marked shear thinning phenomenon was observed, attributable to the orientation of the polymer chains and the reduction in intermolecular interactions during flow. Concurrently, increasing the temperature from 160 °C to 170 °C led to a reduction in apparent viscosity, indicating enhanced mobility of the macromolecular chains and a decrease in the viscous resistance of the system. Comparison among the formulations revealed that F1 and F3 exhibited slightly higher viscosities than F2, suggesting a higher resistance to flow under the investigated conditions. Specifically, at a temperature of 170 °C and a shear rate of 500 s−1, F2 showed an apparent viscosity of approximately 145 Pa·s, which was lower than those of F1 (~185 Pa·s) and F3 (~170 Pa·s), thereby highlighting higher melt fluidity. However, since capillary rheology measurements were performed without experimental replicates, these differences should be interpreted as qualitative rheological trends rather than statistically validated differences. Nevertheless, the observed behavior is consistent with the higher torque values obtained from plastograph analysis and with the subsequent foaming performance, supporting the interpretation that F1 and F3 may have exhibited greater resistance to melt deformation during processing. These rheological differences are particularly relevant for the subsequent foaming process, as they directly influence cell nucleation, growth, and stabilization during expansion, as reported for biodegradable PLA systems [65].
The MFR results are consistent with the rheological maps obtained by capillary rheometry, indicating that F2 exhibits higher melt fluidity, whereas F1 and F3 exhibit higher viscosity and therefore greater resistance to flow. The higher MFR of F2 may result from the combined rheological response of the PBSA-, PBAT-, and PLA-based phases and from the multiphase morphology developed during melt blending. Conversely, the lower MFR of F1 suggests reduced chain mobility and a greater resistance of the PBAT/PLA matrix to shear deformation under the investigated conditions. The pseudoplastic behavior observed for all formulations is associated with the progressive orientation and disentanglement of the polymer chains along the flow direction as the shear rate increases [66,67]. Sufficiently high melt viscosity can improve cell-wall stability during expansion; however, excessively high resistance to flow may also restrict cell growth. Therefore, foamability depends on the balance between melt resistance and deformability rather than on viscosity alone.
Although dynamic oscillatory rheological measurements (e.g., storage modulus, loss modulus and loss tangent) were not performed in the present study, the combined use of MFR, capillary rheometry and torque plastograph analysis provided a consistent comparative assessment of melt stability and processability among the investigated formulations. Future work will include oscillatory rheological characterization to further quantify melt elasticity and strain-hardening behavior during the foaming process.

3.3.3. Differential Scanning Calorimetry (DSC)

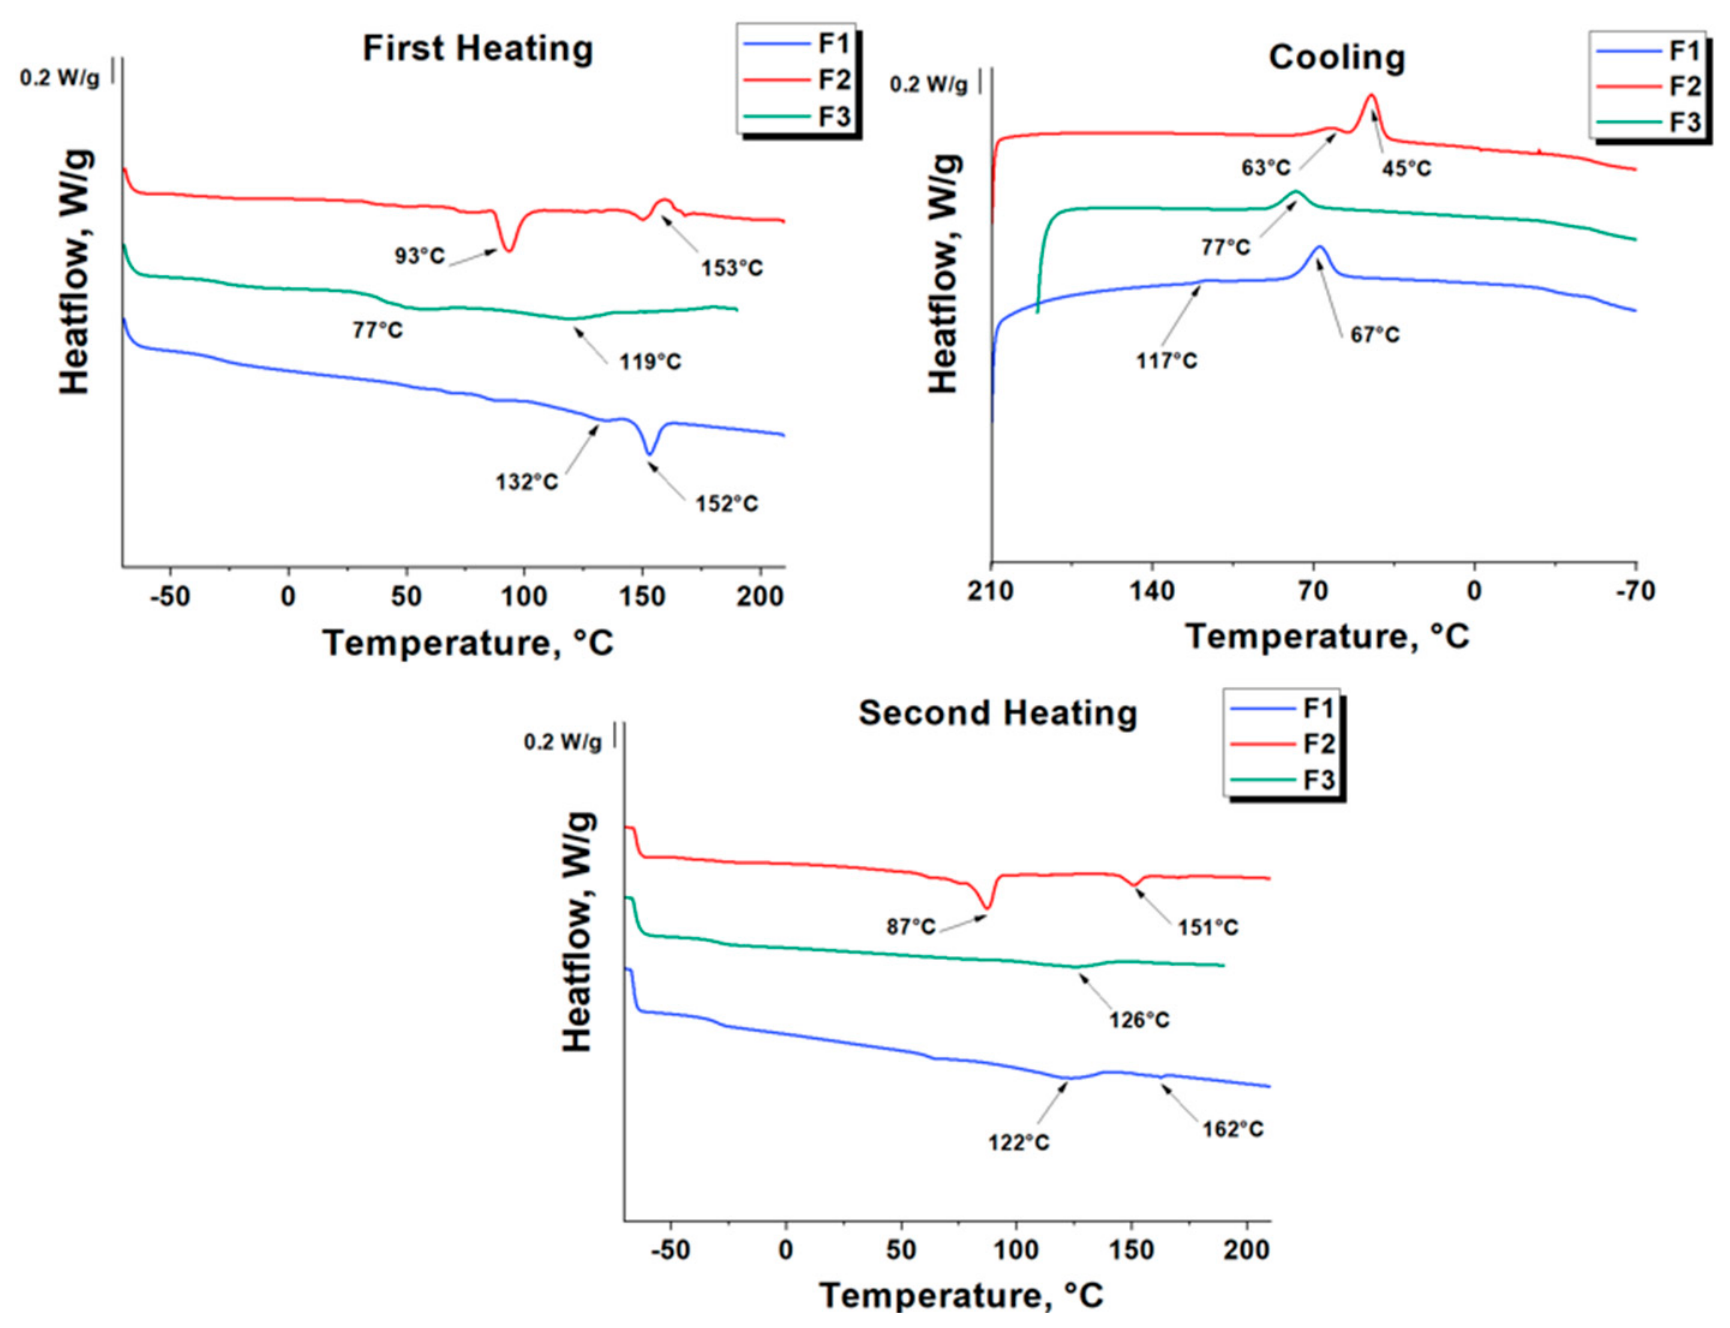
Figure 5 shows the DSC thermograms of the base biodegradable formulations F1, F2, and F3, while Table 11 summarizes the main thermal parameters obtained from the first heating, cooling, and second heating scans. The results demonstrate that the blend composition significantly affects the melting behavior, crystallization kinetics, and crystalline organization of the investigated biodegradable systems. During the first heating scan, formulation F1 exhibited two distinct melting peaks located at approximately 132 °C and 152 °C, which were attributed to the melting of the PBAT-rich and PLA-rich phases, respectively, in agreement with the characteristic melting temperatures reported in the literature for these polymers [68,69]. Similarly, formulation F2 displayed two melting events centered at approximately 93 °C and 153 °C, corresponding to the PBSA-rich and PLA-rich phases. In contrast, formulation F3 exhibited a broader and less pronounced melting transition around 119 °C, reflecting the different thermal behavior of the PBAT/TPS blend and the influence of the thermoplastic starch phase on the crystalline structure. The crystallinity values reported in Table 11 indicate that F2 possessed the highest degree of crystalline organization, which can reasonably be attributed to the presence of PBSA and its favorable crystallinity [70], whereas F1 and F3 exhibited comparatively lower crystallinity. The cooling thermograms further highlight differences in the crystallization behavior of the three formulations. F1 showed two crystallization peaks at approximately 63 °C and 45 °C, indicating the independent crystallization of the different polymer phases. F2 exhibited crystallization events centered at approximately 117 °C and 67 °C, while F3 was characterized by a broader crystallization peak around 77 °C, suggesting a different crystallization mechanism associated with the TPS-containing formulation. During the second heating scan, changes in the melting transitions compared with the first heating cycle indicate the thermal reorganization of the polymer phases induced by the controlled melting and recrystallization process. F1 and F2 retained two distinct melting events, whereas F3 exhibited a broader melting transition centered at approximately 126 °C, confirming the different crystalline organization of the PBAT/TPS blend. Overall, the DSC analysis demonstrates that the composition of the biodegradable blends strongly influences their thermal transitions, crystallization behavior, and crystalline morphology, which directly affect melt processability, and consequently, the subsequent foaming performance.
The presence of two distinct melting endotherms in F1 and F2 is consistent with a multiphase structure in which the polymer components retain at least partially independent thermal transitions. The higher crystalline contribution observed for F2 may be associated with the crystallization behavior of the PBSA-rich phase. From a foaming perspective, crystalline domains may restrict molecular mobility and melt deformability during cell growth. Therefore, the higher crystalline contribution of F2 may have increased melt stiffness during expansion, contributing to the intermediate cellular morphology observed. Conversely, the lower crystalline contribution of F1 may have provided a wider deformability window during foaming, which may have favored more uniform cell growth and stabilization [71].
The DSC results also provide additional insight into the different foaming behaviors of the investigated formulations. Formulation F2 exhibited the highest crystalline contribution, which is consistent with its higher stiffness and reduced ductility observed during tensile testing. The higher crystalline fraction may have limited melt deformability during cell growth, contributing to the intermediate cellular morphology obtained after foaming. Conversely, F1, which exhibited a lower degree of crystallinity, likely provided greater melt deformability during foaming and produced the most homogeneous foam, characterized by the lowest density and the highest cell circularity. Formulation F3 exhibited a less organized crystalline structure and the least favorable cellular morphology after foaming, suggesting that blend composition and crystalline organization jointly influenced foam stability. Although the DSC analyses provide useful information on the intrinsic thermal behavior of the investigated formulations, it should be noted that they were performed under atmospheric pressure prior to the foaming process.
Therefore, the reported thermal transitions describe the intrinsic thermal behavior of the blends and do not account for the influence of dissolved nitrogen under the high-pressure conditions employed during batch foaming. Previous studies have shown that dissolved gases may influence crystallization kinetics, molecular mobility, and phase morphology by acting as temporary plasticizing agents during the foaming process. Consequently, the present DSC results should be interpreted as a comparative characterization of the investigated formulations, whereas the investigation of in situ crystallization phenomena under high-pressure nitrogen conditions remains an important topic for future research.

3.3.4. FTIR

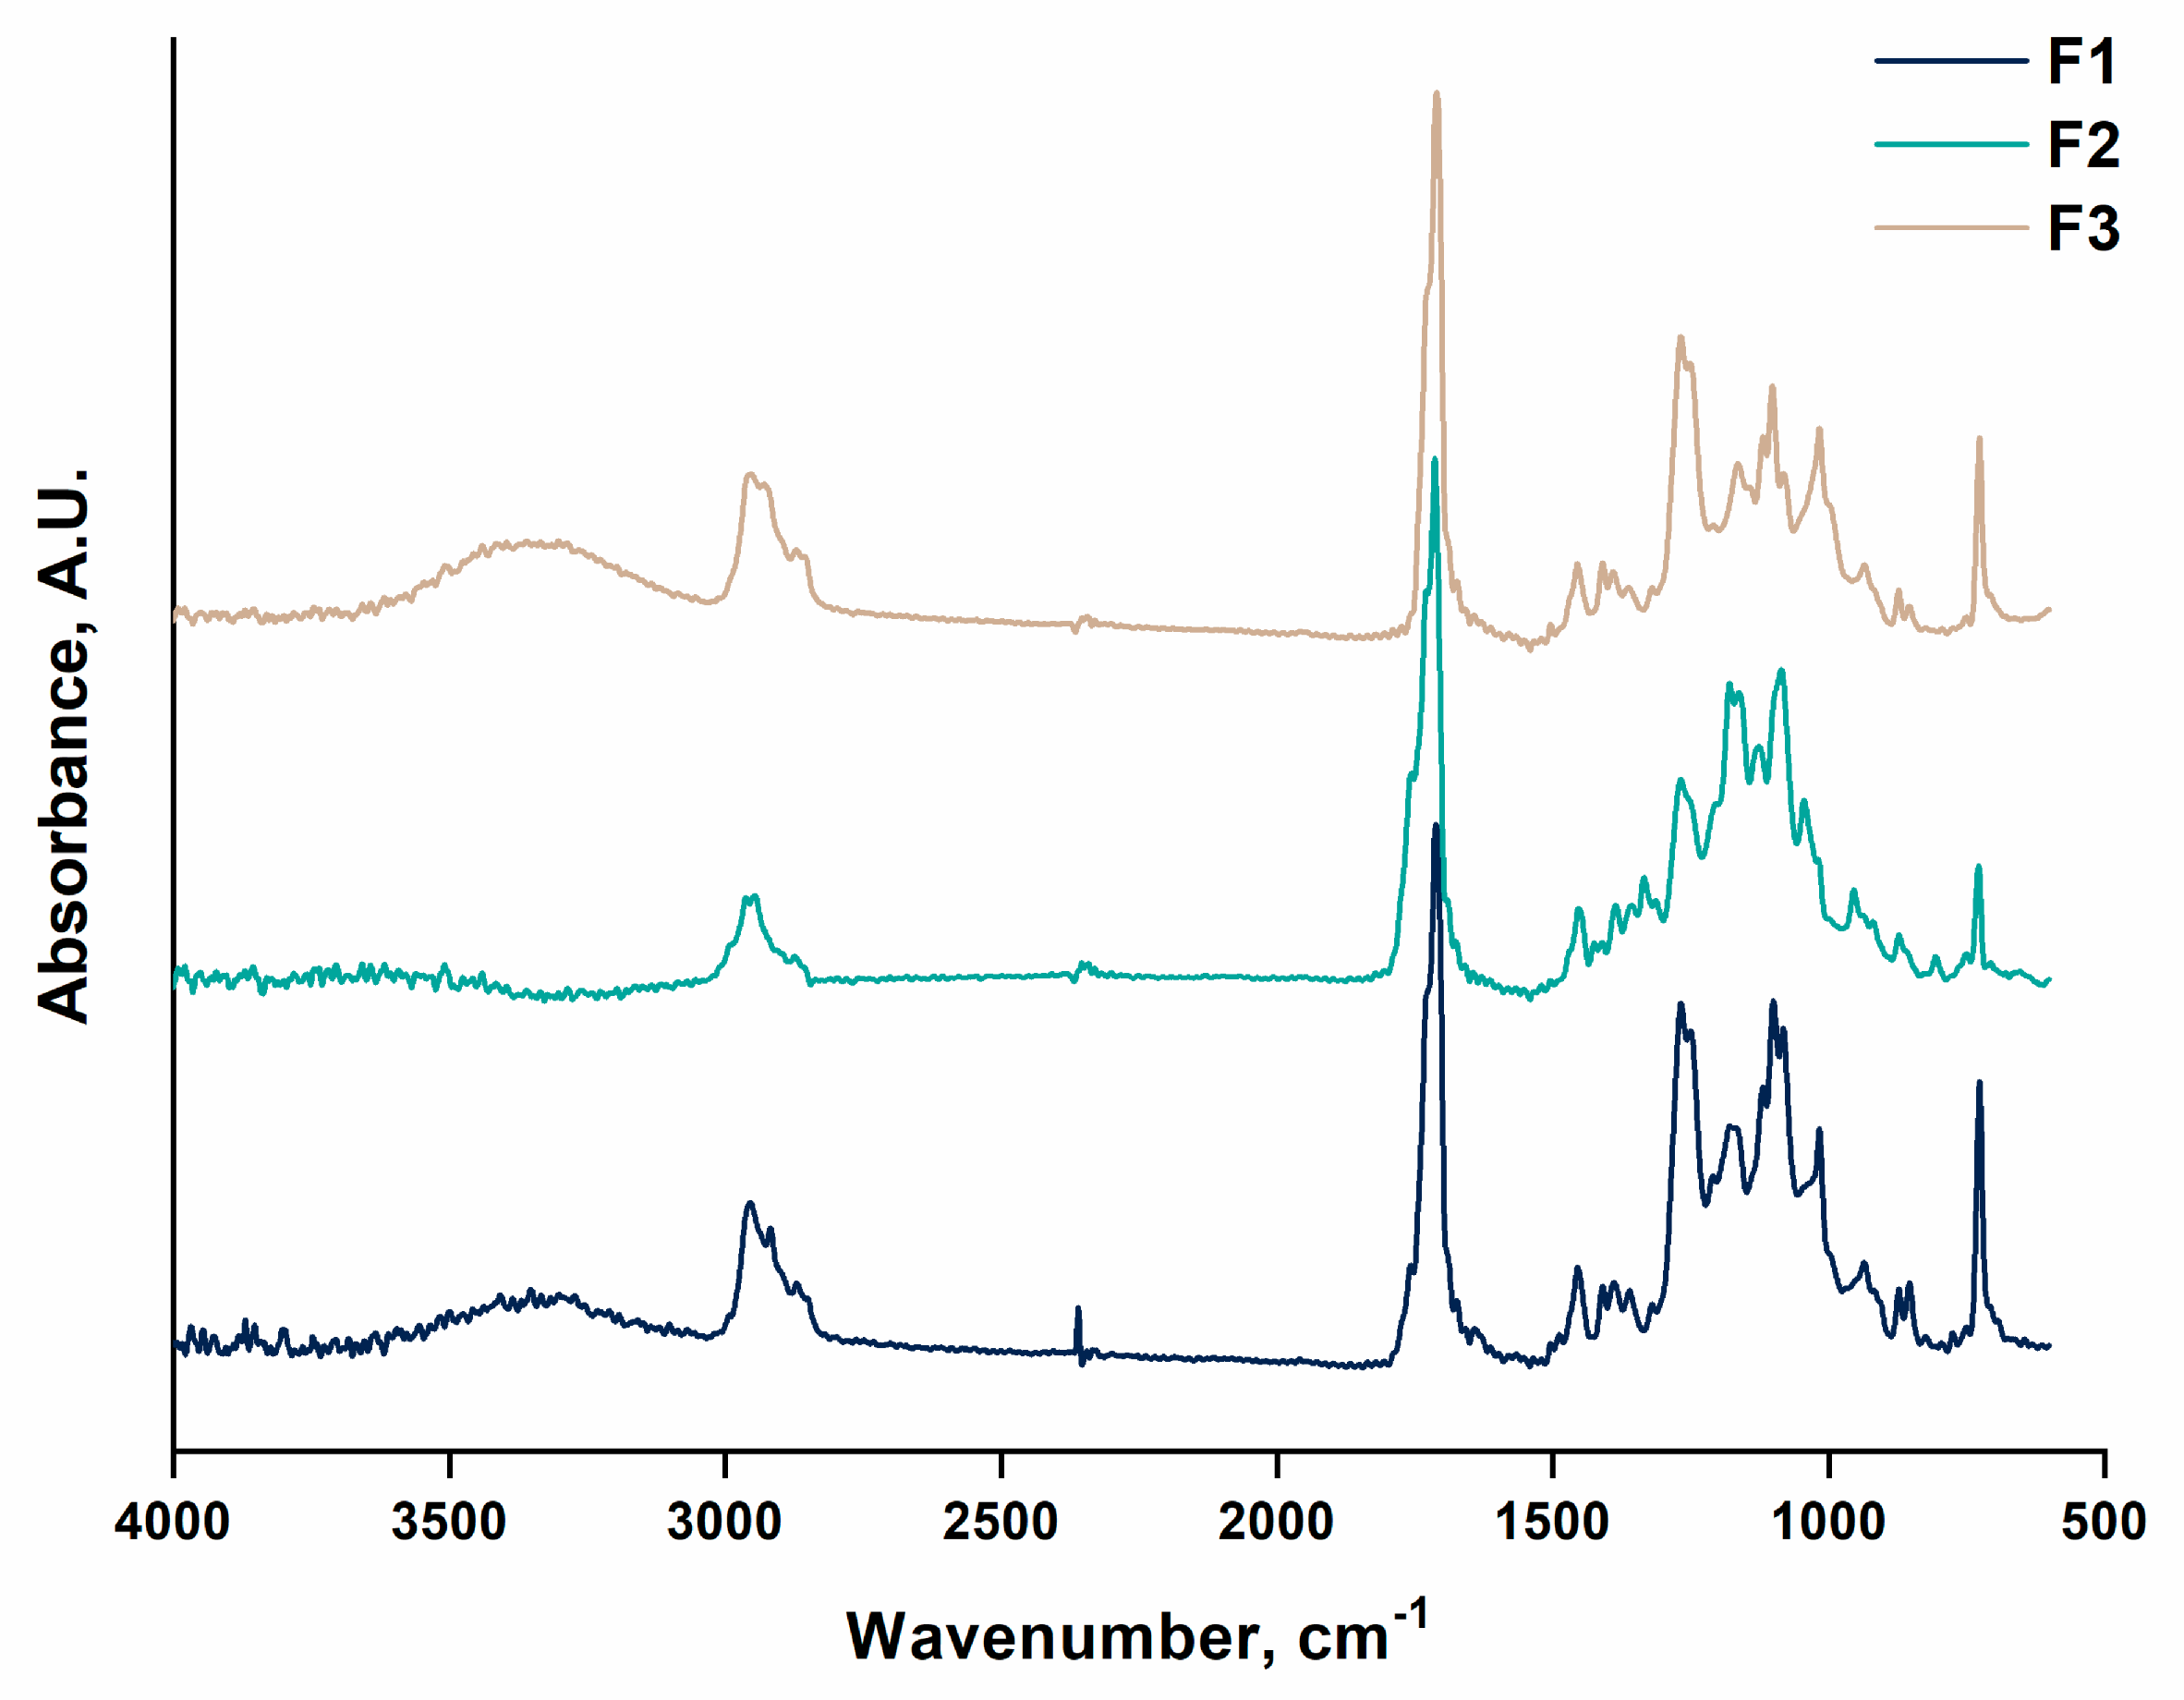
Figure 6 illustrates the FTIR-ATR spectra of the F1, F2, and F3 biodegradable formulations acquired within the 4000–600 cm−1 range. All formulations exhibited the main characteristic bands of the constituent biodegradable polyesters, including the intense carbonyl (C=O) stretching signal in the 1700–1750 cm−1 region and the bands associated with C–O and C–O–C groups between 1000 and 1300 cm−1. The observed differences in relative intensity and shape of specific bands were linked to the distinct blend compositions and the coexistence of different polymer phases. Specifically, variations in the carbonyl and C–O bonding regions matched the varying contributions of the PLA, PBAT, PBSA, and TPS components across the investigated systems. The broad band appearing between 3200 and 3500 cm−1 for formulation F3 belongs to the hydroxyl (–OH) stretching vibrations of the TPS phase, reflecting the hydrophilic nature of starch-based components [72]. The absence of any new distinct peaks or significant shifts in the main signals indicates that the extrusion and foaming processes did not induce macroscopically detectable chemical modifications via FTIR-ATR. Consequently, the analysis confirms that the primary chemical functionalities of the biodegradable matrices were preserved post-processing.
These results indicate that the differences in rheological, mechanical, and foaming behavior among the formulations cannot be attributed to the formation of new chemical functionalities detectable by FTIR-ATR. Instead, they are more likely associated with blend composition, phase morphology, molecular architecture, and physical interactions among the polymer components. Nevertheless, subtle reactions induced by the chain extender cannot be excluded, since chain extension or branching may occur without generating clearly distinguishable new absorption bands in complex multiphase spectra [42].

3.3.5. Tensile Tests

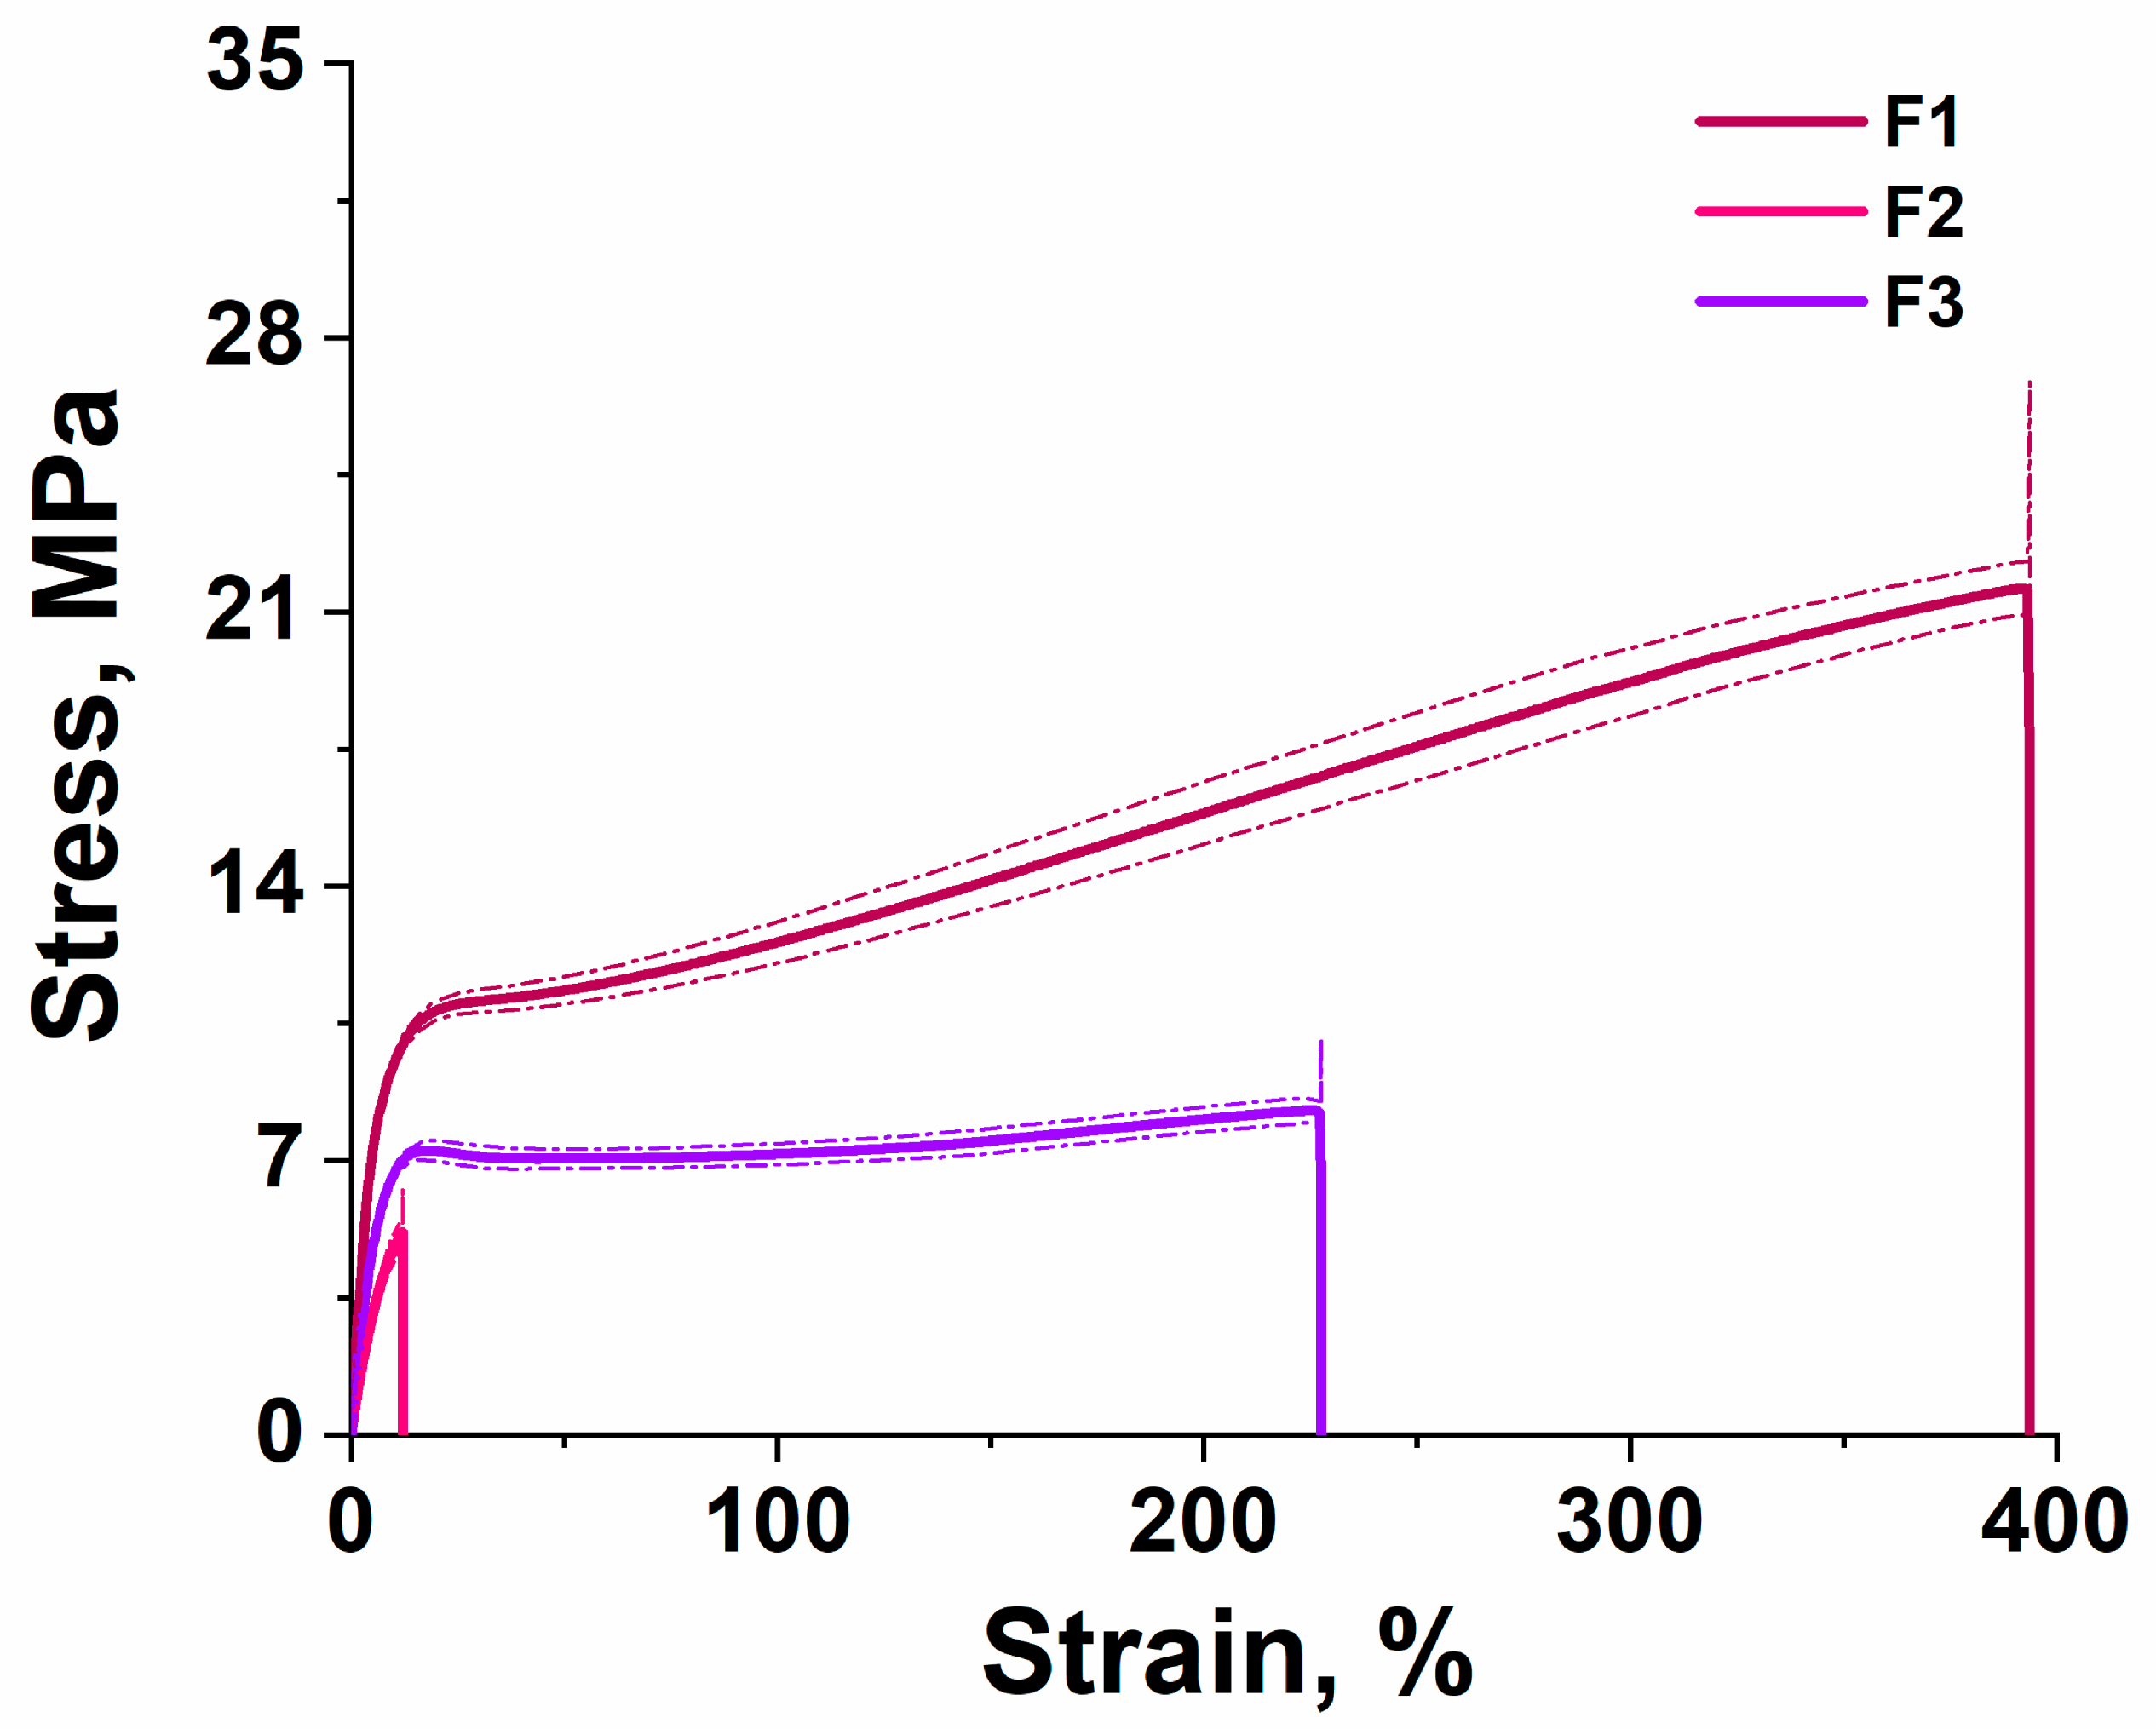
Figure 7 shows the average stress–strain curves obtained from tensile testing of the three biodegradable formulations, with the main mechanical parameters summarized in Table 12. F1 displayed the most ductile behavior, combining a high elongation at break (~454%) with a tensile strength of approximately 22.7 MPa. Following the yield point (~7.2 MPa), the material underwent marked plastic deformation and strain hardening, indicating good deformability and toughness. Conversely, F2 exhibited the most rigid behavior, characterized by the highest elastic modulus (643 MPa) and yield strength (16.5 MPa), but a low elongation at break (~26.5%), which points to a limited capacity for plastic deformation. F3 showed an intermediate performance, with lower tensile strength (~8.3 MPa) but greater deformability (~233%) relative to F2. This trend can be attributed to the presence of TPS, which reduces system stiffness while increasing blend flexibility. Overall, these results demonstrate how formulation composition dictates the balance among stiffness, strength, and ductility. One-way ANOVA revealed statistically significant differences among the investigated formulations for all tensile properties (p < 0.05). Tukey’s HSD post hoc test showed that F1 and F2 did not differ significantly in maximum stress, whereas both exhibited significantly higher values than F3. In contrast, maximum elongation, elastic modulus, and yield strength differed significantly among all formulations (p < 0.05), as indicated by the shared significance letters reported in Table 12.
F1, whose composition combines the high ductility of PBAT with the stiffening contribution of PLA, exhibited the most ductile mechanical behavior, whereas F2, designed to provide higher melt fluidity, showed the lowest plastic deformation capacity.
The high fluidity and stiffness recorded for F2 are consistent with its specific blend design, which was tailored to enhance melt processability and evaluate the effect of higher molecular mobility on the subsequent foaming behavior.
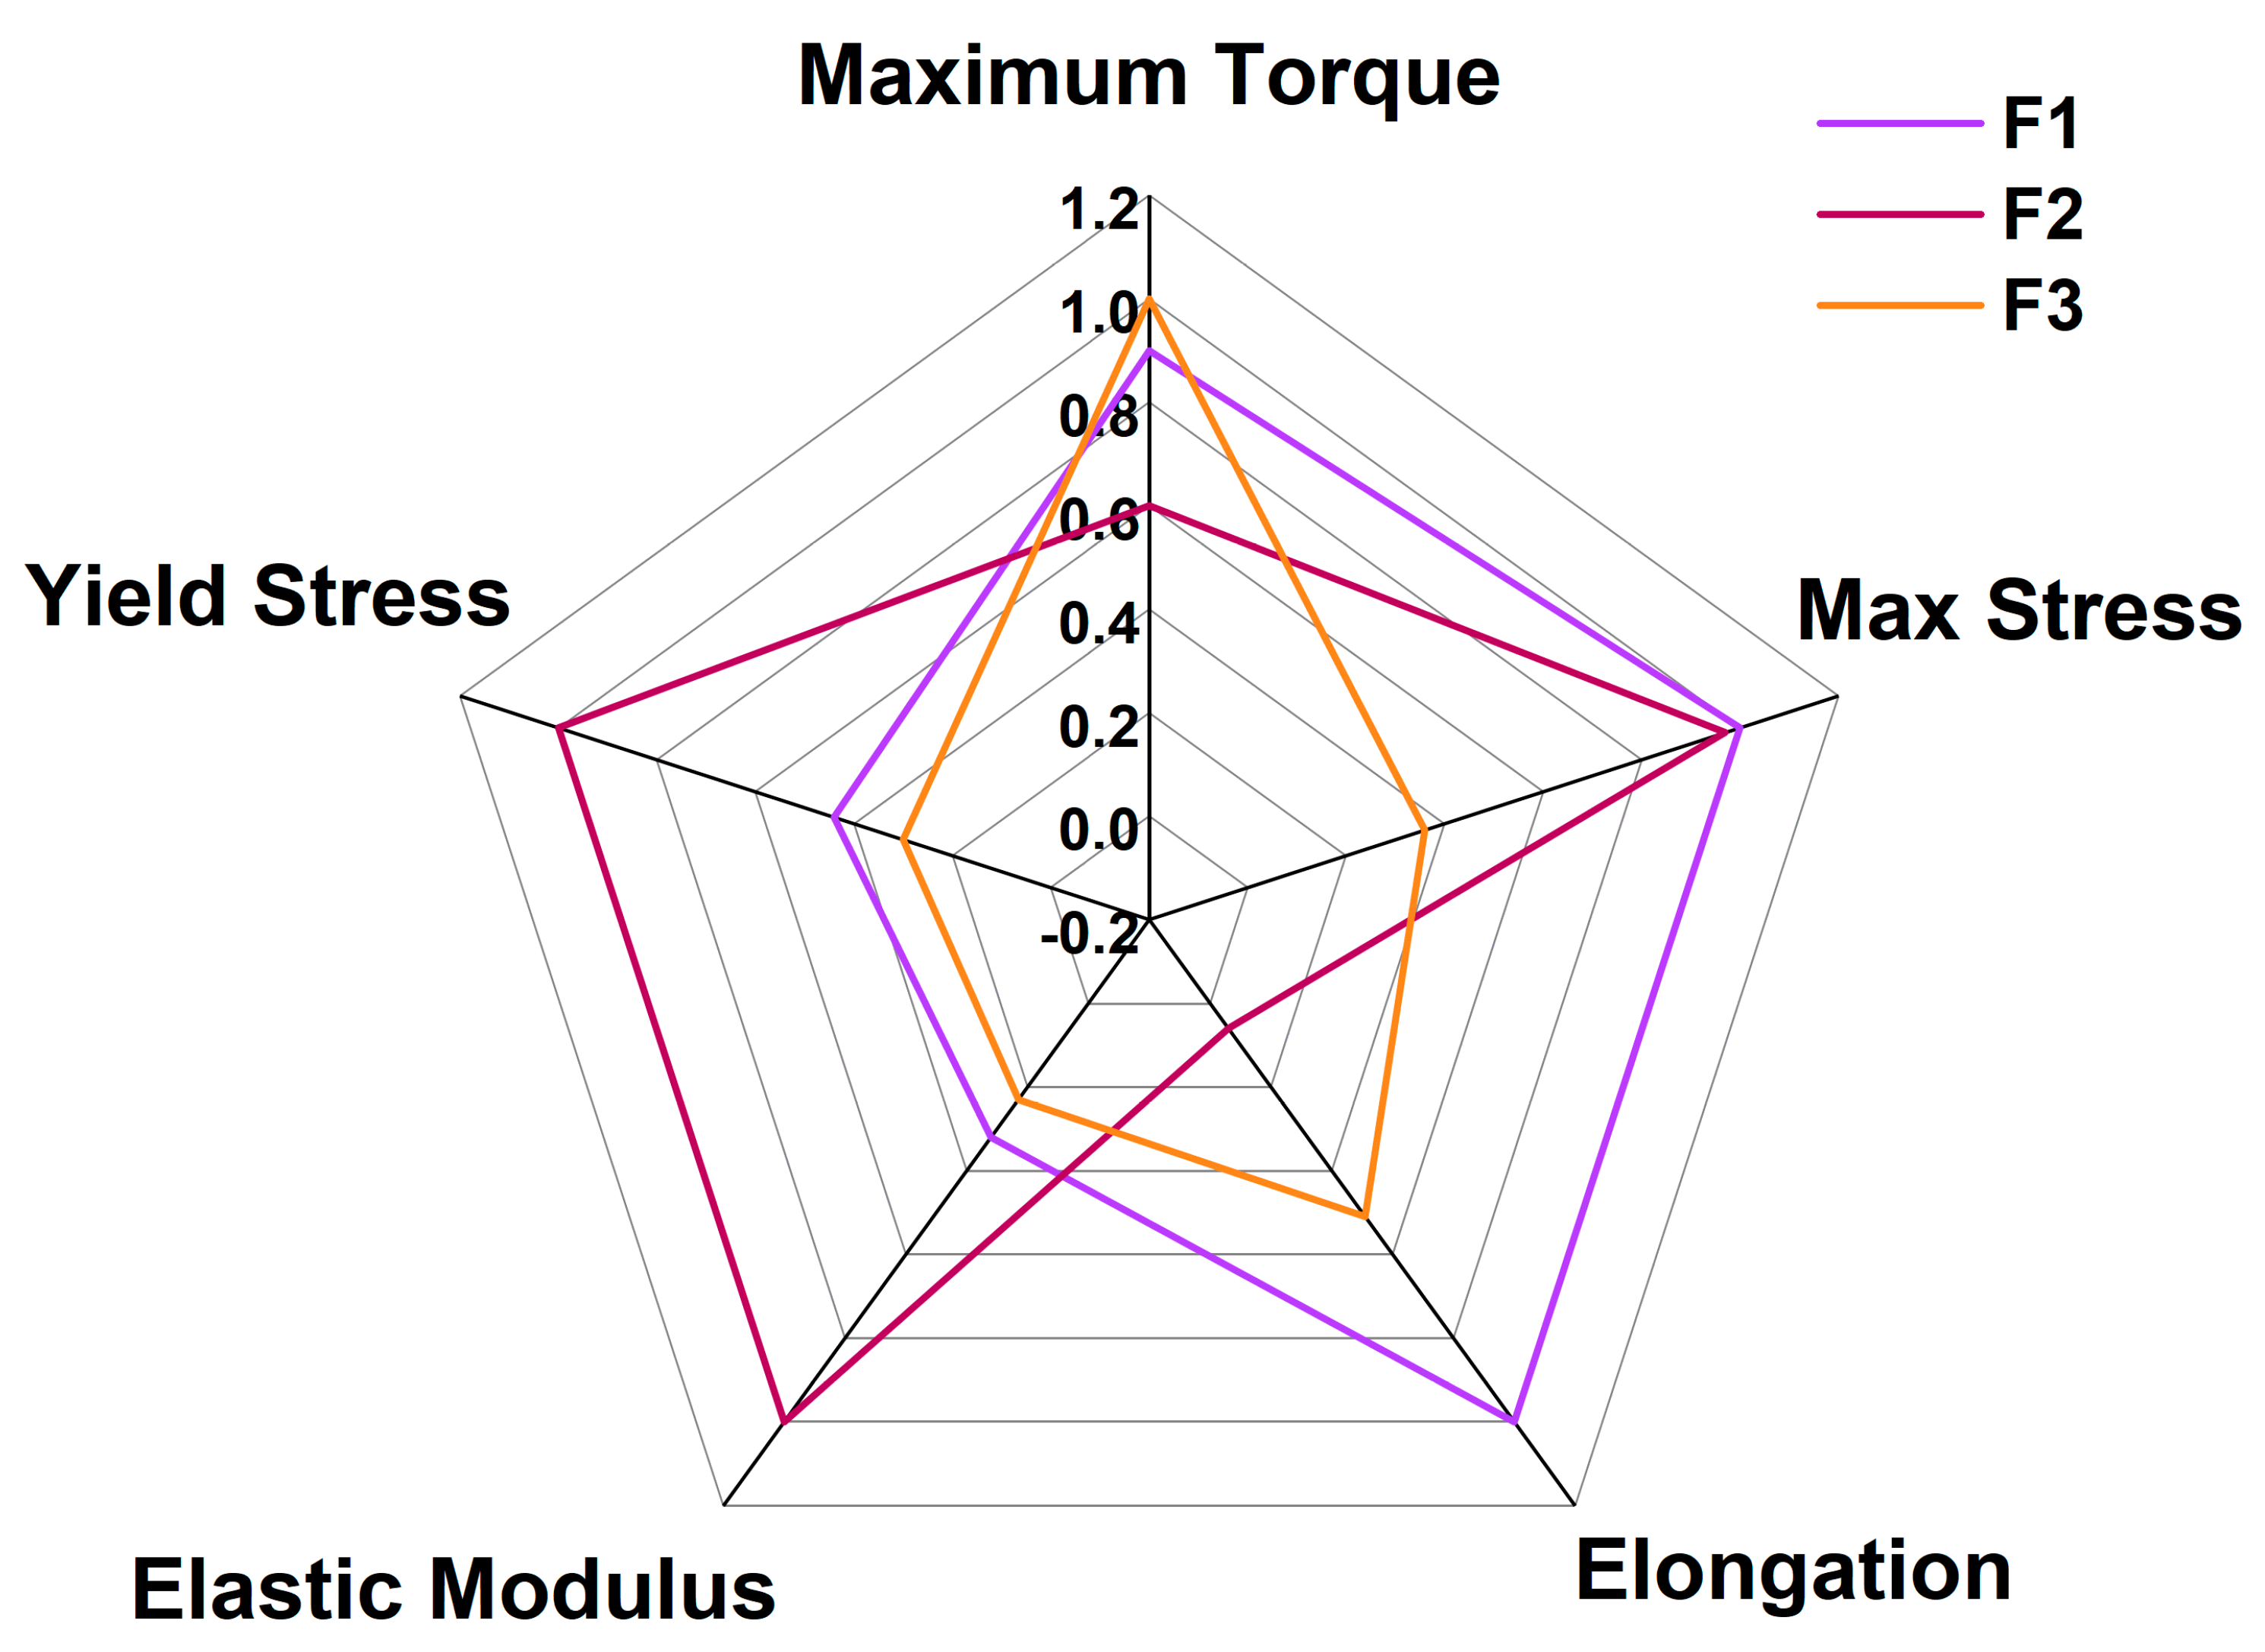
The radar chart in Figure 8 provides a normalized comparison of the primary rheological and mechanical properties of the base formulations (F1, F2, and F3), including maximum plastograph torque (Torque), tensile strength (Max Stress), elongation at break (Elongation), elastic modulus (Elastic Modulus), and yield strength (Yield Stress). To simultaneously compare parameters expressed in different units, the experimental data were normalized using a min–max approach within a 0–1 range. The radar plot serves as a qualitative tool to visualize the balance between rheological behavior and mechanical performance of the investigated biodegradable blends. Formulation F1 exhibited the most balanced overall profile, combining high tensile strength and elongation at break with relatively high torque values and intermediate stiffness. In contrast, F2 was characterized by the highest elastic modulus and yield strength, indicating the stiffest mechanical behavior, although it showed the lowest elongation at break and lower torque than the other formulations. Formulation F3 exhibited the highest maximum torque, indicating the greatest melt rheological reinforcement while showing lower tensile strength and stiffness than F1 and F2 and intermediate ductility. The elevated torque of F3 demonstrates improved melt resistance during processing; however, this behavior does not directly translate into superior foam morphology, confirming that the final cellular structure is governed not only by melt rheology, but also by the composition of the polymer blend and the mechanisms of cell nucleation and growth during foaming. Overall, the radar plot highlights the trade-off between rheological reinforcement, stiffness, strength, and ductility, providing a comprehensive overview of the performance of the investigated biodegradable formulations.

3.4. Film Characterization

3.4.1. FTIR

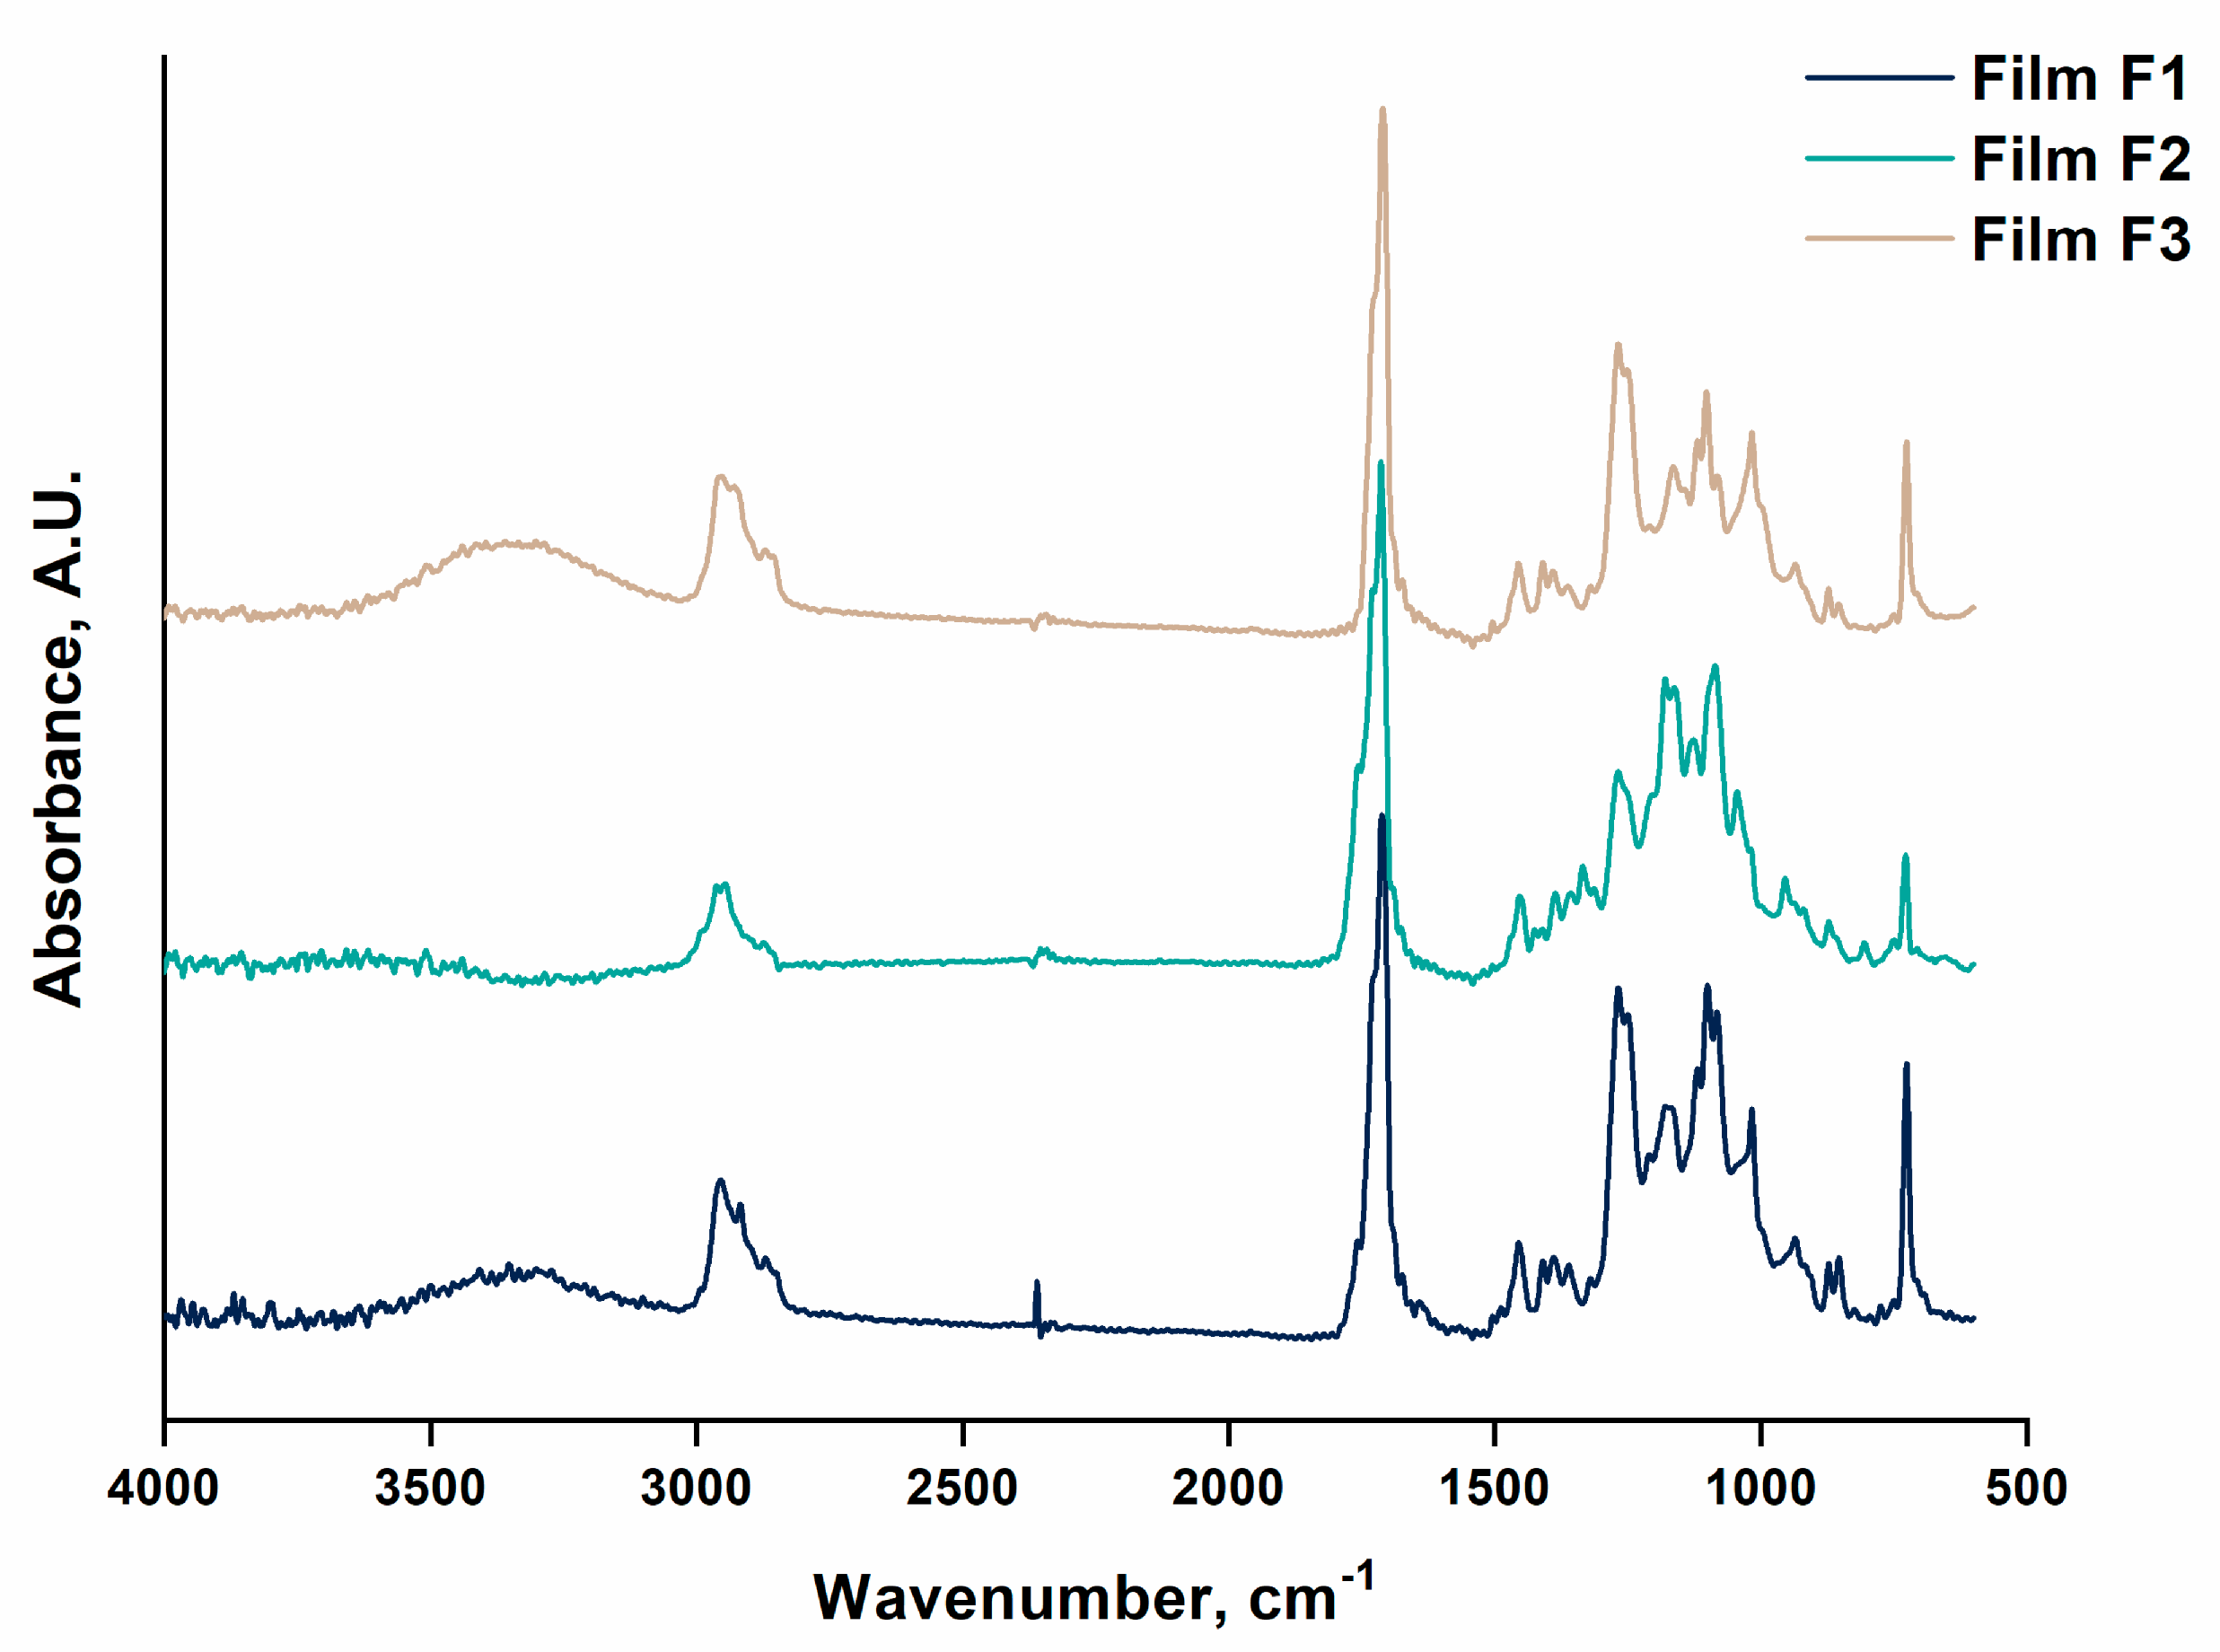
FTIR analyses were conducted on the extruded films to assess potential chemical changes induced by the cast extrusion process relative to the starting pellets. Figure 9 reports the FTIR-ATR spectra of the F1, F2, and F3 biodegradable films acquired in the 4000–600 cm−1 range. All formulations displayed the main characteristic bands typical of the biodegradable polyesters used in the blends, confirming the integrity of the polymer matrices within the extruded compounds. Specifically, the sharp band located between 1700 and 1750 cm−1 belongs to the stretching vibrations of the carbonyl group (C=O), which is characteristic of ester-based polymers like PLA, PBAT, and PBSA. The bands between 1000 and 1300 cm−1 are assigned to C–O and C–O–C stretching vibrations, while the signals located between 2800 and 3000 cm−1 correspond to the stretching vibrations of aliphatic –CH2 and –CH3 groups. Formulation F3 displayed a broader band in the 3200–3500 cm−1 region, arising from –OH group vibrations and directly linked to the presence of TPS within the blend. Additionally, F3 presented a more intricate fingerprint region (1500–900 cm−1) compared to the other systems, suggesting contributions from starch components and different intermolecular interactions within the system. Comparing the spectra of the starting pellets with those of the cast-extruded films revealed no meaningful shifts in the main characteristic peaks, indicating that extrusion did not cause significant chemical alterations. The observed differences in relative band intensities are primarily associated with the base composition of the biodegradable blends and the distribution of the polymer matrices within the F1, F2, and F3 systems.

3.4.2. Tensile Test

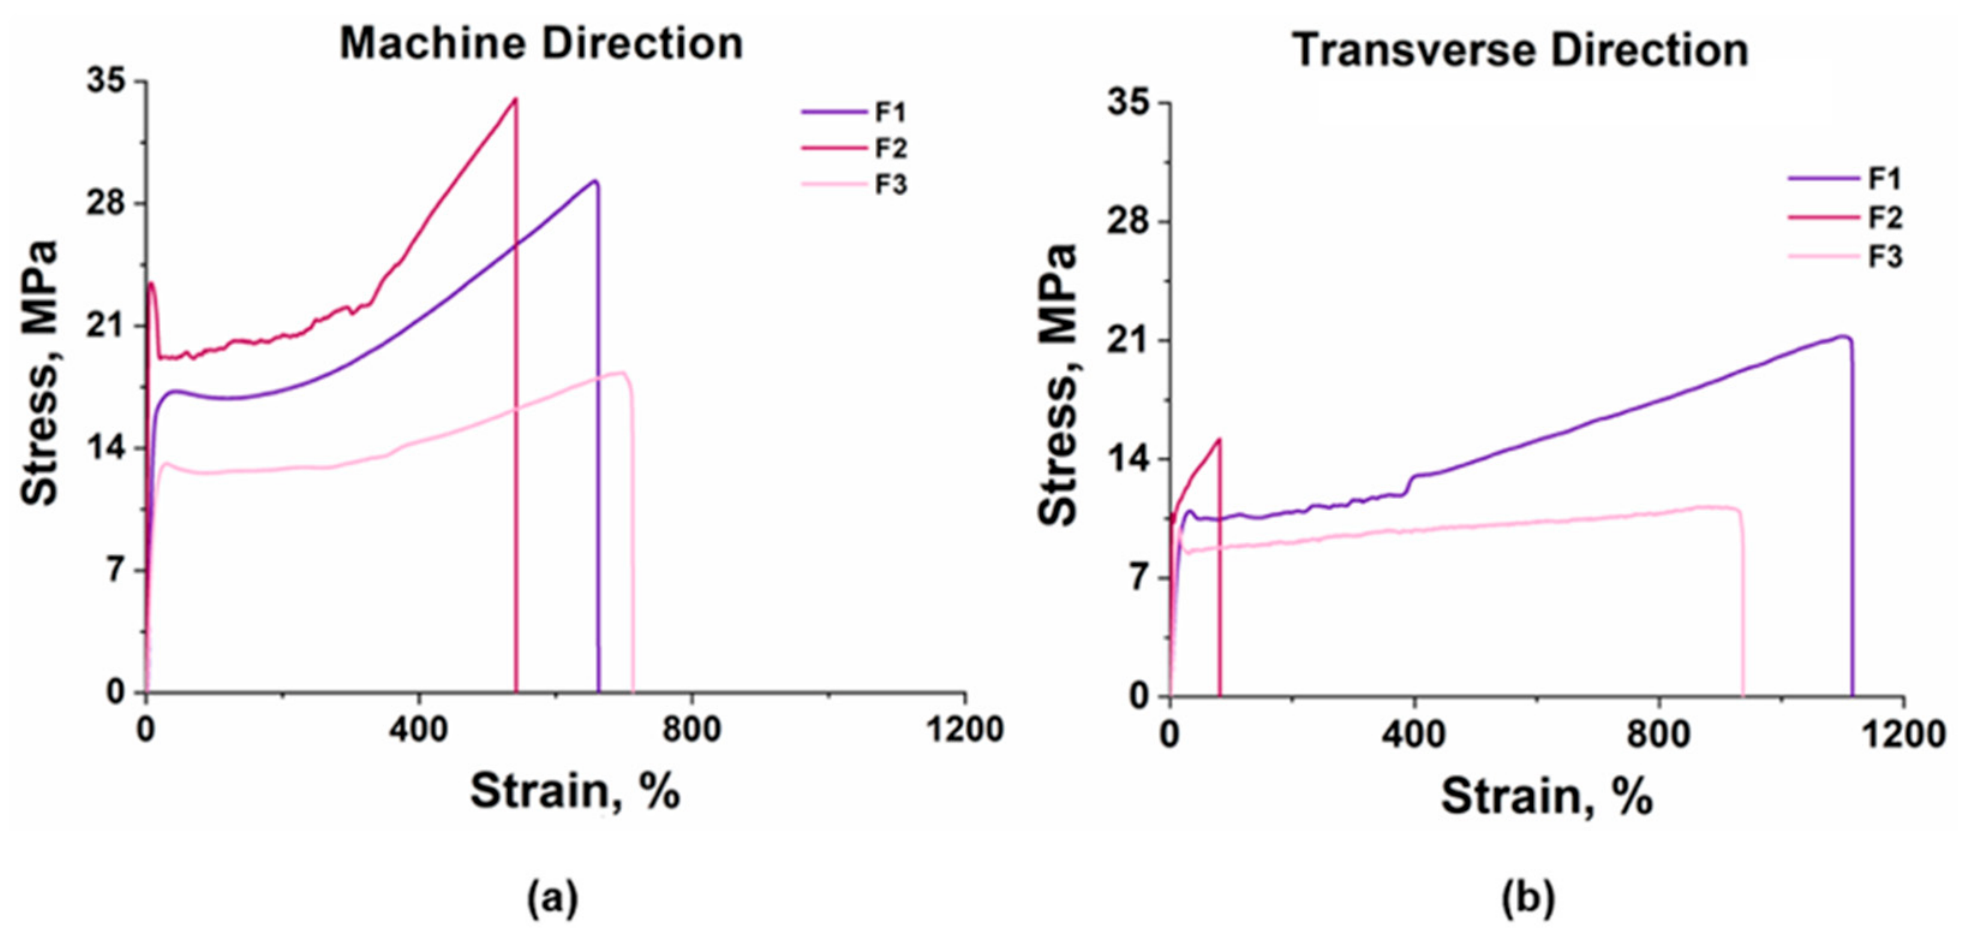
Figure 10 illustrates the stress–strain curves obtained from tensile testing conducted along both the machine direction (MD) and transverse direction (TD) of the cast-extruded biodegradable films, while Table 13 and Table 14 summarize the main mechanical parameters of the investigated polymer bases. The results revealed a marked anisotropic behavior of the films, which is attributable to the molecular orientation induced during the cast extrusion process. In the MD direction, formulation F2 displayed the highest mechanical performance in terms of strength and stiffness, reaching a maximum stress of 36.1 ± 3.5 MPa and an elastic modulus of 843 ± 38 MPa. This behavior can be linked to the combined presence of PBSA and PLA, which impart greater structural rigidity and a higher load-transfer capability to the material. F2 exhibited a significant reduction in elongation at break (560 ± 45%), pointing to a less ductile behavior compared to the other systems. Conversely, F1 provided the best trade-off between mechanical strength and ductility, showing high elongation at break values in both MD (772 ± 114%) and especially in TD (985 ± 116%). This performance suggests good melt stability and a relatively uniform distribution of molecular orientation within the film. Furthermore, the predominance of PBAT contributes to enhancing the flexibility and plastic deformation capacity of the system. In contrast, formulation F3 exhibited the lowest mechanical properties, with maximum stress and elastic modulus values below those of the other investigated blends. This trend can be ascribed to the presence of TPS, which tends to reduce the stiffness and mechanical strength of the system while increasing film flexibility. One-way ANOVA confirmed that formulation significantly affected all tensile properties measured in both the machine direction (MD) and transverse direction (TD) (p < 0.05). Tukey’s HSD post hoc test showed that in the MD, F2 exhibited significantly higher maximum stress, elastic modulus, and yielding stress than F1 and F3, whereas F1 showed significantly higher maximum strain than F2, while F3 did not differ significantly from either formulation. In the TD, Tukey’s HSD indicated that F1 exhibited the highest maximum stress and maximum strain, whereas F2 presented the highest elastic modulus and yielding stress. All statistically significant pairwise differences are indicated by the lowercase letters reported in Table 13 and Table 14.
A comparison between MD and TD highlights the clear influence of the cast extrusion process on the mechanical properties of the films. Specifically, the elastic modulus and tensile strength values were generally higher along the MD direction, consistent with the polymer chain orientation induced by the melt flow during extrusion. On the contrary, higher elongation at break values were observed in TD, particularly for formulation F1, indicating a greater transverse deformation capacity of the film. These findings demonstrate that the composition of the biodegradable blends significantly dictates the balance among stiffness, mechanical strength, and ductility, as well as the degree of anisotropy developed during the cast extrusion process. Moreover, the superior processability observed during cast extrusion for F1 and F2 matches their respective MFR values and the higher rheological stability evidenced by the previous analyses.

3.5. Optimization

Plastograph

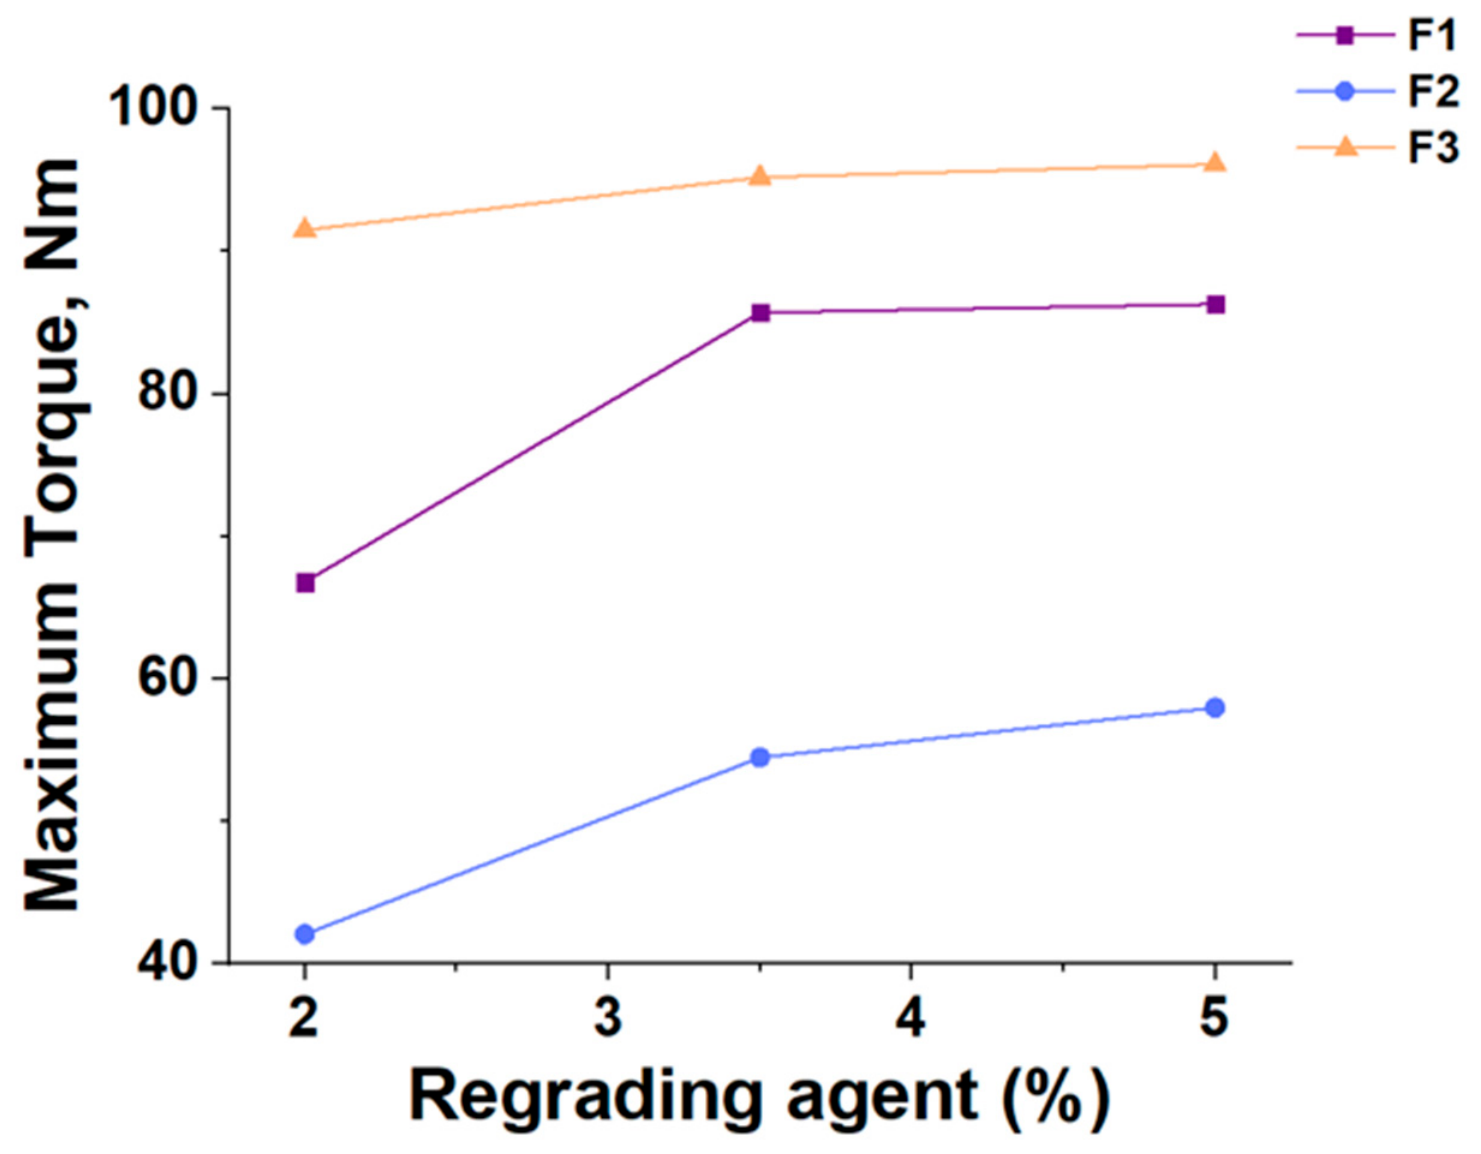
Table 15, Table 16 and Table 17, together with Figure 11, summarize the maximum torque values measured during the plastograph analyses of the investigated biodegradable formulations containing different concentrations of the chain-extending additive (2, 3.5, and 5 wt.%). Each test was performed at least in triplicate, and the reported values are expressed as mean ± standard deviation. The results reveal that the chain-extending additive markedly influences the rheological behavior of the investigated systems, although the magnitude of the effect depends on the blend composition. For formulation F1, the maximum torque increased from 66.8 ± 0.7 Nm at 2 wt.% to 85.7 ± 0.8 Nm at 3.5 wt.%, reaching the highest value of 86.3 ± 0.6 Nm at 5 wt.%. A similar trend was observed for formulation F2, where the maximum torque progressively increased from 42.1 ± 0.9 Nm to 54.5 ± 0.8 Nm and 58.0 ± 0.7 Nm with increasing chain-extending additive concentration. Formulation F3 exhibited consistently higher torque values than the other blends, with maximum torques of 91.5 ± 0.8 Nm, 95.2 ± 0.9 Nm, and 96.1 ± 0.7 Nm for 2, 3.5, and 5 wt.%, respectively. Overall, the progressive increase in maximum torque with increasing additive concentration indicates an enhancement of melt strength and viscosity, suggesting that the chain-extending additive effectively promoted reactive interactions within the polymer melt.
The progressive increase in maximum torque with increasing chain-extender concentration indicates greater resistance of the melt to deformation and is consistent with an increase in apparent melt viscosity. This behavior is compatible with chain-extension and/or branching reactions between the multifunctional reactive additive and the terminal hydroxyl and carboxyl groups of the biodegradable polyesters, which may increase molecular entanglement and improve melt stability. However, since molecular-weight measurements and oscillatory rheological analyses were not performed, the occurrence and extent of these reactions cannot be directly quantified from torque measurements alone. For F3, despite the high absolute torque values, the presence of the TPS phase introduced additional compositional and interfacial heterogeneity. The hydrophilic nature and moisture sensitivity of TPS may have promoted non-uniform gas distribution and localized differences in melt resistance during expansion. Therefore, the high torque measured under mixing conditions did not necessarily translate into homogeneous melt elasticity or uniform cell stabilization during foaming, resulting in greater cell coalescence and partial collapse [62].
These interactions are reasonably attributed to chain extension and/or branching reactions, which increased molecular entanglement and improved the resistance of the melt to thermo-mechanical deformation. Among the investigated concentrations, 5 wt.% consistently provided the highest maximum torque values, indicating the strongest rheological reinforcement and supporting its selection for the subsequent foaming experiments. It is worth noting, however, that the higher maximum torque recorded for F3 reflects an enhanced melt strength of the blend in the mixing chamber rather than an improved stability under foaming conditions. The TPS phase, owing to its hydrophilic nature and limited thermal stability, can promote cell coalescence and collapse during gas expansion, so a high torque value alone does not guarantee a superior cellular structure, as discussed in Section 3.6.

3.6. Foaming

3.6.1. Density and Visual Analysis

Density measurements revealed significant differences among the investigated foamed biodegradable formulations, as reported in Table 18. Specifically, F1 exhibited the lowest density value (0.786 ± 0.02 g/cm3), indicating a higher expansion ratio and a greater presence of internal porosity. F2 displayed an intermediate density (0.89 ± 0.03 g/cm3), while F3 yielded the highest value (1.05 ± 0.04 g/cm3), suggesting a more compact structure and lower efficiency of the foaming process.
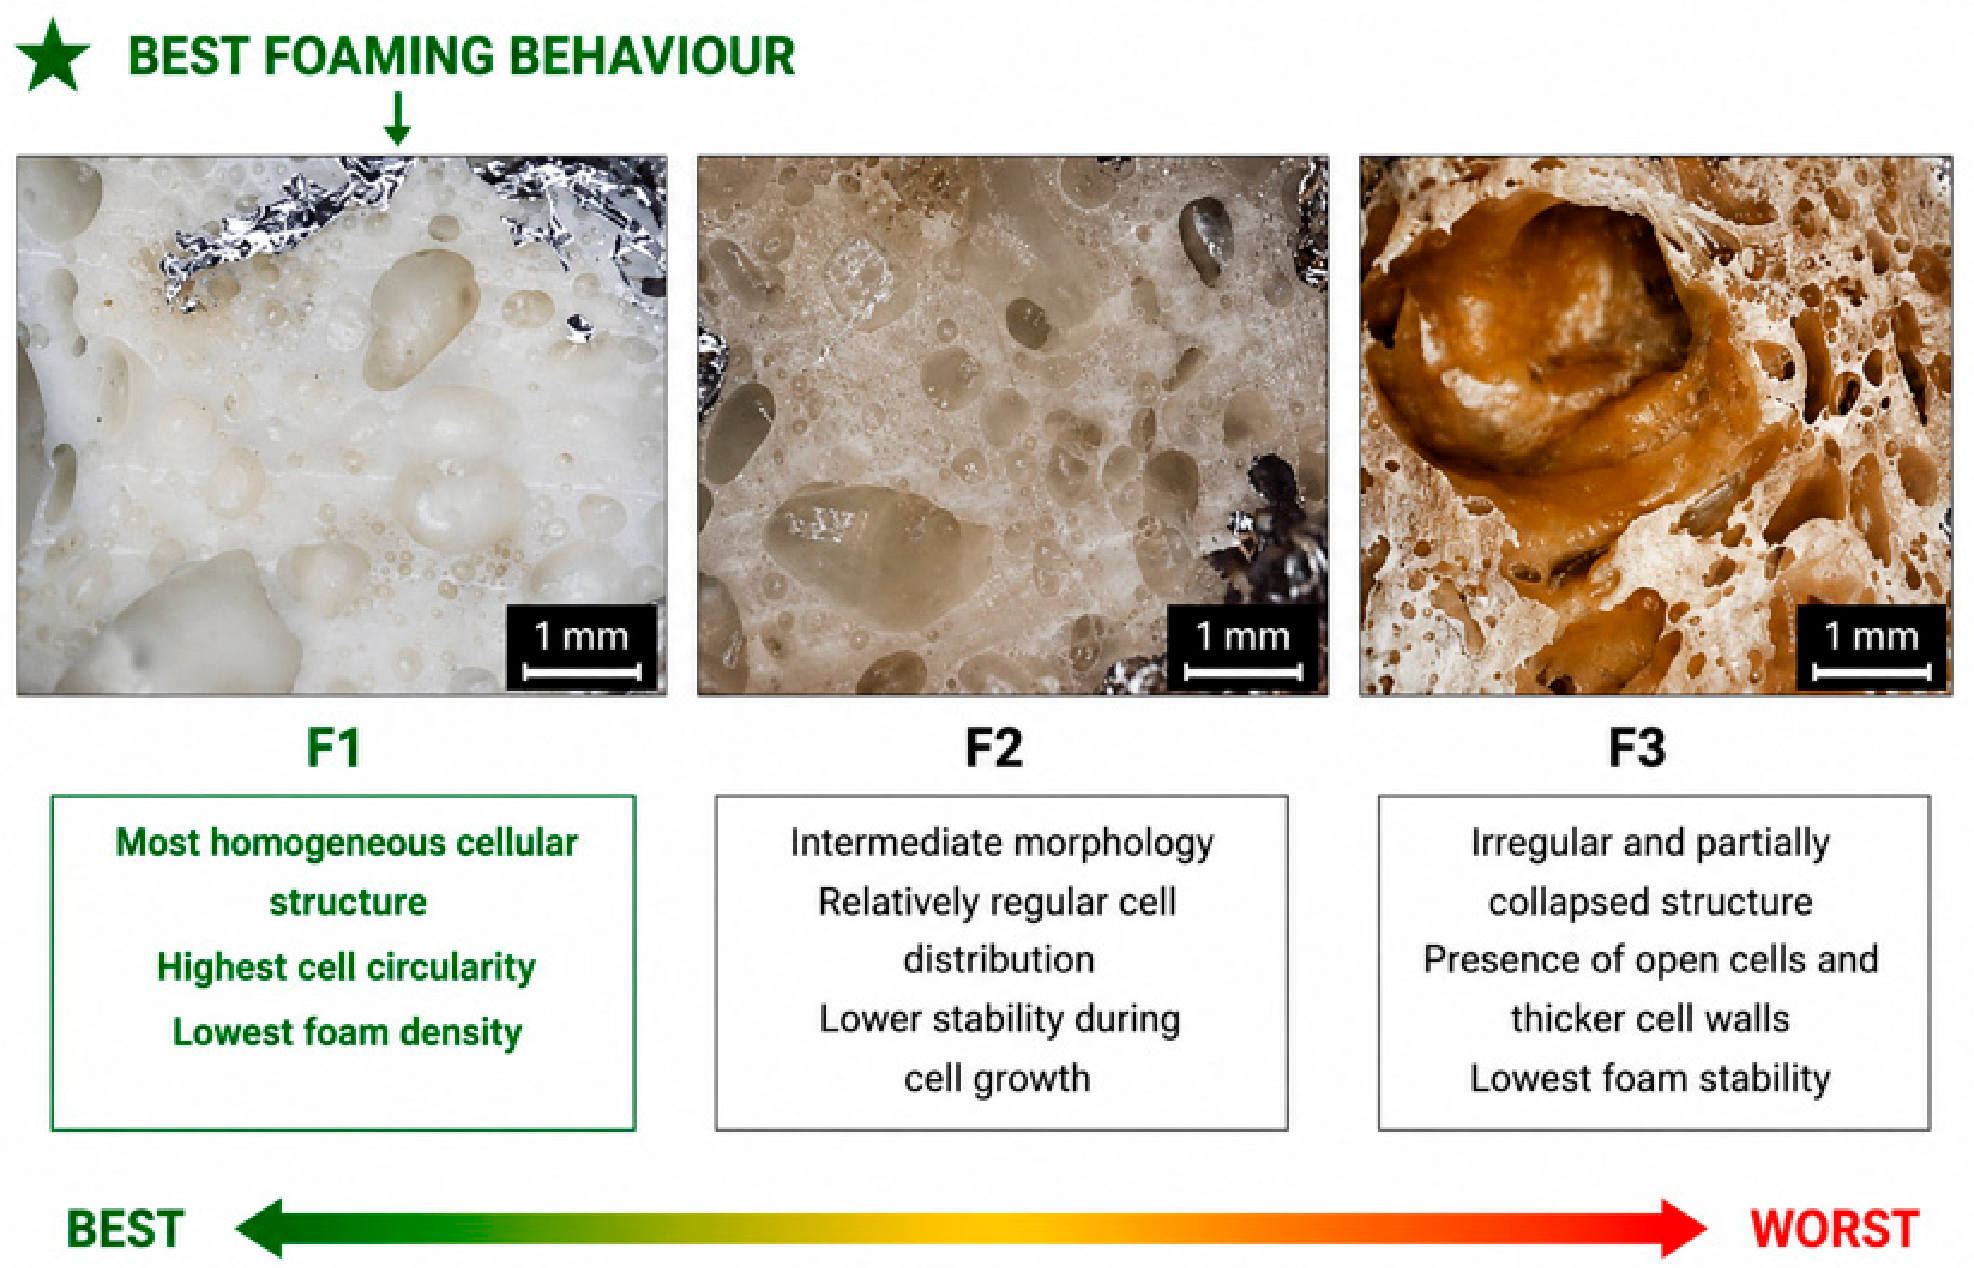
Optical microscopy images (Figure 12) further confirm the influence of blend composition on the foaming behavior of the investigated formulations. Among the three systems, F1 exhibited the best overall foaming performance, producing the most homogeneous and expanded cellular structure. This observation is consistent with the quantitative ImageJ analysis, which showed the highest cell circularity (0.826 ± 0.04) and the lowest foam density (0.786 ± 0.02 g/cm3), reflecting the favorable balance between melt deformability and reactive reinforcement provided by the chain extender in the PBAT/PLA matrix. F2 exhibited an intermediate morphology, characterized by relatively regular cell distribution but lower stability during cell growth. Conversely, F3 displayed the most irregular and partially collapsed structure, with the presence of open cells and thicker cell walls, which can be attributed to the limited thermal stability and hydrophilic nature of the TPS phase. Overall, these results demonstrate that blend composition plays a decisive role in determining the cellular morphology, foam density, and structural stability of biodegradable foams, with F1 representing the optimal composition for the investigated foaming process.
The green star highlights the formulation exhibiting the best foaming behaviour (F1). Among the investigated biodegradable blends, F1 exhibited the best overall foaming performance. This formulation produced the most homogeneous and stable cellular structure, with the highest cell circularity and the lowest foam density. Its superior behavior can be attributed to the favorable balance between melt deformability and rheological reinforcement provided by the chain extender in the PBAT/PLA matrix. The irregular cellular morphology observed for F3 is likely associated with the heterogeneous nature of the PBAT/TPS blend. The hydrophilic starch-rich phase may reduce interfacial compatibility with the polyester matrix and locally decrease melt strength, thereby promoting non-uniform cell growth and coalescence during expansion. Although SEM characterization was not performed in the present study, the optical microscopy observations, together with the rheological and DSC results, consistently indicate that the heterogeneous phase morphology contributes to the reduced structural stability of the foam.

3.6.2. Foaming Morphology and Optical Microscopy Analysis

Semi-quantitative analysis performed via ImageJ highlighted meaningful differences in the cellular morphology of the investigated biodegradable formulations. For each system, 40 representative cells were analyzed, and the reported morphological parameters expressed as mean ± standard deviation. The number of analyzable cells was constrained by the field of view and resolution of the available optical microscopy setup.
Specifically, as shown in Table 19, formulation F1 yielded a more uniform and stable cellular structure, characterized by the highest circularity value (0.826 ± 0.04) and the lowest apparent porosity (6.35 ± 0.7%). The average cell area was lower than that of the other formulations (12.55 ± 1.8 µm2), suggesting better control over cell nucleation and growth phenomena during the expansion process. This behavior is consistent with the better balance between melt fluidity and chain-extender reinforcement achieved in the PBAT/PLA matrix, which favored controlled nucleation and limited cell coalescence during expansion.
Formulation F2 displayed an intermediate behavior, with an average cell area of 18.74 ± 2.5 µm2 and an apparent porosity of 11.42 ± 1.1%. Its lower circularity values compared to F1 (0.701 ± 0.05) indicate reduced regularity of the cellular structure, likely associated with the higher melt fluidity observed through rheological and MFR testing. In contrast, F3 exhibited the most irregular cellular structure, characterized by the largest average cell area (31.68 ± 4.2 µm2), the highest apparent porosity (24.57 ± 2.3%), and the lowest circularity value (0.563 ± 0.06). These findings highlight more pronounced cell coalescence and collapse phenomena, attributable to the reduced rheological stability of the system and the incorporation of the TPS phase within the biodegradable blend [46]. Differences in the two-dimensional areal cell density were also observed among the formulations investigated (Table 19). However, this parameter should be interpreted together with the average cell area, circularity, and apparent porosity, since it provides complementary information on the two-dimensional distribution of the cellular structure. Taken together, the quantitative results obtained via ImageJ analysis confirm that blend composition and melt rheological behavior strongly influence the final cellular morphology and structural stability of the resulting foams.
The foaming process can be understood through three sequential stages: (i) nucleation, (ii) cell growth, and (iii) cell stabilization.
(i)
Nucleation is governed by the nucleating masterbatch, which provides heterogeneous nucleation sites that lower the energy barrier for bubble formation. The effectiveness of nucleation depends on the dispersion quality and interfacial energy between the nucleating particles and the polymer matrix.
(ii)
Cell growth is controlled by the balance between the driving force for expansion (supersaturation pressure of dissolved N2) and the resistive forces (melt viscosity and extensional stress). In F1, the balance between melt resistance and deformability, together with the rheological reinforcement suggested by the plastograph results, may have allowed more uniform cell growth while limiting coalescence. In F2, higher crystallinity stiffens the melt prematurely, limiting cell deformation. The heterogeneous PBAT/TPS system may exhibit non-uniform resistance to biaxial deformation, favoring cell coalescence and collapse.
(iii)
Cell stabilization occurs when the polymer vitrifies or crystallizes sufficiently to “freeze” the cellular structure. The cooling step from 165 °C to 145 °C was designed to increase melt strength before depressurization, narrowing the window during which cells can coalesce. The higher circularity of F1 is consistent with more uniform cell growth and more effective stabilization, whereas the lower circularity of F3 indicates greater cell deformation and partial collapse [33,46].
Table 20 summarizes the main physical and cellular morphology parameters of the developed biodegradable foams (F1–F3) and compares them with typical values reported for commercial EPS [73]. The results confirm the observations from the optical microscopy images (Figure 12). Among the formulations investigated, F1 exhibited the lowest density, the smallest average cell area, and the highest cell circularity, indicating a comparatively homogeneous and regular cellular structure. In contrast, F3 showed the highest density, the largest cell area, the highest apparent porosity, and the lowest circularity, reflecting an irregular and partially collapsed cellular morphology, while F2 displayed intermediate characteristics. Although all biodegradable foams exhibited higher densities and lower expansion ratios than commercial EPS, F1 achieved the best overall balance between cellular homogeneity, density reduction, and structural stability. The porosity values of F1–F3 were obtained by two-dimensional image analysis, whereas the EPS value refers to typical bulk porosity reported in the literature [73,74]; therefore, the comparison is indicative.

3.6.3. DSC

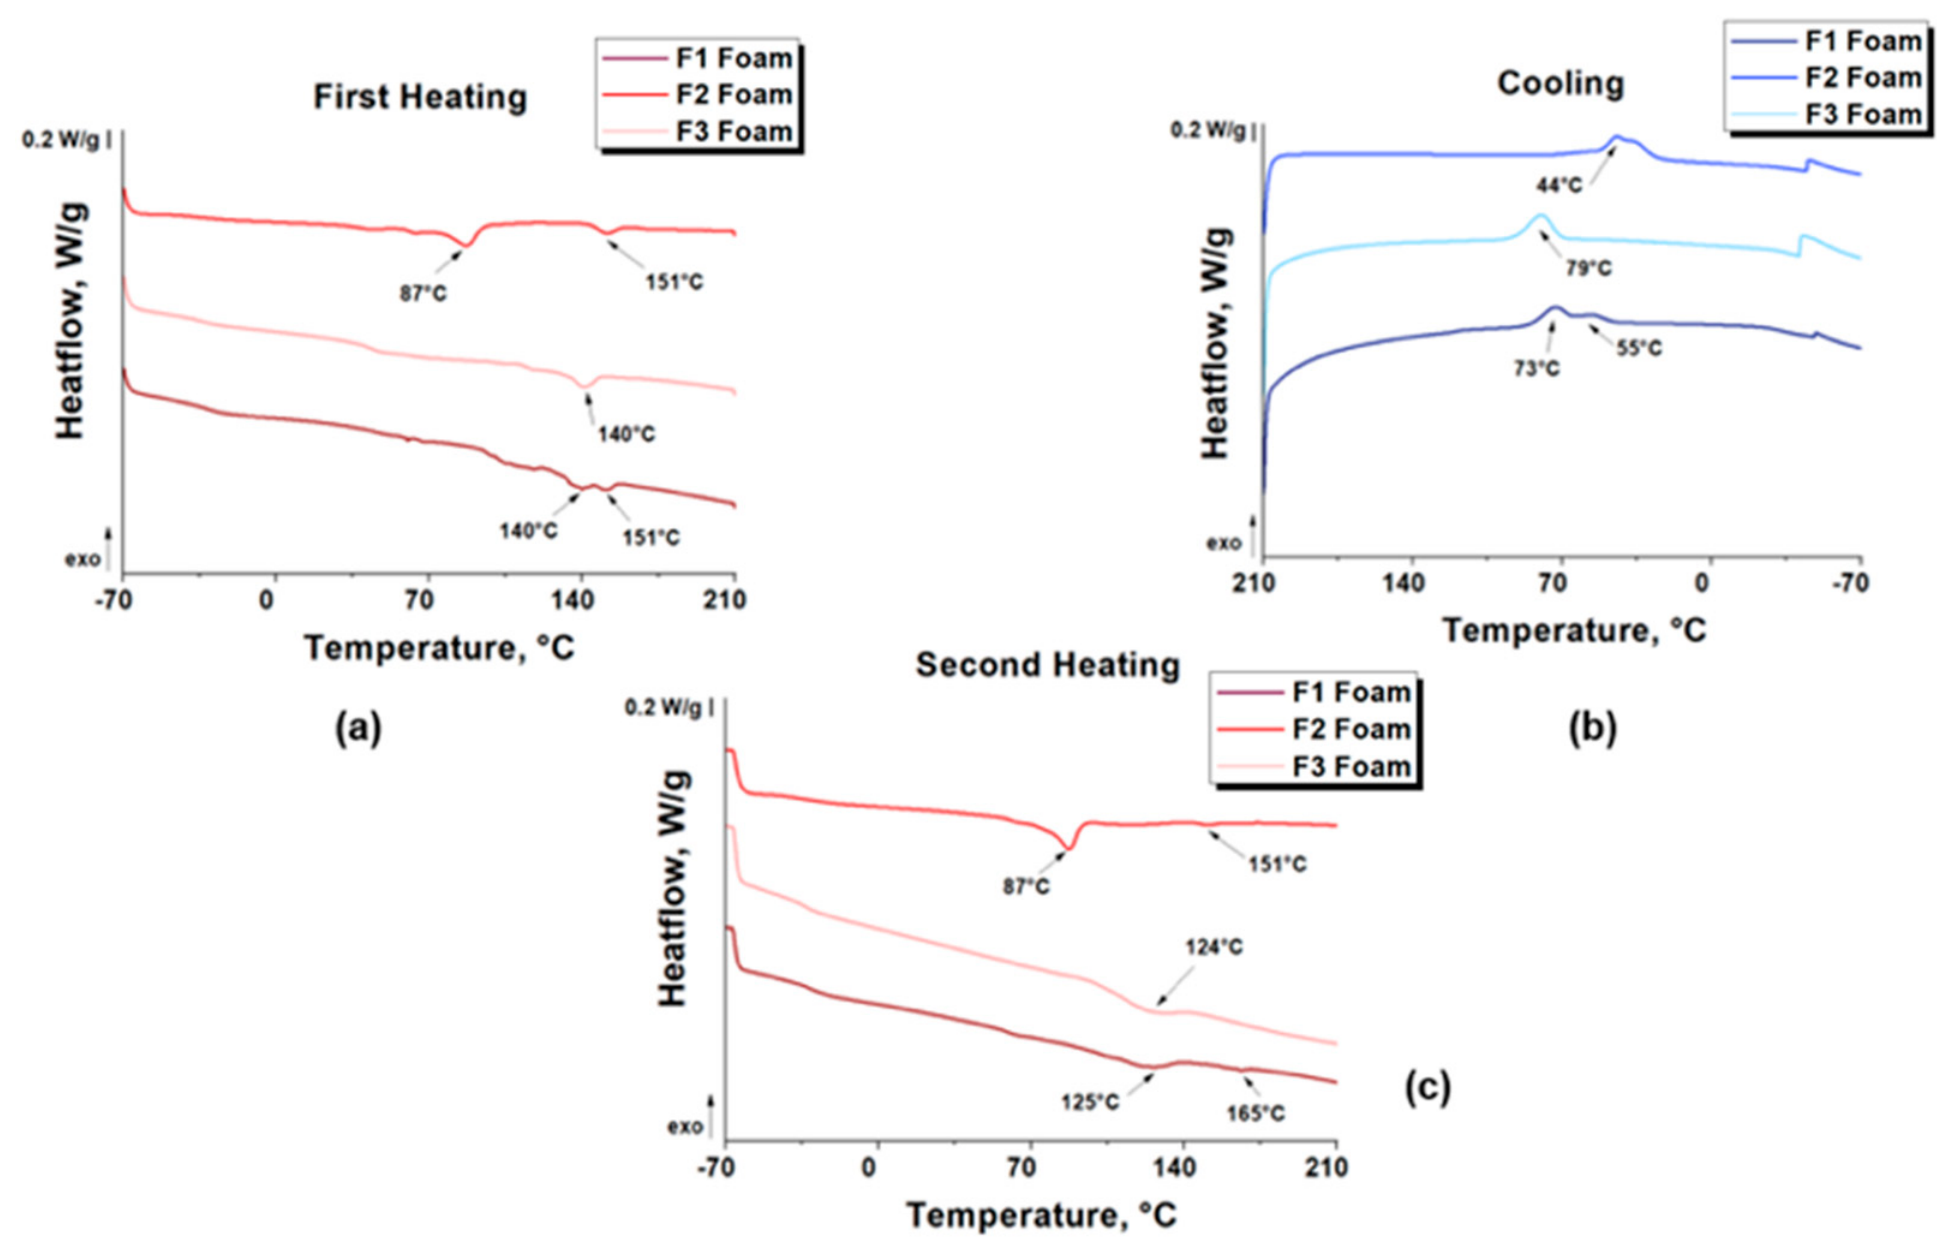
Figure 13 illustrates the DSC thermograms of the foamed F1, F2, and F3 formulations containing 5 wt.% of the chain-extending masterbatch, while Table 21 summarizes the primary thermal parameters obtained from the first heating, cooling, and second heating scans. The results revealed distinct thermal behaviors depending on the composition of the investigated biodegradable blends and the morphology developed during the foaming process. During the first heating, formulation F1 exhibited two distinct melting peaks located at approximately 140 °C and 151 °C, which are attributable to the presence of different polymer phases and crystalline reorganization phenomena within the PBAT/PLA system. Similarly, F2 presented a double thermal event, with a first peak at about 87 °C associated with the PBSA phase and a second peak at 151 °C belonging to the PLA component. In contrast, formulation F3 displayed a single main melting event around 140 °C, indicating a thermally less complex structure but one characterized by lower morphological stability. The cooling curves showed significant differences in crystallization behavior. Specifically, F3 exhibited the highest crystallization temperature (~79 °C), suggesting faster reorganization of the polymer chains during cooling. Conversely, F1 showed two distinct crystallization events (~55 °C and ~73 °C), consistent with the multiphase nature of the blend, whereas F2 displayed a main peak at approximately 44 °C, pointing to a more delayed crystallization of the system. In the second heating scan, all formulations showed variations in their melting peaks compared to the first scan, highlighting structural reorganization phenomena and differing crystalline stabilities induced by the prior thermal cycle. Notably, F1 maintained a multiphase behavior with thermal events at approximately 125 °C and 165 °C, while F2 and F3 exhibited more simplified transitions. The DSC findings demonstrate how the blend composition and the presence of the chain-extending masterbatch significantly influence the thermal stability, crystallization, and morphological organization of the biodegradable foamed structures.
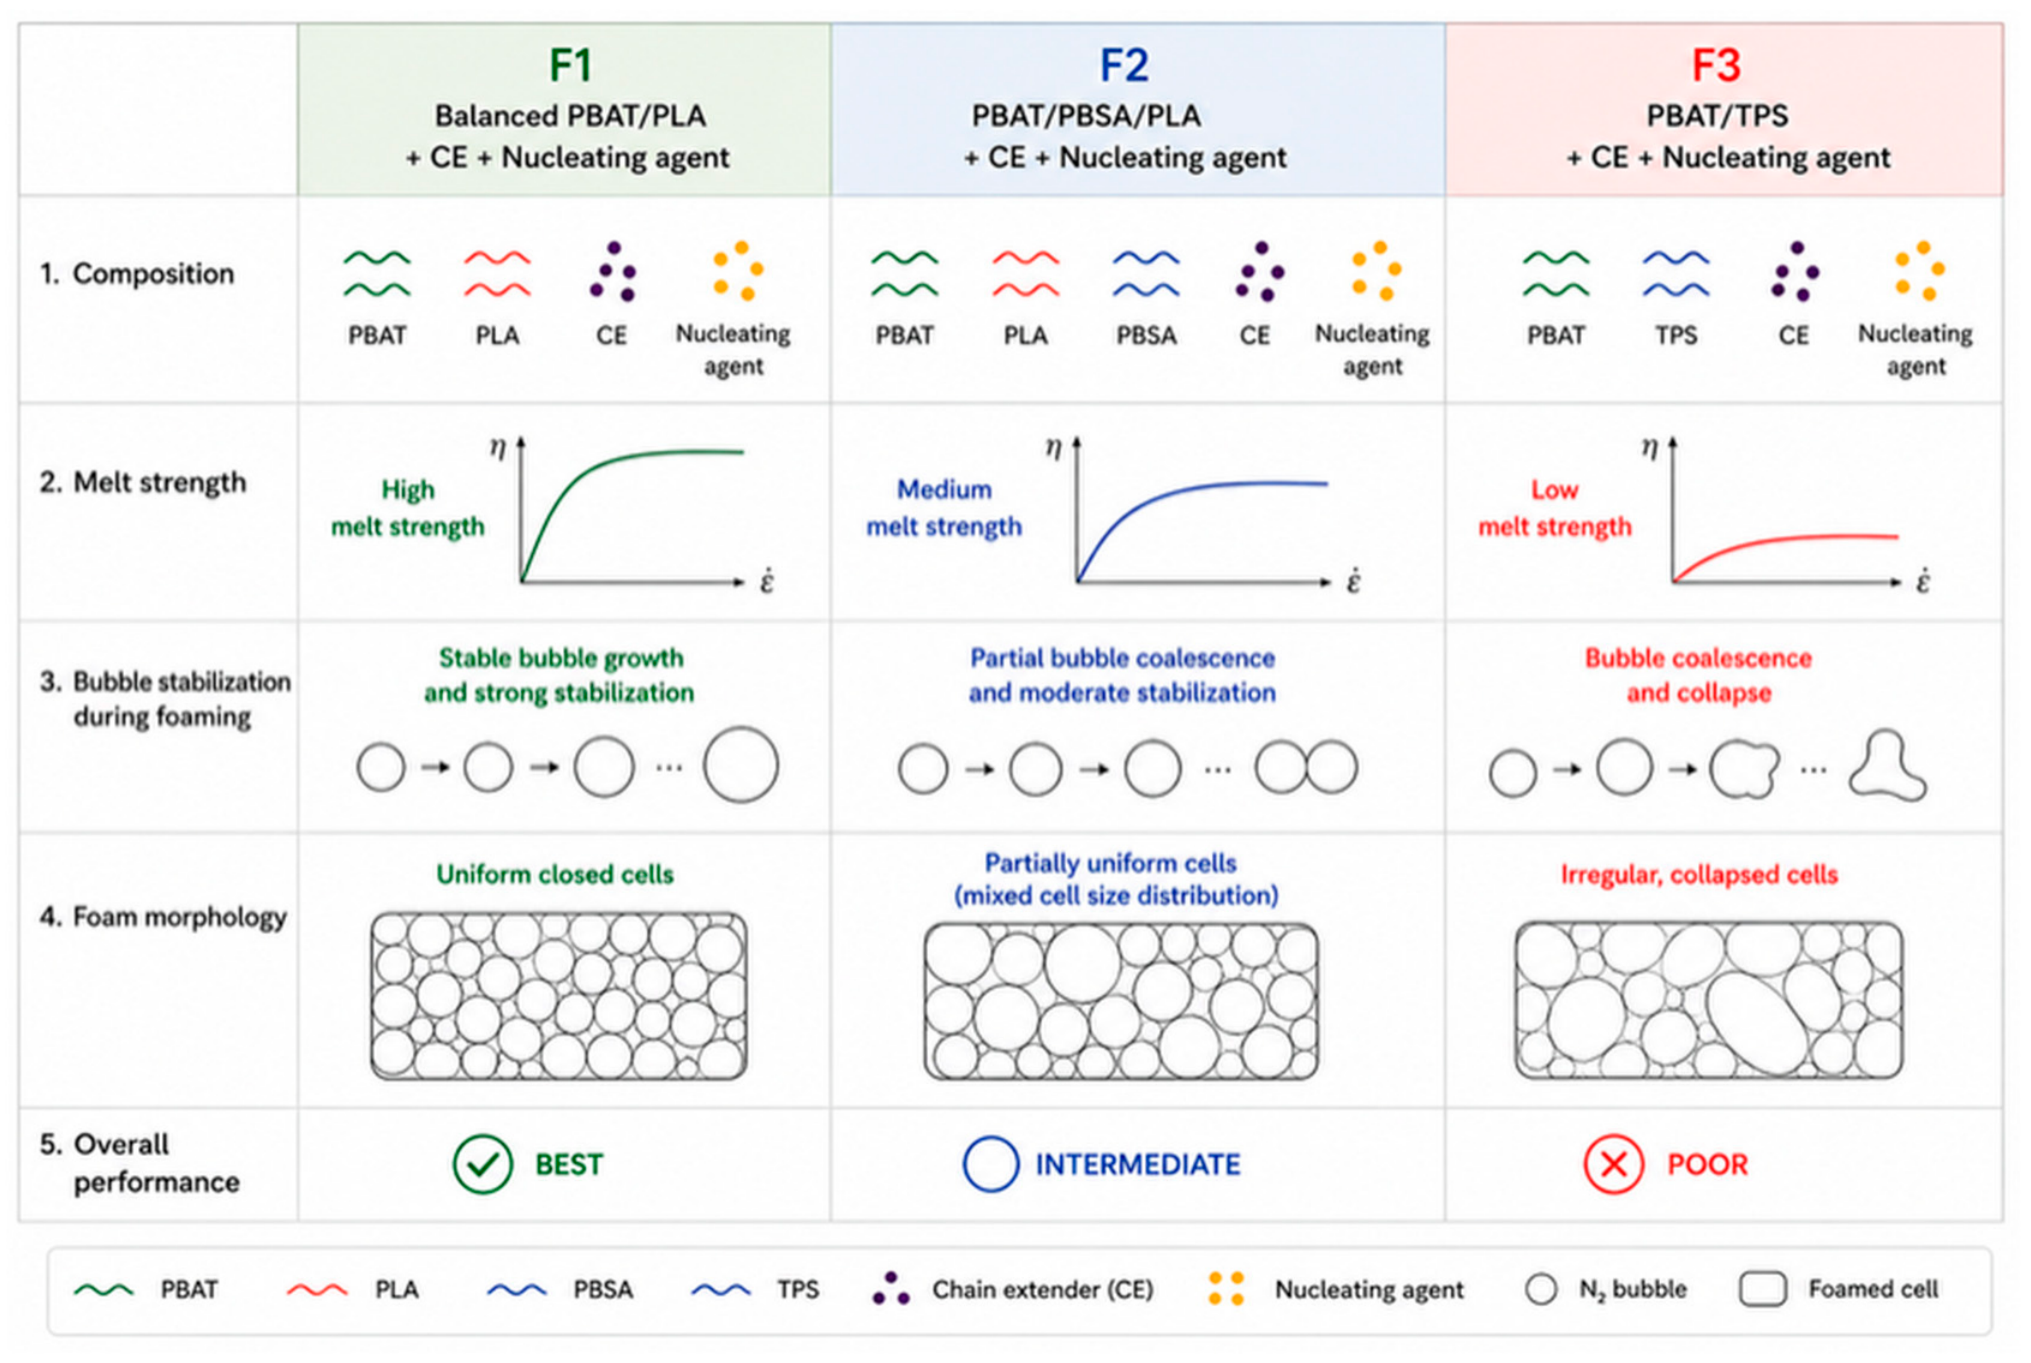
Comparison of DSC traces before and after foaming revealed shifts in melting peak positions and crystallinity, indicative of thermomechanical history effects. The higher crystallization temperature of F3 after foaming (~79 °C vs. ~77 °C before) suggests accelerated nucleation induced by the heterogeneous TPS phase, yet the resulting crystalline morphology was insufficiently interconnected to reinforce cell walls. This decoupling between bulk crystallinity and mechanical reinforcement explains why F3 exhibited both the highest post-foaming Tc and the poorest cellular structure [75]. Based on the experimental results, a schematic mechanism is proposed to explain the different foaming behaviors of the investigated biodegradable formulations. Figure 14 summarizes the relationship between blend composition, rheological behavior, melt stability, and cellular morphology.

4. Conclusions

In this study, three multiphase biodegradable formulations based on different combinations of PBAT, PLA, PBSA, and TPS were developed to investigate the influence of blend composition on rheological behavior, processability, and foaming performance. The results demonstrated that blend composition plays a fundamental role in determining melt stability, cellular morphology, and the final properties of expanded biodegradable materials. Among the investigated systems, formulation F2 exhibited the highest melt flow rate (5.42 ± 0.10 g/10 min), indicating superior processability, whereas F1 provided the best overall balance between rheological stability and foaming performance. F1 produced the most homogeneous cellular structure, with the highest cell circularity (0.826 ± 0.04) and the lowest foam density (0.786 ± 0.02 g/cm3). Conversely, although F3 exhibited the highest torque during plastograph analysis (96.1 ± 0.7 Nm), it showed the least favorable foaming performance and cellular morphology. Overall, the results highlight that the optimization of biodegradable blend composition, combined with the use of nucleating and reactive chain-extending masterbatches, is an effective strategy for improving melt stability and foam quality. Although the achieved densities remained higher than those of conventional EPS foams, the investigated formulations provide useful insights into the influence of blend composition on biodegradable foam development. Although the present study provides a comprehensive evaluation of the rheological, thermal, mechanical, and cellular behavior of the investigated formulations, some aspects require further investigation. Cellular morphology was quantitatively evaluated by optical microscopy combined with ImageJ image analysis, including equivalent cell diameter, areal cell density, circularity, and apparent porosity, providing a comprehensive comparative assessment of the foam structure. Nevertheless, higher-resolution morphological characterization, including SEM analysis, particularly of the PBAT/TPS system, could provide additional information on phase distribution, interfacial adhesion, and cell wall thickness, thereby contributing to a deeper understanding of the structure–property relationships of the investigated blends. Likewise, complementary characterization techniques such as dynamic oscillatory rheology, gel permeation chromatography (GPC/SEC), X-ray diffraction (XRD), and interfacial analyses (e.g., AFM or fractographic SEM) could provide further insight into melt elasticity, molecular weight evolution induced by the chain extender, crystalline structure, and interfacial compatibility. These analyses were beyond the scope of the present study but represent valuable directions for future research.
Furthermore, the mechanical characterization performed in this study was limited to the precursor cast films. The mechanical performance and structural integrity of the final foamed materials may be significantly influenced by their cellular morphology and service temperature. Future work will therefore focus on further optimizing both the blend composition and processing conditions, performing advanced morphological characterization, and investigating the mechanical behavior of the foamed materials through tensile, compression, and impact tests under different service temperatures. These future investigations will contribute to a more comprehensive understanding of the processing–structure–property relationships and support the development of biodegradable foams with improved expansion efficiency and cellular stability.

Author Contributions

All authors contributed to the study conception and design. Material preparation, data collection, and analysis were performed by D.M.P. and P.G. The first draft of the manuscript was written by D.M.P., and all authors commented on previous versions of the manuscript. The manuscript was revised by G.A. and B.M. All authors have read and agreed to the published version of the manuscript.

Funding

This work was funded by the European Union—NextGenerationEU—National Recovery and Resilience Plan (NRRP)—Mission 4, Component 2, Investment 1.1, under the Ministry of University and Research (MUR) PRIN 2022 program (D.D. n. 104 of 2 February 2022), financed through the ranking scroll procedure (ref. D.D. n. 1401 of 18 September 2024). Project title: ‘Eco-friendly foaming process of polybutylene adipate terephthalate (PBAT), polybutylene succinate terephthalate (PBST) and their blends with thermoplastic starch (TPS)’—Project Code.: 2022AKJNBA. CUP: F53C24000940006—Roma Tre University; CUP: B53C24006840006—Sapienza University of Rome). Sustainability 18 08748 i001

Data Availability Statement

The data presented in this study are available from the corresponding author upon reasonable request.

Acknowledgments

The authors gratefully acknowledge the financial support provided by the PRIN 2022 program funded by the Italian Ministry of University and Research (MUR) under the National Recovery and Resilience Plan (NRRP) supported by the European Union—NextGenerationEU.

Conflicts of Interest

The authors declare no conflicts of interest.

References

  1. Chin, M.T.; Diao, T. Industrial and Laboratory Technologies for the Chemical Recycling of Plastic Waste. ACS Catal. 2024, 14, 12437–12453. [Google Scholar] [CrossRef] [Scilit]
  2. Scalenghe, R. Resource or Waste? A Perspective of Plastics Degradation in Soil with a Focus on End-of-Life Options: One Step Beyond. Heliyon 2024, 10, e40647. [Google Scholar] [CrossRef] [Scilit]
  3. Nofar, M.; Zhu, W.; Park, C.B.; Randall, J. Crystallization Kinetics of Linear and Long-Chain-Branched Polylactide. Ind. Eng. Chem. Res. 2011, 50, 13789–13798. [Google Scholar] [CrossRef] [Scilit]
  4. Wadhwa, N.; Saharan, N. A Comprehensive Review of Biodegradable Polymers in Sustainable Packaging Applications. Res. Rev. J. Food Sci. Technol. 2024, 13, 28–37. [Google Scholar] [CrossRef] [Scilit]
  5. Wang, G.; Zhao, G.; Dong, G.; Mu, Y.; Park, C.B. Lightweight and Strong Microcellular Injection Molded PP/Talc Nanocomposite. Compos. Sci. Technol. 2018, 168, 38–46. [Google Scholar] [CrossRef] [Scilit]
  6. Ousji, H.; Miled, K.; Siala, A.; Belkassem, B.; Lecompte, D. Blast Mitigation Using Low-Density EPS Concrete: An Experimental Study. Case Stud. Constr. Mater. 2024, 21, e03962. [Google Scholar] [CrossRef] [Scilit]
  7. González-Betancur, D.; Hoyos-Montilla, A.A.; Tobón, J.I. Sustainable Hybrid Lightweight Aggregate Concrete Using Recycled Expanded Polystyrene. Materials 2024, 17, 2368. [Google Scholar] [CrossRef] [Scilit]
  8. Mei, L.; Huang, Y.; Xiang, D. Research on the Mechanical Properties of EPS Lightweight Soil Mixed with Fly Ash. Polymers 2024, 16, 3517. [Google Scholar] [CrossRef] [Scilit]
  9. El Gamal, S.; Al-Jardani, Y.; Meddah, M.S.; Abu Sohel, K.; Al-Saidy, A. Mechanical and Thermal Properties of Lightweight Concrete with Recycled Expanded Polystyrene Beads. Eur. J. Environ. Civ. Eng. 2024, 28, 80–94. [Google Scholar] [CrossRef] [Scilit]
  10. Rofdi, M.I.; Mohamed Tamat, N.S.; Nuryawan, A.; Sakagami, H.; Hermawan, A. Studies on Particleboard Production Using Expanded Polystyrene (EPS) Waste as a Binder for Construction Applications. Constr. Build. Mater. 2024, 449, 138279. [Google Scholar] [CrossRef] [Scilit]
  11. Geyer, R.; Jambeck, J.R.; Law, K.L. Production, Use, and Fate of All Plastics Ever Made. Sci. Adv. 2017, 3, e1700782. [Google Scholar] [CrossRef] [Scilit] [PubMed]
  12. Prata, J.C.; Silva, A.L.P.; Walker, T.R.; Duarte, A.C.; Rocha-Santos, T. Solutions and Integrated Strategies for the Control and Mitigation of Plastic and Microplastic Pollution. Int. J. Environ. Res. Public Health 2019, 16, 2411. [Google Scholar] [CrossRef] [Scilit]
  13. Rhodes, C.J. Plastic Pollution and Potential Solutions. Sci. Prog. 2018, 101, 207–260. [Google Scholar] [CrossRef] [Scilit]
  14. Walker, T.R.; Xanthos, D. A Call for Canada to Move toward Zero Plastic Waste by Reducing and Recycling Single-Use Plastics. Resour. Conserv. Recycl. 2018, 133, 99–100. [Google Scholar] [CrossRef] [Scilit]
  15. European Parliament; Council of the European Union. Directive (EU) 2019/904 of the European Parliament and of the Council of 5 June 2019 on the reduction of the impact of certain plastic products on the environment. Off. J. Eur. Union 2019, L 155, 1–19. [Google Scholar]
  16. Sethia, P.; Nandhini, D.; Amutha, S. Effects of Marine Microplastic on Marine Life and the Food Webs—A Detailed Review. Mar. Ecol. 2024, 45, e12819. [Google Scholar] [CrossRef] [Scilit]
  17. Schnurr, R.E.J.; Alboiu, V.; Chaudhary, M.; Corbett, R.A.; Quanz, M.E.; Sankar, K.; Srain, H.S.; Thavarajah, V.; Xanthos, D.; Walker, T.R. Reducing Marine Pollution from Single-Use Plastics (SUPs): A Review. Mar. Pollut. Bull. 2018, 137, 157–171. [Google Scholar] [CrossRef] [Scilit]
  18. Spies, A.M.; Geldmacher, J.; García López, C.; Pretz, T.; Raulf, K. Methodology to Quantify Single-Use Plastic Products in Municipal Solid Waste. Part 1: Development of a Sampling Methodology. Waste Manag. Res. 2024, 42, 485–494. [Google Scholar] [CrossRef] [Scilit]
  19. Rabelo, L.S.; Tanaka, F.C.; dos Santos, S.S.; Aouada, F.A.; de Moura, M.R. The Future of Sustainable Packaging: Exploring Biodegradable Solutions Through Extrusion, Thermo-Expansion, 3D Printing and Supercritical Fluid from Agro-Industry Waste. Foods 2025, 14, 4027. [Google Scholar] [CrossRef] [Scilit]
  20. Gonçalves, L.F.F.F.; Reis, R.L.; Fernandes, E.M. Forefront Research of Foaming Strategies on Biodegradable Polymers and Their Composites by Thermal or Melt-Based Processing Technologies: Advances and Perspectives. Polymers 2024, 16, 1286. [Google Scholar] [CrossRef] [Scilit] [PubMed]
  21. Islam, M.; Xayachak, T.; Haque, N.; Lau, D.; Bhuiyan, M.; Pramanik, B.K. Impact of Bioplastics on Environment from Its Production to End-of-Life. Process Saf. Environ. Prot. 2024, 188, 151–166. [Google Scholar] [CrossRef] [Scilit]
  22. Yadav, K.; Nikalje, G.C. Comprehensive Analysis of Bioplastics: Life Cycle Assessment, Waste Management, Biodiversity Impact, and Sustainable Mitigation Strategies. PeerJ 2024, 12, e18013. [Google Scholar] [CrossRef] [Scilit] [PubMed]
  23. Kumar, R.; Lalnundiki, V.; Shelare, S.D.; Abhishek, G.J.; Sharma, S.; Sharma, D.; Kumar, A.; Abbas, M. An Investigation of the Environmental Implications of Bioplastics: Recent Advancements on the Development of Environmentally Friendly Bioplastics Solutions. Environ. Res. 2024, 244, 117707. [Google Scholar] [CrossRef] [Scilit]
  24. Nizamuddin, S.; Chen, C. Biobased, Biodegradable and Compostable Plastics: Chemical Nature, Biodegradation Pathways and Environmental Strategy. Environ. Sci. Pollut. Res. 2024, 31, 8387–8399. [Google Scholar] [CrossRef] [Scilit]
  25. Fang, C.; Zhang, X.; Zhang, Z.; Naidu, R. Characterising Fragmentation of Compostable Bioplastic: Releasing Microplastics or Small Bioplastic Debris. Environ. Sci. Eur. 2024, 36, 121. [Google Scholar] [CrossRef] [Scilit]
  26. Abe, M.M.; Portinho, J.L.; Gonçalves, M.M.C.; Sanvezzo, P.B.; Freitas, C.; Souza, J.F.; Carneiro, R.; Ferragut, C.; Costa, M.L.; Aouada, M.R.M.; et al. Development of Polysaccharide Bioplastic: Analysis of Thermomechanical Properties and Different Environmental Implications. J. Clean. Prod. 2024, 469, 143163. [Google Scholar] [CrossRef] [Scilit]
  27. Sultan, A.; Sultan, H.; Shahzad, W.; Kareem, A.; Liaqat, A.; Ashraf, Z.; Shahid, A.; Rauf, A.; Saeed, S.; Mehmood, T.; et al. Comparative Analysis of Physical and Mechanical Properties of Starch-Based Bioplastic Derived from the Pulp and Peel of Potatoes. J. Indian Chem. Soc. 2024, 101, 101301. [Google Scholar] [CrossRef] [Scilit]
  28. Yang, X.; Ling, X.; Li, Y.; Wang, H. Simultaneous Enhanced Mechanical Properties and Foamability of Biodegradable PBAT via Physical Cross-Linking through Reactive Blending. ACS Appl. Polym. Mater. 2024, 6, 13969–13978. [Google Scholar] [CrossRef] [Scilit]
  29. Benitez, J.J.; Florido-Moreno, P.; Porras-Vázquez, J.M.; Tedeschi, G.; Athanassiou, A.; Heredia-Guerrero, J.A.; Guzman-Puyol, S. Transparent, Plasticized Cellulose-Glycerol Bioplastics for Food Packaging Applications. Int. J. Biol. Macromol. 2024, 273, 132956. [Google Scholar] [CrossRef] [Scilit]
  30. Gunawan, G.; Heryanto, H.; Tahir, D. Keratin-Based Bioplastics Extracted from Chicken Feathers: Effect of Chitosan Concentration on the Structural, Chemical Bonding, and Mechanical Properties of Bioplastics. Int. J. Biol. Macromol. 2024, 265, 130722. [Google Scholar] [CrossRef] [Scilit]
  31. Jiménez, J.A.V.; Le Moigne, N.; Bénézet, J.-C.; Sauceau, M.; Sescousse, R.; Fages, J. Foaming of PLA Composites by Supercritical Fluid-Assisted Processes: A Review. Molecules 2020, 25, 3408. [Google Scholar] [CrossRef] [Scilit]
  32. Peng, K.; Mubarak, S.; Diao, X.; Cai, Z.; Zhang, C.; Wang, J.; Wu, L. Progress in the Preparation, Properties, and Applications of PLA and Its Composite Microporous Materials by Supercritical CO2: A Review from 2020 to 2022. Polymers 2022, 14, 4320. [Google Scholar] [CrossRef] [Scilit]
  33. Tiwary, P.; Park, C.B.; Kontopoulou, M. Transition from Microcellular to Nanocellular PLA Foams by Controlling Viscosity, Branching and Crystallization. Eur. Polym. J. 2017, 91, 283–296. [Google Scholar] [CrossRef] [Scilit]
  34. Vilem, R.; Mertlik, O.; Plachy, T.; Manas, L.; Sedlacek, T. UHMWPE-Assisted Melt Strength Enhancement of Recycled PLA for Lightweight Foaming. ACS Polym. Au 2026, 6, 376–387. [Google Scholar] [CrossRef] [Scilit]
  35. Xu, C.; Sun, C.; Wan, H.; Tan, H.; Zhao, J.; Zhang, Y. Microstructure and Physical Properties of Poly(Lactic Acid)/Polycaprolactone/Rice Straw Lightweight Biocomposite Foams for Wall Insulation. Constr. Build. Mater. 2022, 354, 129216. [Google Scholar] [CrossRef] [Scilit]
  36. Taguet, A.; Cassagnau, P.; Lopez-Cuesta, J.-M. Structuration, Selective Dispersion and Compatibilizing Effect of (Nano)Fillers in Polymer Blends. Prog. Polym. Sci. 2014, 39, 1526–1563. [Google Scholar] [CrossRef] [Scilit]
  37. Münstedt, H. Melt Strain Hardening of Polymeric Systems Filled with Solid Particles: Review and Supplementary Experimental Results. Rheol. Acta 2024, 63, 333–343. [Google Scholar] [CrossRef] [Scilit]
  38. Faria, C.; Reis, D.; Dias, D.; Reis, R.; Cruz, S. Material Limitations and Processing Challenges of Bio-Based Thermoplastics: A Review. J. Appl. Polym. Sci. 2026, 143, e70436. [Google Scholar] [CrossRef] [Scilit]
  39. Garancher, J.-P.; Fernyhough, A. Expansion and Dimensional Stability of Semi-Crystalline Polylactic Acid Foams. Polym. Degrad. Stab. 2014, 100, 21–28. [Google Scholar] [CrossRef] [Scilit]
  40. Le Marec, P.E.; Ferry, L.; Quantin, J.-C.; Bénézet, J.-C.; Bonfils, F.; Guilbert, S.; Bergeret, A. Influence of Melt Processing Conditions on Poly(Lactic Acid) Degradation: Molar Mass Distribution and Crystallization. Polym. Degrad. Stab. 2014, 110, 353–363. [Google Scholar] [CrossRef] [Scilit]
  41. Yang, Y.; Li, X.; Zhang, Q.; Xia, C.; Chen, C.; Chen, X.; Yu, P. Foaming of Poly(Lactic Acid) with Supercritical CO2: The Combined Effect of Crystallinity and Crystalline Morphology on Cellular Structure. J. Supercrit. Fluids 2019, 145, 122–132. [Google Scholar] [CrossRef] [Scilit]
  42. Al-Itry, R.; Lamnawar, K.; Maazouz, A. Improvement of Thermal Stability, Rheological and Mechanical Properties of PLA, PBAT and Their Blends by Reactive Extrusion with Functionalized Epoxy. Polym. Degrad. Stab. 2012, 97, 1898–1914. [Google Scholar] [CrossRef] [Scilit]
  43. Du, J.; Yang, H.; Zhao, X. Preparation of Tomato Peel Pomace Powder/Polylactic Acid Foams under Supercritical CO2 Conditions: Improvements in Cell Structure and Foaming Behavior. Int. J. Biol. Macromol. 2024, 270, 132480. [Google Scholar] [CrossRef] [Scilit]
  44. Xu, M.; Wu, M.; Li, X.; Tang, J.; Ma, W.; Zhu, X.; Ren, Q.; Wang, L.; Zheng, W. Biodegradable Nanofibrillated Microcellular PBS/PLA Foams for Selective Oil Absorption. Int. J. Biol. Macromol. 2024, 254, 127844. [Google Scholar] [CrossRef] [Scilit]
  45. Ding, Y.; Yang, Q.; Wang, X.; Li, S. The Effect of Free Radical Initiators on Poly(Butylene Adipate-co-Terephthalate) (PBAT) and Its Foaming Performance. J. Mater. Sci. 2024, 59, 20854–20869. [Google Scholar] [CrossRef] [Scilit]
  46. Li, Z.; Jiang, J.; Qiao, M.; Xie, Y.; Zhang, Y.; Zhu, C.; Wang, X.; Li, Q. Biodegradable Ultra-Large Expansion and High Open-Cell PLA/PBAT Foams Fabricated by Supercritical CO2 Foaming for Selective Oil/Water Absorption. J. Polym. Environ. 2024, 32, 4647–4660. [Google Scholar] [CrossRef] [Scilit]
  47. da Silva Figueiró, C.; Calcagno, C.I.W.; Santana, R.M.C. Starch Foams and Their Additives: A Brief Review. Starch 2024, 76, 2300012. [Google Scholar] [CrossRef] [Scilit]
  48. D’Souza, G.C.; Ng, H.; Charpentier, P.; Xu, C.C. Recent Developments in Biobased Foams and Foam Composites for Construction Applications. ChemBioEng Rev. 2024, 11, 7–38. [Google Scholar] [CrossRef] [Scilit]
  49. Chen, P.-H.; Chen, C.-W.; Chan, T.-H.; Lin, H.-Y.; Tuan, K.-L.; Su, C.-S.; Tsai, J.-C.; Lin, F.-H. Foaming of Bio-Based PLA/PBS/PBAT Ternary Blends with Added Nanohydroxyapatite Using Supercritical CO2: Effect of Operating Strategies on Cell Structure. Molecules 2025, 30, 2056. [Google Scholar] [CrossRef] [Scilit]
  50. Li, B.; Qiu, H.; He, H.; Zhang, Y. Performance-Enhanced PBAT/PBS Foams via Micro-Opening Microcellular Injection Molding With an ADR Chain Extender. Polym. Eng. Sci. 2026, 66, 2492–2502. [Google Scholar] [CrossRef] [Scilit]
  51. Wen, B.; Wang, G.; Xu, R.; Weng, C.; Yang, J. CO2-Philic Chain Extenders: Engineering Interfacial Activation for Optimized Cellular Morphogenesis in Biodegradable Polymer Foams. Polymer 2025, 338, 129086. [Google Scholar] [CrossRef] [Scilit]
  52. Li, S.; Zhou, D.; Yu, Z.; Ji, J.; You, F.; Qiu, J.; Luo, G.; Jiang, X.; Shen, Q. Research Progress on the Improvement Strategy of Foaming Behavior for Biodegradable Polymer Foams and Their Functional Applications. Sustain. Mater. Technol. 2025, 44, e01354. [Google Scholar] [CrossRef] [Scilit]
  53. He, X.; Zhang, F.; Li, C.; Ding, W.; Jin, Y.; Tang, L.; Huang, R. Effect of Starch Plasticization on Morphological, Mechanical, Crystalline, Thermal, and Optical Behavior of Poly(Butylene Adipate-Co-Terephthalate)/Thermoplastic Starch Composite Films. Polymers 2024, 16, 326. [Google Scholar] [CrossRef] [Scilit]
  54. Chuakhao, S.; Rodríguez, J.T.; Lapnonkawow, S.; Kannan, G.; Müller, A.J.; Suttiruengwong, S. Formulating PBS/PLA/PBAT Blends for Biodegradable, Compostable Packaging: The Crucial Roles of PBS Content and Reactive Extrusion. Polym. Test. 2024, 132, 108383. [Google Scholar] [CrossRef] [Scilit]
  55. Shaikh, S.; Yaqoob, M.; Aggarwal, P. An Overview of Biodegradable Packaging in Food Industry. Curr. Res. Food Sci. 2021, 4, 503–520. [Google Scholar] [CrossRef] [Scilit]
  56. Genovesi, A.; Milo di Villagrazia, M.; Barletta, M. Evaluation of Processability and Functional Properties of Low-Cost Compatibilized PLA–PHBH Blends for Thermoforming. J. Appl. Polym. Sci. 2025, 142, e58179. [Google Scholar] [CrossRef] [Scilit]
  57. Barborik, T.; Zatloukal, M. Steady-State Modeling of Extrusion Cast Film Process, Neck-In Phenomenon, and Related Experimental Research: A Review. Phys. Fluids 2020, 32, 061302. [Google Scholar] [CrossRef] [Scilit]
  58. ISO 1133-1:2022; Plastics—Determination of the Melt Mass-Flow Rate (MFR) and Melt Volume-Flow Rate (MVR) of Thermoplastics—Part 1: Standard Method. International Organization for Standardization (ISO): Geneva, Switzerland, 2022.
  59. ISO 11357-1:2016; Plastics—Differential Scanning Calorimetry (DSC)—Part 1: General Principles. International Organization for Standardization (ISO): Geneva, Switzerland, 2016.
  60. ASTM D882-18; Standard Test Method for Tensile Properties of Thin Plastic Sheeting. ASTM International: West Conshohocken, PA, USA, 2018.
  61. Schnepf, U.; von Moers-Meßmer, M.A.L.; Brümmer, F. A Practical Primer for Image-Based Particle Measurements in Microplastic Research. Microplast. Nanoplast. 2023, 3, 16. [Google Scholar] [CrossRef] [Scilit]
  62. Fourati, Y.; Tarrés, Q.; Mutjé, P.; Boufi, S. PBAT/Thermoplastic Starch Blends: Effect of Compatibilizers on the Rheological, Mechanical and Morphological Properties. Carbohydr. Polym. 2018, 199, 51–57. [Google Scholar] [CrossRef] [Scilit]
  63. Al-Itry, R.; Lamnawar, K.; Maazouz, A. Rheological, Morphological, and Interfacial Properties of Compatibilized PLA/PBAT Blends. Rheol. Acta 2014, 53, 501–517. [Google Scholar] [CrossRef] [Scilit]
  64. Desole, M.P.; Palangio, G.; Gisario, A.; Barletta, M. Reactive Degradation and Upgrading of Recycled Polypropylene Using Nexamite Additives: Effects on Rheological, Thermal and Mechanical Properties. Appl. Sci. 2026, 16, 4621. [Google Scholar] [CrossRef] [Scilit]
  65. Standau, T.; Zhao, C.; Murillo Castellón, S.; Bonten, C.; Altstädt, V. Chemical Modification and Foam Processing of Polylactide (PLA). Polymers 2019, 11, 306. [Google Scholar] [CrossRef] [Scilit]
  66. Signori, F.; Coltelli, M.-B.; Bronco, S. Thermal Degradation of Poly(Lactic Acid) (PLA) and Poly(Butylene Adipate-Co-Terephthalate) (PBAT) and Their Blends upon Melt Processing. Polym. Degrad. Stab. 2009, 94, 74–82. [Google Scholar] [CrossRef] [Scilit]
  67. Niu, Z.; Chen, F.; Zhang, H.; Liu, C. High Content of Thermoplastic Starch, Poly(Butylenes Adipate-Co-Terephthalate) and Poly(Butylene Succinate) Ternary Blends with a Good Balance in Strength and Toughness. Polymers 2023, 15, 2040. [Google Scholar] [CrossRef] [Scilit]
  68. Farah, S.; Anderson, D.G.; Langer, R. Physical and Mechanical Properties of PLA, and Their Functions in Widespread Applications—A Comprehensive Review. Adv. Drug Deliv. Rev. 2016, 107, 367–392. [Google Scholar] [CrossRef] [Scilit]
  69. Bianchi, M.; Dorigato, A.; Morreale, M.; Pegoretti, A. Evaluation of the Physical and Shape Memory Properties of Fully Biodegradable Poly(Lactic Acid) (PLA)/Poly(Butylene Adipate Terephthalate) (PBAT) Blends. Polymers 2023, 15, 881. [Google Scholar] [CrossRef] [Scilit]
  70. Androsch, R.; Jariyavidyanont, K.; Janke, A.; Schick, C. Poly(Butylene Succinate): Low-Temperature Nucleation and Crystallization, Complex Morphology and Absence of Lamellar Thickening. Polymer 2023, 285, 126311. [Google Scholar] [CrossRef] [Scilit]
  71. González-Henríquez, C.M.; Sarabia-Vallejos, M.A.; Rodriguez-Hernandez, J. Polymers for Additive Manufacturing and 4D-Printing: Materials, Methodologies, and Biomedical Applications. Prog. Polym. Sci. 2019, 94, 57–116. [Google Scholar] [CrossRef] [Scilit]
  72. Averous, L.; Boquillon, N. Biocomposites Based on Plasticized Starch: Thermal and Mechanical Behaviours. Carbohydr. Polym. 2004, 56, 111–122. [Google Scholar] [CrossRef] [Scilit]
  73. Xu, Z.; Sun, D.; Xu, J.; Yang, R.; Russell, J.D.; Liu, G. Progress and Challenges in Polystyrene Recycling and Upcycling. ChemSusChem 2024, 17, e202400474. [Google Scholar] [CrossRef] [Scilit]
  74. Ramli Sulong, N.H.; Mustapa, S.A.S.; Abdul Rashid, M.K. Application of Expanded Polystyrene (EPS) in Buildings and Constructions: A Review. J. Appl. Polym. Sci. 2019, 136, 47529. [Google Scholar] [CrossRef] [Scilit]
  75. Krishnan, V.G.; Fiorucci, L.; Sarbu, A.; Drenckhan-Andreatta, W. Characterizing the Foaming Process of Polymers: Review of Experimental Methods. Adv. Colloid Interface Sci. 2025, 344, 103579. [Google Scholar] [CrossRef] [Scilit]
Figure 1. Experimental workflow illustrates the preparation, processing, foaming, characterization, and comparison of the investigated biodegradable formulations.
Sustainability 18 08748 g001
Figure 2. Representative images of the biodegradable pellets obtained after the twin extrusion process for the investigated formulations: (a) F1, (b) F2, and (c) F3.
Sustainability 18 08748 g002
Figure 3. Representative images of the cast extrusion process and corresponding biodegradable films obtained from the investigated formulations: (a) F1, (b) F2, and (c) F3.
Sustainability 18 08748 g003
Figure 4. Three-dimensional rheological maps showing the combined effect of shear rate and temperature on the apparent viscosity of the investigated biodegradable formulations: (a) F1, (b) F2, and (c) F3.
Sustainability 18 08748 g004
Figure 5. DSC thermograms of the biodegradable polymer formulations F1, F2, and F3.
Sustainability 18 08748 g005
Figure 6. FTIR-ATR spectra of the investigated biodegradable formulations (F1, F2, and F3) acquired in the wavenumber range between 4000 and 600 cm−1.
Sustainability 18 08748 g006
Figure 7. Representative stress–strain curves obtained from tensile tests performed on the investigated biodegradable films: F1, F2, and F3.
Sustainability 18 08748 g007
Figure 8. Comparative performance map showing the normalized comparison of the main rheological and mechanical properties of formulations F1, F2, and F3, including torque stability, maximum stress, elongation at break, elastic modulus, and yield stress.
Sustainability 18 08748 g008
Figure 9. FTIR-ATR spectra of the biodegradable films obtained from formulations film F1, film F2, and film F3 in the wavenumber range between 4000 and 600 cm−1.
Sustainability 18 08748 g009
Figure 10. Representative stress–strain curves of the biodegradable films obtained from formulations F1, F2, and F3 tested along (a) machine direction (MD) and (b) transverse direction (TD).
Sustainability 18 08748 g010
Figure 11. Maximum torque as a function of chain-extending agent concentration for formulations F1, F2, and F3 during melt processing.
Sustainability 18 08748 g011
Figure 12. Optical microscopy images of foamed biodegradable formulations F1, F2, and F3 containing the 5 wt.% chain-extending masterbatch, acquired at approximately 20× magnification (scale bar: 1 mm).
Sustainability 18 08748 g012
Figure 13. DSC thermograms of foamed biodegradable formulations F1, F2, and F3 obtained with the 5 wt.% chain-extending masterbatch during (a) first heating, (b) cooling, and (c) second heating scans.
Sustainability 18 08748 g013
Figure 14. Proposed mechanism of the foaming behavior of biodegradable formulations.
Sustainability 18 08748 g014
Table 1. Composition of the investigated formulations expressed in weight percentage (wt.%).
MaterialsF1F2F3
wt.%
PBAT—TH 801/2 Resin8029.3562.7
PLA Ingeo Biopolymer 2003D18.700
BioPBS FM92PM0400
PLA Luminy LX 175029.350
TPS—Amitroplast 89450036
Additive package1.31.31.3
Table 2. Nucleating masterbatches F1, F2, and F3.
Nucleating Masterbatch F1 (%)
PBAT—TH 801/2 Resin64
Nucleating additive20
PLA Ingeo Biopolymer 2003D16
Nucleating Masterbatch F2 (%)
BioPBS FM92PM41
PBAT—TH 801/2 Resin19.5
Nucleating additive20
PLA Luminy LX 17519.5
Nucleating Masterbatch F3 (%)
TPS Amitroplast 894516
Nucleating additive20
PBAT—TH 801/2 Resin64
Table 3. Chain-extending masterbatches F1, F2, and F3.
Chain-Extending Masterbatch F1 (%)
Reactive additive10
PBAT—TH 801/2 Resin72
PLA Ingeo Biopolymer 2003D18
Chain-Extending Masterbatch F2 (%)
BioPBS FM92PM40
PBAT—TH 801/2 Resin25
Reactive additive10
Chain-Extending Masterbatch F3 (%)
TPS Amitroplast 894518
Reactive additive10
PBAT—TH 801/2 Resin72
Table 4. Processing parameters adopted during the extrusion of formulations F1, F2, and F3, including barrel temperature profile (T1–T12), screw speed, melt temperature (Tmelt), and melt pressure (Pmelt).
Machine’s Parameters
F1T1T2T3T4T5T6T7T8T9T10T11T12
130135135140150155155140135135130125
Screw speed (rpm)280Tmelt (°C)138 Pmelt (bar)25
F2T1T2T3T4T5T6T7T8T9T10T11T12
120140145150155155160155150145145145
Screw speed (rpm)300Tmelt (°C)147Pmelt (bar)23
F3T1T2T3T4T5T6T7T8T9T10T11T12
120125125130135137135135135133133130
Screw speed (rpm)330Tmelt (°C)129Pmelt (bar)4.7
Table 5. Main processing parameters adopted during the cast extrusion process, including temperature profile, screw speed, haul-off speed, calender speed, and winding conditions, for Formulation 1.
ParameterValueUnit
Cylinder temperature155–160°C
Die/head temperature144–145°C
Extruder screw speed70rpm
Haul-off speed1.6m/min
Calender speed1.2–1.3m/min
Winding setting40%
Table 6. Main processing parameters adopted during the cast extrusion process, including temperature profile, screw speed, haul-off speed, calender speed, and winding conditions, for Formulation 2.
ParameterValueUnit
Cylinder temperature159–160°C
Die/head temperature164–165°C
Extruder screw speed99.9–100rpm
Haul-off speed0.7–0.8m/min
Calender speed0.7–0.8m/min
Winding setting15–16%
Table 7. Main processing parameters adopted during the cast extrusion process, including temperature profile, screw speed, haul-off speed, calender speed, and winding conditions, for Formulation 3.
ParameterValueUnit
Cylinder temperature154–164°C
Die/head temperature147–150°C
Extruder screw speed75rpm
Haul-off speed1.4m/min
Calender speed1.1–1.2m/min
Winding setting40%
Table 8. Symbols, descriptions and units used for the calculation of the degree of crystallinity from DSC thermograms.
SymbolDescriptionUnit
Δ H mi Melting enthalpy of polymer i measured during the DSC heating scanJ/g
Δ H ci Cold crystallization enthalpy of polymer iJ/g
Δ H mi 0 Melting enthalpy of 100% crystalline polymer iJ/g
w i Weight fraction of polymer i in the formulation-
X C   Degree of crystallinity%
Table 9. Experimental design adopted in the present study.
CategoryInvestigated ParameterF1F2F3
Independent variableBlend compositionPBAT/PLAPBAT/PBSA/PLAPBAT/TPS
Controlled variableNucleating masterbatch content5 wt.%5 wt.%5 wt.%
Controlled variableChain-extending masterbatch content (foaming stage)5 wt.%5 wt.%5 wt.%
Controlled variableFoaming temperature165 °C165 °C165 °C
Controlled variableSaturation pressureSame conditionsSame conditionsSame conditions
Controlled variableSaturation time1 h1 h1 h
Controlled variableDepressurization procedureIdenticalIdenticalIdentical
Response variablesMeasured propertiesRheological, thermal,
mechanical and
morphological
Rheological, thermal,
mechanical and
morphological
Rheological, thermal,
mechanical and
morphological
Table 10. Melt flow index (MFI) values of the investigated biodegradable compounds measured under standard testing conditions.
Compoundg/10 min
F13.56 ± 0.10 c
F25.42 ± 0.10 a
F34.36 ± 0.28 b
Values are reported as mean ± standard deviation. Different lowercase letters indicate statistically significant differences among the formulations according to Tukey’s post hoc test (p < 0.05).
Table 11. Thermal parameters obtained from DSC analyses of the investigated biodegradable formulations (F1, F2, and F3).
First HeatingSecond HeatingCooling
Tm (°C)Xc (%)Tg(°C)Tm (°C)Xc (%)Tg(°C)Tc (°C)
F1132 (PBAT)7.37 ± 0.5−691225.65 ± 0.2−3667
152 (PLA)15.3 ± 0.57516211.7 ± 0.359117
F293 (PBSA)14.7 ± 0.3 878.8 ± 0.7−41.5245
150 (PLA)11.1 ± 0.5 1519.3 ± 0.463
F31196.25 ± 0.2−341264.33 ± 0.3−3477
Table 12. Tensile properties of the investigated biodegradable film formulations including maximum stress, elongation at break, elastic modulus and yielding stress. Values are reported as mean ± standard deviation.
NameMax Stress. MPaMax Strain. %Elastic Modulus. MPaYielding Stress. MPa
F122.7 ± 0.5 a454 ± 43 a206 ± 18 b7.2 ± 0.3 b
F222.1 ± 1.0 a26.5 ± 6.3 c643 ± 28 a16.5 ± 0.9 a
F38.3 ± 0.3 b233 ± 5 b145 ± 14 c5.0 ± 0.2 c
Different lowercase letters indicate statistically significant differences among the formulations according to Tukey’s post hoc test (p < 0.05).
Table 13. Comparison of the MD film parameters of F1, F2, and F3.
Max Stress, MPaMax Strain, %Elastic Modulus, MPaYielding Stress, MPa
F125.9 ± 3.4 b772 ± 114 a224 ± 12 b14.2 ± 0.8 b
F236.1 ± 3.5 a560 ± 45 b843 ± 38 a23.9 ± 1.3 a
F314.1 ± 2.6 c672 ± 61 ab105 ± 12 c8.4 ± 1.0 c
Values are reported as mean ± standard deviation. Different lowercase letters indicate statistically significant differences among the formulations according to Tukey’s post hoc test (p < 0.05).
Table 14. Comparison of the TD film parameters of F1, F2, and F3.
Max Stress, MPaMax Strain, %Elastic Modulus, MPaYielding Stress, MPa
F119.3 ± 1.5 a985 ± 116 a89 ± 3 c7.5 ± 0.3 b
F213.5 ± 2.7 b86.6 ± 12.5 c694 ± 104 a9.4 ± 2.3 a
F310.4 ± 0.9 c647 ± 307 b130 ± 14 b8.3 ± 0.6 ab
Values are reported as mean ± standard deviation. Different lowercase letters indicate statistically significant differences among the formulations according to Tukey’s post hoc test (p < 0.05).
Table 15. Maximum torque for formulation F1 containing different concentrations of chain-extending agent during melt processing at constant temperature.
FormulationChain-Extending
Agent (%)
Maximum Torque (Nm)
F1266.8 ± 0.7
F13.585.7 ± 0.8
F1586.3 ± 0.6
Table 16. Maximum torque for formulation F2 containing different concentrations of chain-extending agent during melt processing at constant temperature.
FormulationChain-Extending
Agent (%)
Maximum Torque (Nm)
F2242.1 ± 0.9
F23.554.5 ± 0.8
F2558 ± 0.7
Table 17. Maximum torque for formulation F3 containing different concentrations of chain extender agent during melt processing at constant temperature.
FormulationChain-Extending
Agent (%)
Maximum Torque (Nm)
F3291.5 ± 0.8
F33.595.2 ± 0.9
F3596.1 ± 0.7
Table 18. Density of foam for formulations F1, F2, and F3.
SampleValue (g/cm3)
F1 foam0.786 ± 0.02
F2 foam0.89 ± 0.03
F3 foam1.05 ± 0.04
Table 19. Quantitative morphological parameters of the foamed structures obtained by ImageJ image analysis.
ParameterUnitF1F2F3
Number of analyzed cells404040
Equivalent cell diameterµm4.00 ± 0.294.89± 0.196.35 ± 0.42
Median equivalent cell diameterµm1.952.975.05
Circularity0.826 ± 0.040.701 ± 0.050.563 ± 0.06
Average cell areaµm212.55 ± 1.818.74 ± 2.531.68 ± 4.2
Two-dimensional areal cell densitycells/mm25.0606.0947.756
Apparent porosity%6.35 ± 0.711.42 ± 1.124.57 ± 2.3
Table 20. Comparison of the physical and cellular morphology parameters of the developed biodegradable foams (F1–F3) and typical values reported for commercial expanded polystyrene (EPS).
ParameterF1F2F3Commercial EPS
Density (g/cm3)0.786 ± 0.020.89 ± 0.031.05 ± 0.040.010–0.020
Average cell area (µm2)12.55 ± 1.818.74 ± 2.531.68 ± 4.2
Equivalent cell diameter (µm)4.00 ± 0.294.89 ± 0.196.35 ± 0.4250–200
Porosity (%)6.35 ± 0.711.42 ± 1.124.57 ± 2.3>95
Circularity0.826 ± 0.040.701 ± 0.050.563 ± 0.06~0.9 (closed cells)
Predominant cell structurePredominantly regular cellsIntermediate/partially irregular cellsIrregular and partially collapsed cellsClosed, uniform
Table 21. Thermal analysis parameters of foam formulations F1, F2, and F3.
First HeatingSecond HeatingCooling
Tm (°C)Tm (°C)Tc (°C)
F1140 (PBAT)12555
151 (PLA)16573
F287 (PBS)8744
151 (PLA)151
F314012479
Disclaimer/Publisher’s Note: The statements, opinions and data contained in all publications are solely those of the individual author(s) and contributor(s) and not of MDPI and/or the editor(s). MDPI and/or the editor(s) disclaim responsibility for any injury to people or property resulting from any ideas, methods, instructions or products referred to in the content.