1. Introduction
Women’s participation in the labour market is widely recognised as a key driver of inclusive growth and sustainable development, contributing directly to Sustainable Development Goal (SDG) 5 (Gender Equality) and SDG 8 (Decent Work and Economic Growth). Fertility decisions play an important role in shaping women’s labour-market trajectories because childbearing influences the allocation of time, human capital accumulation, and employment opportunities over the life course. Understanding whether fertility constrains women’s employment remains particularly important in Sub-Saharan Africa, where demographic change is occurring alongside persistent labour-market inequalities.
From a theoretical perspective, Demographic Transition Theory views fertility declines as both a consequence and a catalyst of socioeconomic transformation. Notestein [
1] argues that fertility reduction accompanies modernisation, urbanisation, and changing family structures, whereas Bryant [
2] and Easterlin [
3] emphasise changing wealth flows, cohort dynamics, and expanding economic opportunities. Collectively, these perspectives suggest that declining fertility reallocates women’s time from childrearing to productive activities, thereby facilitating labour-market participation. Similarly, demographic dividend frameworks associate fertility declines with economic growth through favourable age structures and increased female labour supply. Consistent with these expectations, recent studies report that lower fertility is associated with improved labour-market access and reduced caregiving burdens [
4,
5]. Nevertheless, whether lower-fertility contexts necessarily experience weaker fertility-related employment penalties remains an open empirical question.
Evidence from Sub-Saharan Africa suggests that the relationship between fertility and women’s employment is more complex than demographic transition theory alone would predict. Although fertility has declined across much of the region, many women continue to be concentrated in informal and low-productivity employment [
6,
7]. Consequently, demographic change has not always translated into improved labour-market outcomes. Instead, structural factors—including labour-market segmentation, limited childcare support, and persistent caregiving responsibilities—continue to shape women’s economic opportunities [
8]. As a result, an important question remains: do fertility-related employment penalties differ across countries at different stages of demographic transition, or do they persist across distinct institutional contexts? Increasingly, the literature suggests that institutional conditions mediate the relationship between fertility and women’s economic outcomes rather than demographic change alone [
7,
9].
This perspective is reinforced by McDonald’s Gender-System Theory [
10], which distinguishes between gender equity in education and labour-market institutions and persistent inequities within family institutions responsible for caregiving. Where these institutional spheres remain misaligned, fertility decline may coexist with continued disadvantages in women’s employment. However, because gender norms, caregiving arrangements, and intra-household bargaining are not directly observed in this study, Gender-System Theory is used as an interpretive framework rather than as a mechanism that is empirically tested.
Against this background, Kenya and South Africa provide a valuable comparative setting. Kenya represents a relatively higher-fertility economy characterised by widespread labour-market informality, whereas South Africa combines lower fertility with a more formalised, although highly unequal, labour market. This contrast enables an assessment of whether fertility-related employment penalties vary across distinct demographic and institutional contexts. Furthermore, fertility effects may differ across the life course, as early childbearing, higher parity, and lower educational attainment can intensify employment constraints and generate cumulative disadvantage.
Despite extensive evidence documenting a negative association between fertility and women’s employment, several important gaps remain. First, existing studies are predominantly based on single-country analyses, limiting understanding of whether fertility-related employment penalties differ across demographic-transition settings. Second, many rely on conventional regression models that are vulnerable to endogeneity arising from omitted variables, reverse causality, and self-selection into fertility. Third, comparatively little evidence examines how fertility penalties vary across life-course characteristics such as parity, educational attainment, and age at first birth. By comparing Kenya and South Africa using a common instrumental-variable framework, this study extends the literature by providing comparative causal evidence on fertility-related employment penalties across two countries at different stages of demographic transition.
To address these gaps, the study estimates the causal effect of fertility on women’s paid employment participation using exogenous variation generated by twin births [
11]. Because the sex-composition instrument exhibits relatively weak first-stage performance, it is employed primarily as a supplementary robustness check rather than as the primary source of identification. In addition, a Principal Component Analysis (PCA)-based Economic Independence Index is constructed as an alternative outcome measure to assess whether fertility influences broader dimensions of economic autonomy beyond employment participation alone. Collectively, these analyses contribute to ongoing debates on demographic transition, women’s employment, and sustainable development by examining whether fertility-related employment penalties persist across different demographic contexts. The remainder of the paper presents the empirical strategy, data, results, and their implications for policy and future research.
2. Background
2.1. Fertility Transition and Women’s Economic Roles
Sub-Saharan Africa has experienced a sustained decline in fertility, with total fertility rates falling from more than six births per woman in the 1980s to approximately 4.3 births in recent years [
12,
13]. Within the region, Kenya has reached approximately 3.4 births per woman, whereas South Africa has stabilised near replacement level at about 2.3 births [
14,
15]. These demographic shifts have occurred alongside rising educational attainment, urbanisation, and structural changes in labour markets. From a demographic transition perspective, declining fertility is expected to reduce dependency burdens and caregiving demands, thereby expanding women’s opportunities for labour-market participation and economic advancement.
Nevertheless, demographic change has not always translated into improved employment outcomes. Despite declining fertility, women across Sub-Saharan Africa remain disproportionately concentrated in informal and low-productivity employment [
6]. Moreover, institutional quality, labour-market segmentation, and unequal caregiving responsibilities continue to constrain women’s economic opportunities [
7,
8]. Consequently, the relationship between fertility and women’s employment appears to depend not only on demographic change but also on the institutional environment within which fertility decisions are made. This observation motivates closer examination of the mechanisms linking fertility to women’s labour-market outcomes.
2.2. Fertility and Labour Supply: Micro-Level Evidence
At the microeconomic level, fertility is widely regarded as a determinant of women’s labour supply because childbearing increases caregiving responsibilities and may interrupt human capital accumulation and employment continuity [
16]. To overcome the endogeneity of fertility, several studies have employed quasi-experimental designs based on twin births and the sex composition of the first two children. These studies consistently show that exogenous increases in fertility reduce women’s labour-market participation [
11,
17], although the magnitude of these effects varies across institutional and labour-market settings.
Although this evidence establishes a negative relationship between fertility and employment, several limitations remain. First, most existing studies examine individual countries, limiting understanding of how fertility-related employment penalties vary across demographic contexts. Second, conventional regression approaches remain vulnerable to omitted-variable bias, reverse causality, and self-selection into fertility. Third, comparatively little attention has been given to heterogeneity across women’s life-course trajectories, including parity, educational attainment, and age at first birth. These limitations highlight the need for comparative analyses using credible causal identification strategies.
2.3. Institutional Mediation and Gender Systems
Beyond demographic processes, institutional conditions influence how fertility affects women’s employment. Gender-System Theory [
10] argues that women’s economic outcomes depend on the alignment between equity in labour-market institutions and equity within family institutions responsible for caregiving. Where caregiving responsibilities remain disproportionately borne by women, fertility may continue to constrain employment even in lower-fertility settings.
Accordingly, fertility-related employment penalties may persist despite demographic transition if institutional support for combining work and family responsibilities remains limited. Existing studies similarly demonstrate that labour-market institutions, social norms, and caregiving arrangements shape women’s economic opportunities [
8,
18]. However, the mechanisms proposed by Gender-System Theory, including gender norms, intra-household bargaining, and caregiving arrangements, are not directly observed in this study. Consequently, the theory is used primarily to interpret the empirical findings rather than to test specific behavioural mechanisms.
2.4. Comparative Context and Research Gap
The comparison between Kenya and South Africa provides a useful opportunity to examine fertility-related employment penalties across contrasting demographic contexts. Kenya is characterised by relatively higher fertility and widespread labour-market informality, whereas South Africa combines lower fertility with a more formalised, although highly unequal, labour market. Rather than assuming that lower fertility necessarily improves women’s employment outcomes, this study examines whether fertility-related employment penalties differ across these two settings.
Despite growing interest in fertility and women’s employment, three important gaps remain. First, causal evidence from Sub-Saharan Africa remains limited. Second, little evidence exists on whether fertility-related employment penalties differ across demographic-transition contexts. Third, few studies jointly examine cross-country differences and life-course heterogeneity using a common identification strategy. These gaps are particularly relevant to SDG 5 (Gender Equality) and SDG 8 (Decent Work and Economic Growth) because they concern the extent to which demographic change translates into improved labour-market opportunities for women. Addressing these issues therefore contributes to both demographic scholarship and sustainable development policy.
2.5. Contribution of the Study
This study advances the literature in four respects. First, it provides a comparative analysis of fertility-related employment penalties in Kenya and South Africa, representing different stages of demographic transition. Second, it strengthens causal inference by employing an instrumental-variable strategy based primarily on twin births. Third, it examines heterogeneity in fertility effects across parity, educational attainment, and age at first birth. Fourth, it contributes to demographic-transition debates by evaluating whether fertility-related employment penalties persist across distinct demographic and institutional contexts.
The analysis focuses primarily on women’s paid employment participation while employing a Principal Component Analysis (PCA)-based Economic Independence Index as a robustness measure of broader economic autonomy. Consequently, the study provides evidence relevant to SDG 5 and SDG 8 by examining how fertility influences women’s labour-market participation and economic inclusion. Drawing on these contributions, the following section develops the conceptual framework underpinning the empirical analysis.
2.6. Conceptual Framework
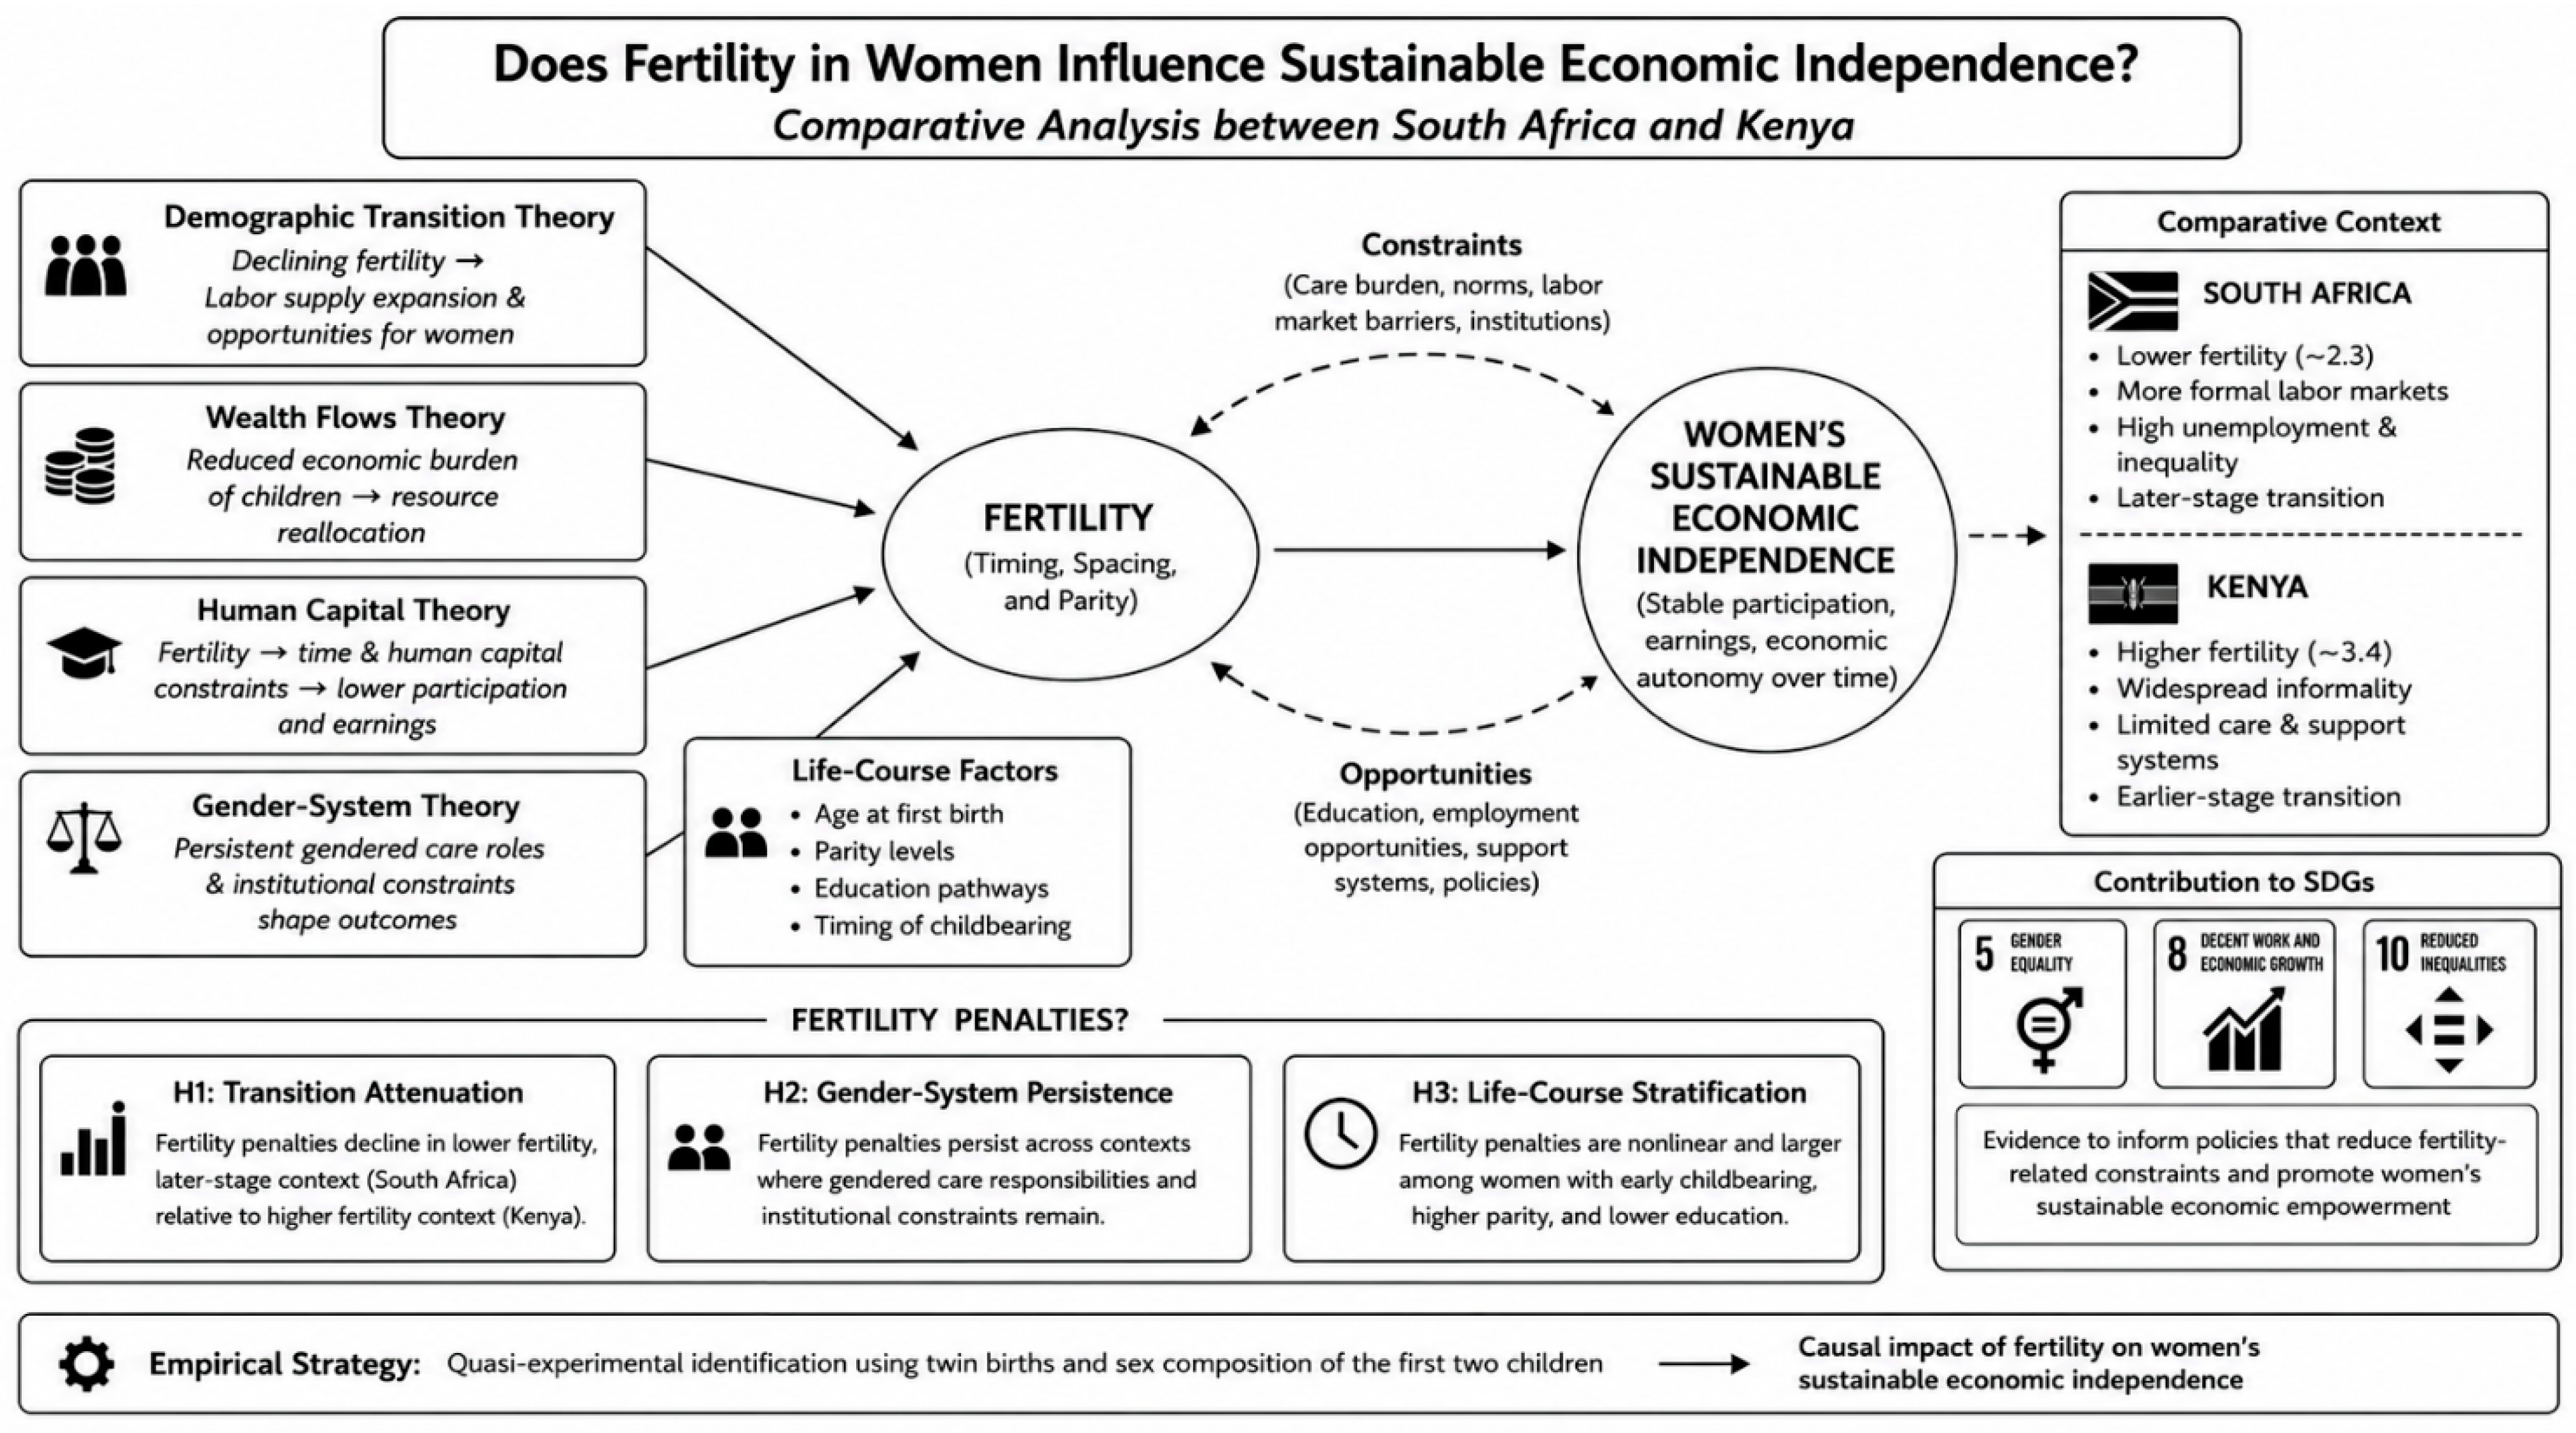
Figure 1 presents the conceptual framework guiding the study. Fertility is conceptualised as the central explanatory variable influencing women’s employment outcomes and broader economic autonomy through multiple pathways. Higher fertility may increase caregiving responsibilities and reduce labour-market participation, whereas lower fertility may ease time constraints and facilitate economic engagement. Accordingly, the relationship between fertility and women’s employment is viewed as institutionally contingent rather than deterministic.
Figure 1 serves primarily as a theoretical framework illustrating potential pathways through which fertility may influence women’s economic outcomes and does not imply that all mechanisms are empirically tested in the present study. The framework integrates insights from Demographic Transition Theory, Wealth Flows Theory, Human Capital Theory, and Gender-System Theory while emphasising the potential moderating roles of age at first birth, parity, and educational attainment.
Finally, the comparative framework positions Kenya and South Africa as contrasting demographic contexts in which the persistence of fertility-related employment penalties can be examined empirically. To identify causal effects, the study exploits exogenous variation in fertility generated by twin births and, as a supplementary robustness check, the sex composition of the first two children. The next section describes the data, variable measurement, and empirical strategy used to estimate these relationships.
3. Methodology
3.1. Data and Sample
This study uses nationally representative Demographic and Health Survey (DHS) data from Kenya [
14] and South Africa [
15] to examine the relationship between fertility and women’s employment outcomes. These countries represent different stages of demographic transition and labour-market development, providing an appropriate setting for assessing whether fertility-related employment penalties vary across institutional contexts. The analysis also contributes to SDG 5 (Gender Equality) and SDG 8 (Decent Work and Economic Growth) by examining how fertility shapes women’s labour-market participation and broader economic autonomy.
The DHS employs a stratified two-stage cluster sampling design and provides harmonised information on fertility, education, household welfare, and employment, thereby facilitating cross-country comparisons [
19,
20]. To approximate completed fertility and minimise simultaneity between fertility and employment outcomes, the analysis is restricted to women aged 25–49 years [
6,
21]. For the instrumental-variable (IV) analysis, the sample is further limited to women with at least one live birth because identification relies on exogenous fertility variation generated by twin births and the sex composition of the first two children [
11]. Sampling weights are applied throughout to ensure national representativeness, while standard errors are clustered at the primary sampling unit (PSU) level to account for intra-cluster correlation [
22]. Having defined the analytical sample, the next section describes the measurement of the study variables.
3.2. Measurement of Outcome and Key Variables
The primary outcome variable is women’s paid employment participation, measured as a binary indicator equal to one if the respondent was engaged in paid work at the time of the survey and zero otherwise. Paid employment is widely used in fertility–labour market research because it reflects labour-market attachment and economic inclusion [
6,
11]. Although employment represents an important dimension of economic autonomy, it does not fully capture women’s broader economic independence. To address this limitation, the robustness analysis employs two additional outcomes: participation in income-generating activities and a Principal Component Analysis (PCA)-based Economic Independence Index, which combines paid employment status, occupation type, and control over earnings into a composite measure of economic autonomy. The construction of this index is presented in
Section 3.3 and
Appendix A Table A1.
The main explanatory variable is completed fertility, measured as the total number of children ever born. Additional fertility indicators include parity and age at first birth to capture life-course heterogeneity. Consistent with previous demographic research, the analysis controls for age, age squared, educational attainment, marital status, household wealth, urban residence, region fixed effects, birth-cohort fixed effects, and a country fixed effect [
6,
23]. Because fertility is potentially endogenous to women’s employment outcomes, causal identification is achieved using an instrumental-variable strategy described below. Detailed variable definitions are presented in
Table 1.
3.3. Construction of the Economic Independence Index
While paid employment participation is the primary outcome, employment alone may not fully reflect women’s economic autonomy. Women may participate in the labour market yet remain economically constrained because of low-quality employment, limited control over earnings, or restricted decision-making authority. Accordingly, the study constructs a multidimensional Economic Independence Index using Principal Component Analysis (PCA) [
24,
25].
The index combines three indicators: paid employment participation, occupation type, and control over earnings. All variables are standardised before estimation, after which PCA is applied to extract the first principal component. This component satisfies the Kaiser criterion (eigenvalue > 1) and explains 62.3% of the total variance. The resulting component scores are subsequently standardised so that higher values indicate greater economic independence. The suitability of the data for PCA is confirmed using the Kaiser–Meyer–Olkin (KMO) statistic and Bartlett’s test of sphericity.
The PCA results indicate a coherent underlying dimension of women’s economic independence, with all five indicators exhibiting substantial positive factor loadings ranging from 0.655 to 0.782. The first component has an eigenvalue of 2.586 and explains 51.72% of the total variance. Moreover, the KMO statistic of 0.781 indicates satisfactory sampling adequacy, while Bartlett’s test of sphericity is statistically significant (χ
2 = 624.37, df = 10,
p < 0.001), confirming that the correlation matrix is suitable for PCA. The corresponding factor loadings, eigenvalue, variance explained, KMO statistic, and Bartlett’s test are reported in
Appendix A Table A1. The PCA-derived index is used exclusively as a robustness outcome to assess whether fertility is associated with broader dimensions of women’s economic autonomy beyond paid employment participation.
3.4. Empirical Specification
Having defined the study variables, the next step is to estimate the relationship between fertility and women’s employment outcomes. Because fertility decisions may be influenced by unobserved characteristics that also affect employment, the empirical strategy combines conventional regression with instrumental-variable estimation to address potential endogeneity. The first-stage fertility equation is specified as
where
Instrument represents either twin births or the sex composition of the first two children, and
X denotes the vector of control variables. These controls include age, age squared, educational attainment, marital status, household wealth, urban residence, region fixed effects, birth-cohort fixed effects, and a country fixed effect. Including these variables reduces omitted-variable bias by accounting for observable characteristics associated with both fertility behaviour and women’s employment outcomes [
11,
17]. The primary parameter of interest is the causal effect of completed fertility on women’s paid employment participation after isolating exogenous variation in fertility through the instrumental variables.
3.5. Identification Strategy
A key empirical challenge is that fertility is potentially endogenous. Women who differ in preferences, education, career aspirations, household characteristics, or labour-market opportunities may also differ systematically in fertility behaviour. Consequently, ordinary least squares (OLS) estimates may suffer from reverse causality and omitted-variable bias. To overcome this challenge, the study employs an instrumental-variable (IV) strategy using twin births as the primary instrument and the sex composition of the first two children as a supplementary robustness instrument.
3.5.1. Twin-Birth Instrument
Following Angrist and Evans [
11] and Rosenzweig and Wolpin [
17], the primary instrument is an indicator for a twin birth at parity two. Twin births generate an unexpected increase in family size that is largely unrelated to women’s pre-existing labour-market intentions, thereby providing exogenous variation in fertility.
The first-stage specification is
where Twin equals one if the respondent experienced a twin birth and zero otherwise. The vector
X contains the demographic and socioeconomic controls described above. The corresponding second-stage equation is
where predicted fertility replaces observed fertility. Consequently, the coefficient
identifies the causal effect of an additional child on women’s employment outcomes, conditional on the identifying assumptions.
The validity of the twin-birth instrument depends on the exclusion restriction that twin births influence employment only through their effect on fertility. However, twin births may also increase childcare demands, maternal health risks, and household expenditures, potentially affecting employment independently of fertility. Because these alternative pathways cannot be ruled out empirically, the exclusion restriction is regarded as plausible rather than directly testable. Accordingly, the findings should be interpreted with appropriate caution.
3.5.2. Sex-Composition Instrument
To assess the robustness of the results, fertility is alternatively instrumented using an indicator denoting whether the first two children are of the same sex. This approach exploits parental preferences for mixed-sex families, whereby parents with two children of the same sex are more likely to have another child [
11]. The first-stage equation is
Although the instrument exhibits a positive relationship with fertility in both countries, its first-stage association is substantially weaker than that of twin births. Given the relatively low first-stage F-statistic, the sex-composition instrument is interpreted cautiously and employed primarily as a supplementary robustness check rather than as the principal identification strategy.
3.5.3. Overidentified Instrumental-Variable Specification
To further evaluate the robustness of the findings, both instruments are estimated jointly in an overidentified specification. This approach enables formal assessment of instrument validity through the Hansen J test of overidentifying restrictions, while consistency of the estimated fertility coefficients across alternative specifications provides additional reassurance that the findings are not driven by a single identification strategy [
25,
26,
27].
3.5.4. Instrument Diagnostics
Consistent with current best practice in instrumental-variable estimation, the study reports first-stage coefficients, first-stage F-statistics, partial , Kleibergen–Paap rk Wald F-statistics, Stock–Yogo critical values, and Hansen J statistics. These diagnostics indicate that the twin-birth instrument is strong and provides the primary source of causal identification, whereas the sex-composition instrument should be interpreted as supplementary evidence because of its comparatively weaker first-stage performance.
3.6. Heterogeneity and Cross-Country Tests
Having established the baseline causal relationship, the analysis next examines whether fertility effects vary across demographic contexts and women’s life-course characteristics. Cross-country interaction models evaluate whether fertility-related employment penalties differ between Kenya and South Africa, while stratified analyses by parity, educational attainment, and age at first birth assess heterogeneity across women’s life trajectories [
28,
29].
Because instrumental-variable estimates identify Local Average Treatment Effects (LATEs), the estimated coefficients capture the causal effect of fertility among women whose fertility decisions are influenced by the instruments rather than the average effect for all women. Consequently, the subgroup analyses should be interpreted as context-specific causal effects rather than universally applicable relationships.
These analyses provide additional insight into the persistence and distribution of fertility-related employment penalties across demographic contexts, with direct relevance to SDG 5 (Gender Equality) and SDG 8 (Decent Work and Economic Growth). The next section presents the empirical findings.
3.7. Sample Selection and Analytical Sample Construction
Table 2 summarises the construction of the analytical sample. The study begins with 39,593 women interviewed in the Kenya and South Africa Demographic and Health Surveys. Restricting the sample to women with complete fertility histories, valid employment information, and complete covariate data yields 23,158 observations for the baseline OLS analysis. Applying the additional requirements for instrumental-variable estimation, including construction of the twin-birth and sex-composition instruments, results in a final analytical sample of 13,818 women.
Reporting the sample selection process enhances transparency, clarifies differences in estimation samples across descriptive, OLS, IV, and robustness analyses, and allows readers to assess the representativeness of the empirical evidence. Having established the analytical sample and estimation strategy, the following section presents the descriptive statistics and subsequent econometric results.
4. Results
To evaluate whether fertility-related employment penalties differ across demographic contexts, the empirical results are presented in four stages. First, descriptive statistics and pairwise correlations summarise the characteristics of the study sample. Second, first-stage estimates assess the relevance and strength of the instrumental variables. Third, baseline OLS and instrumental-variable (IV) models estimate the relationship between fertility and women’s paid employment participation [
30]. Finally, heterogeneity and robustness analyses examine whether the findings remain consistent across alternative specifications and outcome measures.
4.1. Descriptive Patterns
Table 3 summarises the demographic and socioeconomic characteristics of women aged 25–49 years in Kenya and South Africa. The two countries exhibit marked differences in fertility, educational attainment, urbanisation, and labour-market participation. Women in Kenya have higher completed fertility, earlier childbearing, and lower levels of education and urban residence than their counterparts in South Africa. Conversely, women in South Africa display lower fertility, higher educational attainment, greater urban residence, and higher participation in paid employment.
These descriptive patterns are broadly consistent with the countries’ different stages of demographic transition and suggest that lower fertility coexists with more favourable labour-market outcomes. However, because descriptive statistics do not account for observable or unobservable differences across women, they cannot establish whether fertility itself causes lower employment participation. Accordingly, the subsequent analyses employ multivariate and instrumental-variable methods to identify the causal relationship between fertility and women’s employment outcomes.
4.2. Correlation Analysis
Table 4 reports the pairwise correlations among the principal study variables. Consistent with the study hypotheses, fertility is negatively associated with women’s paid employment participation and the broader Economic Independence Index, while education, household wealth, urban residence, and age at first birth are positively associated with employment outcomes. Fertility is also negatively correlated with education, wealth, and age at first birth, indicating that women with higher fertility generally possess fewer socioeconomic advantages associated with labour-market participation.
Importantly, none of the pairwise correlation coefficients approach conventional thresholds for multicollinearity. The absence of high correlations among the explanatory variables suggests that multicollinearity is unlikely to bias the subsequent regression estimates. Nevertheless, correlation analysis cannot distinguish causal effects from associations because fertility decisions may be jointly determined with women’s employment outcomes. The next section therefore evaluates the suitability of the instrumental variables used to address this endogeneity concern.
4.3. Instrument Relevance and First-Stage Results
Before estimating the causal effect of fertility, it is necessary to establish that the instrumental variables are sufficiently correlated with fertility.
Table 5 presents the first-stage estimates for the twin-birth and sex-composition instruments separately for Kenya, South Africa, and the pooled sample.
The results indicate that twin births exhibit a strong and statistically significant positive relationship with completed fertility across all specifications. Both the first-stage F-statistics and the Kleibergen–Paap rk Wald statistics substantially exceed conventional thresholds, confirming that the twin-birth instrument satisfies accepted criteria for instrument relevance and strength. The corresponding partial values further indicate that the instrument explains meaningful variation in fertility after controlling for observable characteristics.
By contrast, the sex-composition instrument displays a weaker first-stage relationship with fertility. Although the pooled specification remains statistically significant, the instrument performs less consistently across countries, with particularly weak evidence in South Africa. Given its comparatively lower first-stage statistics, the sex-composition instrument is interpreted cautiously and employed primarily as a supplementary robustness check rather than as the principal identification strategy.
Consequently, the first-stage diagnostics provide strong support for using twin births as the primary source of exogenous variation in fertility, while the sex-composition instrument serves to assess the robustness of the main findings. Having established instrument relevance, the analysis proceeds to estimate the relationship between fertility and women’s employment outcomes.
4.4. Baseline Conditional Associations
Table 6 presents the baseline OLS estimates of the association between completed fertility and women’s paid employment participation. Across Kenya, South Africa, and the pooled sample, fertility is consistently and negatively associated with paid employment participation. The estimated coefficients indicate that women with more children are significantly less likely to participate in paid employment after controlling for demographic and socioeconomic characteristics.
The remaining covariates exhibit the expected relationships with employment outcomes. Educational attainment, household wealth, and urban residence are positively associated with paid employment participation, whereas marriage is negatively associated with employment across most specifications. The inclusion of region, birth-cohort, and country fixed effects further reduces the possibility that the estimated relationships are driven by unobserved geographical or cohort-specific factors.
Although these findings provide important evidence of a negative association between fertility and employment, they should not be interpreted as causal. Fertility decisions may be influenced by unobserved characteristics, including career preferences, household circumstances, or labour-market opportunities, which are not fully captured by conventional regression models. Consequently, the OLS estimates may understate or overstate the true economic consequences of fertility. The following section therefore presents the instrumental-variable estimates, which exploit exogenous variation in fertility to identify its causal effect on women’s paid employment participation.
4.5. H1: Transition Attenuation
Having established the relevance of the instrumental variables, the next step estimates the causal effect of fertility on women’s paid employment participation.
Table 7 reports the instrumental-variable estimates based primarily on the twin-birth instrument.
Across all specifications, fertility exerts a negative and statistically significant effect on women’s paid employment participation. The estimated effects are consistently larger than those obtained from the OLS models, indicating that conventional regression estimates understate the employment consequences of childbearing. This difference is consistent with the presence of endogeneity arising from omitted variables, reverse causality, or measurement error, thereby reinforcing the value of the instrumental-variable approach. The estimated coefficients remain stable across alternative model specifications, suggesting that the negative relationship between fertility and employment is robust to the inclusion of demographic, socioeconomic, and regional controls. Similarly, the control variables generally exhibit the expected signs, with educational attainment, household wealth, and urban residence positively associated with employment participation. Therefore, the results provide strong empirical support for the first hypothesis that higher fertility reduces women’s paid employment participation. Having established this baseline relationship, the analysis next examines whether the magnitude of the fertility penalty differs across demographic contexts.
4.6. H2: Cross-Country Heterogeneity in Fertility Penalties
To determine whether fertility-related employment penalties differ across countries at different stages of demographic transition, an interaction model is estimated for the pooled sample.
Table 8 presents the results.
The instrumented fertility coefficient remains negative and statistically significant, confirming that higher fertility reduces women’s paid employment participation after accounting for endogeneity. Although the country indicator shows that average employment participation differs between Kenya and South Africa, the interaction between fertility and the Kenya indicator is statistically insignificant.
This finding indicates that the magnitude of the fertility-related employment penalty does not differ significantly between the two countries. Consequently, the results provide little empirical support for the proposition that lower-fertility contexts necessarily experience weaker employment penalties associated with childbearing. Instead, the evidence suggests that fertility-related employment disadvantages persist across both demographic settings despite their different fertility levels and labour-market structures. To further examine the robustness of this conclusion, the analysis next estimates an overidentified model that combines both instrumental variables.
4.7. H2: Gender-System Persistence
Table 9 reports the estimates obtained using the combined twin-birth and sex-composition instruments. The purpose of this specification is to assess whether the principal findings remain stable under an alternative identification strategy while permitting formal tests of instrument validity.
The estimated fertility coefficient remains negative and statistically significant, closely resembling the baseline twin-IV estimates. This consistency indicates that the principal findings are not driven by reliance on a single instrument. The overidentification diagnostics further strengthen confidence in the empirical strategy. The Hansen J statistic fails to reject the null hypothesis of instrument validity, suggesting that the combined instruments satisfy the overidentifying restrictions. Likewise, the joint first-stage statistics indicate that the instruments remain sufficiently correlated with fertility in the combined specification. Taken together, these results reinforce the conclusion that fertility exerts a robust negative effect on women’s employment participation irrespective of the identification strategy employed. Having established the persistence of fertility-related employment penalties across countries, the next section investigates whether these penalties vary across women’s life-course characteristics.
4.8. H3: Life-Course Stratification
The final hypothesis examines whether fertility-related employment penalties differ across women’s life-course trajectories. To address this question, separate analyses are conducted by parity, educational attainment, and age at first birth.
4.8.1. Heterogeneity by Parity
Table 10 reports the parity-specific estimates.
The results indicate that fertility-related employment penalties become progressively larger as family size increases. Women transitioning from three to four or more children experience substantially greater employment losses than those moving from two to three children. This pattern suggests that the opportunity costs associated with childbearing accumulate over the life course, with larger families imposing progressively greater constraints on women’s labour-market participation.
4.8.2. Heterogeneity by Educational Attainment
Table 11 presents the estimates stratified by educational attainment.
A clear educational gradient emerges. Fertility-related employment penalties are largest among women with primary education or less, smaller among women with secondary education, and statistically insignificant among women with tertiary education. These findings indicate that higher educational attainment moderates the adverse employment consequences of fertility, suggesting that education provides greater access to stable employment opportunities and increases women’s ability to remain attached to the labour market following childbirth.
4.9. Robustness Checks
To evaluate the robustness of the main findings, two additional analyses are undertaken. First, the dependent variable is expanded beyond paid employment participation to include alternative measures of women’s economic autonomy. Second, additional diagnostic tests are performed to assess instrument strength and validity.
4.9.1. Alternative Outcome Measures
Table 12 presents the estimates using participation in income-generating activities and the PCA-based Economic Independence Index as alternative outcome variables.
Across all specifications, fertility remains negatively associated with women’s economic outcomes. The consistency of the estimated coefficients across alternative dependent variables indicates that fertility-related disadvantages extend beyond paid employment participation to broader dimensions of economic autonomy. Details of the construction and diagnostic properties of the PCA-based Economic Independence Index are provided in
Appendix A Table A1.
4.9.2. Alternative Instrument: Sex Composition
Finally,
Table 13 summarises the diagnostic statistics for the instrumental-variable estimations.
The diagnostic results confirm that the twin-birth instrument satisfies conventional criteria for instrument relevance and strength, whereas the sex-composition instrument exhibits comparatively weaker first-stage performance. Accordingly, the twin-birth instrument constitutes the primary basis for causal identification, while the sex-composition instrument provides supplementary evidence supporting the robustness of the results. The Hansen J statistics further fail to reject the null hypothesis of instrument validity in the overidentified models, providing additional support for the empirical specification. The Durbin and Wu–Hausman endogeneity tests likewise reject the null hypothesis that fertility is exogenous, thereby supporting the use of instrumental-variable estimation. Detailed endogeneity test results are presented in
Appendix A Table A2. Collectively, these diagnostic tests strengthen confidence that the reported fertility effects are not driven by weak instruments or violations of the overidentifying restrictions.
4.9.3. Robustness of IV Estimates: Combined Twin-Birth and Sex-Composition Instruments
Table 14 presents the overidentified specification combining the twin-birth and sex-composition instruments.
The estimated fertility coefficient remains negative and statistically significant, closely matching the baseline twin-IV estimates, thereby reinforcing the robustness of the main findings. The Hansen J statistic fails to reject the null hypothesis of valid overidentifying restrictions, while the joint first-stage and Kleibergen–Paap statistics indicate that the combined instruments satisfy conventional relevance criteria. In addition, the significant Wu–Hausman test confirms the endogeneity of fertility and supports the use of instrumental-variable estimation. Overall, the combined specification strengthens confidence that the estimated fertility effects are not driven by a single instrument.
4.9.4. Instrument Strength and Weak-Instrument Diagnostics
The diagnostic results confirm that the twin-birth instrument provides the primary source of identification, consistent with recommended practices for assessing instrument strength in instrumental-variable estimation [
2,
31]. Although the sex-composition instrument exhibits comparatively weaker first-stage performance, it is retained as a supplementary robustness check rather than as the principal basis for causal inference, following the conventional first-stage threshold proposed by [
32]. Furthermore, the Hansen J test provides evidence consistent with valid overidentifying restrictions, supporting the joint validity of the instruments [
33]. Detailed first-stage coefficients, first-stage F-statistics, partial
, Kleibergen–Paap statistics, Stock–Yogo critical values, and Hansen J statistics are reported in
Appendix A Table A3. Generally, the robustness analyses indicate that the principal findings remain consistent across alternative outcome measures and identification strategies. The following section discusses these findings in relation to demographic theory and previous empirical evidence.
5. Discussion
This study examined whether fertility-related employment penalties differ across countries at different stages of demographic transition and whether these penalties persist across contrasting demographic and labour-market contexts. Using quasi-experimental variation generated by twin births and, as a supplementary robustness check, the sex composition of the first two children, the findings consistently show that higher fertility reduces women’s paid employment participation and broader measures of economic autonomy in both Kenya and South Africa. Taken together, these results suggest that fertility-related employment penalties remain substantial despite differences in fertility levels and labour-market structures, with important implications for SDG 5 (Gender Equality) and SDG 8 (Decent Work and Economic Growth).
From a demographic-transition perspective, the contrasting demographic profiles of Kenya and South Africa might be expected to generate different employment consequences of childbearing. Classical Demographic Transition Theory argues that fertility decline reallocates household resources and facilitates women’s participation in productive activities through structural transformation [
1]. Similarly, Wealth Flows Theory suggests that declining fertility reduces dependency burdens and increases opportunities for productive investment [
34]. However, the cross-country interaction model reveals no statistically significant difference in fertility-related employment penalties between Kenya and South Africa. Rather than confirming that lower fertility necessarily improves women’s labour-market outcomes, the findings indicate that fertility decline alone does not automatically weaken the employment consequences of childbearing. This interpretation is consistent with recent evidence showing that demographic transition does not necessarily eliminate labour-market inequalities where institutional support for working mothers remains limited [
8,
28].
Beyond the cross-country comparison, both the OLS and IV estimates demonstrate a robust negative relationship between fertility and women’s paid employment participation. Importantly, the IV estimates are substantially larger than the corresponding OLS estimates, indicating that conventional regression models may underestimate the economic costs of childbearing. While the OLS models suggest that an additional child reduces paid employment participation by approximately 3–4 percentage points, the IV estimates indicate reductions of about 6–7 percentage points. This divergence is consistent with endogeneity arising from measurement error, omitted-variable bias, or selection into fertility, all of which may attenuate conventional estimates. By exploiting exogenous fertility variation, the IV strategy provides more credible evidence of the causal effect of fertility on women’s employment. These findings are also consistent with Human Capital Theory, which argues that childbearing interrupts labour-force attachment, reduces work experience accumulation, and lowers long-term employment prospects [
16]. Similar patterns have been reported in contexts where childcare provision and flexible employment opportunities remain limited [
7].
Nevertheless, the IV estimates should be interpreted as Local Average Treatment Effects (LATEs), representing the effect of fertility among women whose fertility decisions are influenced by the instruments rather than the average effect for all women [
35]. Consequently, although the results strengthen causal inference, they should not be interpreted as universal fertility effects applicable to the entire population.
The findings are broadly consistent with Gender-System Theory, although they do not constitute a direct test of the theory. McDonald [
10] argues that fertility decline may coexist with persistent gender inequalities when improvements in labour-market opportunities are not accompanied by comparable changes in family institutions and caregiving responsibilities. The persistence of fertility-related employment penalties across both countries is compatible with this perspective. However, because the DHS data do not directly measure gender norms, caregiving arrangements, intra-household bargaining, or the distribution of unpaid care work, the evidence should be interpreted as indirect rather than definitive support for Gender-System Theory. This interpretation accords with recent evidence highlighting the continued importance of labour-market segmentation, unequal care burdens, and institutional constraints in shaping women’s economic opportunities across Sub-Saharan Africa [
8].
The heterogeneity analysis provides additional insight into how fertility-related employment penalties are distributed across women’s life courses. First, the parity-specific estimates show that employment penalties increase with family size, with the transition from three to four or more children generating substantially larger effects than the transition from two to three children. This finding suggests that the opportunity costs of childbearing accumulate as caregiving responsibilities expand. Second, fertility penalties are strongest among women with primary education or less, smaller among those with secondary education, and statistically insignificant among tertiary-educated women. These results suggest that education moderates the employment consequences of fertility by improving access to formal employment, increasing job flexibility, and strengthening women’s capacity to remain attached to the labour market.
The robustness analyses further reinforce the consistency of the findings. Fertility remains negatively associated with women’s economic outcomes when the dependent variable is expanded from paid employment participation to the PCA-based Economic Independence Index. The similarity of the estimated effects across alternative outcome measures indicates that fertility-related employment penalties extend beyond labour-market participation to broader dimensions of economic autonomy. Nevertheless, paid employment participation remains the primary observable outcome, and the study does not claim to measure the full spectrum of women’s empowerment or economic independence.
Collectively, these findings contribute to ongoing debates on demographic transition and women’s economic outcomes. Rather than demonstrating that fertility decline necessarily enhances women’s empowerment, the results indicate that fertility-related employment penalties persist across countries at different stages of demographic transition. This suggests that demographic change alone is unlikely to eliminate the employment disadvantages associated with childbearing. Instead, the findings point to the importance of institutional conditions, including labour-market opportunities, educational attainment, childcare support, and broader social structures, in shaping women’s employment outcomes.
Several limitations should nevertheless be acknowledged. First, although twin births are widely accepted as an instrumental variable in the fertility literature, the exclusion restriction cannot be verified directly. Twin births may influence women’s employment through pathways other than fertility, including increased childcare intensity, maternal health challenges, or household financial pressures. Accordingly, the exclusion restriction should be regarded as plausible rather than certain. Second, the weak first-stage relationship observed for the sex-composition instrument indicates that it should be interpreted primarily as a supplementary robustness check rather than a principal source of identification. Third, because the IV estimates identify Local Average Treatment Effects, they may not generalise to women whose fertility decisions are unaffected by the instruments. Fourth, the DHS lacks direct measures of earnings quality, childcare arrangements, gender norms, and intra-household bargaining, limiting examination of the mechanisms underlying the estimated relationships. Finally, the cross-sectional design precludes analysis of long-term employment trajectories and dynamic fertility responses.
Generally, the findings demonstrate that fertility imposes significant employment penalties across both Kenya and South Africa, regardless of their different stages of demographic transition. Rather than indicating that lower fertility alone improves women’s labour-market outcomes, the results suggest that fertility-related employment penalties remain closely linked to educational opportunities, labour-market institutions, and caregiving responsibilities. Accordingly, progress towards SDG 5 and SDG 8 is likely to depend not only on demographic change but also on policies that enable women to reconcile childbearing with sustained labour-market participation. The next section therefore discusses the policy implications arising from these findings.
6. Policy Implications
The findings have important implications for SDG 5 (Gender Equality) and SDG 8 (Decent Work and Economic Growth) because they demonstrate that fertility is associated with lower women’s paid employment participation and broader economic autonomy in both Kenya and South Africa. Rather than indicating that fertility decline alone improves women’s economic outcomes, the results suggest that reducing the labour-market constraints associated with childbearing may help mitigate fertility-related employment penalties. Accordingly, policies should focus on creating institutional conditions that enable women to reconcile caregiving responsibilities with sustained labour-market participation.
First, the persistence of fertility-related employment penalties highlights the importance of reducing childcare constraints. Affordable childcare and early childhood development (ECD) services may enable women to remain attached to the labour market by lowering the opportunity costs of childbearing. Previous studies have shown that accessible childcare supports women’s employment in both developed and developing countries [
36,
37]. Although the present study does not evaluate specific childcare programmes, the findings suggest that expanding childcare services could be particularly beneficial for women facing caregiving-related employment constraints.
Second, the results underscore the importance of labour-market policies that facilitate continued employment following childbirth. Flexible working arrangements, parental leave provisions, and employment-support programmes may help women maintain labour-force attachment while balancing family responsibilities. These measures may be especially relevant in contexts where labour-market participation is constrained by limited institutional support. However, because the study does not directly assess the effectiveness of these interventions, these recommendations should be interpreted as policy implications rather than causal prescriptions.
Third, the heterogeneity analysis suggests that policy interventions should recognise differences across women’s life-course trajectories. Fertility-related employment penalties are strongest among women with lower educational attainment and increase with family size. These findings imply that investments in girls’ education, school retention, and opportunities for re-entry into education after childbirth may reduce long-term employment disadvantages. Similarly, support mechanisms targeting women with larger families may help alleviate the cumulative employment constraints associated with higher parity.
Finally, the results reinforce the importance of reproductive health and family-planning services in supporting women’s educational and employment trajectories. Planned and delayed childbearing may facilitate continued schooling and stronger labour-market attachment. Nevertheless, the findings do not imply that fertility reduction alone is sufficient to improve women’s employment outcomes. Instead, the persistence of fertility-related employment penalties across both countries indicates that demographic change is most likely to translate into improved economic opportunities when accompanied by supportive labour-market institutions, accessible childcare, and expanded educational opportunities.
Overall, these policy implications should be interpreted cautiously because the study identifies fertility-related employment penalties rather than evaluating the effectiveness of specific policy interventions. The findings therefore suggest that policies reducing childcare and labour-market constraints associated with childbearing may help mitigate the adverse employment consequences of higher fertility. Consequently, progress towards SDG 5 and SDG 8 is likely to depend not only on demographic change but also on strengthening women’s access to employment opportunities and the institutional support needed to balance work and family responsibilities. The final section summarises the study’s principal conclusions and contributions.
7. Conclusions
This study examined whether fertility-related employment penalties differ across countries at different stages of demographic transition by comparing Kenya and South Africa using a quasi-experimental instrumental-variable approach. Exploiting exogenous variation in fertility generated by twin births and, as a supplementary robustness check, the sex composition of the first two children, the analysis demonstrates that higher fertility significantly reduces women’s paid employment participation and broader measures of economic autonomy. The consistency of the findings across alternative specifications and outcome measures, including the PCA-based Economic Independence Index, strengthens confidence in the robustness of the estimated relationships.
A central finding is that fertility-related employment penalties remain remarkably similar across Kenya and South Africa despite substantial differences in fertility levels and labour-market structures. Consequently, the results provide little evidence that lower-fertility contexts necessarily experience weaker employment penalties associated with childbearing. Rather than indicating that demographic transition alone improves women’s economic outcomes, the findings suggest that the economic consequences of fertility remain closely linked to broader institutional and labour-market conditions.
Furthermore, the heterogeneity analysis shows that fertility-related employment penalties increase with parity and are concentrated among women with lower educational attainment, whereas tertiary-educated women experience substantially smaller and statistically insignificant employment effects. These findings highlight the importance of human capital and life-course characteristics in shaping women’s employment trajectories and suggest that the economic costs of childbearing are not evenly distributed across women.
From a theoretical perspective, the findings are broadly consistent with Human Capital Theory and provide indirect evidence compatible with Gender-System Theory. However, because the study does not directly observe gender norms, caregiving arrangements, intra-household bargaining, or unpaid care responsibilities, the results should be interpreted as supporting these theoretical perspectives indirectly rather than constituting a direct empirical test.
This study contributes to the literature in three important ways. First, it provides comparative causal evidence on fertility-related employment penalties across two Sub-Saharan African countries at different stages of demographic transition. Second, it strengthens causal inference by employing an instrumental-variable strategy based primarily on twin births. Third, it demonstrates that fertility-related employment penalties persist across contrasting demographic contexts, thereby contributing to debates on demographic transition, women’s employment, and sustainable development.
Several limitations should nevertheless be acknowledged. The instrumental-variable estimates identify Local Average Treatment Effects (LATEs) and therefore apply to women whose fertility decisions are influenced by the instruments. In addition, although twin births are widely used in the fertility literature, the exclusion restriction cannot be verified directly, while the comparatively weak first-stage performance of the sex-composition instrument means that it should be interpreted primarily as supplementary evidence. Finally, the DHS data do not provide direct measures of earnings quality, childcare arrangements, gender norms, or intra-household bargaining, limiting examination of the mechanisms through which fertility affects women’s employment outcomes.
Generally, the findings demonstrate that fertility remains an important determinant of women’s employment outcomes across different demographic contexts. Accordingly, progress towards SDG 5 (Gender Equality) and SDG 8 (Decent Work and Economic Growth) is likely to depend not only on demographic change but also on strengthening the institutional, educational, and labour-market conditions that enable women to combine childbearing with sustained participation in economic life. Future research should build on these findings by using longitudinal data and richer measures of caregiving, labour-market quality, and household decision-making to better understand the mechanisms underlying fertility-related employment penalties.