1. Introduction
Mining is an important economic backbone in areas rich in mineral resources. However, high-intensity mining changes the surface, soil structure and near-surface hydrological processes [
1]. In coal mining areas, ground settlement, surface soil stripping and compaction increase soil bulk density (BD). These reduce infiltration capacity and water holding capacity and hinder vegetation growth. The recovery of ecosystem functions also slows down [
2]. In the process of mining, the land may be damaged due to digging, settlement, occupation and other reasons. Reclamation restores the land to a usable state through regulatory measures. In recent years, the evaluation of reclamation is no longer just about checking whether the project has been completed but further questions the extent to which the ecosystem function has actually recovered [
3]. Water resources are limited in the arid and semi-arid coal mining areas of the Loess Plateau and its surroundings. Precipitation is unevenly distributed across seasons. Evaporation is strong. These factors together restrict the continuous recovery of vegetation [
4]. Vegetation cover alone cannot determine whether an ecosystem has truly shifted from “surface greening” to “functional recovery”. A single soil physicochemical indicator cannot do so either [
5,
6,
7].
Studies have shown that vegetation restoration can improve the organic matter and nutrient content of soil and enhance the stability and pore structure of aggregates. At the same time, it reduces soil bulk density through several processes. These include root penetration, litter decomposition, root exudate input, aggregate formation and microbial activation [
8,
9,
10]. In the Loess Plateau, long term vegetation restoration has been proven to improve capillary water holding capacity (CWHC), moisture field capacity (MFC) and maximum water holding capacity (MWHC). Among them, porosity and bulk density are important factors to explain the soil hydrological variation [
9]. Recent studies based on structural equation models further show that vegetation properties do not always directly control the soil hydrological process. They indirectly affect the infiltration and water holding capacity by changing intermediate variables such as soil organic matter, porosity, particle size distribution and bulk density [
11,
12]. The direct and indirect effects of various soil factors on hydrological functions need to be analyzed. This is necessary to evaluate the recovery effect of mining areas. It is realized that hydrological improvement is ultimately driven by vegetation recovery and mediated by soil reconstruction.
In recent years, multivariate ordination and structural equation models have been increasingly used in eco-hydrological research [
11,
13,
14,
15]. This provides methodological support for identifying the direct and indirect relationships between vegetation, soil properties and hydrological functions. However, most of the relevant research focuses on non-mining ecosystems. The coupling pathway between vegetation, soil physicochemical properties and hydrological functions exists in different vegetation recovery modes in coal mine reclamation areas. Its quantitative analysis is limited as there are still three gaps in the existing research: First, more attention is being paid to vegetation cover, soil nutrients or carbon stock recovery. However, little attention is being paid to hydrological functions such as CWHC, MFC, MWHC and infiltration; second, most studies are at the level of single-factor correlation analysis. The identification of the mediating pathway between vegetation, soil structure, soil chemical properties and hydrological function is weak; third, evidence is still lacking for critical thresholds of key indicators such as SOC and BD in recovery evaluation.
Ecosystem recovery is not always a continuous and gradual process. Once several key factors exceed the critical threshold, the system function may jump, lag or decline [
16,
17,
18]. Global scale studies showed that water availability can induce nonlinear thresholds for soil biodiversity and multiple soil functions. Water exceeds specific thresholds. Then, the soil carbon cycle, plant productivity and microbial processes may change significantly [
19,
20]. Further global meta-analysis found the following: SOC, mineral associated, and microbial origin fractions all have thresholds. These characteristics are controlled by water availability, and there are differences in the response mechanism of each SOC component to environmental factors before and after the threshold [
21,
22]. For coal mine reclamation areas, SOC and BD represent the key state variables of soil chemical recovery and structural recovery respectively [
23]. SOC accumulation promotes aggregate formation, pore stability and water holding ability. The increase of BD usually means increased soil compaction, limited root growth and reduced water conductivity [
9]. Therefore, identifying the critical thresholds of SOC and BD for water holding capacity, infiltration and comprehensive hydrological functions is helpful to explain the nonlinear phenomenon in the recovery of mining areas. At the same time, this identification also provides a practical diagnostic basis for reclamation soil improvement, vegetation configuration and later management.
The Xishan Mining Area in Taiyuan, Shanxi Province is located in a typical coal resource development zone. Long-term coal mining and related industrial activities have caused ecological problems. There are also typical restoration units such as a waste rock treatment area, a vegetation degradation recovery area, a bare greening area and an industrial land reconstruction area in the surrounds. This provides a typical regional case for analyzing the relationship between vegetation restoration, soil structure reconstruction and hydrological function recovery in mining areas [
24]. For this reason, this study selected a sample site with a reclamation period of about 20 years under multi-mode vegetation recovery in the Taiyuan Xishan Mining Area and comprehensively evaluated the vegetation attributes, soil structure indicators, soil chemical indicators and soil hydrological functional indicators. The study aimed to elucidate the pathways and critical thresholds through which vegetation-driven soil restoration reconstructs soil hydrological functions in coal mining reclamation areas. The specific objectives of this study were as follows: (1) To identify the dominant soil physicochemical factors driving variation in soil water holding capacity and infiltration functions under comparable reclamation years and topographic conditions. (2) To determine the mediating pathways through which vegetation recovery influences soil hydrological functions via soil structure and chemical properties. (3) To establish the critical thresholds of soil organic carbon and bulk density for soil hydrological functions and to identify the key transition ranges for hydrological function recovery. The research results can provide a mechanistic basis and threshold reference. These can guide the transformation of arid and semi-arid coal mining areas from vegetation construction to soil hydrological function reconstruction.
2. Materials and Methods
2.1. Plot Investigation and Laboratory Analysis
This study aimed to evaluate the impact of the vegetation recovery mode on the soil hydrological function and the driving mechanism of that function. It conducted field investigations and lab experiments. Through these, it sequentially obtained vegetation composition data, soil physicochemical data, and soil hydrological characteristic data. In July 2024, a field inspection was conducted in the Xishan Mining Area. Reclamation lands with different vegetation recovery modes were selected. They had similar reclamation years (20 years) and topographic conditions. This study focused on the impact of vegetation restoration on the surface 0–10 cm soil. The study covers five typical vegetation restoration models, taking local undisturbed reference forest as a reference benchmark for ecological restoration to evaluate the recovery effect of different artificial models: (1) Pinus bungeana–herbaceous mixture, (2) Prunus davidiana–herbaceous mixture, (3) pure Pinus tabulaeformis stand, (4) pure Platycladus orientalis stand, (5) pure Medicago sativa grassland. Among them, Pinus bungeana–herbaceous mixture and Prunus davidiana–herbaceous mixture are classified as tree–herb mixed mode, pure Pinus tabulaeformis stand and pure Platycladus orientalis stand are classified as pure tree mode, and pure Medicago sativa grassland is classified as pure herb mode. The undisturbed naturally regenerated reference forest has the highest content of soil organic carbon, total nitrogen, and total phosphorus, and has the best water holding capacity and infiltration performance. Therefore, it is set as a control to evaluate the recovery degree of each restoration mode. For each vegetation restoration mode, 3 independent samples were set up as repetitions (i.e., each mode n = 3). In each sample site, tree plots (10 m × 10 m) and herb plots (1 m × 1 m) were set up for the vegetation survey. A systematic sampling design was adopted and the “S”-shaped point layout method was used. Three sampling points were established in each plot. At each sampling point, the presence of a vascular plant species was determined based on whether its rooting system fell within the plot boundaries. All vascular plant species present at each point were identified and recorded as presence/absence data. These data were then used to calculate the Jaccard and Sørensen similarity indices as follows. Remove the litter on the surface. Use soil augers and other tools to collect the 0–10 cm topsoil mixture at each sampling point. Put it in a self-sealing bag. Bring it back for the determination of the soil physicochemical properties. During sample collection and analysis, use a core cutter (100 cm3) to collect undisturbed soil. Put the soil in a core cutter box. Bring the soil back to the laboratory. Determine the soil infiltration rate and water holding indices.
The core cutter method was used to determine soil bulk density and total porosity. It was also used to determine the soil water holding capacity and other related indicators. Soil infiltration was measured using a double-ring infiltrometer (QN–500, Jinan, China) to record the infiltration curve for 0–80 min and calculate the initial infiltration rate (IIR) (0–3 min), steady infiltration rate (SIR) (65–80 min) and average infiltration rate (AIR) (0–80 min). The remaining mixed soil samples were air-dried, ground and passed through a 2 mm sieve. Soil pH was determined by the potentiometric method using a sieved soil sample [
25]. The pipette method was used to determine soil particle size composition according to Stokes’ law to determine soil texture [
26]. Soil organic carbon content was determined by the potassium dichromate external heating method [
27]. Soil total nitrogen content was determined by the Kjeldahl method [
28]. Soil total phosphorus content was determined by the molybdenum–antimony colorimetric method [
29]. All physical and chemical measurements were repeated three times and averaged to ensure data reliability.
2.2. Redundancy Analysis
Redundancy analysis (RDA) was used to identify the key physicochemical factors. RDA is a constrained sorting method based on a linear model used to examine the relationship between the response variable matrix and the explanatory variable matrix. In this analysis, the physicochemical properties of soil serve as explanatory variables and the hydrological functions serve as response variables. The response variables are sorted under the constraints imposed by the explanatory variables to reveal the influence of the soil physicochemical factors on the water holding capacity and infiltration properties of the soil. The importance of each axis is determined according to its eigenvalue and the proportion of variance it explains. RDA helps extract core information from high-dimensional data. It clarifies the complex relationships among variables and provides more targeted reference for ecological recovery decision-making.
2.3. Partial Least Squares Structural Equation Modeling
This study explores the causal pathways between vegetation, soil physicochemical properties and soil hydrological processes in industrial and mining areas. It uses partial least squares structural equation modeling (PLS–SEM) for analysis. The analysis process is based on the plspm package (version 0.5.0) in R software (version 4.2.1). All variables are standardized (mean = 0, variance = 1) to remove the influence of different units of measurement. To avoid multicollinearity, the Pearson correlation coefficient and variance inflation factor (VIF) are calculated for all independent variables. After removing variables with a correlation coefficient greater than 0.7, variables with a VIF greater than 10 are excluded to streamline the model.
Specifically, the 13 screened vegetation–soil–hydrological variables are grouped into 5 composite latent variables (vegetation, soil structure, soil chemistry, water holding capacity and infiltration). The vegetation latent variable was measured using the Jaccard and Sørensen similarity indices. These indices measure the compositional similarity of each restoration plot’s vascular plant community relative to the undisturbed reference forest. Higher values indicate closer compositional convergence toward the reference state. TPOR was reverse-coded before constructing the model. This was to align it with the ecological meaning of BD. In BD, a high value indicates soil compaction and structural degradation. This meets the consistency requirements of the measurement model. Subsequently, the preliminary path model is based on the theoretically assumed connections between the composite factors and soil hydrological functions. Vegetation is assumed to be an exogenous driving factor; it directly or indirectly affects soil structure, soil chemistry, water holding capacity and infiltration. Soil structure and soil chemistry play mediating roles and are simultaneously affected by vegetation. They further influence water holding capacity and infiltration. No direct path is set between water holding capacity and infiltration as these two are regarded as parallel final response variables. The model uses the centroid weighting scheme for parameter estimation. The significance of the path coefficients is tested by 500 bootstrap resamples, where p < 0.05 is considered significant. The overall goodness-of-fit (GoF) is used to evaluate the predictive performance of the model. All the above statistical analyses were carried out in the R (version 4.2.1) environment, which ensures transparent and reproducible analytical procedures.
2.4. Threshold Regression Model
The threshold regression model quantified the nonlinear effects of SOC and BD on hydrological functions, identified their thresholds, and analyzed the response variations across them. PLS–SEM reveals an average linear relationship. In reality, however, soil carbon accumulation and compaction occur in ecosystems. During these processes, nonlinear discontinuous changes often occur which means that only when SOC has accumulated to a certain threshold or BD exceeds a certain threshold will the soil hydrological function experience a significant jump or collapse. Identifying these thresholds is crucial for developing precise soil recovery and management strategies. Therefore, this study used the threshold regression model. It quantified the nonlinear effects of SOC and BD on soil water holding capacity and infiltration rate and also quantified the critical points of SOC and BD for these effects.
The study employs four types of threshold regression models proposed by Fong et al., namely the step model, hinge model, segmented model and step-segmented model [
30]. Among them, the step model is used to detect the abrupt change in the intercept. The hinge model is used to detect the unidirectional change in the slope after the threshold point. The segmented model allows the slope to change before and after the threshold. The step-segmented model can detect the intercept jump and the two-sided change in the slope simultaneously. The performance of the model is evaluated based on the Akaike Information Criterion (AIC) which provides a balance between goodness-of-fit and model complexity. It is used to select the optimal model [
31]; the lower the AIC value, the better the fit.
3. Results
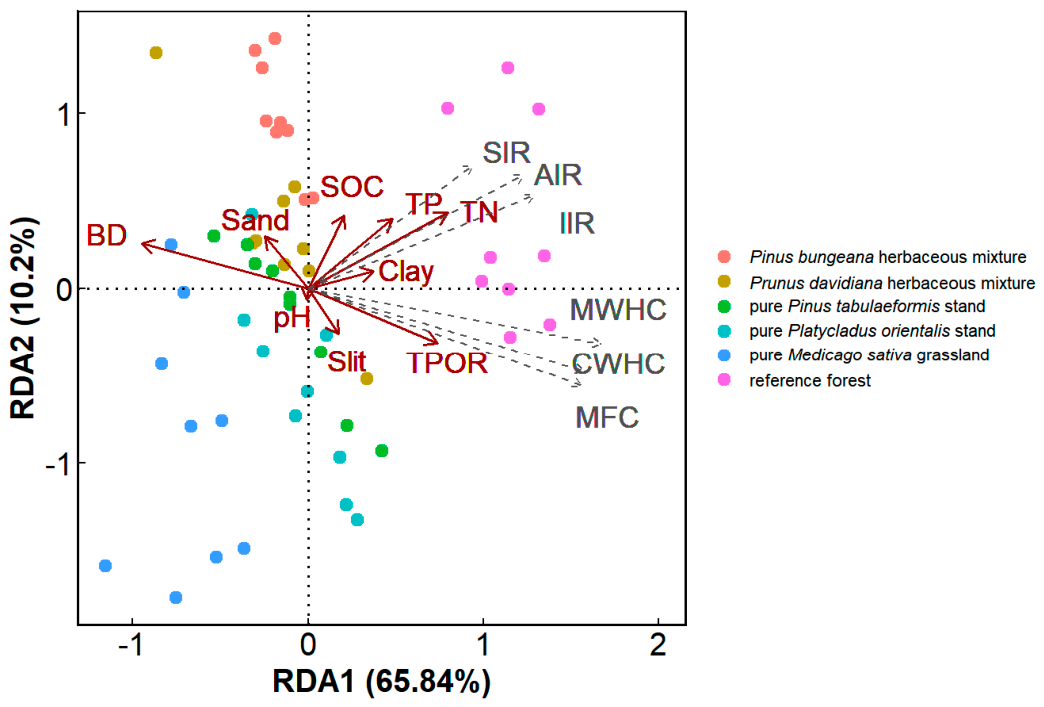
RDA1 and RDA2 explained 65.84% and 10.2% of the variation in response variables, respectively, with a cumulative explained variance of 76.04% (
Figure 1). Soil bulk density is the core negative driver of hydrological function. It is strongly negatively correlated with all infiltration and water holding capacity. Soil organic carbon (SOC), total nitrogen, total phosphorus and other nutrient indicators are the core positive drivers and are positively correlated with the hydrological function. Different vegetation recovery modes show significant differences in the RDA ordination space, and the high hydrological functions are found in positive axis regions, which have high nutrients and low bulk density. The low hydrological functions are found in negative axis regions, which have high bulk density and low fertility.
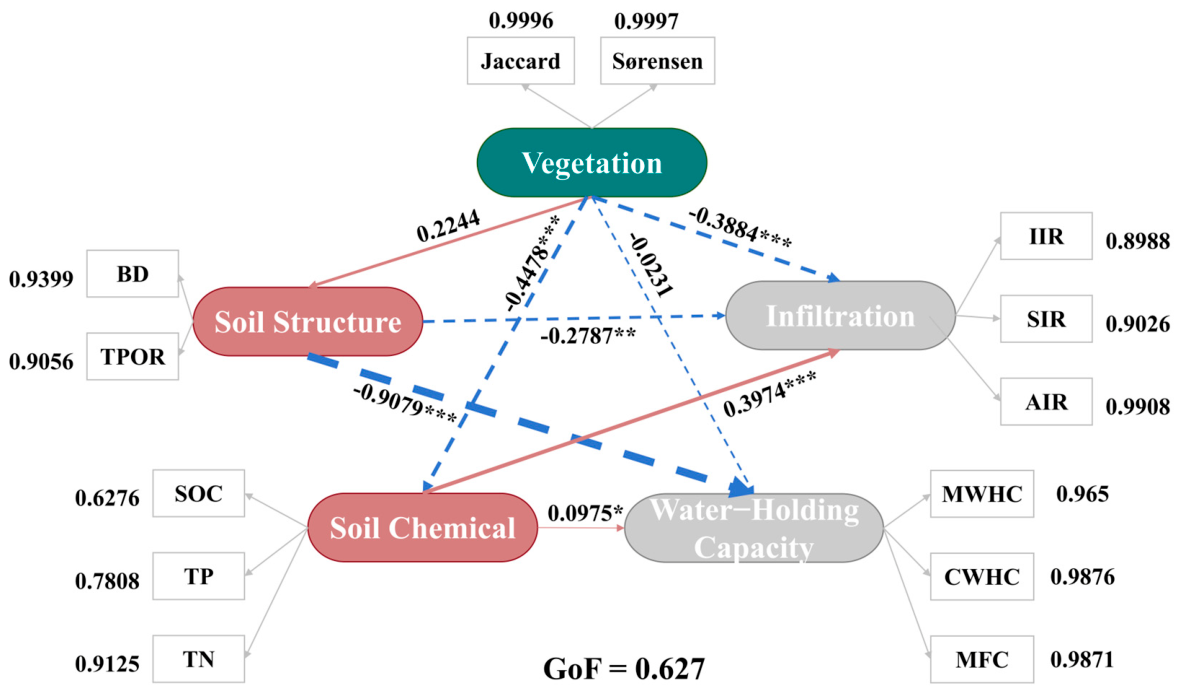
The model exhibited good overall fit (GoF = 0.627), with factor loadings of all observed indicators ≥ 0.6 (mostly >0.8) (
Figure 2). Vegetation has a weak positive effect on soil structure (0.2244) and a moderate negative effect on infiltration rate (−0.3884). It has a moderate negative effect on soil chemical properties (−0.4478) and no significant effect on water holding capacity. Soil structure has a strong negative impact on water holding capacity (−0.9079), which is the core driving factor affecting soil water holding capacity. At the same time, soil structure also has a weak negative correlation with infiltration rate (−0.2787). The soil chemical properties have a moderate positive effect on infiltration rate (0.3974) and a weak positive effect on water holding capacity (0.0975).
The measurement model showed good reliability and validity as follows. The composite reliability (DG.rho) of all latent variables is higher than 0.7. Among them vegetation (1.000), water holding capacity (0.986), infiltration (0.952) and soil structure (0.921) reach excellent levels, and soil chemical properties (0.827) are also good (
Table 1). Cronbach’s α for soil chemical properties is slightly lower than the conventional standard (0.684). However, the overall reliability is still acceptable. In terms of convergent validity, the average variance extracted (AVE) of all latent variables is greater than 0.5, meeting the basic requirements for convergent validity. Among them, the AVE of water holding capacity (AVE = 0.960) and vegetation (AVE = 0.999) is close to 1, and soil structure (AVE = 0.852), infiltration (AVE = 0.868) and soil chemical properties (AVE = 0.612) also reach good or acceptable levels. In terms of the explanatory power of the structural model, the coefficient of determination (R
2) of endogenous latent variables shows large differences. The R
2 of water holding capacity reaches 0.928, indicating high predictive power. The R
2 of infiltration is 0.677, but the R
2 of soil chemical properties is only 0.201, indicating weak explanatory power. The R
2 of soil structure is the lowest, at only 0.050.
The AIC of the hinge model was lowest for both water holding capacity and infiltration rate, indicating significant threshold effects for both indicators (
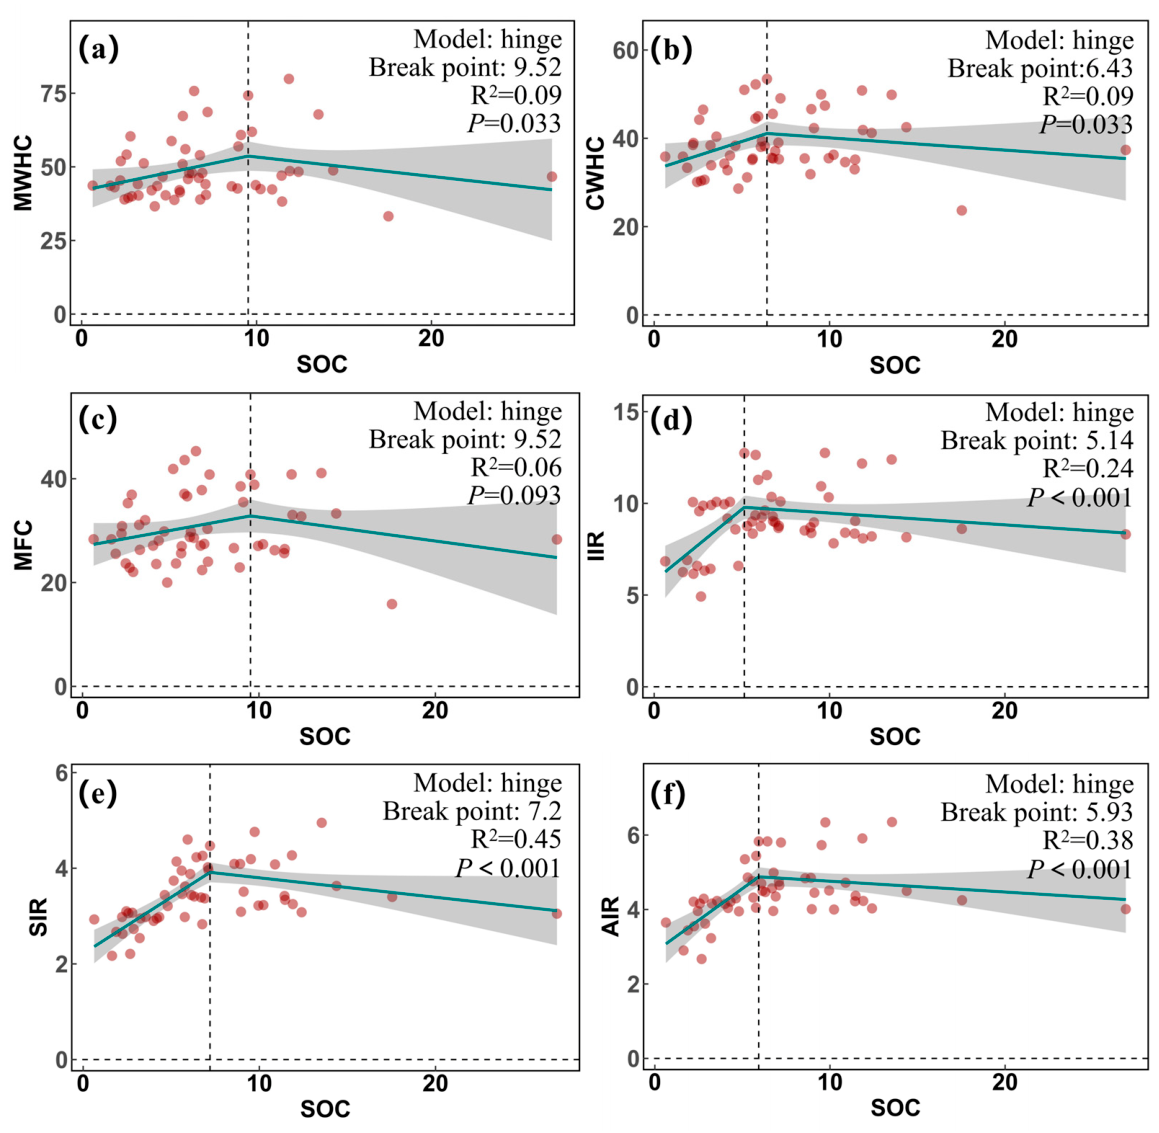
Table 2). All water holding capacity and infiltration indicators show significant threshold effects. The hinge model fitting shows that when the SOC is below the threshold, the hydrological function increases rapidly and linearly with increasing SOC. After exceeding the threshold, the growth rate slows down significantly, showing a pattern of diminishing marginal returns (
Figure 3). Among them, the threshold for the water holding capacity is about 9.52 g/kg, and the threshold effect is significant; the threshold for the infiltration rate is about 5.93 g/kg, and the threshold effect is extremely significant.
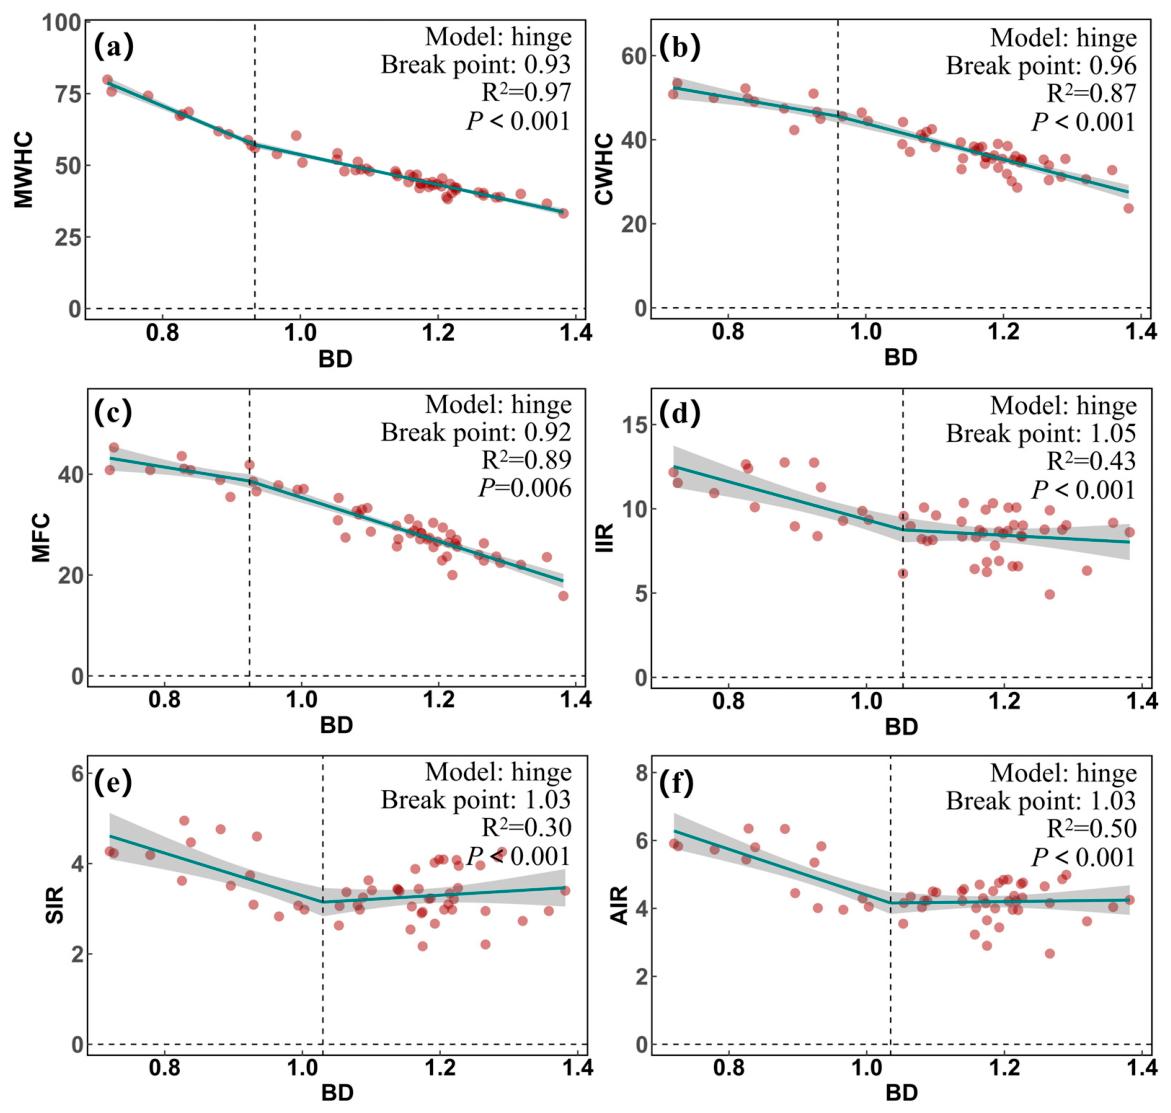
Among the nonlinear effects of soil bulk density on soil water holding capacity and infiltration properties, the AIC of all hinge models is the lowest (
Table 3). The fitting results show significant threshold effects for water holding capacity and infiltration rate (
Figure 4). Among them, the threshold for water holding capacity is about 0.93 g/cm
3, and the model’s explanatory power R
2 is close to 0.9. Both CWHC and MFC models show a rapid decline after the threshold. In contrast MWHC shows a trend of declining more rapidly before the threshold than after. The threshold for the infiltration rate is 1.03 g/cm
3. Both the AIR and SIR models show a slight increase after the rapid decline before the threshold. However, they show a slight downward trend after the IIR threshold. The confidence intervals of the parameters before and after the threshold for each model have no overlap. The interval width is narrower than the corresponding confidence interval of the SOC threshold model.
4. Discussion
In different vegetation recovery modes of the Xishan Mining Area, the hydrological function of the soil is mainly controlled by bulk density and nutrient status. Soil structure compaction is mainly characterized by increased bulk density and reduced porosity. This kind of compaction is a key factor restricting the hydrological function recovery of reclaimed soil. Nutritional indicators such as SOC, TN and TP are positively correlated with hydrological function. This shows that the improvement of hydrological function is not simply caused by the increase in surface vegetation coverage but is also closely related to the loosening of soil structure, the accumulation of organic matter and the restoration of nutrient supply capacity.
The result is consistent with previous ecological restoration and mining area reclamation studies on the Loess Plateau. Extant studies have shown that porosity and bulk density play an important role in controlling hydrological properties such as soil capillary water holding capacity (CWHC), moisture field capacity (MFC) and saturated hydraulic conductivity [
32]. For the reclaimed soil in mining areas, bulk density reflects the degree of soil compaction. It also comprehensively characterizes the influence of factors such as mining disturbance, soil reconstruction, mechanical compaction and later management practices. During the reclamation process, the soil remains at a high bulk density for a long time. This reduces macropores and connected pores. As a result, precipitation infiltration and soil water storage capacity are limited. Conversely, if vegetation restoration reduces bulk density and improves pore structure, the soil water holding capacity and infiltration rate are improved [
33].
SOC, TN and TP positively affect hydrological function. This reflects the coupling between fertility recovery and hydrological function reconstruction [
34]. For reclaimed soil, organic carbon is not only an indicator of fertility, but also participates in the processes of aggregate formation, pore stabilization and water holding capacity [
34,
35,
36]. SOC accumulation improves surface soil structure and increases porosity. The improvement of TN and TP is conducive to vegetation growth and litter return. This improvement further promotes soil structural development. Vegetation restoration can improve SOC, TN, available nutrients and soil enzyme activity. But its recovery effect is regulated by factors, according to a meta-analysis of post mining sites [
37]. These factors include mine type, climate and initial soil conditions. Therefore, samples with high hydrological functions are mostly distributed in low bulk density and high nutrient areas. This essentially reflects the improvement of reclaimed soil development in terms of structure and fertility [
33].
Water holding capacity and infiltration belong to the same soil hydrological function, but their response mechanisms are not exactly the same. Water holding capacity depends more on stable pore space. It is more sensitive to bulk density and the pore system. In addition to the influence of bulk density, infiltration rate is also regulated by factors such as SOC accumulation, aggregate stability, root pores and crack connectivity [
38]. Therefore, in this study, SOC and BD show different thresholds for water holding capacity and infiltration. The infiltration process can respond to a lower level of SOC accumulation. In contrast the stable improvement of water holding capacity requires more complete structural reconstruction and pore stabilization.
The impact of vegetation on hydrological function is not a simple direct effect. It is mainly realized through intermediate processes such as soil structure and soil chemical properties. In this study, vegetation shows a negative influence on soil chemical properties and infiltration properties. However, this does not mean a weakening of soil fertility or hydrological function by vegetation restoration [
12] (
Figure 2). Additionally, the latent variable of vegetation is mainly composed of community composition and similarity indicators. It does not include process-based indicators such as root biomass, root length density, litter input, canopy interception and multi-year organic matter return. Therefore, the negative path may reflect the time mismatch between recovery stage, community composition and soil development status [
13,
39].
In the early stage of reclamation, pioneer plants or invasive species may quickly increase the complexity of the community composition. However, at that time, the soil may still have a high bulk density. It may also have low organic matter and an unstable pore system. Consequently, the community composition index does not correspond to a high soil hydrological function [
40,
41]. Previous studies also pointed out the following fact. The recovery of the reclaimed soil vegetation system has obvious chrono sequence effects. Under different vegetation types, soil functions and vegetation functions may exhibit either synergy or trade-offs. Therefore, the negative relationship exists between vegetation indicators and some soil chemical properties or hydrological functions. This relationship is a result of differences in recovery stage and a mismatch between community and soil functions. It is not a reduction in the restoration effect of vegetation.
From the perspective of path relationships, the hydrological effect of vegetation recovery depends on long term factors. These factors are about improving soil structure and nutrient conditions. The effect is largely mediated by changes in soil properties, such as organic matter, porosity, bulk density, and particle size composition [
8]. In this study, soil structural compaction significantly limits water holding capacity, and soil chemical properties promote infiltration rate. This also indicates something. Evaluating mining area recovery cannot just look at vegetation establishment or community composition as vegetation may or may not promote soil change—more attention should be paid to that. The soil change is from a compacted, infertile, low porosity state to a state with stable structure, carbon-rich conditions and good pore connectivity. Ecosystem services give a perspective. The restoration of hydrological functions links directly to the improvement of services, which include soil moisture regulation, carbon sequestration and nutrient retention in mining areas. The improvement of these functions helps to stabilize soil microhabitats as it creates conditions for the recovery of soil biodiversity [
42]. It also supports the degraded ecosystem to move towards self-sustainability. Hydrological function thresholds connect to regional ecosystem service targets. This connection serves as a supplementary component for the comprehensive benefit evaluation of ecological restoration in mining areas.
Both SOC and BD exhibited significant threshold effects on water holding capacity and infiltration rate [
43,
44]. The recovery of soil hydrological functions in mining areas is not a continuous, uniform linear process but follows a clearly segmented response. This is consistent with recent ecosystem threshold research [
19,
43]. Soil function often responds to key environmental factors in a nonlinear manner. Water availability and soil carbon components exhibit threshold type responses. This study further shows the following. In coal mining reclamation soil, SOC and BD are the key state variables for fertility recovery and structural recovery and also have critical significance for water holding capacity and infiltration functions.
Previous studies often thought that the soil hydrological relationship was linear and also that it was only qualitatively stated, but this study provides statistical evidence to the contrary. This evidence confirms that thresholds exist and can be quantified, and this finding has two uses. First, the location of SOC or BD relative to the threshold of a reclamation plot can directly show its recovery stage. The threshold itself can serve as a diagnostic criterion for assessing recovery degree [
45], while there is no need to rely on indirect indicators such as vegetation cover. Second, the slopes before and after the threshold differ. This indicates that the effectiveness of the same management measure varies with the recovery stage. Below the threshold, increasing SOC or reducing BD yields rapid, expected improvements. Above the threshold, the same measures produce substantially diminishing returns. Management should shift to structural interventions. In other words, threshold regression results not only characterize the changes that have occurred but they also allow for prospective assessment of measure effectiveness, which enables more precise management decisions.
Below the threshold, hydrological function increases rapidly with increasing SOC, while above the threshold, the growth rate slows down significantly. This indicates that in the low-SOC stage, organic carbon input has an obvious compensatory effect on reclaimed soil. This can quickly improve water storage and infiltration rate by promoting aggregate formation, enhancing surface stability and improving pore structure. When the SOC reaches a certain level, the hydrological benefits brought by simply increasing organic carbon tend to decrease. The limiting factors may shift to physical processes such as pore connectivity, soil thickness, soil compaction degree and root structure [
46,
47]. Thus, SOC is an important condition for the restoration of soil hydrological function in mining areas, but it is not the only decisive factor.
The SOC threshold for infiltration rate is lower than that for water holding capacity. Therefore, the infiltration process may be more sensitive to early SOC accumulation. Low SOC improves infiltration through aggregation, while high SOC is needed for water holding capacity through pore stabilization and mineral associations [
2,
48,
49]. In the early stage of recovery, the infiltration rate can be quickly improved through certain measures, which include surface soil improvement, litter retention, organic matter addition and herb–shrub root system improvement. However, to stably improve water holding capacity, a long period of soil ripening and structural reconstruction is needed [
33] (
Figure 2). Compared with SOC, the management significance of the BD threshold is more direct, which indicates that the bulk density threshold has high stability and maneuverability. The BD threshold model exhibits narrower confidence intervals than the SOC threshold model. This feature makes bulk density a more stable indicator. It also makes it easier to use for assessing hydrological function recovery in reclaimed soil.
Therefore, the evaluation of ecological restoration in the Xishan Mining Area should not just depend on vegetation diversity or similarity indices. Instead, it should pay attention to the reconstruction of soil hydrological functions. In restoration practice, SOC and BD can be used as important indicators for post-reclamation management. In the early recovery stage, mechanical compaction should be controlled by optimizing soil cover thickness and land preparation and also by reducing repeated heavy machinery use. Meanwhile, SOC input should be increased through litter water holding capacity, organic matter addition, and grass or grass–shrub mixtures. For plots with BD above the critical interval, replanting or increasing coverage alone is insufficient to improve hydrological function. Restoring pore connectivity also requires deep tillage, micro-topography modification, organic mulching, and root improvement [
32]. Some lands have SOC above the threshold, but their hydrological function has not been improved significantly. For these lands, management should shift from simply adding organic carbon to improving soil structure and soil layer continuity [
50,
51]. The above graded management measures are based on SOC and BD thresholds and can be further included in the periodic soil monitoring program for the reclaimed mining area. They can be converted into a dynamic management mechanism for sustaining operations. The SOC and BD levels of each block are re-measured on a regular basis, which allows us to assess the change in its recovery stage. Accordingly, the starting, strengthening, or stopping of the corresponding measures can be begun, rather than only as a one-time evaluation conclusion. At the institutional level, according to the requirements of the Technical Specification for Monitoring and Evaluation of Mine Land Reclamation and Ecological Restoration, for restoration monitoring and evaluation, it is required to include functional indicators in the evaluation of mining area restoration. These indicators include water holding capacity, infiltration rate, BD and SOC thresholds. The assessment should avoid relying only on vegetation cover for recovery effects.
There are still some limitations in this study. First, a single spatial comparison cannot replace long-term monitoring. Second, the sample size is limited. The results of PLS–SEM and threshold regression are more suitable for the preliminary determination of action pathways and diagnostic thresholds at the site scale. Therefore, these results should not be applied as general rules for the whole Loess Plateau Mining Area [
52,
53,
54]. Third, this study focused only on the 0–10 cm surface layer, without revealing deep storage, vertical infiltration, or root water uptake [
55,
56]. Fourth, vegetation variables were limited to community composition and similarity, excluding root traits, litter, and canopy structure. These unmeasured traits may explain the varying effects of recovery modes on soil properties. Tree roots are deeper and more widespread, favoring macropores. Herb roots are shallow, mainly affecting surface soil. Litter quality and canopy transpiration also vary among modes, affecting surface moisture, temperature, microbial activity, and organic matter accumulation. These factors need further study. Soil structure analysis is based on bulk density and porosity, and evidence from aggregate stability, pore connectivity, or microstructural images is lacking [
57,
58,
59]. Future research should monitor long term recovery chrono sequences, study deeper layers, and use staining tracer or CT analysis to validate SOC and BD thresholds and their regional applicability.