Article

Assessment of the Impact of Beaver Dams on Flow Conditions, Retention Capacity, and Water Resources in the Junikowski Stream in Poznań


by
Stanisław Zaborowski
1,
Tomasz Kałuża
1,*,
Maciej Pawlak
1,
Mateusz Hämmerling
1,
Michał Woźniak
2,
Maksymilian Rybacki
3 and
Tomasz Tymiński
4
1
Department of Hydraulic and Sanitary Engineering, Poznań University of Life Sciences, Piątkowska 94, 60-649 Poznań, Poland
2
Sweco Polska Sp. z o.o., Franklina Roosevelta 22, 60-829 Poznań, Poland
3
Institute of Meteorology and Water Management-National Research Institute, Podleśna 61, 01-673 Warsaw, Poland
4
Institute of Environmental Engineering, Wrocław University of Environmental and Life Sciences, Pl. Grunwaldzki 24, 50-363 Wroclaw, Poland
*
Author to whom correspondence should be addressed.
Sustainability 2026, 18(17), 8725; https://doi.org/10.3390/su18178725
Submission received: 1 August 2026 / Revised: 20 August 2026 / Accepted: 21 August 2026 / Published: 26 August 2026

Abstract

Beaver dams can substantially modify flow conditions and increase local water retention, particularly in small urban and peri-urban streams exposed to hydrological alterations and increasing water deficits. This study evaluates the influence of beaver dams on hydraulic conditions, retention capacity, and water resources in the Junikowski Stream in Poznań, Poland. Field surveys, geodetic measurements, and spatial data were used to develop a one-dimensional hydraulic model in HEC-RAS. Three management scenarios were analysed: a channel without impoundment structures, the 2022 configuration including beaver dams and two artificial weirs, and the 2025 configuration representing a more developed beaver-dam cascade together with the functioning weirs. Simulations were conducted for a range of characteristic and probability flows to assess changes in water levels, inundation extent, and retained water volume. The results show that beaver dams exert the strongest effect under low-flow conditions, when they significantly increase water levels and improve local retention. Their hydraulic influence decreases with increasing discharge, although they continue to affect the spatial distribution of water in the valley. The proposed artificial structure may partly maintain retention benefits in the event of beaver dam degradation or removal. The findings demonstrate that beaver dams may function as effective nature-based solutions supporting water retention and potentially contributing to drought resilience and sustainable management of urban stream valleys.

1. Introduction

The Eurasian beaver (Castor fiber) is a classic example of an ecosystem engineer and a keystone species for the functioning of river valleys [1]. Following extensive protection and reintroduction programmes, Eurasian beavers have recolonised large parts of their former European range and are increasingly occurring in human-dominated landscapes, including urban and peri-urban environments. Their presence in cities such as Zurich, as well as experience from reintroduction programmes in England, demonstrates both the ecological restoration potential of the species and the growing need for adaptive management and human–beaver coexistence [2,3,4]. By constructing dams, excavating canals, removing bank shading, and modifying channels, beavers directly influence the water cycle, flow conditions, geomorphological processes, and the structure of aquatic and wetland habitats [1,5,6]. Their activity leads to increased water retention, runoff deceleration, enhanced hydraulic connectivity between the channel and the floodplains, and the creation of a diverse habitat mosaic, all of which are of significant importance for both ecosystem functioning and water management practice [1,7,8,9,10].
In recent years, the role of beavers has been increasingly analysed in the context of nature-based solutions, green and blue-green infrastructure, and the adaptation of catchments and cities to climate change [11]. Such ecosystem-based approaches are also consistent with broader European strategies aimed at strengthening climate resilience and supporting the transition towards climate neutrality [12]. In this context, beaver dams may meet key NBS (Nature-Based Solution) criteria by relying on natural ecosystem-engineering processes to enhance surface-water storage, slow runoff, increase lateral hydrological connectivity, and support wetland and riparian habitat functions. Their effectiveness as an NBS is, however, site-specific and should be evaluated together with potential impacts on drainage systems, infrastructure, and local flood risk. This is of particular importance given the increasing relevance of hydrological extremes in Poland, including recurrent severe droughts and changes in the characteristics of extreme precipitation events [11,13,14,15]. From this perspective, beaver dams can be viewed as natural, self-regulating retention structures that increase water residence time in the valley, reduce runoff velocity, and support the restoration of local hydrological and ecological functions in streams [16,17,18].
Beaver activity primarily involves the periodic or long-term impoundment of water in small and medium-sized streams [10]. The resulting beaver dams and ponds transform river sections characterised predominantly by flow within a single-thread channel into a mosaic of slow-flow reaches, backwaters, wetlands, and local pools [19]. As a result, the volume of water retained in the valley increases; the balance between surface runoff, infiltration, and groundwater recharge is altered; and local systems of dams and backwaters can influence the flow regime at the scale of an entire small catchment [1,16]. Studies conducted across various types of catchments have demonstrated that beaver dam complexes increase water storage, attenuate peak flows, extend the catchment response time to precipitation, and can stabilise low flows [6,11].
The impact of beaver dams also has a geomorphological and habitat dimension. In low-gradient streams, reduced flow velocity upstream of beaver dams promotes the deposition of fine sediments and local bed aggradation. The associated increase in water levels and lateral spreading of flow may also promote channel widening, activation or formation of secondary flow paths, and greater morphological connectivity between the channel and adjacent valley floor. Together, these processes increase the morphological heterogeneity of the channel and river valley [6,20]. More broadly, the interpretation of flood-related processes requires consideration of the interactions between hydraulic conditions, valley morphology, sediment dynamics, and inundation patterns [21]. Beaver dams are dynamic and semi-permeable structures, which distinguishes them from conventional small hydraulic structures. Their presence causes flow deceleration, an increase in water depth, enhanced channel–valley exchange, and the creation of local infiltration and water storage zones [20]. Long-term studies conducted in river valleys indicate that the presence of beavers can lead to increased habitat moisture, the development of ponds and backwaters, and an increase in the spatial diversity of valley vegetation [6].
The significance of beaver activity, however, depends on local conditions and catchment structure [22]. Dam distribution models indicate that beavers prefer reaches with favourable topographical, hydrological, and morphological conditions, with commonly considered variables including channel gradient, valley width, drainage area or discharge, and the availability of riparian woody vegetation [23,24]. In agricultural and urbanised catchments, channel characteristics, surface water and groundwater connectivity, and land use are also of particular importance [11,25]. This means that the hydrological effects of beaver presence cannot be assessed solely on the basis of the number of dams, but should be analysed in relation to catchment, hydraulic, and spatial conditions [19]. Consequently, the hydrological role of beaver dams in urban streams should be assessed not only from an ecological perspective, but also in relation to stormwater conveyance, local water storage, and infrastructure safety.
This is particularly relevant in small urban catchments, where rapid runoff, limited storage capacity, and dense infrastructure increase the sensitivity of stream valleys to both water deficits and local flooding. In the context of sustainable water management, it is particularly important to determine the extent to which beaver dams can support landscape retention and reduce stormwater runoff, while simultaneously understanding the consequences they may cause in urbanised areas [6,25,26]. In urban and peri-urban areas, the presence of beavers can support the restoration of river valley functions, increase the retention capacity of streams and adjacent areas, and enhance elements of blue-green infrastructure [27,28,29]. At the same time, it can lead to conflicts related to stream maintenance, local flooding, infrastructure safety, and the functioning of drainage systems [30,31]. In the Junikowski Stream valley, infrastructure potentially affected by beaver-induced impoundment includes culverts, embankments and dykes carrying pedestrian and bicycle paths across the valley, as well as stormwater outlets discharging directly into the stream channel, whose hydraulic performance may be influenced by elevated water levels and local backwater effects. For this reason, there is a need for studies combining hydraulic, hydrological, and spatial assessments of the impacts of beaver activity in small urban streams.
Against this background, the Junikowski Stream provides a suitable case study for evaluating how beaver activity modifies hydraulic conditions in a highly urbanised small catchment. The main objective of this study was to assess the impact of changes in flow conditions in the channel of the Junikowski Stream, along the section from km 8 + 480 to km 9 + 420, resulting from natural impoundments caused by the activity of a beaver colony. The analysed stream flows through urbanised areas and constitutes an important component of the stormwater management system in Poznań. As part of the research, the spatial extent of the impoundments’ impact and the retention volume were determined after approximately three years of beaver activity. The study also assessed the significance of beaver dams as a factor influencing the local stormwater retention system and the development of valley vegetation. The study tested the hypothesis that the presence and progressive development of beaver dams significantly increase water levels, inundation extent, and steady-state surface-water storage within the stream valley compared with conditions without dams, with the greatest relative effect occurring under low-flow conditions.

2. Materials and Methods

2.1. Study Area

The Junikowski Stream is a third-order natural stream located within the urban agglomeration of Poznań (Poland, Europe), which over the past decades has been the subject of numerous studies, analyses, and projects [32,33]. The stream is a small urban watercourse and a left-bank tributary of the Warta River, with its valley constituting a vital component of the hydrographic and ecological system in the western part of the city. it originates at the Ławica Airport grounds (104 m a.s.l.) and has a length of 11.48 km down to its mouth (55 m a.s.l.), with a catchment area of 49.9 km2.
For the Poznań–Ławica synoptic station, the mean annual temperature was 9.4 °C over the 30-year period (1991–2020). According to the mean temperature values for individual months within the specified time range, January was observed to be the coldest month on average, with an average temperature of −0.4 °C. Conversely, July was identified as the warmest month, with an average temperature of 19.5 °C. The mean annual precipitation over the 30-year period is 539 mm, with July being the rainiest month, averaging 84 mm, and April being the driest month, averaging 29 mm. The city of Poznań, in conjunction with the wider Greater Poland region, is among the areas in Poland that experience the lowest annual precipitation totals. This phenomenon can be attributed to the rain shadow effect and the region’s specific topography [34].
The analysed section (km 8 + 480 to km 9 + 420) runs through green areas on the outskirts of the Marcelin Forest (a municipal forest) and adjacent to the Junikowo Cemetery. It is situated in the southwestern part of Poznań, within an urban catchment characterised by a highly modified yet still valuable natural environment [33]. The studied reach of the stream in the vicinity of the Marcelin Forest is of particular importance as it lies within the Junikowo green wedge, connecting forest complexes, open spaces, allotment gardens, cemetery greenery, the stream valley, and the Szachty area located further downstream (former clay pits, now a green recreational area). In the context of an urban agglomeration, such a layout functions as an ecological corridor, a local zone for water retention, aeration, and organism migration, while simultaneously serving as a key recreational resource for the residents of Poznań’s western districts [35].
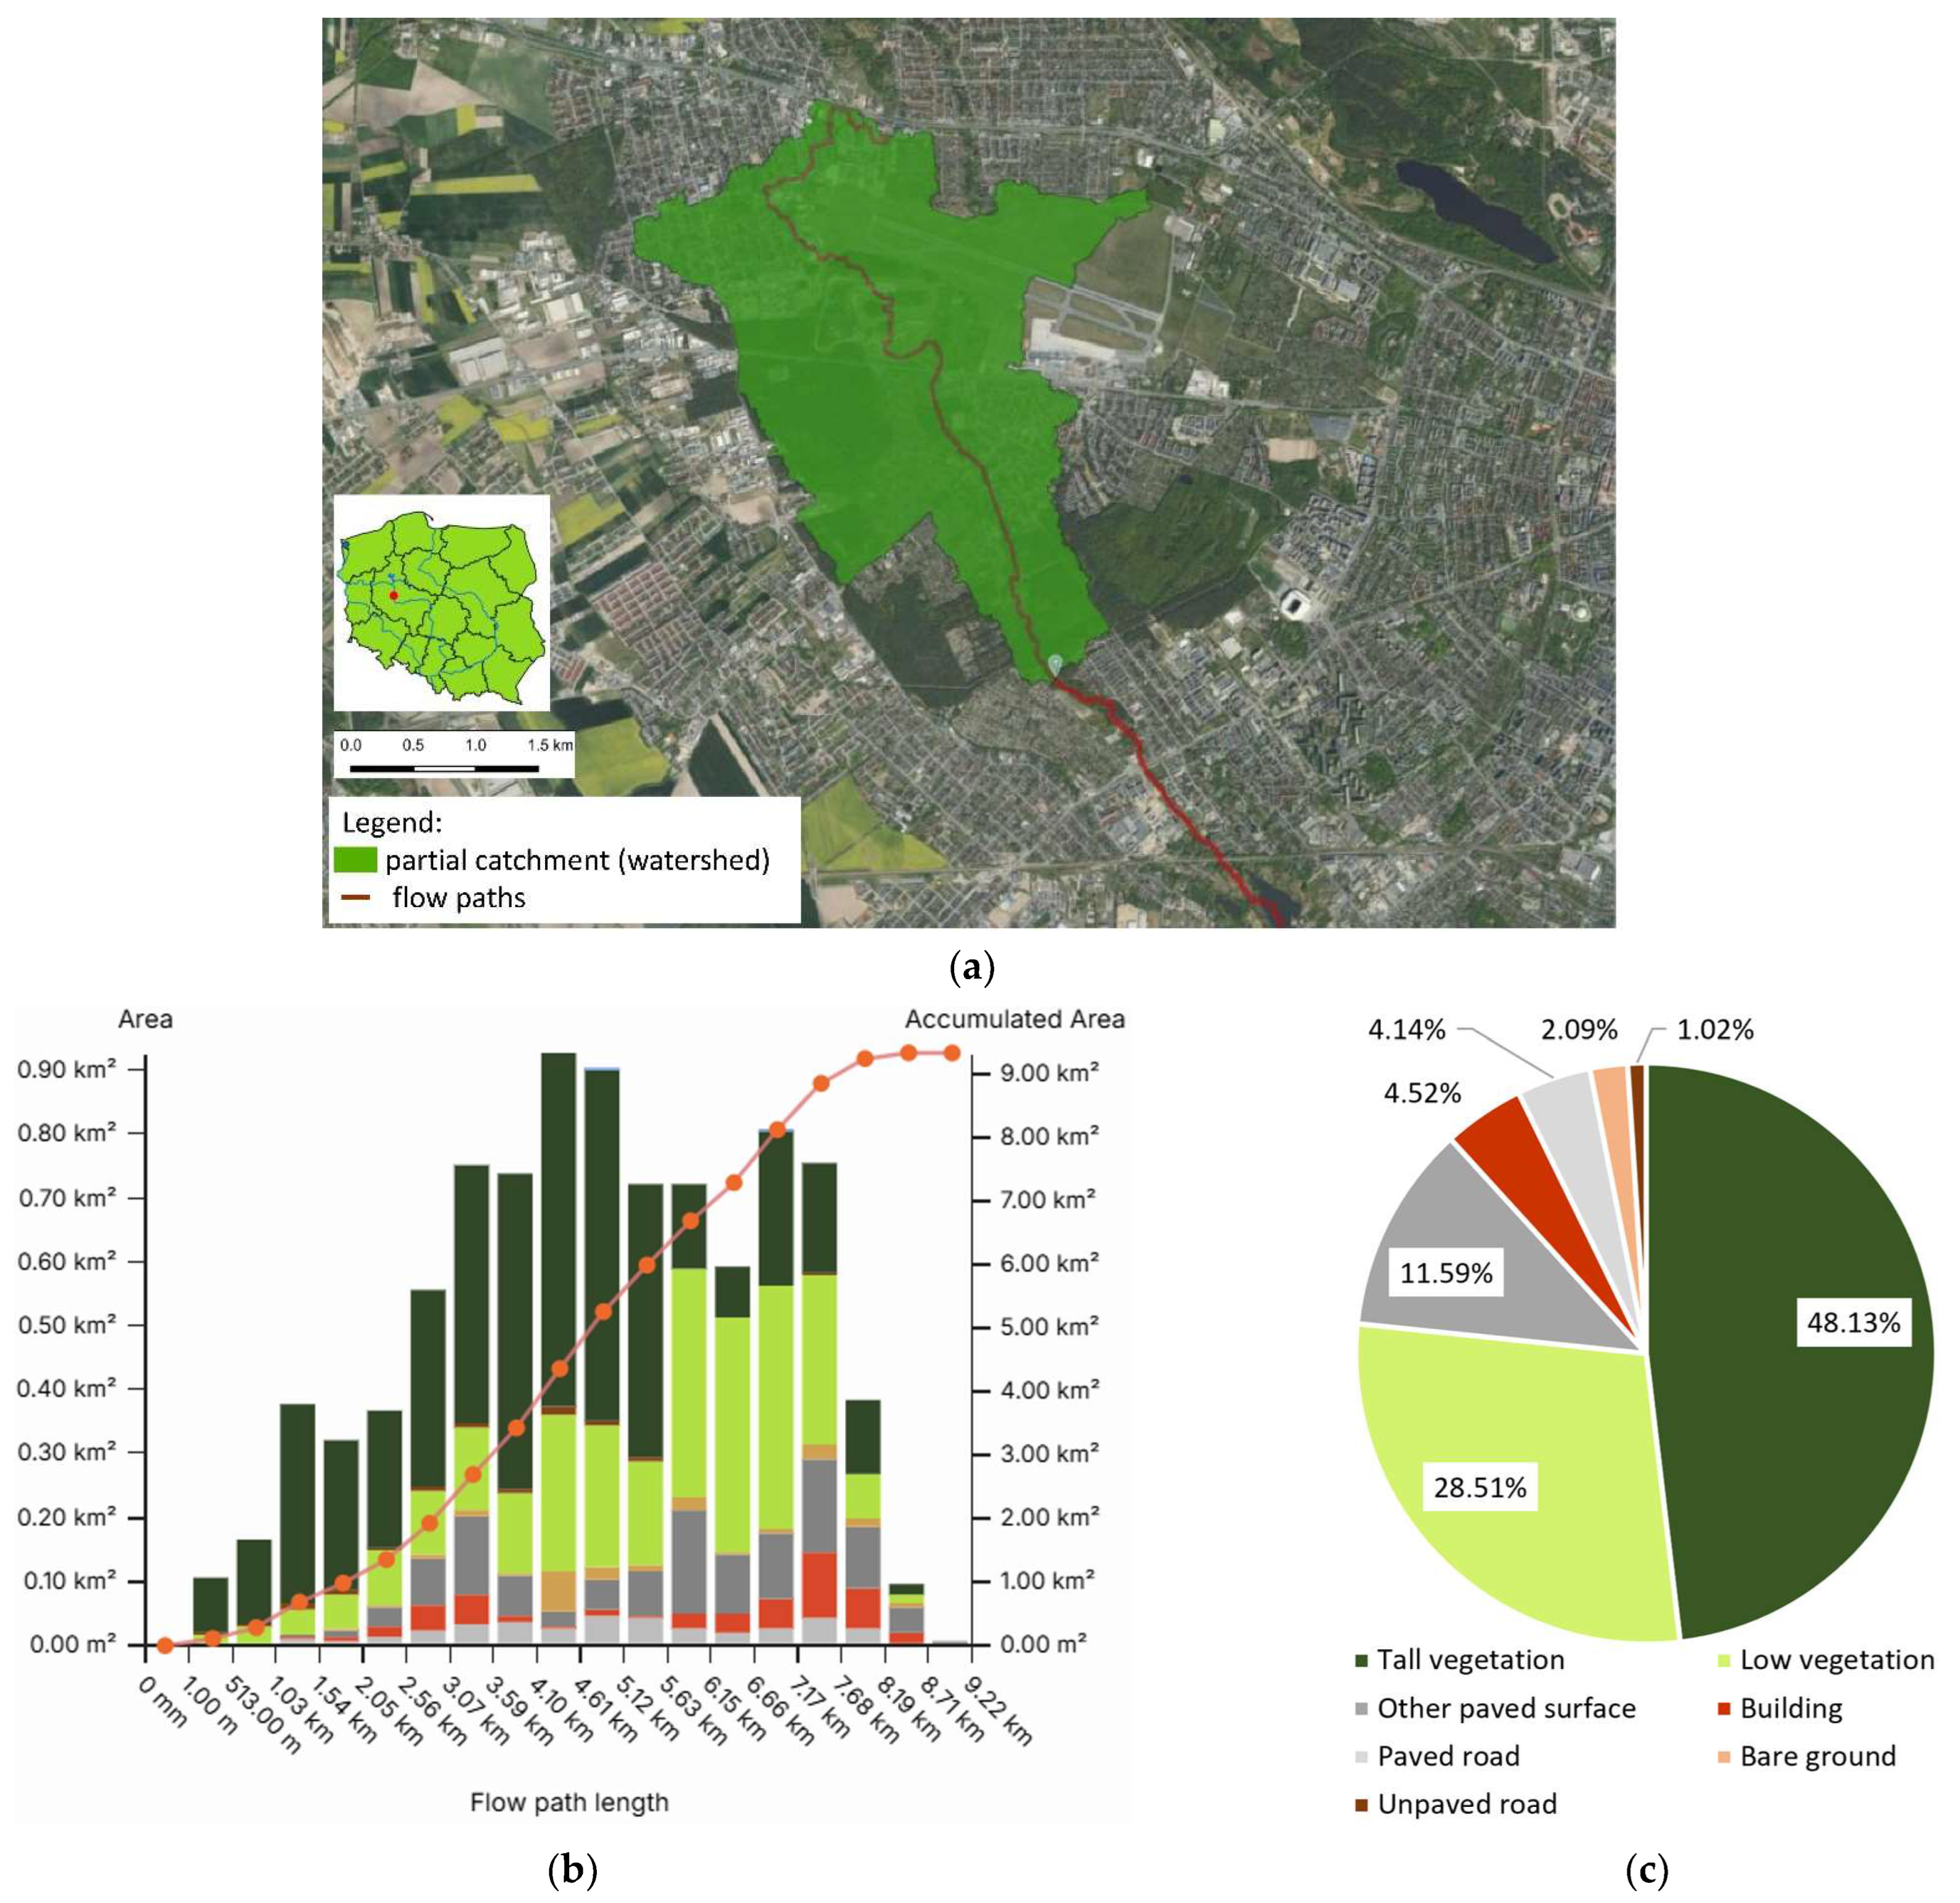
The catchment area down to the cross-section of the first beaver dam in the analysed reach (Figure 1a) (km 8 + 480) is 9.33 km2. Up to this cross-section, green spaces dominate the catchment (80%), with the remainder comprising (20%) impermeable surfaces (roads, paved areas, and roofs). The weighted average of the runoff coefficient, when calculated with consideration for the proportion of the specified surfaces designated for natural surfaces, is estimated to be approximately 0.1 and for surfaces classified as impermeable, this average is estimated to be approximately 0.9. A detailed land cover structure is presented in Figure 1b,c. The mean longitudinal gradient is relatively steep, amounting to 2.6‰ for the entire catchment.
It is worth noting that analyses conducted for the Junikowski Stream catchment [36] demonstrated that the entire catchment area is highly vulnerable to droughts and water deficits. Furthermore, the heavily modified catchment surface leads to accelerated runoff and a lack of retention, which exacerbates the effects of water deficits and causes flash floods during heavier precipitation. In forested and semi-natural parts of the valley, soil moisture storage may complement surface-water retention, as soil properties, vegetation, and local climatic conditions jointly influence the amount and persistence of water stored in the soil [37]. The desiccation of the stream valley has resulted in the degradation of many ecologically valuable habitats. For this reason, among others, the idea emerged to construct two small, wooden weirs in this area. As the implementation of the project was about to begin in 2021, it was discovered that the area had recently been colonised by beavers. A decision was then made to position the artificial impoundments in such a way that they would enhance the effect of the beaver dams and, should they be abandoned, partially assume their functions.

2.2. Ecological and Hydrological Context of the Junikowski Stream Valley

From the perspective of Poznań’s blue-green infrastructure, the Junikowski Stream valley in the vicinity of the Marcelin Forest should be treated as an area of high ecological, landscape, and social significance. Its value stems not only from the presence of valuable species but also from its function as a local ecological corridor. The natural environment of the analysed section of the Junikowski Stream catchment is shaped by a mosaic of forest, scrub, meadow, ruderal, and wetland habitats [38]. The diversity of moisture and soil conditions, the presence of periodically waterlogged depressions, and the proximity to the Marcelin Forest favour the development of diverse vegetation, including riparian, alder carr, scrub, and meadow communities [39]. Of particular importance are the fragments where moist conditions and the continuity of riparian vegetation have been preserved, as they increase the valley’s water retention capacity, reduce surface runoff, and sustain local biodiversity [33].
The ecological value of this area also stems from its function as an urban wildlife refuge. The former “Strumień Junikowski” (Junikowski Stream) ecological site was identified as a habitat for numerous bird species, including breeding, visiting, and migrating species [40]. The proximity to the Marcelin Forest further increases the importance of this area for forest birds and birds of prey. The stream valley, wooded areas, scrub, and open habitats also create favourable conditions for small mammals, amphibians, reptiles, and invertebrates.
At the same time, the catchment remains under strong urbanisation pressure [41]. Channel regulation, urban development, surface sealing, transport infrastructure, and intensive recreational use affect hydrological conditions, habitat continuity, and environmental quality. Typical problems in the Junikowski Stream catchment include reduced infiltration, increased surface runoff, short-term flow peaks following precipitation, habitat desiccation during dry periods, and the influx of pollutants. Additional threats include the succession of woody vegetation onto open meadow habitats, the expansion of alien species, and littering resulting from anthropogenic pressure.

2.3. Beaver Activity

The analysed section (km 8 + 480 to km 9 + 420) is characterised by a gradient of 1.34‰, which favours the construction of beaver dams, while the proximity of the forest provides a source of both food and the building materials necessary for dam construction. In 2025, a total of 12 dams were located and measured along the investigated reach: 3 main dams with impoundment heights ranging from 0.1 to 0.8 m, and 9 intermediate dams with small impoundments not exceeding 0.4 m. The majority of the dams were located in a channel section within the river valley, where wetland habitats overgrown with reed and marsh vegetation predominated. The number of dams has changed over time. The initial inventory conducted in 2022 identified 4 beaver dams [42]. At the beginning of the observation period, the investigated reach was occupied by a single beaver colony. The subsequent increase in the number of dams from 4 in 2022 to 12 in 2025 suggests an expansion of beaver activity within the valley. However, no systematic census of individuals or family groups was conducted, and therefore the presence of an additional colony cannot be confirmed. The locations and shapes of the dams varied, but the structures consistently utilised the local topography and, in some cases, existing infrastructure such as bridges, culverts, and embankments. Table 1 presents the properties of the dams.
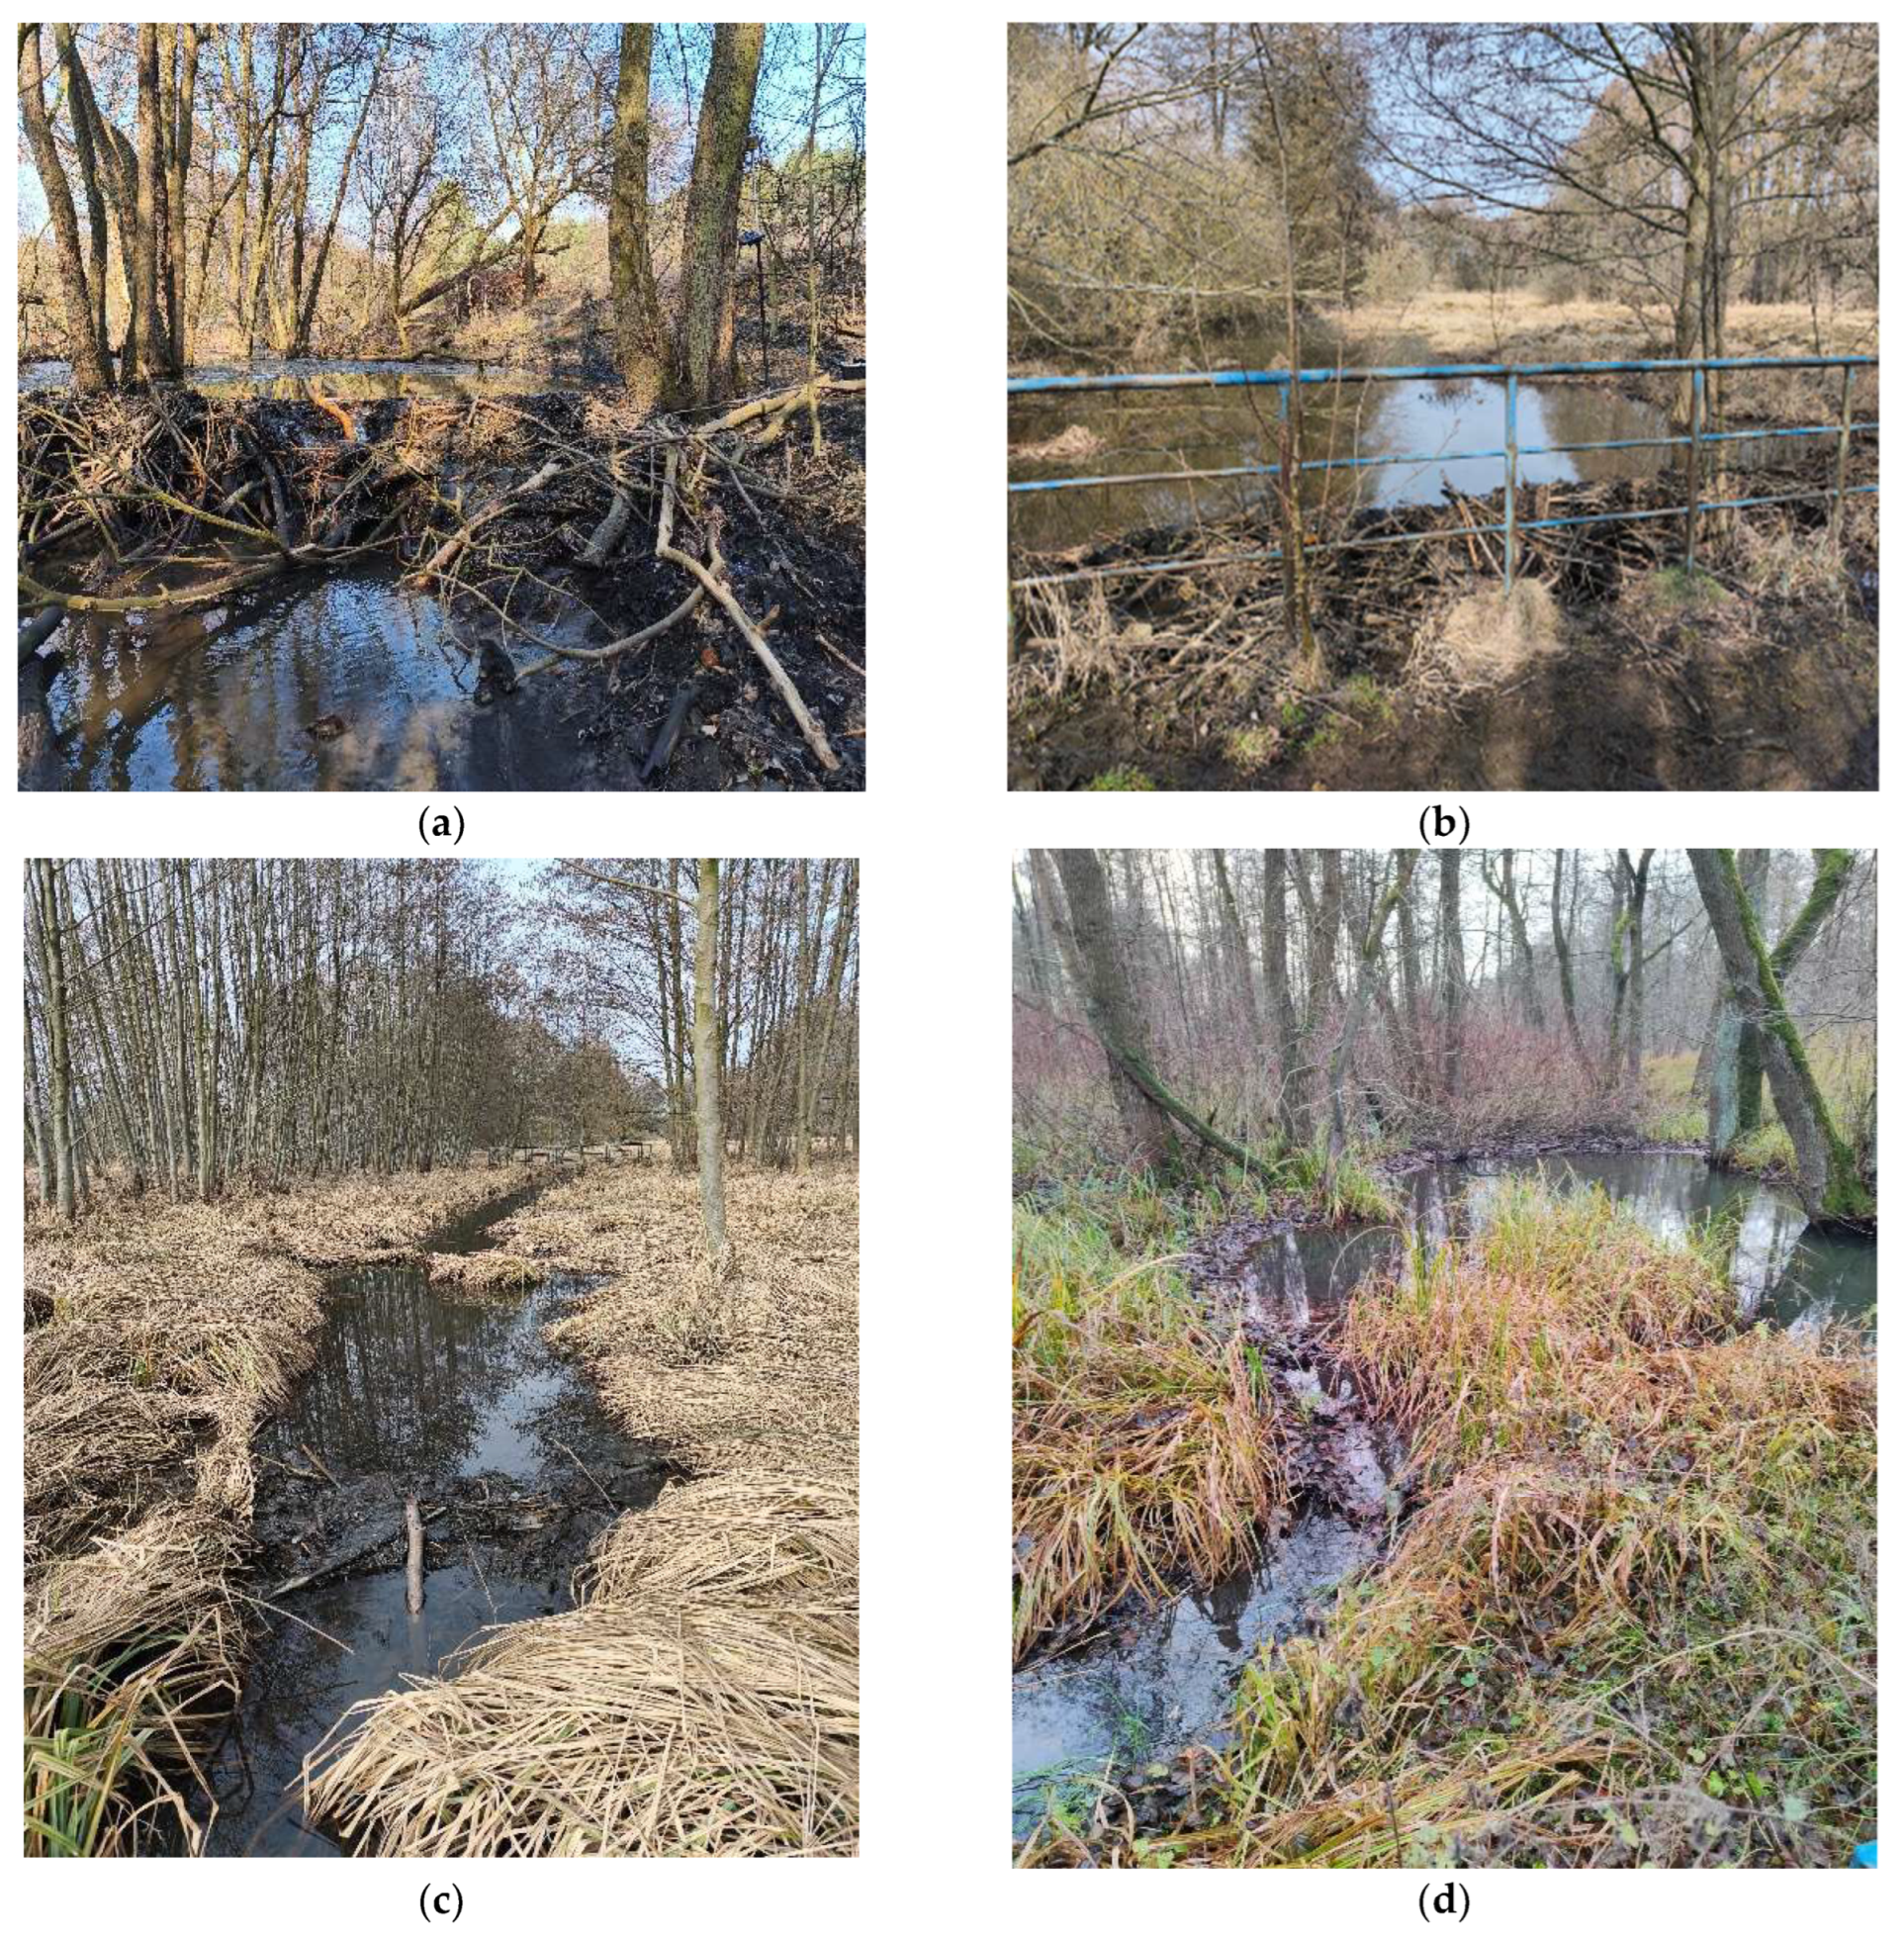
Currently, dam no. 1 (km 8 + 480) is located in a natural narrowing of the river valley (Figure 2a). The impoundment height is 0.78 m, and the extent of the impoundment reaches the next dam located by the embankment at cross-section km 8 + 890. Dam no. 2 is located downstream of the embankment carrying a path and a service road that crosses the Junikowski Stream valley (km 8 + 890) (Figure 3). It has assumed a horseshoe shape, and the impoundment was relatively low, fluctuating between 0.10 and 0.20 m (Figure 2d). The intermediate dams, located between dam no. 2 (km 8 + 890) and dam no. 3 (km 9 + 420), have been numbered 2.1 to 2.9 and, with one exception (dam 2.4), are situated entirely within the channel. Their height, shape, and composition are highly diverse. The impoundment heights typically range from 0.05 to 0.20 m, with the highest impoundment in this group reaching approximately 0.4 m (dam 2.7).
Dams 2.1–2.3 are small structures situated entirely within the stream channel, impounding water up to the bankfull level. Due to the diverse topography upstream of the dams, where surface depressions are present, the areas adjacent to the channel become inundated. In the case of dam 2.4, a specific situation was observed where the distinct course of the channel had disappeared due to infilling or collapse, and the dam was situated on the valley surface in the form of a low earth-and-reed embankment. The height of this dam was approximately 0.05 m, reaching 0.10 m at its highest point, making it the longest of the intermediate dams with a total length of approximately 6 m. Dams 2.5 and 2.6, on the other hand, are small earth-and-reed structures with an impoundment height of approximately 0.10 m. Dam 2.7 was located approximately 5 m downstream of an old footbridge. Its impoundment of approximately 0.40 m extended to a system of perpendicular drainage ditches which, under the current impoundment conditions, facilitated the spreading of water across the area where the beavers had constructed a lodge. Dams 2.8 and 2.9 are also structures characterised by minor impoundments not exceeding 0.10 m. They are situated entirely within the channel and do not cause water to overtop the banks (Figure 2c).
Dam no. 3 was located 1 m upstream of a small pedestrian and bicycle bridge (km 9 + 420). The beavers utilised the bridge structure, and the impoundment height was approximately 0.40 m (Figure 2b). Just upstream of the extent of the third dam’s impact, several other beaver-built structures were observed, with their impoundment reaching subsequent cascading dams.

2.4. Field Surveys

2.4.1. Topographical Surveys

Field surveys were conducted in January 2023 [42], November 2025 and in April 2026. The surveys enabled the acquisition of topographical data and the precise determination of the extent of the beaver dam impoundments. Additionally, photographic documentation and an inventory of the beaver dams, as well as the impounding structures in the form of two small weirs, were compiled.
The measurements were performed using two TOPCON FC-6000 GPS devices equipped with a TOPCON HiPer SR receiver (TOPCON CORPORATION, Tokyo, Japan), providing an RTK measurement accuracy of H: ±10 mm and V: ±15 mm, which allowed for a relatively precise determination of the terrain’s elevation profile. In addition to measuring the water surface profile and its extent, channel cross-sections were surveyed at characteristic locations. These cross-sections facilitated the development of a hydrodynamic model of the river. The topographical surveys also involved determining the shape and elevations of the beaver dams, the channel bed profile upstream and downstream of the dams and identifying the parameters of the embankments traversing the valley. Furthermore, the inlet and outlet elevations of the culverts inventoried along the investigated reach were determined.
The topographical surveys served to supplement, update, and verify the suitability of publicly available digital data. The basis for the calculations and modelling consisted of DTMs (Digital Terrain Models) made available by GUGiK (Head Office of Geodesy and Cartography) on the office’s website [43] from 2012 and 2024. The most up-to-date DTM available was from 2024. For this purpose, four point clouds encompassing the study area were downloaded and subsequently merged into a single file. The collected point cloud was characterized by a spatial characteristic of a grid mesh of 12 points/m2 with a mean error of 0.02. Next, all points not identified as ground were filtered out. Additionally, the stream channel in the DTM was corrected based on the channel cross-sections measured in the field. The obtained points were further verified in terms of their classification. Due to the outdated KRON86 vertical datum for DTM from 2012, the points were converted to the EVRF2007 reference system. The converted point dataset was transformed into a raster using triangulation, yielding a raster with a resolution of 0.1 m. The original DTM had a mesh size of 1.0 m with a mean error of 0.1; this DTM was created by scanning at a resolution of 12 points/m2 with a mean error of 0.1. The resulting DTM was compared against the GPS measurements. In locations with constant elevations (benchmarks, roads, utilities, structures, and characteristic points), the differences fell within the margin of measurement error (H: ±10 mm and V: ±15 mm), while in the flooded areas, they exhibited only minor discrepancies (under 50 mm).
Finally, the DTM from 2012 was used to build the model in HEC-RAS, while the water levels measured in the field were used for validation. The coordinate system used to create the model and present the results was based on EPSG:2180 (ETRS89/Poland CS92); however, some files were created in local coordinate systems (e.g., EPSG:2177).

2.4.2. Hydrology

No systematic long-term hydrological monitoring is conducted on the Junikowski Stream, and there is no gauging station within the catchment providing continuous discharge records. Therefore, the hydrological characteristics used in this study [44] were derived from available design studies and supplemented by field discharge measurements. For the analyses, the values of characteristic flows and flows with a specified exceedance probability p% were adopted based on the data provided in the study [45]. The data indicated in the aforementioned study were recalculated for the computational cross-section. To transfer the hydrological information to the analysed cross-section at km 8 + 518, an extrapolation method was applied. This method is based on the assumption that the values of characteristic flows change proportionally to the increase in the catchment area [45,46]. Selected results in the form of characteristic flows and flows with a specified exceedance probability p% are summarised in Table 2.
As part of the model calibration, water discharge measurements were also conducted. For this purpose, additional cross-sections were surveyed at selected locations, allowing for the precise determination of the channel geometry and the current water surface elevation. Flow velocity measurements were performed in April 2023 and November 2025. To determine the discharge in the respective cross-sections, hydrometric verticals were established, where water velocity was measured at various depths. The measurements were conducted using a Valeport model 801 electromagnetic current meter, which enables velocity measurement in the range of 0.001 to 5 m·s−1. On the basis of the measured cross-sectional geometry and the velocity distribution within the hydrometric verticals, the discharge in the analysed cross-sections was calculated. The measurements were carried out in accordance with applicable methodological standards, described, among others, by Zaborowski [46].

2.5. HEC-RAS Computational Model

For the numerical simulation, HEC-RAS software version 6.6, developed and maintained by the US Army Corps of Engineers, was utilised [47]. Similar approaches combining topographic and field-survey data with one-dimensional HEC-RAS modelling have been applied for the delineation of inundation extents and flood hazard zones [48]. HEC-RAS offers the advantage of integrating hydraulic calculations with detailed terrain and spatial data; however, the reliability of the results depends on the quality of the input data, the representation of channel geometry and roughness, and the adopted boundary conditions [49]. For this purpose, the built-in GIS module, RAS Mapper, was used, thereby providing a starting point for the development of the hydraulic model. Additionally, all points from the topographical survey were imported into RAS Mapper. This was achieved using the available DTM data, the measured extent of the beaver backwater, and the verification of elevations against the DTM. The stored water volumes were calculated in RAS Mapper by spatially integrating the water-depth raster derived from the difference between the simulated water-surface elevation and the underlying DTM over the inundated area. A one-dimensional model was selected because the primary objective was to quantify longitudinal changes in water levels and surface-water storage associated with the beaver dams rather than to reproduce detailed multidirectional flow paths across the floodplain. The limitations of this approach for representing lateral spreading through depressions and drainage ditches are discussed in Section 4.
Using data from archival maps, the DTM, and the surveyed cross-sections, a hydrodynamic model was developed. The model was supplemented with Manning’s roughness coefficients, and additional cross-sections were interpolated to increase computational accuracy and stabilise the model. A major difficulty was determining the appropriate Manning’s coefficient values due to the lush vegetation, which varied significantly depending on the season. Following the field inspection, three roughness coefficient values were adopted in the model for the main channel (n = 0.030, 0.035, and 0.048 m−1/3∙s), and three values for the areas located within the stream valley (0.035, 0.050, and 0.070 m−1/3∙s). The adopted range is consistent with Manning’s roughness values reported for natural channels and floodplain areas with moderate to dense vegetation [50,51]. The accuracy of the generated model was verified against the water surface elevations and the extent of the backwater. On this basis, the roughness coefficient values for individual cross-sections were refined. Boundary conditions in the form of a discharge of 0.017 m3∙s−1, measured during the field surveys (which is close to the SSQ (average annual flow) value of 0.026 m3∙s−1), were adopted for the simulation. The modelling was primarily used to assess the relative effect of beaver dams on water levels and water retention under the investigated scenarios; in this case, the flow rate should be sufficient. For the calculations, “Normal Depth” was adopted as the downstream boundary condition, which is based on inputting the longitudinal gradient at the lower end of the computational domain (model). To calibrate the model, a discharge of approximately 0.017 m3∙s−1 was assumed. In the case of the calibration model, the water surface elevation was applied as the downstream boundary condition.

2.6. Scalgo Software

To determine the preliminary inundation extent, the Scalgo Live software was used at https://scalgo.com/pl/ (accessed on 1 July 2026), utilising the Watershed tool. Meanwhile, to identify land cover types, the Land Cover tool was applied (based on local BDOT thematic maps and orthophotomap analysis). The Sea-Level Rise function within this software was used to simulate the rise in the water level resulting from the impact of beaver activity, namely the construction of natural dams. The Sea-Level Rise tool was not used to calculate the longitudinal hydraulic backwater profile. Instead, it was applied as a preliminary terrain-based inundation screening method, in which a prescribed water-surface elevation was compared with the DTM within each defined workspace. Because the analysed valley is relatively flat and individual workspaces covered short reaches, the assumption of an approximately horizontal water surface was considered acceptable for the preliminary delineation of inundated areas. The resulting extents were therefore treated as approximate and were not used as a substitute for the hydraulic calculations performed in HEC-RAS 7.0. The area of impact of the beaver dams was divided into workspaces representing the areas upstream of the dams. Within a given workspace, an appropriate stream water level associated with the impact of the specific beaver dam was assumed. A separate simulation was performed for each of these workspaces for the assumed horizontal water surface elevation. On this basis, the area inundated as a result of the impact of a given beaver dam was visualised.

3. Results

3.1. Analysis of Field Data and Terrain Models

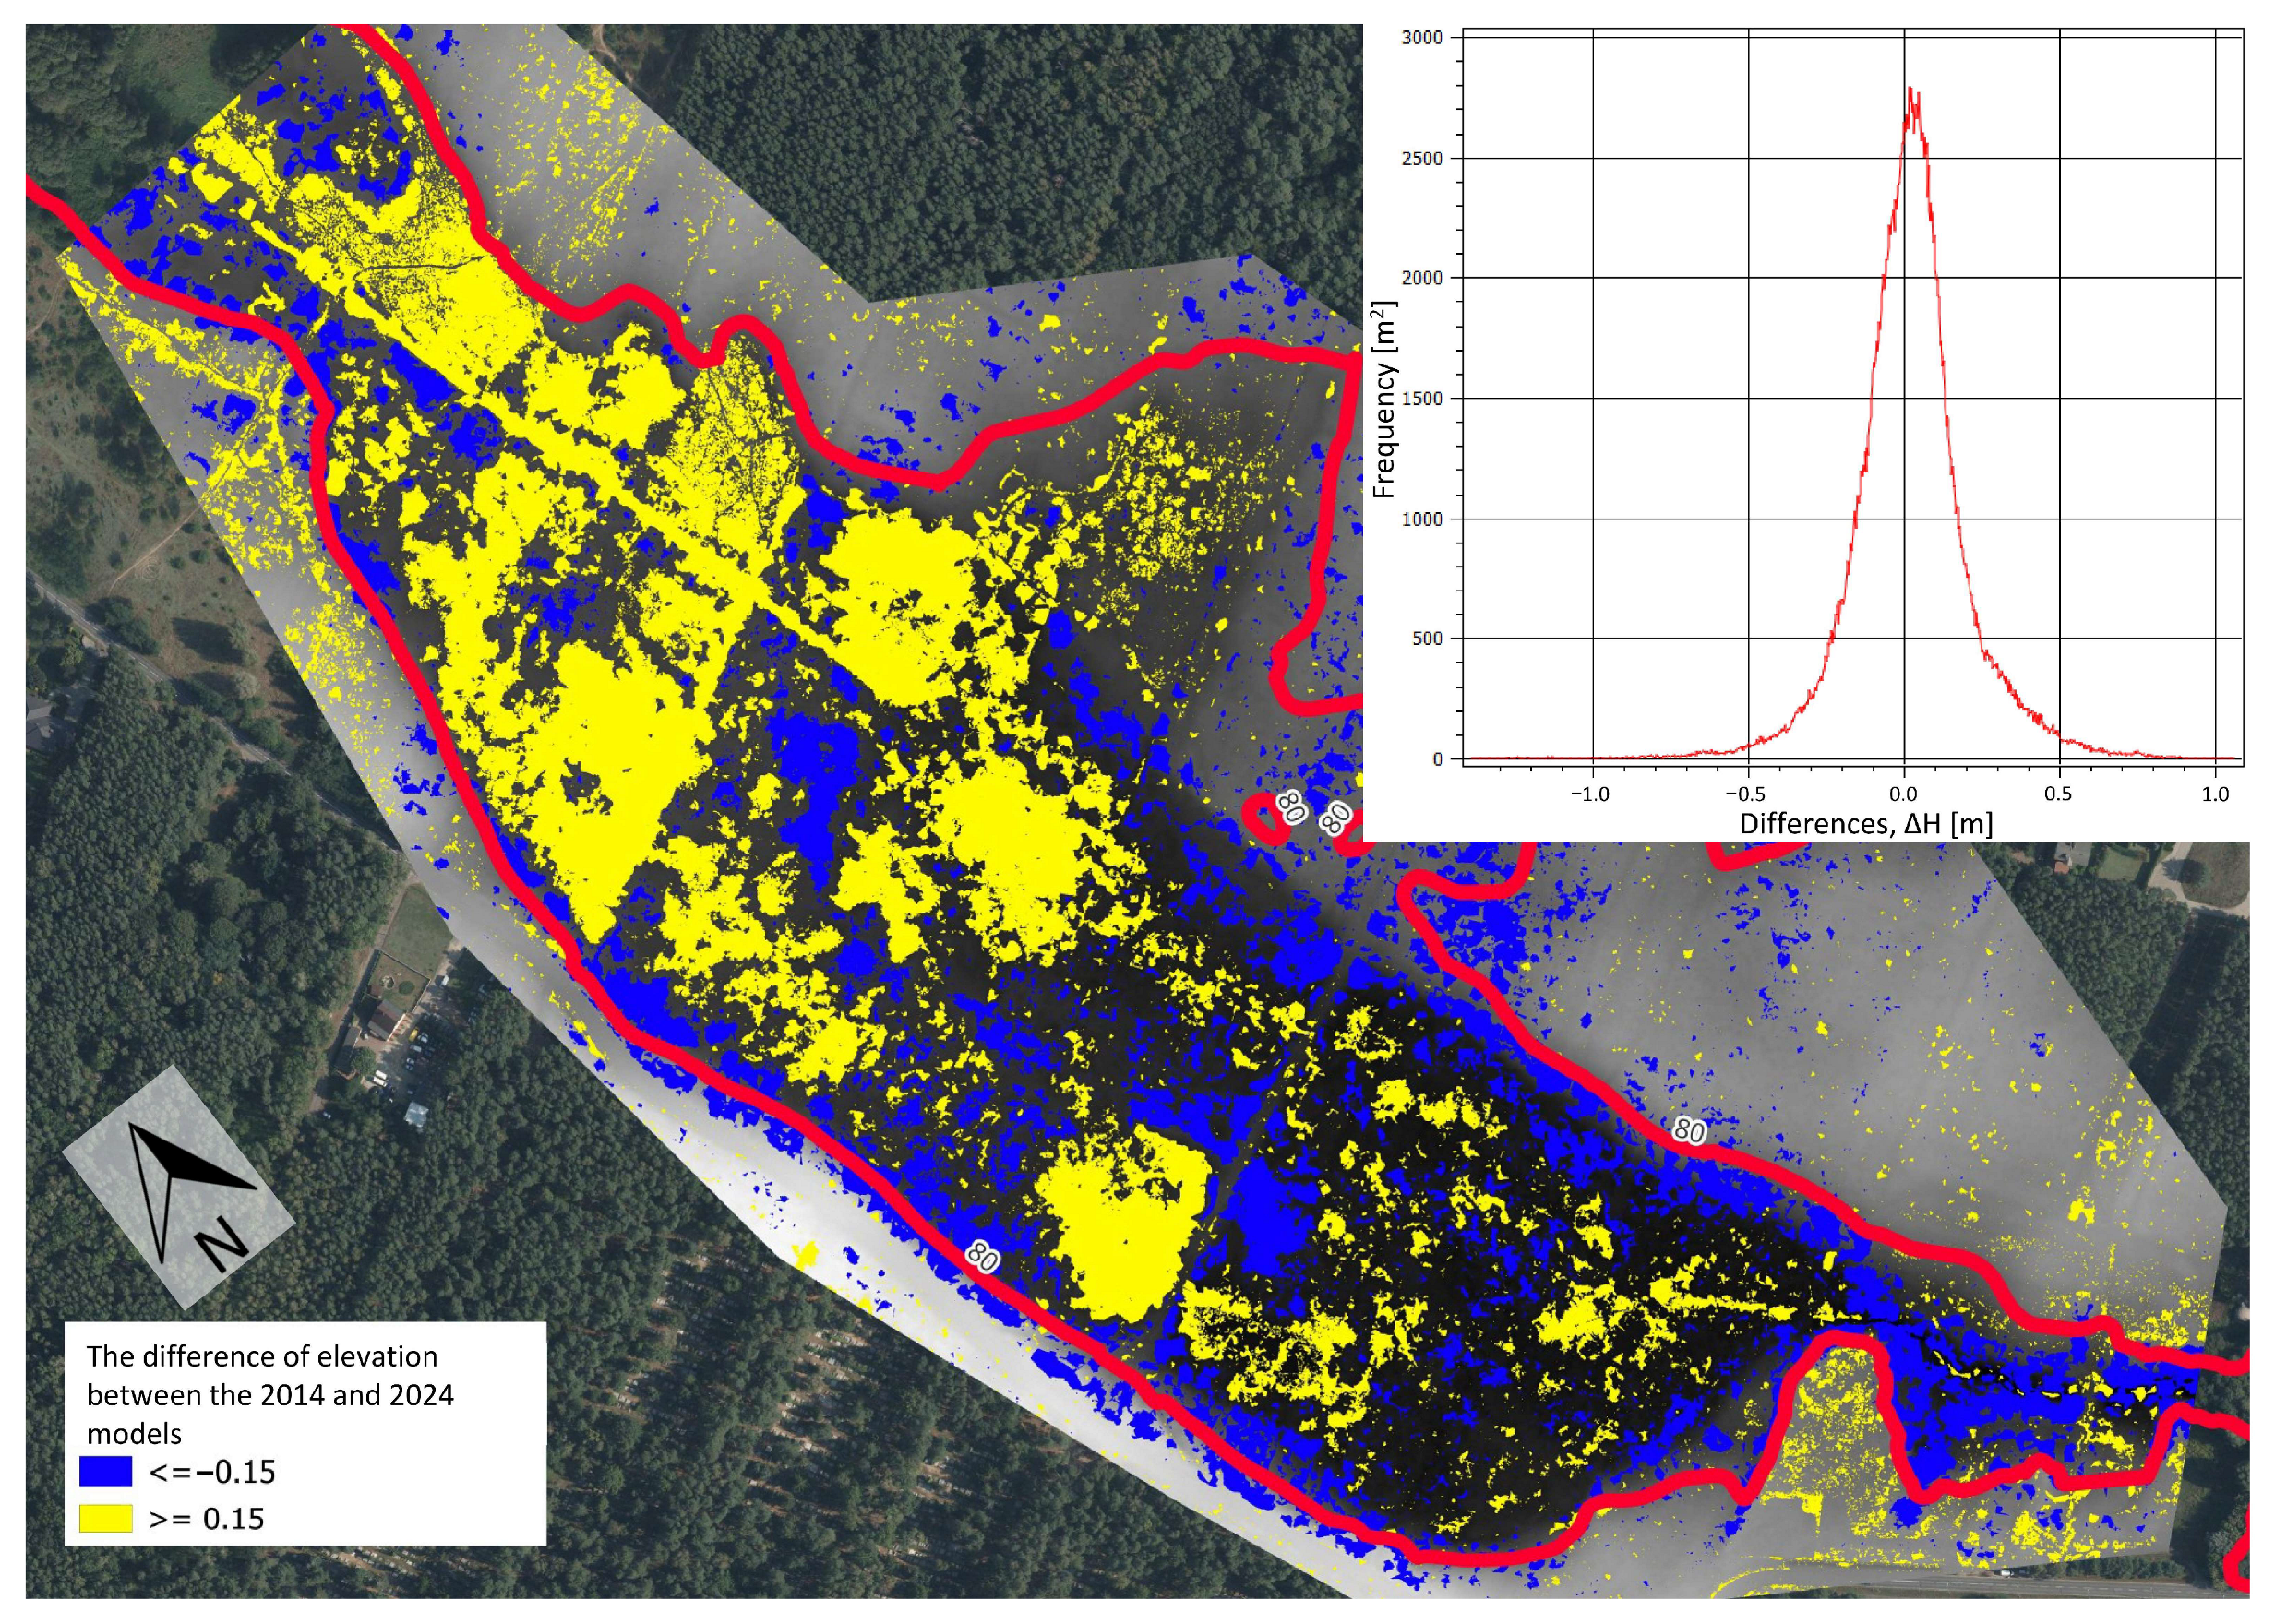
The analysis conducted during data processing revealed that the latest available maps and 2024 DTMs were subject to error. On the basis of the GPS RTK measurements performed in 2025, the differences and discrepancies with the 2024 DTM were verified. Differences ranging from 0.05 to 0.70 m were observed. These differences were caused by the laser reflection from the water’s surface in areas flooded as a result of beaver activity, and from the floating plants that formed ‘floating islands’ in the flooded area. The 2012 DTM was used solely as a reference terrain model representing conditions prior to the expansion of beaver activity and does not define the temporal scope of the field study. The 2012 DTM more accurately reflects the initial/actual conditions of this area (those prevailing prior to the expansion of the beaver colony in the analysed area). Conversely, the 2024 DTM incorporated changes in topography indirectly related to the activity of beavers and other animals (including the expansion of wetland habitat vegetation in the valley). In the majority of cases, the discrepancies occurred in the area inundated by the beaver impoundments (the area visible within the red outline in Figure 4). They were not recorded in the forested areas. This could have resulted from the employed ALS (above sea level) data acquisition technology (laser beam reflections from reeds and sedge vegetation, which, due to changes in moisture conditions caused by beaver activity, dominated the non-forested areas). Both models were compared, as depicted in the figure (Figure 4). The amplitude of the differences is 1.4 m, although in most cases the differences fluctuated between 0.15 and 0.30 m.

3.2. Extents of Beaver Impoundments

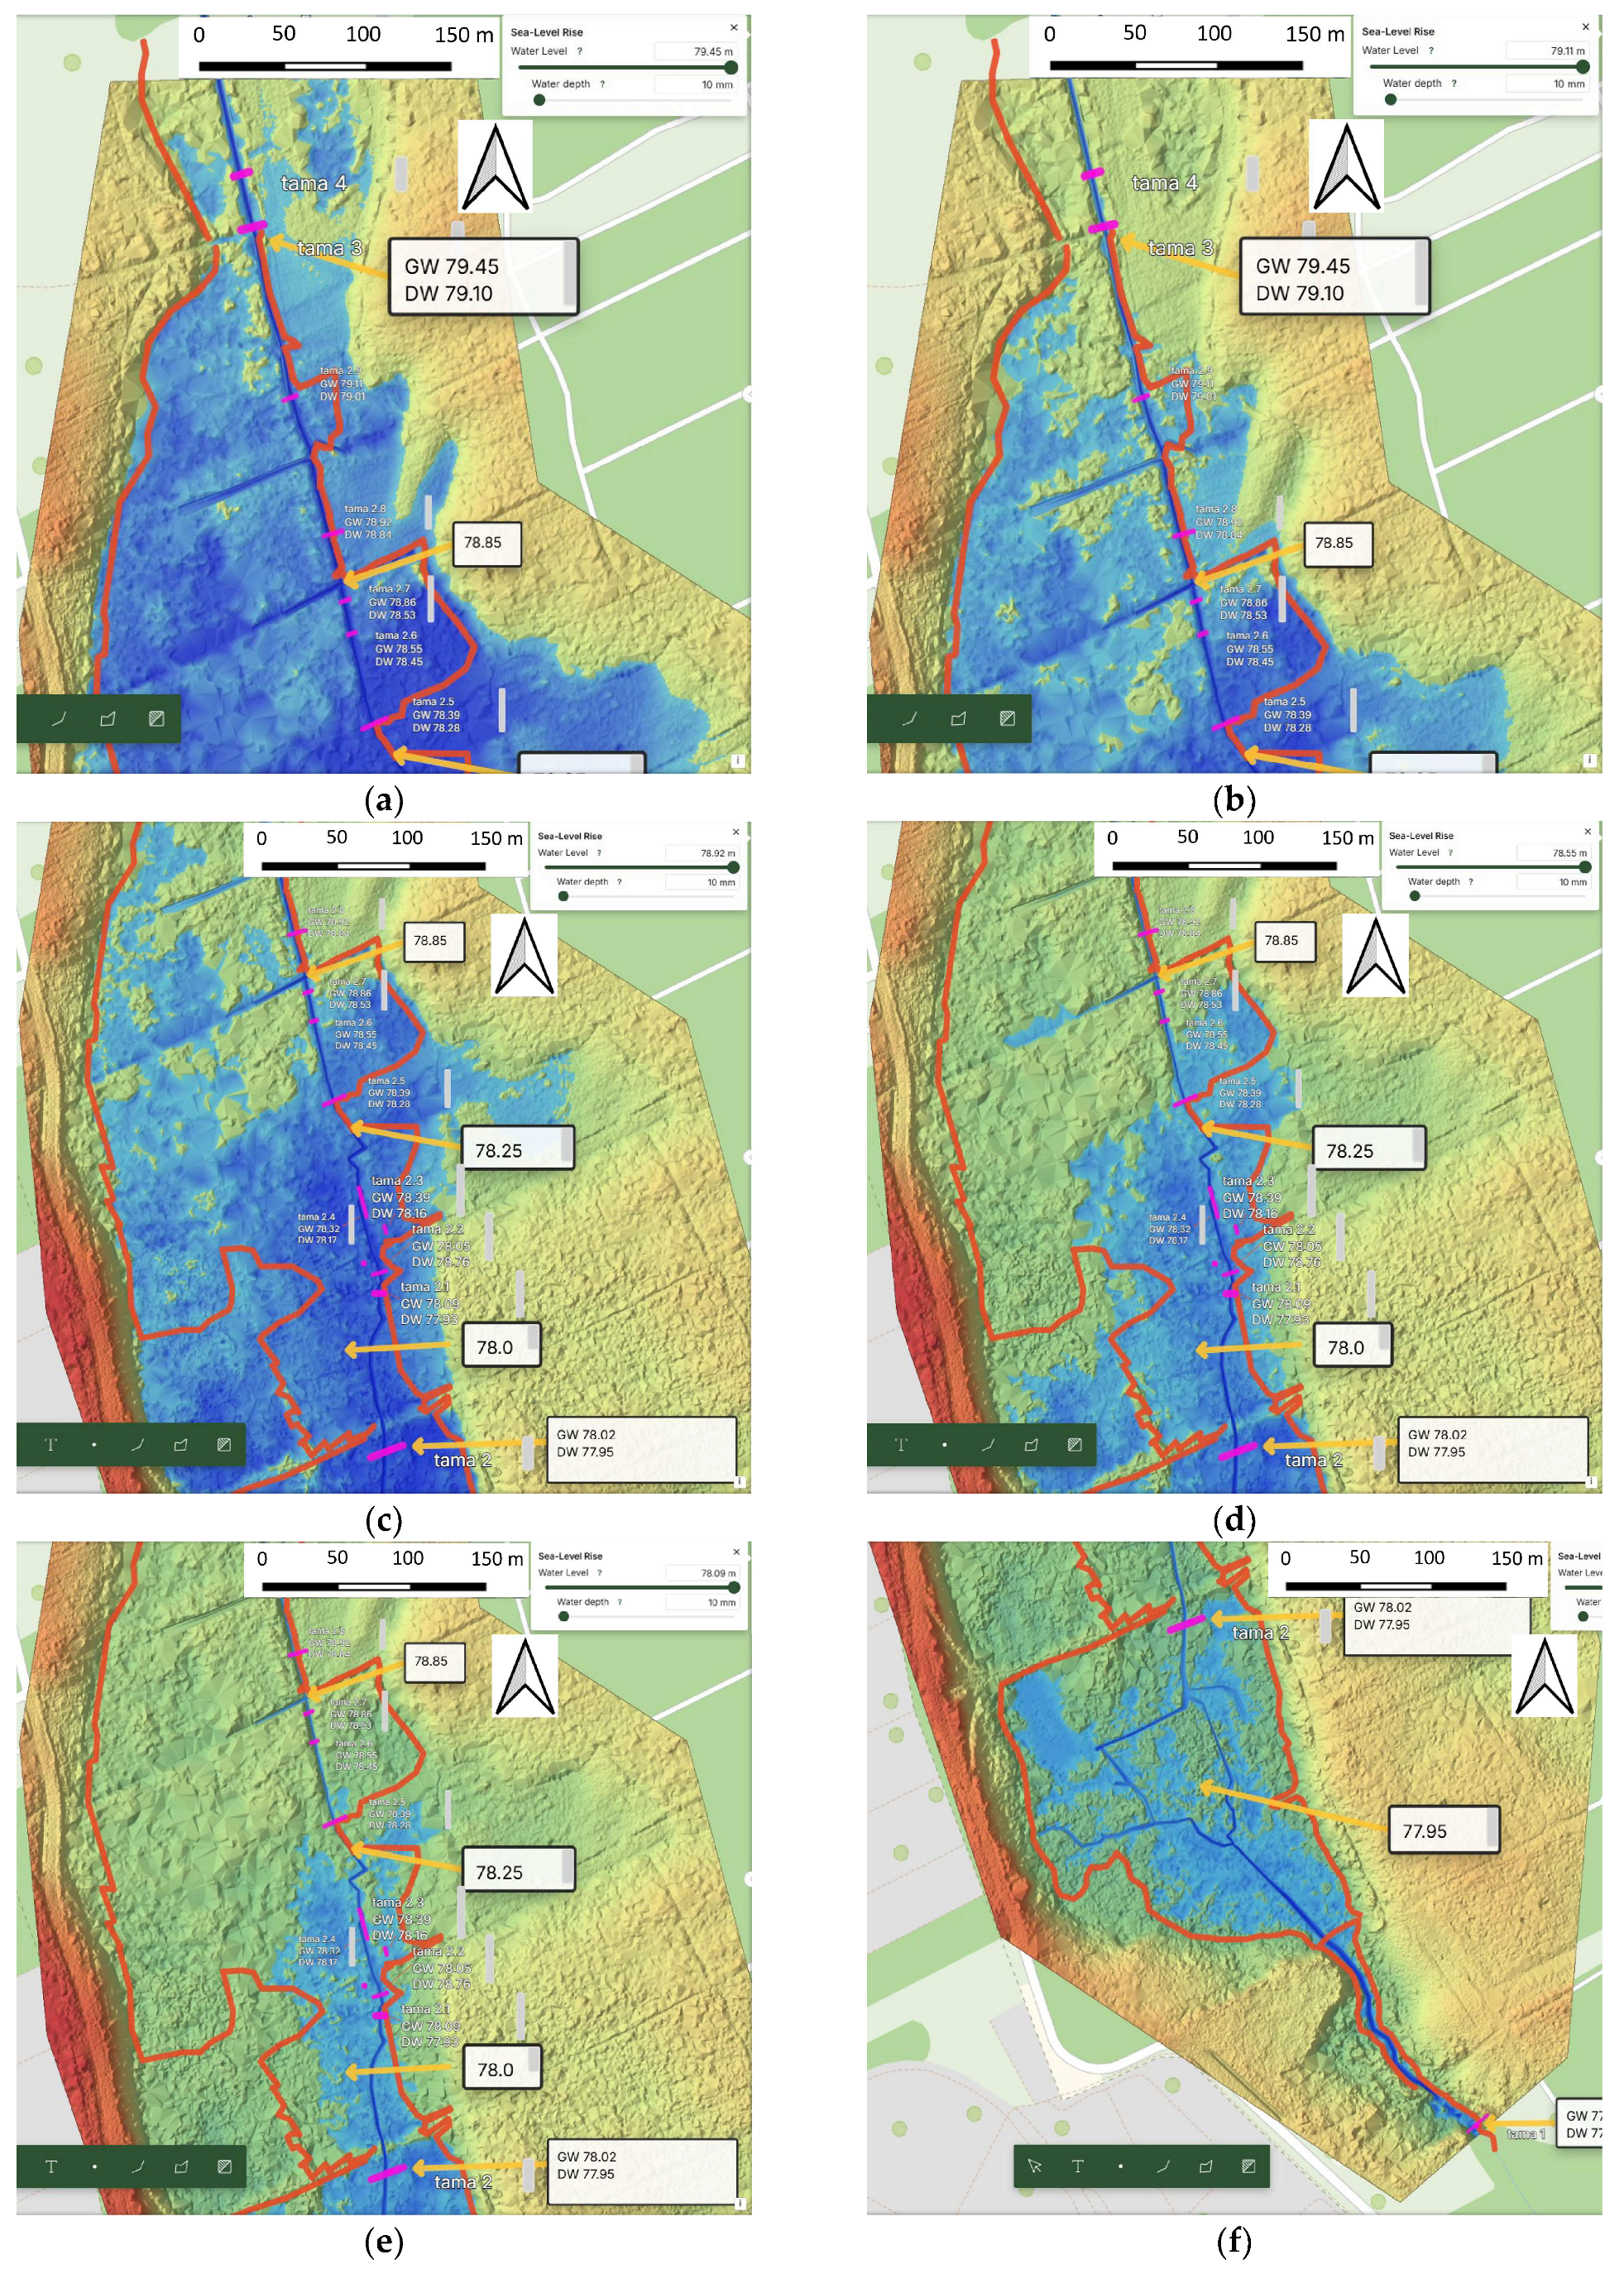
On the basis of the conducted field surveys, the areas inundated by individual beaver dams at their corresponding impoundment elevations were determined using the Scalgo Live software. The inundation extents for selected dams are presented in Figure 5a–f. Figure 5a presents the extent of the impact of dam 3, located at km 9 + 420. The effect of flow bypassing the dam from the eastern side and inundating the areas located downstream is visible, which may create a misleading impression that this area is under the influence of the impoundment of dam 2.9, located at km 9 + 320. Conversely, the impoundment extent presented in Figure 5b is considerably smaller and does not encompass the areas located northeast of the dam, which remain under the influence of dam 3.
Similar relationships were also observed in the case of subsequent dams. The extent of the impact of dam 2.8, presented in Figure 5c, indicates the possibility of water bypassing the embankment and slowly flowing through minor topographical depressions from the western side into the areas affected by dams 2.7 and 2.6 (Figure 5d), as well as structures located further downstream in the cascade. Dam 2.8 could thus affect an area up to 200% larger than the area upstream of its location, to the southwest of its location. In contrast, the impact extents of dams 2.4 (Figure 5e), 2.5, and 2.6 (Figure 5d), due to their low impoundment heights and the local topography, are of a more limited nature and do not cause such extensive spatial impacts. Figure 5f presents the extent of the impact of dam 1, located at km 8 + 480, the influence of which reaches as far as dam 2 at km 8 + 890.
The analysis of the impact extent of individual dams and the areas inundated as a result of their impoundment demonstrated that the unequivocal identification and separation of the influence of individual structures using the available tools is challenging, particularly when compared against the conditions observed in the field. In many cases, the modelled extent of the dams’ impact seemingly encompassed a larger area than was apparent from direct field observations. In reality, some of the inundations were associated with the impact of dams located upstream of the analysed structure.
This situation stems from the complex spatial interaction of the beaver dam cascade, the slow flow of water through subtle topographical depressions, the bypassing of local elevations, and potential water seepage through the ground. This set of interdependencies, observed in a flat valley terrain where a cascade of beaver dams operates, requires further research and a more detailed investigation of the hydrological and hydraulic processes.

3.3. HEC-RAS Modelling Results

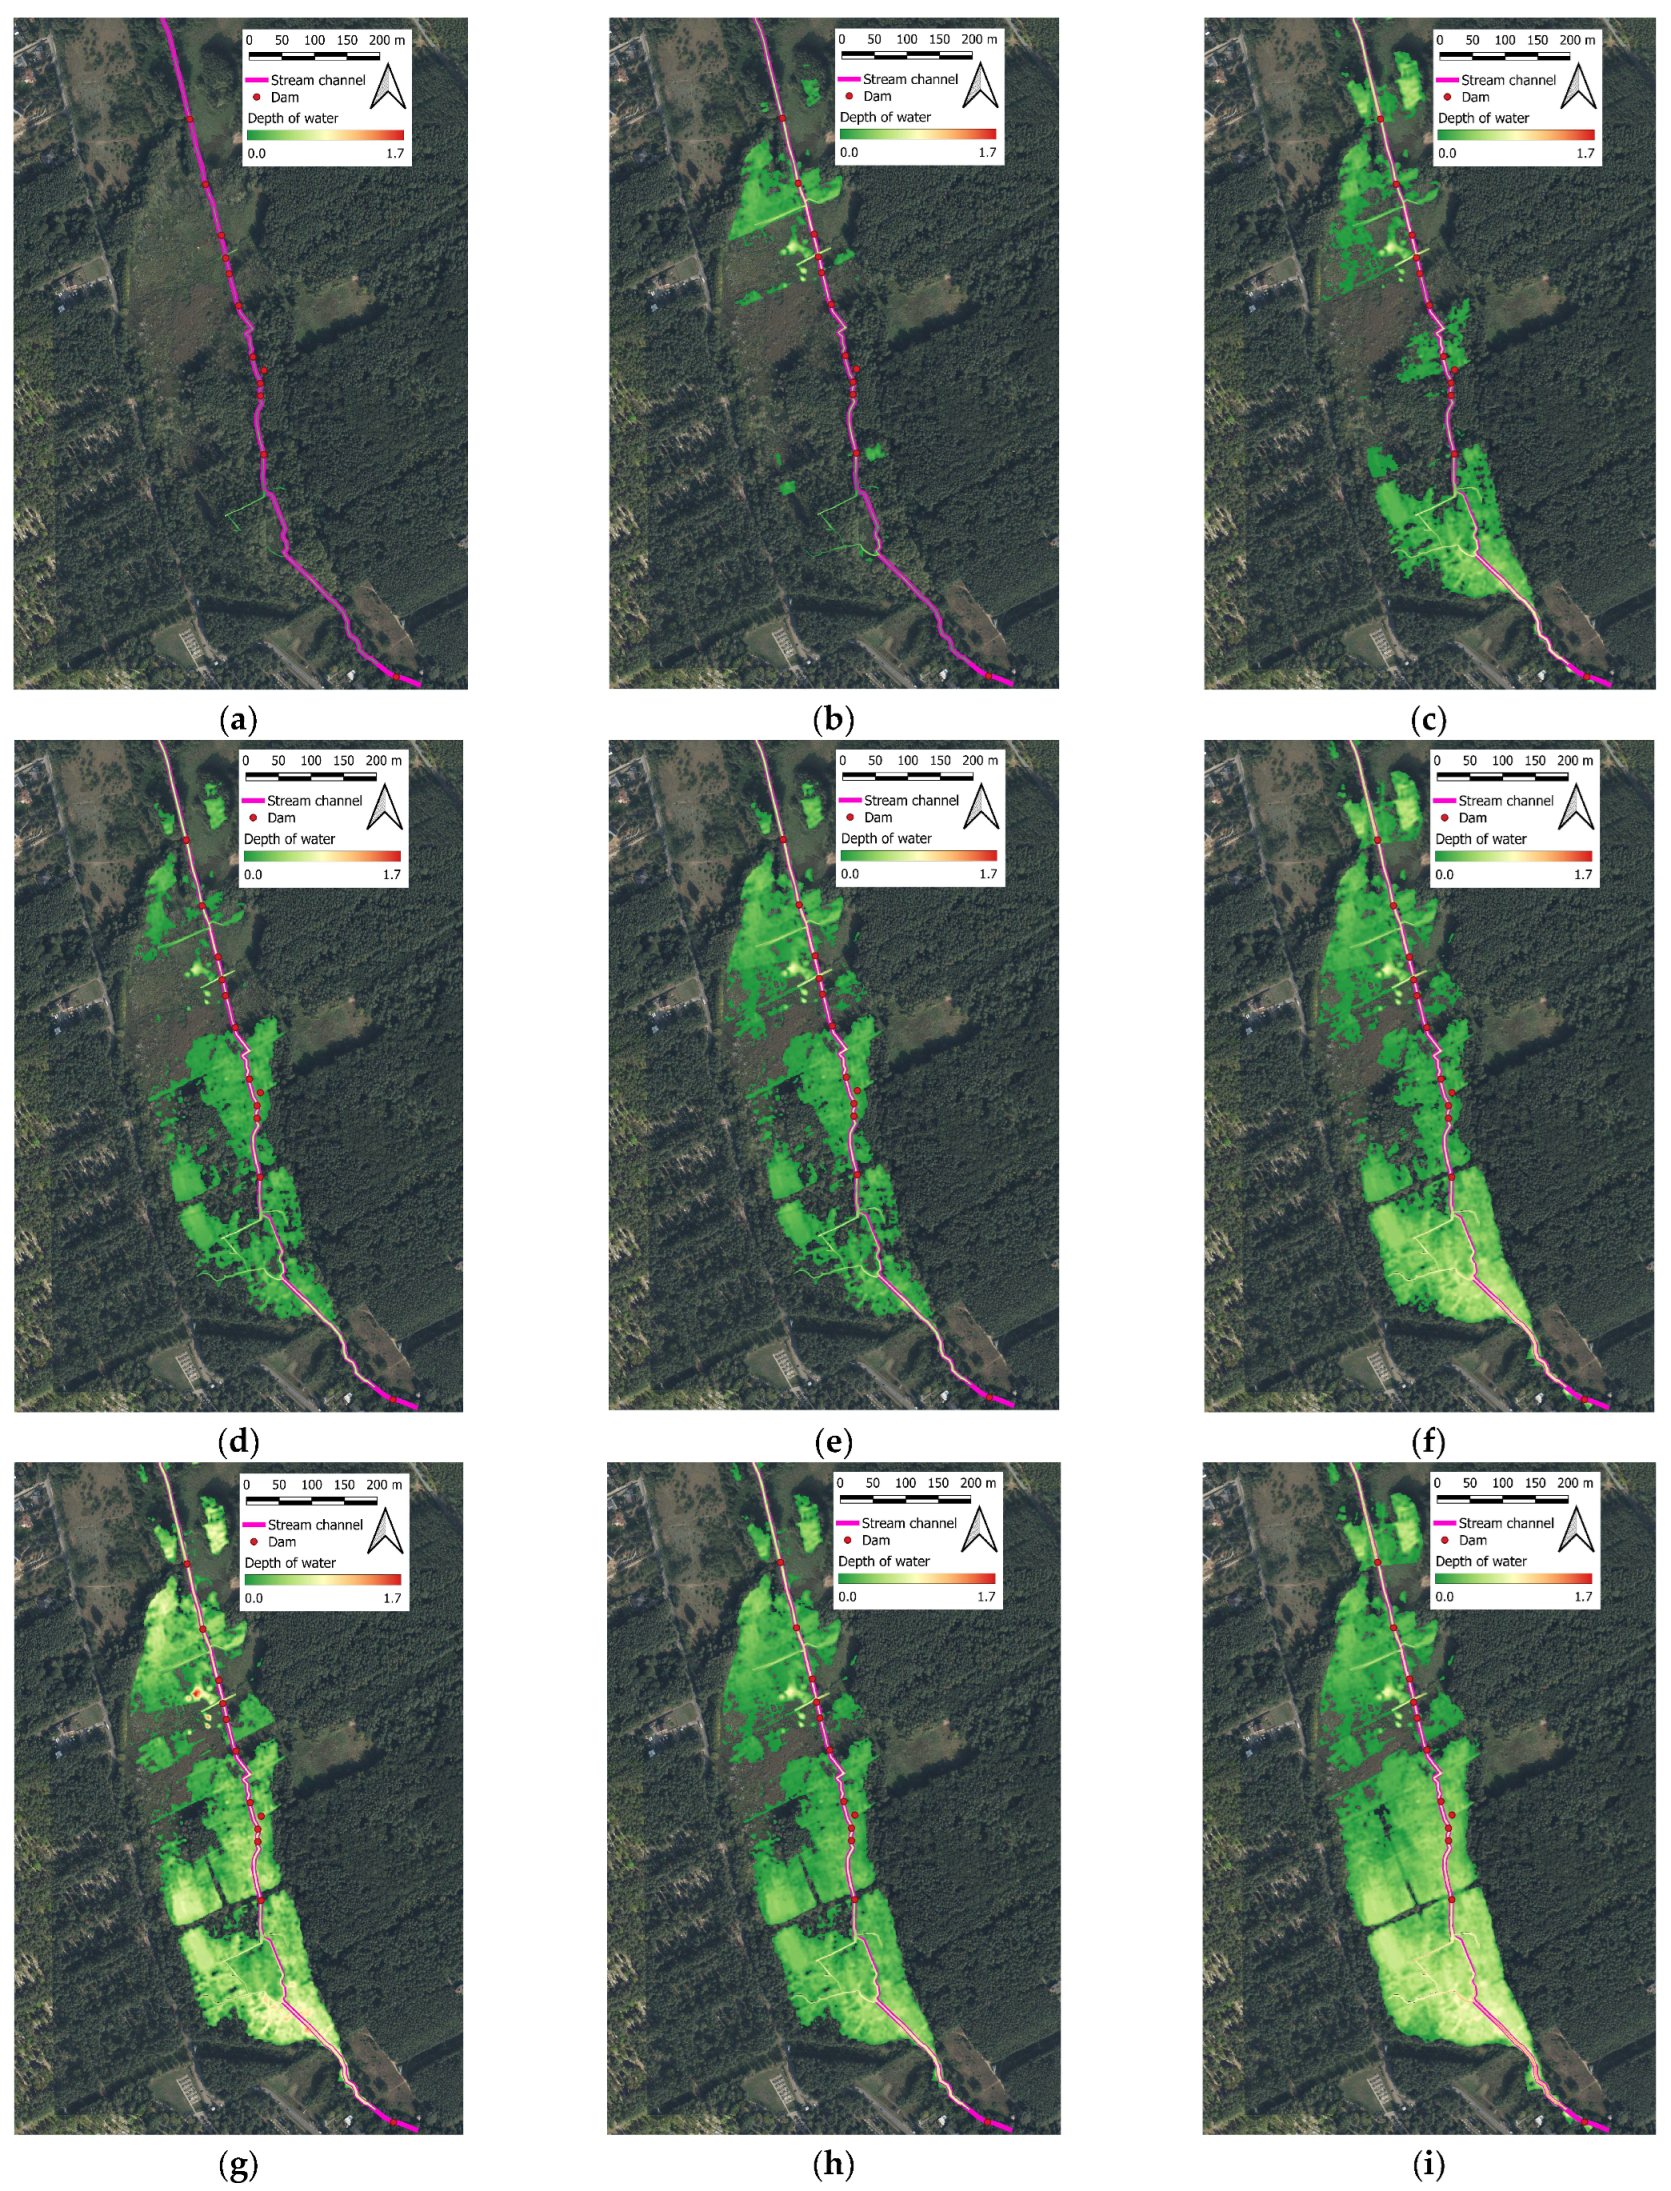
The calibrated model achieved an RMSE of 0.0488 m and an MAE of 0.0287 m for the comparison between modelled and observed water levels. Following model calibration, simulations were conducted for three scenarios and four different flow rates, resulting in a total of 12 simulations. The scenarios comprised three geometric configurations representing conditions prior to beaver expansion and following the colonisation of the Junikowski Stream valley by beavers. Scenario I did not include any dams—the baseline situation. In Scenario II, the model included the beaver dams inventoried in 2022 and two impounding weirs constructed during that period. Scenario III incorporated the beaver dams observed in 2025 during subsequent field surveys, as well as the functioning weirs. Figure 6 displays the depth distribution of retained water across the study area.
The figures in the first column (Figure 6a,d,g) present Scenario I—the baseline situation. In the case of the lowest flow, SSQ (average annual flow) (Figure 6a), there is virtually no water present on the floodplain. Water flow is confined strictly to the stream channel. The appearance of beaver dams (Figure 6b,c) causes water to spread locally across the floodplain to a depth of several centimetres (initially in the upper part of the valley), even at such a low discharge of 0.026 m3∙s−1. Further beaver expansion, with 12 dams in 2025 (Scenario III), leads to the intensification of this process and the emergence of backwaters across practically the entire study reach.
For the Q20% flow in the absence of dams (Figure 6d), the possibility of water overtopping the banks and inundating adjacent topographical depressions with a shallow layer of water reaching several centimetres was demonstrated. However, the impact of beaver dams (Figure 6e), particularly in the northern part of the investigated area, increases this extent. For the current dam configuration (Figure 6f), this phenomenon also intensifies in the southern part, where the inundation of a considerable area of the valley can be expected. In the final comparison for the Q5% flow (Figure 6g–i), which occurs once every 20 years, the spreading of water across almost the entire valley is already visible. Due to the limited capacity of the main channel, water already spreads in the baseline scenario, reaching an extent similar to that of the Q20% flow when beaver dams are included (Figure 6c,f). In the case of the Q5% flow, the impact of beaver dams on the inundation extent is considerably smaller than at lower flows, because even in the scenario without dams, water overtops the channel, inundating almost the entire valley. This applies to both the configuration of dams inventoried in 2022 (Figure 6h) and the current configuration from 2025 (Figure 6i), for which the differences in the inundation area compared to the scenario without dams are minor. However, beaver dams, particularly in Scenario III, continue to influence the depth distribution of water in the valley, causing a local increase in water depth in the vicinity of larger impoundments and locations with favourable topography. At the same time, the impact of small dams (intermediate dams 2.1–2.9) and low dams up to approximately 0.50 m in height (dams 2 and 3) diminishes with the occurrence of Q5% flood flows. Only large dams with a height of approximately 1 m or more, or those situated in specific areas of the valley, such as a natural valley narrowing (dam 1), exert a greater influence and sustain noticeable differences in depths relative to the conditions without the presence of beaver dams.
Based on the simulated water surface elevations and inundation extents, the water volume stored within the channel and adjacent inundated areas was calculated for each analysed steady-flow condition using the 2012 DTM. The values presented in Table 3 therefore describe the stored water volume corresponding to individual steady discharges. They should be interpreted as a steady-state measure of surface-water storage rather than as event-scale retention associated with the passage of a flood or rainfall-runoff hydrograph.
Water volumes are summarised for three scenarios: S I—a model excluding beaver dams, S II—a model with beaver dams inventoried in 2022, and S III—a model with beaver dams observed in 2025. The data in Table 3 indicate a noticeable impact of beaver dams on the volume of water stored along the investigated reach of the Junikowski Stream under steady-flow conditions. These differences are greatest at the lowest flows. The difference between S I and S II is 4593 m3, and between S II and S III an additional 6999 m3. At the SWQ flow, considerably smaller differences can be observed between the individual scenarios. The configuration of four small beaver dams increased the stored water volume by approximately 1129 m3, whereas the further beaver activity observed in 2025 increased it by an additional 6192 m3. At higher flows (Q20% and Q5%), the impact of the beaver dams in Scenario II diminishes. The small difference of 127 m3 between Scenarios I and II at Q5% indicates that the floodplain was already extensively inundated under baseline conditions, thereby limiting the additional storage effect of the relatively small 2022 dams. In contrast, for the fully developed cascade represented by Scenario III, the additional stored water volume relative to Scenario I is greatest under low-flow conditions, reaching 11,592 m3 at SSQ. At higher discharges, this difference decreases and remains within a relatively stable range of approximately 7300–8700 m3, indicating a plateau-like response rather than independence from flow rate.
The results demonstrate that beaver dams increase surface-water storage and modify the spatial distribution of water within the valley, particularly under low-flow conditions. Such prolonged surface-water presence may potentially enhance infiltration, subsurface water availability, and moisture conditions in adjacent habitats, as suggested by previous studies; however, these processes were not directly quantified in the present study. Therefore, their magnitude and ecological significance require further investigation using groundwater monitoring and coupled surface–subsurface modelling.

4. Discussion

The observed increase in surface-water storage and the spatial expansion of inundated areas are consistent with the global review by Grudziński et al. [52], who identified increased water storage as one of the most consistent hydrological responses to beaver-dam activity across different environmental settings. In the Junikowski Stream valley, these effects were particularly evident under low-flow conditions and were accompanied by lateral redistribution of water across the flat valley floor. From a broader systems perspective, urban water management should be considered as part of an interconnected infrastructure network, particularly under extreme-weather conditions. Recent studies highlight the importance of electricity–water interactions and show that drainage-system performance can influence the risk of power outages during intense rainfall [53,54] [Hua et al., 2025; Wang et al., 2026]. In this context, nature-based retention measures such as beaver dams may contribute to the broader resilience of urban infrastructure by temporarily storing water and delaying runoff. The results obtained for the Junikowski Stream align with the broader concept of beaver impact on the hydrological connectivity of river corridors. As indicated by Larsen et al. [55], beaver dams restrict the longitudinal connectivity of the stream, while simultaneously enhancing its lateral and vertical connectivity. This leads to the deceleration of runoff and the formation of ponds, wetlands, and transition zones between flowing and standing waters, as well as an increase in surface and subsurface water resources; the accumulation of sediment, carbon, and nutrients; and an increase in habitat complexity. In urban conditions, increasing lateral connectivity and the temporary retention of water in the valley are of particular importance, which, as emphasised by Mason [56], is essential for enhancing the ecosystem services of rivers and their resilience to increasingly frequent hydrological extremes. Similar patterns of lateral surface-water redistribution were observed in the Junikowski Stream valley, where beavers utilised the old network of drainage ditches and local topographical depressions to increase the impact extent of the impoundments. As a result, the water retained by the dams was not confined solely to the main channel, but spread laterally, feeding the former ditches, terrain depressions, and wetland zones. Even at low flows, significant water impoundment, an increase in local retention, and the formation of wetland zones, along with small ponds in places outside the main stream, were observed. The formation of new wetland areas may also have biogeochemical implications, including the potential retention of nutrients and particle-bound contaminants, such as heavy metals, delivered with urban runoff. However, these processes were not investigated in the present study and require dedicated water-quality and sediment analyses. These observations suggest that beaver activity may locally counteract some of the hydrological effects of previous valley drainage and contribute to spontaneous hydrological restoration in the urban landscape.
An important issue regarding retention on small streams such as the Junikowski Stream is the possibility of supporting or replacing natural beaver dams with structures known as Beaver Dam Analogues (BDAs). These are partially permeable, typically biodegradable structures that mimic or enhance the effects of beaver dams. Pilliod [57] indicated that both natural dams and beaver dam-inspired structures can increase the area of standing waters, backwaters, and side channels. This approach was applied on the Junikowski Stream, where two low, permanent wooden impounding weirs were installed in 2022 after the appearance of the first beaver dams. Their purpose was to reinforce and stabilise the beaver impoundments and, in the event of their degradation or destruction, to partially assume their functions. In the present study, artificial impounding structures were included together with beaver dams in Scenarios II and III. Therefore, their isolated hydraulic contribution cannot be quantified from the present simulations, and their role should be interpreted as complementary rather than independently assessed. Observations regarding the functioning of these weirs correlate with the findings of Pilliod [57], who emphasises that the choice between wooden structures, low stone weirs, or other forms of retention enhancement should be dictated by local objectives and field conditions. Conversely, Burgher [58] draw attention to the need for long-term monitoring, as the durability of the effects of reintroducing or supporting beaver activity is not always certain.
The research results along the reach of the Junikowski Stream confirmed that beavers can support the restoration of hydrological and ecological processes, but they are unable to independently reverse the effects of centuries of river channel modifications. Caution must also be exercised in evaluating the effectiveness of beavers as a restoration tool. Wohl [59] points out that questions remain open regarding the extent of actions necessary to genuinely restore river processes in highly modified catchments, including urban catchments. Similarly, Marshall [60] emphasises that the reintroduction of beavers or the mimicking of their activity may yield different effects depending on the location within the catchment, valley geometry, and geographical region [61].
The ability to quantitatively predict the effects of impoundments at the catchment scale also remains an important limitation [62]. Hydrodynamic modelling is an essential tool for such research [63,64]. Wohl and Inamdar [65] indicate that despite numerous local studies, it remains difficult to forecast the effects of a cascading system of beaver dams under conditions of highly dynamic hydromorphological changes. In the present study, this limitation was partly addressed by integrating historical terrain information with repeated high-accuracy RTK surveys and hydraulic modelling. The 2012 DTM provided a reference surface representing conditions prior to the expansion of beaver activity, while RTK measurements were used to verify and locally correct channel geometry, dam elevations, culverts, and water-surface levels. This combination reduced uncertainties associated with terrain representation and enabled the hydraulic consequences of different beaver-dam configurations to be assessed within a consistent spatial framework. Hill et al. [63] demonstrate that 2D models are currently gaining in importance; however, the majority of them have thus far been applied in small catchments of less than 100 km2 and primarily to assess the local impact of beaver impoundments [66,67]. In less complex cases, 1D models are still widely used [26]. However, the 1D formulation represents flow along a predefined longitudinal direction and aggregates hydraulic properties across individual cross-sections. As a result, lateral momentum and spatial redistribution of shallow flow across the floodplain are not explicitly resolved. This is an important limitation in the flat wetland sections of the Junikowski Stream valley, where water may spread slowly in several lateral directions and bypass individual beaver dams through local depressions and drainage pathways. Therefore, the 1D model should be interpreted as a tool for assessing the longitudinal hydraulic response and modelled surface-water storage rather than as a detailed representation of the spatial dynamics of floodplain flow. The application of the one-dimensional HEC-RAS model in the present study is therefore justified by the scale of the analysed stream, the availability of field data, and the objective of the study, which was to assess changes in water levels, the impact extent of the impoundments, and the modelled surface-water storage. Seasonal vegetation variability represents an additional source of uncertainty because it directly affects hydraulic roughness and the adopted Manning’s coefficients. Dense summer vegetation may increase flow resistance, water levels, and modelled surface-water storage, whereas reduced winter vegetation may have the opposite effect. Therefore, the calculated storage volumes should also be interpreted in relation to the seasonal state of vegetation [68,69,70].
A further limitation of the present analysis is the use of steady-flow simulations for characteristic and probability discharges. In reality, the passage of an unsteady flood wave may produce rapidly changing water levels, stresses associated with the reaction of the stream to the dam that are not represented in the current model. Previous event-based modelling has shown that the influence of beaver-dam cascades on flood peaks is strongly dependent on event magnitude and local topography, while dam-break processes remain difficult to quantify because of limited information on dam stability [26]. Under such transient conditions, the most fragile beaver dams may be damaged or breached, potentially reducing their temporary storage effect and altering inundation patterns. Consequently, the results obtained for higher discharges should be interpreted as steady-state hydraulic responses rather than as predictions of dam performance during the passage of a flood wave. The research results indicate that beaver dams in the Junikowski Stream valley can be regarded as natural or semi-natural features supporting retention and sustainable water management in the urban landscape. These benefits must, however, be balanced against potential local infrastructure impacts. At km 8 + 890, beaver-induced backwater may prolong waterlogging near the service-road embankment and potentially affect drainage efficiency and embankment stability, which justifies regular monitoring of this location. At the same time, their impact should be managed adaptively, taking into account local hydraulic, environmental, and social conditions. For the Junikowski Stream, such adaptive management could include annual topographic and beaver-dam surveys, regular inspection of culverts and embankments, monitoring of upstream water levels, and selective partial removal or lowering of individual dams where backwater effects threaten drainage capacity or infrastructure safety. Such an approach aligns with the principles of the sustainable management of urban river valleys and the concept of Nature-Based Solutions.

5. Conclusions

The hydraulic effect of beaver dams was strongly dependent on discharge. In the most developed dam configuration, the modelled additional surface-water storage relative to the no-dam scenario reached 11.592 m3 under SSQ conditions and remained within approximately 7300–8700 m3 at higher discharges. Larger structures and dams located in natural valley narrowings remained hydraulically relevant over a wider range of flows, indicating that both dam size and local valley morphology control the magnitude of their impact.
The results therefore indicate that the principal hydrological function of the beaver-dam cascade is associated with increasing local surface-water storage and redistributing water within the valley, particularly during low-flow periods. These effects may support wetter habitat conditions and urban blue-green infrastructure, although habitat moisture and water residence time were not directly quantified in this study.
The specific contribution of this study lies in the application of an integrated field-survey, terrain-analysis, GIS, and HEC-RAS modelling framework to a highly urbanized small stream undergoing rapid hydromorphological change associated with beaver activity. An important element of the study was the comparison of beaver-dam configurations from different years, which made it possible to capture the dynamic nature of beaver activity and its changing hydraulic influence within a flat urban wetland valley.
The obtained results have practical significance for sustainable stormwater management, the restoration of urban streams, and the planning of climate change adaptation measures. They indicate that, under appropriate local conditions, beaver dams can be regarded as an effective Nature-Based Solution supporting local surface-water storage, the improvement of habitat conditions, and the mitigation of the effects of water deficits. The results do not indicate that the artificial wooden weirs are indispensable for achieving the local resilience objectives of the Junikowski Stream valley. Beaver activity alone substantially modifies water levels, inundation extent, and surface-water storage, particularly under low-flow conditions. The wooden weirs should therefore be regarded as complementary structures that may partly maintain these functions if natural beaver dams are degraded, abandoned, or removed. The comparison of the 2022 and 2025 surveys also shows that natural beaver dams are temporally variable and potentially fragile structures, whose location, dimensions, and hydraulic function may change substantially over time. At the same time, their utilisation in urban spaces requires monitoring, the assessment of the risk of conflicts with infrastructure, and flexible management that takes into account the variability in the location, durability, and height of the impoundments. For the crossing at km 8 + 890, regular inspection of culvert conveyance, inlet and outlet blockage, upstream water levels, and the condition of the road embankment is recommended, particularly during periods of increased beaver activity.
The research conducted on the Junikowski Stream indicates that beaver activity should not be perceived solely as a maintenance issue, but also as a potential component of an urban hydrological adaptation strategy. The incorporation of natural beaver impoundments into the system of retention measures can support the more sustainable management of small urban streams, provided that further research is conducted on their durability, water quality, biodiversity, and infrastructure safety. Future studies should also include continuous water-level monitoring, for example using limnigraphs, to quantify the actual flow-attenuation and storage dynamics of beaver impoundments during storm events.
The combined use of field surveys, high-resolution terrain data, GIS-based spatial analysis, and HEC-RAS modelling also provides a transferable methodological framework that can be replicated in other highly urbanized small catchments in Eastern Europe, provided that comparable topographic and hydrological data are available.

Author Contributions

Conceptualization, T.K., S.Z. and M.H.; methodology, T.K., S.Z., M.P. and M.H.; software, T.K., M.H., M.P., M.R., M.W. and S.Z.; validation, T.K., M.H., T.T. and S.Z.; formal analysis, T.K., S.Z., M.W., M.R. and M.H.; investigation, S.Z., T.K., T.T. and M.H.; resources, T.K., S.Z., M.P. and M.W.; writing—original draft preparation, T.K., M.H., M.P. and S.Z.; writing—review and editing, T.K., M.H. and S.Z.; visualisation, T.K., M.P., M.H., MP., M.R. and S.Z.; supervision, T.K., T.T. and M.H.; project administration, T.K.; funding acquisition, S.Z. and T.K. All authors have read and agreed to the published version of the manuscript.

Funding

The research was co-founded by the National Science Centre of Poland within the PRELUDIUM project (No. 2021/41/N/ST10/02490): “Evaluation of a zoogenic factor in the modification of environmental, retention and hydromorphological conditions in small lowland watercourses based on the action of beavers (Castor fiber)” (2022–2025).

Institutional Review Board Statement

Not applicable.

Informed Consent Statement

Not applicable.

Data Availability Statement

The original contributions presented in this study are included in the article. Further inquiries can be directed to the corresponding author.

Conflicts of Interest

Michał Woźniak is employed by Sweco Polska Sp. z o.o. The company had no role in the design of the study; in the collection, analysis, or interpretation of data; in the preparation of the manuscript; or in the decision to publish the results. The remaining authors declare no conflicts of interest.

References

  1. Brazier, R.E.; Puttock, A.; Graham, H.A.; Auster, R.E.; Davies, K.H.; Brown, C.M.L. Beaver: Nature’s Ecosystem Engineers. WIREs Water 2021, 8, e1494. [Google Scholar] [CrossRef] [Scilit]
  2. Kleinschroth, F. Zurich’s Urban Beavers Are Crowd-pleasers. Front. Ecol. Environ. 2022, 20, 369. [Google Scholar] [CrossRef] [Scilit]
  3. Auster, R.E.; Puttock, A.K.; Barr, S.W.; Brazier, R.E. Learning to Live with Reintroduced Species: Beaver Management Groups Are an Adaptive Process. Restor. Ecol. 2023, 31, e13899. [Google Scholar] [CrossRef] [Scilit]
  4. Serva, D.; Biondi, M.; Iannella, M. The Eurasian Beaver Range Expansion Reveals Uneven Future Trends and Possible Conservation Issues: An European Assessment. Biodivers. Conserv. 2023, 32, 1999–2016. [Google Scholar] [CrossRef] [Scilit]
  5. Kałuża, T.; Sojka, M.; Wróżyński, R.; Jaskuła, J.; Zaborowski, S.; Hämmerling, M. Modeling of River Channel Shading as a Factor for Changes in Hydromorphological Conditions of Small Lowland Rivers. Water 2020, 12, 527. [Google Scholar] [CrossRef] [Scilit]
  6. Puttock, A.; Graham, H.A.; Ashe, J.; Luscombe, D.J.; Brazier, R.E. Beaver Dams Attenuate Flow: A Multi-site Study. Hydrol. Process. 2021, 35, e14017. [Google Scholar] [CrossRef] [Scilit]
  7. Mazur, R.; Kałuża, T.; Chmist, J.; Walczak, N.; Laks, I.; Strzeliński, P. Influence of Deposition of Fine Plant Debris in River Floodplain Shrubs on Flood Flow Conditions—The Warta River Case Study. Phys. Chem. Earth Parts A/B/C 2016, 94, 106–113. [Google Scholar] [CrossRef] [Scilit]
  8. Gorczyca, E.; Radecki-Pawlik, A.; Krzemień, K. (Eds.) Procesy Fluwialne a Utrzymanie Rzek i Potoków Górskich; Instytut Geografii i Gospodarki Przestrzennej UJ: Kraków, Poland, 2021. [Google Scholar]
  9. Pollock, M.M.; Beechie, T.J.; Wheaton, J.M.; Jordan, C.E.; Bouwes, N.; Weber, N.; Volk, C. Using Beaver Dams to Restore Incised Stream Ecosystems. BioScience 2014, 64, 279–290. [Google Scholar] [CrossRef] [Scilit]
  10. Kałuża, T.; Hämmerling, M.; Zaborowski, S.; Pawlak, M. Beaver Dams as a Significant Factor in Shaping the Hydromorphological and Hydrological Conditions of Small Lowland Streams. Sustainability 2025, 17, 3317. [Google Scholar] [CrossRef] [Scilit]
  11. Fairfax, E.; Westbrook, C. The Ecology and Evolution of Beavers: Ecosystem Engineers That Ameliorate Climate Change. Annu. Rev. Ecol. Evol. Syst. 2024, 55, 323–345. [Google Scholar] [CrossRef] [Scilit]
  12. Georgescu, L.P.; Balsalobre-Lorente, D.; Zlati, M.L.; Fortea, C.; Antohi, V.; Barbuta-Misu, N. Cluster Analysis of the Transition to Climate Neutrality in the European Union. Sustain. Dev. 2025, 33, 1498–1519. [Google Scholar] [CrossRef] [Scilit]
  13. Pińskwar, I. Complex Changes of Extreme Precipitation in the Warming Climate of Poland. Intl. J. Climatol. 2022, 42, 817–833. [Google Scholar] [CrossRef] [Scilit]
  14. Pińskwar, I.; Choryński, A.; Kundzewicz, Z.W. Severe Drought in the Spring of 2020 in Poland—More of the Same? Agronomy 2020, 10, 1646. [Google Scholar] [CrossRef] [Scilit]
  15. Kalbarczyk, R.; Kalbarczyk, E. Risk of Natural Hazards Caused by Extreme Precipitation in Poland in 1951–2020. Water 2024, 16, 1705. [Google Scholar] [CrossRef] [Scilit]
  16. Puttock, A.; Graham, H.A.; Cunliffe, A.M.; Elliott, M.; Brazier, R.E. Eurasian Beaver Activity Increases Water Storage, Attenuates Flow and Mitigates Diffuse Pollution from Intensively-Managed Grasslands. Sci. Total Environ. 2017, 576, 430–443. [Google Scholar] [CrossRef] [Scilit]
  17. Jordan, C.E.; Fairfax, E. Beaver: The North American Freshwater Climate Action Plan. WIREs Water 2022, 9, e1592. [Google Scholar] [CrossRef] [Scilit]
  18. Szałkiewicz, E.; Kałuża, T.; Grygoruk, M. Environmental Flows Assessment for Macroinvertebrates at the River Reach Scale in Different Degrees of Hydromorphological Alteration. Front. Environ. Sci. 2022, 10, 866526. [Google Scholar] [CrossRef] [Scilit]
  19. Auster, R.E.; Puttock, A.; Brazier, R. Unravelling Perceptions of Eurasian Beaver Reintroduction in Great Britain. Area 2020, 52, 364–375. [Google Scholar] [CrossRef] [Scilit]
  20. Gorczyca, E.; Krzemień, K.; Sobucki, M.; Jarzyna, K. Can Beaver Impact Promote River Renaturalization? The Example of the Raba River, Southern Poland. Sci. Total Environ. 2018, 615, 1048–1060. [Google Scholar] [CrossRef] [Scilit]
  21. Baker, V.R. Geomorphological Understanding of Floods. Geomorphology 1994, 10, 139–156. [Google Scholar] [CrossRef] [Scilit]
  22. Campbell-Palmer, R.; Puttock, A.; Wilson, K.A.; Leow-Dyke, A.; Graham, H.A.; Gaywood, M.J.; Brazier, R.E. Using Field Sign Surveys to Estimate Spatial Distribution and Territory Dynamics Following Reintroduction of the Eurasian Beaver to British River Catchments. River Res. Apps 2021, 37, 343–357. [Google Scholar] [CrossRef] [Scilit]
  23. Macfarlane, W.W.; Wheaton, J.M.; Bouwes, N.; Jensen, M.L.; Gilbert, J.T.; Hough-Snee, N.; Shivik, J.A. Modeling the Capacity of Riverscapes to Support Beaver Dams. Geomorphology 2017, 277, 72–99. [Google Scholar] [CrossRef] [Scilit]
  24. Graham, H.A.; Puttock, A.; Macfarlane, W.W.; Wheaton, J.M.; Gilbert, J.T.; Campbell-Palmer, R.; Elliott, M.; Gaywood, M.J.; Anderson, K.; Brazier, R.E. Modelling Eurasian Beaver Foraging Habitat and Dam Suitability, for Predicting the Location and Number of Dams throughout Catchments in Great Britain. Eur. J. Wildl. Res. 2020, 66, 42. [Google Scholar] [CrossRef] [Scilit]
  25. Ronnquist, A.L.; Westbrook, C.J. Beaver Dams: How Structure, Flow State, and Landscape Setting Regulate Water Storage and Release. Sci. Total Environ. 2021, 785, 147333. [Google Scholar] [CrossRef] [Scilit]
  26. Neumayer, M.; Teschemacher, S.; Schloemer, S.; Zahner, V.; Rieger, W. Hydraulic Modeling of Beaver Dams and Evaluation of Their Impacts on Flood Events. Water 2020, 12, 300. [Google Scholar] [CrossRef] [Scilit]
  27. Auster, R.E.; Barr, S.W.; Brazier, R.E. Beavers and Flood Alleviation: Human Perspectives from Downstream Communities. J. Flood Risk Manag. 2022, 15, e12789. [Google Scholar] [CrossRef] [Scilit]
  28. Ciach, M.; Wrazidło, D.; Fedyń, I. Ecosystem Engineers Enter the City: Habitat Characteristics Influencing the Distribution of Eurasian Beavers Castor Fiber in a Human-Transformed Landscape. Landsc. Urban Plan. 2023, 240, 104893. [Google Scholar] [CrossRef] [Scilit]
  29. Edejer, S.R.; Haase, D.; Dennis, M.; Larsen, A. Ten Steps towards Integrated Decision Making for Ecological Restoration in Cities: Rewilding the European beaver (Castor fiber) in Berlin, Germany. MethodsX 2024, 13, 102827. [Google Scholar] [CrossRef] [Scilit]
  30. Rurek, M. Characteristics of Beaver Ponds and Landforms Induced by Beaver Activity, S Part of the Tuchola Pinewoods, Poland. Water 2021, 13, 3641. [Google Scholar] [CrossRef] [Scilit]
  31. Hämmerling, M.; Kałuża, T.; Zawadzki, P.; Zaborowski, S.; Sojka, M.; Liberacki, D.; Ptak, M. Application of Multi-Criteria Analytic Methods in the Assessment of the Technical Conditions of Small Hydraulic Structures. Buildings 2022, 12, 115. [Google Scholar] [CrossRef] [Scilit]
  32. Mazurek, M. Kształtowanie Jakości Wody w Junikowskim Strumieniu Na Obszarze Aglomeracji Poznańskiej. Czas. Geogr. 2024, 95, 293–329. [Google Scholar] [CrossRef] [Scilit]
  33. Graf, R.; Jawgiel, K. The Impact of the Parameterisation of Physiographic Features of Urbanised Catchment Areas on the Spatial Distribution of Components of the Water Balance Using the WetSpass Model. ISPRS Int. J. Geo-Inf. 2018, 7, 278. [Google Scholar] [CrossRef] [Scilit]
  34. IMWM-PIB Climate Portal. Available online: https://klimat.imgw.pl/pl/climate-normals/TSR_AVE (accessed on 15 August 2026).
  35. Zwoliński, Z.; Jasiewicz, J.; Mazurek, M.; Hildebrandt-Radke, I.; Makohonienko, M. Geohazards and Geomorphological Setting in Poznań Urban Area, Poland. J. Maps 2021, 17, 202–214. [Google Scholar] [CrossRef] [Scilit]
  36. Kocięcka, J.; Liberacki, D.; Stachowski, P.; Korytowski, M.; Kupiec, J.M. Assessment of the Ecological Status and the Need for Renovation of Drainage Ditches in the Strumień Junikowski Catchment. Rocz. Ochr. Sr. 2019, 21, 1473–1488. [Google Scholar]
  37. Dinca, L.; Badea, O.; Guiman, G.; Braga, C.; Crisan, V.; Greavu, V.; Murariu, G.; Georgescu, L. Monitoring of Soil Moisture in Long-Term Ecological Research (LTER) Sites of Romanian Carpathians. Ann. For. Res. 2018, 61, 171–188. [Google Scholar] [CrossRef] [Scilit]
  38. Gołdyn, R.; Basińska, A.; Budzyńska, A.; Dondajewska-Pielka, R.; Joniak, T.; Klimaszyk, P.; Kowalczewska-Madura, K.; Kozak, A.; Kuczyńska-Kippen, N.; Nagengast, B.; et al. Stojące i płynące wody Poznania. In Stojące i Płynące Wody Poznania; Bogucki Wydawnictwo Naukowe: Poznań, Poland, 2019. [Google Scholar]
  39. Mazurek, M. Rzeźba, Osady i Wody Zlewni Junikowskiego Strumienia. In Środowisko Geograficzne Zlewni Junikowskiego Strumienia; Mazurek, M., Abramowicz, D., Eds.; Bogucki Wydawnictwo Naukowe: Poznań, Poland, 2022. [Google Scholar]
  40. Wrońska-Pilarek, D.; Kluza-Wieloch, M. Dawne Użytki Ekologiczne w Zlewni Junikowskiego Strumienia i Ich Rola w Ekologicznym Systemie Obszarów Chronionych Miasta Poznania. In Środowisko Geograficzne Zlewni Junikowskiego Strumienia; Mazurek, M., Abramowicz, D., Eds.; Bogucki Wydawnictwo Naukowe: Poznań, Poland, 2022. [Google Scholar]
  41. Graf, R.; Jawgiel, K. Wpływ Antropopresji Na Sieć Rzeczną Zlewni Junikowskiego Strumienia. In Środowisko Geograficzne Zlewni Junikowskiego Strumienia; Mazurek, M., Abramowicz, D., Eds.; Bogucki Wydawnictwo Naukowe: Poznań, Poland, 2022; pp. 157–184. [Google Scholar]
  42. Woźniak, M. Assessment of the Impact of Changes in Flow Conditions Resulting from Natural Damming. Master’s Thesis, Poznań University of Life Sciences, Poznań, Poland, 2023. [Google Scholar]
  43. GUGiKK (Główny Urząd Geodezji i Kartografii, En: Head Office of Geodesy and Cartography). Available online: http://www.gov.pl/web/gugik (accessed on 1 August 2026).
  44. Biuro Projektów Wodnych Melioracji i Inżynierii Środowiska BIPROWODMEL Sp. z o.o. Koncepcja Zagospodarowania Wód Opadowych i Roztopowych w Poznaniu. Cz. 10: Zlewnia Strumienia Junikowskiego [Concept for the Management of Rainwater and Snowmelt in Poznań. Part 10: Junikowski Stream Catchment]; Technical Report; BIPROWODMEL Sp. z o.o.: Poznań, Poland, 2013. [Google Scholar]
  45. Shu, C.; Ouarda, T.B.M.J. Improved Methods for Daily Streamflow Estimates at Ungauged Sites. Water Resour. Res. 2012, 48, 2011WR011501. [Google Scholar] [CrossRef] [Scilit]
  46. Zaborowski, S.; Kałuża, T.; Jusik, S.; Dysarz, T.; Hämmerling, M. Environmental Restoration and Changes of Sediment and Hydrodynamic Parameters in a Section of a Renaturalised Lowland Watercourse. Sustainability 2024, 16, 3948. [Google Scholar] [CrossRef] [Scilit]
  47. USACE. HEC-RAS River Analysis System User’s Manual Version 6.0; Report No. CPD-68; US Army Corps of Engineers Hydrologic Engineering Center: Davis, CA, USA, 2020. [Google Scholar]
  48. Arseni, M.; Rosu, A.; Calmuc, M.; Calmuc, V.A.; Iticescu, C.; Georgescu, L.P. Development of Flood Risk and Hazard Maps for the Lower Course of the Siret River, Romania. Sustainability 2020, 12, 6588. [Google Scholar] [CrossRef] [Scilit]
  49. More, D.D.; Gavit, B.K.; Nandgude, S.B. Hydrologic Engineering Centers-River Analysis System (HEC-RAS)—A Review. J. Agric. Res. Technol. 2024, 49, 139–150. [Google Scholar] [CrossRef] [Scilit]
  50. Chow, V.T. Open-Channel Hydraulics; McGraw-Hill Book: New York, NY, USA, 1959. [Google Scholar]
  51. Arcement, G.J.; Schneider, V.R. Guide for Selecting Manning’s Roughness Coefficients for Natural Channels and Flood Plains; USGPO; US Geological: Reston, VA, USA; US Geological, 1989. [Google Scholar]
  52. Grudzinski, B.P.; Fritz, K.; Golden, H.E.; Newcomer-Johnson, T.A.; Rech, J.A.; Levy, J.; Fain, J.; McCarty, J.L.; Johnson, B.; Vang, T.K.; et al. A Global Review of Beaver Dam Impacts: Stream Conservation Implications across Biomes. Glob. Ecol. Conserv. 2022, 37, e02163. [Google Scholar] [CrossRef] [Scilit]
  53. Hua, Z.; Zhou, B.; Chan, K.W.; Zhang, C.; Cao, Y.; Wang, P.; Xia, M. A Progressive Polyhedral Approximation Method for Nonlinear PDE-Constrained Electricity-Water Nexus Dispatch. IEEE Trans. Smart Grid 2025, 16, 2703–2706. [Google Scholar] [CrossRef] [Scilit]
  54. Wang, Y.; Zhou, B.; Xu, Y.; Yung Chung, C.; Yang, Y.; Yuan, Z.; Hu, C. Spatio-Temporal Power Outage Risk Prediction for Interdependent Urban Electricity and Drainage Networks Under Rainstorm Disasters. IEEE Trans. Smart Grid 2026, 17, 2888–2902. [Google Scholar] [CrossRef] [Scilit]
  55. Larsen, A.; Larsen, J.R.; Lane, S.N. Dam Builders and Their Works: Beaver Influences on the Structure and Function of River Corridor Hydrology, Geomorphology, Biogeochemistry and Ecosystems. Earth-Sci. Rev. 2021, 218, 103623. [Google Scholar] [CrossRef] [Scilit]
  56. Mason, R.J.; Johnson, M.F.; Wohl, E.; Russell, C.E.; Olden, J.D.; Polvi, L.E.; Rice, S.P.; Hemsworth, M.J.; Sponseller, R.A.; Thorne, C.R. Rebalancing River Lateral Connectivity: An Interdisciplinary Focus for Research and Management. WIREs Water 2025, 12, e1766. [Google Scholar] [CrossRef] [Scilit]
  57. Pilliod, D.S.; Rohde, A.T.; Charnley, S.; Davee, R.R.; Dunham, J.B.; Gosnell, H.; Grant, G.E.; Hausner, M.B.; Huntington, J.L.; Nash, C. Survey of Beaver-Related Restoration Practices in Rangeland Streams of the Western USA. Environ. Manag. 2018, 61, 58–68. [Google Scholar] [CrossRef] [Scilit]
  58. Burgher, J.A.S.; Hallza, J.; Lambert, M.R.; Piovia-Scott, J. Beaver-related Restoration and Freshwater Climate Resilience across Western North America. Restor. Ecol. 2026, 34, e70194. [Google Scholar] [CrossRef] [Scilit]
  59. Wohl, E. Legacy Effects of Loss of Beavers in the Continental United States. Environ. Res. Lett. 2021, 16, 025010. [Google Scholar] [CrossRef] [Scilit]
  60. Marshall, K.N.; Hobbs, N.T.; Cooper, D.J. Stream Hydrology Limits Recovery of Riparian Ecosystems after Wolf Reintroduction. Proc. R. Soc. B. 2013, 280, 20122977. [Google Scholar] [CrossRef] [Scilit]
  61. Collen, P.; Gibson, R.J. The General Ecology of Beavers (Castor Spp.), as Related to Their Influence on Stream Ecosystems and Riparian Habitats, and the Subsequent Effects on Fish. Rev. Fish Biol. Fish. 2000, 10, 439–461. [Google Scholar] [CrossRef] [Scilit]
  62. Kobojek, E. Wpływ Działalności Bobrów Na Lokalne Procesy Fluwialne w Wybranych Rzekach Równiny Łowicko-Błońskiej. AUL. Folia Geogr. Phys. 2013, 12, 17–32. [Google Scholar] [CrossRef] [Scilit]
  63. Hill, B.; Liang, Q.; Bosher, L.; Chen, H.; Nicholson, A. A Systematic Review of Natural Flood Management Modelling: Approaches, Limitations, and Potential Solutions. J. Flood Risk Manag. 2023, 16, e12899. [Google Scholar] [CrossRef] [Scilit]
  64. Follett, E.; Beven, K.; Hankin, B.; Mindham, D.; Chappell, N. The Importance of Retention Times in Natural Flood Management Interventions. Proc. IAHS 2024, 385, 197–201. [Google Scholar] [CrossRef] [Scilit]
  65. Wohl, E.; Inamdar, S. Beaver Versus Human: The Big Differences in Small Dams. WIREs Water 2025, 12, e70019. [Google Scholar] [CrossRef] [Scilit]
  66. Lane, S.N. Natural Flood Management. WIREs Water 2017, 4, e1211. [Google Scholar] [CrossRef] [Scilit]
  67. Wingfield, T.; Macdonald, N.; Peters, K.; Spees, J.; Potter, K. Natural Flood Management: Beyond the Evidence Debate. Area 2019, 51, 743–751. [Google Scholar] [CrossRef] [Scilit]
  68. Walczak, N.; Walczak, Z.; Kałuża, T.; Hämmerling, M.; Stachowski, P. The Impact of Shrubby Floodplain Vegetation Growth on the Discharge Capacity of River Valleys. Water 2018, 10, 556. [Google Scholar] [CrossRef] [Scilit]
  69. Tymiński, T.; Kałuża, T.; Hämmerling, M. Verification of Methods for Determining Flow Resistance Coefficients for Floodplains with Flexible Vegetation. Sustainability 2022, 14, 16170. [Google Scholar] [CrossRef] [Scilit]
  70. Aliaga, J.; Aberle, J. Bed Shear Stress Model for Rough Bed Flows through Rigid Emergent Vegetation. Environ. Fluid Mech. 2025, 25, 23. [Google Scholar] [CrossRef] [Scilit]
Figure 1. Catchment characteristics: (a) catchment area down to the investigated cross-section, (b) characteristics of sub-catchments down to the investigated cross-section, (c) land cover structure down to the investigated cross-section.
Sustainability 18 08725 g001
Figure 2. Photographs of selected beaver dams: (a) dam 1, (b) dam 3, (c) dam 2.9, (d) dam 2.
Sustainability 18 08725 g002
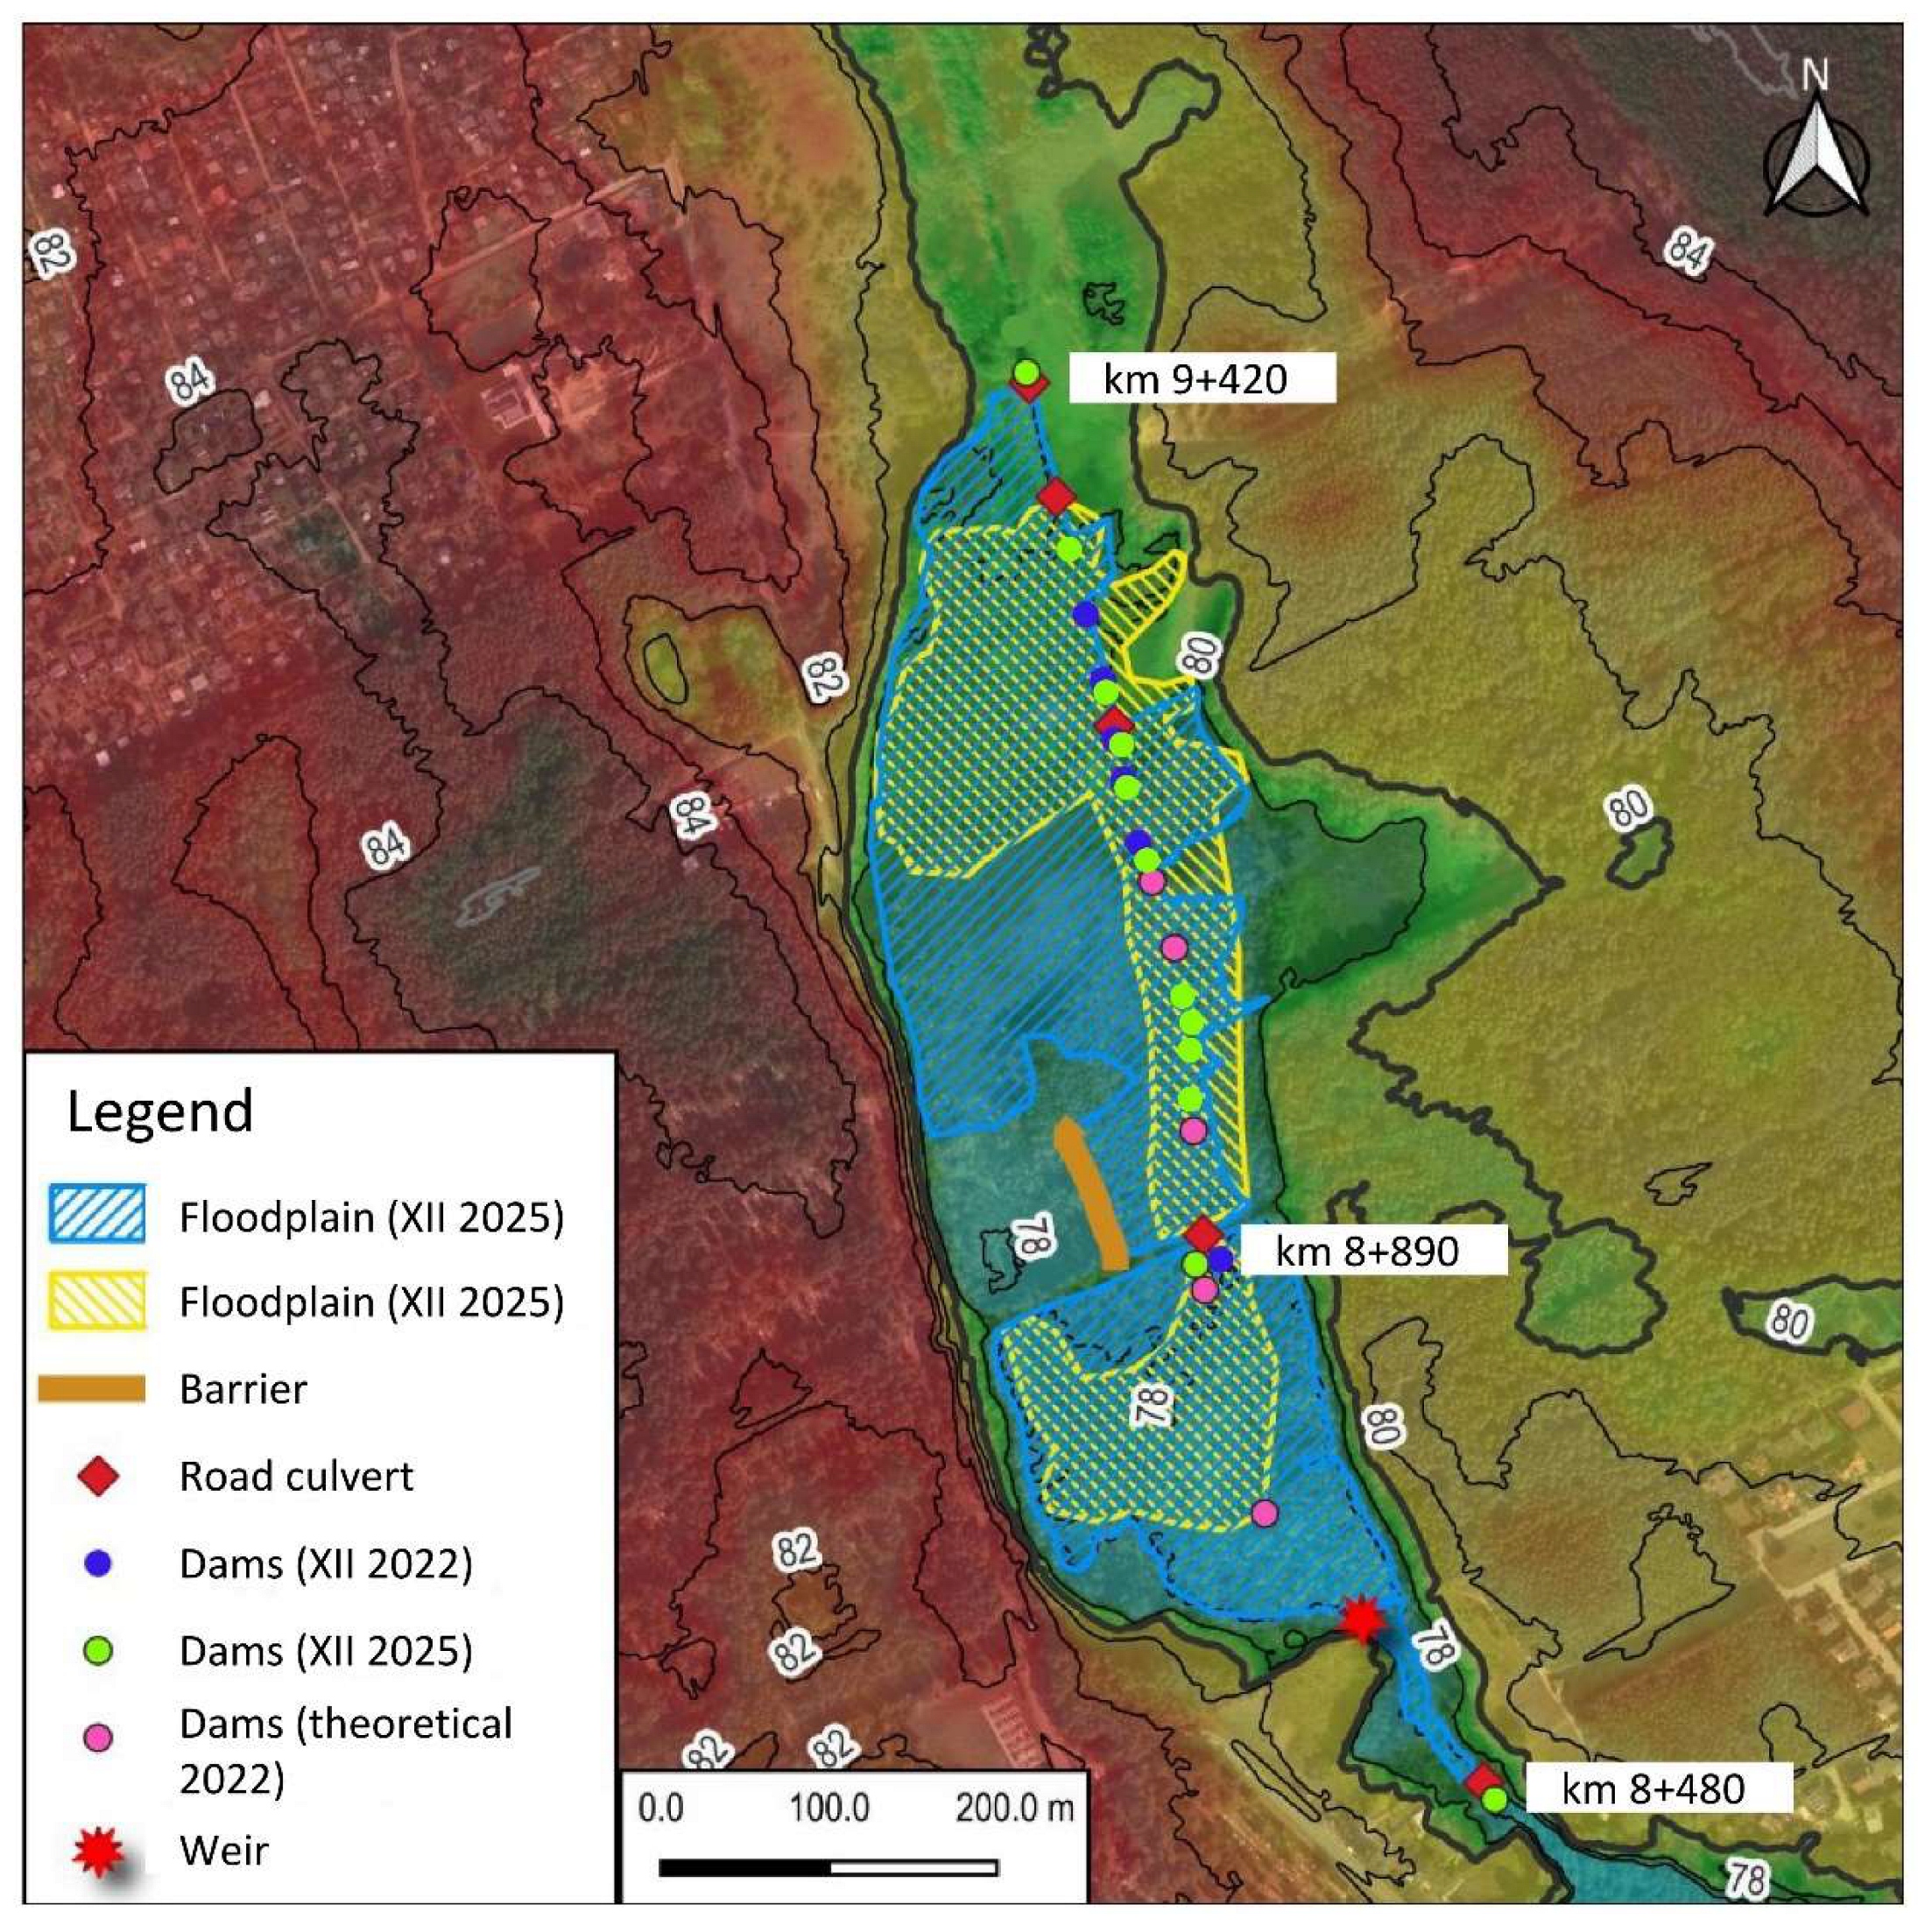
Figure 3. Location of the dams inventoried for the respective measurement campaigns.
Sustainability 18 08725 g003
Figure 4. Differences between the 2024 and 2012 DTM elevations with frequency histogram of these differences. The yellow colour represents an area raised by no less than 0.15 m, whereas blue indicates a lowering of at least 0.15 m relative to the 2012 model.
Sustainability 18 08725 g004
Figure 5. Impact of dams on water level in the stream for: (a) dam 3, (b) dam 2.9, (c) dam 2.8, (d) dam 2.6, (e) dam 2.4, (f) dam 1.
Sustainability 18 08725 g005
Figure 6. Comparison of depths for three scenarios: Scenario I—model without beaver dams, Scenario II—model with beaver dams from 2022, Scenario III—model with beaver dams from 2025. Figures (ac) display the SSQ flow; figures (df) display the Q20% flow; figures (gi) display the Q5% flow; the pink line marks the course of the riverbed.
Sustainability 18 08725 g006
Table 1. Location and characteristics of beaver dams, coordinates in the EPSG2180 system.
No.NorthingEastingHeight
[m]
Width
[m]
1505082.65352352.620.789.2
2505426.89352154.340.2035.0
2.1505517.00352150.600.051.3
2.2505535.90352151.000.101.5
2.3505556.10352156.550.050.9
2.4505576.98352139.950.106.0
2.5505656.08352119.240.101.4
2.6505704.96352105.030.101.3
2.7505729.24352100.050.301.8
2.8505764.33352094.250.051.8
2.9505842.89352070.920.102.1
3505942.99352048.150.402.8
Table 2. Summary of characteristic flows and flows with a specified exceedance probability p% for the computational cross-section analysed in this study. SSQ—average annual flow, SWQ—high average annual flow, Q20%—a flow with a 20 percent probability of occurrence, Q5%—a flow with a 5 percent probability of occurrence.
No.Stream kmCharacteristic Flow (m3∙s−1)Flows with a Specified Exceedance Probability p% (m3∙s−1)
SSQSWQQ20%Q5%
123456
1.8 + 4800.0260.3610.8761.578
Table 3. Summary of stored water volume under specified steady-flow conditions for the considered scenarios: Scenario I—model without beaver dams, Scenario II—model with beaver dams from 2022, and Scenario III—model with beaver dams from 2025.
FlowAbsolute Volume, V [m3]Change in Volume, ΔV [m3]
S IS IIS IIIS I–S IIS I–S IIIS II–S III
SSQ941553412.533459311.5926999
SWQ7857898615.178112973216192
Q20%10.04910,74618.73569786867989
Q5%16.59016,71725.05912784698342
Disclaimer/Publisher’s Note: The statements, opinions and data contained in all publications are solely those of the individual author(s) and contributor(s) and not of MDPI and/or the editor(s). MDPI and/or the editor(s) disclaim responsibility for any injury to people or property resulting from any ideas, methods, instructions or products referred to in the content.