Article

Beyond the Ranking Paradox: A Context-Weighted Liveability Index for Assessing Mediterranean Smart Cities—A Proof-of-Concept GIS-Based Comparison of Bologna and Athens

Department of Civil, Architectural and Environmental Engineering (DICEA), University of Padua, 35131 Padova, Italy
*
Author to whom correspondence should be addressed.
Sustainability 2026, 18(17), 8723; https://doi.org/10.3390/su18178723
Submission received: 28 July 2026 / Revised: 22 August 2026 / Accepted: 24 August 2026 / Published: 26 August 2026

Abstract

Conventional international rankings assess urban efficiency via context-blind metrics, a design that the literature suggests may structurally disadvantage Mediterranean centres and obscure the sustainable policy pathways mandated by the Sustainable Development Goals, most notably the governance of urban transitions under SDG 11. This paper proposes the Context-Weighted Liveability Index (CWLI), which introduces context-sensitive weights into the aggregation of standard smart city KPIs, bridging the global comparability of IMD-style indices with the Mediterranean-specific assessment logic of the ASCIMER framework. Weights derive from five geographic coefficients—climate, culture, economy, historical density, and demography—through a transparent weighted additive formulation with an explicit sensitivity matrix, whose robustness is verified through Monte Carlo uncertainty analysis over 5000 perturbed configurations spanning parameters, coefficients, measurements and benchmarks. Coefficients and KPIs are computed from open spatial data through a replicable GIS protocol (QGIS; OpenStreetMap, Copernicus land cover and land surface temperature, and ISTAT/ELSTAT census data at sub-municipal scale). Applied comparatively to Bologna and Athens, the framework shows that contextual weighting concentrates over 60% of the total weight on climate-sensitive indicators and yields, through the decomposition of contributions, a policy diagnosis that differs from the one suggested by reading an overall smart city rank in isolation: Athens’ largest contribution is digital and its liveability deficit territorial—a profile with direct consequences for sustainable urban transition and talent attraction. Implications for SDG 11 monitoring, equitable access to urban green space, and digital twin integration are discussed.

1. Introduction

Over the preceding twenty years, the smart city paradigm has solidified its status as a primary evaluative framework for urban efficiency across the European continent. Global benchmarks, including the IMD Smart City Index, IESE Cities in Motion, and ProptechOS rankings, now wield considerable authority over municipal strategy, functioning as critical determinants for capital flows, place-branding discourses, and the prioritisation of local governance objectives [1]. The 2026 edition of the IMD Smart City Index evaluates 148 cities worldwide through resident-perception surveys, organised around two pillars—Structures and Technology—each articulated in five dimensions (IMD World Competitiveness Center—Methodology of the IMD Smart City Index). Despite the methodological refinement of these instruments, a persistent geographic asymmetry emerges from their results: Mediterranean European cities are consistently positioned in the lower portion of the rankings, while Central and Northern European cities dominate the top quartiles. The implications of such evaluative authority extend beyond place branding; longitudinal analysis of Italian municipal data confirms that perceived quality of life and technological maturity operate as dual determinants for the residential preferences of younger cohorts, suggesting that the structural biases inherent in global benchmarks directly influence regional talent competition, demographic resilience, and the equitable realisation of the Sustainable Development Goals framed by SDG 11 [2].
In previous work, the authors interrogated this asymmetry through the lens of the liveability paradox (can cities be ‘smart’ yet ‘unlivable’?), proposing a set of nine quality-of-life indicators mapped to the six Giffinger dimensions and comparing Athens with Zurich [3]. While our preceding investigation purposefully adopted an egalitarian weighting regime across indicators, it simultaneously designated the formulation of a weighting architecture—calibrated to contextual specificities—as the paramount trajectory for subsequent inquiry. This paper operationalises that mandate. It posits that the metrics typically mobilised for smart city evaluation are not fundamentally flawed; rather, they necessitate context-weighted aggregation to yield analytically rigorous comparative diagnoses: a 10 m2 per inhabitant figure for urban green provision per capita carries a different meaning in a city where the climate enables outdoor social life for most of the year than in one where such practice is climatically constrained for several months, and the relevance of digital municipal services is unlikely to be uniform across cities with markedly different administrative cultures and demographic structures.
This structural under-recognition is what we term the Mediterranean Ranking Paradox: in the 2025 IMD index, Bologna is placed 83rd and Athens 129th, yet the documentary record of the two cities describes an integrated municipal digital twin coordinated with statutory planning in Bologna and the digitalisation of over two hundred municipal services alongside Europe’s first Chief Heat Officer in Athens [4,5,6]. Such results do not depict municipal underperformance; rather, they characterise urban centres whose specific manifestations of digital and institutional intelligence remain largely illegible to prevailing evaluative methodologies. When two municipalities, characterised by substantial and verified governance innovation, are relegated to mediocrity by the metrics currently wielding authoritative influence over policy discourse, it suggests that the assessment instruments are either misaligned in their primary objectives or structurally flawed in their aggregative logic.
The contribution of this paper is threefold. First, it formalises a Context-Weighted Liveability Index (CWLI) that introduces context coefficients into the aggregation of standard smart city KPIs, bridging the globally comparable but context-blind logic of IMD-style indices and the context-sensitive but non-comparable assessment logic of the ASCIMER framework [7]; the aggregation is deliberately statistical in treatment—a transparent weighted additive composite whose full parameterisation is exposed and subjected to systematic Monte Carlo uncertainty analysis—rather than an argued weighting. Second, it operationalises the index through a fully replicable GIS protocol based exclusively on open data and open-source software, so that both the geographic coefficients and the spatial KPIs are computed rather than compiled, removing the definitional heterogeneity that affects literature-based comparisons. Third, it applies the framework comparatively to Bologna and Athens, two Mediterranean cities selected through a most-different systems design, demonstrating that geographic weighting operates as a city-specific calibration rather than a uniform regional correction and that the resulting decomposition inverts the diagnostic narrative produced by conventional rankings.
Three research questions guide this study. RQ1: Does context-sensitive weighting materially change aggregate liveability scores relative to equal weighting? RQ2: Do the contribution profiles of the two cities differ and in what direction? RQ3: Are the resulting diagnoses robust to uncertainty in parameters, coefficients, measurements, and benchmarks? Section 3 and Section 5 answer these questions directly. Consistently with the two-city design, this study is presented as a proof-of-concept comparative demonstration rather than a test of region-wide claims.
The remainder of this paper is structured as follows. Section 2 outlines the methodology: the critical review of the IMD and ASCIMER frameworks, the CWLI formulation, the definition of the geographic coefficients and the sensitivity matrix, the GIS computation protocol, and the case study design. Section 3 presents the comparative results for Bologna and Athens. Section 4 discusses the findings, their policy implications, and the limitations of the approach. Section 5 concludes and outlines future research directions, including integration with urban digital twin platforms.

Literature Review

Scholarly critique of urban intelligence metrics has diversified across three distinct trajectories pertinent to this inquiry. Primary concerns focus on the structural biases inherent in global evaluative instruments: the IMD index faces interrogation for its reliance on restricted perception-based sampling and methodological opacity, whereas the IESE Cities in Motion framework synthesises an exhaustive indicator set through aggregative logics that lack full transparency, thereby institutionalising a market-centric bias frequently identified in critical reviews [1,8,9]. Giffinger et al., in the foundational methodological discussion of smart city evaluation, identified the assignment of indicator weights as the most consequential and most contested decision in composite index design, noting that different weighting schemes can produce radically different rankings from identical data [10]. A parallel stream addresses the compensability problem through non-compensatory aggregation: Ivaldi and colleagues recently applied DP2-based synthesis and hierarchical clustering to the IMD indicators, showing that cities at similar rank positions conceal profoundly different multidimensional maturity profiles [11]. The second direction concerns the geography of the literature itself: empirical and normative work is overwhelmingly calibrated to Northern and Central European, North American, and East Asian cities, treating context as a detail rather than a determinant [12]. The ASCIMER project (Assessing Smart City Initiatives for the Mediterranean Region), developed at Universidad Politécnica de Madrid under the European Investment Bank’s EIBURS programme, remains the most systematic effort to build assessment criteria sensitive to Mediterranean institutional and morphological specificities, yet it stopped short of formalising how indicator weights should respond to geographic context [7]. The third direction concerns spatial disaggregation: recent work incorporates fine-grained spatial analysis into urban assessment, recognising that the distribution of services and amenities—not merely their aggregate quantity—determines lived urban quality [13,14,15]. This paper positions itself at the intersection of the three: it supplies the weighting layer ASCIMER lacks, grounds it in the Mediterranean context that the global indices ignore, and computes it from spatially explicit open data.

2. Materials and Methods

2.1. Research Design

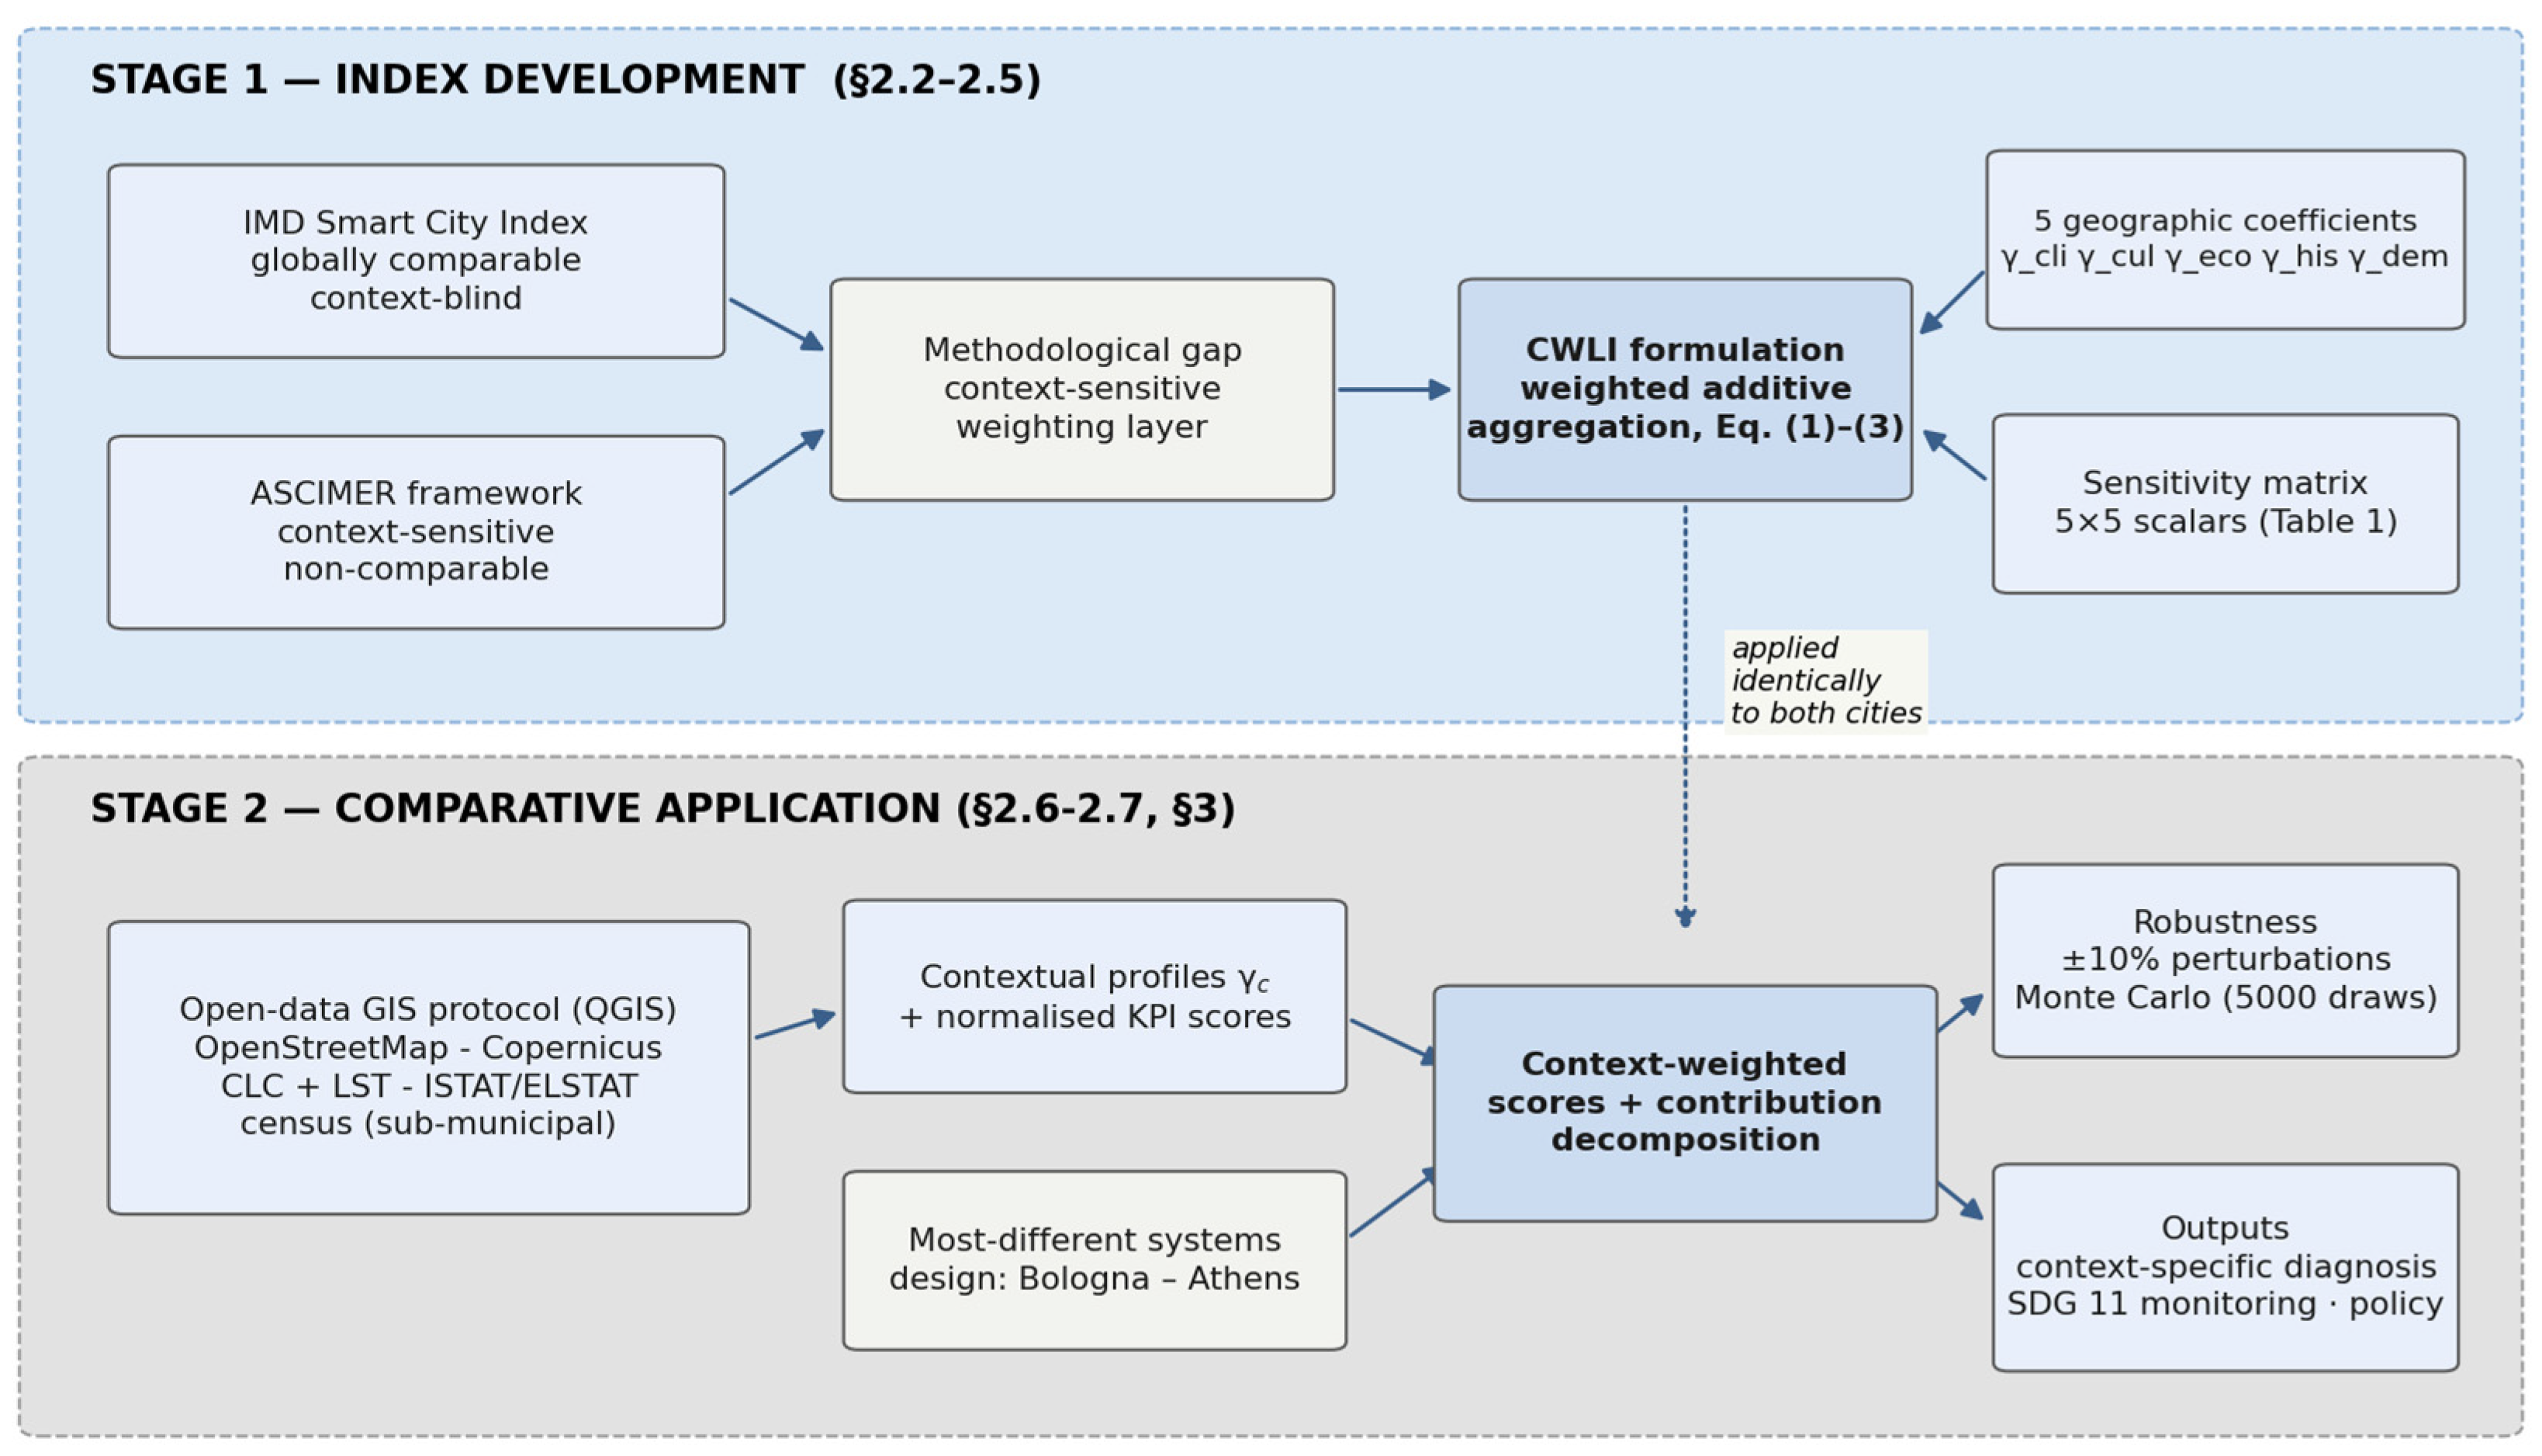
The research adopts a quantitative comparative case study design in two stages, consistent with the mixed-methods structure of our previous work [3]. Stage one develops the index: a critical reading of the IMD and ASCIMER frameworks identifies the methodological gap (Section 2.2), which the CWLI formulation addresses (Section 2.3, Section 2.4 and Section 2.5). Stage two applies the index to Bologna and Athens through a GIS-based computation protocol (Section 2.6), with case selection following a most-different systems logic (Section 2.7): the two cities differ maximally on population, density, planning tradition, institutional continuity, and fiscal trajectory, while sharing the Mediterranean contextual condition the CWLI is designed to parameterise. This design supports a proof-of-concept demonstration of the claim that geographic weighting operates as a city-specific calibration. Figure 1 summarises the analytical workflow.

2.2. The IMD and ASCIMER Frameworks: The Methodological Gap

The IMD Smart City Index, produced by the World Competitiveness Center in collaboration with the World Smart Sustainable Cities Organization (WeGO), assesses 148 cities through resident-perception surveys of approximately 400 respondents per city, computing final scores as a three-year weighted average and grouping cities by Subnational Human Development Index level. Two features are distinctive: grounding in perception rather than objective measurement and HDI grouping intended to neutralise structural development gaps. Neither addresses a more fundamental issue: the relative importance of each indicator is implicitly assumed uniform across all cities. A ten-point gap in public transport satisfaction contributes equally to the final score in Zurich and in Athens, regardless of how central public transport actually is to residents’ daily liveability in each context. Notably, evidence from the 2026 edition itself suggests that the Structures pillar—institutional effectiveness and participation—predicts overall performance more consistently than the Technology pillar [1,8], implying the index measures something other than the technological smartness it nominally claims to assess.
ASCIMER approached the problem from the opposite end. Its six-dimension, 38-factor framework explicitly recognises that Mediterranean cities operate within a distinctive set of challenges—institutional fragmentation, climate vulnerability, post-2008 fiscal constraints, complex historical stratification—and that smart city projects must be assessed against these conditions rather than against templates derived from Northern European experience [7]. Its principal limitation is operational: it identifies which dimensions matter and why but proposes no mathematical structure for embedding contextuality into a comparable index. The two frameworks thus bracket the gap this paper addresses: IMD offers a comparable but context-blind index; ASCIMER offers context sensitivity without comparability. The CWLI bridges the two through an explicit weighting layer defined by geographic coefficients.

2.3. The Context-Weighted Liveability Index: General Formulation

Let c denote a city under evaluation and i an indicator drawn from a reference set of n smart city KPIs. The CWLI for city c is defined as in Equation (1):
CWLI_c = Σi=1n wi(γ_c) · (KPIi,c/KPIi,ref)
where KPIi,c is the value of indicator i observed in city c; KPIi,ref is a reference value normalising the indicator to a dimensionless scale; and wi(γ_c) is the context-sensitive weight of indicator i, dependent on the vector of geographic coefficients γ_c characterising the contextual profile of city c. Weights are constrained to sum to unity (Equation (2)), so that weights are normalised. The index itself is not bounded above: since normalised KPI ratios may exceed 1 when a city outperforms a reference value, CWLI scores above 1 are possible in principle; no cap is imposed, and no indicator exceeds its reference in the present dataset:
Σi=1n wi(γ_c) = 1
A city meeting all reference values scores 1; values above (below) 1 indicate above-reference (below-reference) performance after contextual weighting. The aggregation is deliberately linear and compensatory: this preserves transparency and interpretability—each contribution wi·ki (where ki = KPIi,c/KPIi,ref denotes the normalised indicator score) is directly readable—at the cost of allowing strong indicators to offset weak ones arithmetically, a trade-off taken up in Section 4.
A terminological note: the qualifier ‘context-weighted’ is adopted to avoid confusion with geographically weighted regression (GWR), in which model coefficients vary continuously across spatial units. In the present framework, weights are city-level contextual weights: they vary between cities as a function of their contextual profiles, not within cities across space.

2.4. Geographic Coefficients

The contextual profile of each city is described by a five-component vector γ_c = (γ_cli, γ_cul, γ_eco, γ_his, γ_dem), each component in [0, 1]. Three coefficients are computed from explicit formulas. γ_cli = min(D20/183, 1), where D20 is the number of days per year with a mean temperature above 20 °C (corroborated by the land-surface-temperature elaborations of Section 3.1): D20 = 130 for Bologna and 165 for Athens yield 0.71 and 0.90. γ_eco = 1 − GDP_PPP/€80,000, with the reference anchored to the leading EU metropolitan economies: €43,000 (Bologna) and €23,000 (Attica) yield 0.46 and 0.71. γ_dem = 0.5·min(density/10,000, 1) + 0.5·min(share65+/30, 1), computed at a study-area scale: 0.42 for the Bologna Metropolitan City and 0.73 for the Athens–Piraeus agglomeration. The remaining two coefficients—γ_cul (culture of outdoor public life, informed by Eurostat Time Use data and documented urban practices) and γ_his (share and constraining role of the historic fabric)—are author assessments, explicitly not the product of a formal expert-elicitation protocol: the two authors assigned the values 0.78/0.82 and 0.65/0.55 on the documented criteria of Supplementary Materials File S1, their normative meaning and expected direction are documented in Supplementary Materials File S1, and their uncertainty (±0.10) is explicitly propagated in the Monte Carlo analysis of Section 3.4. The formula or assessment basis, inputs, source, and reference year of every coefficient are reported in Section 3.1.

2.5. Indicator Selection, Sensitivity Matrix, and Weight Composition

Five indicators are selected on the criterion of maximum contextual sensitivity, covering the four ASCIMER dimensions most exposed to contextual variation (environment, mobility, living, and people) and intersecting three IMD dimensions: (1) urban green provision per capita (m2/inhabitant); (2) soft mobility share (% of trips on foot or by bicycle); (3) tree canopy cover (%); (4) housing affordability (inverted rent to income); (5) digital municipal services adoption (%). The weight of each indicator is a weighted additive combination of the five coefficients (Equation (3)):
wi(γ_c) = αi·γ_cli + βi·γ_cul + δi·γ_eco + εi·γ_his + ζi·γ_dem
where the indicator-specific scalars satisfy αi + βi + δi + εi + ζi = 1 and express the sensitivity of indicator i to each contextual dimension, and author judgements—not a formal expert elicitation—about within-row ordering and proportions are grounded in the literature summarised in Supplementary Materials File S1, their residual uncertainty is propagated in Section 3.4, and their empirical calibration through Delphi/AHP elicitation is identified in Section 5 as a prerequisite for policy applications on the substantive determinants of each KPI (Table 1). After computation, weights are normalised to sum to unity. The matrix is intended as a transparent, replicable starting point rather than a definitive parameterisation; its robustness is tested in Section 3.4, where all twenty-five scalars are subjected to individual perturbation and to joint Monte Carlo uncertainty analysis, so that the parameterisation is treated as a statistical object with quantified uncertainty rather than a fixed rhetorical choice; alternative calibrations are discussed in Section 4.

2.6. GIS-Based Computation Protocol

Both the geographic coefficients of Section 2.4 and the KPI values of Section 2.5 are computed—wherever the underlying variable is spatial—through a single GIS protocol applied identically to both cities. The protocol serves two purposes. Methodologically, it removes the principal weakness of composite indices assembled from heterogeneous literature values: definitional inconsistency across cities, whereby nominally identical indicators (green space per capita being the canonical case, with published Athens values ranging from 0.96 to 6.45 m2/inhabitant depending on definitions [16]) are measured against different definitions, boundaries, and dates. Operationally, it makes the index fully replicable: every spatial input derives from open data processed with open-source software (QGIS 3.34 LTR; QGIS Association, Grüt, Switzerland).
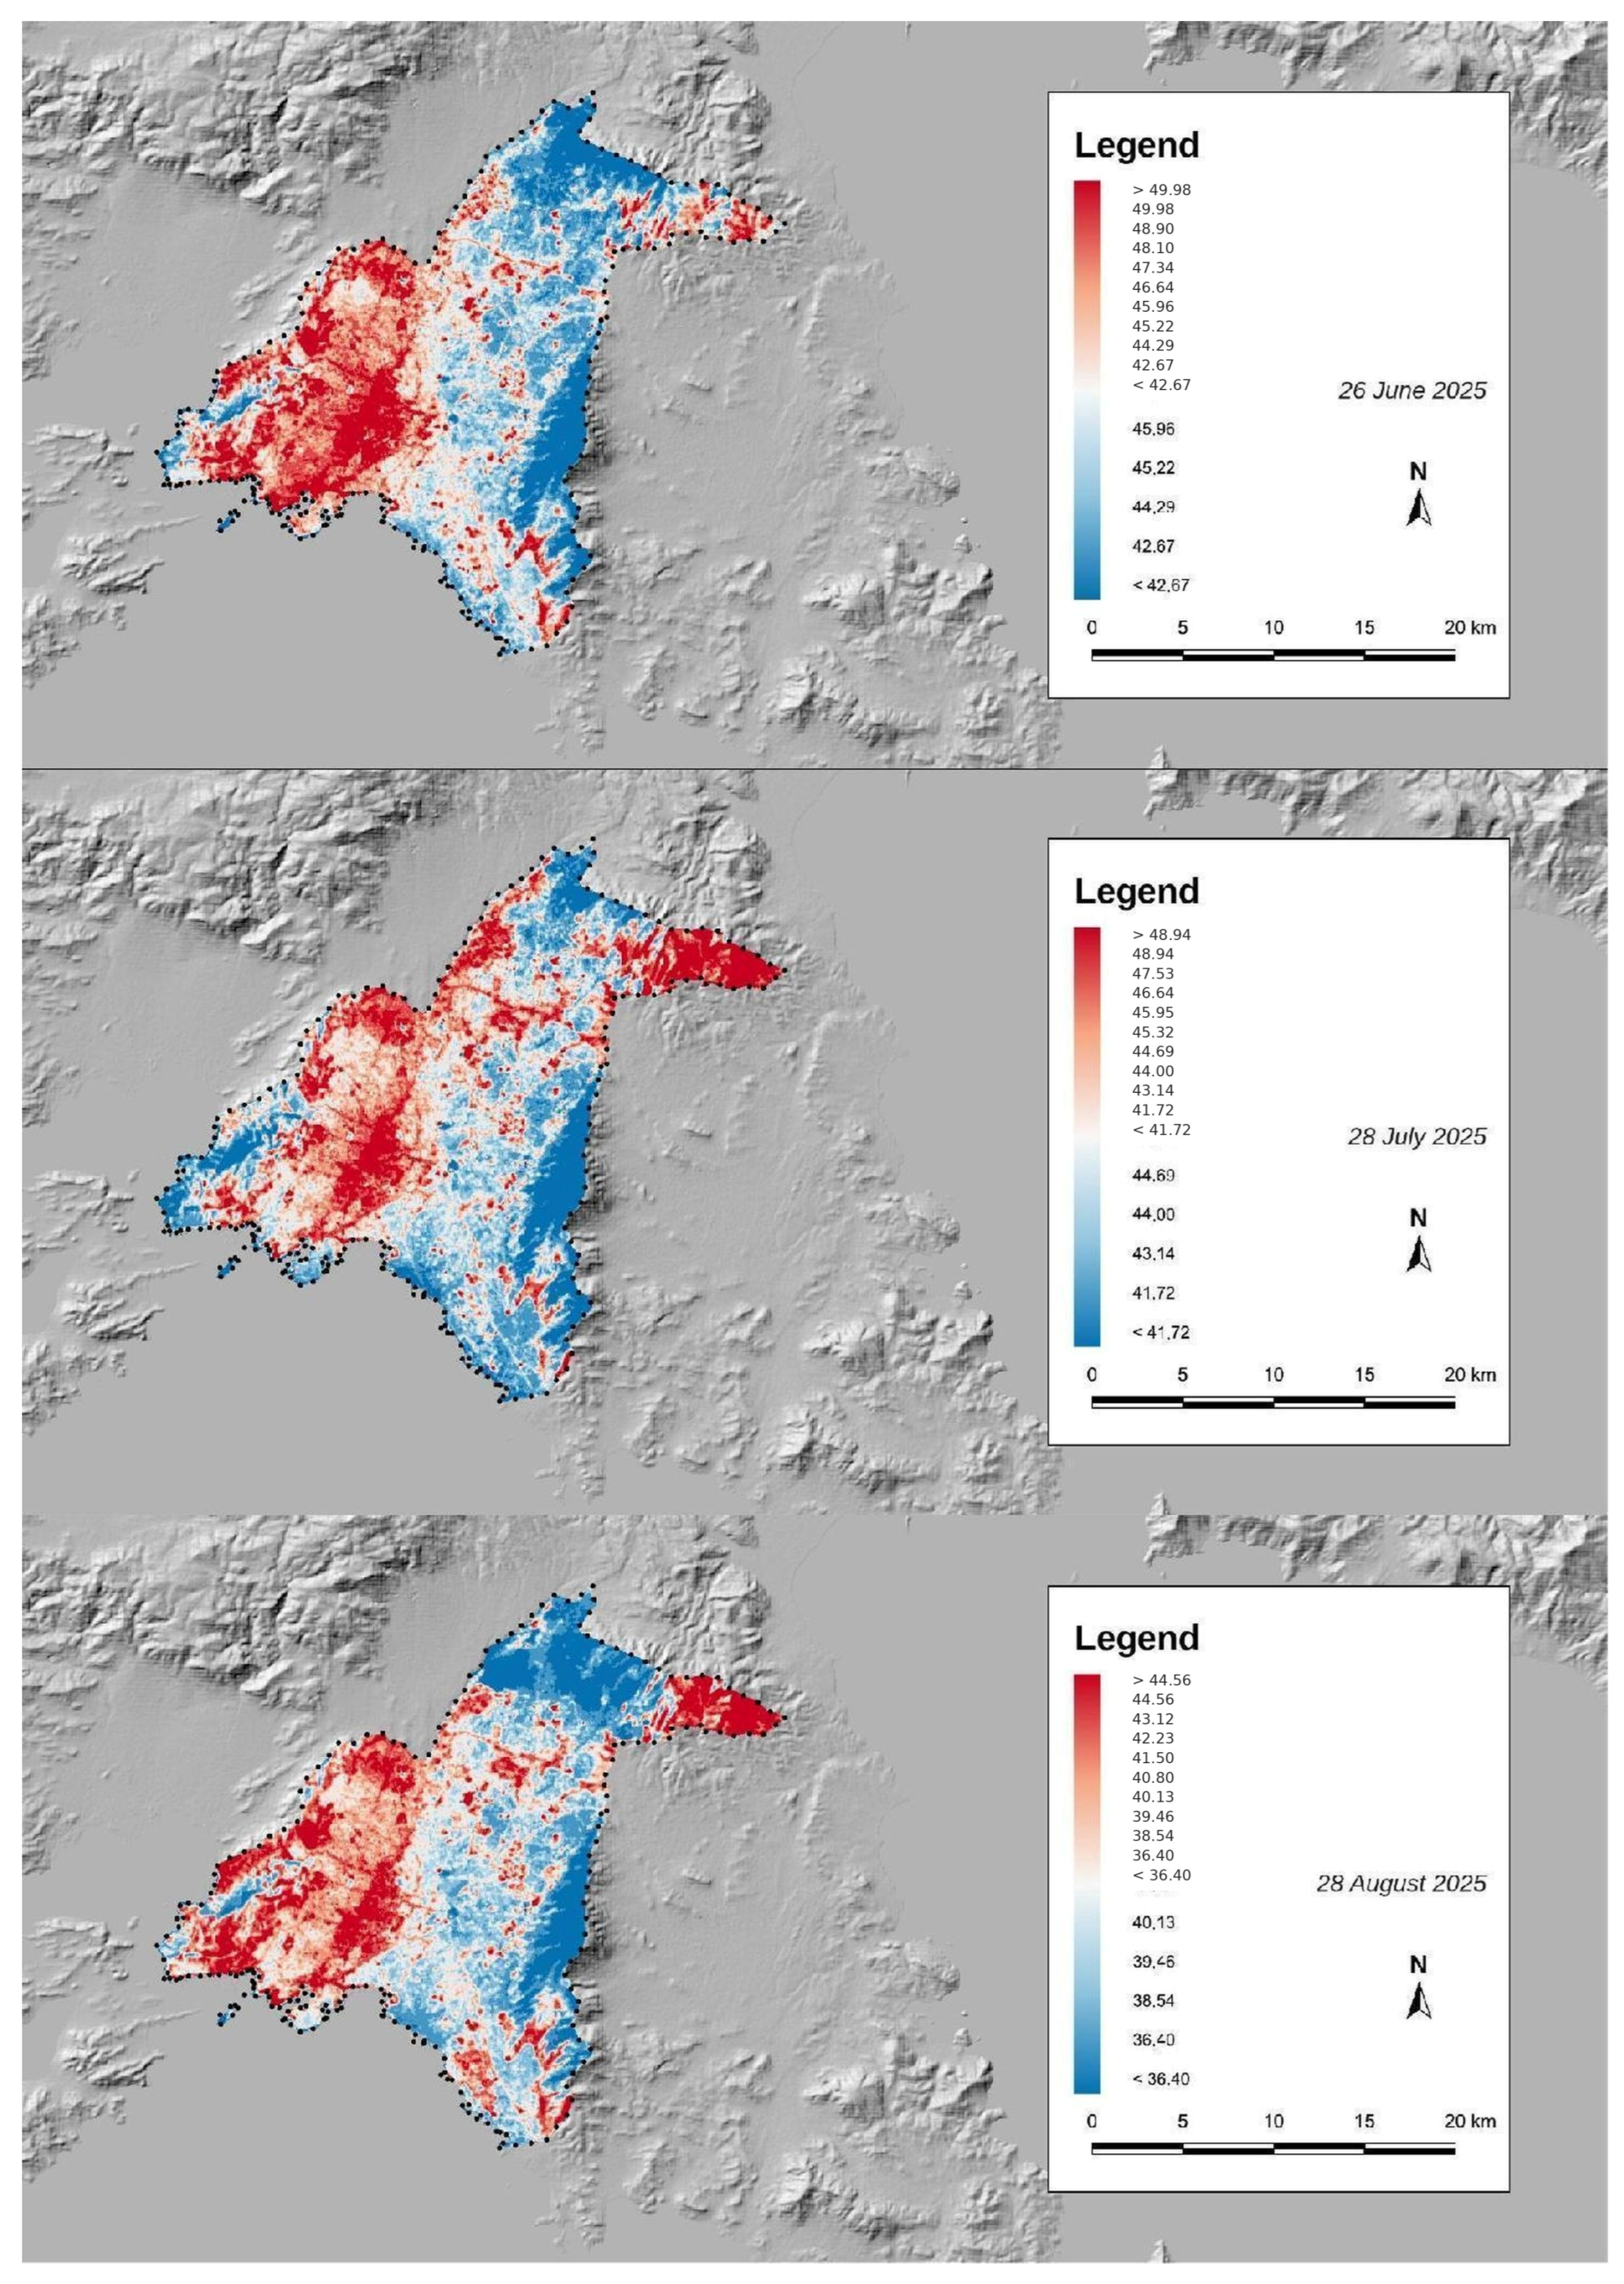
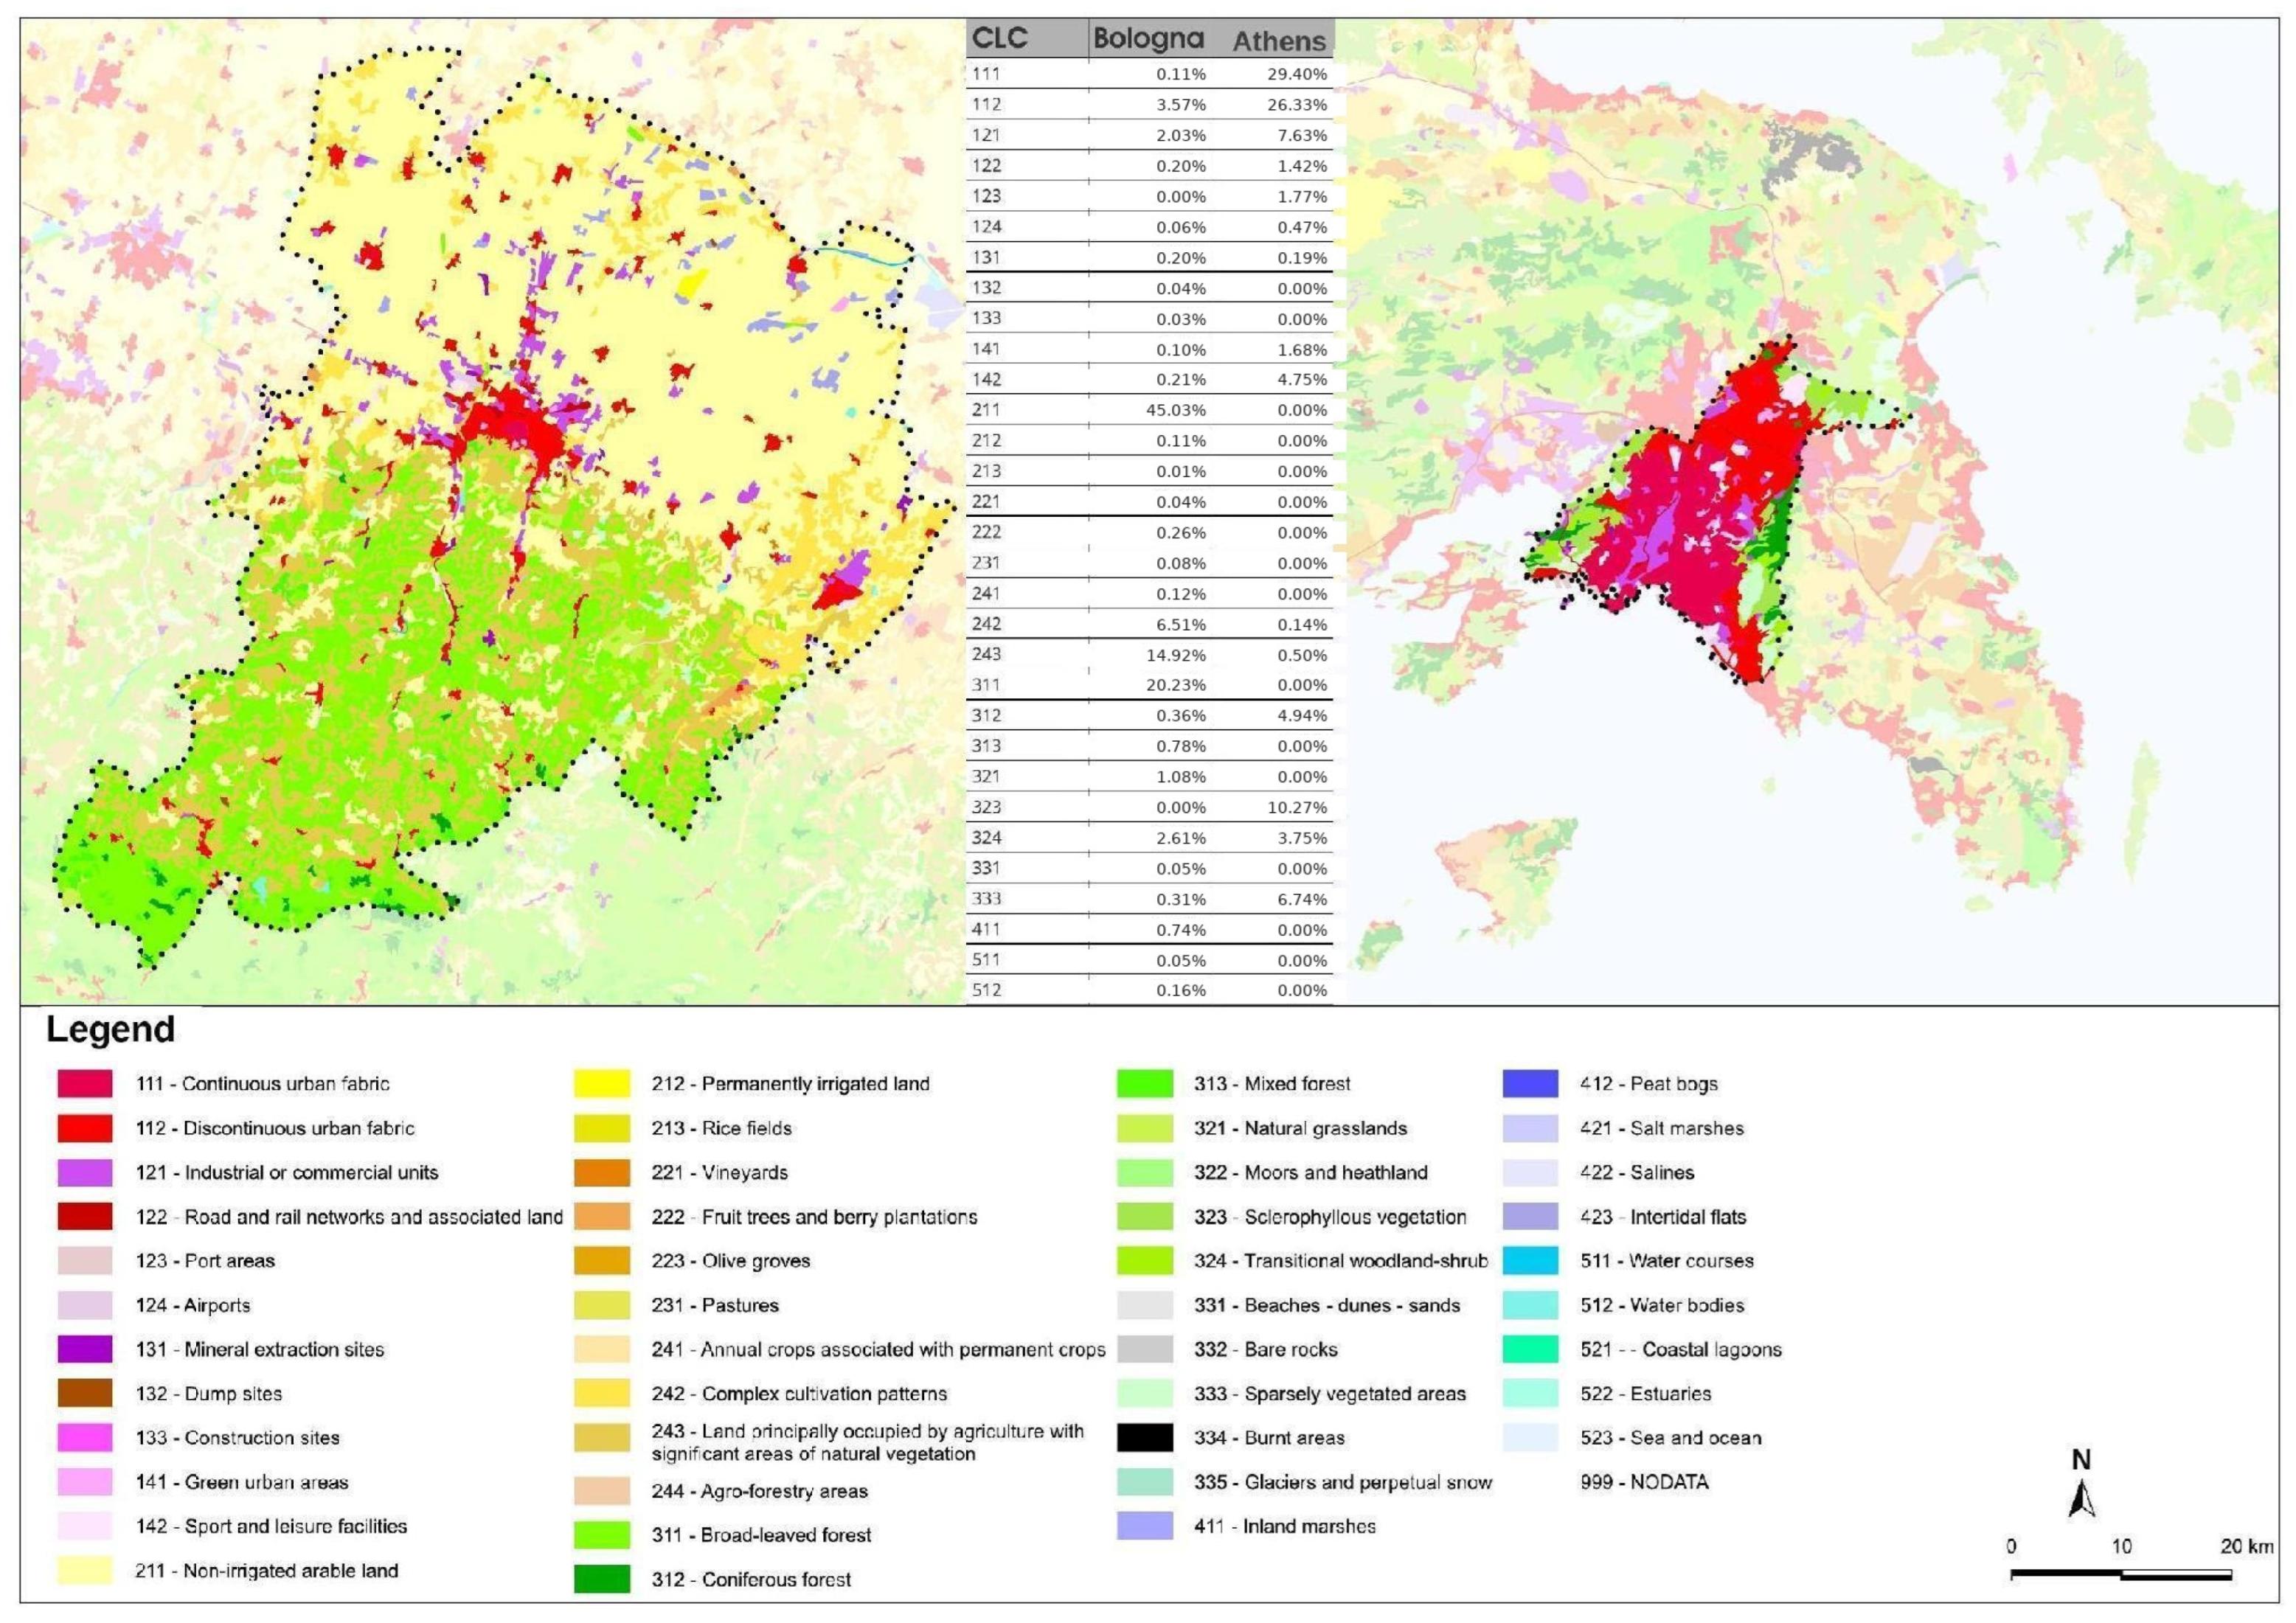
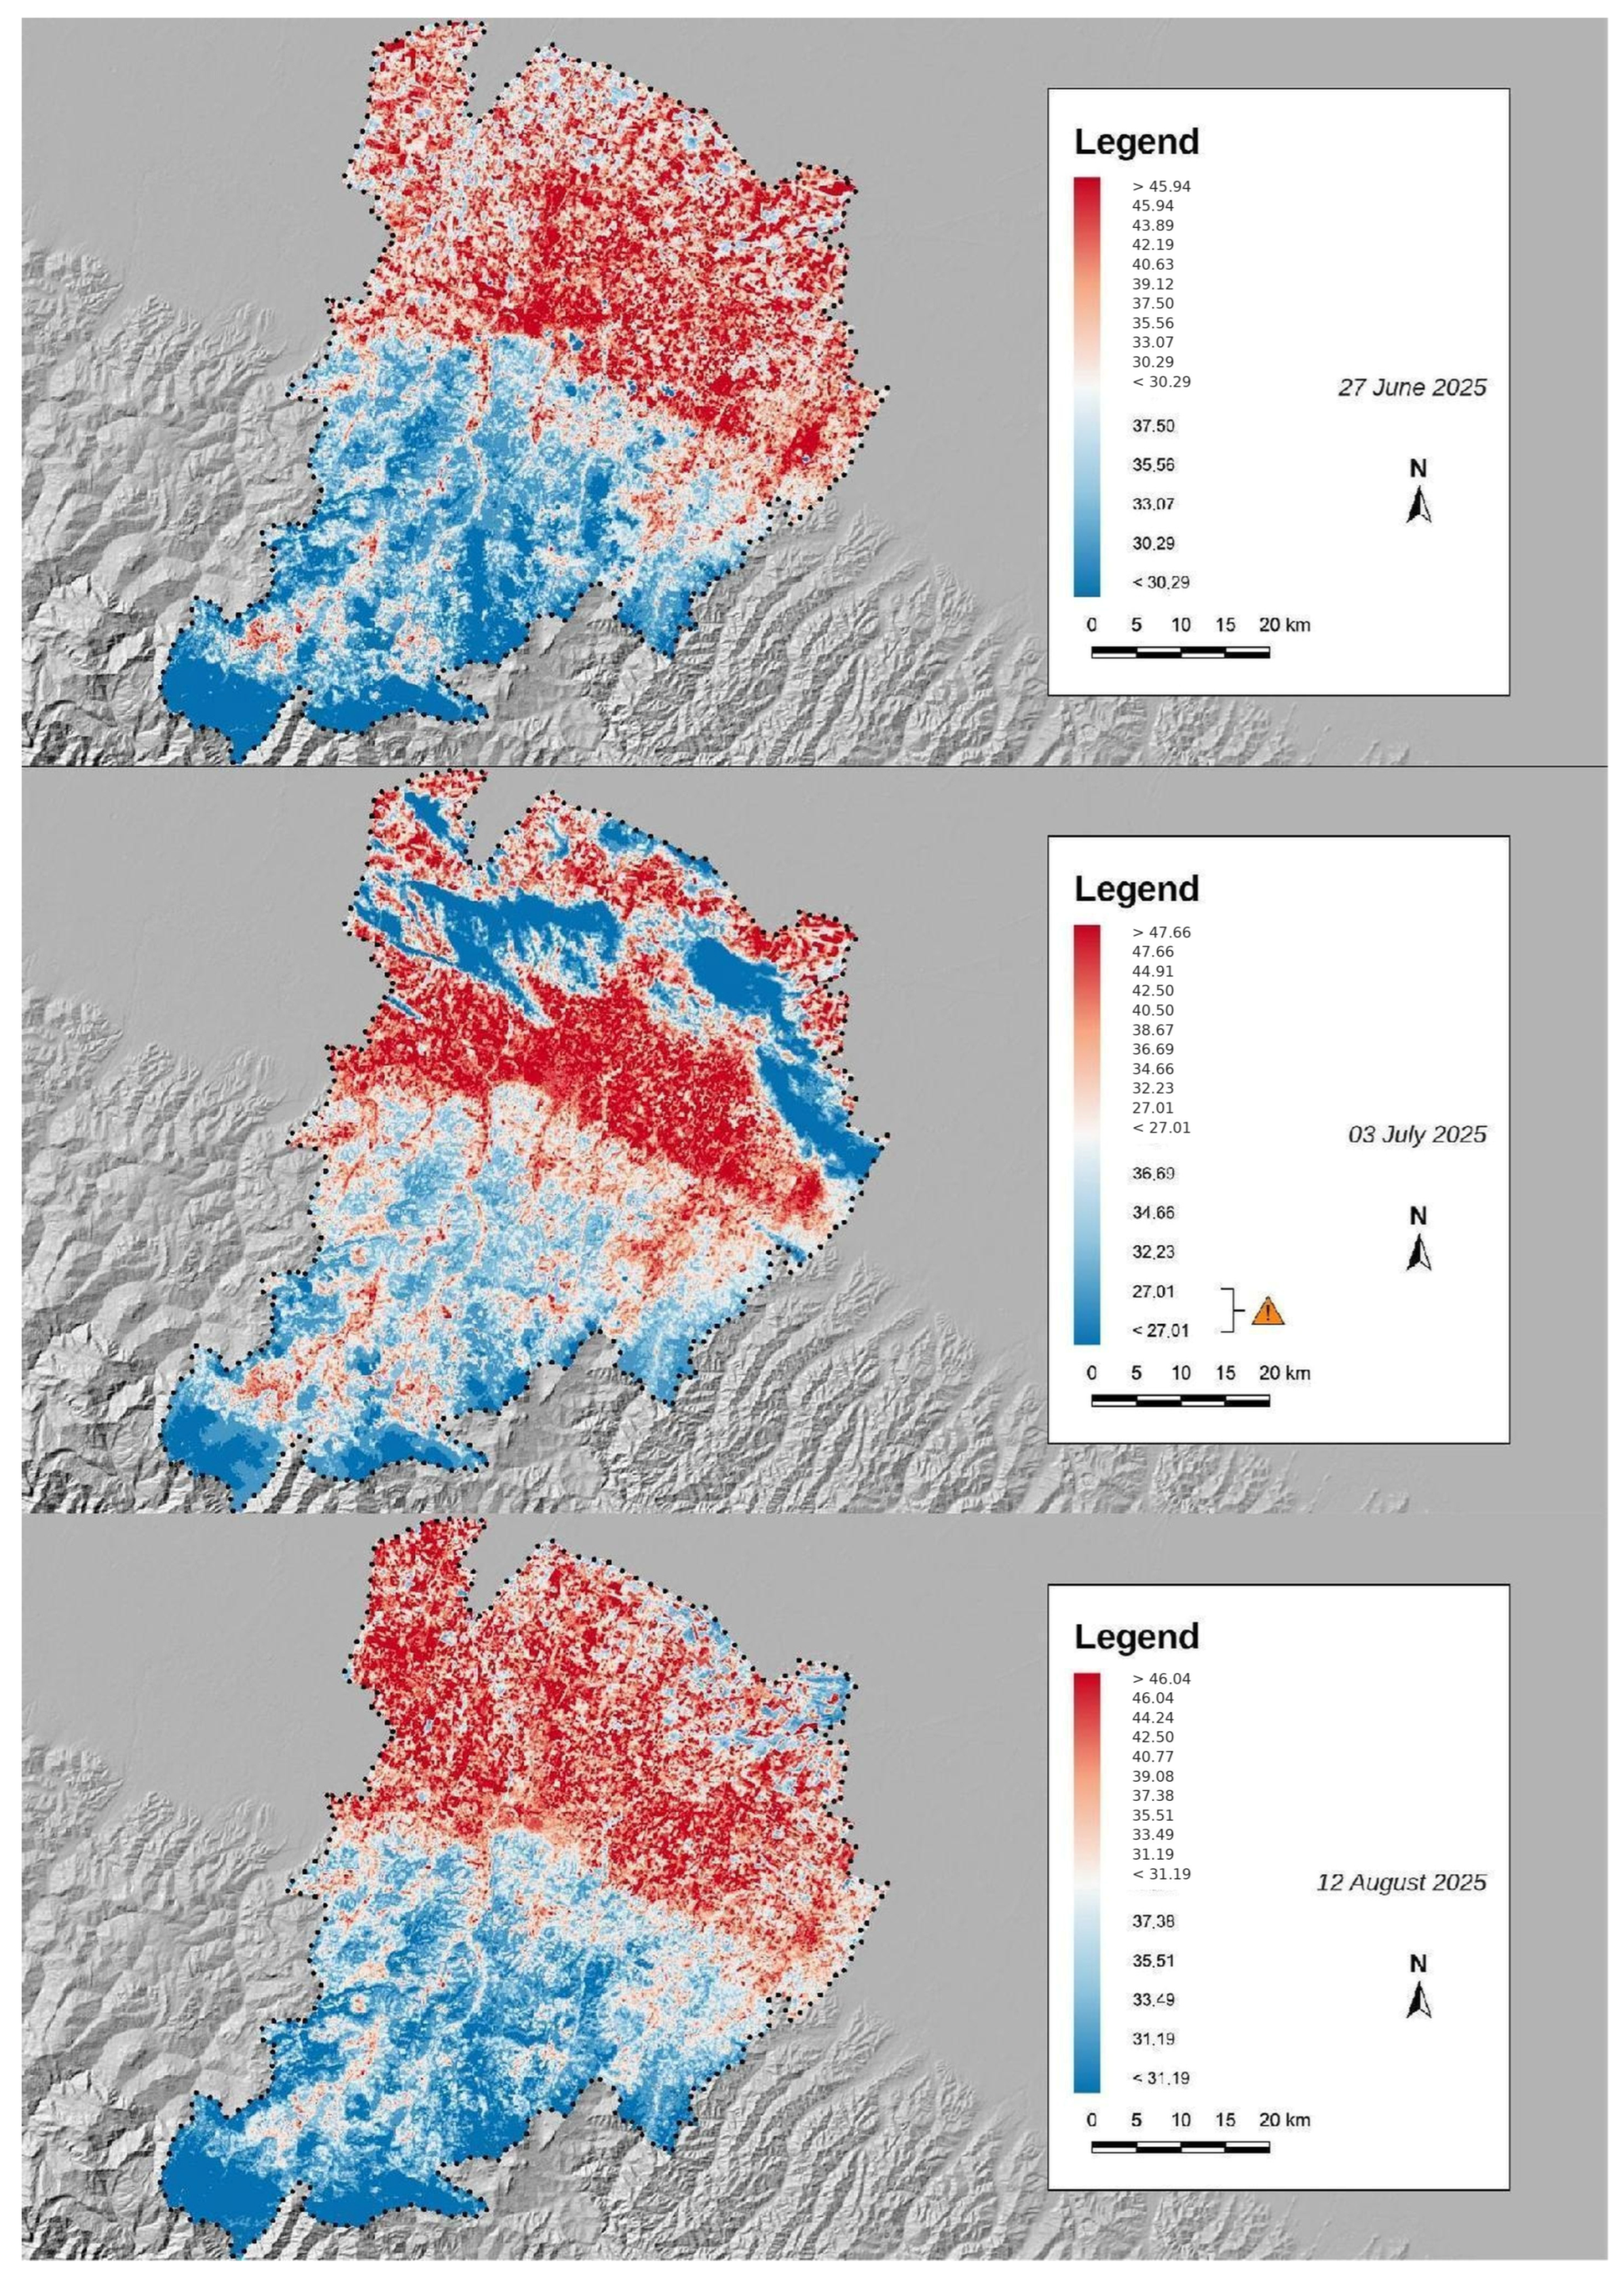
Three families of open sources are harmonised to common spatial units and reference dates. OpenStreetMap provides road and pedestrian network geometry, publicly accessible open spaces, and public transport infrastructure; the pedestrian network supports the interpretive accessibility elaborations only; the green KPI of Section 2.5 is an area-provision measure, and network-accessible green space within walking-time thresholds is identified as a methodological development. Copernicus Land Monitoring Service data supply the environmental layer: CORINE Land Cover and high-resolution tree-cover-density layers support canopy and green-space classification (Figure 2); the summer thermal regime is documented by Landsat 8/9 Collection 2 Level-2 Surface Temperature scenes (USGS EarthExplorer; three cloud-screened summer scenes per city, 2025—see Supplementary Materials File S2), corroborating γ_cli empirically (Figure 3 and Figure 4). National census microdata at sub-municipal resolution—ISTAT (2021) for Bologna and ELSTAT (2021) for Athens [17,18]—supply density, age structure, and derived demographic indicators. Eurostat series complete the non-spatial inputs. Three design choices deserve emphasis: identical definitions across cities, so cross-city differences reflect territory rather than measurement; sub-municipal resolution, with neighbourhood-scale distributions retained for the discussion of intra-urban inequality; and objective inputs, with the perception dimension deliberately excluded from the index and re-entering only in the interpretive discussion.
The protocol has two declared limitations. CORINE’s 25 ha minimum mapping unit is coarse for intra-urban green space, mitigated by combining CLC with the high-resolution tree-cover layer and OSM polygons. OSM completeness differs between the cities—pedestrian network coverage is denser for Bologna—introducing a potential asymmetry screened for completeness against official municipal cartography (see Supplementary Materials File S2 for the procedure adopted).

2.7. Study Context: Bologna and Athens

The comparison was conducted at the scale at which the GIS analysis was performed: the Metropolitan City of Bologna—55 municipalities, 1,010,812 inhabitants at the 2021 census (1,024,290 in the 2026 preliminary estimate) over 3702 km2, for a density of 273 inhabitants/km2—and the Athens–Piraeus urban agglomeration—40 municipalities, 3,059,758 inhabitants over approximately 412 km2, for a density of 7427 inhabitants/km2—within the continuous urban fabric at the core of the ~3.8-million Attica region. Bologna is the capital of Emilia-Romagna, heir to one of Europe’s most continuous planning traditions, from the 1889 master plan through the ‘Bologna model’ of historic-centre conservation to the PUG 2021; its smart city trajectory runs from the 2010 Smart City Platform memorandum to an integrated municipal digital twin explicitly linked to statutory planning instruments. The Athens–Piraeus agglomeration was shaped by the antiparochì densification system, which produced the polykatoikia city and its chronic open-space scarcity; its smart city trajectory is compressed and recent, spanning the Resilience Strategy 2030, the DAEM digitalisation of over 200 municipal services, and the DUET digital twin pilot. Two structural contrasts define the most-different design at this scale: a territorial density contrast of twenty-seven to one (273 vs. 7427 inhabitants/km2) and diverging ageing profiles—ageing index 199.8 for the Bologna metropolitan area against 170.4 for the agglomeration—while, notably, the two core municipalities are nearly identical on this measure (211.3 and 210.9). One scale distinction must be declared explicitly: the urban green classification of Section 3.2 is performed on the two core municipalities (Bologna, 140.86 km2; Dímos Athinaíon, 38.96 km2) under an identical definition, whereas contextual coefficients and demographic profiles are computed at the study-area scale; this nested design preserves like-for-like comparability at both levels [6,19,20,21].

3. Results

3.1. Contextual Profiles

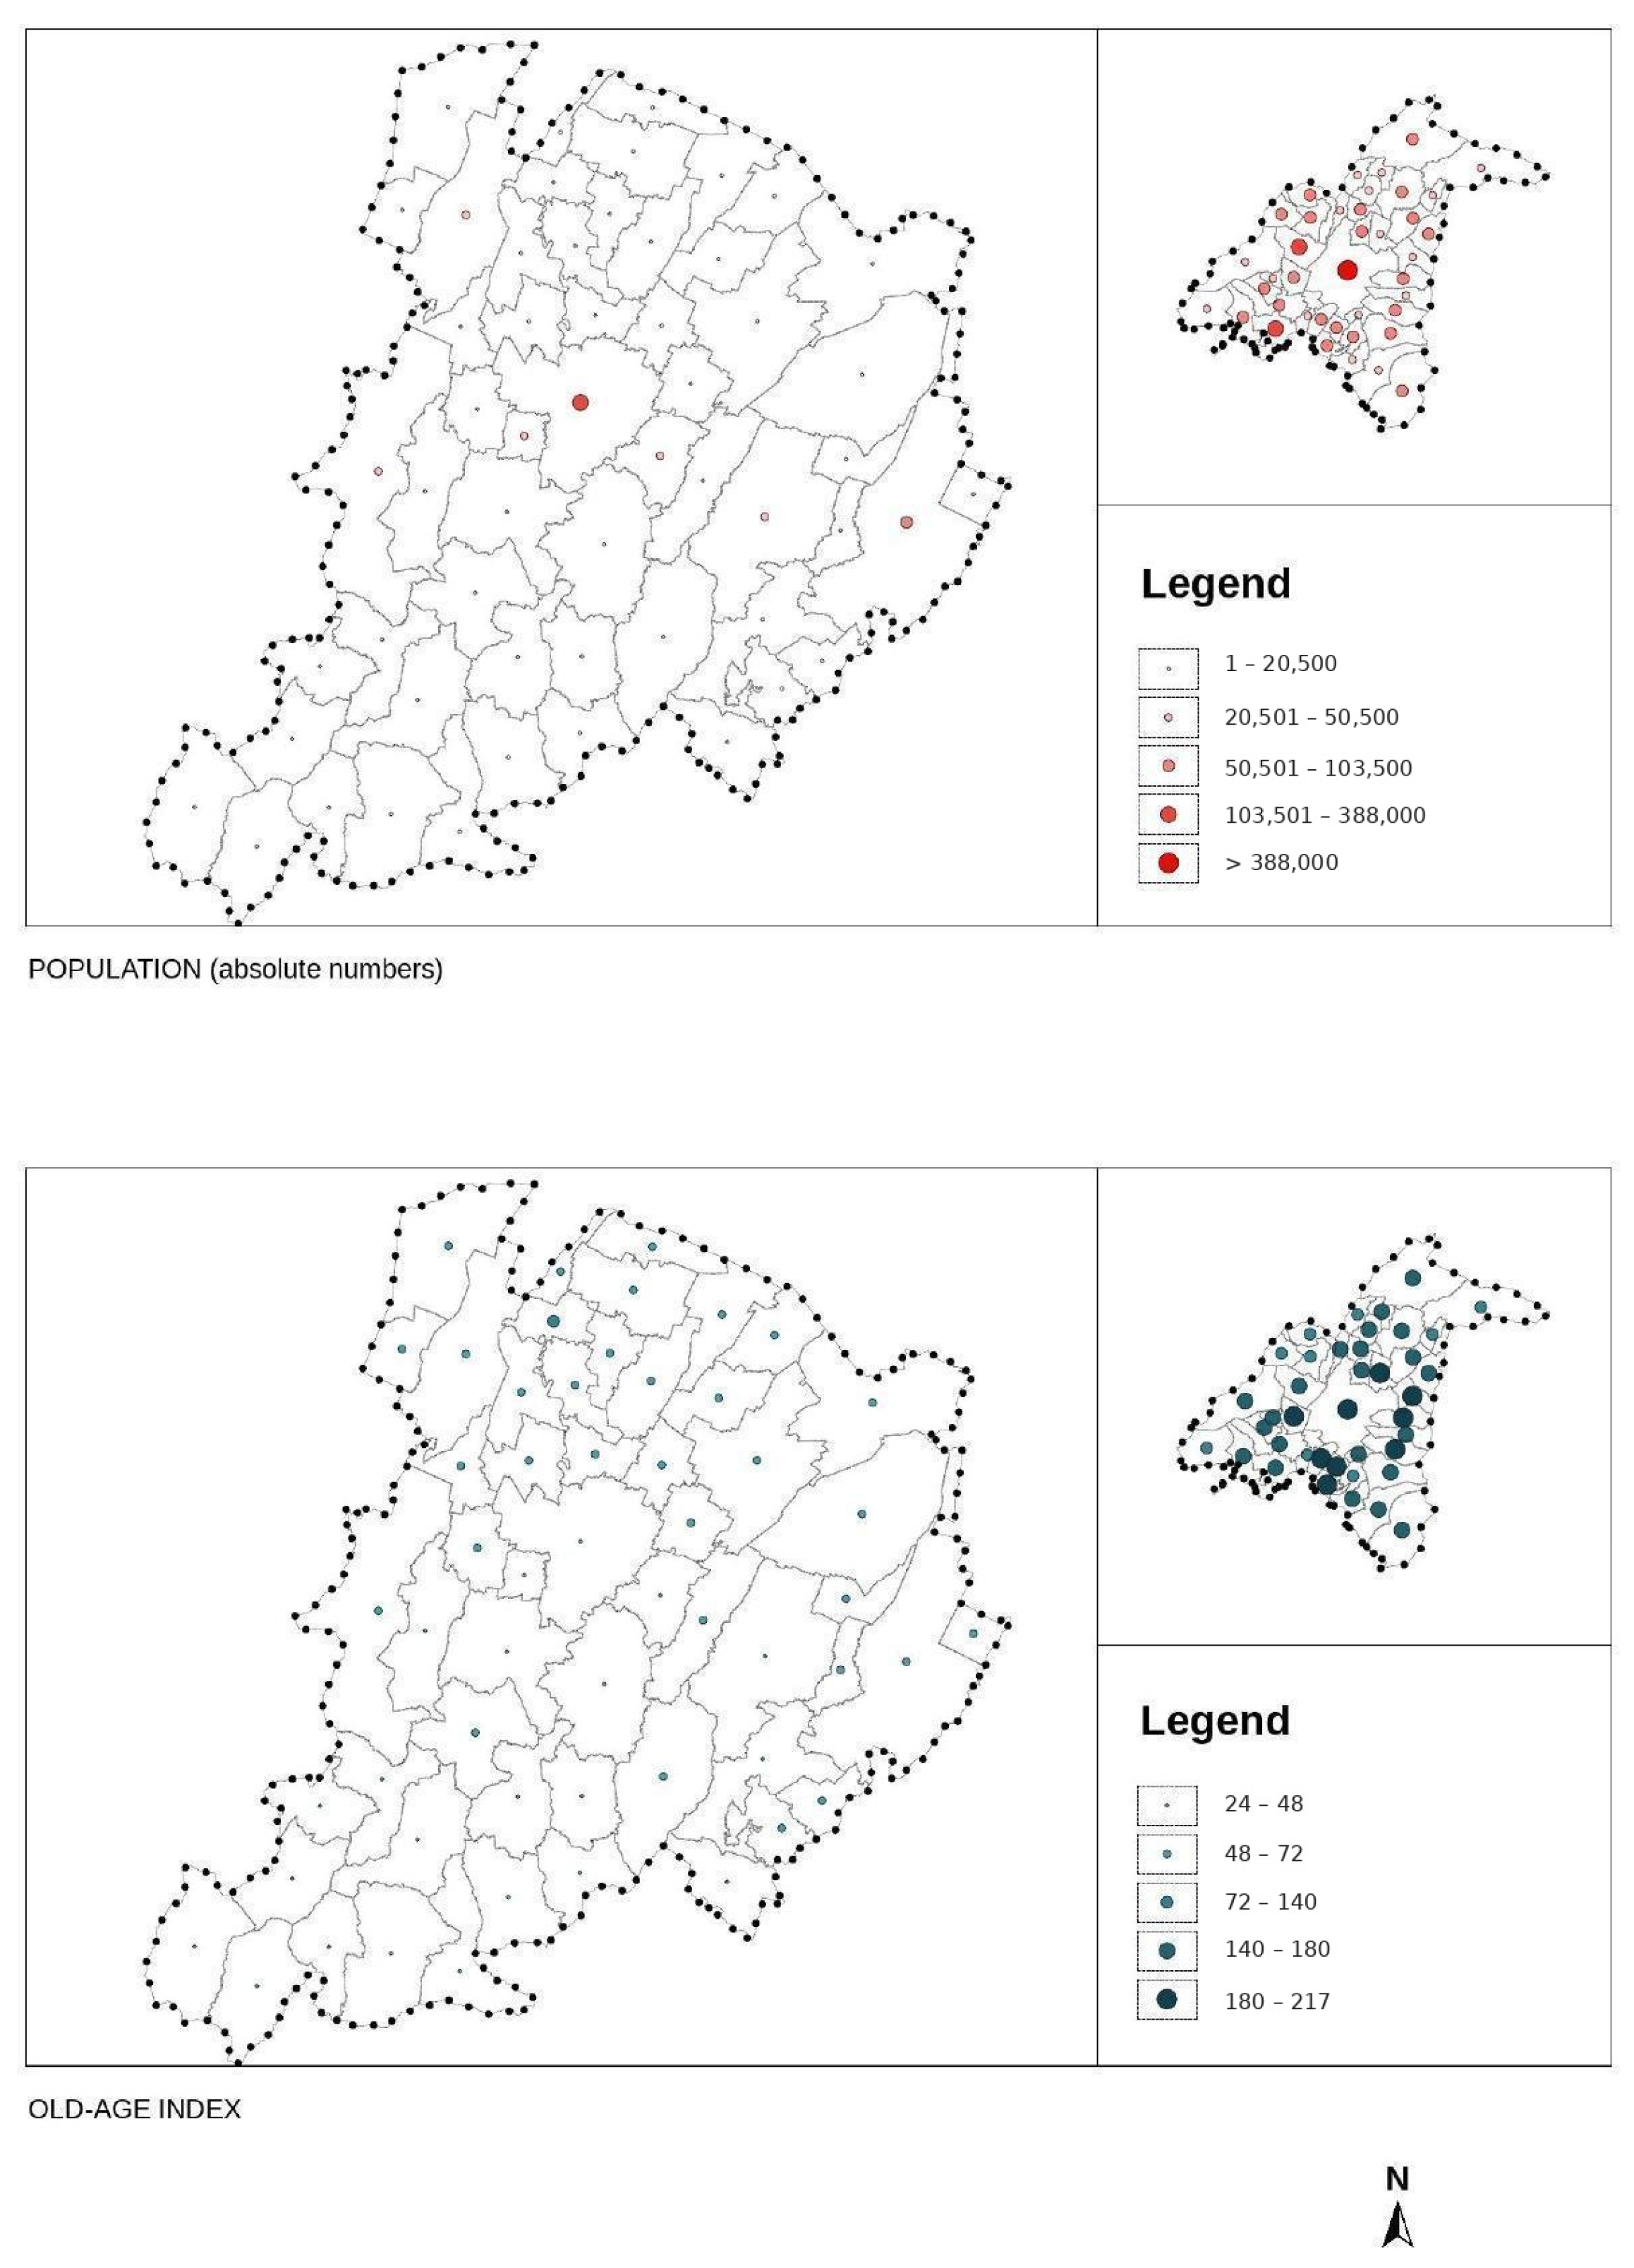
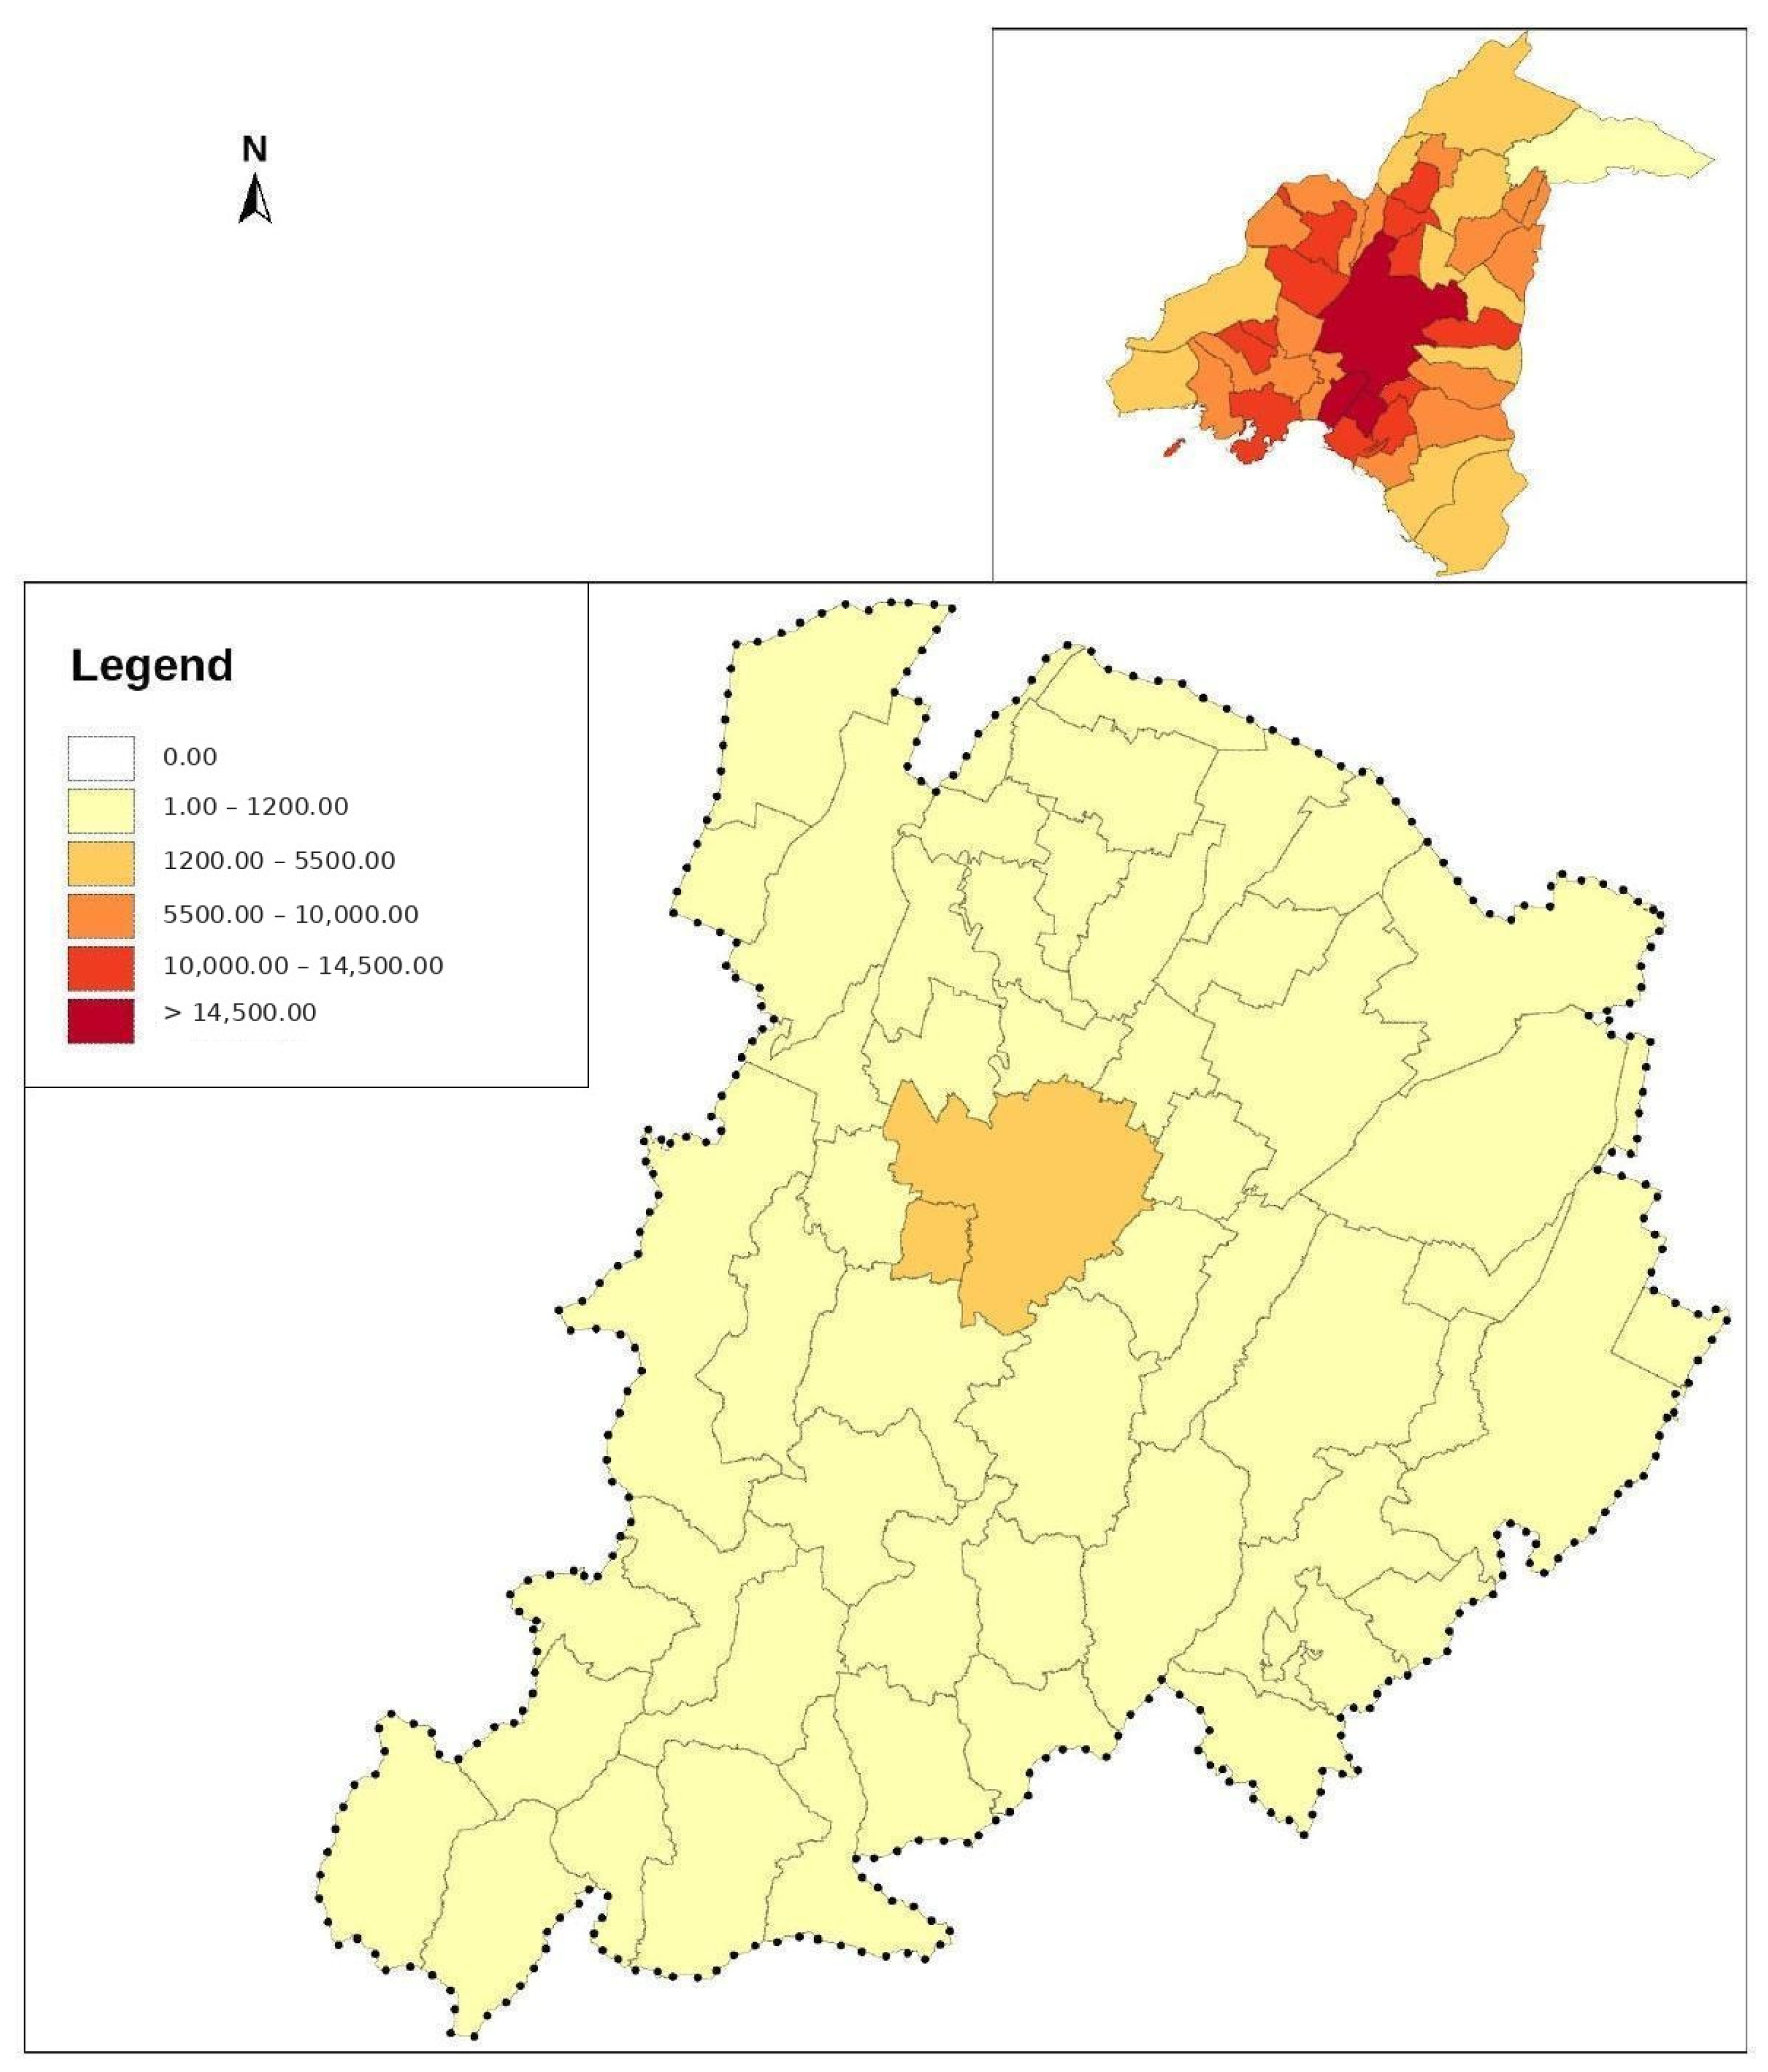
Table 2 reports the five geographic coefficients. Demographic coefficients are computed directly from the 2021 census rounds at study-area scale (Figure 5 and Figure 6): the Bologna Metropolitan City records 273 inhabitants/km2 and a 65+ share of 24.6% (248,420 residents; ageing index 199.8) from ISTAT; the Athens–Piraeus agglomeration records 7427 inhabitants/km2 and a 65+ share of 21.6% (659,435 residents; ageing index 170.4) from ELSTAT [17,18]. Climatic coefficients reflect the Köppen classification and days above 20 °C—Bologna at the Cfa/Csa boundary (~130 days), Athens a core Csa climate (~165 days)—corroborated by the land-surface-temperature elaborations documenting the pronounced summer urban heat island of the Athens basin, where long-term monitoring has recorded intensities approaching 10 °C and demonstrated the moderating role of urban green areas [22]. Economic coefficients derive from the formula of Section 2.4 (γ_eco = 1 − GDP_PPP/€80,000): ~€43,000 for Bologna and ~€23,000 for Attica yield 0.46 and 0.71 [23]. Historical coefficients express the share and constraining role of the historic fabric: Bologna’s UNESCO porticoes system and dense medieval core yield 0.65; Athens’ proportionally smaller historic-archaeological core, with pervasive archaeological constraints, yields 0.55.

3.2. KPI Values and Normalisation

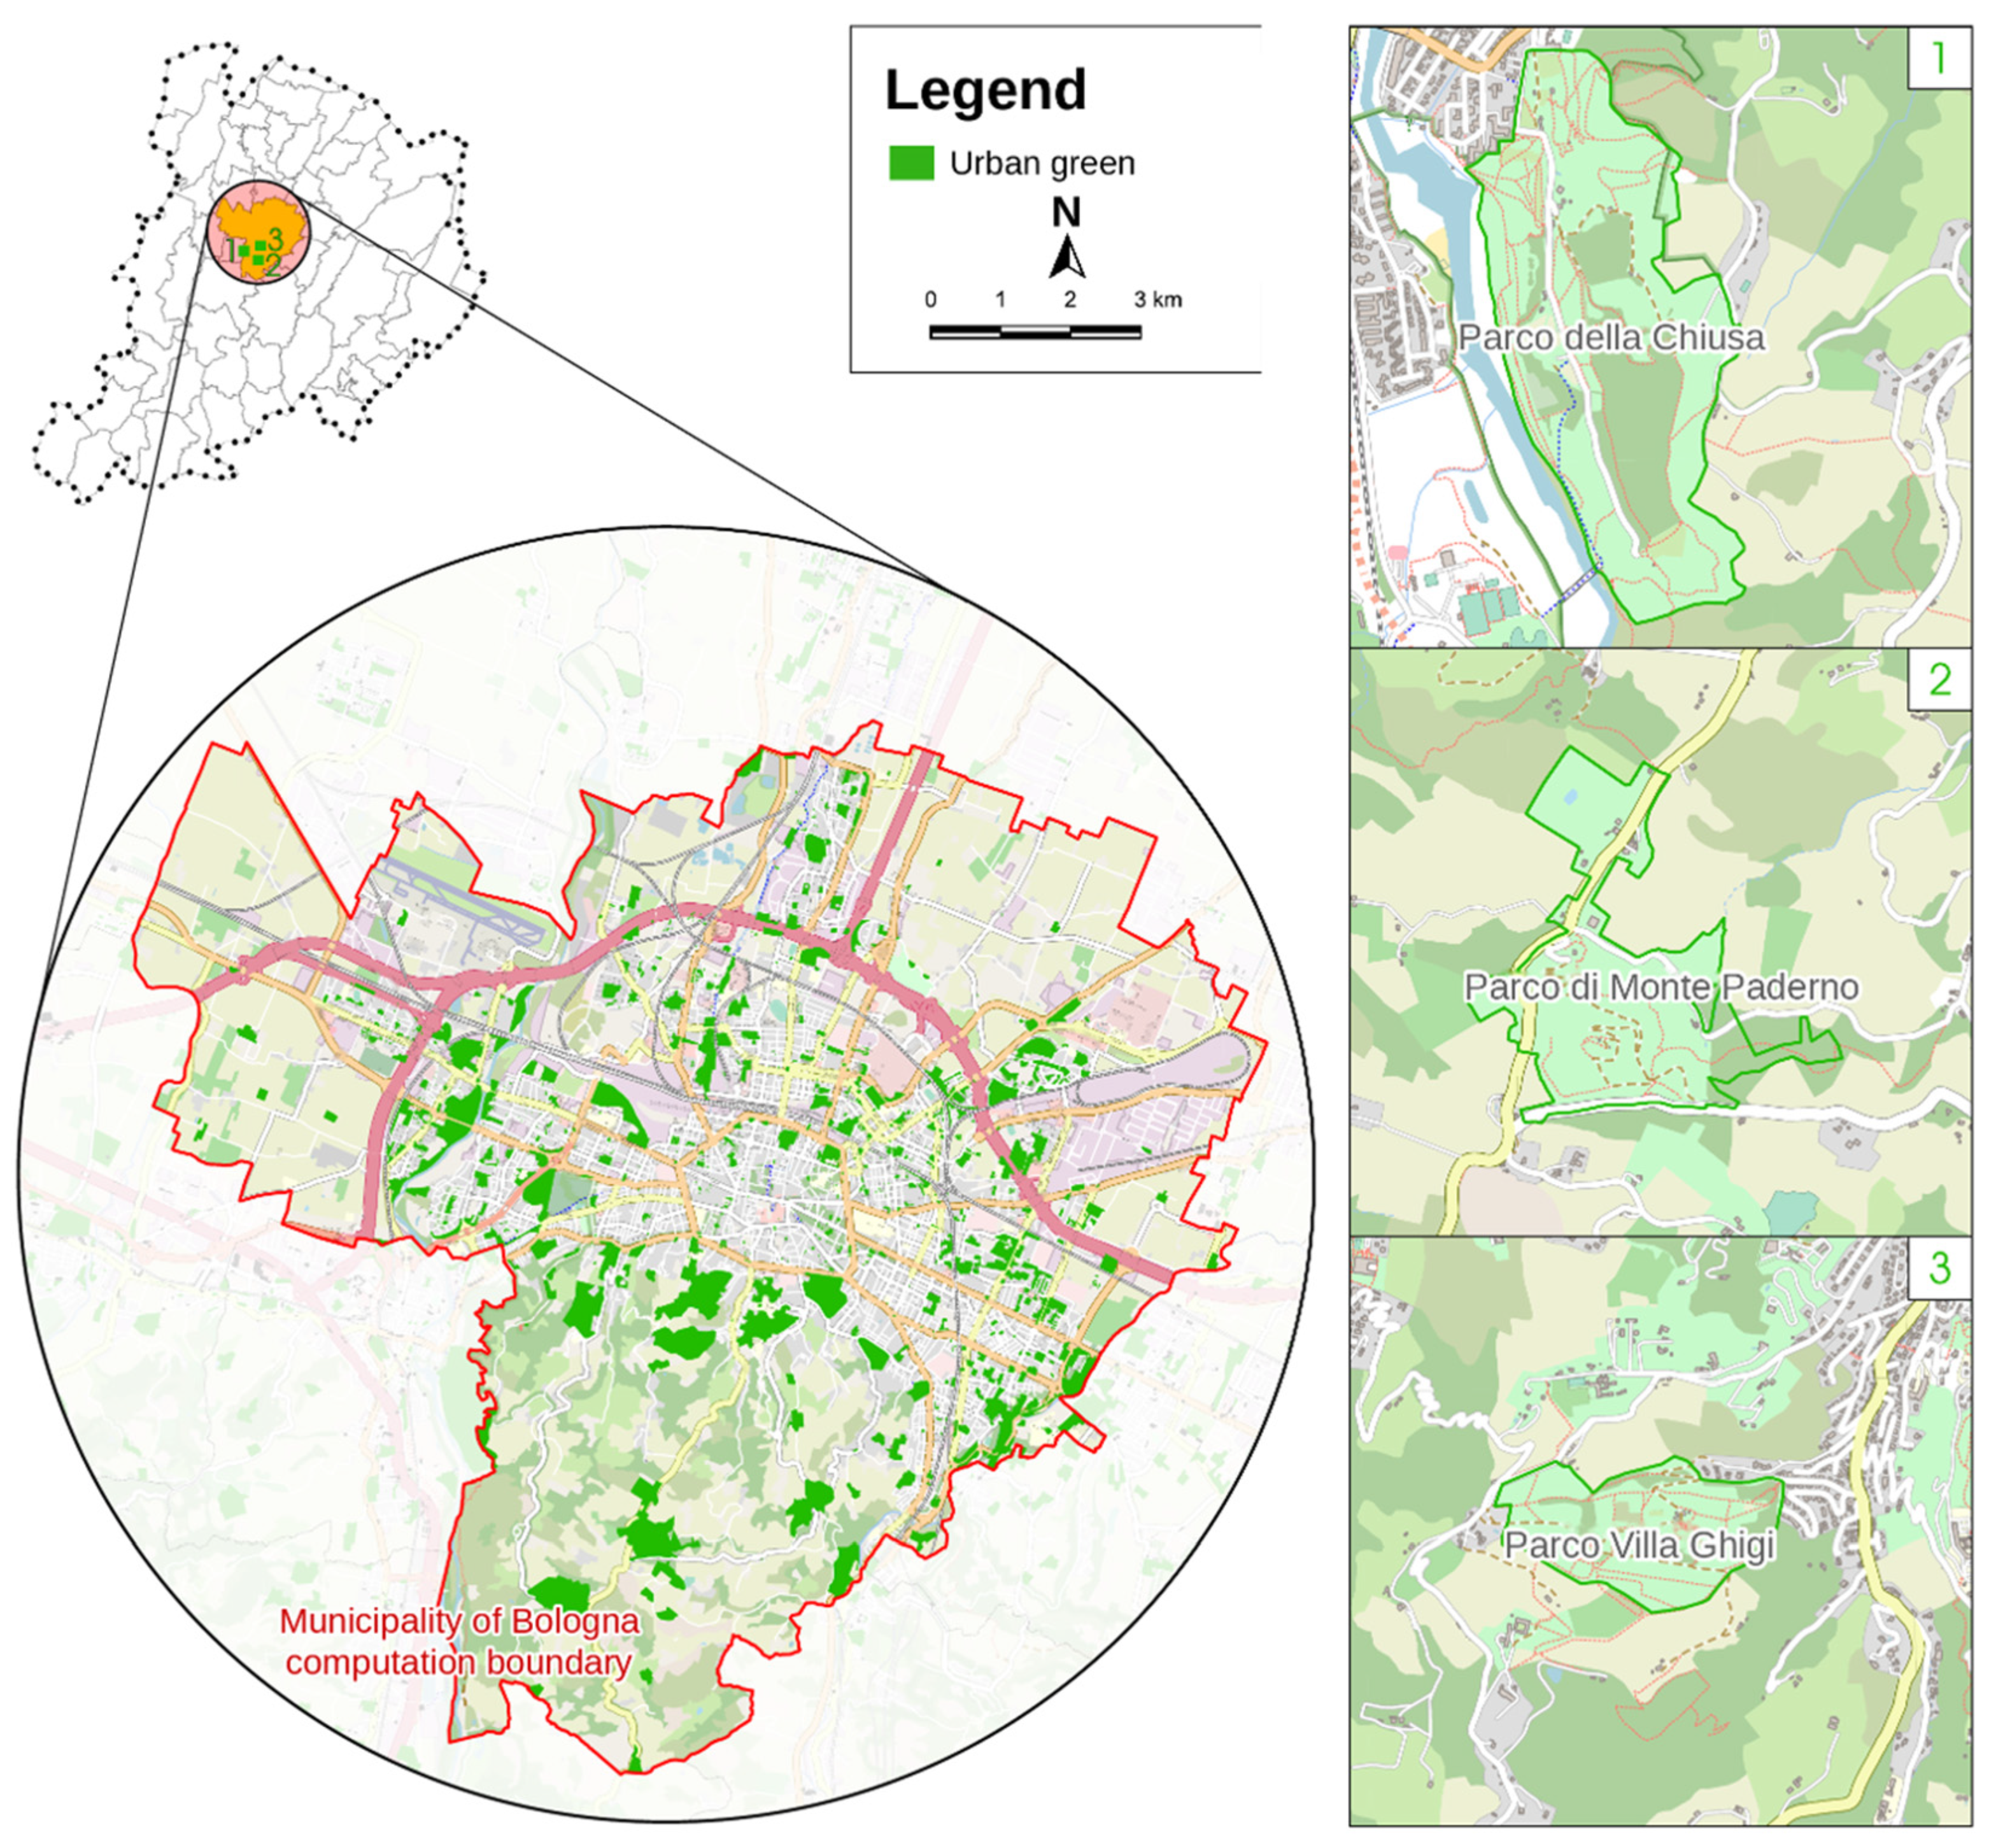
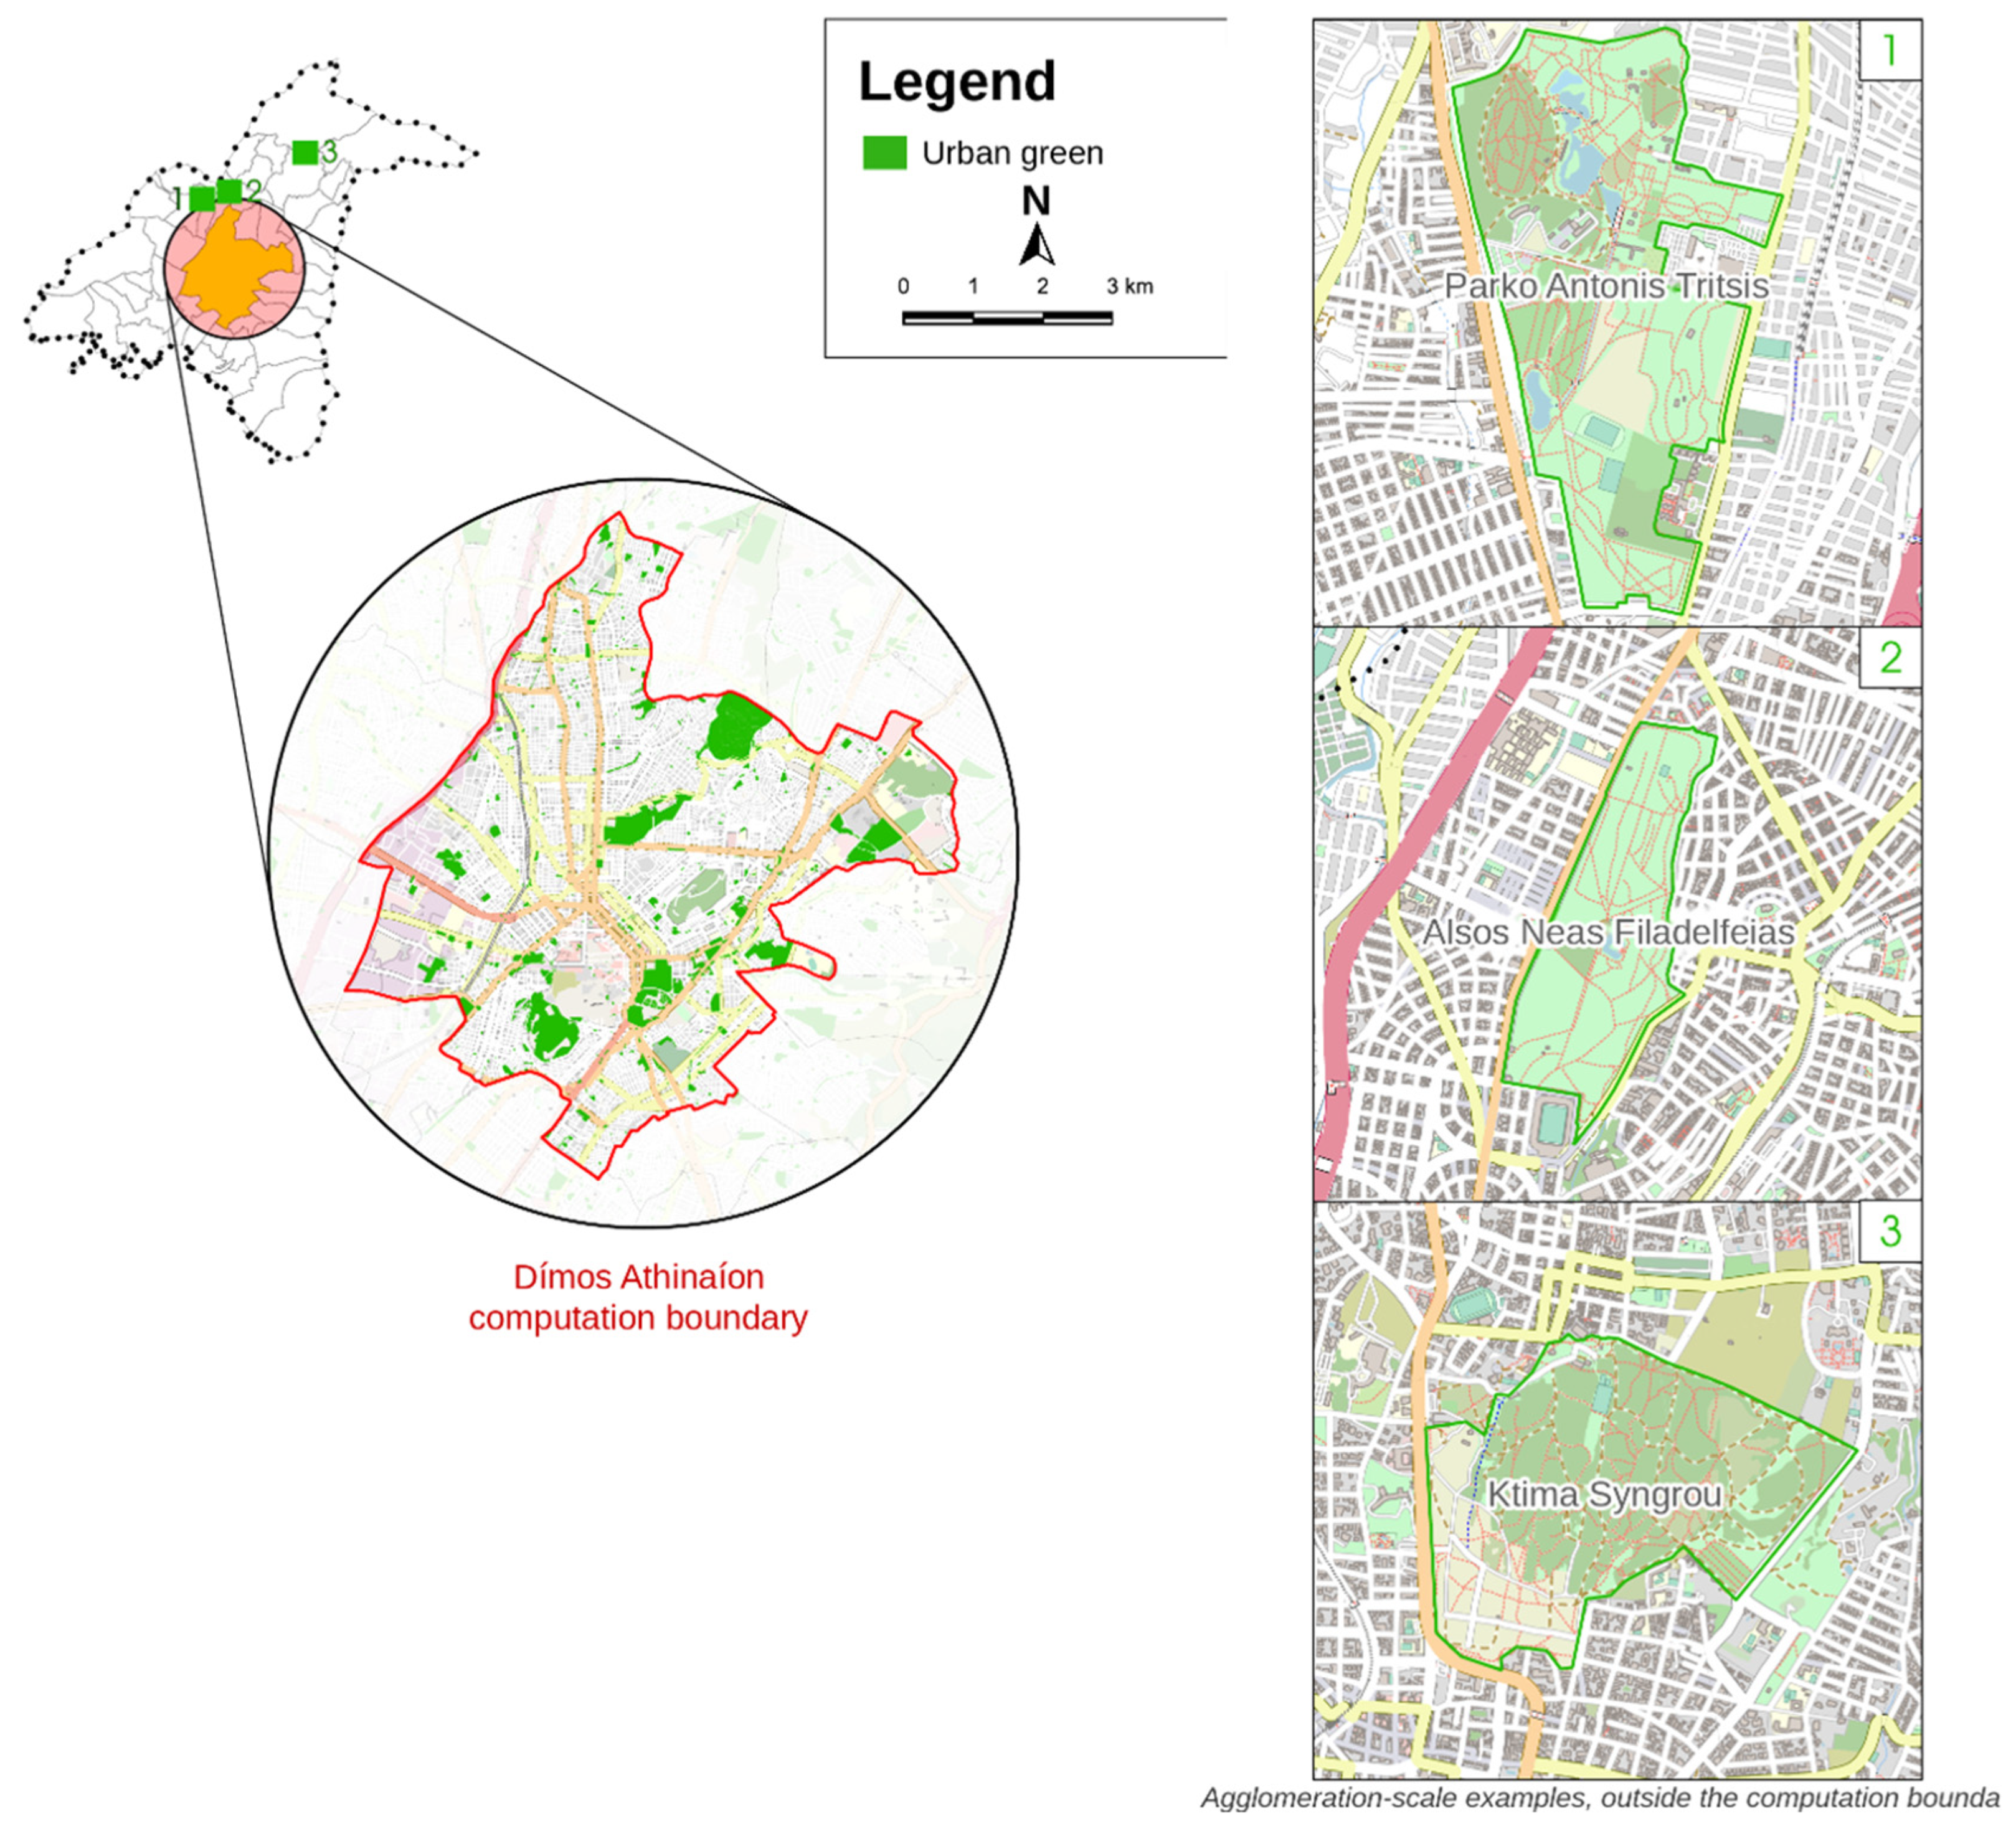
Table 3 reports observed KPI values and normalised scores. Urban green provision is computed from the urban green layer produced by the GIS analysis of this study, under an identical definition and procedure for the two core municipalities (Bologna; Dímos Athinaíon): classified urban green within the municipal boundary (Figure 7 and Figure 8) amounts to 9.3 km2 in Bologna (6.6% of the municipal area) and 2.7 km2 in Athens (6.9%), corresponding to 24.0 and 4.2 m2 per inhabitant against the 2021 census populations. Two observations follow. First, the Bologna value independently confirms the 22.4 m2/inhabitant reported by secondary sources, validating the classification. Second, and more significant for the argument of this paper, the two cities devote a nearly identical share of municipal territory to urban green (6.6% vs. 6.9%): the six-fold per-capita gap is entirely a density effect at the core-municipality scale (2756 vs. 16,972 inhabitants/km2) rather than a difference in green endowment. This is precisely the kind of contextual structure that a-spatial indicators conceal. The soft mobility share for Athens combines a walking share of ~16% with cycling below 2%. Tree canopy cover is ~17% for Bologna and ~11% for Athens (European Environment Agency—urban tree cover dataset). Housing affordability reflects Greece’s acute rental stress: 52% of Greek renters spend more than 30% of income on rent, with central Athens asking rents of €10–11/m2 against a median net salary near €1100/month, yielding 0.45—marginally worse than Bologna’s 0.50 [24,25]. Digital services adoption is proxied symmetrically by the national Eurostat e-government indicator (2024): 55.1% for Italy—among the three lowest EU values—against 66.3% for Greece, where uptake accelerated sharply after the gov.gr reform and, in Athens, the DAEM digitalisation programme (Eurostat—E-government activities of individuals via websites, isoc_ciegi_ac, 2024; ELSTAT—Survey on ICT Usage by Households and Individuals, 2024).

3.3. Context-Weighted Scores and Comparative Analysis

Applying Equation (3) to the two contextual profiles and normalising yields the weight vectors and scores in Table 4. The unweighted (equal-weights) aggregation gives 0.753 for Bologna and 0.479 for Athens; the context-weighted aggregation gives CWLI = 0.763 for Bologna and CWLI = 0.475 for Athens (values reflect the formalised coefficients of Section 2.4).
Three findings answer the research questions. First (RQ1), the weighting effect is real but deliberately small: contextual weighting shifts the aggregate score by +0.010 for Bologna and −0.004 for Athens relative to equal weighting, while concentrating 64.8% and 61.4% of total weight on the three climate-sensitive indicators (60% under equal weights). The redistribution is city-specific in direction—Bologna down-weights housing affordability (0.176 vs. 0.200), and Athens retains nearly full weight on it (0.188)—but the weighting layer remains close to equal weighting: a structural property of the additive normalised formulation, acknowledged in Section 2.3. Second (RQ2), the diagnostic content is carried by the contribution decomposition, which is stable across weighting schemes: under equal weights and under contextual weights alike, digital services are Athens’ largest contribution (0.187, 39% of its total score) and urban green provision is Bologna’s (0.213), while Athens’ green contribution (0.035) is the smallest cell of the entire comparison. The decomposition, not the weighting shift, relocates Athens’ deficit from the technological register to the morphological–environmental one—the legacy of the antiparochì densification—and this relocation is consistent with the IMD’s own pillar-level evidence: in the 2026 edition, Athens (139th) records higher Technology than Structures scores, the pattern the IMD analysis itself associates with governance- and infrastructure-constrained cities, in contrast with the top performers, which lead on Structures. Rank position alone, therefore, cannot be read as a technological diagnosis, a correction we adopt from the reviewers. Third, the two cities’ weight vectors differ far less than their contribution vectors, motivating the uncertainty analysis of Section 3.4 and the sharper parameterisations discussed in Section 4.

3.4. Sensitivity and Monte Carlo Uncertainty Analysis

Robustness (RQ3) is tested in three ways, with all computations reproducible from the Supplementary Script (random seed 42). First, individual perturbation: each of the twenty-five sensitivity scalars is perturbed by ±10% with row re-normalisation; the CWLI varies by less than ±0.002 in both cities. Second, a broadened Monte Carlo experiment (5000 draws) simultaneously perturbs all sensitivity scalars (±10%), the expert-assessed coefficients γ_cul and γ_his (±0.10, additive), the data-based coefficients (±5%), KPI measurements (±5%), and reference benchmarks (±10%). The resulting distributions are: Bologna mean 0.765, SD 0.023, [p5, p95] = [0.728, 0.804]; Athens mean 0.477, SD 0.016, [0.452, 0.503]. The Bologna–Athens gap is positive in 100% of draws (mean 0.289, minimum 0.190), and the diagnosis is stable: digital services are Athens’ largest contribution in 100% of draws, and urban green provision Bologna’s in 96.9%. Third, boundary sensitivity: recomputing all components on harmonised core-municipality boundaries (γ_dem from municipal density and age structure; all other inputs unchanged) yields CWLI 0.764 for Bologna and 0.481 for Athens, against 0.763 and 0.475 under the nested design, a maximum shift of 0.006 that leaves ordering, gap, and contribution ranking unchanged. The nested spatial design is therefore not a source of diagnostic instability, although the modifiable areal unit problem is acknowledged as a structural limitation in Section 4. Finally, a one-at-a-time variance decomposition of the Monte Carlo analysis identifies where output uncertainty originates. The percentages are one-at-a-time variance ratios: for each uncertainty source j, all other sources are held at their nominal values and the ratio Varj/Varm is computed, where Varm is the variance of the full Monte Carlo model (5000 draws, common random seed). Because the sources interact through the multiplicative benchmark term, these ratios are not additive shares and their sum can marginally exceed 100% (102.1% for Bologna, 101.5% for Athens); the small excess indicates weak interaction effects. Benchmark uncertainty dominates (82.4% and 80.7% of output variance for Bologna and Athens, respectively), followed by KPI measurement error (19.4% and 19.7%), while the entire parameterisation of the weighting layer—sensitivity scalars and geographic coefficients combined—accounts for 0.3% and 1.1%. The diagnostic conclusions are thus insensitive to the judgement-based components of the framework, and most sensitive to the choice of reference benchmarks, which are accordingly reported with explicit sources and uncertainty bands.

4. Discussion

The comparative application demonstrates that context-weighted aggregation is more than a numerical recalibration: it materially changes the diagnostic reading of urban performance. Three distinct implications emerge for the scholarly critique of smart city metrics, constrained by three methodological limitations that delineate the scope of these findings.

4.1. Implications

Initially, evaluative instruments must formalise and parameterise the geographic specificities through which performance metrics are translated. While monolithic international benchmarks facilitate high-level comparisons, they remain structurally misaligned with local governance requirements: the same urban centre relegated to the lower quartiles by context-blind rankings reveals itself, through contextual weighting, as a digitally mature environment facing morphological limitations—a divergence in diagnostic outcomes that points to differently targeted policy interventions. For Mediterranean urban administrations, the operational corollary is that strategic investments in climate-contingent KPIs—encompassing public amenities, active transport, and arboreal density—may yield non-linear dividends in perceived quality of life relative to capital expenditure; this remains a preliminary hypothesis requiring longitudinal validation. Such diagnostic insights extend beyond immediate welfare into the domain of regional competition: the longitudinal analysis by Marchesani and colleagues confirms that technological maturity and urban liveability function as synergistic determinants for the residential preferences of younger cohorts. This suggests that the robust digital performance of Athens will yield diminishing returns in talent attraction until its structural territorial constraints are mitigated, thereby situating the CWLI decomposition as a critical instrument for navigating the contemporary landscape of urban competitiveness [2]. Furthermore, the observation that both municipalities allocate a remarkably congruent proportion of their administrative territory to urban green space—despite a six-fold disparity in per-capita provision—underscores the analytical necessity of spatially explicit metrics: this divergence is primarily a function of inherited urban density, reflecting the structural legacy of the antiparochì regime in Athens rather than a deficit in municipal environmental strategy. Consequently, the requisite policy interventions must diverge, prioritising the management of densification and the deployment of micro-greening initiatives over conventional land acquisition. Finally, the ASCIMER framework, when enhanced by a formalised weighting architecture, achieves operational parity with IMD-style benchmarks; the CWLI functions as a methodological bridge between these evaluative paradigms, while its reliance on open-data GIS protocols ensures its replicability across the Mediterranean region with minimal institutional expenditure [7].

4.2. Limitations and Refinements

Three limitations should be acknowledged. First, the sensitivity matrix is theoretically motivated but not empirically calibrated; the compression of weights observed in Section 3.3 indicates that the additive composition of Equation (3), combined with contextual profiles that are jointly high on climate and culture, limits the differentiation of the weighting layer itself. Two refinements follow for future work: sharper, expert-elicited parameterisations and a multiplicative (geometric) composition, which would both increase weight differentiation and limit the full compensability of the linear form, under which, for instance, Athens’ digital strength arithmetically offsets its open-space deficit. The non-compensatory route is not hypothetical: DP2-based aggregation has been applied to the IMD indicators with hierarchical clustering, and its city profiles converge with ours—Bologna’s proximity-and-liveability domain is among the strongest in that sample, and Athens’ digital readiness is its best relative dimension—a convergence obtained from entirely different inputs (perception surveys versus territorial open data) and aggregation logics, which strengthens both diagnoses [11]. The natural synthesis, a DP2-type aggregation whose distance components are modulated by geographic coefficients, requires a city sample rather than a pair and is reserved for the multi-city extension. Second, the choice of reference values embeds a normative assumption about what good performance means; transparent justification is essential for transferability, and city-panel calibration of references is a natural extension. Third, three input values warrant strengthening: the Athens walking share relies on a dated source and should be updated with Attica SUMP data; the urban green values, here derived from the study’s own GIS layer, should be finalised through zonal statistics on the source shapefiles; and national e-government figures proxy municipal uptake, a simplification that sub-national digital statistics would remove where available.

5. Conclusions

The present inquiry operationalises the mandate established by our preceding critique of urban intelligence metrics, supplying the formal weighting architecture previously identified as a paramount trajectory for subsequent research. Through the synthesis of five geographic coefficients and a transparent sensitivity matrix, the CWLI formalises context-weighted aggregation, leveraging a replicable GIS protocol to demonstrate—via the comparative case of Bologna and Athens—that contextual calibration functions as a city-specific diagnostic instrument whose analytical rigor is evidenced by the resulting contribution decomposition. The framework is structured as a preliminary two-city proof of concept, wherein the primary contribution remains diagnostic rather than merely arithmetic: while an aggregate rank position, interpreted in isolation, might imply a technological deficit in Athens’ performance, the CWLI decomposition reveals a digitally mature urban environment whose liveability constraints are fundamentally territorial, stemming from the structural scarcity of open space in one of Europe’s most densely articulated municipal cores, whereas Bologna exhibits the inverse contextual profile. Any evaluative instrument incapable of registering this distinction fails to provide meaningful policy guidance; conversely, the framework developed here, despite the relative simplicity of its linear formulation, successfully transforms a monolithic ranking into a rigorous policy diagnosis. In doing so, it offers municipalities a monitoring instrument aligned with SDG 11: equitable access to green and public space (target 11.7), sustainable mobility (11.2), and adaptive climate governance correspond precisely to the climate-sensitive indicators toward which contextual weighting redistributes evaluative attention, so that the index reads as an operational bridge between smart city assessment and the sustainable urban transition agenda, answering the recognised need to recalibrate city-level indicators for intra-urban conditions in SDG 11 monitoring [14].
Future research proceeds along three lines. First, empirical calibration of the sensitivity matrix through expert elicitation (Delphi/AHP) and testing of multiplicative and non-compensatory (DP2-type) formulations. Second, extension of the framework to a panel of Mediterranean cities—Barcelona, Marseille, Valencia, Thessaloniki—to move from comparative demonstration to regional evidence. Third, integration with urban digital twin platforms: digital twins such as Bologna’s Gemello Digitale can supply real-time KPI data at fine spatial resolution, while context-weighted aggregation provides the interpretive layer translating technological monitoring into liveability-oriented planning decisions [26,27] stand to benefit from evaluation frameworks that recognise the specificity of their climatic, cultural, economic, historical and demographic conditions, rather than penalising them for not conforming to templates defined elsewhere.

Supplementary Materials

The following supporting information can be downloaded at: https://www.mdpi.com/article/10.3390/su18178723/s1, File S1: Literature-to-Parameter Correspondence for the Sensitivity Matrix; File S2: GIS Data and Processing Metadata. Supplementary Script: cwli_computation (1). References [28,29,30,31,32,33,34] are cited in the Supplementary Materials.

Author Contributions

Conceptualization, M.G. and A.B.; methodology, M.G.; software, M.G.; validation, M.G. and A.B.; formal analysis, M.G.; investigation, M.G.; data curation, M.G.; writing—original draft preparation, M.G.; writing—review and editing, A.B.; supervision, A.B. All authors have read and agreed to the published version of the manuscript.

Funding

This research received no external funding. The APC was funded by University of Padova PhD research funds.

Institutional Review Board Statement

Not applicable.

Informed Consent Statement

Not applicable.

Data Availability Statement

All spatial inputs were derived from open data (OpenStreetMap, Copernicus Land Monitoring Service, USGS Landsat Collection 2 Level-2, ISTAT, ELSTAT, Eurostat). The computation script reproducing all results (cwli_computation.py; earlier review rounds referred to it as gwli_computation.py) is provided as Supplementary Material.

Conflicts of Interest

The authors declare no conflicts of interest.

References

  1. IMD Business School for Management and Leadership Courses. Transparency and Public Trust Are Key to Urban Success, IMD Smart City Index 2026 Finds. Available online: https://www.imd.org/news/competitiveness/transparency-and-public-trust-key-to-urban-success/ (accessed on 22 July 2026).
  2. Marchesani, F.; Masciarelli, F.; Prencipe, A. Smart cities as mortal engines: Competing for generations Y and Z through livability and digital technologies. Cities 2026, 170, 106659. [Google Scholar] [CrossRef] [Scilit]
  3. Bove, A.; Ghiraldelli, M. Smart but Unlivable? Rethinking Smart City Rankings Through Livability and Urban Sustainability: A Comparative Perspective Between Athens and Zurich. Sustainability 2025, 17, 8901. [Google Scholar] [CrossRef] [Scilit]
  4. Petrei, F. Gemello Digitale. Fondazione IU Rusconi Ghigi. Available online: https://fondazioneiu.it/progetto/gemello-digitale/ (accessed on 22 July 2026).
  5. Galderisi, A.; Limongi, G.; Salata, K.-D. Strengths and weaknesses of the 100 Resilient Cities Initiative in Southern Europe: Rome and Athens’ experiences. City Territ. Archit. 2020, 7, 16. [Google Scholar] [CrossRef] [Scilit]
  6. ΔAΕΜ. H ΕΤAΙΡΕΙA. Available online: https://www.daem.gr/en/i-etaireia/ (accessed on 22 July 2026).
  7. Monzon, A. Smart Cities Concept and Challenges: Bases for the Assessment of Smart City Projects. In Smart Cities, Green Technologies, and Intelligent Transport Systems; Helfert, M., Krempels, K.-H., Klein, C., Donellan, B., Guiskhin, O., Eds.; Communications in Computer and Information Science; Springer International Publishing: Cham, Switzerland, 2015; Volume 579, pp. 17–31. [Google Scholar] [CrossRef] [Scilit]
  8. IMD Business School for Management and Leadership Courses. SCI 2026 Methodology. Available online: https://www.imd.org/smart-city-observatory/home/methodology/ (accessed on 22 July 2026).
  9. Sharifi, A. A typology of smart city assessment tools and indicator sets. Sustain. Cities Soc. 2020, 53, 101936. [Google Scholar] [CrossRef] [Scilit]
  10. Giffinger, R.; Fertner, C.; Kramar, H.; Kalasek, R.; Pichler-Milanovic, N.; Meijers, E.J. Smart Cities. Ranking of European Medium-Sized Cities. Final Report; Report; Centre of Regional Science, Vienna UT: Vienna, Austria, 2007. [Google Scholar] [CrossRef]
  11. Ivaldi, E.; Pavanini, T.; Filì, T.; Musso, E. Assessing smart city maturity through a multidimensional DP2-based clustering of the IMD smart city index. Sci. Rep. 2026, 16, 14806. [Google Scholar] [CrossRef] [Scilit]
  12. Caragliu, A.; del Bo, C.; Nijkamp, P. Smart cities in Europe. J. Urban Technol. 2011, 18, 65–82. [Google Scholar] [CrossRef] [Scilit]
  13. Angelidou, M. Smart cities: A conjuncture of four forces. Cities 2015, 47, 95–106. [Google Scholar] [CrossRef] [Scilit]
  14. Ulbrich, P.; De Albuquerque, J.P.; Coaffee, J. The Impact of Urban Inequalities on Monitoring Progress towards the Sustainable Development Goals: Methodological Considerations. ISPRS Int. J. Geo-Inf. 2018, 8, 6. [Google Scholar] [CrossRef] [Scilit]
  15. Taleai, M.; Sliuzas, R.; Flacke, J. An integrated framework to evaluate the equity of urban public facilities using spatial multi-criteria analysis. Cities 2014, 40, 56–69. [Google Scholar] [CrossRef] [Scilit]
  16. Karanikola, P.; Panagopoulos, T.; Tampakis, S.; Simoglou, G.; Tzelepi, A. Perceptions of urban green infrastructure in two contrasting municipalities of the metropolitan area of Athens, Greece. Nat.-Based Solut. 2023, 3, 100063. [Google Scholar] [CrossRef] [Scilit]
  17. 2021 Population-Housing Census—ELSTAT. Available online: https://www.statistics.gr/en/2021-census-pop-hous (accessed on 23 July 2026).
  18. Risultati del Censimento Permanente Della Popolazione. Available online: https://www.istat.it/statistiche-per-temi/censimenti/popolazione-e-abitazioni/risultati/ (accessed on 23 July 2026).
  19. Tsiligiannis, A. Why isn’t urban development sustainable? An institutional approach to the case of Athens, Greece. J. Contemp. Urban Aff. 2020, 4, 71–78. [Google Scholar] [CrossRef] [Scilit]
  20. Benassi, F.; Salvati, L. Urban Cycles and Long-Term Population Trends in a Southern European City: A Demographic Outlook. Appl. Spat. Anal. Policy 2020, 13, 777–803. [Google Scholar] [CrossRef] [Scilit]
  21. Myrivili, E. Athens Resilience Strategy for 2030: Redefining the City. Available online: https://resilientcitiesnetwork.org/ (accessed on 22 July 2026).
  22. Santamouris, M.; Cartalis, C.; Synnefa, A. Local urban warming, possible impacts and a resilience plan to climate change for the historical center of Athens, Greece. Sustain. Cities Soc. 2015, 19, 281–291. [Google Scholar] [CrossRef] [Scilit]
  23. Gross Domestic Product (GDP) at Current Market Prices by Metropolitan Region. Available online: https://ec.europa.eu/eurostat/databrowser/view/met_10r_3gdp__custom_12633138/default/table?lang=en (accessed on 23 July 2026).
  24. Greek Real Estate Market Studies and Reports. Available online: https://www.bankofgreece.gr/en/statistics/real-estate-market/greek-real-estate-market-studies-and-reports (accessed on 17 August 2026).
  25. Adamopoulou, E.; Kapopoulos, P.; Zekente, K.-M. Decoding Housing Affordability in Greece; Alpha Bank Economic Research: Athens, Greece, 2025. [Google Scholar]
  26. Batty, M. Digital twins. Environ. Plan. B Urban Anal. City Sci. 2018, 45, 817–820. [Google Scholar] [CrossRef] [Scilit]
  27. Barresi, A. Urban Digital Twin and urban planning for sustainable cities. TECHNE—J. Technol. Archit. Environ. 2023, 25, 78–83. [Google Scholar] [CrossRef] [Scilit]
  28. Nikolopoulou, M.; Lykoudis, S. Thermal comfort in outdoor urban spaces: Analysis across different European countries. Build. Environ. 2006, 41, 1455–1470. [Google Scholar] [CrossRef] [Scilit]
  29. Aghamolaei, R.; Azizi, M.M.; Aminzadeh, B.; O’Donnell, J. A comprehensive review of outdoor thermal comfort in urban areas: Effective parameters and approaches. Energy Environ. 2023, 34, 2204–2227. [Google Scholar] [CrossRef] [Scilit]
  30. Saneinejad, S.; Roorda, M.J.; Kennedy, C. Modelling the impact of weather conditions on active transportation travel behaviour. Transp. Res. Part Transp. Environ. 2012, 17, 129–137. [Google Scholar] [CrossRef] [Scilit]
  31. Zoulia, I.; Santamouris, M.; Dimoudi, A. Monitoring the effect of urban green areas on the heat island in Athens. Environ. Monit. Assess. 2009, 156, 275–292. [Google Scholar] [CrossRef] [Scilit]
  32. Dewilde, C. Explaining the declined affordability of housing for low-income private renters across Western Europe. Urban Stud. 2018, 55, 2618–2639. [Google Scholar] [CrossRef] [Scilit]
  33. Rogers, E.M. The Digital Divide. Converg. Int. J. Res. New Media Technol. 2001, 7, 96–111. [Google Scholar] [CrossRef] [Scilit]
  34. Liu, L.; Wu, F.; Tong, H.; Ha, C. The Digital Divide and Active Aging in China. Int. J. Environ. Res. Public Health 2021, 18, 12675. [Google Scholar] [CrossRef] [Scilit]
Figure 1. Research design and analytical workflow: Stage 1 develops the CWLI from the IMD–ASCIMER methodological gap; Stage 2 applies it identically to Bologna and Athens through the open-data GIS protocol, with Monte Carlo robustness verification. Source: authors’ elaboration.
Sustainability 18 08723 g001
Figure 2. CORINE Land Cover classification of the Bologna (left) and Athens (right) urban areas, with the shared CLC legend. Source: authors’ elaboration on Copernicus CLC data (QGIS).
Sustainability 18 08723 g002
Figure 3. Land surface temperature of the Bologna metropolitan area on 27 June, 3 July and 12 August 2025 (°C; class breaks are scene-specific, and colour scales are not directly comparable across panels or cities). Source: authors’ elaboration on USGS Landsat Collection 2 Level-2 data (QGIS).
Sustainability 18 08723 g003
Figure 4. Land surface temperature of the Athens basin on 26 June, 28 July and 28 August 2025 (°C; class breaks are scene-specific, and colour scales are not directly comparable across panels or cities), documenting the summer urban heat island corroborating γ_cli. Source: authors’ elaboration on USGS Landsat Collection 2 Level-2 data (QGIS).
Sustainability 18 08723 g004
Figure 5. Population density by municipality, Bologna Metropolitan City with Athens–Piraeus agglomeration inset (ISTAT/ELSTAT 2021). Source: authors’ elaboration (QGIS).
Sustainability 18 08723 g005
Figure 6. Population (absolute numbers, top) and old-age (ageing) index (bottom) by municipality, Bologna Metropolitan City with Athens–Piraeus agglomeration inset (ISTAT/ELSTAT 2021). Source: authors’ elaboration (QGIS).
Sustainability 18 08723 g006
Figure 7. Urban green within the municipality of Bologna (computation boundary shown in red), with detail panels of the principal parks. Parking areas are excluded from the green computation. Source: authors’ elaboration on OSM/CLC data (QGIS).
Sustainability 18 08723 g007
Figure 8. Urban green within the municipality of Athens (Dímos Athinaíon computation boundary shown in red), with detail panels (Parko Antonis Tritsis, Alsos Neas Filadelfeias, Ktima Syngrou) shown as agglomeration-scale examples outside the computation boundary. Parking areas are excluded from the green computation. Source: authors’ elaboration on OSM/CLC data (QGIS).
Sustainability 18 08723 g008
Table 1. Indicator-specific sensitivity scalars (each row sums to 1).
Indicatorα (Climate)β (Culture)δ (Economy)ε (History)ζ (Demography)
Urban green provision0.350.300.050.200.10
Soft mobility0.250.250.100.300.10
Tree canopy0.450.100.100.250.10
Housing affordability0.050.100.550.200.10
Digital services0.050.200.200.100.45
Table 2. Geographic coefficient values for Bologna and Athens (range [0, 1]).
CoefficientBolognaAthensSource/Proxy
γ_cli (climate)0.710.90Köppen class; days > 20 °C; LST (GIS)
γ_cul (culture)0.780.82Eurostat TUS; documented outdoor practices
γ_eco (economy)0.460.71Inverse PPP GDP/capita vs. EU reference
γ_his (history)0.650.55Historic core share; heritage constraints
γ_dem (demography)0.420.73Study-area census density + 65+ share (ISTAT/ELSTAT)
Table 3. KPI values, reference benchmarks and normalised scores. † Computed from the urban green GIS layer of this study under an identical definition for both cities.
KPIBolognaAthensReferenceScore BOScore AT
Urban green provision (m2/inhabitant)24.0 †4.2 †25.00.960.17
Soft mobility share (%)~38~17.545.00.840.39
Tree canopy cover (%)~17~1125.00.680.44
Housing affordability (inverted rent-to-income)0.500.451.000.500.45
Digital services adoption (%)55.166.370.00.790.95
Table 4. Normalised context-sensitive weights, contributions and CWLI for Bologna and Athens.
KPIw (BO)Contribution (BO)w (AT)Contribution (AT)
Urban green provision0.2220.2130.2090.035
Soft mobility0.2140.1800.1990.077
Tree canopy0.2120.1440.2060.091
Housing affordability0.1760.0880.1880.085
Digital services0.1760.1380.1970.187
Unweighted score0.7530.479
CWLI0.7630.475
Disclaimer/Publisher’s Note: The statements, opinions and data contained in all publications are solely those of the individual author(s) and contributor(s) and not of MDPI and/or the editor(s). MDPI and/or the editor(s) disclaim responsibility for any injury to people or property resulting from any ideas, methods, instructions or products referred to in the content.