Article

Ranking Soil Quality Indicators Using the SMART Criteria, AHP Method and Chatbots

by
Alexandre Marco da Silva
1,* and
Jakub Kostecki
2
1
Department of Environmental Engineering, Institute of Sciences and Technology of Sorocaba, São Paulo State University, 511 Tres de Março Avenue, Sorocaba 18087-180, SP, Brazil
2
Institute of Environmental Engineering, 15 Szafrana Campus A, Building A-12, 65-516 Zielona Góra, Poland
*
Author to whom correspondence should be addressed.
Sustainability 2026, 18(17), 8713; https://doi.org/10.3390/su18178713
Submission received: 15 June 2026 / Revised: 14 August 2026 / Accepted: 20 August 2026 / Published: 25 August 2026
(This article belongs to the Special Issue Land Degradation, Soil Conservation and Reclamation)

Abstract

Soil is a complex environmental component characterized by numerous physical, chemical, and biological attributes that determine its capacity to provide ecosystem services. While composite soil health indices are traditionally derived from static literature reviews or costly expert panels, this study evaluates the potential of general-purpose large language models as a rapid, low-cost aid for AI-driven environmental decision support. We systematically evaluate the conceptual reliability and mathematical consistency of four distinct Large Language Models (LLMs): ChatGPT, Gemini, Claude, and Copilot, in executing an Analytic Hierarchy Process (AHP) matrix integrated with the SMART criteria. The evaluation prioritized seven indicators: soil organic matter (SOM), earthworm presence, aggregate stability, electrical conductivity, available nutrients, pH, and water infiltration capacity. All platforms generated mathematically consistent AHP matrices, with consistency ratios below accepted thresholds. Across ten independent runs per platform, soil organic matter received the highest mean global weight (~0.22) and earthworms the lowest (~0.08); inter-platform agreement was statistically significant (Kendall’s W = 0.75, p = 0.007), yet single-run variability reached ~50%, showing that repeated prompting is required. This approach offers a practical framework for rapid, preliminary indicator screening under resource-constrained conditions, while revealing model-specific divergences and possible training-data biases that warrant further investigation. However, our findings suggest AI-generated AHP outputs should be treated as preliminary decision-support results and should be verified through cross-platform comparison, repeated prompting, expert review, and site-specific validation.

1. Introduction

Assessing soil health under resource-constrained conditions requires identifying a prioritized set of measurable parameters—a challenge shared by agricultural producers, environmental restoration specialists, and land-use planners alike. To mitigate excessive labor and financial expenditures, it is necessary to determine which quality indicators most accurately and comprehensively represent local conditions [1,2]. However, the selection of such indicators remains partly dependent on expert judgment, local experience, and the availability of analytical resources. This creates a need for transparent decision-support approaches that can help structure and compare alternative indicators.
The burgeoning integration of Artificial Intelligence (AI) across diverse scientific domains has raised questions about whether AI platforms can reliably prioritize soil quality parameters [3,4]. Specifically, the consistency and accuracy of AI-generated rankings for soil health indicators have not yet been rigorously evaluated [4]. This issue is particularly relevant for multicriteria decision-making methods, such as the Analytic Hierarchy Process (AHP), where pairwise comparisons and consistency checks are central to the reliability of the final ranking. Furthermore, since soils must be analyzed quickly and accurately for rational use within a sustainability framework—or even for remediation—the development of studies like this one yields products that help meet this demand.
This study therefore evaluates the efficacy of AI platforms in developing hierarchical indicator rankings within an Analytic Hierarchy Process (AHP) framework. The goal is to establish a robust hierarchy of indicators that optimize resource allocation and improve the accuracy of available data on soil health, thereby enhancing sustainability efforts in soil analysis and land-use processes. More specifically, the study examines whether different AI platforms generate consistent AHP-based rankings, whether their outputs differ across systems, and whether the resulting priorities are consistent with established soil quality literature.

1.1. Concepts of Soil, Soil Health and Soil Quality Indicators

Soil is the uppermost layer of the Earth’s surface layer, an essential natural capital formed through the weathering of rocks and the decomposition of organic matter over time, under the influence of climate, topography, microorganisms and more recently human activity. It performs multiple critical functions: supporting plant growth, providing habitat for living organisms, enabling water infiltration and storage, neutralizing harmful chemicals, and serving as a foundation for infrastructure. Its composition, including mineral particles, organic matter, water and air, varies considerably across regions and land-use types [5,6].
Soil health reflects its ability to function within the sustainable limits of the ecosystem and land use. When healthy, soil can support essential biological activities, to maintain environmental quality, and to promote the health of plants and animals. Thus, soil health also reflects its resilience, or how the soil responds to environmental stress [6,7]. Since many soil functions cannot be directly measured, evaluation efforts have largely focused upon the selection of key indicators [8].
An indicator is a measurable attribute used to monitor and evaluate performance, status, or progress. In soil science, researchers have developed numerous quality indicators categorized into physical, chemical, and biological domains [2,9]. Many indicators overlap across categories or interplay with other environmental elements, such as water, and their measurement requirements range from simple field procedures to complex, costly, and labor-intensive laboratory analyses [10,11,12].
The scientific community recognizes at least thirty indicators across three categories: physical, chemical and biological. Although some indicators have an independent mode of functioning, most interact dynamically, changing in response to fluctuations in others [1]. This high volume and complex interconnectedness can obscure the identification of truly representative attributes [2,10].
Recognizing a prioritized, manageable subset of indicators is therefore critical for professionals who require soil quality data but operate under time and resource constraints. Decision-support methods that synthesize multidimensional information into actionable rankings have consequently gained increasing prominence in applied soil science [3,10].

1.2. The AHP Method and SMART Criteria

Multicriteria decision-making methods such as the Analytic Hierarchy Process (AHP) were developed to support complex decisions involving multiple quantitative and qualitative factors. AHP decomposes a decision problem into criteria, sub-criteria, and alternatives, and then uses pairwise comparisons to derive relative priorities [13,14]. In the context of soil quality assessment, this structure is useful because indicators differ not only in scientific relevance, but also in measurability, cost, feasibility, and practical interpretability.
In short, AHP offers a theory and methodology for relative measurement. Rather than seeking exact numerical values, relative measurement focuses on the proportional relationships among alternatives or criteria. The central idea is to simplify the analysis of complex systems by reducing them to a series of pairwise comparisons. The method rests on three core principles [15,16]:
Hierarchy construction: Complex problems often demand organizing criteria into a hierarchical structure, which reflects a natural pattern of human reasoning. AHP facilitates this structuring process, most commonly using a tree-like hierarchy in which the main goal is decomposed into criteria and lower-level alternatives.
Priority setting: The method establishes priorities through pairwise comparisons of elements with respect to a given criterion.
Logical consistency: AHP incorporates indices that permit analysts to evaluate the consistency of establishment of priority, ensuring that the relative rankings do not violate logical coherence. The consistency of the results is often measured by the Consistency Ratio (CR), calculated by Equations (1) and (2):
C R = C I I R
C I = λ m a x n n 1
where CR is the consistency ratio, CI is the consistency index, IR is the Randomness Index (or Random Inconsistency Index) based on the matrix dimension, λmax is the maximum eigenvalue and “n” is the matrix size.
The CR is a fundamental metric for validating the consistency of pairwise judgments made by decision-makers. According to Saaty [14], a CR of 0.10 or lower indicates an acceptable level of internal consistency; values above 0.10 suggest that the pairwise comparisons should be reviewed. We stress, however, that a CR at or below 0.10 reflects only the internal logical coherence of the pairwise-comparison matrix in Saaty’s sense and does not guarantee scientific reliability or ecological validity.
In practice, people often find it easier to express their preferences through verbal judgments rather than numerical scales. To make this tendency achievable, AHP links specific linguistic terms of numerical values, thereby assisting decision-makers in articulating priorities. One way is integrating the SMART criterion with AHP. Integrating the SMART criteria (Specific, Measurable, Achievable, Relevant, Time-bound) with the AHP (Analytic Hierarchy Process) method is a powerful strategy for multi-criteria decision-making, combining clarity in goal setting with rigorous mathematical structuring for choosing the best alternative [4,17].
This methodological framework converts broad intentions into clear, actionable strategies by specifying desired outcomes and the metrics used to assess progress. Each component of the SMART framework is briefly outlined below [17]:
Specific: The criterion precisely identifies the element under evaluation and indicates whether the direction of change aligns with the intended management outcomes.
Measurable: The criterion should be associated with quantifiable indicators. These indicators should be accessible through direct measurement, sampling, or systematic monitoring.
Achievable: The criterion considers the spatial and temporal context of the system being evaluated, ensuring that the expected outcomes are realistic given the system’s characteristics and monitoring history.
Relevant: The criterion evaluates whether the focus of assessment is aligned with the overarching goals of the evaluation framework.
Time-bound: The criterion establishes a clear timeframe for achieving the intended goal, thereby creating a sense of urgency and guiding the sequencing of actions.

1.3. Linking AHP and SMART Criteria with Soil Indicators

To evaluate soil quality, soil indicators must be selected in a way that reflects both scientific relevance and practical applicability. These indicators should be assessed according to their importance for ecosystem services and sustainability, their sensitivity to changes in soil functioning, and their relevance to key soil processes [1,7,10]. Despite the growing number of studies proposing soil quality indicators and composite soil health indices, the process of selecting a prioritized subset of indicators under limited financial and analytical resources remains largely dependent on expert judgment and context-specific decision frameworks [8,16].
Decision-making methods like the Analytic Hierarchy Process (AHP) are often and successfully used in environmental assessments [16]. However, their implementation usually requires expert knowledge, which may introduce variability in judgments, increase the time required for analysis, and limit the reproducibility of the procedure [16]. Simultaneously, recent advances in artificial intelligence, particularly large language models, have created new opportunities to support complex decision-making and rapid creation of hierarchical evaluation schemes. Nevertheless, there is currently a lack of systematic studies examining whether AI platforms can consistently generate logically coherent AHP matrices, how their prioritization of soil quality indicators compares across systems, and to what extent such AI-assisted rankings align with established soil science knowledge.
To the best of our knowledge, this is an original study that operationalizes a hybrid AHP–SMART framework within LLM architectures to prioritize soil quality attributes within a sustainability-oriented decision-support context.
The contribution of this research is twofold: first, it applies a controlled repeated-query design to compare the stability, mathematical consistency, and cross-platform agreement of several general-purpose LLMs performing the same AHP–SMART task, demonstrating that internal mathematical consistency (consistency ratio ≤ 0.10) can coexist with unstable single-run weightings and occasional logic inversions. Second, it shows that AI-generated priorities may reflect patterns present in the underlying scientific literature, such as the comparatively lower weighting of the biological indicator considered here (earthworms). Because only one biological indicator was included and training-data content was not analyzed directly, this is presented as a hypothesis requiring broader testing rather than as a demonstrated effect.
Therefore, this work extends beyond a simple ranking exercise by establishing a methodological baseline for evaluating the stability, consistency, and limitations of generative AI in environmental multicriteria decision support.

2. Material and Methods

2.1. Selection of Soil Quality Indicators

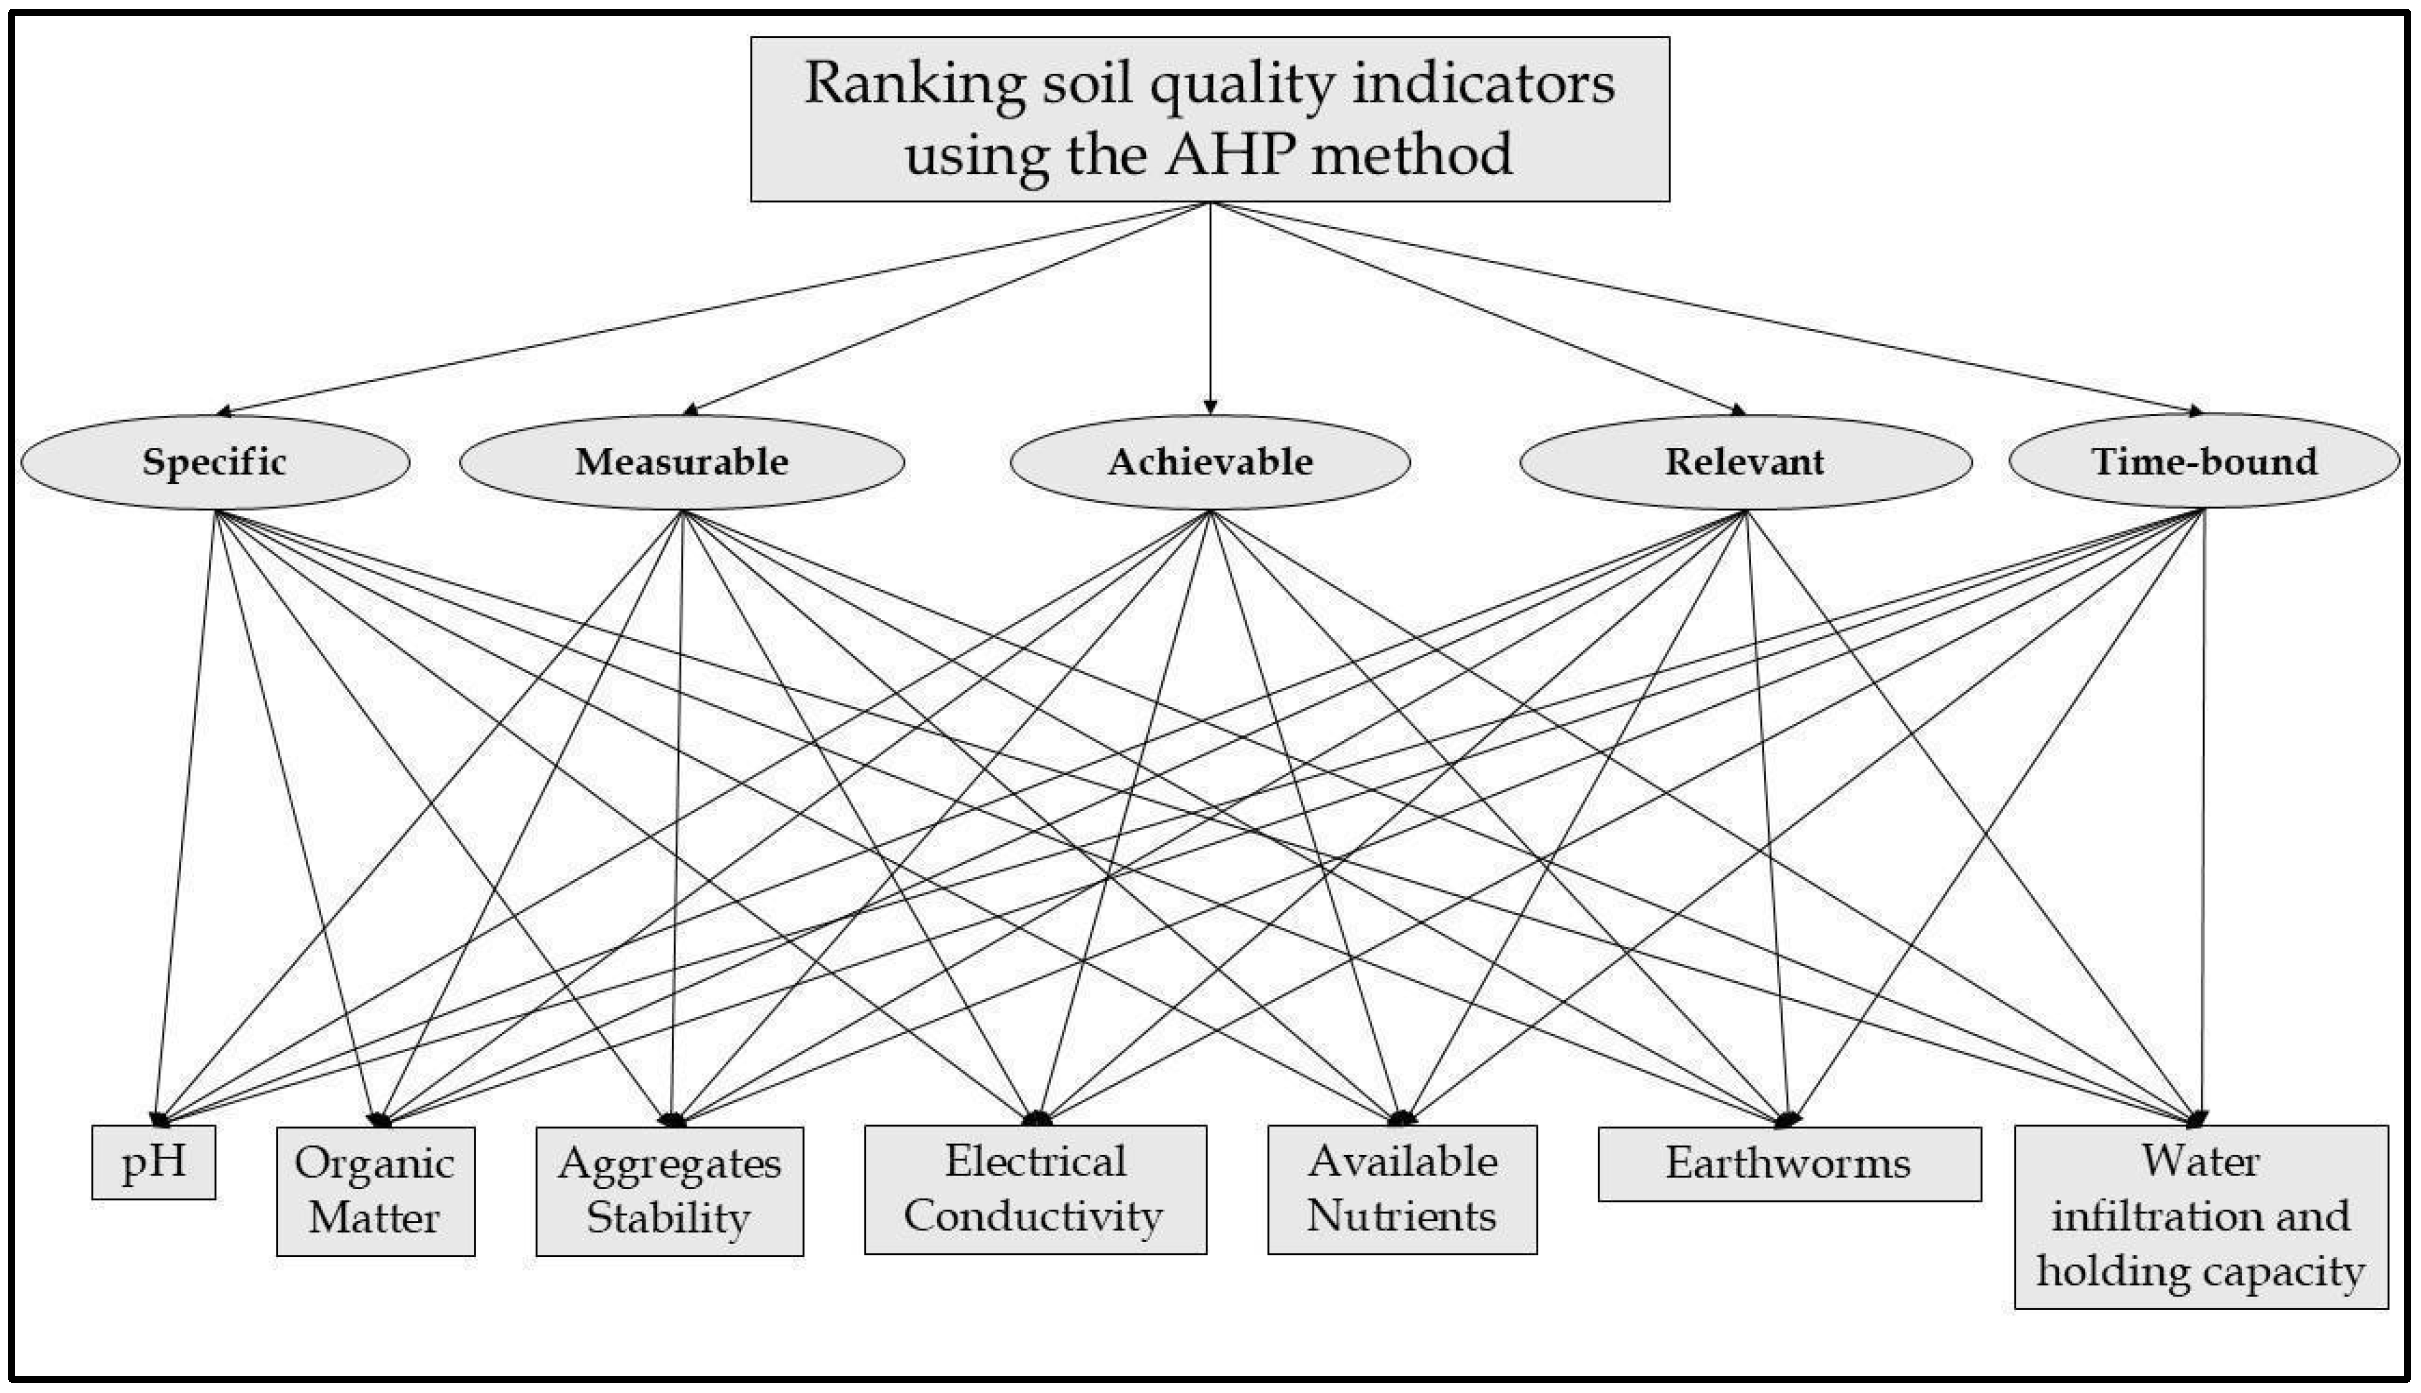
To implement the Analytic Hierarchy Process (AHP), we used the S.M.A.R.T. criteria as the main evaluation framework [17]. In this study, the S.M.A.R.T. criteria were applied not as management objectives, but as criteria for assessing the practical suitability of soil quality indicators. To implement the Analytic Hierarchy Process (AHP), a standardized set of seven soil quality attributes was selected to serve as the experimental baseline (Figure 1). To select a representative baseline of soil quality indicators, a systematic search of the literature indexed in the Web of Science Core Collection was performed for records published up to May 2026. The search query string utilized was: “soil quality” OR “soil health” AND “indicator” OR “quality index”, which yielded a total of 5055 initial candidate records.
The selection of indicators followed a multi-stage screening process: (i) Initial identification: records retrieved from the database were evaluated for relevance to multi-criteria soil assessment. (ii) Inclusion/Exclusion criteria: studies were included if they provided empirical or conceptual frameworks for soil health evaluation across physical, chemical, or biological domains and detailed specific measurement protocols. Studies focusing exclusively on non-soil environmental matrices, highly localized heavy metal contamination, or single-crop response trials without generalizable indicator frameworks were excluded. (iii) Candidate indicator mapping and final selection for the AHP baseline: Seven core indicators were selected. From the indicators across the physical, chemical, and biological domains identified from the eligible literature and supplemented by standard institutional monitoring guidelines [1,2,10,18]: Soil Organic Matter (SOM), Soil pH, Available Nutrients, Electrical Conductivity (EC), Aggregate Stability, Water Infiltration and Retention Capacity, and Earthworm Presence.
The inclusion of these seven indicators was justified by two key criteria: (i) their universal recognition and frequency of occurrence in consensus soil-health literature across physical, chemical, and biological domains, and (ii) their feasibility for assessment via standard field or laboratory protocols [1,2,10,11].
Restricting the baseline set to seven indicators was necessary to preserve a parsimonious, computationally manageable matrix and prevent decision fatigue or excessive noise in the Large Language Model (LLM) evaluations. Furthermore, while earthworms were selected as the primary macro-biological indicator due to their straightforward field quantification methods, microbial and enzymatic metrics typically require more complex, labor-intensive laboratory protocols and display higher micro-scale spatial variability. Their exclusion does not indicate lower ecological significance; these indicators might be incorporated into future, after more comprehensive evaluations. A brief conceptualization and methods of analysis of each attribute is provided in Appendix A.

2.2. Selection of AI Platforms

Four widely used, publicly available general-purpose Large Language Models (LLMs), developed by OpenAI, Google, Anthropic, and Microsoft, were selected to facilitate an exploratory cross-platform comparison. Rather than offering a statistically representative or exhaustive sample of the global LLM landscape, this selection provides a representative standard of systems commonly deployed for scientific assistance and decision support. The interface details are: OpenAI GPT-5.5 Instant; Gemini Flash 3, Claude Sonnet 5 with Medium reasoning and Opus 4.8, Microsoft Copilot version 365 with dynamic model selection. All platforms operated under fixed default hyperparameters (e.g., temperature) that could not be modified through the web GUI, with access restricted to a public web interface.
All tests were carried out via the official web user interfaces in May and June 2026 using default platform settings. We always consider the default configurations of each platform, with this operational limitation explicitly noted.

2.3. Experimental Procedure, Prompt Design and Data Analysis

To evaluate output stability, each AI platform was queried ten independent times using an identical prompt. Every run was performed in a newly initiated conversation without conversational memory or additional contextual information. The publicly available version of each platform available during the study period was used throughout the experiment. In one case, an additional instruction was required to complete the requested AHP procedure, as discussed below.
The standardized prompt is presented below. Pairwise-comparison matrices were extracted directly from the completed response sequence without post hoc modification of the numerical values. ChatGPT required one confirmation prompt to continue from the SMART-criteria matrix to the soil-quality-indicator analysis; no other follow-up interaction occurred. Because large language models may generate different outputs even when presented with identical instructions, the results should be interpreted as exploratory observations of platform behavior rather than as deterministic or fully reproducible outputs. This design enabled inter-platform agreement and within-platform variability to be evaluated under comparable experimental conditions.
The AI platforms provided numerical values for the Consistency Index (CI) and Consistency Ratio (CR), calculated using Equations (1) and (2). These values were used to verify whether the generated AHP matrices satisfied the commonly accepted consistency threshold.
Descriptive statistics (mean, median, mode, standard deviation, and coefficient of variation) together with graphical summaries were used to characterize the generated rankings. Because only four AI platforms were compared, inter-platform agreement was assessed using Kendall’s coefficient of concordance (W) and pairwise Spearman rank correlations based on the mean rankings obtained from the ten independent runs. Within-platform variability was quantified using coefficients of variation (CV).
Prompt submitted to the AI platforms:
Hello, I’m working on a project involving the Analytic Hierarchy Process (AHP).
The goal is to establish a hierarchical system of parameters related to soil quality indicators.
As criteria, I’m considering those of the SMART system (specific, measurable, achievable, relevant, and time-bound).
As parameters, I’m considering pH, organic matter, aggregate stability, electrical conductivity, available nutrients, earthworms, and water infiltration and retention capacity.
Assuming you are acting as a soil scientist, could you generate matrices with suggestive AHP values in this context?
I also need you to present, in detail, that is, with explanations and numerical values, the final values for the consistency index and the consistency ratio.
We considered the non-parametric test Kendall’s W (coefficient of concordance) to evaluate the significance and the degree of agreement among the platforms that ranked the same set of soil attributes.

3. Results

3.1. Ranking the S.M.A.R.T. Criteria and Consistency Analysis

The Relevant criterion received the highest mean weight (0.375) and was ranked first by all four platforms. Time-bound received the lowest mean weight (0.076). Inter-platform variability differed considerably among the SMART criteria: it was highest for Specific (CV = 31.7%) and Time-bound (CV = 27.3%), whereas Achievable showed the lowest variability (CV = 4.8%). Thus, although the platforms agreed on the highest-ranked criterion, they differed substantially in the relative weighting of the remaining SMART dimensions (Table 1).
Despite the observed variation, all platforms produced Consistency Index and Consistency Ratio values below and compatible with the accepted threshold, indicating internal consistency of the pairwise comparison matrices rather than validation of the results themselves (Table 2).

3.2. Ranking of Soil Quality Indicators and Consistency Analysis

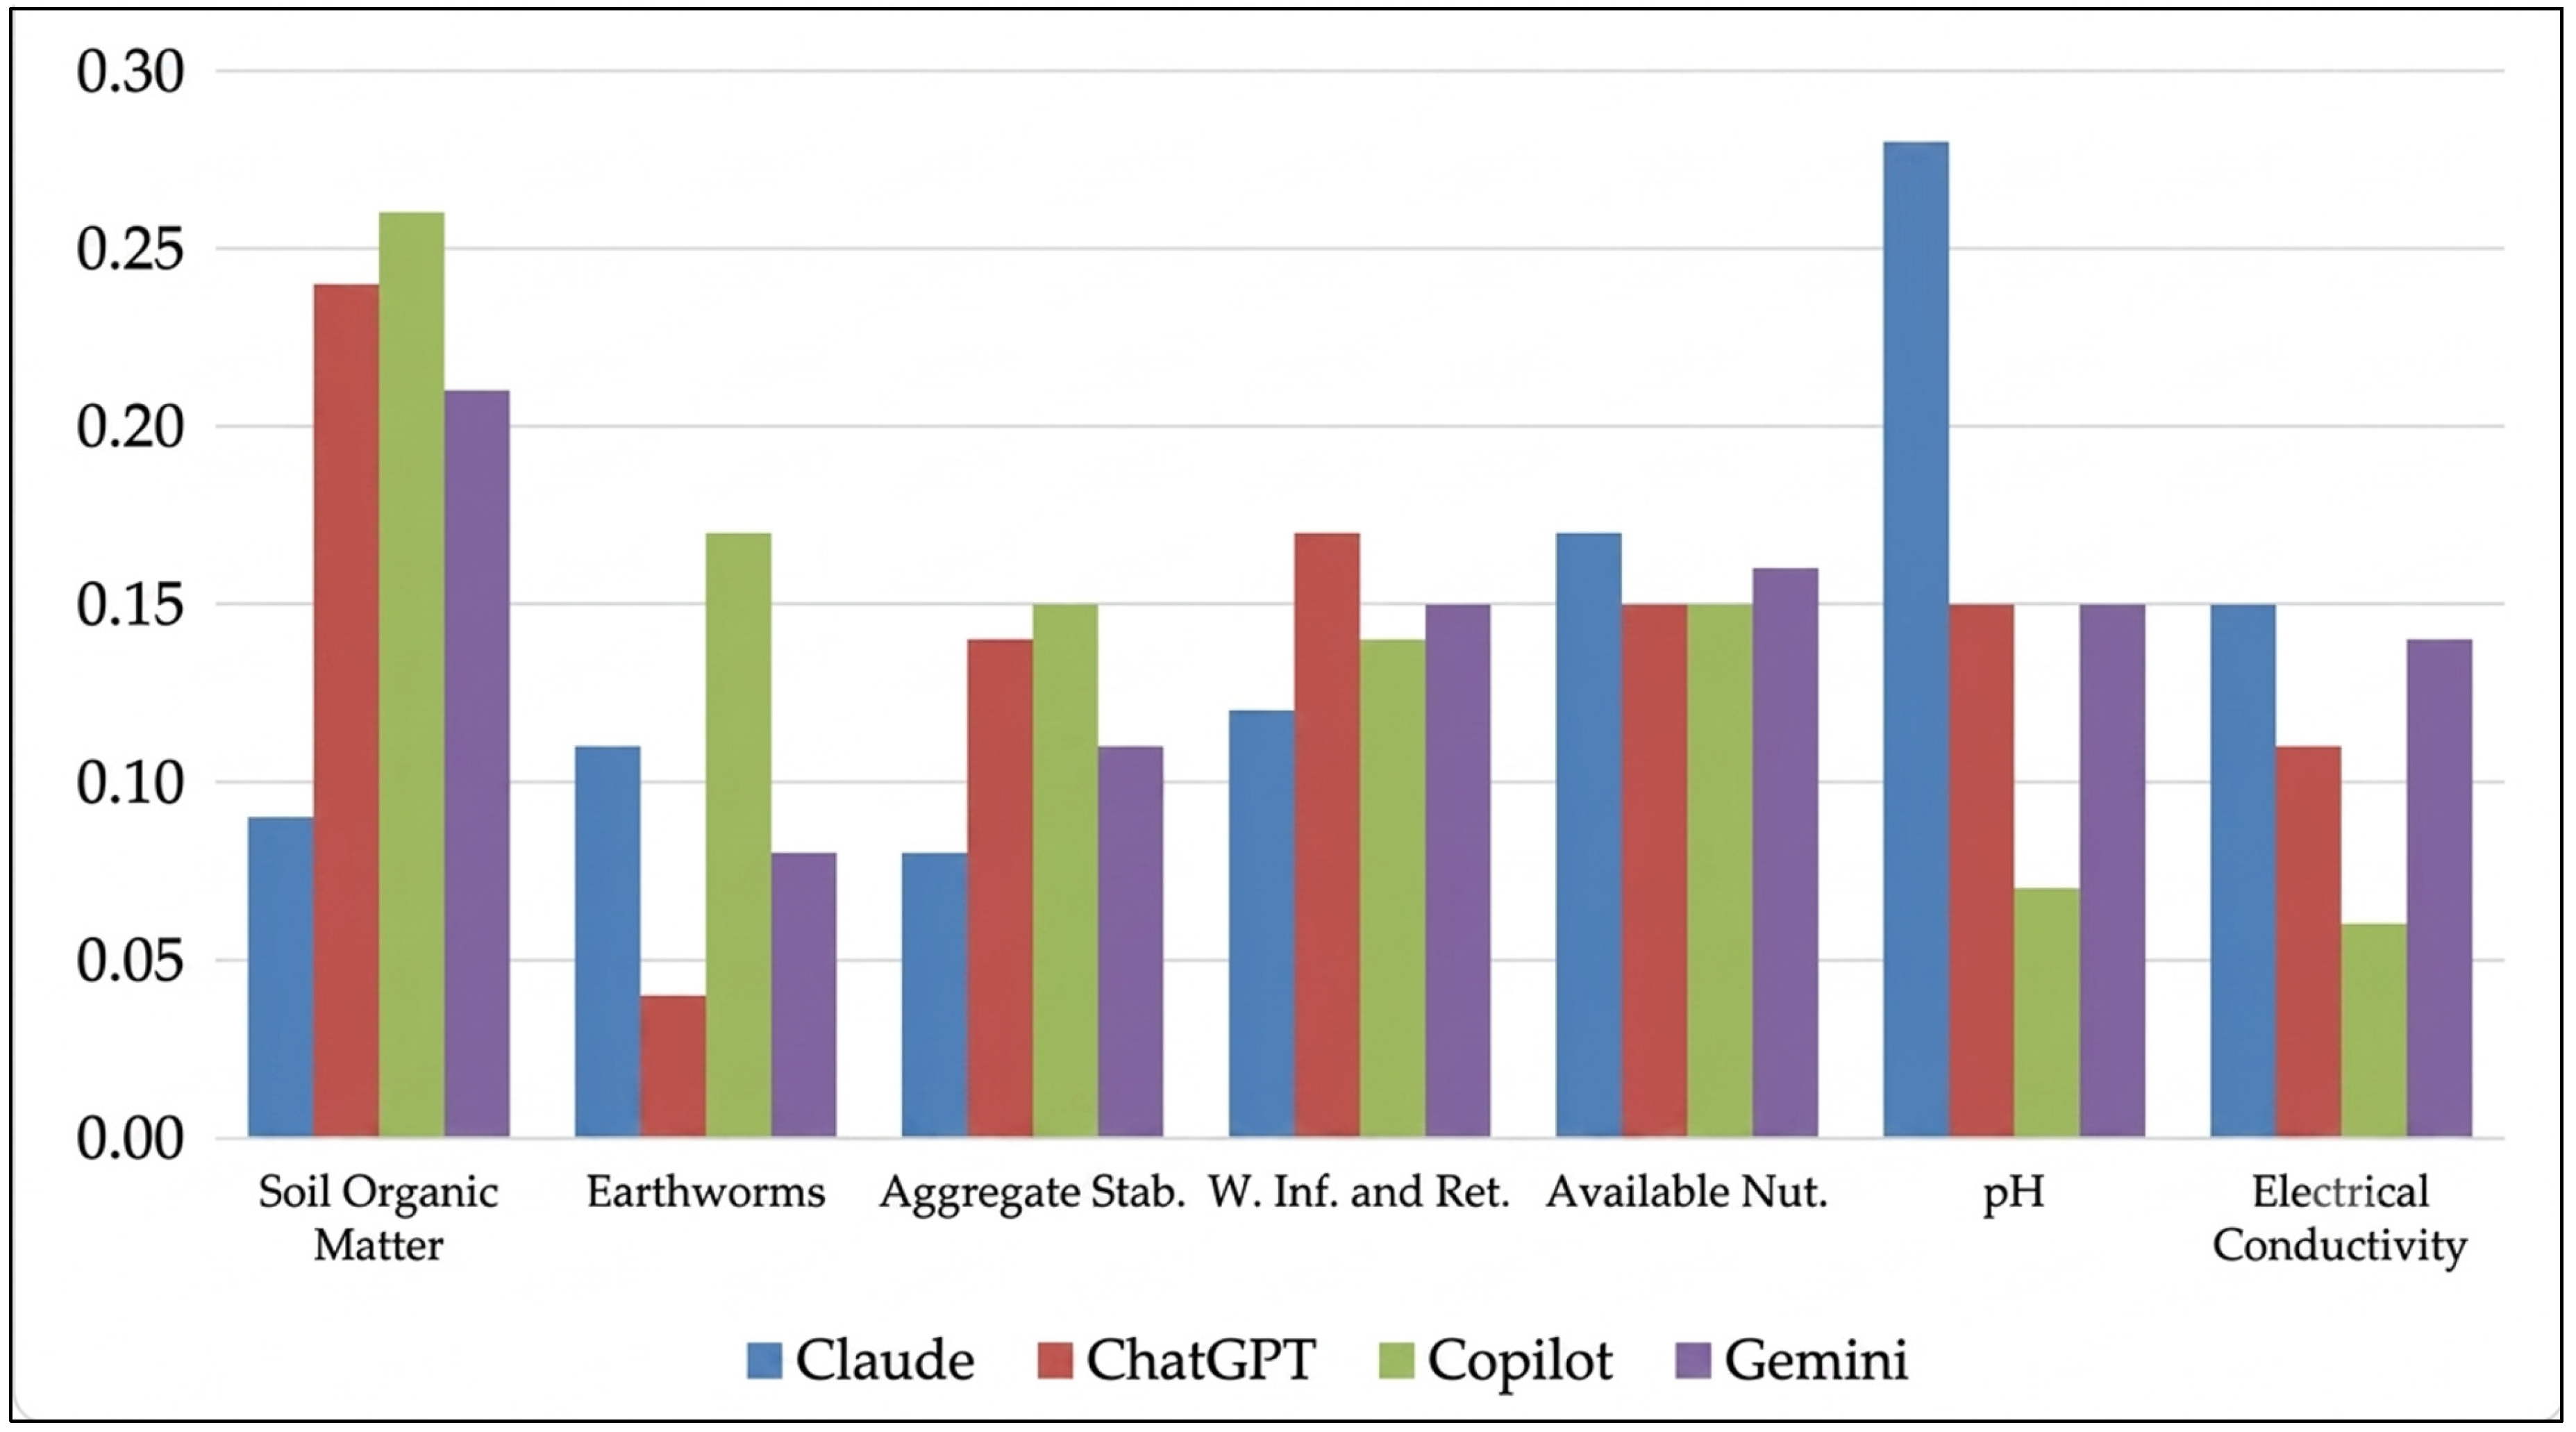
The AI platforms produced divergent results regarding indicator prioritization (Figure 2 and Table 3). Evaluating the platform over ten independent runs revealed that soil organic matter earned the highest average global weight (~0.22), whereas earthworms received the lowest (~0.08) (Table 3). While there was significant overall agreement across platforms (Kendall’s W = 0.75, p = 0.007), single-run values varied by up to 50%, demonstrating that reliable results depend on repeated prompting.
Like the results of the SMART approach factors, the consistency index (CI) and consistency ratio (CR) calculation for the soil quality indicator parameters also showed low values, confirming the internal consistency of the generated pairwise-comparison matrices (Table 4). This fact was reported in the analysis of the four AI platforms.
Averaging over the ten runs, the four platforms showed strong and statistically significant agreement in their indicator rankings (Kendall’s W = 0.75, χ2 (6) = 18.4, p = 0.007; mean pairwise Spearman ρ = +0.68). At the same time, within-platform variability was high: mean coefficients of variation ranged from about 13% (Claude) to about 34% (Copilot), and individual indicators varied by up to ~50% between runs. The platforms’ averaged rankings therefore converge, whereas single outputs are unstable, confirming that a single query is an unreliable estimate, and that repeated prompting is required.
To test version dependence directly, the same protocol was run on two Claude builds—Sonnet 5 and Opus 4.8 (n = 10 each). The two versions produced almost identical rankings (Spearman ρ = 0.96) but differed in stability and dispersion: Opus 4.8 was markedly more consistent across runs (mean intra-version CV ~5% vs. ~13% for Sonnet 5) and produced flatter weight distributions. Model version thus affected the confidence and granularity of the AI-generated priorities more than their ordinal ranking, empirically confirming that these outputs are version-dependent.

3.3. Performance of the AI Platforms

All four platforms returned numerical AHP matrices accompanied by explanations that were generally internally coherent and directly responsive to the prompt. However, notable differences were observed in the depth of interpretation and the degree of autonomous task completion across platforms (Table 5).
ChatGPT was the only platform that did not complete the full analysis autonomously. After generating the SMART criteria matrix, it paused and asked whether the user wished to proceed with the soil quality indicator analysis. Upon confirmation, it completed the remaining matrices. This behavior suggests that ChatGPT’s default configuration may divide complex analytical requests into sequential steps, possibly as a safeguard against generating excessively long outputs in a single response.
Copilot completed both analyses but was the only platform that did not provide any qualitative interpretation of its numerical outputs (Table 5). This absence of interpretative commentary limits the utility of Copilot’s outputs in contexts where methodological justification is required alongside numerical results.
Claude, ChatGPT, and Gemini each provided qualitative explanations for their AHP value assignments, linking indicator scores to specific SMART dimensions (Table 5). Although the mean results were broadly coherent, isolated runs occasionally produced divergent weighting patterns. These deviations did not persist across repetitions and therefore illustrate run-to-run instability rather than a stable platform-specific preference.
Across all platforms, response times were sufficiently rapid to suggest that AI-assisted AHP construction could meaningfully accelerate the early stages of multicriteria environmental assessments. However, such acceleration should be understood as support for preliminary structuring and screening, not as a substitute for expert-based assessment or independent validation.

4. Discussion

4.1. Selection and Representativeness of AI Platforms

In the context of sustainability, continuous monitoring of soil quality indicators prevents erosion and degradation, guiding regenerative management. Utilizing data reduces reliance on chemical inputs and promotes carbon sequestration. It is, therefore, an indispensable strategy for balancing soil use with long-term environmental conservation. The quantitative and qualitative insights generated across the four AI platforms provide a unique perspective on digital soil governance and management. The fact that Soil Organic Matter (SOM) achieved the highest overall priority (≈0.22) demonstrates that LLMs can accurately capture foundational soil paradigms. However, the real innovative value of this cross-platform analysis lies in capturing the high inter-platform variability (e.g., a CV of 31.7% for the ‘Specific’ criterion), proving that AI platforms cannot yet be treated as deterministic or interchangeable expert systems.
The four platforms selected for this study: ChatGPT, Gemini, Claude, and Copilot, represent widely used and freely accessible AI systems as accessed in July 2026, and their selection is broadly consistent with independent popularity data reported by Forbes Brasil [19]. Minor discrepancies between our platform selection and the Forbes ranking, notably the inclusion of Copilot in our study and its absence from that list, may reflect differences in the methodology used to assess platform popularity and the rapid pace of change in the AI landscape. Therefore, the platform selection should be interpreted as a sensible and exploratory sampling strategy rather than as a definitive ranking of global AI platform usage.
A functionally relevant distinction emerged between platforms: while ChatGPT, Claude, and Gemini provided both numerical outputs and qualitative interpretations, Copilot delivered only numerical matrices without accompanying explanation (Table 5). This difference has practical implications for applied environmental assessments, where interpretative transparency is as important as numerical precision. Numerical AHP outputs without explanatory justification may be less useful for expert review, methodological auditing, and decision-making contexts requiring traceable reasoning.

4.2. Ranking the S.M.A.R.T. Criteria and Consistency Analysis

Across all evaluated platforms, the consistency indices and consistency ratios consistently remained below the 0.10 threshold established by Saaty [14], thereby demonstrating the internal logical coherence of the AI-generated pairwise comparison matrices (Table 2). However, this mathematical consistency should not be misinterpreted as empirical validation of scientific accuracy. All four platforms allocated the highest priority vector to the “Relevant” criterion (mean weight: 0.375), underscoring its foundational role in linking specific soil quality indicators to broader land management objectives [17]. This criterion, alternatively operationalized as “Realistic” within variant SMART frameworks, evaluates the degree to which selected metrics align with the overarching objectives of the assessment, rendering it a predictable priority within a decision-support context [4,17].
In one isolated run, the weighting pattern produced by Claude diverged substantially from the remaining outputs: rather than assigning the highest weight to “Relevant,” Claude ranked it lowest (0.05), instead prioritizing “Time-bound” (0.39). Such an isolated divergence should not be interpreted as evidence of hallucination, because no formal hallucination-detection procedure was applied. It is more appropriately described as an unstable or domain-misaligned weighting decision that did not persist across repeated runs, a known limitation of large language models, whose outputs may be internally consistent yet occasionally misaligned with domain knowledge [3,4,20,21]. This finding reinforces the methodological recommendation that AI-generated AHP outputs should be cross-validated across multiple platforms and reviewed by domain experts before use in applied assessments.
Inter-platform variability differed substantially among the SMART criteria, ranging from 4.8% for Achievable to 31.7% for Specific. This pattern indicates that the platforms agreed relatively closely on some dimensions but interpreted others, particularly Specific and Time-bound, less consistently. This variability may reflect differences in model design, training data, response generation procedures, and stochastic output variability, rather than genuine disagreement about soil science principles.

4.3. Ranking of Soil Quality Indicators and Consistency Analysis

The AI-generated rankings of soil quality indicators showed partial alignment with expert-based assessments reported in the literature, suggesting that AI-assisted AHP may be useful as an exploratory tool for preliminary indicator screening [1,10,21].
Soil Organic Matter (SOM) received the highest average priority weight across platforms (≈0.22), consistent with its established status as a primary soil quality indicator [10,11]. This result is also broadly consistent with expert-based AHP assessments: Çelik and Sürücü [22] reported SOM weights of approximately 0.24 for orchard and arable soils, and 0.37 for pastures, values of a comparable order of magnitude to those generated here. The convergence between AI outputs and expert-derived rankings for SOM.
pH and Available Nutrients ranked second and third overall, although their average weights were very similar. Available Nutrients showed notably low inter-platform variability (CV = 8.3%), indicating strong agreement across AI systems regarding its importance. This stability may reflect the direct connection between nutrient availability and soil fertility, plant growth, and land management decisions.
Earthworm presence received the lowest average weight (0.08) and the highest inter-platform variability among indicators (CV = 30.1%), reflecting the well-documented challenges associated with biological indicators in soil quality assessment [23,24,25]. Earthworms are highly sensitive to edaphic conditions, climate, land use, and seasonal fluctuations, and their quantification requires labour-intensive field protocols that are difficult to standardize [23,26]. These characteristics may reduce their measurability and achievability scores within the SMART framework, which likely contributed to their low average ranking and high variability across platforms.
Within the context of ecological restoration monitoring, the secondary priority assigned to earthworm presence does not necessarily denote negligible ecological significance; [23,24]. Rather, it reflects the pragmatic constraints of deploying this metric in rapid, resource-limited assessments. Although biological indicators are highly efficacious for evaluating ecosystem trajectory and recovery [9,18,24,27], their robust interpretation typically requires rigorous seasonal controls, longitudinal sampling designs, and specialized taxonomic expertise. Consequently, earthworm presence is optimized as a complementary indicator within high-resolution monitoring frameworks, rather than as a primary screening metric in initial assessments.

4.4. Interpretative Capacity of AI Platforms

The qualitative interpretations provided by ChatGPT, Claude, and Gemini (Table 5) were generally technically coherent and broadly aligned with established soil science knowledge. This suggests that these platforms may be able not only to generate numerical AHP matrices, but also to provide domain-relevant justifications for their outputs. This interpretative capacity is particularly valuable in resource-limited assessment contexts, where decision-makers may need transparent explanations to support the evaluation of numerical rankings. However, such explanations should not be treated as independent validation, because plausible reasoning may still accompany questionable or biased weighting decisions.
The lower average ranking of biological indicators across AI-generated outputs is broadly consistent with trends reported in the soil science literature. Schweng et al. [28] note that digital soil mapping efforts have focused predominantly on organic carbon and chemical properties using remote sensing, largely omitting biological attributes. Through a bibliometric analysis Gatica-Saavedra et al. [25] found that among commonly used soil health indicators, chemical indicators appear in 76% of studies, physical indicators in 58%, and biological indicators in 55%, with earthworms specifically ranked below soil enzymes and microbial respiration in terms of frequency of use. The lower prevalence of biological indicators in applied assessments is attributed to their high spatiotemporal variability, the time required for data collection, and the need for specialized methods and expertise [25,27,28].
Taken together, these findings suggest that AI platforms may reflect, and in some cases could reinforce, the existing biases of the scientific literature on which they were trained. This has implications for the use of AI in environmental decision-making: outputs should be interpreted not only in terms of their internal consistency, but also in relation to the scope, balance, and representativeness of the knowledge base they draw upon. For this reason, AI-generated rankings should be considered preliminary decision-support outputs rather than definitive expert judgments.

4.5. Mechanisms Underlying Inter-Platform Differences

The observed differences may arise from a combination of model-specific factors and stochastic generation, including differences in training corpora, alignment procedures, default inference configurations, and the way each model interprets the prompt. Because these mechanisms were not experimentally isolated, they should be considered plausible explanations rather than demonstrated causes. Soil organic matter (SOM) consistently received the highest overall ranking because it is widely recognized as one of the most comprehensive indicators of soil quality and ecosystem functioning [1,10]. SOM plays a crucial role in climate change mitigation by acting as a valuable carbon reservoir [27,28]. Maintaining and rebuilding SOM is, therefore, essential to ensuring long-term food security and environmental balance. SOM directly influences numerous physical, chemical and biological soil properties, including nutrient cycling, aggregate stability, water retention, microbial activity, carbon sequestration and crop productivity [10,11]. Its dominant position is therefore consistent with decades of soil science research and with previous expert-based soil quality assessment frameworks, suggesting that the AI platforms reproduced the broad scientific consensus regarding the central role of soil organic matter.
In contrast, biological indicators, particularly earthworm abundance, exhibited substantially greater variability among platforms. Earthworms are widely accepted as valuable indicators of soil biological quality because they strongly influence soil structure, organic-matter decomposition, nutrient cycling and ecosystem functioning [29,30]. However, their practical use is considerably more context-dependent than that of most physicochemical indicators: earthworm populations are strongly affected by soil type, climate, moisture conditions, agricultural management, land use and seasonal variability, and their assessment requires standardized field sampling protocols that are not routinely included in many soil monitoring programs [29]. The greater variability observed among AI platforms may therefore reflect the broader diversity of scientific perspectives represented in the
The platforms also differed in how they expressed their judgements. Copilot combined the highest run-to-run variability with the absence of any qualitative justification, whereas Claude assigned comparatively greater importance to biological indicators such as earthworm presence, indicating a broader interpretation of ecological soil functioning. These differences should not be interpreted as evidence that one platform is scientifically superior to another; rather, they demonstrate that different large language models may assign different relative importance to the same evidence because they are developed using different training corpora, optimization procedures and alignment strategies [19,20]. Comparable variability has been reported in recent comparative evaluations of LLM performance across scientific and decision-support tasks [28,30].
From a practical perspective, these findings indicate that AI platforms can produce internally consistent AHP matrices and may substantially accelerate the preliminary stages of multicriteria environmental assessment. Nevertheless, mathematical consistency alone does not guarantee ecological validity or scientific correctness. AI-generated rankings should therefore be regarded as structured preliminary decision-support tools rather than substitutes for expert judgement, and cross-platform comparison, repeated prompting, transparent reporting of model versions and independent expert verification remain essential before AI-generated AHP rankings are incorporated into practical soil quality assessment or environmental management [13,14].

5. Final Remarks

Through this study we evaluated the operational viability and constraints of utilizing Large Language Models (LLMs) within a hybrid AHP–SMART framework for soil quality indicator prioritization. The major conclusions are as follows:
(i) Mathematical Consistency vs. Scientific Validity: While all tested LLM platforms generated mathematically consistent pairwise comparison matrices (CR ≤ 0.10), internal logical coherence does not inherently guarantee ecological validity or domain accuracy.
(ii) Output Instability and Stochasticity: Single-run LLM outputs are inherently unstable, showing within-platform coefficients of variation up to ~34% and occasional logic inversions. Consequently, separate queries are unreliable, and consistent decision-support requires a protocol based on repeated prompting and cross-platform benchmarking.
(iii) Replication of Literature Biases: The AI-generated rankings prioritized physicochemical attributes, led by SOM (global weight ≈ 0.22), while consistently assigning lower weights to biological metrics like earthworms (≈0.08). This reflects and potentially reinforces existing biases in published literature regarding the measurement feasibility of biological indicators.
(iv) Practical Guidance: Generative AI should be viewed strictly as a rapid, low-cost screening tool for initial model structuring rather than an autonomous expert system. Operational deployment in environmental decision-making should ask for expert confirmation, site-specific calibration, and explicit reporting of model versions.
Limitations: A methodological limitation of this study is that inference parameters were governed by the default settings of each platform’s web interface and could not be manually constrained or extracted. While this mirrors the typical user experience of practitioners relying on standard web GUIs for environmental decision support, future studies utilizing API access should explicitly control temperature to further isolate model variance. Although each platform was queried ten times, the four systems remain a convenience sample of mainstream free-tier platforms and do not cover the full AI landscape. Outputs are version- and configuration-dependent and temporally unstable, so the results describe the specific builds accessed in this study. The analysis relies on AI-generated pairwise comparisons without an independent expert-derived benchmark; agreement with the published literature and the internal cross-platform concordance therefore serve as indirect validity checks rather than a formal ground truth. Finally, the analysis is generic rather than site-specific.

Author Contributions

Conceptualization: A.M.d.S.; Methodology: A.M.d.S.; Validation: A.M.d.S. and J.K.; Formal Analysis: A.M.d.S. and J.K.; Investigation: A.M.d.S. and J.K.; Writing—original draft preparation: A.M.d.S.; Writing—review and editing: A.M.d.S. and J.K.; visualization; Supervision: A.M.d.S. and J.K. All authors have read and agreed to the published version of the manuscript.

Funding

This research was funded by the Brazilian National Council for Research and Development-CNPq, Grant: 301955/2022. Author granted: Alexandre Marco da Silva.

Institutional Review Board Statement

Not applicable.

Informed Consent Statement

Not applicable.

Data Availability Statement

The original contributions presented in this study are included in the article. Further inquiries can be directed to the corresponding author.

Acknowledgments

During the preparation of this manuscript/study, the authors used AI platforms: ChatGPT, Google Gemini, Claude, and Microsoft Copilot for the purposes of data generation and analysis. The authors have reviewed and edited the output and take full responsibility for the content of this publication.

Conflicts of Interest

The authors declare no conflicts of interest.

Appendix A

Concepts of the soil attributes contemplated in the study (displayed alphabetically):
EARTHWORMS (PHYLUM ANNELIDA) act as ecosystem engineers, enhancing aeration, porosity, and aggregate stability through burrowing [22]. Their casts are organic debris converted into bioavailable nutrients. They are sensitive to compaction and pollutants. For quantification, it is possible to use a shovel for digging up a block of soil approximately 20 x 20 x 20 x 20 cm. Next, transfer the soil block onto the plastic sheet. By screening, collecting and counting the total number of earthworms and, if possible, separate them by species [29].
HYDROLOGICAL PROPERTIES, SPECIFICALLY INFILTRATION AND WATER-HOLDING CAPACITY, reflect a soil’s ability to drain and store water. Texture and structure are decisive; clay excels in retention, while sand prioritizes infiltration [26]. Field infiltration is measured using double rings or permeameters [30,31], while retention is analyzed via Richards chambers.
NUTRIENT AVAILABILITY defines the soil’s capacity to support life cycles [32]. Comprehensive chemical analysis of macro- and micronutrients is resource-intensive [33], leading to the adoption of Near-Infrared Spectroscopy for efficiency [34]. Derived metrics like Cation Exchange Capacity further indicate nutrient supply potential.
SOIL AGGREGATES are clusters of particles bound by organic agents and roots, indicating structural integrity. Formation is driven by biological secretions, SOM decomposition, and wetting-drying cycles, influencing hydraulic conductivity and carbon sequestration [12,35,36]. Stability is traditionally measured via wet sieving to calculate Mean Weight Diameter [37], though smartphone applications now offer rapid digital alternatives [38].
SOIL ORGANIC MATTER (SOM) is a primary quality indicator essential for fertility and microbial activity [11]. Higher SOM correlates with increased microbial biomass [23]. Typically estimated as 58% carbon in its constitution, SOM loss triggers soil’s degradation [6]. Quantification methods include wet combustion (e.g., Walkley-Black), precise but costly elemental analysis, or the calcination method (400 °C) to determine mass loss [39,40]. While in situ sensors for carbon stocks are emerging, their credibility remains under evaluation [41].
SOIL pH AND ELECTRIC CONDUCTIVITYThe pH governs nutrient bioavailability and microbial health. A range of 6.0–7.0 is generally optimal [42,43]. It is measured using calibrated meters in a 2:1 water-to-soil suspension. Similarly, Electrical Conductivity (EC), usually measured in Siemens per meter (S.m−1), but in agricultural practice, deciSiemens per meter (dS.m−1), milliSiemens per centimeter (mS.cm−1), or microSiemens per centimeter (µS.cm−1), serves as a proxy for soluble salts, texture, and salinity [29]. High EC may indicate either high fertility or harmful salinity [33].

References

  1. Muñoz-Rojas, M. Soil quality indicators: Critical tools in ecosystem restoration. Curr. Opin. Environ. Sci. Health 2018, 5, 47–52. [Google Scholar] [CrossRef] [Scilit]
  2. Maienza, A.; Buttafuoco, G.; Biancofiore, G.; Ün, A.; Renovell, J.; Pisarčik, M.; Fuksa, P.; Grabiński, J.; Lumini, E.; Di Lonardo, S.; et al. Soil quality indicators in agroecological practices: Lessons from a systematic review of long-term experiments. Eur. J. Soil Sci. 2025, 76, e70138. [Google Scholar] [CrossRef] [Scilit]
  3. Negiş, H.; Şeker, C.; Şeker, H.K. Using artificial intelligence algorithms to analyze chromatic attributes for soil quality indicators. J. Soil Sci. Plant Nutr. 2025, 25, 3466–3483. [Google Scholar] [CrossRef] [Scilit]
  4. Pacci, S.; Dengiz, O.; Alaboz, P.; Demirağ Turan, İ.N.C.İ.; Özkan, B. A smart approach to soil quality evaluation by integrating hesitant fuzzy-AHP and artificial intelligence for multi-criteria decision. Int. J. Environ. Sci. Technol. 2026, 23, 104. [Google Scholar] [CrossRef] [Scilit]
  5. Panagos, P.; Montanarella, L.; Barbero, M.; Schneegans, A.; Aguglia, L.; Jones, A. Soil priorities in the European Union. Geoderma Reg. 2022, 29, e00510. [Google Scholar] [CrossRef] [Scilit]
  6. Smith, P.; Poch, R.M.; Lobb, D.A.; Bhattacharyya, R.; Alloush, G.; Eudoxie, G.D.; Anjos, L.H.; Castellano, M.; Ndzana, G.M.; Chenu, C.; et al. Status of the World’s Soils. Annu. Rev. Environ. Resour. 2024, 49, 73–104. [Google Scholar] [CrossRef] [Scilit]
  7. Fausak, L.K.; Bridson, N.; Diaz-Osorio, F.; Jassal, R.S.; Lavkulich, L.M. Soil health–a perspective. Front. Soil Sci. 2024, 4, 1462428. [Google Scholar]
  8. Maaz, T.M.; Heck, R.H.; Glazer, C.T.; Loo, M.K.; Zayas, J.R.; Krenz, A.; Beckstrom, T.; Crow, S.E.; Deenik, J.L. Measuring the immeasurable: A structural equation modeling approach to assessing soil health. Sci. Total Environ. 2023, 870, 161900. [Google Scholar] [CrossRef] [Scilit]
  9. Belcher, B.M.; Claus, R.; Davel, R.; Place, F. Indicators for monitoring and evaluating research-for-development: A critical review of a system in use. Environ. Sustain. Indic. 2024, 24, 100526. [Google Scholar] [CrossRef] [Scilit]
  10. Sharma, S.; Lishika, B.; Kaushal, S. Soil quality indicators: A comprehensive review. Int. J. Plant Soil Sci. 2023, 35, 315–325. [Google Scholar] [CrossRef] [Scilit]
  11. Simon, C.D.P.; Gomes, T.F.; Pessoa, T.N.; Soltangheisi, A.; Bieluczyk, W.; Camargo, P.B.D.; Martinelli, L.A.; Cherubin, M.R. Soil quality literature in Brazil: A systematic review. Rev. Bras. Cienc. Solo 2022, 46, e0210103. [Google Scholar] [CrossRef] [Scilit]
  12. Souza, R.S.; de Morais, I.S.; Rosset, J.S.; de Melo Rodrigues, T.; Loss, A.; Pereira, M.G. Aggregation as a soil quality indicator in areas under different uses and managements. Farming Syst. 2024, 2, 100082. [Google Scholar] [CrossRef] [Scilit]
  13. Saaty, T.L. The Analytic Hierarchy Process: Planning, Priority Setting and Resource Allocation; McGraw-Hill: New York, NY, USA, 1980. [Google Scholar]
  14. Saaty, T.L. Rank generation, preservation and reversal in the analytic hierarchy process. Decis. Sci. 1987, 18, 157–177. [Google Scholar] [CrossRef] [Scilit]
  15. Tang, H.; Shi, P.; Fu, X. An analysis of soil erosion on construction sites in megacities using analytic hierarchy process. Sustainability 2023, 15, 1325. [Google Scholar] [CrossRef] [Scilit]
  16. Kumar, A.; Pant, S. Analytical hierarchy process for sustainable agriculture: An overview. MethodsX 2023, 10, 101954. [Google Scholar] [CrossRef] [Scilit]
  17. Aldridge, C.A.; Colvin, M.E. Writing SMART objectives for natural resource and environmental management. Ecol. Solut. Evid. 2024, 5, e12313. [Google Scholar] [CrossRef] [Scilit]
  18. USDA Natural Resources Conservation Service. Soil Quality Indicators-Biological Indicators and Soil Functions. Factsheet, 2015. Available online: https://www.nrcs.usda.gov/sites/default/files/2023-01/Indicators-Biological-Indicators-and-Soil-Functions.pdf (accessed on 5 May 2026).
  19. FMES (Forbes Magazine Editorial Staff). From ChatGPT to DeepSeek: The 10 Most Used AIs by Professionals (in Portuguese). 2026. Available online: https://forbes.com.br/forbes-tech/2026/03/do-chatgpt-ao-deepseek-o-mapa-das-50-ias-que-ja-dominam-a-internet/ (accessed on 10 May 2026).
  20. Evangelou, E.; Giourga, C. Identification of soil quality factors and indicators in Mediterranean agro-ecosystems. Sustainability 2024, 16, 10717. [Google Scholar] [CrossRef] [Scilit]
  21. Matson, A.; Fantappiè, M.; Campbell, G.A.; Miranda-Vélez, J.F.; Faber, J.H.; Gomes, L.C.; Hessel, R.; Lana, M.; Mocali, S.; Smith, P.; et al. Four approaches to setting soil health targets and thresholds in agricultural soils. J. Environ. Manag. 2024, 371, 123141. [Google Scholar] [CrossRef] [Scilit]
  22. Çelik, Ö.; Sürücü, A. Soil quality assessment in the Araban plain across various land use types. J. King Saud. Univ. Sci. 2024, 36, 103385. [Google Scholar] [CrossRef] [Scilit]
  23. Kooch, Y.; Heydari, M.; Parsapour, M.K.; Valkó, O. Earthworm: A keystone species of soil quality, health, and functions. Acta Oecol. 2025, 128, 104106. [Google Scholar] [CrossRef] [Scilit]
  24. Bhaduri, D.; Sihi, D.; Bhowmik, A.; Verma, B.C.; Munda, S.; Dari, B. A review of effective soil health bio-indicators for ecosystem restoration and sustainability. Front. Microbiol. 2022, 13, 938481. [Google Scholar] [CrossRef] [Scilit]
  25. Gatica-Saavedra, P.; Aburto, F.; Rojas, P.; Echeverría, C. Soil health indicators for monitoring forest ecological restoration: A critical review. Restor. Ecol. 2023, 31, e13836. [Google Scholar] [CrossRef] [Scilit]
  26. Sun, J.; Hua, L.; Niu, Y.; Zhang, Z.; Dong, R.; Chu, B.; Sun, W.; Cai, B. Grassland restoration measures influence soil water-holding capacity by altering soil and vegetation properties composition. Int. Soil Water Conserv. Res. 2026, 14, 100611. [Google Scholar] [CrossRef] [Scilit]
  27. Ascenzi, I.; Hilbers, J.P.; van Katwijk, M.M.; Huijbregts, M.A.; Hanssen, S.V. Empirically based estimates of soil organic carbon gains after ecosystem restoration and their global climate benefits. Sustainability 2026, 18, 2516. [Google Scholar] [CrossRef] [Scilit]
  28. Schweng, S.; Bernardini, L.; Keiblinger, K.; Kaul, H.P.; Fister, I., Jr.; Lukač, N.; Ser, J.D.; Holzinger, A. What can artificial intelligence do for soil health in agriculture? Comput. Sci. Rev. 2026, 59, 100832. [Google Scholar] [CrossRef] [Scilit]
  29. FAO (Food and Agriculture Organization). Soil Testing Methods. Global Soil Doctors Program—A Farmer-to-Farmer Training Program; FAO: Rome, Italy, 2020. [Google Scholar]
  30. Rauber, L.R.; Mallman, M.S.; Reinert, D.J.; Pires, F.S.; Vargas, F.D.; Gubiani, P.I. Automatic measurement of water infiltration into the soil. Rev. Bras. Cienc. Solo 2024, 48, e0230078. [Google Scholar] [CrossRef] [Scilit]
  31. Michaud, M.E.; Gan, H. Comparison of common methods to quantify field saturated hydraulic conductivity in glacial till soils of Northeastern United States. Soil Sci. Soc. Am. J. 2025, 89, e70112. [Google Scholar] [CrossRef] [Scilit]
  32. Brown, P.H.; Zhao, F.J.; Dobermann, A. What is a plant nutrient? Changing definitions to advance science and innovation in plant nutrition. Plant Soil 2022, 476, 11–23. [Google Scholar] [CrossRef] [Scilit]
  33. Carter, M.R.; Gregorich, E.G. Soil Sampling and Methods of Analysis; CRC Press: New York, NY, USA, 2007. [Google Scholar]
  34. Piccini, C.; Metzger, K.; Debaene, G.; Stenberg, B.; Götzinger, S.; Borůvka, L.; Sandén, T.; Bragazza, L.; Liebisch, F. In-field soil spectroscopy in Vis–NIR range for fast and reliable soil analysis: A review. Eur. J. Soil Sci. 2024, 75, e13481. [Google Scholar] [CrossRef] [Scilit]
  35. Hamza, A.; Karčauskienė, D.; Mockevičienė, I.; Repšienė, R.; Tahir, M.A.; Manzoor, M.Z.; Kousar, S.; Lodhi, S.S.; Rasool, N.; Ullah, I. Soil Aggregate Dynamics and Stability: Natural and Anthropogenic Drivers. Agriculture 2025, 15, 2500. [Google Scholar] [CrossRef] [Scilit]
  36. Liu, X.; Fan, S.; Huang, Z.; Liu, J.; Su, W.; Liang, G.; Liu, G. Aggregate protection dominates the variation in soil organic matter temperature sensitivity induced by the expansion of Moso bamboo into Chinese fir forests. Plant Soil 2025, 518, 1–18. [Google Scholar] [CrossRef] [Scilit]
  37. Almajmaie, A.; Hardie, M.; Acuna, T.; Birch, C. Evaluation of methods for determining soil aggregate stability. Soil Tillage Res. 2017, 167, 39–45. [Google Scholar] [CrossRef] [Scilit]
  38. Fajardo, M.; Pino, V.; Jones, E.; Morgan, C.; Stevenson, B.; Saby, N.; Lacoste, M.; McBratney, A. Measuring soil aggregate stability with mobile phones: Lessons, challenges, and future work. Sci. Rep. 2025, 15, 24536. [Google Scholar] [CrossRef] [Scilit]
  39. Gerenfes, D.; Giorgis, A.; Negasa, G. Comparison of organic matter determination methods in soil by the loss on ignition and the potassium dichromate method. Int. J. Hortic. Food Sci. 2022, 4, 49–53. [Google Scholar] [CrossRef] [Scilit]
  40. Rukaitė, J.; Juknevičius, D.; Kriaučiūnienė, Z.; Šarauskis, E. Determination of soil organic carbon by conventional and spectral methods, including assessment of the use of biostimulants, N-fertilisers, and economic benefits. J. Agric. Food Res. 2024, 18, 101434. [Google Scholar] [CrossRef] [Scilit]
  41. Gyawali, A.J.; Wiseman, M.; Ackerson, J.P.; Coffman, S.; Meissner, K.; Morgan, C.L. Measuring in situ soil carbon stocks: A study using a novel handheld VisNIR probe. Geoderma 2025, 453, 117152. [Google Scholar] [CrossRef] [Scilit]
  42. Hartemink, A.E.; Barrow, N.J. Soil pH-nutrient relationships: The diagram. Plant Soil 2023, 486, 209–215. [Google Scholar] [CrossRef] [Scilit]
  43. Wang, C.; Kuzyakov, Y. Soil organic matter priming: The pH effects. Glob. Change Biol. 2024, 30, e17349. [Google Scholar] [CrossRef] [Scilit]
Figure 1. Hierarchical structure used to prioritize soil quality indicators (rectangles) according to SMART criteria (ellipses).
Sustainability 18 08713 g001
Figure 2. Final weights of the soil quality indicators.
Sustainability 18 08713 g002
Table 1. Weights of the SMART criteria assigned by each AI platform.
S.M.A.R.T. Factor ↓ \A.I. Platform →ClaudeChatGPTCopilotGeminiAverageCV (%)
Relevant0.3630.4260.3070.4060.37514.0
Measurable0.2700.2510.2320.2700.2567.1
Specific0.1640.1720.2870.1570.19531.7
Achievable0.0980.0940.1040.0950.0984.8
Time-bound0.1050.0570.0690.0720.07627.3
Coefficient of Variation—CV (%)57.773.353.969.1----
Where dark green cells indicate the highest values within each platform and red cells indicate the lowest values.
Table 2. Maximum eigenvalues (λmax), Consistency Indexes, and Consistency Ratios for SMART factors yielded by tested AI platforms.
ClaudeChatGPTCopilotGemini
λmax5.335.115.125.06
Consistency Index0.0830.0270.0300.015
Consistency Ratio0.0740.0240.0270.013
Table 3. Average final weights across the four AI platforms. In this heat map, cells dark green-painted correspond to the highest values on each AI platform, and cells painted in orange correspond to the lowest values.
Soil Quality IndicatorClaudeChatGPTCopilotGeminiAverageCV (%)
Soil Organic Matter0.189
±0.019
0.224
±0.042
0.229
±0.068
0.226
±0.029
0.2178.8
pH 0.164
±0.013
0.162
±0.045
0.137
±0.050
0.201
±0.042
0.16616.0
Available Nutrients0.136
±0.024
0.145
±0.023
0.163
±0.045
0.140
±0.028
0.1468.3
Water Infiltration and Retention0.131
±0.014
0.144
±0.024
0.144
±0.044
0.119
±0.019
0.1358.8
Aggregate Stability0.119
±0.014
0.155
±0.057
0.149
±0.045
0.102
±0.036
0.13119.3
Electrical Conductivity0.155
±0.020
0.113
±0.059
0.092
±0.047
0.150
±0.025
0.12823.6
Earthworms0.107
±0.019
0.057
±0.012
0.085
±0.028
0.061
±0.011
0.07830.1
Coefficient of Variation (%)19.635.633.639.6
Where green cells indicate the highest values within each platform (column) and red cells the lowest; the bottom row is each platform’s coefficient of variation across the criteria.
Table 4. Maximum eigenvalues (λmax), Consistency Indexes, and Consistency Ratios for Soil Quality Indicators yielded by the four AI platforms.
ClaudeChatGPTCopilotGemini
λmax7.357.577.457.22
Consistency Index0.0580.0840.0750.056
Consistency Ratio0.0440.0650.0570.023
Table 5. Interpretative explanations provided by AI platforms.
AI PlatformInterpretative Explanations Provided by AI Platforms
Claude Sonnet 5Among the soil parameters, Available Nutrients and Organic Matter consistently receive top global scores because they excel across all SMART dimensions: they are specific (quantifiable in mg.kg−1 or %), highly measurable (lab and field kits), relevant to crop performance, and respond to management within 1–3 growing seasons. Earthworms, while a powerful biotic indicator, rank lower primarily due to lower measurability and attainability scores, counting protocols are labor-intensive and subject to seasonal variability.
ChatGPT OpenAI GPT-5.5 InstantOrganic Matter and Water Infiltration dominate the Relevance criterion because they influence structure, nutrient cycling, and resilience. The pH, EC, and Available Nutrients score highest in Measurability due to standardized laboratory methods. Earthworms rank lower in Attainability and Measurability because biological sampling introduces variability.
Most influential indicators—Organic Matter, Water Infiltration and Retention, Aggregate Stability (representing soil structure), water regulation, and carbon cycling, which are central to soil quality.
Moderately important—Available Nutrients, pH.
Lower weight indicators: Electrical Conductivity, Earthworms (due to measurement variability.
Copilot 365The platform did not provide any interpretative explanations.
Gemini Flash 3Organic Matter—High relevance outweighs lower “Time-bound” scores.
Available Nutrients—Balanced performance across all SMART criteria.
pH—Carried by extremely high Measurability/Attainability.
Water Capacity—Essential for crop health; moderate ease of measurement.
Electrical Conductivity—High ease of use, but lower specific relevance to all soils.
Aggregate Stability—Critical physical indicator, but harder to measure (Attainability).
Earthworms—High biological relevance but lack “Time-bound” precision.
Disclaimer/Publisher’s Note: The statements, opinions and data contained in all publications are solely those of the individual author(s) and contributor(s) and not of MDPI and/or the editor(s). MDPI and/or the editor(s) disclaim responsibility for any injury to people or property resulting from any ideas, methods, instructions or products referred to in the content.