Article

Eco-Designing Convenience Food: A Monte Carlo Product Environmental Footprint Assessment of Dry, Fresh, and Instant Pasta Systems

Department for Innovation in the Biological, Agro-Food and Forest Systems, University of Tuscia, 01100 Viterbo, Italy
Sustainability 2026, 18(17), 8712; https://doi.org/10.3390/su18178712
Submission received: 10 July 2026 / Revised: 18 August 2026 / Accepted: 23 August 2026 / Published: 25 August 2026
(This article belongs to the Special Issue Advances in Sustainable Food Technology and Food Industry)

Abstract

The global pasta industry is increasingly challenged to reconcile consumer demand for convenience with the need to reduce environmental impacts across the food supply chain. This study presents a cradle-to-grave Product Environmental Footprint (PEF) assessment integrated with Monte Carlo stochastic simulations to evaluate four durum wheat (Triticum durum) semolina pasta systems: traditional dry pasta, fresh pasta, instant pasta in a rigid cup, and an eco-designed instant pasta in a flexible pouch. Systems were evaluated using a primary functional unit of 1 kg of commercial product and normalized to an isocaloric serving to account for variations in moisture content and preparation. When evaluated across the full cradle-to-grave system boundary, traditional dry pasta (1.91 ± 0.08 kg CO2e/kg) and flexible-pouch instant pasta (1.72 ± 0.08 kg CO2e/kg) achieve comparable, lowest overall impacts, while the rigid cup format (3.85 ± 0.17 kg CO2e/kg) is heavily penalized by packaging mass intensity and transport inefficiency. Industrial starch pre-gelatinization creates a porous structure enabling rapid passive rehydration (0.90 kWh/kg domestic energy), which fully offsets factory thermal inputs (0.326 kWh/kg) and dramatically outperforms traditional stovetop boiling (2.40 kWh/kg). Crucially, replacing rigid cups with flexible pouches reduces total packaging material mass per kg of net pasta product by 72.5% (279.8 g/kg vs. 1016.2 g/kg), avoiding severe volumetric logistics penalties. Conversely, fresh pasta incurs the highest Climate Change impact (4.14 ± 0.17 kg CO2e/kg) due to continuous cold-chain distribution and storage requirements. Overall, this work demonstrates that shifting thermal energy processing from domestic preparation to factory pre-gelatinization—when combined with ambient shelf stability and lightweight flexible packaging—provides a promising eco-design strategy to decarbonize convenience foods, subject to commercial validation of packaging barrier performance and consumer acceptance.

1. Introduction

1.1. Product Typologies and Life Cycle Energy Profiles

The pasta sector is a cornerstone of the global food industry, constantly evolving to balance sustainability requirements with emerging consumption patterns. Behind the generic term “pasta” lie three distinct product categories with specific production, logistical, and consumption characteristics that dictate energy impacts throughout their life cycles:
-
Dry Semolina Pasta: This traditional format is obtained exclusively through extrusion or rolling and subsequent drying of doughs prepared with durum wheat semolina and water. The final moisture content must not exceed 12.5% (w/w), ensuring room-temperature stability for extended periods [1]. While this optimizes logistics, it requires prolonged domestic cooking times.
-
Fresh Pasta: This format undergoes partial drying with regulations stipulating a moisture content of no less than 24% (w/w) and water activity (aw) between 0.92 and 0.97 [1]. It must be refrigerated at temperatures not exceeding +4 °C. Continuous cold-chain maintenance and pasteurization increase its energy profile, while optional additions like eggs or fillings further elevate energy requirements.
-
Instant Pasta: This format includes pre-cooked products via frying or steaming and subsequently dehydrated to a moisture content of 7–10% to ensure microbiological and structural stability in cup or pouch formats [2,3]. Steam pre-cooking induces starch gelatinization, facilitating rapid rehydration with hot water within 3–4 min [4]. Although instant pasta shifts much of the energy load from domestic cooking to industrial processing, it faces nutritional criticism. Commercial variants are often deep-fried, resulting in high saturated and trans-fatty acids [5]. Furthermore, the high glycemic index from complete starch gelatinization and excessive sodium in seasonings correlate with an increased metabolic disease risk [6].

1.2. Industry Landscape and Supply Dynamics: The Italian Benchmark

Global production and commercial dynamics highlight Italy’s leading role in the sector. Italy holds the primacy in production (3.7 million Mg, 22.3% of global output) and export of dry pasta (2.1 million Mg, 43% of the global market) [7]. This leadership reflects a national per capita consumption of ~23 kg/year (19.8 kg dry, 3.4 kg fresh), well above benchmarks like Tunisia (17 kg/year) and Venezuela (15 kg/year) [8].
Regarding supply, Italy is the leading European producer of durum wheat (3.8 million Mg, 12% of the global total), yet relies on 1.9 million Mg of imports (primarily from Canada, France, and Greece) to meet demand. Production shows marked regional specialization:
-
Central-Southern Italy: Hosts 60% of dry pasta factories, with Campania serving as the main hub for exports (24.4%) and production (19%). Puglia leads raw material generation (23.2% of durum wheat), and Sicily concentrates 36% of national milling capacity.
-
Northern Italy: Concentrates 90% of fresh pasta producers. Although fresh pasta accounts for only 5% of total volumes, it generates 15% of the sector’s economic value, with a high export propensity (61.1% of turnover) [8].

1.3. Market Trends Driven by Consumer Drivers

Market growth across all three segments is driven by distinct market dynamics and shifting consumer habits:
-
Dry Pasta: Valued at USD 84 billion in 2025, the global pasta market is projected to reach USD 107.7 billion by 2031, with a compound annual growth rate (CAGR) of 4.33%, propelled by innovations like ancient grains and bronze die extrusion [9].
-
Instant Pasta: Global demand reached 123 billion servings in 2025 [10]. The instant noodles market—valued at USD 51 billion—is projected to reach USD 87 billion by 2031 (CAGR 9.39%) [11]. Even in traditional markets like Italy, demand reaches ~50 million servings annually due to consumer reliance on convenient, quick meals [10].
-
Fresh Pasta: Market value stands at USD 1.66 billion (2026) and is expected to grow to USD 2.24 billion by 2035 (CAGR 3.34%) [12]. Artisanal positioning and reduced cooking times drive this growth, though pasteurization and refrigeration create critical environmental trade-offs [13,14].
The contemporary evolution of consumption appears to be driven by three macro-trends directly influencing energy loads:
  • Convenience and timesaving: Shorter preparation times shift emissions from household cooking to industrial processing, packaging, and cold-chain logistics.
  • Health and wellness: Rising demand for whole-grain, high-protein, and gluten-free formulations requires adjusted drying parameters and cooking times compared to traditional semolina pastas. Meanwhile, instant pasta’s nutritional challenges (fats, high glycemic index) drive industrial efforts to mitigate rapid starch digestion [6].
  • Transparent sustainability: Consumers evaluate cradle-to-grave carbon footprints, weighing the logistical efficiency of ambient dry pasta against the cooking speed of fresh and instant varieties.

1.4. Environmental Hotspots and Study Scope

Life cycle assessment (LCA) literature identifies domestic preparation as a major environmental hotspot [15,16,17,18,19,20,21]. Dry pasta cooking requires ~2.4 kWh/kg [22], generating a carbon footprint of ~0.915 kg CO2e/kg. Domestic efficiency varies significantly by method [23]: eco-sustainable pasta cookers can cut emissions by up to 72% [24], whereas microwave cooking often exceeds 2.5 kWh/kg [25].
This study investigates whether reduced domestic preparation times for fresh and instant formats outweigh the higher industrial energy loads required for thermal processing, pre-cooking, and cold-chain logistics. The objective is to determine the optimal balance between consumer convenience and life cycle environmental performance. Crucially, this study strictly limits its scope to matrices composed exclusively of durum wheat (Triticum durum) semolina and water across dry, fresh, and instant forms. This boundary deliberately separates sustainable durum wheat pasta from the broader instant noodle market, where over 80% of global production consists of deep-fried common soft wheat (Triticum aestivum) flour [26,27]. By isolating durum wheat formulations, this paper models life cycle energy dynamics without the confounding rheological, milling, and deep-frying variables typical of Asian noodle manufacturing [27,28].

2. Methodology

This study follows the life cycle assessment (LCA) procedure in accordance with ISO 14040 [29] and ISO 14044 [30] standards.

2.1. Goal and Scope Definition

The primary goal of this study is to evaluate the environmental impacts associated with the entire life cycle—from agricultural raw material cultivation to end-of-life disposal—of four primary pasta delivery systems derived from durum wheat semolina (DWS):
  • System A: Traditional dry pasta in a flexible bag (DP).
  • System B: Fresh pasta in a flexible bag under modified atmosphere packaging (FRP).
  • System C: Commercial instant pasta in a rigid multi-material cup (IP-Cup).
  • System D: Eco-designed instant pasta in a flexible pouch (IP-Bag).
Additionally, a localized sensitivity scenario (System E) is evaluated in Section 3.6.2 to assess the impacts of a domestic Italian supply chain for the IP-Bag format.
The system boundaries cover upstream agricultural production and milling, primary, secondary, and tertiary packaging materials, automated palletization on wooden Euro EPAL pallets, distribution logistics, and the domestic preparation phase (rehydration/cooking without added seasonings), in alignment with the Product Category Rules (PCR) for dried pasta [31].
As illustrated in Figure 1, a comprehensive cradle-to-grave approach is adopted. The life cycle encompasses the following operational stages:
  • Upstream Raw Material Production: Durum wheat agricultural cultivation, harvesting, and subsequent milling into semolina (DWS].
  • Packaging Production: Manufacturing of primary, secondary, and tertiary packaging formats.
  • Industrial Transformation: Processing and packaging of DP, FRP, and IP, accounting for direct inputs of water (W), electrical energy (EE), and thermal energy (ThE).
  • Differentiated Logistics: Palletized transport to distribution centers (DC) and points of sale (PoS), explicitly distinguishing ambient-temperature transportation (DP, IP) from refrigerated cold-chain management at ≤+4 °C (FRP).
  • Use Phase: Resource consumption during household preparation using either natural gas or low-voltage grid electricity.
  • End-of-Life Management: Final disposal pathways, separating packaging material waste from organic food waste, such as cooked leftovers or broth.

2.1.1. Reference Units and Baselines

To maintain mathematical and thermodynamic consistency across mass balances, supply chains, and dietary intake, three distinct reference baselines were implemented:
Industrial Reference Flow: A factory gate-to-gate processing baseline of 1000 kg/h of raw durum wheat semolina (DWS) (with a baseline composition of 14.5% moisture, 12.5% protein, and 70.2% starch w/w) is established to resolve primary mass, water, and energy balances across the agricultural, milling, and manufacturing steps (Section 2.2.2).
Primary Functional Unit (Environmental Characterization): To assess full life cycle characterization, midpoint profiles, and aggregated PEF single scores, the primary functional unit is defined as 1 kg of palletized commercial pasta product ready for distribution at the factory gate, tracked from cradle to grave.
Isocaloric Functional Unit (Nutritional Comparison): Because the moisture content differs substantially among product types (xW = 12.5% for DP, 28.0% for FRP, and 7.0% for IP), comparing 1 kg of wet packaged weight alone would skew nutritional equivalence. To reflect realistic consumer consumption behavior, impacts are scaled to a dietary functional unit of a single portion consisting of 70 g of raw dry matter, excluding seasonings. Based on moisture variations, this corresponds to a raw commercial consumer mass weight of 80.00 g for DP, 97.22 g for FRP, and 75.27 g for IP.

2.1.2. System Boundary Exclusions

In alignment with Section 6.4.4 and Section 6.5 of PAS 2050 standards [32], the following life cycle elements are excluded:
-
Manufacturing, maintenance, and capital equipment infrastructure (e.g., industrial machinery, agricultural tractors, domestic kitchen appliances).
-
Personnel travel and workforce commuting.
-
Consumer travel to and from retail points of sale.

2.1.3. Geographical, Temporal, and Technological Boundaries

Process configurations reflect typical operational standards of industrial-scale Italian pasta manufacturing facilities, operating under current European environmental regulations (PAS 2050, Section 7.2) [32].

2.1.4. Data Sources

Agronomic practices and milling stage inventories were sourced from data reported by Sgambaro [33,34]. Byproduct generation rates (organic trim, scrap, packaging waste) were quantified directly from process mass balances. Background processes (e.g., energy grids, transport models) were sourced from the Ecoinvent v. 3.9.1 database and modeled using SimaPro Craft 10.2.0.2 software (PRé Sustainability, Amersfoort, Netherlands).

2.2. Life Cycle Inventory (LCI) Analysis

2.2.1. Durum Wheat Semolina Background Process Modeling

The foreground dataset for durum wheat semolina (DWS) was modeled using primary agricultural yield data and localized milling conversion parameters representative of Italian production systems [33,34]. Background data for seed production, machinery operations, synthetic fertilizers, and field operations were sourced from the Ecoinvent v. 3.9.1 database. Soil emissions of greenhouse gases ( N 2 O , CO 2 , CH 4 ) were modeled using standard EPD® [35] and IPCC [36] agricultural emission factors. About 70% of straw was harvested and sold as a byproduct, while the residual 30% and all the below-ground residues were left on the soil [33]. This resulted in an economic allocation factor of 94.75% for durum wheat grains and 5.25% for straw [35]. Full inventory parameters, cultivation input variables, and allocation factors are detailed in Table S1.1 (Supplementary Material Text S1).

2.2.2. Industrial Transformation Lines

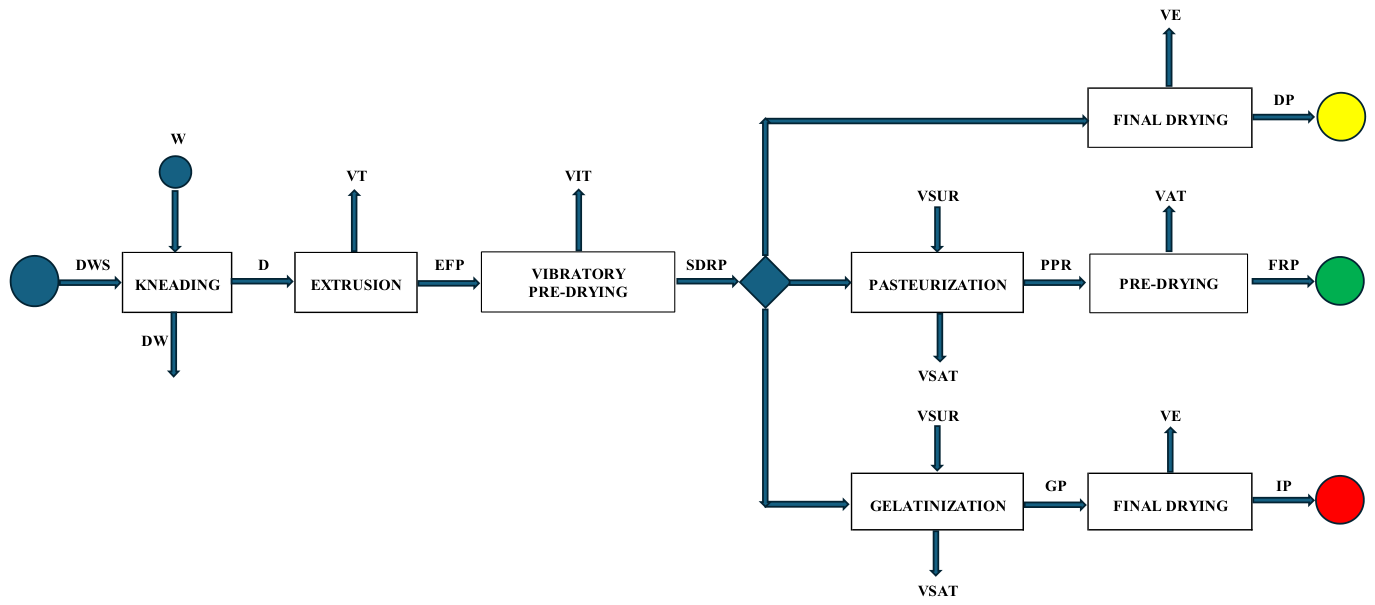
The manufacturing of dry pasta (DP), fresh pasta (FRP), and instant pasta (IP) shares a common upstream processing sequence prior to branching into specialized downstream production routes (Figure 2).
During kneading, durum wheat semolina (DWS) is blended with process water (W) at a ratio of approximately 0.34 kg W per kg DWS. This operation is carried out under vacuum conditions to eliminate air bubbles and foster the development of a fully hydrated gluten matrix. A minor dough waste (DW) fraction (~0.5% mass loss) occurs during mixer startup and shutdown [18].
The hydrated dough is then extruded under pressure through bronze or Teflon dies, where a sudden pressure drop triggers flash evaporation, resulting in a ~1.5% water mass loss as vapor (VT). Immediately following extrusion, the shaped pasta (~35% moisture content) enters a vibratory pre-drying shaker (trabatto), which further reduces moisture levels by 0.3–0.5%. This rapid surface stabilization creates a transient elastic crust that lowers surface water activity (aW) and prevents product adhesion during downstream operations. Operating parameters, mass balances, and specific energy and utility demands for these upstream unit operations are detailed in Table S1.2 (Supplementary Material Text S1) [13,18,37,38].
Following pre-drying, the process diverges into three distinct branches:
Dry Pasta (DP): The product undergoes extended thermal drying (60–80 °C for 2–10 h) to achieve a regulatory moisture target of 12.5%. Starch gelatinization remains minimal (αgel < 5%), preserving native starch for a long shelf life at ambient conditions.
Fresh Pasta (FRP): Pasta enters a pasteurization tunnel using superheated steam (110–130 °C for ~2 min) to reduce the microbial load. Partial condensation increases moisture by ~0.5% before final drying/shaking stabilizes the product at 28% moisture for modified atmosphere packaging (MAP). This treatment induces partial gelatinization (αgel = 75 ± 5%) and protein coagulation, providing characteristic elasticity [39,40].
Instant Pasta (IP): To achieve rapid consumer rehydration (3–4 min), pasta is treated in a gelatinization chamber with superheated steam (VSUR) at 150 °C for 10 min, driving near-complete transformation (αgel > 95%). Latent heat from extracted saturated steam (VSAT) is recovered via heat exchangers to preheat boiler feed water to 80–90 °C. The pre-cooked product (GP) is rapidly dried at 70–90 °C (15–25% relative humidity, RH) to ~7% moisture, establishing capillary microporosity, followed by thermal stabilization at 25–30 °C.
Mass and energy balances —evaluated for a semolina feed rate of 1000 kg/h with 14.5% moisture, 12.5% protein, and 70.2% starch (w/w)—reflect distinct structural transformations and thermal dynamics across the three production routes, as shown in Table 1.
Based on the technical data collected in Table 1, fundamental differences emerge in the degree of transformation of the starch and protein matrices, which are directly reflected in the factory energy balances:
-
Instant pasta (IP, ~0.326 kWh/kg) represents the most energy-intensive process in the sector; its elevated demand is driven by the necessity to front-load thermal energy during steaming to supply both latent and sensible heat required to break starch hydrogen bonds (ΔHgel = 11.9 kJ/kg) [41] and coagulate proteins (ΔHcoag ≈ 5.0 kJ/kg) [42], thereby minimizing cooking requirements for the end consumer.
-
Dry pasta (DP, ~0.238 kWh/kg) ranks as the second most energy-demanding line; despite minimal starch transformation (αgel ≤ 5%), energy use is driven almost entirely by the prolonged drying phase needed to stabilize the product down to 12.5% moisture.
-
Fresh pasta (FRP, ~0.072 kWh/kg) exhibits the lowest direct factory energy consumption because thermal treatment is limited to pasteurization and surface stabilization. However, this production efficiency partially offsets post-manufacturing, as the high water activity and moisture content (28% w/w) mandate a continuous cold chain during storage and logistics.
Accounting for realistic thermal efficiency of 50% for thermal unit operations, the specific energy consumption rises to approximately 0.48 kWh/kg for dry pasta, 0.14 kWh/kg for fresh pasta, and 0.65 kWh/kg for instant pasta.

2.2.3. Packaging Materials and Systems

The packaging system comprises three functional levels (primary, secondary, and tertiary):
-
Flexible Plastic Films: Extruded or laminated polymers (e.g., polypropylene, PP) printed and heat-sealed in-line during filling.
-
Rigid PP Containers: Thermoformed or injection-molded cups, sealed with die-cut, heat-welded aluminum-laminate lids.
-
Secondary and Tertiary Packaging: Corrugated cardboard boxes, adhesive sealing tape, 25 kg wooden Euro EPAL pallets, and low-density polyethylene (LDPE) stretch film for load stabilization.
Technical specifications and nominal Bills of Materials for each format are detailed in Table S1.3 (Supplementary Material Text S1).
Packaging choices strongly dictate logistical efficiency and the environmental footprint across the formats analyzed:
  • Dry Pasta (DP): Packaged in flexible PP bags, DP represents the baseline benchmark for packaging efficiency with a packaging-to-product mass ratio of 0.126 kg/kg (Table S1.3). Ambient stability eliminates the need for complex barrier materials or cold chain maintenance.
  • Fresh Pasta (FRP): Utilizes laminated pouches (PE 79.4%, polyamide PA 18.4%, polyurethane adhesive PUR 2.2%) combined with modified atmosphere packaging (MAP) containing CO2 (1.2 g/pack) and N2 (1.9 g/pack) to ensure preservation [13]. Distribution requires refrigerated logistics (0–4 °C).
  • Instant Pasta in Cups (IP-Cup): Packaged in single-serve rigid PP cups (~11 g) with multi-layer aluminum lids (~1.0 g: 79.6% aluminum foil, 17.5% PP sealing layer, 2.9% acrylic varnish) and paper labels (~6.5 g) [43]. Low volumetric storage density yields an unfavorable nominal packaging index of 1.023 kg/kg (Table S1.3). Furthermore, low mechanical resistance requires heavy tertiary stabilization (16 corrugated cardboard layer pads and 4 pressed cardboard edge protectors).
  • Eco-Design Instant Pasta in Bags (IP-Bag): To address the high environmental burden of the cup format, an eco-design scenario shifts the product into a 500 g bulk bag format using Italian pasta “nests” (25–50 g units). This structure allows easy portioning without breakage, simplifies form–fill–seal manufacturing, and enables dense shipping in closed cartons without tertiary edge protectors. Consequently, the packaging-to-product ratio drops to 0.282 kg/kg, and the pallet load density increases from 90.6 kg to 162.0 kg of pasta per pallet (Table S1.3).
Figure S1.1 in the Supplementary Material Text S1 illustrates the packaging phases for the diverse types of pasta examined, along with the management of packaging and organic waste.
For an accurate impact assessment, industrial material scrap rates and average waste coefficients were applied based on literature benchmarks [13,17] and material-specific industrial factors, as reported in Table S1.4. For IP-Cup, conservative values were adopted: 1.2% for rigid containers (lower than flexible films due to greater structural rigidity) and 0.5% for paper components and aluminum lids, in line with data recorded for fresh pasta [13].
The total hourly mass balance of the packaging processes for the four pasta types is summarized in Table 2, with individual line balances detailed in Supplementary Material Text S1 (Tables S1.5–S1.8).
The mass flow analysis (Table 2) demonstrates clear differences in packaging intensity. Dry pasta (DP) requires a total packaging input of 122.30 kg/h to deliver 1092.11 kg/h of palletized product (969.83 kg/h net pasta). Conversely, IP-Cup exhibits significant criticality: delivering 913.39 kg/h of net pasta requires 934.79 kg/h of total packaging material inputs (289.05 kg primary, 306.53 kg secondary, and 339.21 kg tertiary), resulting in 928.16 kg/h of embedded packaging in the output—exceeding the weight of the food itself.
Adopting the eco-design IP-Bag format achieves a 72.5% reduction in embedded packaging mass (255.59 kg/h), dropping primary packaging inputs to 16.65 kg/h, secondary inputs by 69.5% (93.45 kg/h), and tertiary inputs to 146.92 kg/h.
Total process waste and residues range from a minimum of 2.81 kg/h for IP-Bag to a maximum of 8.00 kg/h for IP-Cup (Table 2). While organic waste (scrapped pasta) remains low across all formats (1.18–2.43 kg/h), IP-Cup generates significantly higher solid technical waste—specifically cellulosic paper/cardboard waste (RCC: 3.95 kg/h) and plastic/aluminum waste (RPL+RAL: 2.17 kg/h)—due to structural assembly trimming.
Segregating waste streams into cellulosic (RCC), plastic/aluminum (RPL+RAL), and wood waste (RL) pathways ensures accurate end-of-life modeling and recycling credit allocation in the Life Cycle Inventory (LCI).
LCI parameters, specific conversion utilities, scrap factors, and Ecoinvent v. 3.9.1 background datasets [44,45] for packaging component manufacturing are summarized in Table S1.9 (Supplementary Material Text S1). In the absence of primary plant data for instant pasta packaging, modeling was based on industrial specifications [43]. Rigid PP cups (11 g) were modeled via sheet extrusion and thermoforming with a 15.0% skeletal scrap rate (1.1765 kg gross PP/kg cup). Multi-layer lids (1.0 g) incorporate a 16.5% circular die-cutting scrap rate (gross inputs: 0.9533 kg Al foil, 0.2096 kg PP granulate, and 0.0347 kg acrylic varnish). Transformation operations were allocated to specific component masses, while final slitting was modeled on the cumulative laminate coil mass (1.1976 kg) using metal-working proxies. Multi-layer lid scrap (0.1976 kg/kg lid) was routed to thermal treatment due to delamination constraints, whereas single-polymer PP scrap was assigned to national polymer recycling mixes. For stabilization elements, corrugated cardboard pads incorporate a 3.0% trimming scrap rate (1.03 kg gross/kg pad; 0.025 kWh MV electricity/kg), and pressed edge protectors were modeled using folding boxboard with a 5.0% profiling scrap rate (1.0526 kg gross/kg profile; 0.120 kWh MV electricity/kg and 1.5 MJ natural gas/kg). All paper scrap streams were routed to recycling loops.
Finally, packaging line machinery, structural assembly, and end-of-line palletization consume a uniform electricity demand of 0.0373 kWh (Italian MV grid) per kg of finished product across all formats [33]. Integrating these mass flows, specific conversion energies, and waste coefficients in SimaPro captures the synergy between material complexity and manufacturing intensity, defining the overall life cycle footprint.

2.2.4. Transport and Distribution Phase

All inbound and outbound logistics rely on standard EURO 6 road vehicles and transcontinental container ships. To capture supply chain variability, each transport leg was modeled across Minimum, Base, and Maximum distance scenarios (Table S1.10: Supplementary Material Text S1).
This phase encompasses six distinct logistics stages:
  • Inbound Raw Materials: Inter-facility road transport of agricultural inputs (durum wheat grains from Field to Mill; semolina from Mill to Factory Gate, FG) and packaging raw materials from Production Site (PS) to Packaging FG (PFG) via 16–32 Mg and 7.5–16 Mg trucks, respectively.
  • Finished Packaging Materials: Transport of ready-to-use packaging components (cups, lids, films, cartons) from the PFG to the pasta manufacturing plant (FG) via 7.5–16 Mg trucks.
  • Downstream Product Distribution: Delivery of palletized finished products from FG to regional distribution centers (DC) and points of sale (PoS):
    Dried Pasta: Ambient transport using 16–32 Mg articulated lorries (Base: 800 km; range: 150–1400 km). Loads are weight-saturated due to high product bulk density.
    Fresh Pasta: Temperature-controlled transport using 7.5–16 Mg refrigerated lorries (Base: 450 km; range: 50–1200 km) to account for shorter regional distribution loops.
    Instant Pasta: Due to minimal domestic manufacturing in Italy, IP trade relies on imports categorized under the Harmonized Commodity Description and Coding System (HS) managed by the World Customs Organization [46], falling under the broader six-digit subheading HS 1902.30 (“Other pasta”). Downstream supply was modeled via two parallel procurement pathways:
    -
    Intra-European Pathway (~70% market share): Centralized European manufacturing hubs (e.g., Spain, Hungary, Poland, Germany) supplying Italy via 16–32 Mg articulated lorries (Base: 1300 km; range: 600–1800 km).
    -
    Direct East Asian Pathway (~30% market share): Oceanic transport via container ships (Base: 10,000 km maritime; range: 8000–15,000 km) followed by 300 km of domestic road transport from port to DC.
  • Modified Atmosphere Packaging (MAP) Gases: Logistics for MAP gases (N2 CO2) used in FRP account for the containment vessel’s deadweight via a Cargo Multiplication Factor (CMF), defined as the ratio of the total transported mass (tare + gas) to the net mass of the gas consumed. The overall transport workload (WGas, expressed in Mg km) disaggregates into forward and return legs:
    W G a s = W F o r   + W R e t  
    with
    W F o r = M G a s   C M F   T D   1000  
    W R e t = M G a s   1000   ( C M F 1 )   T D   R l o g
    where MGas is the net mass of the gas consumed in the packaging process (kg), TD is the one-way transport distance (km) from the industrial gas production plant to the pasta facility (Table S1.10), and Rlog is a binary reverse-logistics operator (Rlog = 1 for pressurized CO2 steel cylinders requiring return; Rlog = 0 for bulk cryogenic liquid N2L). Operational parameters, average values, and sensitivity ranges are provided in Table S1.11 (Supplementary Material Text S1).
  • EPAL Wooden Pallets: Open-loop logistics between pallet management center (EPMC), FG, and DCs. Empty pallets are returned to the nearest EPMC over a baseline distance of 100 km (range: 30–250 km).
  • Waste Management: Transport of manufacturing waste from FG and post-consumer packaging/organic waste from consumer households (CH) to waste collection centers (WCC) via 7.5–16 Mg trucks (Base: 50 km).
To address geographical and trade volume uncertainties, IP distribution was parameterized in SimaPro. A single independent parameter for the East Asian market share (SAsia) was assigned a Uniform Distribution bounded by a conservative lower limit of 15% and an upper limit of 50%, with the European share dynamically defined as SEurope = 1 − SAsia.
In Monte Carlo simulations, road transport performance (Mg · km per Mg packaged product) combines SEurope, applied to a triangular distance distribution (Base: 1300 km; range: 600–1800 km), and SAsia, applied to the transoceanic route (Base: 10,000 km; range: 8000–15,000 km) plus the domestic leg of 300 km.
Vehicle load saturation depends on packaging geometry: while IP-Bag and DP-Bag designs maximize mass density per vehicle volume, the rigid IP-Cup configuration induces volume constraints that reduce net food mass per truck load, increasing total vehicle trips for an equivalent delivered mass.

2.2.5. Use Phase

Conventional dry pasta (DP) and instant pasta (IP) are stored at an ambient temperature, whereas fresh pasta (FRP) requires refrigeration at 4 °C across three stages: transport, retail, and domestic storage.
-
Retail Storage: Modeled for 50% of the declared shelf-life (60 days of a 120-day shelf-life). Using PCR guidelines [47] (0.00118 kWh/kg/day), commercial storage consumes 0.0708 kWh/kg.
-
Domestic Storage: Following PCR parameters [31] (old Class A appliance consuming 300 kWh/year across a 10 kg capacity = 0.082 kWh/kg/day), a 60-day home residence time consumes 4.92 kWh/kg. Total refrigerated storage for FRP thus requires ~5.00 kWh/kg.
Domestic preparation for DP and FRP requires 10 L of water and 70 g of salt per kg of pasta [48] and, according to PEF [22] and EPD [31] standards, 0.18 kWh per L of water to reach boiling plus 0.05 kWh per minute of active boiling.
Based on ISO 7304-1 optimal cooking times [49], energy consumption varies by format:
Dry Pasta (DP): An average cooking time of 12 min (range: 9–14 min) yields 2.40 kWh/kg.
Fresh Pasta (FRP): An average cooking time of 5 min (range: 3–9 min) yields 2.05 kWh/kg.
Instant Pasta (IP): Based on WINA standards [10], IP utilizes passive rehydration with a water-to-product ratio of 5 L/kg (300–350 mL per 60–75 g serving) with no active boiling, dropping preparation energy to 0.90 kWh/kg.
Domestic energy inputs follow the European average stove distribution (83% gas, 17% electric) [22], with product-specific energy demands governed by the operational cooking and storage parameters detailed in Table S1.12.
The life cycle energy distribution reveals a notable “energetic paradox” between DP and FRP. Although FRP saves 15% energy during cooking compared to DP, home refrigeration (accounting for >70% of FRP’s total life cycle energy) negates this benefit. To offset this energy debt, three interventions are evaluated:
  • Reduced Domestic Holding Time: Lowering home storage from 60 to 7 days reduces storage energy from 4.92 to 0.57 kWh/kg, lowering total FRP use-phase energy to ~2.7 kWh/kg (near DP baseline).
  • Appliance Upgrades: Upgrading to new EU Class A refrigerators (≤100 kWh/year) reduces daily specific consumption to 0.027 kWh/kg/day.
  • Packaging Innovation: Utilizing ambient-stable packaging to eliminate cold-chain requirements during portions of the shelf-life.
While IP is the most energy-efficient format overall, FRP sustainability remains heavily constrained by consumer holding duration and appliance efficiency.

2.2.6. End-of-Life

The end-of-life (EoL) phase evaluates primary packaging disposal alongside post-consumer food waste, accounting for cooking-induced water absorption dynamics that alter final waste mass:
-
Dry Pasta (DP): Absorbs 1.3 ± 0.10 g of water/g raw pasta [17]. Prepared at 10 L/kg, ~5% evaporates, 11 ± 2% is retained in the matrix [24], and the remaining water is discarded to sewage.
-
Fresh Pasta (FRP): Cooked weight increases by 116–118% relative to raw mass [50]. Prepared at 10 L/kg, shorter boiling limits evaporation to 3–4%, with the remainder discarded to sewage.
-
Instant Pasta (IP): Hydration yields a cooked-to-raw mass ratio of 2.0 g/g (range: 1.85–2.15 g/g) [51]. Prepared via passive rehydration (5 L/kg for 3–4 min), 1–2% evaporates, 0.85–1.15 L/kg dry product is retained, and unconsumed seasoned broth is drained.
Post-consumer raw mass waste is governed by product shelf-life and supply chain stability (Table S1.13). Ambient dry pasta (DP; 24–36 months shelf life) and instant pasta (IP; 12–18 months shelf life) exhibit high microbiological stability, resulting in low retail waste (<1%) and consumer household waste (2–3% for DP; ~2% for IP) [52,53]. Conversely, fresh pasta (FRP; 1–4 months shelflife) experiences higher loss rates, with retail waste reaching 5–7% and consumer waste reaching 10–12% due to cold-chain vulnerabilities [54].
For cooked leftovers, standard PEF and EPD guidelines apply a uniform default waste rate of 2% across formats [22,31]. However, empirical field data from Last Minute Market/Barilla SpA show real-world cooked leftovers ranging from 10 to 40% (averaging 25% in school catering) [48]. While single-use IP formats intrinsically minimize portioning residues [48], DP and FRP remain susceptible to over-portioning. Consequently, the standard 2% default is retained for baseline modeling, whereas the empirical 10–40% range is evaluated in parametric sensitivity analysis.
Packaging disposal varies by design: multi-material IP cups (plastic cups, paper sleeves, and aluminum lids) present complex recycling challenges, whereas mono-material PP bags for DP and FRP enter standard plastic streams. Upstream industrial waste streams—including organic scraps, plastic film, paperboard, and broken pallets—are managed according to 2022 Italian waste pathways (Table S1.14) [55,56,57,58,59,60]. Material sorting-for-recycling rates are 81.2% for paper/cardboard, 73.6% for aluminum, 62.7% for wood, and 48.9% for plastics [58]. Collected organic food waste undergoes biological treatment (49.2%, split into 44.0% composting and 5.2% anaerobic digestion) [60], with the unsorted organic fraction split between landfilling (21.9%) [56] and waste-to-energy incineration (28.9%).

2.3. Environmental Impact Assessment

The environmental impact of the chosen functional unit was evaluated using the standard Product Environmental Footprint (PEF) methodology [61,62,63], implemented within SimaPro Cluster 10.2.0.2 software (PRé Consultants, Amersfoort, NL). Following the Ecoinvent cut-off system model [64], the producer bears full responsibility for waste disposal without receiving environmental credits for recyclable material provisions. Consequently, potential CO2 credits from recycling both renewable and non-renewable materials were excluded to ensure a conservative impact assessment.
The PEF method evaluates 16 distinct impact categories, each linked to specific reference substances as follows: Climate Change (CC): kg CO2e; Ozone Depletion (OD): kg CFC11e; Ionizing Radiation—human health (IR): kBq 235Ue; Photochemical Ozone Formation (PhOF): kg NMVOCe; Particulate Matter (PM): disease incidence; Human Toxicity, non-carcinogenic effects (NC-HT): CTUh; Human Toxicity, carcinogenic effects (C-HT): CTUh; Acidification (AC): mol H+e; Freshwater Eutrophication (FWE): kg Pe; Marine Eutrophication (ME): kg Ne; Terrestrial Eutrophication (TE): mol Ne; Freshwater Ecotoxicity (FWET): CTUe; Land Use (LU): Pt; Water Use (WU): m3 water deprived; Resource Use, fossils (RUF): MJ; and Resource Use, minerals and metals (RUMM): kg Sbe.
To resolve environmental trade-offs and derive an overall PEF score, individual category results were consolidated into a single Weighted Single Score. This normalization and weighting procedure aligned with the global impact benchmarks and factors recommended by Sala et al. [65] and Sala et al. [66], respectively.

2.4. Data Quality and Uncertainty Analysis

The reliability of the Life Cycle Inventory (LCI) was verified using a Data Quality Indicator (DQI) framework based on the pedigree matrix [67]. Primary data flows were divided into foreground data (specific primary information from dry and fresh pasta manufacturers, including packaging and waste processes) and background data (generic secondary data, such as the Italian electricity grid mix). Significant data flows, identified via process network maps, were evaluated across five dimensions: Reliability (Ri), Completeness (Coi), Temporal Representativeness (TiRi), Spatial Representativeness (GeRi), and Technical Representativeness (TeRi). Individual scores were aggregated into a Data Quality Rating (DQRi) for each data flow via the following equation:
D Q R i = R i + C o i + T i R i + G e R i + T e R i 5
The dataset’s final DQR was determined by averaging these individual DQRi values. According to PEF guidelines [62], datasets were classified into five qualitative tiers: Excellent (DQR ≤ 1.5), Very Good (1.5 < DQR ≤ 2.0), Good (2.0 < DQR ≤ 3.0), Fair (3.0 < DQR ≤ 4.0), or Poor (DQR > 4.0). Parameter uncertainty (PUi) was quantified on a data quality scale from 1 (highest quality) to 5 (lowest quality), corresponding to specific geometric standard deviations (σgi) ranging from 1.05 to 2.00. The standard uncertainty (ui) for each life cycle step (PEFi) was calculated using refined uncertainty factors:
ui = PEFi (σgi − 1)
Assigned factors (σgi − 1) ranged from 0.05 for measured primary data (PUi = 1) to 1.00 for highly uncertain proxies (PUi = 5). The overall standard uncertainty (uT) for the total PEF score was calculated using the Root Mean Square (RMS) method, assuming independent distributions [61,67]:
u T = i u i 2
The final uncertainty range is presented as ± (2 × uT), approximating a 95% confidence interval [62].

2.5. Monte Carlo Analysis and Probabilistic Dominance

To evaluate the inherent variability in primary LCI data—specifically regarding agricultural yield fluctuations, processing energy, packaging material masses, transport distances, and domestic preparation parameters across the pasta variants—a Monte Carlo Analysis (MCA) with 2000 sampling iterations was performed [68]. Parameter uncertainty was modeled by assigning log-normal, triangular, or normal probability distributions to all foreground and background LCI inputs.
Probabilistic dominance was defined as the likelihood of traditional dry pasta (System A) exhibiting equal or higher environmental impacts than alternative formats (Systems B–E), expressed as P(A ≥ J) across 2000 iterations, adopting a 95% confidence threshold (p < 0.05).
The environmental variance and comparative performance between systems were quantified using the following stochastic metrics:
-
Weighted Single Score (PEF): Aggregates characterization, normalization, and weighting factors into a single metric expressed in points (Pt) to compare cumulative footprints.
-
Probability P(AJ): Denotes the percentage of iterations where the environmental impact score of System A exceeds or equals that of System J (J ∈ B, C, D, E). Values near 50% indicate high distribution overlap (environmental equivalence), whereas boundary values near 0% or 100% indicate strong probabilistic dominance for System A or System J, respectively.
-
Mean Absolute Difference (AJ): Reported alongside its standard deviation (SD) to illustrate the absolute scale of variance between product baselines in impact points (ICNWj).
-
Relative Percentage Difference (ΔAJ): Quantifies the relative deviation of System A against reference System J, calculated as:
Δ A J = ( Mean A M e a n J ) M e a n J × 100
where MeanA represents the stochastic mean impact of dry pasta, and MeanJ represents the stochastic mean impact of the comparison system J.
Under this definition, negative ΔAJ values indicate an environmental advantage for System A (lower impact score than System J), whereas positive ΔAJ values indicate an environmental advantage for System J (System A exhibits a higher impact score than System J). Percentage differences were interpreted with caution in impact categories characterized by low absolute baseline values, where minor numerical variances can artificially amplify relative percentage shifts.

2.6. LCA Software Modeling and Network Structure

The life cycles of the pasta variants were modeled in SimaPro using a stage-based hierarchical product network rather than decoupled assemblies, ensuring sequential tracking of material, packaging, and energy flows from raw agriculture to final consumption, as summarized in Table S2.1 (Supplementary Material Text S2).
The network integrates five core dimensions:
-
Unit Processes: Model upstream durum wheat agriculture, semolina milling, pasta manufacturing, and component-level packaging production (PP bags/cups, labels, cartons, tape, EPAL pallets, and shrink film).
-
Multi-Tiered Packaging: Structures packaging into three hierarchical assembly levels linked to the product matrix: Primary (Ass-1 pack, direct food contact), secondary (Ass-2 pack, outer cases/multipacks), and tertiary (Ass-3 pack, palletization).
-
Use Phase: Quantifies consumer-stage water and energy grid consumption required for cooking each packaged variant.
-
Reverse Logistics: Tracks circular transport loops, including an EPAL wooden pallet pooling system that amortizes tertiary packaging burdens over multi-trip cycles.
-
End-of-Life (EoL) Scenarios: Routes post-industrial and post-consumer waste streams directly from their generation stages into material-specific pathways—plastics (RPL), paper/cardboard (RCC), and wood (RL)—across landfilling, incineration, and recycling (EoL-1-3 pack).
Detailed inventory data and SimaPro network flowcharts for all scenarios (including the Made-in-Italy bag format) are provided in Tables S2.2–S2.63 (Supplementary Material Text S2).

3. Results

3.1. Life Cycle Impact Assessment and Network Flow Analysis

To systematically identify the accumulation and shifting of environmental burdens across the four pasta systems, structural network flow analysis was conducted using cumulative single score metrics (Figure S1.2a–d). The visual stream width within the Sankey diagrams directly reflects the impact magnitude, revealing distinct hotspot shifts between traditional and convenience formats:
Dry Pasta (DP; 161.4 μPt/kg): Exhibits a streamlined, linear network dominated by upstream agriculture. The primary environmental drivers are localized diesel fuel during harvesting and synthetic fertilizer production (ammonium nitrate and inorganic phosphorus) for durum wheat cultivation, followed by semolina milling. Post-milling mechanical dehydration and ambient flexible packaging introduce minimal downstream flow deviations.
Instant Pasta in a Bag (IP-Bag; 161.7 μPt/kg): Displays a hybrid profile that couples high upstream processing intensity with a streamlined packaging footprint, achieving an overall impact equivalent to traditional DP (a 56.4% reduction relative to the cup format). Industrial flash-cooking and specialized dehydration expand the factory utility branch (medium-voltage electricity and natural gas), but nesting low-mass flexible polymer pouches within corrugated shipping cartons prevents downstream visual bloat.
Fresh Pasta (FRP; 347.9 μPt/kg): Features a bifurcated network where non-dehydrated high moisture content bypasses factory drying but introduces major downstream burdens. Continuous cold-chain logistics (refrigerated road transport and cold storage) and post-consumer cooking wastewater treatment generate heavy post-manufacturing hotspots alongside durum wheat cultivation.
Instant Pasta in a Cup (IP-Cup; 370.8 μPt/kg): Generates the highest total environmental footprint, shifting the system’s center of gravity downstream. While agricultural inputs remain relevant, visual flow expands dramatically around the multi-material container assembly. Sheet extrusion, thermoforming, and metalworking for the rigid PP cup, aluminum foil lid, corrugated pads, and paper labels create a concentrated packaging hotspot that dominates the total life cycle footprint.
Logistical performance across the four pasta systems underscores how material volume, packaging mass, and transport mode dictate distribution impacts (Table S1.15). The data highlight a strong contrast between transoceanic shipping and regional road freight. For instant formats, direct ocean shipping from East Asia accounts for massive transport distances—6.069 Mg·km for IP-Cup and 3.846 Mg·km for IP-Bag—yet yields remarkably low single score impacts (5.52 μPt/kg and 3.50 μPt/kg, respectively) due to bulk marine fuel efficiency. Conversely, overland trucking dominates distribution emissions: outbound road freight for IP-Cup (2.328 Mg·km via 16–32 Mg lorry) generates 33.01 μPt/kg, nearly six times the impact of its transoceanic leg.
This trend also reflects the “packaging weight penalty” of rigid containers. The high tare weight and lower bulk density of the IP-Cup increase outbound transport burden relative to the IP-Bag, whose flexible pouch structure reduces outbound road emissions to 20.87 μPt/kg (1.472 Mg·km). Finally, fresh pasta (FRP) exhibits a distinct logistics profile: while outbound distribution is relatively low (0.6716 Mg·km; 9.52 μPt/kg), regional inbound raw material transport demands 1.725 Mg·km, driving a substantial localized load of 29.81 μPt/kg (via 7.5–16 Mg lorries) due to smaller vehicle capacities and active cold-chain requirements.

3.2. Life Cycle Step Contributions

Table 3 presents the deterministic contribution analysis calculated from static point estimates in the Life Cycle Inventory (LCI). The deterministic single scores split the four formats into high-impact systems—instant pasta in a cup (370.8 μPt/kg) and fresh pasta (347.9 μPt/kg)—and low-impact systems, comprising instant pasta in a bag (161.7 μPt/kg) and traditional dry pasta (161.4 μPt/kg).
While durum wheat cultivation establishes a substantial environmental baseline across all configurations (44.6–58.7 μPt/kg), its relative contribution varies fundamentally based on downstream system design. For traditional dry pasta and the Instant Pasta—Bag formats, agricultural field operations represent the single largest hotspot, driving 33.6% and 36.3% of their respective totals. Conversely, in the fresh pasta and Instant Pasta—Cup systems, the relative weight of agricultural inputs falls to 12.8% and 15.8%, as their environmental profiles become heavily dominated by downstream lifecycle stages. Across all four variants, secondary processing steps—semolina milling, extrusion, and pre-packaging handling—maintain a negligible footprint, collectively accounting for less than 10% of any single product’s total PEF score.
The primary divergence in lifecycle behavior stems from structural trade-offs between packaging complexity and consumer preparation.
Instant pasta in a cup exhibits a packaging-dominated profile, where the rigid multi-material container assembly (PP cup, Al foil lid, and cardboard protective sleeves) generates an extraordinary 219.8 μPt/kg—accounting for 59.3% of the total product footprint and dwarfing its agricultural stage nearly fourfold. However, its rapid rehydration efficiency drastically restricts its use-phase burden to just 5.0% (18.4 μPt/kg). By replacing the rigid container with a low-mass flexible polymer pouch, instant pasta in a bag slashes absolute packaging impacts by over 83% down to 36.3 μPt/kg (22.4%). Because it retains the same optimized rehydration phase (18.4 μPt/kg; 11.4%), this pouch format successfully re-establishes agriculture as the primary driver, yielding a streamlined eco-profile that matches traditional dry pasta.
In sharp contrast to the packaging-heavy Instant Pasta—Cup, fresh pasta presents a consumer-use-dominated system. Its use phase accounts for 219.2 μPt/kg—an overwhelming 63.0 % of its total footprint—driven by the thermodynamic energy demands of continuous household/commercial refrigeration throughout its shelf-life alongside extended boiling times. Traditional dry pasta maintains a more balanced co-dominance between agricultural inputs ( 33.6 % ) and domestic cooktop energy (32.3%; 52.2 μPt/kg), operating without cold-chain requirements.
Finally, logistical transportation imposes a steady burden of 13.0–18.8% across all formats, peaking in absolute terms for the Instant Cup (49.1 μPt/kg) and fresh pasta (44.5 μPt/kg) due to container volumetric constraints and refrigerated freight, respectively. In the Waste Disposal stage, while fresh pasta (0.7%) and the Instant Cup (2.2%) incur net positive burdens, traditional dry pasta achieves a net-negative score (−0.4%; −0.7 μPt/kg). This credit occurs because energy recovery and nutrient capture from cooking wastewater treatment in modern European municipal infrastructure outweigh the minor end-of-life impact of its simple flexible film packaging.

3.3. Data Quality Rating and Uncertainty Analysis

To validate the reliability and robustness of the compiled life cycle inventories, detailed pedigree matrix assessments were performed in strict alignment with the process network configurations (Figure S1.2) and primary environmental drivers (Table 3). This qualitative framework evaluates each inventory parameter independently across five core indicators—Reliability (Ri), Completeness (Coi), Temporal Representativeness (TiRi), Geographical Representativeness (GeRi), and Technical Representativeness (TeRi)—to provide transparent, criteria-specific justifications across all life cycle stages.
To accurately reflect structural differences in data provenance between empirical commercial operations and prospective packaging scenarios, the pedigree evaluation was configured into two dedicated matrix structures (Tables S1.16 and S1.17 in Supplementary Material Text S1):
Empirical Commercial Formats (Dry Pasta, Fresh Pasta, Instant Pasta—Cup): Table S1.16 evaluates the baseline commercial products. Sourced directly from certified Environmental Product Declarations (EPDs), industrial mass and energy balances, and verified factory logistics records, these formats achieve high representativeness scores across technical (TeRi = 2) and geographical (GeRi = 1–2) parameters. This yields a consolidated Data Quality Rating (DQR) score of 2.10.
Prospective Scenario (Instant Pasta—Bag): Table S1.17 models the prospective instant-bag variant. Because this format couples scaled processing parameters with literature proxy datasets for the flexible polymer pouch, higher parameter uncertainty scores were assigned to Pasta at Packaging (DQRi = 3.00), Packaging Materials (DQRi = 3.00), Transport (DQRi = 2.80), and Waste Disposal (DQRi = 2.60). Consequently, this system registers a distinct consolidated DQR score of 2.40.
According to the PEF classification reported in Table 22 of ref. [63], both aggregated DQR profiles fall within the 2.0 < DQR ≤ 3.0 interval corresponding to the “Good” data-quality class.
To complement the semi-qualitative DQR evaluation, a quantitative uncertainty analysis was executed using Monte Carlo simulations (n = 2000) to calculate the total standard uncertainty (uT) for each life cycle model based on stage-specific parameter uncertainty scores (PUi) and percentage contributions (PEFi) (Table S1.18).
The resulting uncertainty values were 10.59% for dry pasta, 16.32% for fresh pasta, 15.45% for Instant Pasta—Cup, and 9.66% for Instant Pasta—Bag.
Based on the PEF classification reported in Table 20 of ref. [63], Instant Pasta—Bag falls within the “Excellent” precision category (uT ≤ 10%), whereas dry pasta, fresh pasta, and Instant Pasta—Cup fall within the “Good” category (10% < uT ≤ 20%).

3.4. Characterization Profiles

Table 4 presents the cradle-to-grave environmental impact profiles for 1 kg of each pasta format across the sixteen PEF impact categories (ICj).

3.4.1. Climate Change and Energy Consumption

Climate Change (CC) and Resource Use, Fossils (RUF) demonstrate parallel trajectories across the four evaluated formats, driven by a combination of processing, packaging, and domestic cooking energy:
High-Impact Group: fresh pasta and instant pasta in a cup exhibit the largest carbon footprints (4.14 ± 0.17 and 3.85 ± 0.17 kg CO2e/kg) and fossil resource demands (61.14 ± 2.36 and 60.90 ± 2.77 MJ/kg).
Low-Impact Group: Dry pasta and Instant Pasta—Bag show marked reductions in these categories, recording CC values of 1.91 ± 0.08 and 1.72 ± 0.08 kg CO2e/kg, and RUF demands of 26.50 ± 0.90 and 23.50 ± 0.77 MJ/kg, respectively.

3.4.2. Eutrophication, Acidification, and Atmospheric Impacts

Instant Pasta—Cup records the highest impacts in Freshwater Eutrophication (1.22 × 10⁻³ kg Pe/kg), Marine Eutrophication (7.60 × 10⁻³ kg Ne/kg), Terrestrial Eutrophication (4.73 × 10⁻² mol Ne/kg), and Freshwater Ecotoxicity (18.2 CTUe/kg).
Fresh pasta exhibits notable Non-Cancer (4.45 × 10⁻⁸ CTUh/kg) and Cancer Human Toxicity (1.56 × 10⁻⁹ CTUh/kg).
Acidification and Photochemical Ozone Formation peak in Instant Pasta—Cup (1.82 × 10⁻² mol H+e/kg and 1.40 × 10⁻² kg NMVOCe/kg) and fresh pasta (1.61 × 10⁻² mol H+e/kg and 1.30 × 10⁻² kg NMVOCe/kg), while Particulate Matter emissions are highest in Instant Pasta—Cup (2.24 × 10⁻⁷ disease inc./kg) and Ozone Depletion peaks in fresh pasta (1.16 × 10⁻⁷ kg CFC11e/kg).

3.4.3. Resource and Land/Water Scarcity

Instant Pasta—Cup exerts the strongest pressure on Land Use (235.0 Pt/kg), while fresh pasta dominates Water Use (2.54 m3 depriv./kg) and Resource Use, Minerals and Metals (2.99 × 10⁻⁵ kg Sbe/kg).

3.5. Single Scores

Table 5 outlines the normalized and weighted PEF single scores (ICNWj) expressed in μPt/kg, along with the percentage contribution of each category to the total environmental impact.
Minor differences between the deterministic totals in Table 3 and the stochastic means in Table 5 result from the propagation of non-linear probability distributions through the 2000 Monte Carlo iterations.
The aggregated single scores reveal a distinct environmental hierarchy among the evaluated variants. Instant pasta in a cup registered the highest overall burden (374.2 ± 15.7 μPt/kg), closely followed by fresh pasta (364.5 ± 13.2 μPt/kg). In contrast, dry pasta (166.1 ± 5.4 μPt/kg) and instant pasta in a bag (164.4 ± 4.6 μPt/kg) demonstrated significantly lower overall impacts.
Across all four pasta configurations, two impact categories act as the dominant universal drivers:
-
Climate Change: Represents the single primary contributor (Rank 1) for every format, accounting for 28.7% to 32.1% of total impacts (48.0 to 115.5 μPt/kg).
-
Resource Use, Fossils: Is the second-rank contributor for every format, accounting for 18.3% to 21.5% of total impacts (30.0 to 78.3 μPt/kg).
Together, CC and RUF account for over half of the cumulative PEF score for every variant.
The remaining contributions vary by configuration.
Instant Pasta—Cup has relatively high contributions from Particulate Matter (9.0%, 33.7 μPt/kg), Land Use (6.1%, 22.8 μPt/kg), and Freshwater Eutrophication (5.7%, 21.3 μPt/kg). Instant Pasta—Bag has Land Use as its second major non-fossil contributor (10.4%, 17.1 μPt/kg). Fresh pasta has elevated Resource Use, Minerals and Metals (9.7%, 35.5 μPt/kg) and Water Use (5.2%, 18.9 μPt/kg), while dry pasta has a comparatively distributed impact profile.

3.6. Uncertainty Analysis and Stochastic Evaluation

The deterministic evaluation of life cycle inventories provides an incomplete basis for decision-making due to inherent parameter variability across supply chains. To rigorously test whether observed differences between pasta formats reflect structural environmental performance rather than random background noise, a Monte Carlo simulation (2000 iterations) was conducted. In life cycle assessment (LCA), stochastic modeling through Monte Carlo analysis serves a fundamental role in confirming whether environmental trade-offs are statistically meaningful. Rather than relying on static point estimates, the simulation propagation establishes joint probability distributions for each impact category. This allows for a robust probabilistic comparison across life cycle stages, confirming whether the mean performance differences between baseline dry pasta (System A) and alternative formats (Systems B, C, and D) hold at a 95% confidence level under joint parameter variance. Within this framework, the numerical stability of the stochastic results relies on three basic statistical properties:
-
Sample Size (n): The total number of independent random sampling iterations (n = 2000) performed across the parameter probability distributions.
-
Standard Deviation (SD): A metric reflecting the total spread or variability of the calculated environmental impact scores around the mean across all iterations.
-
Standard Error of the Mean (SEM): Defined mathematically as S E M = S D / n . This metric quantifies the precision with which the true population mean is estimated. Numerical convergence across all indicators was confirmed when the SEM for the cumulative Product Environmental Footprint (PEF) score fell below 0.5% of the mean, ensuring that sampling error does not distort the comparative findings.
Table 6 compares the cradle-to-grave normalized and weighted environmental profiles (ICNWj) and overall PEF single scores of dry pasta (System A) against fresh pasta (System B), instant pasta in a cup (System C), and instant pasta in a bag (System D) under commercial baseline conditions in Italy.

3.6.1. Discussion of Comparative Dominance Patterns

For dry pasta (A) vs. fresh pasta (B), the stochastic analysis gives P(A ≥ B) = 0% for the aggregate PEF score, with ΔAB = −54%, and an absolute mean difference of −2.0 × 10⁻⁴ Pt/kg. Dry pasta also shows probabilistic dominance over fresh pasta across 15 of the 16 midpoint impact categories. The single exception is Land Use [P(A ≥ B) = 100%, ΔAB = +8%].
For dry pasta (A) vs. Instant Pasta—Cup (C), P(A ≥ C) is 0% for the cumulative PEF score with an overall deficit ΔAC of −56%. Dry pasta also has lower impacts across every single midpoint category.
For dry pasta (A) vs. imported Instant Pasta—Bag (D), the aggregate PEF score displays a negligible percentage difference AD = +1%) with a dominance probability settling near neutrality [P(A ≥ D) = 60.5%], indicating that the cumulative profiles are environmentally equivalent. At the midpoint level, however, the probability distributions diverge in several categories.
Instant Pasta—Bag (D) has lower values for Climate Change [P(A ≥ D) = 99.2%, ΔAD = +11%], Ozone Depletion [P(A ≥ D) = 100%, ΔAD = +17%], Fossil Resource Use [P(A ≥ D) = 99.8%, ΔAD = +13%], and Minerals/Metals [P(A ≥ D) = 100%, ΔAD = +18%]; while dry pasta has lower values for Particulate Matter (−21%), Acidification (−14%), and Eutrophication (−7% to −13%), and Water Use (−6%). Midpoint indicators such as Ionizing Radiation [P(A ≥ D) = 68.7%] and Human Toxicity [P(A ≥ D) = 25.0–44.2%] exhibit wide standard deviations relative to mean differences, indicating no structural distinction between the two formats under background variability.

3.6.2. Sensitivity Scenario: Domesticated Supply Chain (System E)

A localized Italian Instant Pasta—Bag scenario (System E) was modeled to evaluate the effect of eliminating the long-distance logistics burden associated with System D. The Cup configuration was not subjected to an equivalent localization scenario because its environmental deficit (ΔAC = −56%) relative to dry pasta is primarily associated with packaging rather than transportation.
Localizing the supply chain eliminates long-distance transport liabilities. As reported in Supplementary Material Text S1 (Table S1.19), the Particulate Matter gap contracts [ΔAE = −17%, P(A ≥ E) = 1.05%], Terrestrial Eutrophication narrows [P(A ≥ E) = 6.05%], and Acidification aligns [ΔAE = −3%, P(A ≥ E) = 17.1%]. With long-range transport penalties removed, the cumulative PEF single score shifts in favor of localized Instant Bag (157.7 ± 5.8 μPt/kg) over dry pasta (166.1 ± 5.4 μPt/kg, ΔAE = +5%). The stochastic simulation yields an overall single-score probability of P(A ≥ E) = 89.6%, confirming that the localized bag format is more eco-efficient than traditional dry pasta across nearly 90 % of simulated iterations.

3.7. Portion-Scale Conversion via Isocaloric Dry Matter Baseline

To evaluate the dietary implications of pasta selection, cradle-to-grave environmental profiles originally modeled on a standard mass basis (1 kg of commercial product) were scaled to an Isocaloric Functional Unit. This standardizes metrics based on an equivalent intake of nutrient density, defined as 70 g of strict dry matter, derived from standard Mediterranean diet guidelines for carbohydrate servings [69]. Because each format possesses a distinct moisture content (xW), the raw mass required to deliver a 70 g dry-matter serving varies significantly across the evaluated systems:
System A (Dry Pasta—DP): At 12.5% (w/w) moisture, one portion requires 80.0 g of raw product.
System B (Fresh Pasta—FRP): At 28.0% (w/w) moisture, a single serving demands 97.22 g of raw product.
Systems C, D, and E (Instant Pasta—IP Variants): Pre-dehydrated down to 7.0% (w/w) moisture, one portion corresponds to 75.27 g of raw product.
At this portion scale, environmental performance is governed by a structural trade-off between embedded supply chain burdens, logistical storage requirements, and domestic preparation conditions.
As detailed in Table S1.20, domestic preparation highlights a stark contrast between kitchen stovetop energy expenditures and logistical storage burdens. Systems C–E exhibit the lowest cooking energy load (67.7 Wh per portion) with zero home refrigeration demand. However, its rapid-rehydration properties generate a concentrated, starch-saturated broth (262–289 mL per serving) discarded as municipal sink effluent. Conversely, traditional boiling for Systems A and B generates larger wastewater volumes (680.0 mL and 826.4 mL per serving, respectively, assuming 8.5 L post-cooking residual water per kg of raw pasta). While these larger volumes dilute starch concentrations, they impose a higher volumetric greywater footprint.
System B represents the most energy-intensive lifecycle path, demanding 685 Wh per serving post-factory. This footprint is dominated by 486 Wh consumed during obligatory retail and residential refrigeration. This performance gap between ambient, shelf-stable formats (Systems A, C, D, and E) and chilled variants (System B) is further exacerbated by domestic waste rates (Table S1.13). The short shelf-life of fresh pasta (1–4 months) leads to a 10–12% household spoilage rate, whereas shelf-stable dry pasta (24–36 months; 2–3% waste) and instant pasta (12–18 months; ~2% waste) are largely insulated from spoilage. For fresh pasta, this waste modifier amplifies upstream agricultural burdens, packaging demands, and cold-chain energy requirements.
To ensure complete analytical consistency, all four principal baseline systems (Systems A–D), along with the localized sensitivity scenario (System E), were integrated with raw mass scaling, process variances, distribution logistics, and domestic preparation loads. This yields the following cradle-to-grave PEF scores per 70 g dry-matter portion:
System A (Dry Pasta): 166.1 [μPt/kg] × 0.080 [kg] = 13.29 μPt/portion.
System B (Fresh Pasta): 364.5 [μPt/kg] × 0.09722 [kg] = 35.44 μPt/portion.
System C (Instant Pasta—Cup): 374.2 [μPt/kg] × 0.07527 kg = 28.17 μPt/portion.
System D (Instant Pasta—Bag): 164.4 mPt/kg × 0.07527 kg = 12.37 μPt/portion.
System E (Made-in-Italy Instant Pasta—Bag): 157.7 [μPt/kg] × 0.07527 kg = 11.87 μPt/portion.
The localized Instant Pasta—Bag therefore shows a 10.7% lower PEF score than dry pasta at the portion level, corresponding to a difference of 1.42 μPt/portion. The reported preparation-energy values are 67.7 Wh for the instant pasta formats and 192.0 Wh for dry pasta.

4. Discussion

4.1. From Product Comparison to Product–Service–System Design

The results show that the environmental performance of pasta is determined not by processing intensity alone but by the interaction among industrial transformation, packaging architecture, logistics, storage requirements, and consumer preparation.
This is the central distinction between a conventional product-oriented interpretation and a product–service–system perspective. A product that requires more industrial processing can nevertheless exhibit a lower cradle-to-grave burden if that processing substantially reduces a more consequential downstream requirement. Conversely, reducing factory energy demand does not necessarily improve total environmental performance if the resulting product requires refrigeration, materially intensive packaging, or energy-intensive preparation at home.
The four configurations provide a particularly clear demonstration of this interaction. Fresh pasta has a relatively low direct factory energy demand, but this advantage is accompanied by refrigeration requirements and a substantially greater use-phase burden. Instant Pasta–Cup substantially reduces the consumer preparation requirement, but the environmental benefit is offset by the material intensity of its rigid packaging. Dry pasta avoids both cold-chain requirements and rigid packaging penalties but retains a comparatively high household cooking burden. Instant Pasta—Bag combines rapid preparation with ambient stability and lower packaging mass.
The resulting environmental hierarchy should therefore be interpreted as a system-design outcome rather than as a simple ranking of processing technologies.

4.2. Packaging Architecture as the Critical Eco-Design Lever

The most consequential difference between the two instant configurations is packaging architecture.
The rigid Cup configuration carries a packaging-to-product mass of approximately 1016.2 g/kg, compared with 279.8 g/kg for the Bag configuration. This represents a 72.5% reduction in packaging mass when moving from the rigid to the flexible format. The deterministic contribution analysis further shows that packaging materials account for 59.3% of the Cup’s total PEF score but only 22.4% of the Bag’s (Table 3).
This contrast is important because the two formats retain essentially the same functional advantage during consumer preparation. The difference in environmental performance is therefore not principally attributable to convenience but to how convenience is packaged.
The Cup demonstrates a case in which additional packaging functionality becomes environmentally disproportionate to the service delivered. The rigid PP container, aluminum-laminate lid, and paper/cardboard components introduce material-production and transport burdens that are sufficiently large to dominate the environmental profile.
The Bag provides a different design pathway. By retaining rapid rehydration while substantially reducing packaging mass, the format allows the use-phase advantage of instant preparation to remain visible at the cradle-to-grave level.
This suggests that packaging should be treated as an upstream product-design variable rather than as a secondary downstream decision. For convenience foods, packaging determines not only material consumption but also transport density, storage requirements, and the extent to which the environmental benefit of processing innovations survives across the complete life cycle.

4.3. Consumer Preparation as an Embedded Product Characteristic

The results also indicate that consumer preparation should not be treated as an external stage independent of product development.
Instant pasta requires greater industrial thermal input than dry pasta because starch gelatinization and protein coagulation are deliberately advanced during manufacturing. The process requires approximately 0.326 kWh/kg, compared with approximately 0.238 kWh/kg for dry pasta.
The purpose of this additional industrial energy input is functional: it reduces the energy required during domestic preparation. Instant pasta can be rehydrated using approximately 5 L/kg of water without continuous active boiling, whereas conventional dry pasta requires approximately 10 L/kg and prolonged stovetop heating. The modeled domestic energy requirements are approximately 0.90 kWh/kg for instant pasta and 2.40 kWh/kg for dry pasta.
The stochastic comparison supports the importance of this energy transfer. Relative to dry pasta, Instant Pasta—Bag shows probabilistic advantages in Climate Change, Fossil Resource Use, Ozone Depletion, and Minerals/Metals, despite its higher industrial processing requirement.
The implication is not that industrial pre-cooking is intrinsically sustainable. Rather, industrial energy expenditure becomes environmentally advantageous when it replaces a larger and more persistent consumer-side energy requirement without introducing compensating burdens elsewhere in the system.

4.4. Why Logistics Distance Does Not Automatically Determine Environmental Preference

One of the more counter-intuitive results concerns the relationship between transport distance and overall environmental performance.
Imported Instant Pasta—Bag involves substantial long-distance transportation, yet its cradle-to-grave Climate Change impact remains below that of fresh pasta and close to that of dry pasta.
This result does not imply that transport distance is environmentally insignificant. The stochastic comparison demonstrates that imported Instant Pasta—Bag performs worse than dry pasta in several regionally sensitive categories, including Particulate Matter, Acidification, Eutrophication, and Water Use. Rather, the result demonstrates that transport distance cannot be interpreted independently of the physical characteristics of the product being transported. Maritime freight is relatively efficient per unit of transported mass, while rigid packaging increases tare weight and reduces volumetric efficiency. Refrigerated distribution, meanwhile, adds an infrastructure and energy requirement that can be more consequential than geographical distance alone.
The appropriate comparison is therefore between complete logistics systems rather than between kilometers traveled.

4.5. The Importance of Cold-Chain Avoidance

Fresh pasta provides the clearest example of the consequences of separating manufacturing efficiency from total lifecycle performance.
Its direct factory energy requirement is lower than that of dry and instant pasta. However, the high moisture content of fresh pasta requires refrigerated storage and distribution. The use phase consequently accounts for 63.0% of its deterministic PEF score, compared with 32.3% for dry pasta and 11.4% for Instant Pasta—Bag (Table 2).
The portion-scale analysis reinforces this distinction.
Fresh pasta requires 685 Wh per portion in the modeled post-factory system, including 486 Wh associated with retail and residential refrigeration. Thus, the lower industrial processing energy of fresh pasta does not translate into a lower life-cycle impact. The environmental burden is effectively transferred downstream into refrigeration, preparation, and associated infrastructure.
This reinforces the importance of evaluating shelf stability as an environmental design attribute. A product requiring little factory energy can still be environmentally intensive if its physical characteristics impose continuous temperature control throughout distribution and storage.

4.6. Imported vs. Localized Instant Pasta—Bag: The Role of Supply Chain Optimization

The comparison between Systems D and E provides further insight into the interaction between packaging and logistics.
The imported Instant Pasta—Bag configuration is approximately equivalent to dry pasta at the aggregate PEF level, with ΔAD = +1% and P(A ≥ D) = 60.5%. However, the localization of the same functional format within the Italian market reduces its cumulative PEF score to 157.7 ± 5.8 μPt/kg and increases the probability that it outperforms dry pasta to 89.6%.
The result is important because it distinguishes packaging optimization from logistics optimization.
The Cup format remains environmentally disadvantaged even when transport is not the principal source of its burden because its packaging architecture itself dominates the environmental profile. By contrast, once the lightweight Bag configuration is established, additional environmental improvement can be obtained through supply chain localization.
The sequence therefore matters: first, reduce the structural packaging penalty; then, optimize the logistics system. This is more effective than attempting to compensate for a highly material-intensive package through transport optimization alone.

4.7. From Comparative LCA to a Convenience-Food Eco-Design Strategy

The combined results suggest three interconnected eco-design principles.
First, convenience should be designed as a service rather than equated with packaging intensity. The environmental advantage of rapid preparation can be retained without the large material burden associated with rigid single-serving containers.
Second, cooking energy should be considered during product formulation and process design. Industrial pre-gelatinization is justified environmentally only when the additional factory burden is smaller than the use-phase energy that it displaces.
Third, ambient stability provides an important system-level advantage. Avoiding refrigeration reduces not only transport energy but also the associated infrastructure and storage requirements.
These principles point toward a broader design criterion: the objective should be to minimize the total energy and material requirements necessary to deliver a given preparation service rather than minimizing energy or material use at any individual stage.
The localized Instant Pasta—Bag scenario illustrates the potential of this approach. At the portion level, its PEF score is 11.87 μPt/portion compared with 13.29 μPt/portion for dry pasta and 35.44 μPt/portion for fresh pasta.
Nevertheless, this result should be understood as a modeled eco-design scenario rather than evidence that instant pasta is universally preferable. The environmental advantage depends on maintaining the low-mass packaging configuration, ambient stability, efficient industrial processing, and low-energy preparation conditions represented in the model.

4.8. Implications for Industrial Practice

The findings have direct implications for the development of next-generation convenience pasta products.
Packaging optimization should be prioritized. Lightweight flexible structures with adequate barrier properties offer the most direct opportunity to prevent packaging from overwhelming the benefits of rapid preparation.
Industrial processing should be optimized for functional energy transfer. The objective should not simply be to minimize factory energy demand, but to identify processing conditions that reduce total cradle-to-grave energy requirements.
Cold-chain dependence should be minimized where product quality and safety permit. Shelf-stable formats can eliminate a substantial downstream infrastructure requirement.
Logistics should be optimized after packaging architecture has been addressed. Increasing pallet utilization, reducing tare mass, and localizing supply chains can further improve an already efficient packaging configuration.
Finally, consumer preparation should be integrated into product development. Dedicated eco-sustainable cooking systems have been reported to reduce the water-to-pasta ratio from approximately 10 L/kg to 2–4 L/kg [24,70,71]. However, unlike the coffee sector, where dedicated appliances have become established alongside portioned products [72], an equivalent technological ecosystem for traditional pasta preparation has not yet achieved comparable commercial diffusion. The environmental opportunity therefore extends beyond product reformulation to the co-development of food products and preparation technologies.

4.9. Scope, Applicability, and Study Limitations

The interpretation of these results should remain within the defined geographical, technological, and behavioral boundaries, as outlined below:
Geographic and Supply Chain Scope: The LCI and market scenarios are anchored in the European market context, with Italy as the principal reference. Electricity mixes, distribution radii, waste-treatment infrastructures, and recycling efficiencies therefore reflect European averages and Italian reporting conditions.
Consumer Behavior Assumptions: The use-phase model applies standardized preparation conditions, including 10 L of water/kg for traditional boiling and 5 L of water/kg for passive rehydration. Actual consumer practices—including induction cooking, lids, altered water-to-pasta ratios, and different preparation times—may modify the relative use-phase burdens.
Industrial Modeling Boundaries: Industrial mass and energy balances are based on thermodynamic baseline models and the manufacturing configurations adopted in this study. Variations in plant efficiency, heat recovery, process integration, and emerging continuous technologies could therefore modify the reported energy profiles.
Product Formulation: This study is restricted to single-ingredient matrices composed exclusively of durum wheat semolina and water. The results should not be directly extrapolated to soft-wheat instant noodles, egg-containing formulations, or deep-fried products.
Prospective nature of the Instant Pasta—Bag Configuration: The Bag configuration represents a prospective eco-design alternative modeled using baseline manufacturing and logistics assumptions. Commercial implementation would require further validation of consumer acceptance, barrier performance, mechanical integrity, shelf life, and distribution performance.

5. Conclusions and Recommendations

This study evaluated the cradle-to-grave Product Environmental Footprint (PEF) of four durum wheat semolina pasta delivery systems using Monte Carlo stochastic simulations to account for parameter uncertainty. The probabilistic assessment demonstrates that overall life cycle performance is governed by trade-offs among processing, packaging architecture, cold-chain logistics, and domestic preparation energy. Specifically, the evaluation revealed the following:
Fresh pasta (System B) incurs the highest cumulative impact, with a PEF score of 364.5 ± 13.2 μPt/kg and a Climate Change impact of 4.14 ± 0.17 kg CO2e/kg, owing to continuous cold-chain requirements that outweigh its shorter cooking time.
Instant pasta in rigid cups (IP-Cup, System C) shows a similarly high impact (374.2 ± 15.7 μPt/kg), primarily because material-intensive packaging accounts for nearly 60% of its overall footprint.
Traditional dry pasta (System A), with a PEF score of 166.1 ± 5.4 μPt/kg, is limited by high use-phase energy demands during prolonged stovetop boiling.
Instant pasta in flexible pouches (IP-Bag, System D) achieved the lowest overall environmental footprint (164.41 ± 4.6 μPt/kg) by replacing household boiling energy with efficient factory pre-gelatinization and pairing ambient stability with low packaging mass.
Although the flexible pouch format shifts the energy burden from household stovetop boiling to efficient industrial pre-gelatinization while remaining ambiently stable, probabilistic analysis shows overlapping confidence intervals rather than absolute dominance over dry pasta P(A ≥ D) = 60.5%]. Localizing the supply chain for flexible pouches improves the mean PEF score to 157.7 ± 5.8 μPt/kg [P(A ≥ E) = 89.6%), reinforcing its potential advantages without exceeding the traditional 95% threshold for strict statistical superiority.
These findings confirm that in the absence of specialized, energy-efficient household pasta-cooking appliances, pre-cooked flexible-pouch systems represent a highly promising prospective strategy for reducing the environmental burden of pasta consumption, provided that long-term shelf-life barrier integrity and consumer market uptake are successfully validated.
The principal eco-design insight centers on packaging architecture: transitioning from rigid cups to lightweight flexible pouches reduces packaging mass by 72.5%, preventing heavy packaging loads from negating the energy benefits gained during domestic preparation. Convenience and sustainability remain compatible as long as reduced consumer preparation energy is paired with optimized material intensity and ambient shelf stability.
Industry stakeholders should focus on lightweight high-barrier flexible packaging, localized sourcing, optimized pallet distribution, and promoting low-impact home cooking methods such as passive boiling.
Future research should expand this framework to alternative grain formulations, novel bio-based barrier films, regional energy grid variations, and emerging cooking appliances.

Supplementary Materials

The following supporting information can be downloaded at: https://www.mdpi.com/article/10.3390/su18178712/s1. Supplementary Material Text S1: Figure S1.1: Flowchart of the packaging process for the diverse durum wheat semolina pasta variants; Figure S1.2: Network-based Sankey diagrams (1% cut-off) mapping the environmental footprint of 1 kg of the studied pasta variants; Table S1.1: Agricultural and processing inventory data for durum wheat semolina production; Table S1.2: Operating parameters, mass losses, and specific utility demands for shared industrial processing operations; Table S1.3: Primary, secondary, and tertiary packaging dimensions and mass breakdowns across all formats; Table S1.4: Industrial percentage loss factors for products, packaging materials, and MAP gases; Table S1.5: Material balance of the dry pasta packaging process (referred to 1000 kg/h of semolina); Table S1.6: Material balance of the fresh pasta packaging process (referred to 1000 kg/h of semolina); Table S1.7: Material balance of the instant pasta in cup packaging process (referred to 1000 kg/h of semolina); Table S1.8: Material balance of the instant pasta in bag packaging process (referred to 1000 kg/h of semolina); Table S1.9: Process modeling parameters, utility inputs, scrap factors, and background dataset proxies for packaging transformations; Table S1.10: Supply chain vehicle fleet types, load capacities, and transport distances; Table S1.11: Delivery parameters, Cargo Multiplication Factors, and reverse logistics requirements for liquid N2 and CO2; Table S1.12: Total energy consumption per kg of cooked product; Table S1.13: End-of-life management parameters for diverse pasta variants’ waste and scraps; Table S1.14: Waste management treatment scenarios in Italy in 2022; Table S1.15: Detailed logistics and transportation analysis for the four pasta variants; Table S1.16: Pedigree matrix scoring for empirical commercial formats; Table S1.17: Pedigree matrix scoring for hypothetical instant pasta in bags; Table S1.18: Uncertainty analysis; Table S1.19: Comparison of the environmental normalized/weighted profiles and overall PEF scores between dry pasta and instant pasta in a bag; Table S1.20: Pasta format domestic storage, cooking, and post-consumer waste profiles. Supplementary Material Text S2: Table S2.1: Summary of the process scenarios, product stage taxonomy, and life cycle networks of pasta systems; Table S2.2: Inventory associated with durum wheat grain production; Table S2.3: Inventory associated with durum wheat semolina production; Table S2.4: Inventory associated with dry pasta processing and packaging; Table S2.5. Inventory associated with dry pasta consumer use phase; Table S2.6: Inventory associated with PP bag production for dry pasta; Table S2.7: Inventory associated with secondary carton production; Table S2.8: Inventory associated with paper label production; Table S2.9: Inventory associated with scotch tape production; Table S2.10: Inventory associated with wooden EPAL pallet production; Table S2.11: Inventory associated with shrink PE film production; Table S2.12: Assembly of primary packaging for dry pasta; Table S2.13: Assembly of secondary packaging for dry pasta; Table S2.14: Assembly of tertiary packaging for dry pasta; Table S2.15: Assembly of primary and secondary packaging for dry pasta; Table S2.16: Assembly of primary, secondary, and tertiary packaging for dry pasta; Table S2.17: End-of-life and waste treatment of dry pasta packaging systems; Table S2.18: End of life of tertiary packaging for dry pasta; Table S2.19: Life cycle of dry pasta; Table S2.20: Life cycle of primary, secondary, and tertiary packaging for dry pasta; Table S2.21: Life cycle of wooden pallet for dry pasta; Table S2.22: Inventory associated with fresh pasta processing and packaging; Table S2.23: Inventory associated with fresh pasta consumer use phase; Table S2.24: Inventory associated with PE/PA/PU bag production for fresh pasta; Table S2.25: Assembly of primary packaging for fresh pasta; Table S2.26: Assembly of secondary packaging for fresh pasta; Table S2.27: Assembly of tertiary packaging for fresh pasta; Table S2.28: Assembly of primary and secondary packaging for fresh pasta; Table S2.29: Assembly of primary, secondary, and tertiary packaging for fresh pasta; Table S2.30: End-of-life and waste treatment of fresh pasta packaging systems; Table S2.31: End of life of tertiary packaging for fresh pasta; Table S2.32: Life cycle of fresh pasta; Table S2.33: Life cycle of primary, secondary, and tertiary packaging for fresh pasta; Table S2.34: Life cycle of wooden pallet for fresh pasta; Table S2.35: Inventory associated with instant pasta processing and packaging; Table S2.36: Inventory associated with instant pasta consumer use phase; Table S2.37: Inventory associated with PP cup production for instant pasta; Table S2.38: Inventory associated with Al lid production for instant pasta; Table S2.39: Inventory associated with pressed cardboard layer pad production for instant pasta; Table S2.40: Inventory associated with pressed cardboard edge protector production for instant pasta; Table S2.41: Assembly of instant pasta in cup; Table S2.42: Assembly of primary packaging for instant pasta in cup; Table S2.43: Assembly of secondary packaging for instant pasta in cup; Table S2.44: Assembly of tertiary packaging for instant pasta in cup; Table S2.45: Assembly of primary and secondary packaging for instant pasta in cup; Table S2.46: Assembly of primary, secondary, and tertiary packaging for instant pasta in cup; Table S2.47: End-of-life and waste treatment of instant pasta (cup) packaging systems; Table S2.48: End of life of tertiary packaging for instant pasta in cup; Table S2.49: Life cycle of instant pasta in cup; Table S2.50: Life cycle of primary, secondary, and tertiary packaging for instant pasta in cup; Table S2.51: Life cycle of wooden pallet for instant pasta in cup; Table S2.52: Assembly of instant pasta in bag; Table S2.53: Assembly of primary packaging for instant pasta in bag; Table S2.54: Assembly of secondary packaging for instant pasta in bag; Table S2.55: Assembly of tertiary packaging for instant pasta in bag; Table S2.56: Assembly of primary and secondary packaging for instant pasta in bag; Table S2.57: Assembly of primary, secondary and tertiary packaging for instant pasta in bag; Table S2.58: End-of-life and waste treatment of instant pasta (bag) packaging systems; Table S2.59: End of life of tertiary packaging for instant pasta in bag; Table S2.60: Life cycle of instant pasta in bag; Table S2.61: Life cycle of primary, secondary, and tertiary packaging for instant pasta in bag; Table S2.62: Life cycle of wooden pallet for instant pasta in bag; Table S2.63: Life cycle of Made-in-Italy instant pasta in bag.

Funding

This research was carried out as part of the INTEGRI project (ARS01_00188), funded by the Italian Ministry of Education, Universities, and Research (MIUR).

Institutional Review Board Statement

Not applicable.

Informed Consent Statement

Not applicable.

Data Availability Statement

The original contributions presented in this study are included in the Supplementary Materials. Further inquiries can be directed to the corresponding author.

Conflicts of Interest

The author declares no conflicts of interest.

Nomenclature

ACAcidification [mol H+e]
ALAluminum lids [kg/h]
ANGPressed cardboard edge protectors [kg/h]
aWWater activity
BDPBagged dried pasta [kg/h]
BFRPBagged fresh pasta [kg/h]
CACardboard cartons [kg]
CAGRCompound annual growth rate [%]
CAIPCartoned Instant Pasta [kg/h]
CCClimate Change [kg CO2e]
CDPCartoned Dry Pasta [kg/h]
CFC11Trichlorofluoromethane.
CFRPCartoned fresh pasta [kg/h]
CHConsumer household
C-HTHuman toxicity, carcinogenic [CTUh]
CIPCleaning-in-place
CMFCargo multiplication factor [kg/kg]
CO2ECarbon dioxide emissions [kg]
CO2eCarbon dioxide equivalent
CO2LLiquid carbon dioxide
CoiGeneric i-th completeness
CTUeComparative toxic unit, ecotoxicity
CTUhComparative toxic unit, human health
CUIPInstant pasta in cups [kg/h]
DDough
DCDistribution center
DMDry matter
DPDry pasta
DQIData quality indicator
DQROverall data quality rating
DQRiGeneric i-th data quality rating indicator
DWDough waste [kg/h]
DWSDurum wheat semolina [kg/h]
ECCarton labels [kg/h]
EEElectrical energy
EFPExtruded fresh pasta [kg/h]
EoLEnd of life
EPPallet labels [kg/h]
EPALEuropean Pallet Association
EPDEnvironmental Product Declaration
EPMCEuro pallet managing center
ESBag/cup labels [kg/h]
ESOEthanol solution (Preservative) [kg/h]
EWEvaporated water rate [kg/h]
FGFactory gate
FPShrink film for pallets [kg/h]
FRPFresh pasta [kg/h]
FUFunctional unit
FWEFresh water eutrophication [kg Pe]
FWETFreshwater ecotoxicity [CTUe]
GeRGeographical representativeness
GHGGreenhouse gas
GP Gelatinized product [kg/h]
GWPGlobal warming potential [kg CO2e/kg]
HACCPHazard analysis critical control point
HDPEHigh-density polyethylene
ICjGeneric j-th impact category
ICNWjWeighted-normalized impact category j
IFCardboard layer pads [kg/h]
IPInstant pasta [kg/h]
IPCCIntergovernmental Panel on Climate Change
IRIonizing radiation—human health [kBq 235Ue]
LCALifecycle assessment
LCILifecycle inventory
LDPELow-density polyethylene
LULand use [Pt]
MAPModified atmosphere packaging
MCAMonte Carlo analysis
MEMarine eutrophication [kg Ne]
MeanJMean impact score of System J
MGasMAP gases consumption [kg]
MVMedium voltage
nSample size
N2LLiquid nitrogen
NC-HTHuman Toxicity, non-carcinogenic [CTUh]
NENitrogen emissions
NMVOCNon-methane volatile organic compounds
OCTOptimal cooking time [min]
ODStratospheric ozone depletion [kg CFC11e]
P(A ≥ B)Monte Carlo probability (A ≥ B impact frequency)
PAPolyamide
PALWooden pallet [kg/h]
PASPublicly available specification
PCRProduct category rules
PDPPalletized dry pasta LCIA [kg/h]
PEPolyethylene
PEB Bags for fresh pasta [kg]
PEFProduct Environmental Footprint single score [Pt]
PFGPackaging factory gate
PFPPalletized final product
PFRCCartoned fresh pasta
PFRPPalletized fresh pasta [kg/h]
PFSPackaged fresh pasta [kg/h]
PhOFPhotochemical ozone formation [kg NMVOCe]
PIBPackaged instant pasta (Bags) [kg]
PIBCACartoned instant pasta [kg]
PIBPPalletized final product [kg]
PICACartoned instant pasta [kg]
PICUPackaged instant pasta (Cups) [kg]
PIPPalletized instant pasta [kg]
PMParticulate matter [disease incidence]
PoS Point of sale
PPPolypropylene
PPB PP bags [kg]
PPCPP cups [kg]
PPRPasteurized fresh pasta [kg/h]
PS Production site
PUiGeneric i-th parameter uncertainty
PURPolyurethane
RALAluminum waste [kg/h]
RCCPaper and cardboard waste [kg/h]
RiGeneric i-th reliability
RLWood waste [kg/h]
RlogBinary reverse-logistics operator
RMRaw material
RMSRoot mean square method
RORGOrganic waste [kg/h]
RPLPlastic waste [kg/h]
RUFResource use—fossils [MJ]
RUMMResource use, minerals and metals [kg Sbe]
SALScrapped aluminum lids [kg/h]
SANGScrapped edge protectors [kg/h]
SAsiaInstant pasta East-Asian market share [%]
SCScotch tape [kg/h]
SCAScrapped cardboard [kg/h]
SDStandard deviation
SDPScrapped dry pasta [kg/h]
SDPA Surface-dried Pasta [kg/h]
SDRPSurface-dried pasta [kg/h]
SECScrapped carton labels [kg/h]
SEMStandard error of the mean
SEPScrapped pallet labels [kg/h]
SESScrapped bag/cup labels [kg]
SEuropeInstant pasta European market share [%]
SFPScrapped PE film [kg/h]
SFRPScrapped fresh pasta [kg/h]
SIFScrapped layer pads [kg/h]
SIPScrapped instant pasta [kg/h]
SPALScrapped pallets [kg/h]
SPEBScrapped PE bags [kg/h]
SPPScrapped primary packaging [kg/h]
SPPBScrapped PP bags [kg/h]
SPPCScrapped PP cups [kg/h]
SSCScrapped scotch tape [kg/h]
TDDelivery distance of MAP gases [km]
TETerrestrial eutrophication [mol Ne]
TeRiGeneric i-th technical representativeness
ThEThermal energy
TiRiGeneric i-th temporal representativeness
uiStandard uncertainty per life cycle step
uTOverall standard uncertainty
VATEvaporated water from fresh pasta pre-drying [kg/h]
VEEvaporated water [kg/h]
VITTrabatto evaporated water [kg/h]
VSATSaturated steam [kg/h]
VSURSuperheated steam [kg/h]
VTExtrusion flashed vapor [kg/h]
WProcess water [kg/h]
WCCWaste collection center
WForForward transport workload [Mg km]
WGasOverall transport workload [Mg km]
WPRWater-to-pasta ratio [L/kg]
WRetReturn transport workload [Mg km]
WUWater scarcity [m3 depriv.]
xWMoisture content [g/g]
αcoagGluten coagulation degree [%]
αgelStarch gelatinization degree [%]
ΔMean environmental impact difference [%]
ΔHcoagGluten coagulation enthalpy [kJ/kg]
ΔHgelStarch gelatinization enthalpy [kJ/kg]
σgiGeneric i-th geometric standard deviation

References

  1. DPR (Decreto del Presidente della Repubblica) 9 Febbraio 2001, n. 187—Regolamento per la Revisione Della Normativa Sulla Produzione e Commercializzazione di Sfarinati e Paste Alimentari. 2001. Available online: https://www.normattiva.it/uri-res/N2Ls?urn:nir:presidente.repubblica:decreto:2001;187 (accessed on 6 May 2026).
  2. Fava-Storci. Instant Pasta Plant. Available online: https://www.favastorci.com/fava_storci_page.asp?pid=25&lang=IT (accessed on 6 May 2026).
  3. Hatcher, D.W. Asian noodle processing. In Cereals processing Technology; Owens, G., Ed.; Woodhead Publishing Ltd.: Cambridge, UK, 2001; pp. 131–157. [Google Scholar]
  4. Fu, B.X. Asian noodles: History, classification, raw materials, and processing. Food Res. Int. 2008, 41, 888–902. [Google Scholar] [CrossRef] [Scilit]
  5. Gulia, N.; Dhaka, V.; Khatkar, B.S. Instant Noodles: Processing, Quality and Nutritional Aspects. Crit. Rev. Food Sci. Nutr. 2013, 54, 1386–1399. [Google Scholar] [CrossRef] [Scilit]
  6. Huh, I.S.; Kim, H.; Jo, H.K.; Lim, C.S.; Kim, J.S.; Kim, S.J.; Kwon, O.; Oh, B.; Chang, N. Instant noodle consumption is associated with cardiometabolic risk factors among college students in Seoul. Nutr. Res. Pract. 2017, 11, 232–239. [Google Scholar] [CrossRef] [Scilit]
  7. Mediobanca. Studio Mediobanca: Italiani i più Grandi Produttori e Mangiatori di Pasta al Mondo (23 kg/anno cad.). 2024. Available online: https://www.beverfood.com/documenti/studio-mediobanca-italiani-i-produttori-e-mangiatori-pasta-23-kg-anno-cad-wd/ (accessed on 7 May 2026).
  8. Mercato Globale. Italia Leader Nell’industria Della Pasta. 2024. Available online: https://mglobale.promositalia.camcom.it/analisi-di-mercato/tutte-le-news/italia-leader-nell-industria-della-pasta.kl (accessed on 7 May 2026).
  9. Mordor Intelligence. Analisi Delle Dimensioni e Della Quota di Mercato Della Pasta—Tendenze di Crescita e Previsioni (2026–2031). 2026. Available online: https://www.mordorintelligence.it/industry-reports/pasta-market (accessed on 7 May 2026).
  10. WINA (World Instant Noodles Association). Global DEemand for Instant Noodles. 2025. Available online: https://instantnoodles.org/en/noodles/demand/table/ (accessed on 7 May 2026).
  11. Mordor Intelligence. Analisi Delle Dimensioni e Della Quota di Mercato dei Noodles Istantanei—Tendenze di Crescita e Previsioni (2026–2031). 2026. Available online: https://www.mordorintelligence.it/industry-reports/instant-noodles-market (accessed on 7 May 2026).
  12. Business Research Insights. Fresh Pasta Market Size, Share, Growth, and Industry Analysis, by Type (Long Style Pasta, Short Style Pasta and Filled Style Pasta), by Application (Residential, Restaurant, and Others), Regional Insights and Forecast from 2026 to 2035. 2026. Available online: https://www.businessresearchinsights.com/market-reports/fresh-pasta-market-108799 (accessed on 7 May 2026).
  13. Cimini, A.; Sestili, F.; Moresi, M. Environmental profile of a novel high-amylose bread wheat fresh pasta with low glycemic index. Foods 2022, 11, 3199. [Google Scholar] [CrossRef] [Scilit]
  14. Cimini, A.; Moresi, M. Fresh versus dry pasta: What is the difference in their environmental impact? Chem. Eng. Trans. 2023, 102, 7–12. [Google Scholar] [CrossRef]
  15. Bevilacqua, M.; Braglia, M.; Carmignani, G.; Zammori, F.A. Life Cycle Assessment of Pasta Production in Italy. J. Food Qual. 2007, 30, 932–952. [Google Scholar] [CrossRef] [Scilit]
  16. Ruini, L.; Ferrari, E.; Meriggi, P.; Marino, M.; Sessa, F. Increasing the Sustainability of Pasta Production through a Life Cycle Assessment Approach. In Advances in Production Management Systems. Sustainable Production and Service Supply Chains (APMS 2013); Prabhu, V., Taisch, M., Kiritsis, D., Eds.; IFIP Advances in Information and Communication Technology; Springer: Berlin/Heidelberg, Germany, 2013; Volume 415. [Google Scholar] [CrossRef] [Scilit]
  17. Cimini, A.; Cibelli, M.; Moresi, M. Cradle-to-grave carbon footprint of dried organic pasta: Assessment and potential mitigation measures. J. Sci. Food Agric. 2019, 99, 5303–5318. [Google Scholar] [CrossRef] [Scilit]
  18. Recchia, L.; Cappelli, A.; Cini, E.; Garbati Pegna, F.; Boncinelli, P. Environmental Sustainability of Pasta Production Chains: An Integrated Approach for Comparing Local and Global Chains. Resources 2019, 8, 56. [Google Scholar] [CrossRef] [Scilit]
  19. Cimini, A.; Cibelli, M.; Moresi, M. Environmental impact of pasta. Chapter 5. In Environmental Impact of Agro-Food Industry and Food Consumption; Galanakis, C., Ed.; Academic Press: San Diego, CA, USA, 2020; pp. 101–127. [Google Scholar] [CrossRef] [Scilit]
  20. Gnielka, A.E.; Menzel, C. The impact of the consumer’s decision on the life cycle assessment of organic pasta. SN Appl. Sci. 2021, 3, 839. [Google Scholar] [CrossRef] [Scilit]
  21. Zingale, S.; Guarnaccia, P.; Timpanaro, G.; Scuderi, A.; Matarazzo, A.; Bacenetti, J.; Ingrao, C. Environmental life cycle assessment for improved management of agri-food companies: The case of organic whole-grain durum wheat pasta in Sicily. Int. J. Life Cycle Assess. 2022, 27, 205–226. [Google Scholar] [CrossRef] [Scilit]
  22. UNAFPA (Unions de Associations de Fabricants de Pâtes Alimentaires). Product Environmental Footprint Category Rules (PEFCR) for Dry Pasta; Version 3.0; Life Cycle Engineering: Turin, Italy, 2018; p. 37. Available online: https://docslib.org/doc/6636089/product-environmental-footprint-category-rules-for-dry-pasta (accessed on 7 May 2026).
  23. Cimini, A.; Moresi, M. Energy efficiency and carbon footprint of home pasta cooking appliances. J. Food Eng. 2017, 204, 8–17. [Google Scholar] [CrossRef] [Scilit]
  24. Cimini, A.; Cibelli, M.; Moresi, M. Development and assessment of a home eco-sustainable pasta cooker. Food Bioprod. Process. 2020, 122, 291–302. [Google Scholar] [CrossRef] [Scilit]
  25. Cimini, A.; Morgante, L.; Moresi, M. Cottura sostenibile della pasta. Tec. Molit. 2024, 75, 31–41. [Google Scholar]
  26. Kim, S.G. Instant noodles. In Pasta and Noodle Technology; Kruger, J.E., Matsuo, R.B., Dick, J.W., Eds.; American Association of Cereal Chemists: St. Paul, MN, USA, 1996; pp. 195–225. [Google Scholar]
  27. Park, C.S.; Baik, B.K. Relationship between protein characteristics and instant noodle making quality of wheat flour. Cereal Chem. 2004, 81, 159–164. [Google Scholar] [CrossRef] [Scilit]
  28. Hou, G.G. Asian Noodle Manufacturing: Ingredients, Processing, and Quality; Wood-head Publishing Series in Food Science, Technology and Nutrition; Woodhead Publishing: Duxford, UK, 2020; pp. 1–25. Available online: https://books.google.it/books/about/Asian_Noodle_Manufacturing.html?id=_HT4DwAAQBAJ&redir_esc=y (accessed on 22 August 2026).
  29. ISO 14040; Environmental Management and Life Cycle Assessment. Principles and Framework. International Organization for Standardization: Geneva, Switzerland, 2006.
  30. ISO 14044; Environmental Management-Life Cycle Assessment-Requirements and Guidelines. International Organization for Standardization: Geneva, Switzerland, 2006.
  31. EPD®. Uncooked Pasta, not Stuffed or Otherwise Prepared. Product Category Classification: UN CPC 2371. PCR 2010:01. Version 4.0.5. Available online: https://www.environdec.com/pcr-library/pcr2010-01 (accessed on 7 May 2026).
  32. PAS 2050:2011; Specification for the Assessment of the Life Cycle Greenhouse Gas Emissions of Goods and Services. British Standards Institution: London, UK, 2011.
  33. Sgambaro SpA. Calcolo Della Carbon Footprint Della Pasta Jolly, Della Pasta Sgambaro Etichetta Gialla e Della Semola Jolly. 2014. Available online: https://sgambaro.it/wp-content/uploads/2016/06/Relazione_Carbon_Footrpint_Sgambaro_2014.pdf (accessed on 8 May 2026).
  34. Sgambaro SpA. Yellow Label Sgambaro Pasta. EPD-IES-0000436:009 (S-P-00436). 2025. Available online: https://www.environdec.com/library/epd436 (accessed on 17 June 2026).
  35. EPD®. Arable and Vegetable Crops. Product Category Classification: UN CPC 011, 012, 014, 017, 0191. PCR 2020:07. Version 1.0.3. Available online: https://www.environdec.com/pcr-library/pcr2020-07 (accessed on 22 June 2026).
  36. Hergoualc’h, K.; Akiyama, H.; Bernoux, M.; Chirinda, N.; del Prado, A.; Kasimir, Å.; Douglas MacDonald, J.; Ogle, S.M.; Regina, K.; van der Weerden, T.J. N2O emissions from managed soils, and CO2 emissions from lime and urea application. In Agriculture, Forestry and Other Land Use: 2019 Refinement to the 2006 IPCC Guidelines for National Greenhouse Gas Inventories; Intergovernmental Panel on Climate Change: Geneva, Switzerland, 2019; Volume 4, Chapter 11; Available online: https://www.ipcc-nggip.iges.or.jp/public/2019rf/pdf/4_Volume4/19R_V4_Ch11_Soils_N2O_CO2.pdf (accessed on 22 June 2026).
  37. Brunetti, L.; Giametta, F.; Catalano, P.; Villani, F.; Fioralba, J.; Fucci, F.; La Fianza, G. Energy consumption and analysis of industrial drying plants for fresh pasta process. J. Agric. Eng. 2015, 46, 164–169. [Google Scholar] [CrossRef] [Scilit]
  38. Abdi, D.; Bekele, A.; Venkatachalam, C.; Parthiban, M. Energy performance analysis of pasta and macaroni factory—A case study. AIMS Energy 2021, 9, 238–256. [Google Scholar] [CrossRef] [Scilit]
  39. Sissons, M.; Abecassis, J.; Marchylo, B.; Carcea, M. Durum Wheat: Chemistry and Technology; AACC International Press: St. Paul, MN, USA, 2012. [Google Scholar]
  40. Donovan, J.W. Phase transitions of starch–water systems. Biopolymers 1979, 18, 263–275. [Google Scholar] [CrossRef] [Scilit]
  41. Ratnayake, W.S.; Jackson, D.S. Starch gelatinization. Adv. Food Nutr. Res. 2009, 55, 221–268. [Google Scholar] [CrossRef] [Scilit]
  42. Schofield, J.D.; Bottomley, R.C.; Timms, M.F.; Booth, M.R. The effect of heat on wheat gluten and the involvement of sulphydryl-disulphide interchange reactions. J. Cereal Sci. 1983, 1, 241–253. [Google Scholar] [CrossRef] [Scilit]
  43. Robertson, G.L. Food Packaging: Principles and Practice, 3rd ed.; CRC Press: Boca Raton, FL, USA, 2016. [Google Scholar] [CrossRef] [Scilit]
  44. Wernet, G.; Bauer, C.; Steubing, B.; Reinhard, J.; Moreno-Ruiz, E.; Weidema, B. The ecoinvent database version 3 (part I): Overview and methodology. Int. J. Life Cycle Assess. 2016, 21, 1218–1230. [Google Scholar] [CrossRef] [Scilit]
  45. European Aluminium. Environmental Profile Report 2024: Executive Summary (V.2.0); European Aluminium Association (EAA): Brussels, Belgium, 2025; Available online: https://european-aluminium.eu/wp-content/uploads/2024/11/2024-11-07-European-Aluminium-EPR-2024-Executive-Summary.pdf (accessed on 8 June 2026).
  46. World Customs Organization (WCO). Harmonized Commodity Description and Coding System, 7th ed.; WCO: Brussels, Belgium, 2022; Available online: https://www.wcoomd.org/en/topics/nomenclature/instrument-and-tools/hs-nomenclature-2022-edition.aspx (accessed on 12 June 2026).
  47. EPD® Food and Beverage Products. PCR 2025:03. Version 1.0.1. Available online: https://www.environdec.com/pcr-library/pcr_fbd3e8c6-483c-48f5-d22f-08da0b49f7f5 (accessed on 16 May 2026).
  48. Barilla. Barilla Food Loss and Waste Report. Barilla Blue Box Pasta 1 kg. 2017. Available online: https://flwprotocol.org/wp-content/uploads/2020/09/Pasta_FLW_5820.pdf (accessed on 16 May 2026).
  49. ISO 7304-1:2025; Durum Wheat Semolina and Alimentary Pasta—Estimation of Cooking Quality of Alimentary Pasta by Sensory Analysis—Part 1: Reference Method. International Organization for Standardization: Geneva, Switzerland, 2025.
  50. Murray, J.C.; Kiszonas, A.M.; Morris, C.F. Influence of soft kernel texture on fresh durum pasta. J. Food Sci. 2018, 83, 2812–2818. [Google Scholar] [CrossRef] [Scilit]
  51. Wójtowicz, A. Influence of some functional components addition on the microstructure of precooked pasta. Pol. J. Food Nutr. Sci. 2005, 55, 417–422. Available online: https://journal.pan.olsztyn.pl/pdf-97904-30434?filename=EVALUATION-OF-THE-NUTRITI.pdf (accessed on 22 August 2026).
  52. Stenmarck, Å.; Jensen, C.M.; Quested, T.; Moates, G. Estimates of European Food Waste Levels; IVL Swedish Environmental Research Institute: Stockholm, Sweden, 2016. [Google Scholar] [CrossRef]
  53. Quested, T.E.; Marsh, E.; Stunell, D.; Parry, A.D. Spaghetti Soup: The Complex World of Food Waste Behaviours; Waste & Resources Action Programme (WRAP): Banbury, UK, 2013; Available online: https://sustainontario.com/greenhouse/resource/spaghetti-soup-the-complex-world-of-food-waste-behaviours/ (accessed on 18 May 2026).
  54. FAO. Global Food Losses and Food Waste—Extent, Causes and Prevention; Food and Agriculture Organization of the United Nations: Rome, Italy, 2011. [Google Scholar]
  55. Williams, H.; Wikström, F. Environmental impact of packaging and food losses in a life cycle perspective: A comparative analysis of five food items. J. Clean. Prod. 2011, 19, 43–48. [Google Scholar] [CrossRef] [Scilit]
  56. Aterini, L. Rifiuti Organici, Oltre il 70% Degli Impianti Italiani di Gestione Lavora in Perdita Economica. 2025. Available online: https://www.greenreport.it/news/green-economy/4711-rifiuti-organici-oltre-il-70-degli-impianti-italiani-di-gestione-lavora-in-perdita-economica (accessed on 18 May 2026).
  57. ISPRA. Tasso di Riciclaggio dei Rifiuti Urbani Organici. 2025. Available online: https://indicatoriambientali.isprambiente.it/it/rifiuti/tasso-di-riciclaggio-dei-rifiuti-urbani-organici (accessed on 18 May 2026).
  58. Evangelista, R.; Mariotta, C.; Ricciardi, F.; Tuscano, J. Imballaggi e rifiuti di imballaggio. Chapter 4. In Rapporto Rifiuti Urbani. Edizione 2023; Rapporti 393/2023; ISPRA: Rome, Italy, 2023; pp. 189–219. Available online: https://www.isprambiente.gov.it/it/pubblicazioni/rapporti/rapporto-rifiuti-urbani-edizione-2023 (accessed on 18 May 2026).
  59. Pavan, A. La Gestione del Rifiuto Indifferenziato in Italia. 2024. Available online: https://www.consorziosea.it/la-gestione-del-rifiuto-indifferenziato-italia/ (accessed on 18 May 2026).
  60. Pergolizzi, A. Il Tesoro Nascosto dei Rifiuti Organici. 2024. Available online: https://www.rigeneriamoterritorio.it/il-tesoro-nascosto-dei-rifiuti-organici/ (accessed on 18 May 2026).
  61. European Commission. Product Environmental Footprint Category Rules (PEFCR) Guidance, Version 6.3; European Commission: Brussels, Belgium, 2018. Available online: https://eplca.jrc.ec.europa.eu/permalink/PEFCR_guidance_v6.3-2.pdf (accessed on 19 May 2026).
  62. European Commission. Commission Recommendation (EU) 2021/2279 of 15 December 2021 on the use of Environmental Footprint methods to measure and communicate the life cycle environmental performance of products and organisations. Off. J. Eur. Union 2021, L471/1, 1–396. Available online: https://eur-lex.europa.eu/legal-content/EN/TXT/PDF/?uri=CELEX:32021H2279 (accessed on 19 May 2026).
  63. Zampori, L.; Pant, R. Suggestions for Updating the Product Environmental Footprint (PEF) Method; JRC Technical Reports 115959. EUR 29682 EN; Publications Office of the European Union: Luxembourg, 2019; Available online: https://publications.jrc.ec.europa.eu/repository/handle/JRC115959 (accessed on 19 May 2026).
  64. EcoInvent. Allocation, Cut-Off, EN15804. Available online: https://support.ecoinvent.org/system-models#Allocation_EN15804 (accessed on 19 May 2026).
  65. Sala, S.; Crenna, E.; Secchi, M.; Pant, R. Global Normalisation Factors for the Environmental Footprint and Life Cycle Assessment; JRC Scientific Report; Publications Office of the European Union: Luxembourg, 2017; Available online: https://op.europa.eu/en/publication-detail/-/publication/3ec9e2cb-f1cc-11e7-9749-01aa75ed71a1/language-en (accessed on 19 May 2026).
  66. Sala, S.; Cerutti, A.K.; Pant, R. Development of a Weighting Approach for the Environmental Footprint; Publications Office of the European Union: Luxembourg, 2018; Available online: https://op.europa.eu/en/publication-detail/-/publication/6c24e876-4833-11e8-be1d-01aa75ed71a1/language-en (accessed on 19 May 2026).
  67. Weidema, B.P.; Wesnæs, M.S. Data quality management for life cycle inventories—An example of using data quality indicators. J. Clean. Prod. 1996, 4, 167–174. [Google Scholar] [CrossRef] [Scilit]
  68. Theodoridis, S. Monte Carlo methods. Chapter 14. In Machine Learning: A Bayesian and Optimization Perspective; Academic Press: London, UK, 2015; pp. 707–744. [Google Scholar]
  69. SINU (Società Italiana di Nutrizione Umana). LARN: Livelli di Assunzione di Riferimento di Nutrienti ed Energia per la Popolazione Italiana, 5th ed.; Biomedia Editori: Milan, Italy, 2024. [Google Scholar]
  70. Cimini, A.; Cibelli, M.; Moresi, M. Reducing the cooking water-to-dried pasta ratio and environmental impact of pasta cooking. J. Sci. Food Agric. 2019, 99, 1258–1266. [Google Scholar] [CrossRef] [Scilit]
  71. Cimini, A.; Cibelli, M.; Taddei, A.R.; Moresi, M. Effect of cooking temperature on cooked pasta quality and sustainability. J. Sci. Food Agric. 2021, 101, 4946–4958. [Google Scholar] [CrossRef] [Scilit]
  72. Moresi, M.; Cimini, A. Streamlined life cycle assessment of packaging waste in coffee preparation and consumption. Ital. J. Food Sci. 2025, 37, 436–477. [Google Scholar] [CrossRef] [Scilit]
Figure 1. System boundaries for the production and consumption of 1000 kg of durum wheat semolina (DWS) processed into dry (DP), fresh (FRP), and instant (IP) pastas. For symbols and abbreviations, please refer to the Nomenclature section.
Sustainability 18 08712 g001
Figure 2. Production process flowchart for DP, FRP, and IP pasta, showing common upstream phases (kneading, extrusion, pre-drying) and subsequent branching into specific production lines. Refer to the Nomenclature section for symbols.
Sustainability 18 08712 g002
Table 1. Summary of operating parameters, degrees of transformation (αgel, αcoag), and energy balances for the three production lines (dry, fresh, and instant pasta). Note: Consumption refers to a semolina feed rate of 1000 kg/h.
Parameter Dry PastaFresh PastaInstant PastaUnit
Finished Product972.261181.6914.8kg/h
Final moisture content12.5287%
Protein content 13.811.414.7%
Degree of gelatinization (αgel)≤575 ± 5≥95%
Degree of coagulation (αcoag)≤2060 ± 10≥90%
Pasteurization-110–2 min-
Steaming --T > 100 °C—10 min
Partial/Total Drying2–10 h10 min2.5 h
Steam Thermal Power -57.2355.75kW
Gelatinization Power0.121.732.19kW
Coagulation Power0.040.110.17kW
Drying Power231.5827.54240.69kW
Total Power231.7384.77298.43kW
The reported energy values are calculated on a theoretical thermodynamic basis.
Table 2. Total mass balance of the packaging processes for the different pasta types analyzed.
Material Flow [kg/h]DPFRPIP (Cup)IP (Bag)
INPUT
Pasta (as is)972.261181.56914.76914.76
Primary Packaging (Film/Gas/Cup/Lid)13.9845.79289.0516.65
Secondary Packaging (Cardboard/Labels)48.9570.54306.5393.45
Tertiary Packaging (Pallet/Film/Corners)60.1794.93339.21146.92
Total Input1095.361392.811849.551171.78
WASTE AND RESIDUES
Organic Waste (Scrapped Pasta)2.431.181.371.37
Paper/Cardboard Waste (RCC)0.480.723.950.94
Plastic/Aluminum Waste (RPL+RAL)0.220.992.170.21
Wood Waste (RL)0.120.180.500.28
Gas Emissions to Air-0.82--
Total Waste3.253.908.002.81
OUTPUT
Palletized Finished Product1092.111388.911841.551168.97
- of which Net Pasta969.831180.38913.39913.39
- of which Total Packaging122.29208.53928.16255.59
Table 3. Percent contribution of life cycle steps to the total PEF score for the four pasta variants.
Pasta ProductDry Pasta Fresh Pasta Instant Pasta—CupInstant Pasta—Bag
Life Cycle Step[μPt/kg][%][μPt/kg][%][μPt/kg][%][μPt/kg][%]
Durum Wheat Grain Production54.233.644.612.858.715.858.736.3
Durum Wheat Semolina Production3.42.12.80.83.61.03.62.2
Vibrated Extruded Pasta Production4.02.53.30.94.21.14.22.6
Pasta at packaging8.25.12.30.78.92.48.95.5
Packaging Materials19.312.028.78.3219.859.336.322.4
Use Phase52.232.3219.263.018.45.018.411.4
Transport20.913.044.512.849.113.230.518.8
Waste Disposal−0.7−0.42.50.78.02.21.10.7
Total161.4100.0347.9100.0370.8100.0161.7100.0
Table 4. Cradle-to-grave environmental impact results for 1 kg of different pasta variants according to the PEF standard method: Mean value and standard deviation for each environmental impact category (ICj).
Pasta VariantDry PastaFresh PastaInstant Pasta—CupInstant Pasta—Bag
ICjUnitValue
CCkg CO2e1.91 ± 8.41 × 10−24.14 ± 1.72 × 10−13.85 ± 1.70 × 10−11.72 ± 7.99 × 10⁻²
ODkg CFC11e7.10 × 10−8 ± 1.69 × 10−91.16 × 10−7 ± 3.93 × 10−91.00 × 10−7 ± 3.78 × 10−95.65 × 10−8 ± 1.48 × 10⁻⁹
IRkBq235Ue1.07 × 10−1 ± 1.98 × 10−33.75 × 10−1 ± 1.37 × 10−23.89 × 10−1 ± 1.55 × 10−21.06 × 10−1 ± 1.64 × 10⁻³
PhOFkg NMVOCe5.93 × 10−3 ± 1.99 × 10−41.30 × 10−2 ± 5.22 × 10−41.40 × 10−2 ± 5.98 × 10−46.54 × 10−3 ± 2.14 × 10⁻⁴
PMdisease inc.6.29 × 10−8 ± 4.15 × 10−91.31 × 10−7 ± 9.47 × 10−92.24 × 10−7 ± 9.98 × 10−97.95 × 10−8 ± 3.60 × 10⁻⁹
ACmol H+e7.12 × 10−3 ± 1.50 × 10−41.61 × 10−2 ± 4.80 × 10−41.82 × 10−2 ± 8.14 × 10−48.26 × 10−3 ± 2.74 × 10⁻⁴
FWEkg Pe4.43 × 10−4 ± 8.68 × 10−68.69 × 10−4 ± 2.74 × 10−51.22 × 10−3 ± 4.98 × 10−54.78 × 10−4 ± 7.98 × 10⁻⁶
MEkg Ne4.45 × 10−3 ± 1.07 × 10−35.42 × 10−3 ± 8.71 × 10−47.60 × 10−3 ± 1.17 × 10−34.89 × 10−3 ± 1.13 × 10⁻³
TEmol Ne2.16 × 10−2 ± 4.13 × 10−43.67 × 10−2 ± 1.14 × 10−34.73 × 10−2 ± 2.02 × 10−32.48 × 10−2 ± 6.93 × 10⁻⁴
ETFWCTUe6.96 ± 0.4415.45 ± 1.1018.19 ± 0.837.46 ± 0.34
C-HTCTUh5.90 × 10−10 ± 2.64 × 10−111.56 × 10⁻⁹ ± 7.02 × 10−111.74 × 10⁻⁹ ± 8.82 × 10−115.94 × 10⁻¹⁰ ± 2.18 × 10⁻¹¹
NC-HTCTUh1.29 × 10−8 ± 5.80 × 10−104.45 × 10⁻⁸ ± 1.70 × 10−94.12 × 10−8 ± 2.29 × 10−91.34 × 10−8 ± 4.99 × 10⁻¹⁰
LUPt1.60 × 102 ± 7.57 × 10−11.48 × 102 ± 2.252.35 × 102 ± 9.681.77 × 102 ± 8.09 × 10⁻¹
WUm3 depriv.0.84 ± 3.04 × 10−22.54 ± 6.27 × 10−21.79 ± 7.64 × 10−20.89 ± 3.11 × 10⁻²
RUFMJ26.50 ± 0.9061.14 ± 2.3660.90 ± 2.7723.50 ± 0.77
RUMMkg Sbe6.43 × 10−6 ± 1.97 × 10−72.99 × 10−5 ± 8.08 × 10−71.75 × 10−5 ± 1.40 × 10−65.46 × 10−6 ± 1.71 × 10⁻⁷
Table 5. Final cradle-to-grave environmental characterization of 1 kg of different pasta variants according to the PEF standard method: Mean value, standard deviation of normalized and weighted impact categories (ICNWj), and percentage contribution to the PEF score.
Pasta Variant Dry PastaFresh PastaInstant Pasta—CupInstant Pasta—Bag
ICNWj[μPt/kg][%][μPt/kg][%][μPt/kg][%][μPt/kg][%]
CC53.3 ± 2.332.1115.5 ± 4.831.7107.4 ± 4.728.748.0 ± 2.129.2
OD0.1 ± 0.0020.10.1 ± 0.0050.040.1 ± 0.0050.00.1 ± 0.00.0
IR1.3 ± 0.00.84.5 ± 0.21.24.6 ± 0.21.21.3 ± 0.00.8
PhOF6.9 ± 0.24.215.3 ± 0.64.216.4 ± 0.74.47.6 ± 0.24.7
PM9.5 ± 0.65.719.7 ± 1.45.433.7 ± 1.59.011.9 ± 0.57.3
AC7.9 ± 0.24.817.9 ± 0.54.920.3 ± 0.95.49.2 ± 0.35.6
FWE7.7 ± 0.24.715.2 ± 0.54.221.3 ± 0.95.78.3 ± 0.15.1
ME6.7 ± 1.64.18.2 ± 1.32.311.5 ± 1.83.17.4 ± 1.74.5
TE4.5 ± 0.12.77.7 ± 0.22.19.9 ± 0.42.75.2 ± 0.13.2
ETFW2.4 ± 0.21.45.2 ± 0.41.46.2 ± 0.31.62.5 ± 0.11.5
C-HT0.7 ± 0.00.41.9 ± 0.10.52.1 ± 0.10.60.7 ± 0.00.4
NC-HT1.8 ± 0.11.16.4 ± 0.21.75.9 ± 0.31.61.9 ± 0.11.2
LU15.5 ± 0.19.314.3 ± 0.23.922.8 ± 0.96.117.1 ± 0.110.4
WU6.2 ± 0.23.718.9 ± 0.55.213.3 ± 0.63.56.6 ± 0.24.0
RUF34.0 ± 1.120.478.3 ± 3.021.578.0 ± 3.620.830.0 ± 1.018.3
RUMM7.6 ± 0.24.635.5 ± 1.09.720.7 ± 1.75.56.5 ± 0.23.9
PEF166.1 ± 5.4100.0364.5 ± 13.2100.0374.2 ± 15.7100.0164.4 ± 4.6100.0
In alignment with PEF reporting protocols, percentage contributions in bold represent the primary environmental contributor (Rank 1) for each variant, while values in italics represent the secondary contributor (Rank 2).
Table 6. Comparison of the final cradle-to-grave environmental normalized and weighted profiles (ICNWj) and overall PEF scores between dry pasta (A) and fresh pasta (B), instant pasta in the cup (C), or bag format (D) according to the standard PEF method: Monte Carlo probabilities [P(AB), P(AC), and P(AD)]; mean differences [(A − B), (A − C), and (A − D)] with corresponding standard deviations, and percentage differences [ΔAB, ΔAC, and ΔAD].
ICNWjP # (A ≥ B)
(%)
(A − B) [Pt/kg]
Mean ± SD
ΔAB §
[%]
P # (A ≥ C)
(%)
(AC) [Pt/kg]
Mean ± SD
ΔAC §
[%]
P # (A ≥ D)
(%)
(A − D) [Pt/kg]
Mean ± SD
ΔAD §
[%]
CC0−6.2 × 10⁻⁵ ± 5.1 × 10⁻⁶−540−5.4 × 10⁻⁵ ± 4.8 × 10⁻⁶−5099.25.2 × 10−6 ± 2.2 × 10−611
OD0 −5.4 × 10⁻⁸ ± 5.2 × 10⁻⁹−540 −3.6 × 10⁻⁸ ± 4.9 × 10⁻⁹−361001.8 × 10−8 ± 2.6 × 10−917
IR0−3.2 × 10⁻⁶ ± 1.7 × 10⁻⁷−710−3.3 × 10⁻⁶ ± 1.8 × 10⁻⁷−7368.71.5 × 10−8 ± 2.9 × 10−81
PhOF0 −8.3 × 10⁻⁶ ± 6.6 × 10⁻⁷−540 −9.5 × 10⁻⁶ ± 7.4 × 10⁻⁷−581.05−7.1 × 10⁻⁷ ± 3.2 × 10⁻⁷−9
PM0−1.0 × 10⁻⁵ ± 1.6 × 10⁻⁶−520−2.4 × 10⁻⁵ ± 1.6 × 10⁻⁶−720−2.5 × 10⁻⁶ ± 7.7 × 10⁻⁷−21
AC0 −1.0 × 10⁻⁵ ± 5.7 × 10⁻⁷−560 −1.2 × 10⁻⁵ ± 9.3 × 10⁻⁷−610−1.3 × 10⁻⁶ ± 3.4 × 10⁻⁷−14
FWE0−7.4 × 10⁻⁶ ± 4.9 × 10⁻⁷−490−1.4 × 10⁻⁵ ± 8.4 × 10⁻⁷−640−6.0 × 10⁻⁷ ± 1.3 × 10⁻⁷−7
ME0 −1.5 × 10⁻⁶ ± 3.4 × 10⁻⁷−180 −4.8 × 10⁻⁶ ± 4.8 × 10⁻⁷−420−6.7 × 10⁻⁷ ± 1.5 × 10⁻⁷−9
TE0−3.2 × 10⁻⁶ ± 2.6 × 10⁻⁷−410−5.4 × 10⁻⁶ ± 4.4 × 10⁻⁷−550−6.7 × 10⁻⁷ ± 1.6 × 10⁻⁷−13
ETFW0 −2.9 × 10⁻⁶ ± 4.1 × 10⁻⁷−550 −3.8 × 10⁻⁶ ± 3.1 × 10⁻⁷−6118.2−1.7 × 10⁻⁷ ± 1.8 × 10⁻⁷−7
C-HT0−1.2 × 10⁻⁶ ± 9.4 × 10⁻⁸−630−1.4 × 10⁻⁶ ± 1.1 × 10⁻⁷−6744.2 −5.0 × 10⁻⁹ ± 4.0 × 10⁻⁸−1
NC-HT0 −4.5 × 10⁻⁶ ± 2.6 × 10⁻⁷−710−4.0 × 10⁻⁶ ± 3.3 × 10⁻⁷−6925.0−7.1 × 10⁻⁸ ± 1.0 × 10⁻⁷−4
LU100 1.2 × 10⁻⁶ ± 2.2 × 10−780 −7.4 × 10⁻⁶ ± 9.3 × 10⁻⁷−320 −1.7 × 10⁻⁶ ± 6.4 × 10⁻⁸−10
WU0−1.3 × 10⁻⁵ ± 4.4 × 10⁻⁷−670−7.1 × 10⁻⁶ ± 5.2 × 10⁻⁷−530−3.7 × 10⁻⁷ ± 7.5 × 10⁻⁸−6
RUF0 −4.4 × 10⁻⁵ ± 3.3 × 10⁻⁶−570 −4.4 × 10⁻⁵ ± 3.7 × 10⁻⁶−5799.83.9 × 10−6 ± 1.4 × 10−613
RUMM0−2.8 × 10⁻⁵ ± 1.0 × 10⁻⁶−780−1.3 × 10⁻⁵ ± 1.6 × 10⁻⁶−631001.1 × 10−6 ± 2.9 × 10−718
PEF0−2.0 × 10⁻⁴ ± 1.4 × 10⁻⁵−540−2.1 × 10⁻⁴ ± 1.6 × 10⁻⁵−5660.51.6 × 10−6 ± 5.7 × 10−61
# Probability P(A ≥ J): Frequency of iterations where the impact of System A is higher than or equal to System J. Values < 5% indicate a strong probabilistic dominance (advantage) for System A, while values > 95% indicate a strong probabilistic dominance (advantage) for System J. Values near 50% indicate high overlap and lack of statistical distinction between formats. § Percentage difference AJ), calculated via Equation (7). Negative values indicate lower environmental impact (an advantage) for System A relative to System J, whereas positive values indicate lower impact (an advantage) for System J relative to System A.
Disclaimer/Publisher’s Note: The statements, opinions and data contained in all publications are solely those of the individual author(s) and contributor(s) and not of MDPI and/or the editor(s). MDPI and/or the editor(s) disclaim responsibility for any injury to people or property resulting from any ideas, methods, instructions or products referred to in the content.