1. Introduction
Access to affordable, reliable, sustainable, and modern energy is central to Sustainable Development Goal 7 (SDG 7), which seeks to ensure energy for all by 2030 [
1,
2]. However, the conventional measurement of SDG 7 often depends on national-level or binary indicators, such as whether a household has an electricity connection or whether clean cooking fuel is used. Although such indicators are useful for macro-level monitoring, they do not sufficiently capture the actual household experience of energy access. Even households that were officially counted as electrified may still experience high energy expenditure, frequent power interruptions, voltage fluctuations, or limited use of renewable energy. Therefore, SDG 7 attainment cannot be reduced to mere connectivity; rather, it must be assessed as a lived household condition involving affordability, reliability, and sustainability.
The existing SDG 7 attainment approaches address important but different dimensions of energy attainment. This is because the official SDG 7 indicators primarily support national and international level monitoring of SDG 7 attainment, while the Multi-Tier Framework extends energy access measurement beyond connection status by incorporating service attributes such as affordability, reliability, quality, and safety [
3]. The energy poverty indices provide multidimensional measures of deprivation, whereas existing SDG 7 composite indices have mainly been developed for the country-level energy-sustainability assessment rather than for evaluating the attained household energy conditions [
4,
5]. Recent applications of explainable machine learning in rooftop solar research have concentrated on technical outcomes such as self-consumption and grid demand rather than on household-level SDG 7 attainment [
6]. The originality of the present study therefore lies in the integration of three elements within a single empirical framework. These include the development of a unified 0–100 household-level index combining affordability, reliability, and sustainability; its application to rooftop solar -adopting households; and the use of explainable machine learning to identify global predictors, nonlinear relationships, and household-specific pathways of attainment. Thus, the study moves from measuring whether households possess energy access or rooftop solar technology to evaluating how effectively they attain the multidimensional requirements of SDG 7.
The rooftop solar deployment at the household level provides a relevant context for examining SDG 7 attainment at the micro level. This is because in the case of households, rooftop solar adoption can contribute to affordability by reducing electricity bills, improve reliability by supporting energy self-generation and backup power, and enhance energy sustainability by increasing the renewable share of household energy consumption [
1,
7]. However, rooftop solar installation by the household alone does not enhance SDG 7 attainment. A household may install solar panels but still face affordability stress [
8,
9], unreliable service quality [
10,
11], low renewable contribution relative to total energy use [
8], or unequal benefits based on income, location, and household characteristics [
9,
12]. Therefore, the policy focus must move beyond counting rooftop solar installations toward assessing whether rooftop solar actually improves household-level SDG 7 outcomes [
1,
8].
The present study has two interconnected gaps. The first is a measurement gap: there is a need for a simple, theoretically grounded household-level composite index that directly operationalises SDG 7 through affordability, reliability, and sustainability. The second is an analytical gap: even after measuring household SDG 7 attainment, policymakers need to know which households attain SDG 7 more effectively, which households remain in the lower-attainment segment, and which demographic, socio-economic, locational, and energy-profile factors explain these differences. This is especially important because household SDG 7 attainment may not follow a normal or linear pattern. In the empirical application, SDG 7 attainment is bounded on a 0–100 scale and displays a high-score concentration with a lower-attainment tail, making flexible modelling approaches appropriate for identifying nonlinear and interactive patterns.
Accordingly, this study aims to operationalise SDG 7 attainment at the household level using a composite Household SDG 7 Index and to explain variation in attainment among rooftop solar households using explainable machine learning techniques. The study is guided by five research questions: How can SDG 7 attainment be operationalised at the household level using affordability, reliability, and sustainability indicators? What is the level and distributional pattern of SDG 7 attainment among rooftop solar households? Which demographic, socio-economic, locational, and energy-profile variables most strongly predict household SDG 7 attainment? Does income exhibit a linear or nonlinear relationship with household SDG 7 attainment? How can explainable machine learning tools identify household-specific pathways of high and low SDG 7 attainment?
The structure of this paper is as organised such that it first presents the background, measurement gap, and contribution of the study. The literature review then explains the theoretical foundations of household-level SDG 7 attainment. The methodology describes index construction, descriptive analysis, threshold sensitivity, Monte Carlo uncertainty propagation, Random Forest regression, and explainability procedures. The results present the corrected index distribution, robustness findings, model performance, variable importance, thematic importance, partial dependence, and household-level explanations. The discussion and policy sections interpret these findings for SDG 7 monitoring, rooftop solar policy, and household energy justice.
2. Literature Review and Theoretical Background
2.1. SDG 7 as a Multidimensional Household Outcome
SDG 7 requires energy access to be affordable, reliable, sustainable, and modern; therefore, household-level SDG 7 attainment cannot be assessed only through electricity connection or clean cooking access. Official SDG 7 indicators remain important for national and international monitoring, but they mainly describe population-level access and do not fully capture the quality, cost, and sustainability of energy experienced by individual households [
1,
13]. This limitation is central to the present study because binary measurement of SDG 7 attainment results in overstatement of SDG 7 status because electrification can occur while still experiencing a high energy burden [
5], frequent outages [
10], voltage instability [
11], or low renewable contribution to overall energy [
1]. Thus, SDG 7 attainment should be understood as a multidimensional household outcome consisting of affordability, reliability, and sustainability [
1,
13].
Affordability represents the ability of a household to pay for energy without compromising other basic needs. Energy poverty literature commonly treats the energy-burden ratio, the share of household income spent on energy, as a key affordability indicator [
5,
14]. This is theoretically appropriate because energy is a basic necessity of a household and a high energy-cost burden directly restricts the effective use of electricity, cooking fuel, and other household energy services [
5,
14,
15]. The affordability pillar of the Household SDG 7 Index therefore measures whether energy remains financially manageable at the household level.
Reliability refers to the continuity and technical quality of energy supply. Electricity access is incomplete if households face frequent interruptions, long outage durations, or unstable voltage. Studies on electricity reliability show that service quality affects the value of electricity access and that unreliable supply imposes economic and welfare costs on households [
10,
16,
17,
18]. Power quality is also central to modern energy access because voltage fluctuations can reduce the usefulness of electricity even when a connection exists [
11]. Therefore, the reliability pillar of the index captures outage frequency, outage duration, and voltage fluctuation as direct indicators of household-level service quality.
Sustainability refers to the extent to which the household energy basket is clean, renewable, and self-reliant. SDG 7 includes the expansion of renewable energy and the improvement of sustainable energy use; therefore, household sustainability must be measured by the renewable contribution to total household energy consumption rather than by the mere presence of a renewable-energy device [
1,
19]. In the context of rooftop solar, this distinction is important because solar generation may increase renewable electricity use, but households may still rely on non-renewable fuels for other energy needs. The sustainability pillar therefore measures the renewable share of total household energy after converting electricity and fuels into comparable energy units.
2.2. Energy Poverty, Energy Justice, and Household Energy Capability
The theoretical foundation of the present study is located in energy poverty, energy justice, and household energy capability. Energy poverty studies show that deprivation is not limited to absence of electricity. It may appear through unaffordable energy expenditure, poor service quality, dependence on polluting fuels, or limited capacity to use energy for daily household functions [
5,
20,
21]. This supports the argument that SDG 7 requires a composite household-level measure rather than a single access indicator.
Energy justice further strengthens this position by emphasising equitable energy outcomes [
22,
23]. If some of the households benefit more from rooftop solar adoption because of the demographic dividend, viz., income, education, employment, location, or energy use pathway, then technology deployment alone cannot be treated as equivalent to SDG 7 attainment [
24,
25,
26]. A justice-oriented interpretation requires identifying whether households actually receive affordable, reliable, and sustainable energy outcomes [
27,
28]. The Household SDG 7 Index follows this logic because it assesses attained household energy conditions rather than counting only energy infrastructure or technology adoption [
3].
The capability perspective also supports the multidimensional index structure. Energy access is valuable because it enables households to cook, study, work, communicate, maintain health, and participate in modern life. These capabilities are weakened when energy is costly, unreliable, or environmentally unsustainable. Therefore, household SDG 7 attainment may be understood as the household’s capability to use energy in a secure, affordable, reliable, and sustainable manner. This theoretical position justifies the use of the Household Energy Affordability Index, Household Energy Reliability Index, and Household Energy Sustainability Index as the three pillars of the composite Household SDG 7 Index.
2.3. Existing SDG 7 and Energy Access Measurement Frameworks
Several existing frameworks contribute to the measurement of energy access and energy poverty. However, they differ in their unit of analysis, conceptual focus, and ability to capture household-level SDG 7 attainment. The present study does not reject these frameworks. Instead, it builds on their strengths while addressing the gap that no commonly used measure directly produces a household-level composite SDG 7 score integrating affordability, reliability, and sustainability together.
From
Table 1, the measurement gap is very evident. The existing frameworks either operate at the national level, rely on binary access, focus on deprivation, or measure only selected dimensions of energy access. That is, the existing measures are partial lower-order dimensions, not complete measures of SDG 7. The existing frameworks expect rooftop solar explainable-AI studies to track SDG 7 at the macro level and not at the micro (household) level. Therefore, they do not capture SDG 7 as a complete household-level attainment outcome. The present study addresses this gap by using a household-level SDG 7 attainment measure that integrates affordability, reliability, and sustainability into a unified 0–100 index.
2.4. Rooftop Solar and SDG 7 Attainment
Rooftop solar, being a renewable and sustainable energy source for the household, provides a relevant context for household-level SDG 7 assessment because it can affect each pillar of the index. It can improve the energy affordability of the rooftop solar-adopting household by way of reducing electricity bills. Also, it improves the energy reliability of the household by supporting self-generation or backup capacity, and improves energy sustainability by increasing the renewable share of household energy use [
9,
29]. However, rooftop solar is an intervention, not the outcome itself. Installation alone does not prove SDG 7 attainment because households may still face affordability stress, unreliable electricity service, low renewable contribution relative to total energy use, or unequal benefits across socio-economic and locational groups [
3,
26]. Therefore, this study treats rooftop solar deployment as the empirical context for measuring SDG 7 attainment, not as a proxy for attainment. This distinction is important for policy because installation counts cannot reveal whether household energy conditions have actually improved [
3]. A household-level index is necessary to determine whether rooftop solar has translated into affordable, reliable, and sustainable energy outcomes [
3].
2.5. Demographic and Socio-Economic Determinants of Household Energy Attainment
Household SDG 7 attainment is not only affected by the technology but also by the demographic, socio-economic, locational, and energy-profile characteristics of the households [
5,
30]. The household-head demographic profile includes age and gender dynamics of the households, which may reflect differences in decision-making, technology familiarity, and household energy practices [
30]. Similarly, the socio-economic profile of the household includes income, education, employment, job type, and religion. Among these, income has the strongest theoretical relevance because it directly affects affordability and indirectly affects the household’s capacity to maintain systems, manage reliability deficits, and invest in cleaner technologies [
5,
9,
14].
The locational profile considers the district and locality because magnitude and strength of solar irradiation, grid reliability, service access, and energy use conditions may differ across places [
3,
10,
11]. However, location must be evaluated along with the household-level capacity of the solar rooftop installed because geographic position alone may not explain attainment [
9,
12]. The energy profile of the household considers variables such as the usage experience, type of solar system, first solar device adopted, and electric vehicle profile. These variables capture how households adopt, use, and integrate solar into their broader energy system [
7,
8,
30]. Thus, the predictor structure used in this study is theoretically aligned with the idea that household SDG 7 attainment is shaped by both socio-economic capability and energy use pathway [
1,
5].
2.6. Conceptual Framework
The conceptual framework of this study follows directly from the multidimensional interpretation of SDG 7 and the household-level measurement gap identified in the literature. The dependent construct is Household SDG 7 Attainment, measured through the composite Household SDG 7 Index. The index is formed as an integration of three dimensions of SDG 7, viz., the Household Energy Affordability Index, Household Energy Reliability Index, and Household Energy Sustainability Index. These three pillars represent the household-level translation of SDG 7’s requirement for affordable, reliable, sustainable, and modern energy.
At the explanatory side, the framework incorporates four distinct dimensions of household profile domains. The household-head demographic profile consists of age and gender; these variables are included because energy access and energy poverty studies commonly treat household-head characteristics as indicators of differential vulnerability, energy use needs, and household decision-making capacity [
31,
32]. The socio-economic profile of the household consists of income, education, employment, job type, and religion. Income, education, employment, and job type are included because household energy affordability, energy-service demand, and the capacity to adopt or benefit from clean-energy technologies vary systematically across socio-economic groups [
26,
33]. Religion is included as a socio-cultural control variable because values, norms, and social identity can operate as background factors shaping sustainable consumption and pro-environmental behaviour; therefore, it is treated here as a control variable rather than as a primary causal variable [
34]. The locational profile of the household consists of district and locality. These variables are important because energy poverty, infrastructure quality, reliability, and renewable-energy benefits are spatially uneven and may differ across districts and rural–urban/local contexts [
32,
33]. The energy profile of the household consists of solar usage experience, type of solar system, first solar device adopted, and electric vehicle profile. These variables are included because household energy outcomes depend not only on whether a technology is adopted, but also on how long it has been used, how the system is configured, how it interacts with household electricity demand, and whether additional electricity loads such as electric vehicles affect self-consumption, grid dependence, and affordability [
3,
25,
35]. These domains are therefore expected to explain variation in the Household SDG 7 Index because they influence the household’s capacity to afford energy, experience reliable supply, and increase the renewable share of total energy consumption [
3,
23].
The conceptual framework of the study therefore interlinks the measurement with an explanation. First, SDG 7 is converted into a micro-level household index mapping all three dimensions of SDG 7, viz., affordability, reliability, and sustainability. Second, the variation in this index is explained through four household profile dimensions, viz., household demographic, socio-economic, locational, and energy-profile factors. Third, explainable machine learning is used to identify global drivers, nonlinear patterns, and household-specific pathways. The conceptual figure for this section can therefore show four predictor domains leading to the Household SDG 7 Index, with the index internally represented by HEAI, HERI, and HESI.
4. Data and Methodology
4.1. Population and Sample
The target population of the study consists of households that have adopted rooftop solar systems. The empirical dataset used for the analysis consists of 659 rooftop solar-adopting households residing across 6 districts in the state of Kerala, India, viz., Thiruvananthapuram: 110 (16.69%); Alappuzha: 110 (16.69%); Ernakulam: 109 (16.54%); Kottayam: 112 (17.00%); Wayanad: 112 (17.00%); and Kasaragod: 106 (16.09%). These households form the valid sample for estimating the Household SDG 7 Index and for modelling the relationship between household profile variables and SDG 7 attainment. Only households with the necessary information required for computing affordability, reliability, sustainability, and demographic profile variables were considered for the final analysis. The data was originally collected as part of the ‘Household Photovoltaic Project for Affordable and Clean Energy (SDG 7): Stakeholder Satisfaction and Project Success.’ The data was collected during the period from 9 August 2025 to 9 October 2025. Thus, the sample represents rooftop solar-adopting households for whom household-level SDG 7 attainment could be empirically computed.
4.2. Data Collection Instrument
The data was collected through a schedule sent out through enumerators. The schedule was designed to capture the information required for the construction of the Household SDG 7 Index and for explaining variation in SDG 7 attainment. The enumerators collected data on household income, total household energy expenditure, outage frequency, outage duration, voltage fluctuation, solar generation, fuel consumption, and household demographic profile. It also collected information on energy-profile variables such as solar usage experience, type of solar system, first solar device adopted, and electric vehicle profile. These household profile variables were considered because they have the potential to influence the household-level conditions involving affordability, reliability, and sustainability [
1,
13].
4.3. Variables Used in the Study
The outcome variable of the study is the Household SDG 7 Attainment Index. It is measured on a continuous 0–100 scale, where higher values indicate higher SDG 7 attainment. The index is computed as the mean score of the three pillars of SDG 7: HEAI, HERI, and HESI.
These predictor variables are essential because the Household SDG 7 Index does not measure rooftop solar adoption alone. Rather, it measures whether rooftop solar households actually attain affordable, reliable, and sustainable energy outcomes. The predictor variables used in the study were age and gender of the household head, as energy use decisions can be influenced by technology familiarity and vulnerability to energy poverty [
30,
31,
32]. Income, education, employment, job type, and religion are included because SDG 7 attainment depends on the household’s socio-economic capacity to pay for energy, maintain the solar system, respond to reliability problems, and adopt cleaner energy practices [
5,
14,
26,
33,
34]. District and locality are included because energy infrastructure, grid quality, service availability, and spatial energy injustice may differ across places, thereby affecting reliability and household energy outcomes [
10,
11,
43]. Finally, the solar profile of the household consists of variables such as solar usage experience, type of solar system, first solar device adopted, and electric vehicle profile, which are included because the benefit of rooftop solar depends on how the household uses, configures, and integrates solar energy into its total energy system [
7,
25,
30,
35]. Therefore, these variables are identified because these variables have the potential to explain why some rooftop solar households attain SDG 7 more effectively while others remain constrained by affordability, reliability, sustainability, or energy use pathway differences.
Table 2 illustrates the summary profile characteristics of the households that participated in the study.
4.4. Analytical Strategy
The analysis was conducted in a sequential manner starting with the Household SDG 7 Index computation. The alignment of the research questions, analytical procedures, empirical outputs, Results, and Discussion is presented in
Table 3.
As shown in
Table 3, the SDG index computation was followed by the descriptive statistics of the SDG 7 Attainment Index. The bootstrap confidence interval was used to estimate the stability of the descriptive statistics because bootstrapping is appropriate for obtaining robust interval estimates when the distributional form of the statistic cannot be fully assumed [
44]. The Shapiro–Wilk test was used for normality assessment [
45]. Threshold sensitivity and Monte Carlo uncertainty analyses were then conducted to evaluate the robustness of the composite score, household rankings, and lower-attainment classification. Further, the Random Forest regression was used to model how demographic, socio-economic, locational, and energy-profile variables jointly explain SDG 7 attainment, as Random Forest is suitable for modelling nonlinear relationships and interaction effects through ensemble decision trees [
46,
47]. Finally, model interpretation was carried out using global variable importance, thematic importance, partial dependence analysis, DALEX, and iBreakDown-based local explanation to identify the dominant predictors, nonlinear response patterns, and household-specific prediction pathways [
48,
49,
50].
4.5. Descriptive and Distributional Analysis
Descriptive analysis was used to examine the central tendency, variability, and shape of SDG 7 attainment among rooftop solar households. The use of mean, median, mode, standard deviation, MAD, skewness, and kurtosis was necessary because the Household SDG 7 Index is a bounded 0–100 composite score, and such indices require examination of both the central tendency and distributional form before interpretation [
51,
52]. The histogram and density plot were used to visualise the distribution, while the boxplot was used to identify concentration at the upper end and the presence of lower-attainment cases [
53]. The Shapiro–Wilk test was applied to formally test normality [
45]. Since SDG indices may exhibit ceiling effects and non-normality, distributional diagnosis was necessary before selecting the modelling strategy [
52,
54].
4.6. Bootstrap Procedure
The distribution of SDG 7 attainment contained a high-score concentration as well as a lower-attainment tail, indicating asymmetry. A bootstrap procedure with 1000 replicates was used to estimate the confidence interval for the mean SDG 7 attainment score [
44]. The bootstrap CI can provide a more stable estimate of the mean [
44,
55].
4.7. Threshold Sensitivity and Monte Carlo Uncertainty Analysis
Following the recommended robustness assessment for composite indicators (OECD & European Commission, 2008) [
52], the baseline thresholds were varied to determine whether the principal conclusions depended on a single scoring specification. The baseline anchors identified for the study were 10% and 25% for household energy burden, 3 and 42 outages per week, 120 and 1920 outage minutes per week, and 7 and 49 voltage-fluctuation events per week. Each pair of thresholds was decreased and increased by 20% in one-at-a-time scenarios, and all thresholds were also changed jointly. The HEAI, ORI, ODI, VSI, HERI, and composite H-SDG 7 score were recalculated for every household under each scenario.
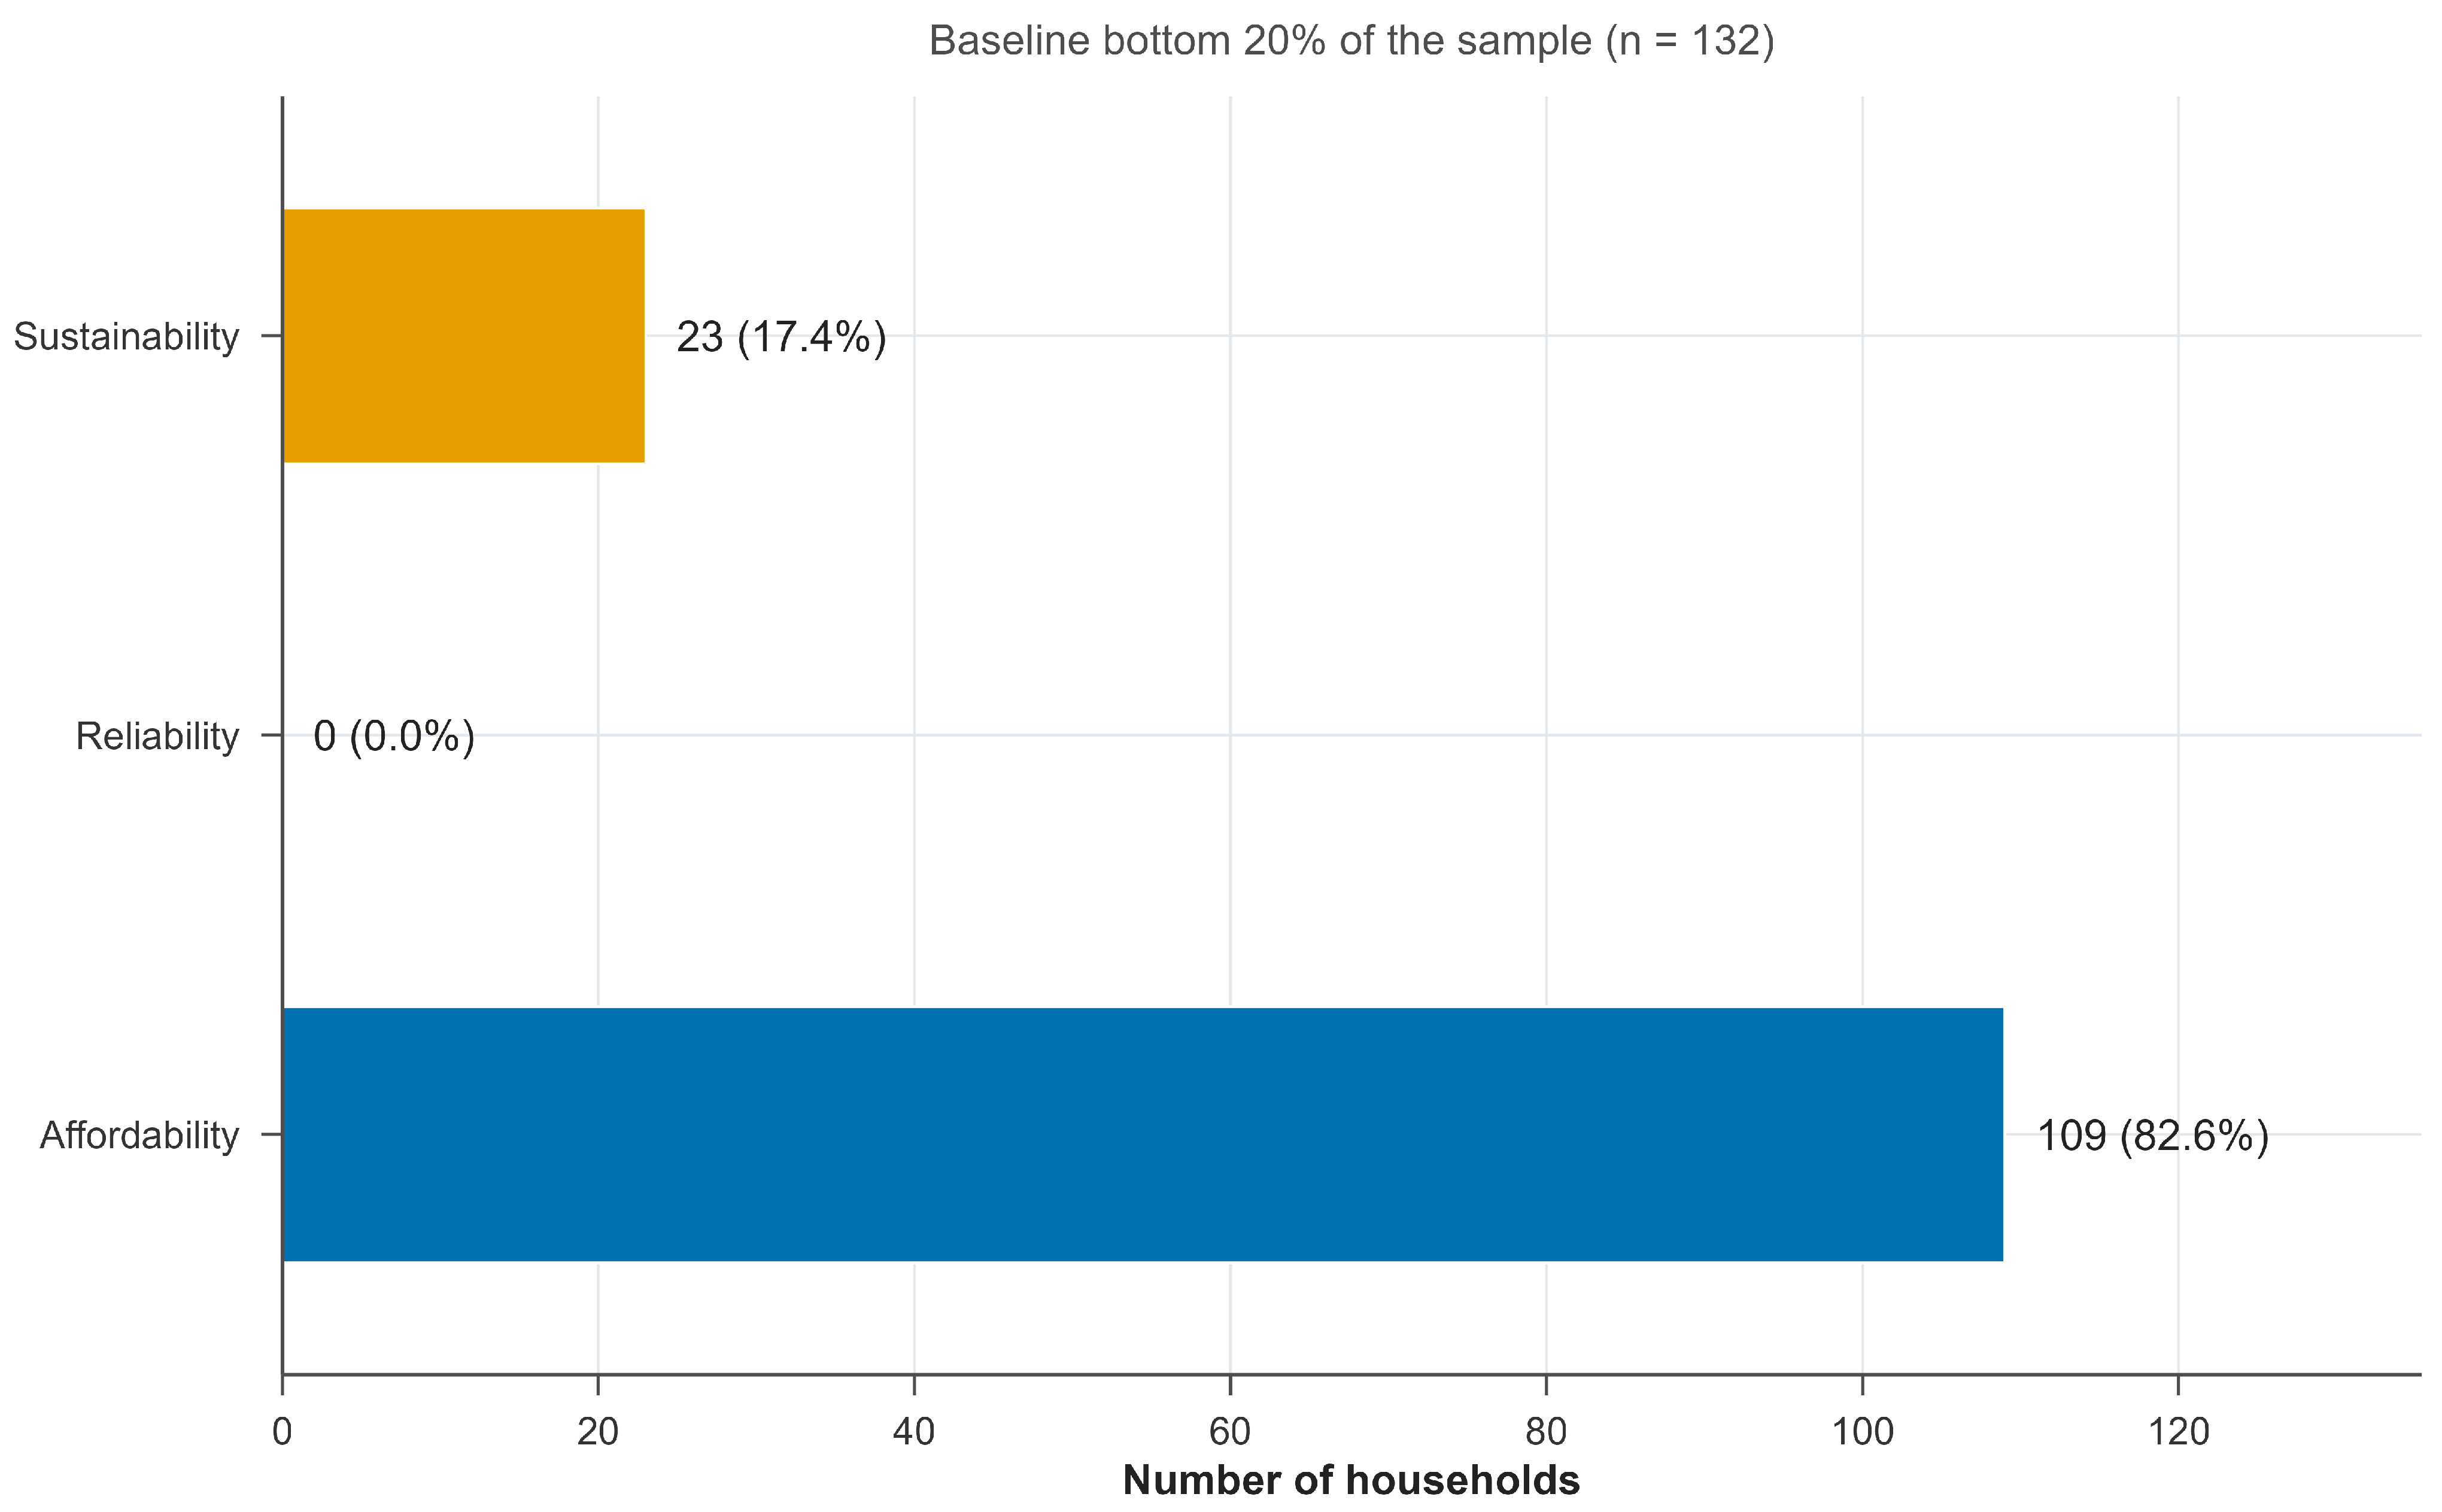
Changes in the distribution were evaluated through the mean, median, standard deviation, and absolute score change. Rank stability was assessed using Spearman and Kendall correlations and absolute rank changes. The 132 households forming the baseline bottom 20% were treated as an analytical lower-attainment segment; this was a sample-specific screening group rather than a universal policy cut-off. Retention, entry, exit, reclassification, and Jaccard similarity were calculated for each alternative threshold specification.
Measurement uncertainty was propagated through 10,000 Monte Carlo replications under low (5%)-, moderate (10%)-, and high (15%)-error scenarios. Income and total energy expenditure were perturbed using multiplicative lognormal distributions centred on the observed values. Outage frequency and voltage-fluctuation counts were perturbed using non-negative rounded distributions, while outage duration was perturbed using a non-negative continuous distribution. HESI was held fixed because the reviewer-identified uncertainty concerned income, expenditure, and outage reporting. For each household, the simulated mean, standard deviation, 2.5th and 97.5th percentiles, interval width, and probability of lower-attainment membership were estimated. These are scenario-based uncertainty intervals conditional on the assumed error distributions, not conventional sampling confidence intervals.
4.8. Random Forest Regression
Random Forest regression was used because the Household SDG 7 Index is the continuous but bounded 0–100 outcome. Further, the relationship between household-profile variables and SDG 7 attainment may involve nonlinearity, interaction effects, and threshold behaviour. Random Forest is an ensemble learning method that aggregates predictions from many decision trees built on bootstrap samples and randomised predictor selection at each split, thereby reducing variance and improving generalisation compared with a single decision tree [
46]. The dependent variable in the model was the Household SDG 7 Index, and the predictor variables were the demographic, socio-economic, locational, and energy-profile variables. The model was implemented using the Random Forest algorithm in R, which is widely used for regression forests and variable importance estimation [
47].
For
regression trees, the Random Forest prediction is as follows:
where
is the prediction produced by the
-th tree and
for the fitted forest [
46].
4.9. Model Validation and Explainability
For measuring the predictive accuracy of the Random Forest model, the test-set performance metrics have been used.
For test observations
, the metrics are calculated as follows:
After establishing model performance, the global importance of the model was assessed using permutation importance and node-purity diagnostics [
46,
47]. Thematic importance was then assessed by grouping predictors into socio-economic profile, energy profile, locational profile, and household-head demographic profile. It was followed by the partial dependence analysis to examine the nonlinear relationship between income and predicted SDG 7 attainment [
50]. Finally, DALEX and iBreakDown were used for model-agnostic local interpretability, allowing individual household predictions to be decomposed into variable-level contributions [
48,
49].
5. Results and Analysis
5.1. Normality Assessment and Implication for Modelling
The normality assumption helps determine the data modelling method to be followed for modelling the SDG 7 Attainment Index of the household, because strictly parametric approaches may become restrictive when the outcome distribution is non-normal, whereas machine learning approaches such as Random Forest can model nonlinear relationships and interaction effects without requiring the response variable to follow a normal distribution [
46,
56,
57]. The descriptive shape statistics illustrated the deviation of the SDG 7 Attainment Index from normality, particularly the skewness and the kurtosis. Skewness illustrated a strong negatively skewed distribution, g
1 = −1.89, whereas the kurtosis illustrated that the distribution was leptokurtic, g
2 = 2.74. The Shapiro–Wilk test of normality further validated that the distribution of the SDG 7 Attainment Index of the household deviates significantly from normality, W = 0.725,
p < 0.001. This is because the SDG 7 attainment score is characterized by a concentration of high attainment values with a long tail extending towards lower attainment. It is also important to note that SDG indices often exhibit such non-normality due to bounded measurement and ceiling effects, particularly when the sampled population already has an enabling condition, here, rooftop solar adoption. Hence, the observed departure from normality is not unexpected; rather, it indicates that interpretation should pay attention to the high concentration near the upper end and the policy-relevant low-attainment subgroup.
5.2. Household SDG 7 Attainment
The SDG 7 attainment of the household was measured with the help of the SDG 7 Attainment Index developed for the study. The descriptive statistics of the Household SDG 7 Attainment Index shown in
Table 4 indicate that the average SDG 7 attainment score of the households was 88.812, with a standard deviation of 9.95 and a 95% bootstrap confidence interval (with 1000 replicates) of 88.00–89.52. This indicates that, on average, the rooftop solar-adopting households demonstrate a relatively high level of SDG 7 attainment. A smaller segment records substantially lower attainment, creating a pronounced tail towards the lower end of the scale.
Further,
Table 4 shows that the MAD is only 4.94, which implies that the core mass of households is concentrated closely around the median, but the overall spread increases due to the presence of substantially lower attainment observations. The minimum score of the SDG 7 Attainment Index among the rooftop solar adopters was 50.00 and the maximum score was 99.33, resulting in a wide range of 49.33. Therefore, while the attainment ceiling is near the upper bound for many households, a minority segment records low attainment values that substantially expand the distributional spread.
5.3. Threshold Sensitivity and Household-Level Uncertainty
The threshold analysis shown in
Table 5 indicated that the broad distributional conclusion was robust, although affordability assumptions affected the exact scores and ordering of some households. Across the alternative specifications, the mean H-SDG 7 score ranged from 86.37 under the joint stringent specification to 90.29 under the joint lenient specification, compared with 88.81 at baseline. Spearman correlations with the baseline ranking ranged from 0.941 to 1.000 and Kendall correlations ranged from 0.863 to 1.000.
Lower-attainment membership was generally stable. Retention of the baseline bottom 20% ranged from 83.3% to 100%, and the overall reclassification rate ranged from 0% to 6.68%. The largest change occurred under the lenient affordability and joint-lenient specifications, each of which replaced 22 of the 132 baseline lower-attainment house-holds. Changes to outage duration and voltage thresholds did not alter the scores in this sample, while outage-frequency changes produced only negligible effects.
Under the primary 10% Monte Carlo scenario, the median household-level 95% uncertainty-interval width was 1.05 index points and the mean width was 5.27 points. A total of 566 households (85.9%) had at least a 90% probability of retaining their baseline lower-attainment classification, while 17 households (2.6%) had classification probabilities between 0.40 and 0.60. Under the more conservative 15% scenario, the median interval width increased to 4.46 points and 528 households (80.1%) retained classification with at least 90% probability. These findings support use of the index for broad diagnosis but show that households close to the lower-tail boundary should be verified before policy decisions are made.
5.4. Household Profile and SDG 7 Attainment
Since the SDG 7 attainment score of the household returns a highly skewed and non-normal distribution, the analytical approaches that assume normality and linearity can become restrictive [
46,
56,
57], particularly when the research objective is to understand how the demographic profile of the household is linked with SDG 7 attainment. Further, the presence of a ceiling concentration and a low-attainment tail suggests that relationships may be nonlinear and may involve interaction effects [
57]. Therefore, the study proceeded with Random Forest for explaining how the household profile is linked with SDG 7 attainment. The dependent variable in the model is the Household SDG 7 Attainment Score, operationalized on a continuous 0–100 scale. Predictor variables are organised thematically into four theoretically grounded dimensions, viz., household-head demographic profile, socio-economic profile, locational profile, and energy profile.
Random Forest (RF) regression is used to model the relationship between household profile and SDG 7 attainment as the outcome is shaped by nonlinearities, threshold effects, and interaction structures that are difficult to represent adequately using strictly parametric specifications [
46,
56,
57]. RF is an ensemble learning method that aggregates predictions from a large number of decision trees built on bootstrap samples, while randomising candidate predictors at each split; this design improves generalization by reducing variance and mitigating overfitting relative to single-tree models [
41].
5.5. Random Forest Model Performance and Validation
To assess the predictive accuracy and robustness of the Random Forest (RF) model, the original dataset comprising 659 households was randomly partitioned using a fixed seed value of 123 into three subsets, viz., a training set of 422 households, a validation set of 106 households, and an independent test set of 131 households. The RF model was estimated using the training dataset, whereas predictive performance was evaluated using the independent test dataset. The sample-split strategy was adopted as per recommended practices in predictive modelling as it enables the evaluation of out-of-sample predictive performance and reduces the risk of overestimating model adequacy due to overfitting [
56].
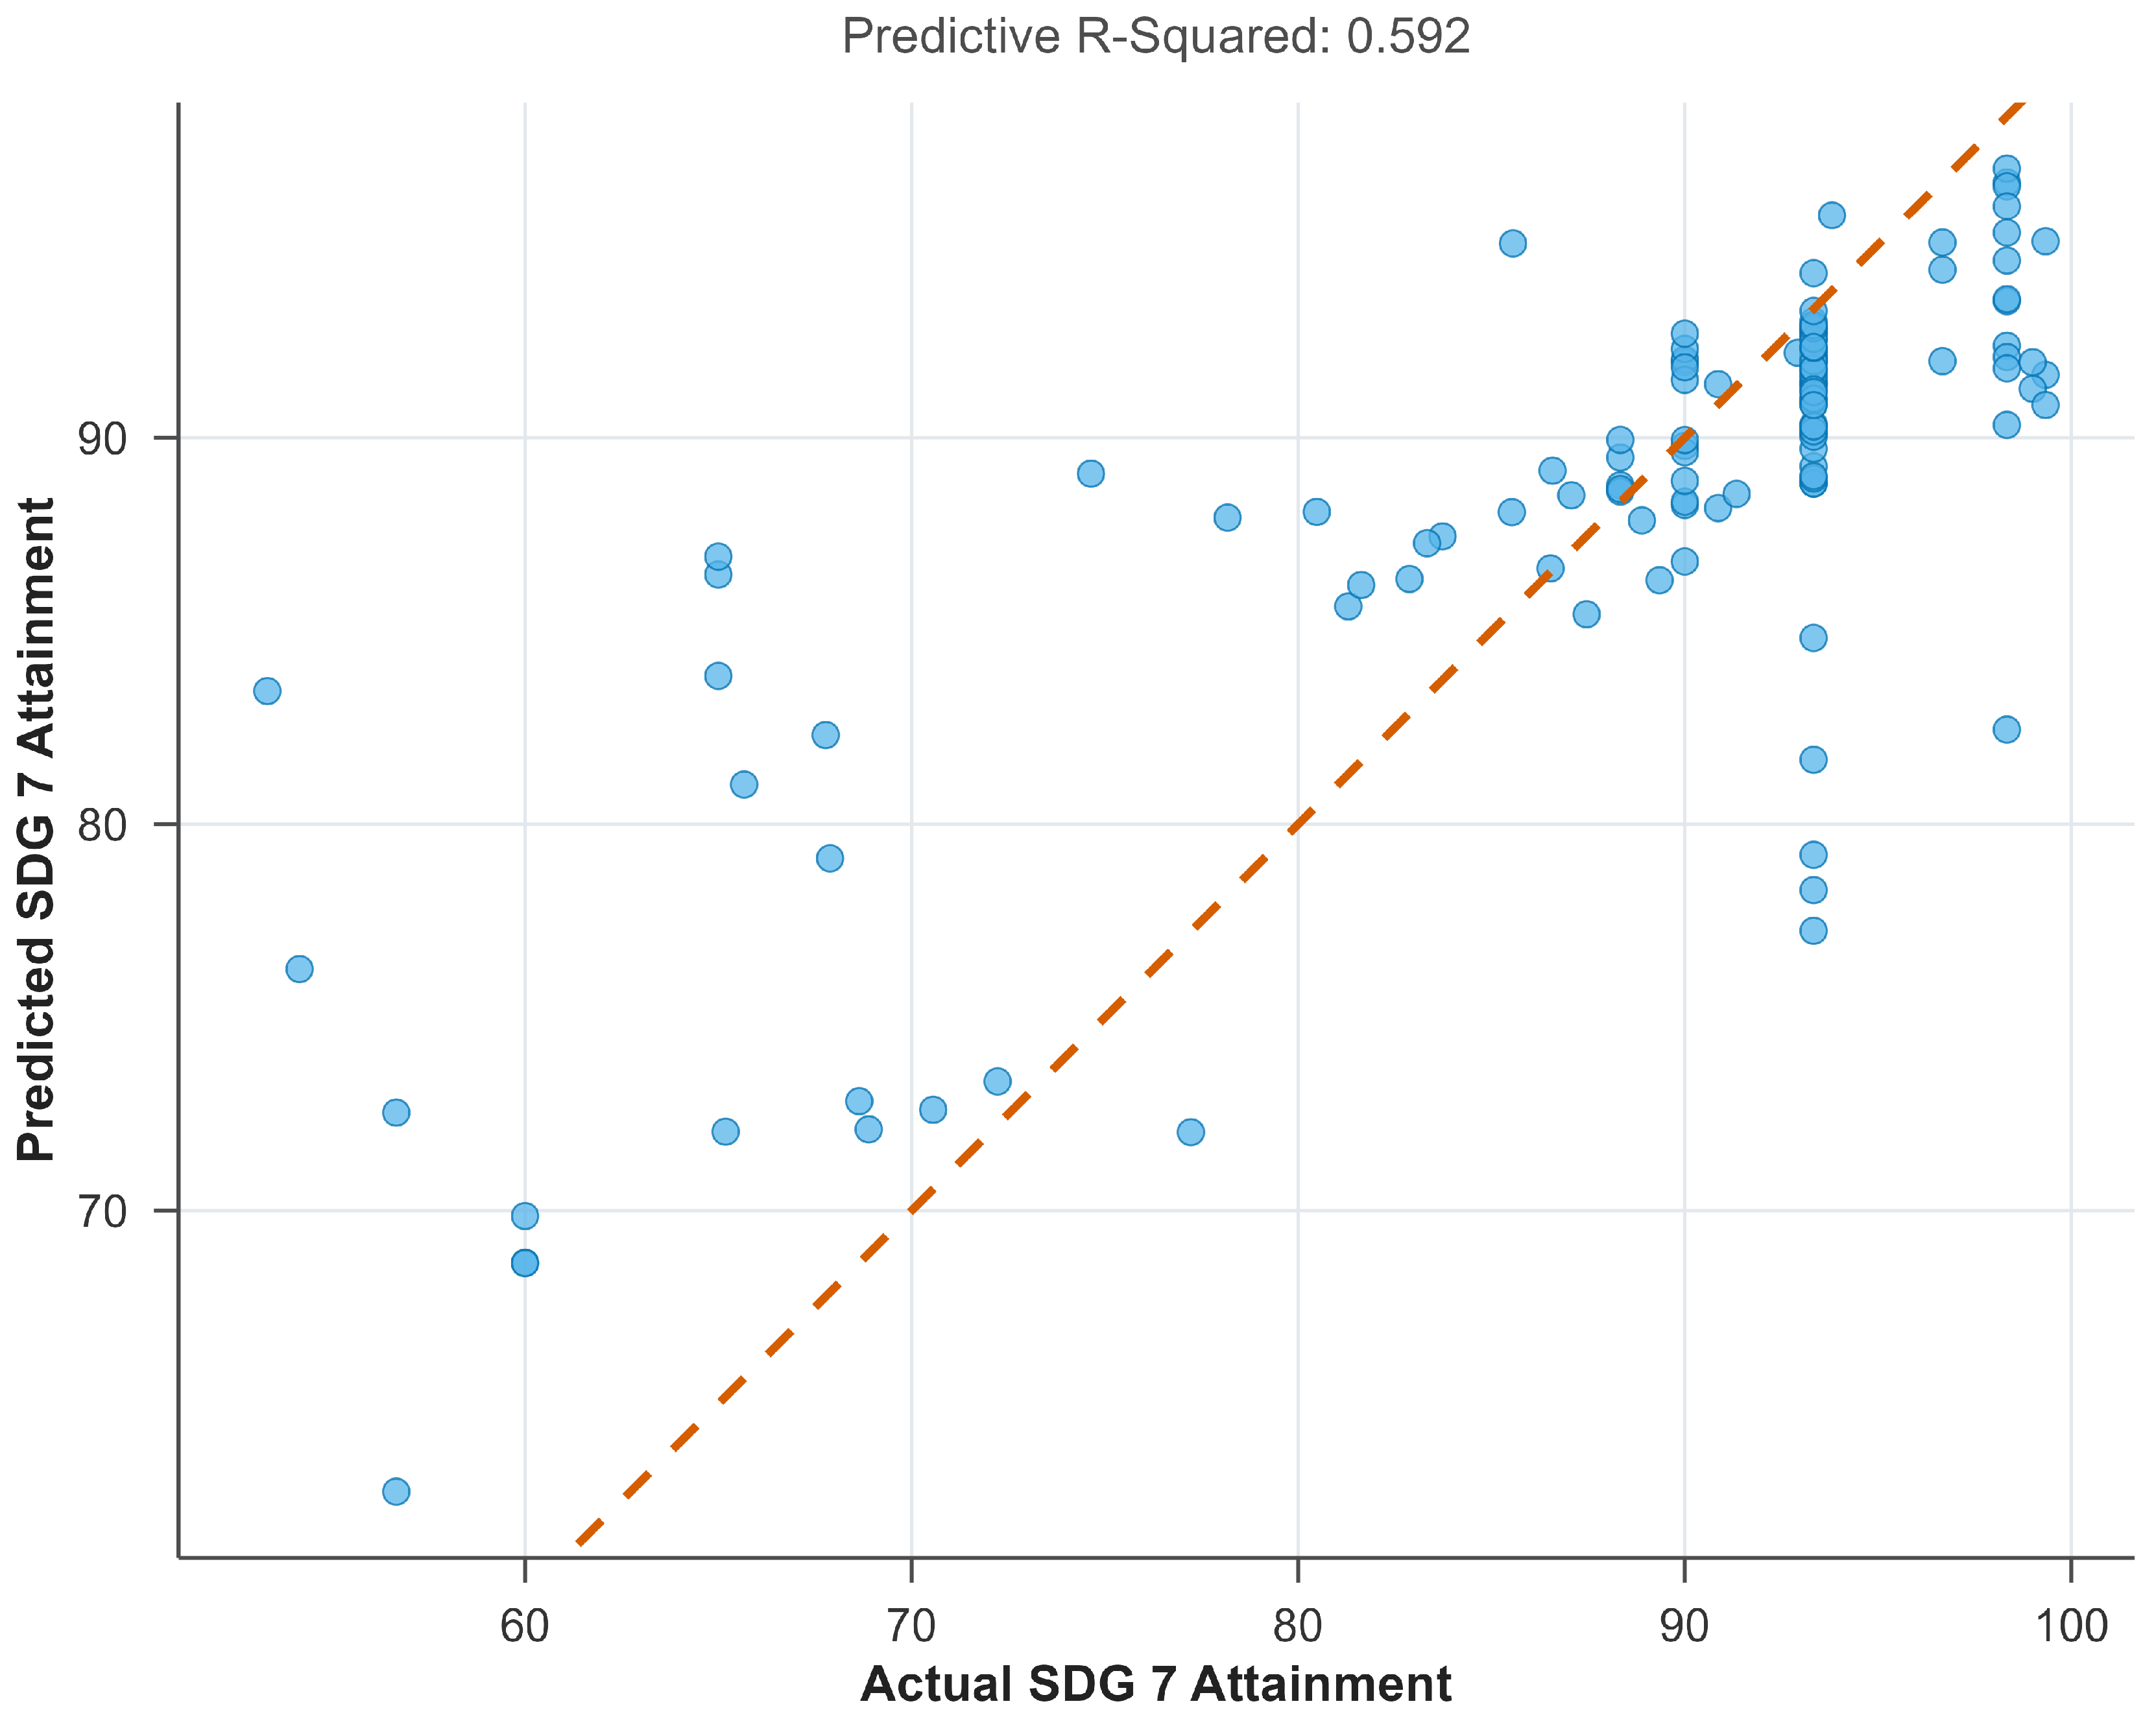
The RF model was evaluated using the independent test dataset of 131 households, and the results are presented in
Table 6. The model obtained a predictive R
2 of 0.592, indicating that it reduced squared prediction error by approximately 59.2% relative to predicting the test-set mean. The squared correlation between observed and predicted scores was 0.628 and is reported separately because it does not measure error reduction in the same manner. The validation-set predictive R
2 was 0.556, providing a consistent indication of out-of-sample performance and indicating that approximately 55.6% of the total variation in household SDG 7 attainment is explained by the combined effects of predictors, viz., demographic, socio-economic, locational, and energy-profile variables. In the context of household-level sustainability analysis, where outcomes are shaped by multiple interrelated behavioural, infrastructural, and contextual factors, this level of explained variance may be considered substantively meaningful.
As per the predictive model statistics illustrated in
Table 6, the mean absolute percentage error (MAPE) of 5.92%, the root mean squared error (RMSE = 7.029) and the mean absolute error (MAE = 4.57) show that, on average, the model’s predicted SDG 7 scores deviate from the observed scores by fewer than ten points on the 0–100 attainment scale. The scaled mean squared error (MSE = 0.405) further indicates that the prediction error is substantially lower than the intrinsic variance of the dependent variable, thereby suggesting that the model captures meaningful structural patterns rather than random noise [
56].
Figure 1 is the predictive performance plot of the SDG 7 attainment, comparing the actual and the predicted SDG 7 attainment scores. The close alignment of the predicted values with the 45-degree reference line is an indication of the congruence between the observed and the predicted SDG 7 attainment scores.
Figure 1 further illustrates that although there is dispersion around the diagonal, it is not alarming, and no obvious systematic bias is visible across low, medium, or high levels of SDG 7 attainment. This confirms that the predictive model is performing satisfactorily across the households with varying levels of SDG 7 attainment levels.
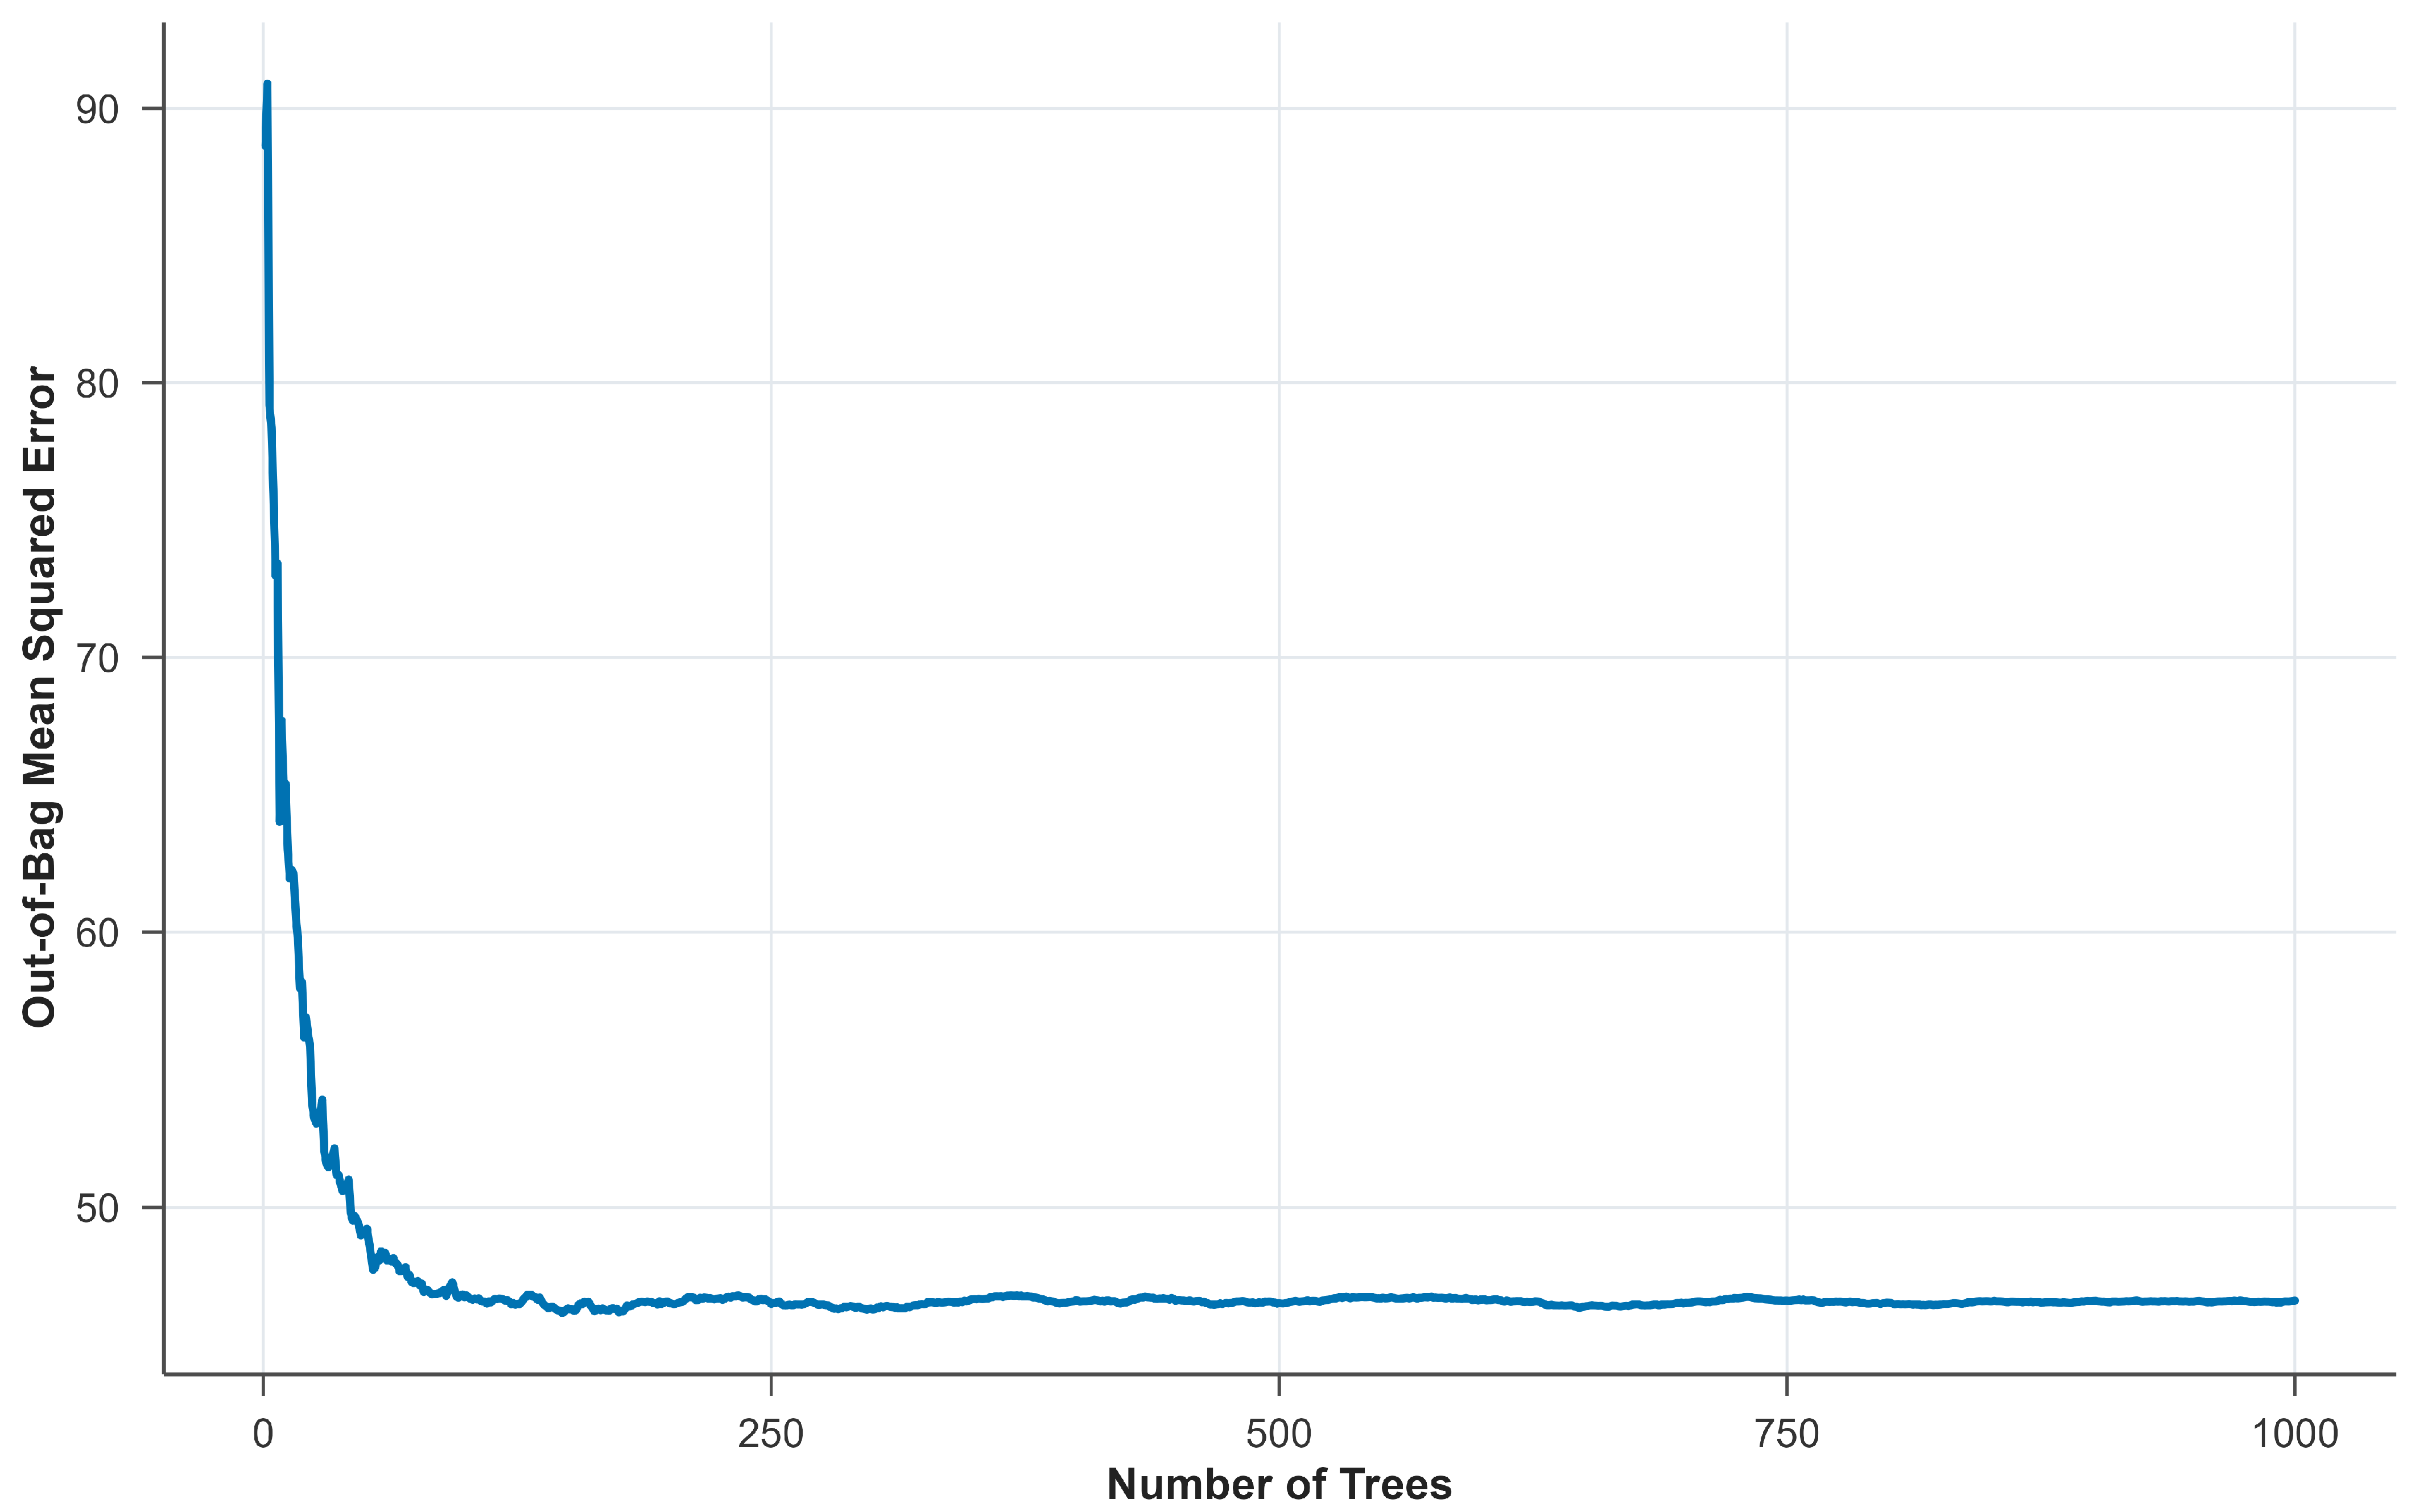
Figure 2 is the error-rate convergence plot. The error-rate convergence plot illustrates that the error-rate curve has a steep downward slope trend during its initial phase. This indicates that the initial trees contributed substantially to the predictive accuracy enhancement of the model. As more trees are added, the curve gradually flattens around and eventually becomes nearly horizontal, showing that the reduction in error becomes minimal beyond a certain point. The flattening of the error-rate curve illustrates stabilization of the error rate and indicates that the RF ensemble has reached convergence well before 1000 trees. This validates that the RF ensemble reached convergence efficiently. The flattening of the error curve confirms that the proposed forest size is sufficient and that the model is not vulnerable to instability arising out of insufficient tree growth. The convergence of the out-of-bag error along with the performance metrics strengthens confidence in the structural reliability and predictive stability while acknowledging the residual prediction error of the RF framework [
46,
47].
5.6. Determinants of SDG 7 Attainment: Global Variable Importance Analysis
Global variable importance was evaluated with the help of using two complementary measures. The scaled `%IncMSE’ quantifies the standardized loss in out-of-bag predictive accuracy when a predictor is permuted. The `IncNodePurity‘ records the cumulative reduction in the residual-sum-of-squares impurity from splits involving that predictor. Further, the permutation p-values were calculated with `rfPermute::rfPermute()’ on the training dataset (n = 422). The observed Random Forest contained 1000 trees, with `mtry = 4‘ and `nodesize = 5‘. The response variable was then permuted 999 times and the predictors remained unchanged. A new forest with identical settings was then fitted after each of the permutations. For each predictor and importance measure, the corresponding one-sided empirical p-value was calculated as [1 + the number of permuted importance values greater than or equal to the observed value]/[999 + 1]. The smallest attainable p-value was therefore 0.001.
This procedure was applied separately to the ‘scaled % of MSE increase’ and to the `node-purity increase‘.
Table 7 reports the key drivers of SDG 7 attainment along with the resulting
p-values in separate columns. These are permutation-based variable-importance
p-values. They are not classical coefficient
p-values or split-frequency
p-values [
46,
47,
58].
As shown in
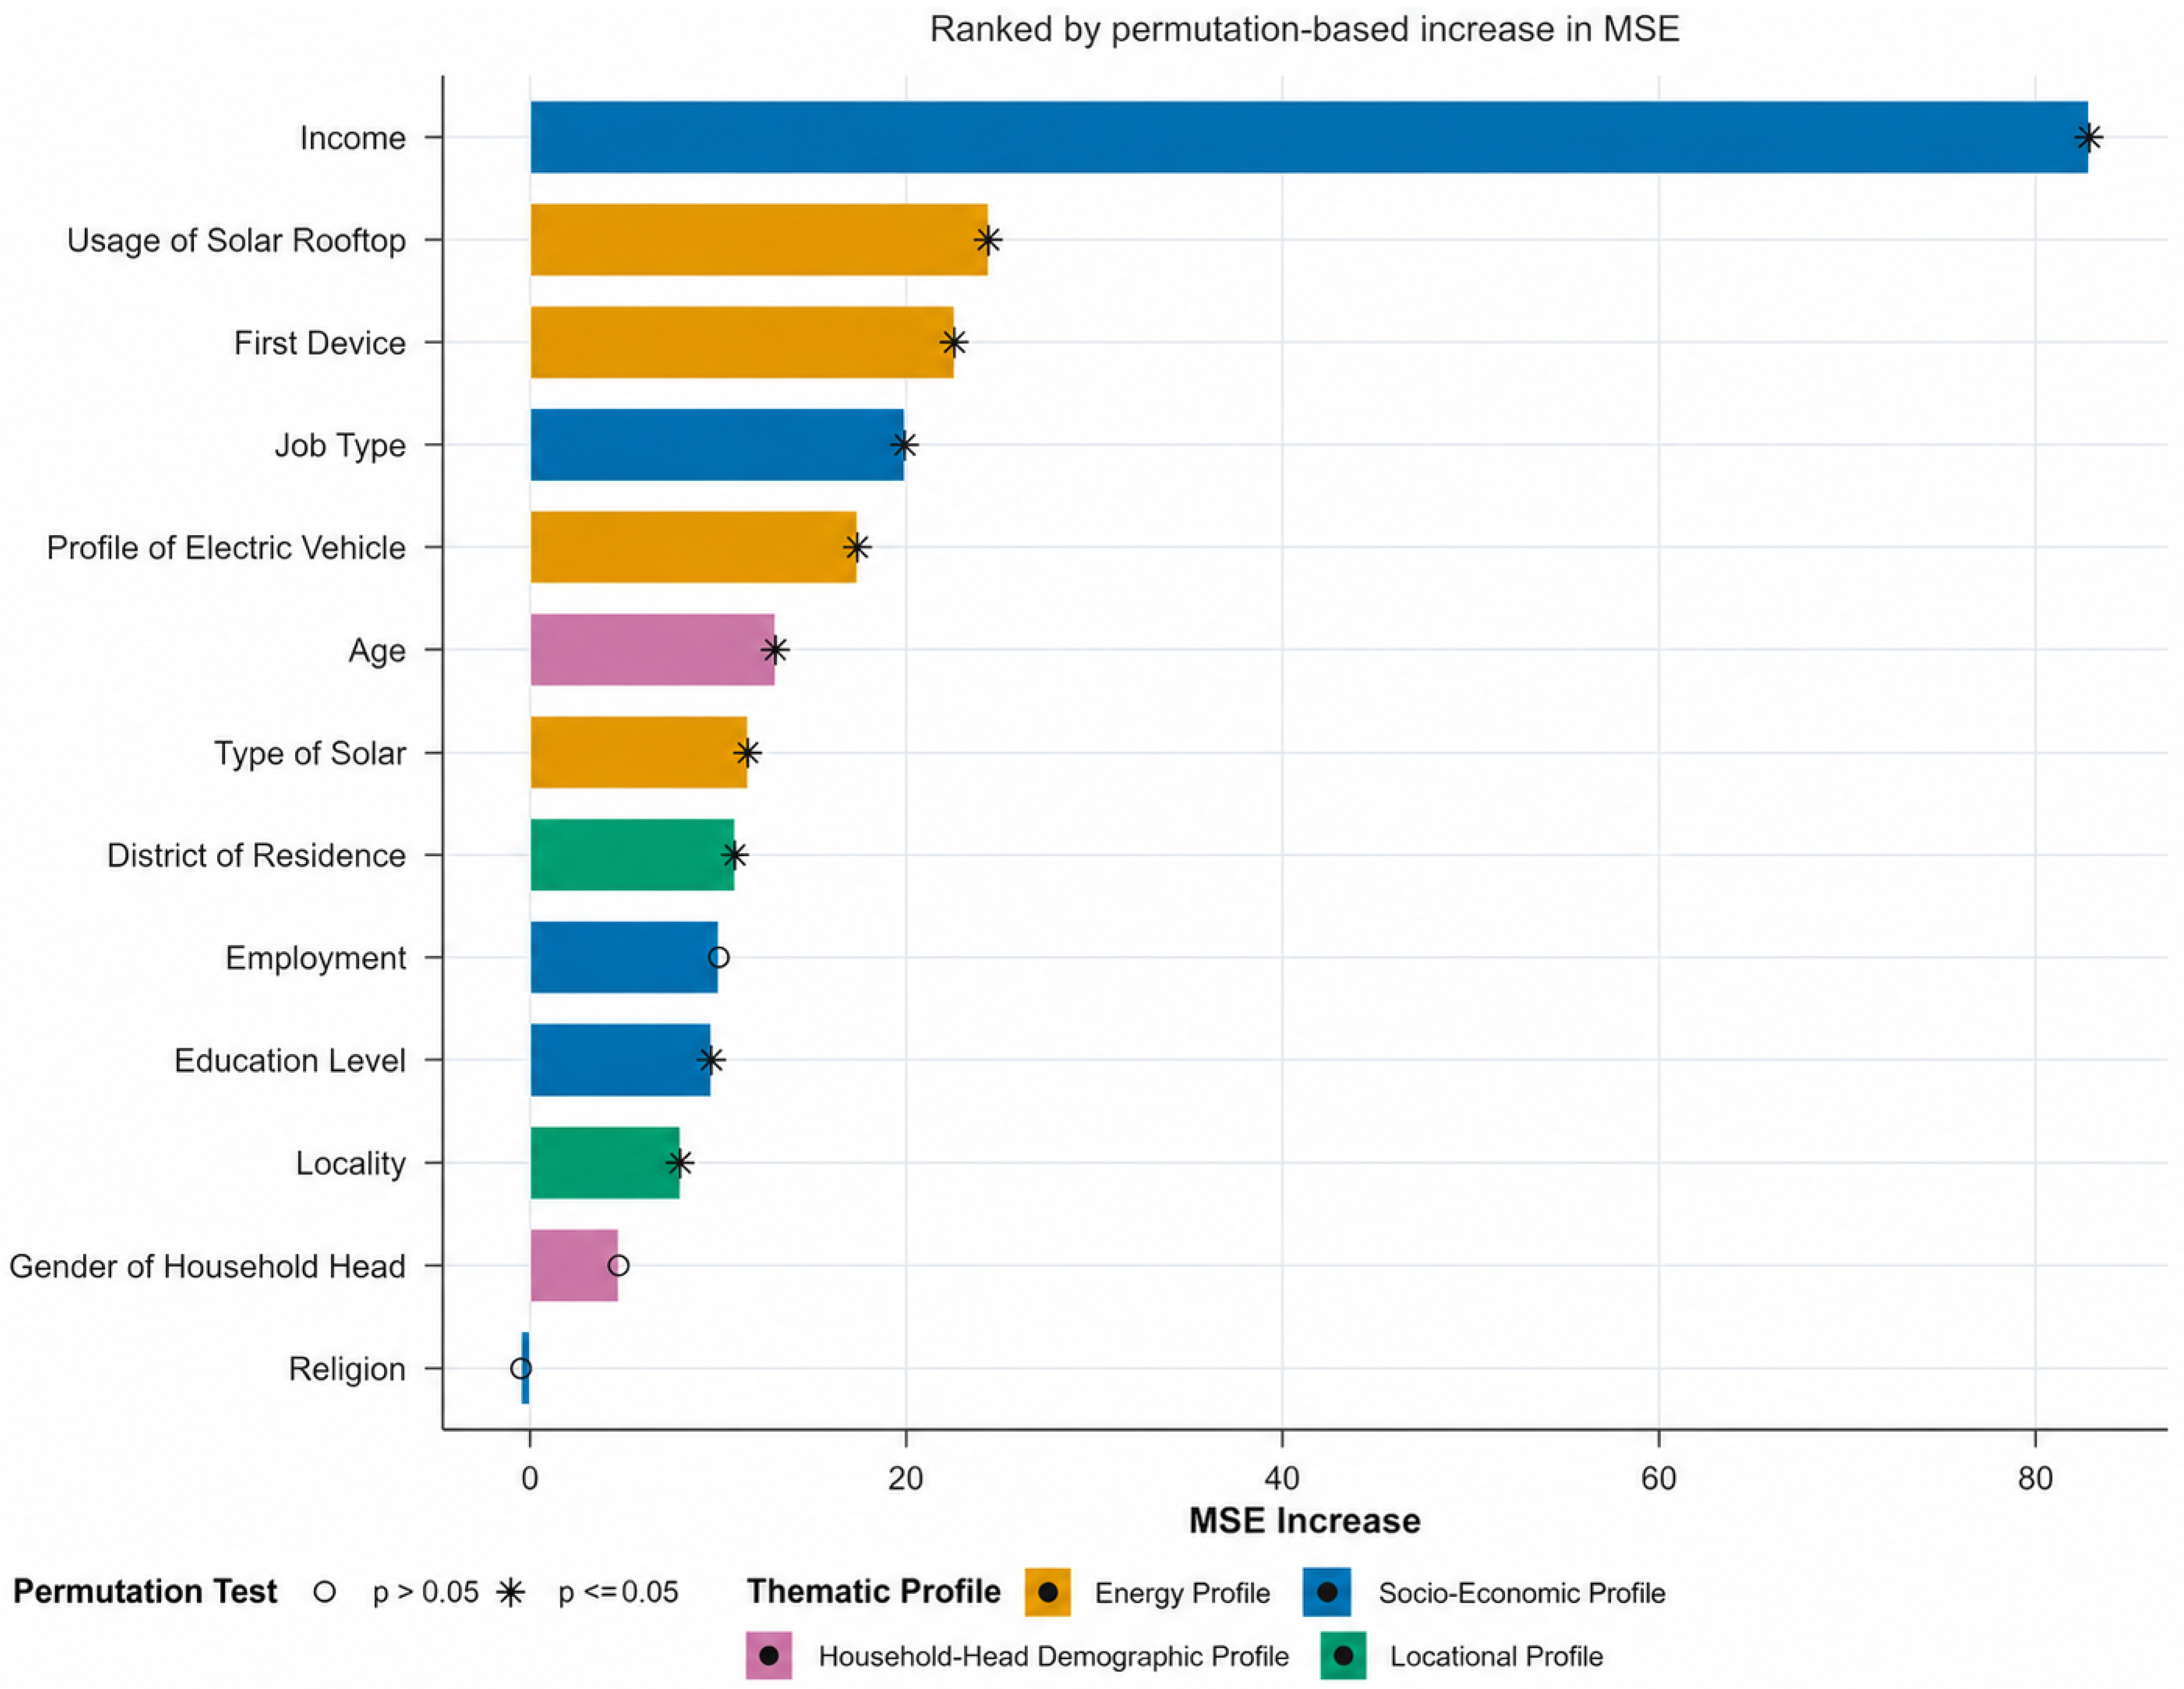
Table 7, income was the dominant predictor (scaled % MSE increase = 82.852,
p = 0.001; increase in node purity = 16,799.819,
p = 0.001). The next largest accuracy-based contributions were usage of solar rooftop (24.364,
p = 0.001), first device (22.557,
p = 0.001), job type (19.900,
p = 0.003), and profile of electric vehicle (17.401,
p = 0.001). These results show that socio-economic capacity remains central, while the way households adopt and use energy technologies also contributes materially to prediction.
Age (13.057, p = 0.007), type of solar (11.588, p = 0.003), district of residence (10.892, p = 0.031), education level (9.656, p = 0.037), and locality (7.998, p = 0.023) also had statistically supported permutation importance. Employment had a positive MSE increase of 10.035 but did not reach the 5% level (p = 0.076). Gender of household head (p = 0.199) and religion (p = 0.670) were not statistically supported by the permutation-importance test.
The node-purity p-values supported income (p = 0.001), job type (p = 0.008), and employment (p = 0.045). Several predictors with significant MSE importance did not have significant node-purity p-values. This difference is not contradictory: permutation importance evaluates predictive information, whereas node purity reflects how variables are used within the tree partitions. The substantive ranking therefore prioritises scaled % MSE increase and treats node purity as complementary.
Religion recorded a slightly negative MSE increase (−0.470, p = 0.670), indicating that permuting religion did not reduce predictive accuracy. Employment, gender, and religion should therefore not be described as statistically supported predictors on the basis of MSE importance, even though employment had a significant node-purity p-value.
Figure 3 ranks predictors by scaled % MSE increase. Income is clearly separated from the remaining variables, while usage of solar rooftop, first device, job type, and profile of electric vehicle form the next group of influential predictors. The figure therefore confirms that the model is driven primarily by socio-economic capacity and energy use pathways.
5.7. Accuracy–Structure Trade-Off and Thematic Importance
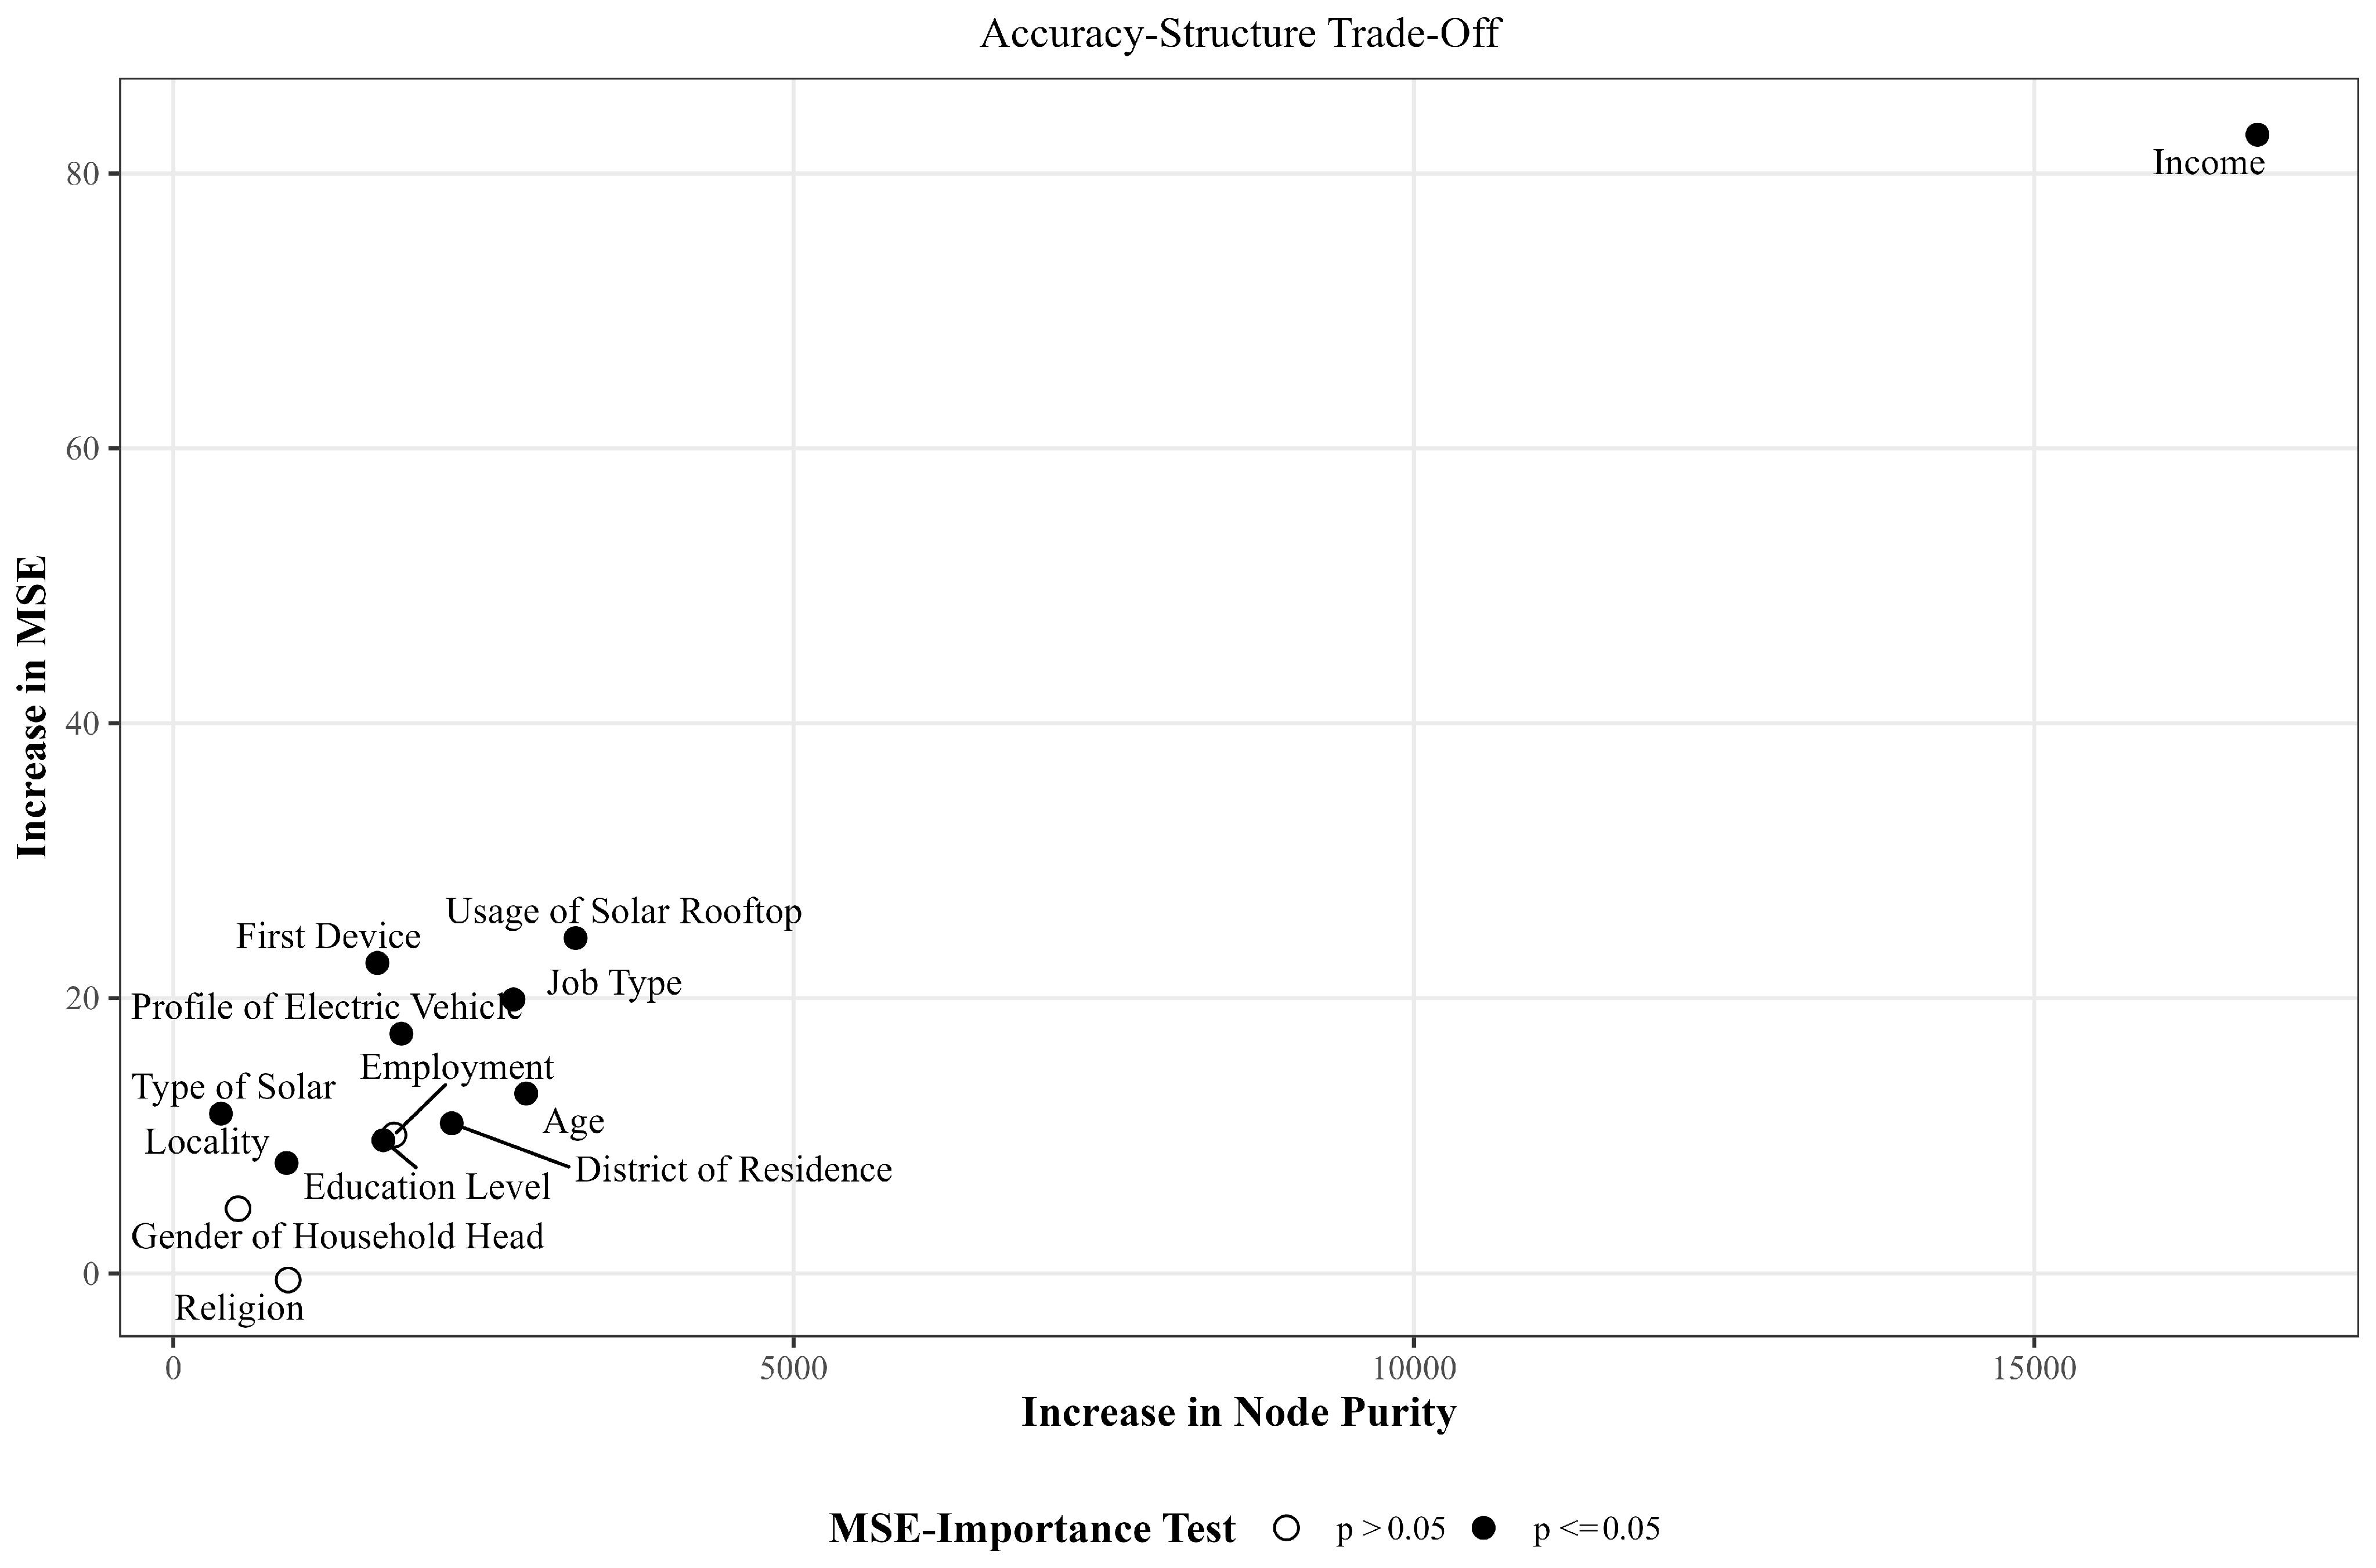
Figure 4 jointly displays the ‘scaled % MSE increase’ and the ‘increase in node purity’. Income occupies the extreme upper-right position, reflecting its dominance on both measures. Job type combines moderate accuracy importance with statistically supported node-purity importance. Other variables contribute through different accuracy–structure combinations, reinforcing the need to interpret the two measures separately.
As illustrated in
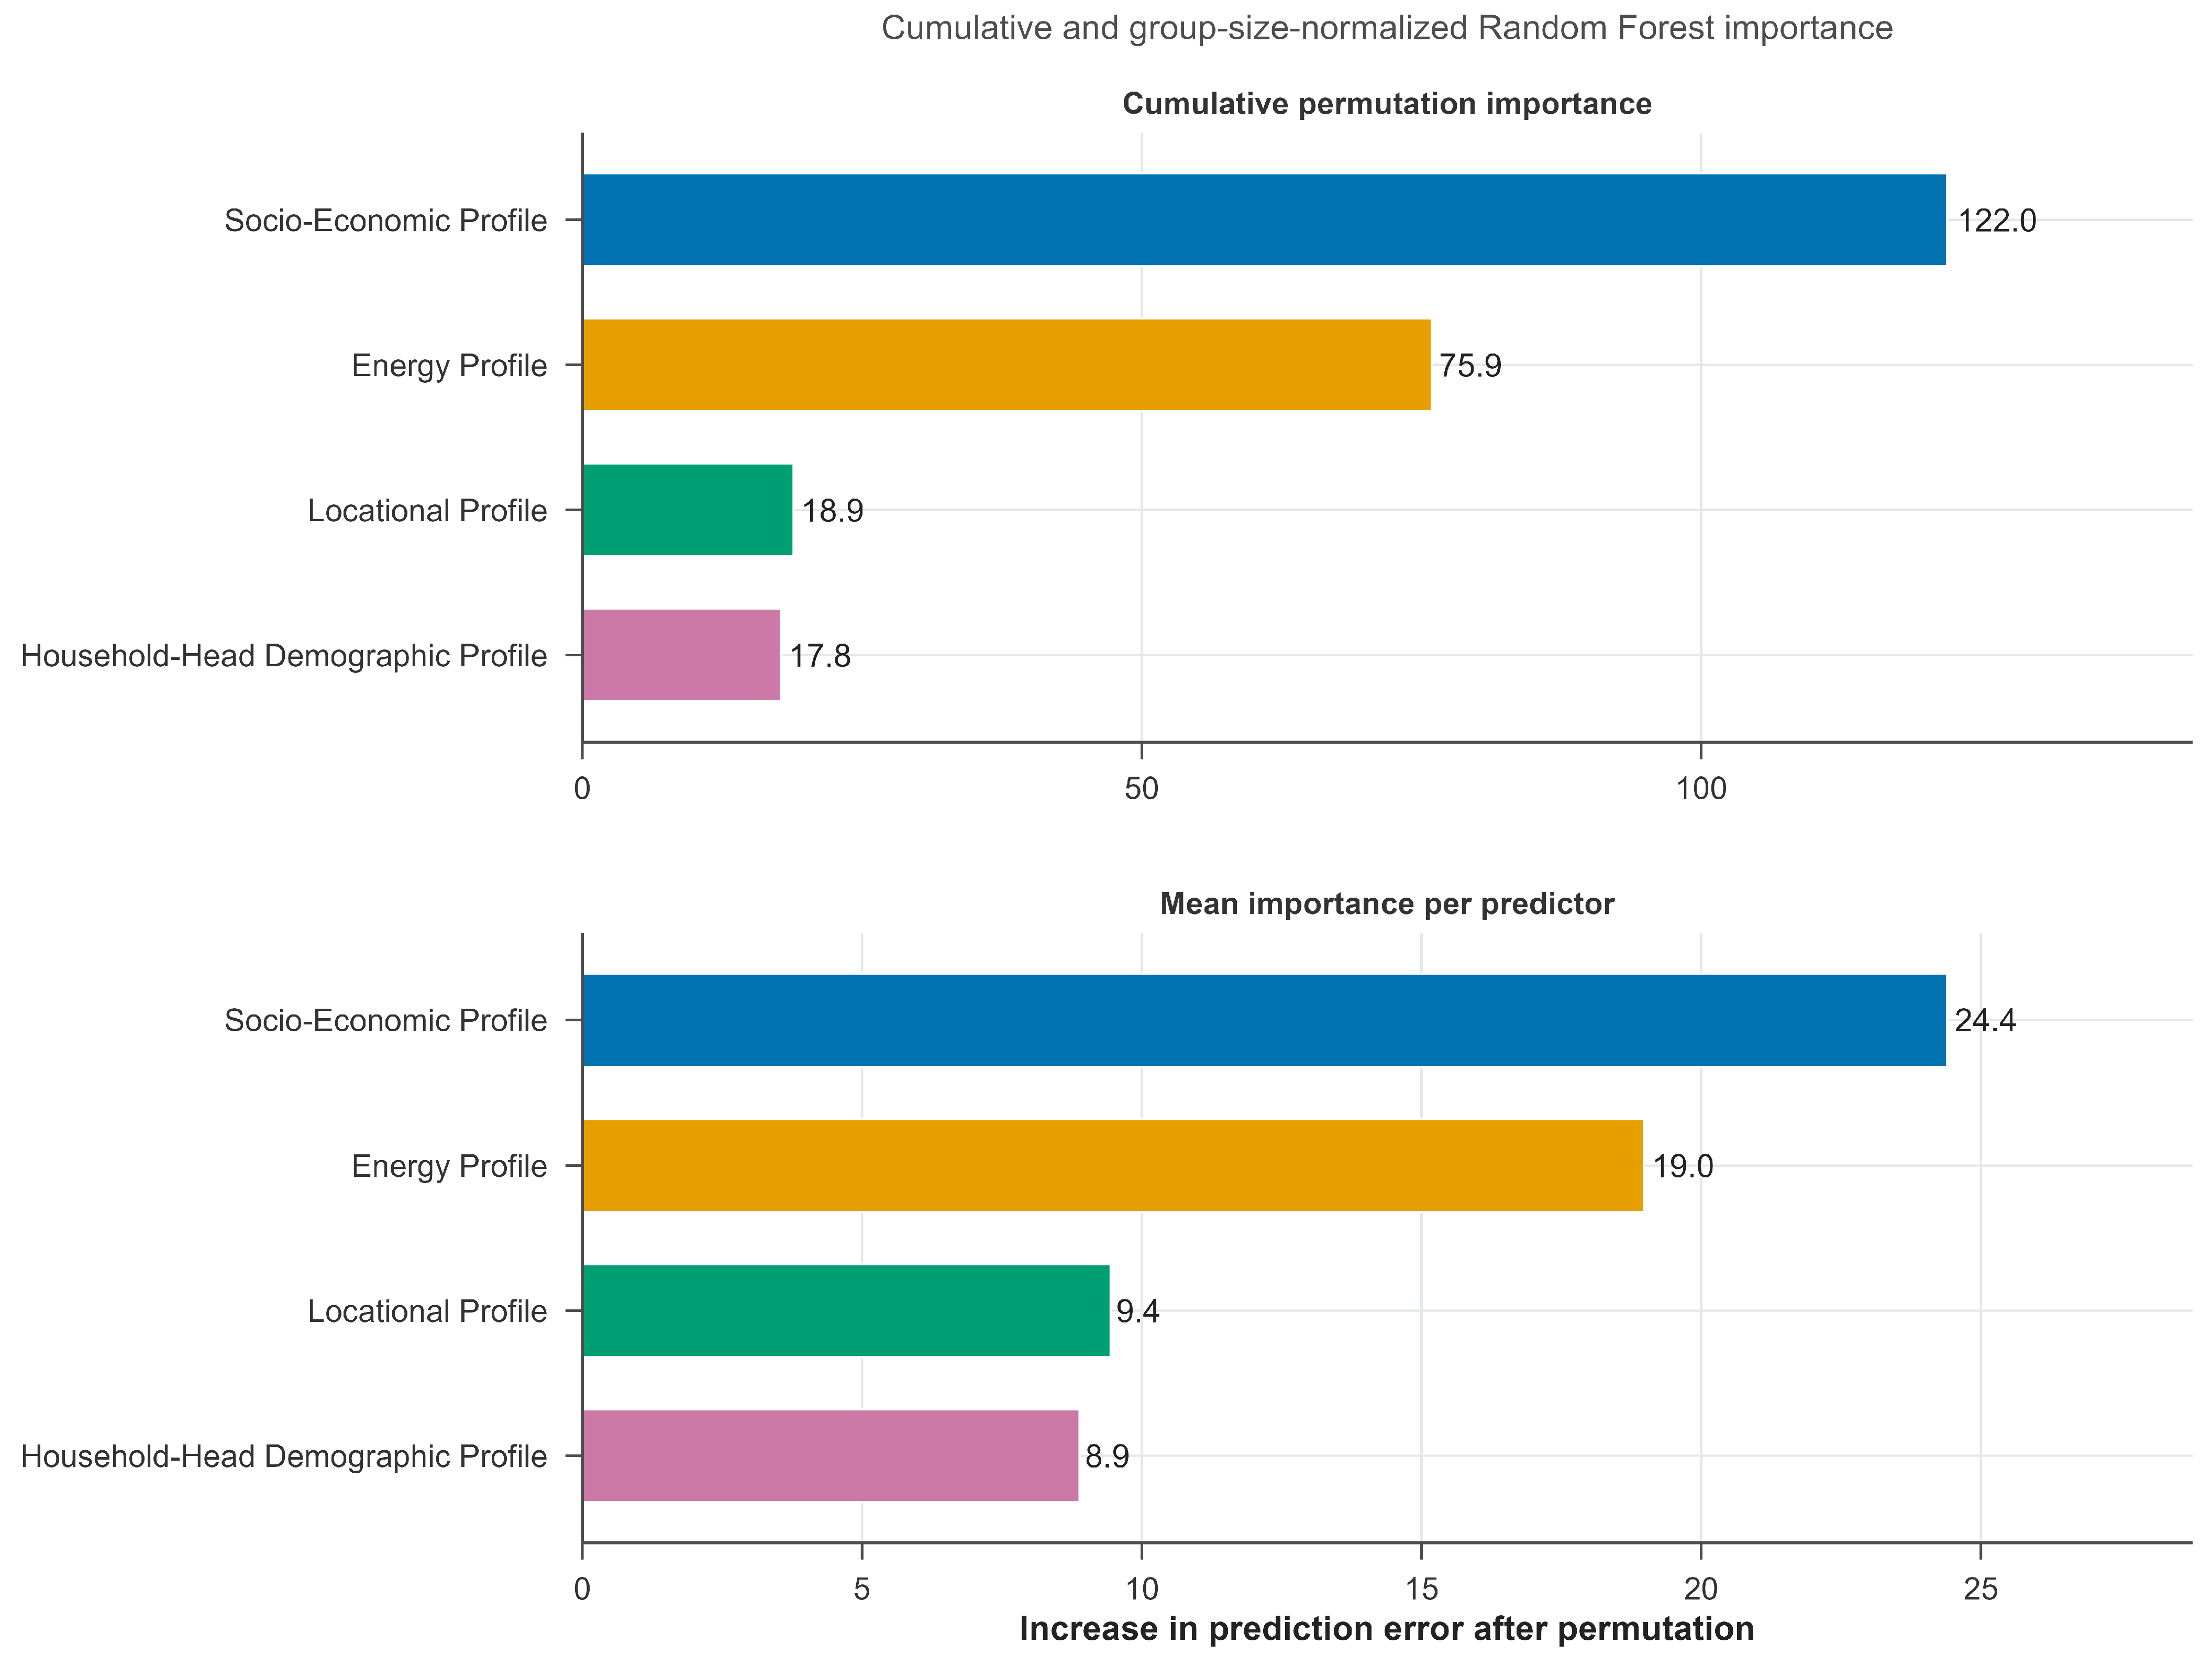
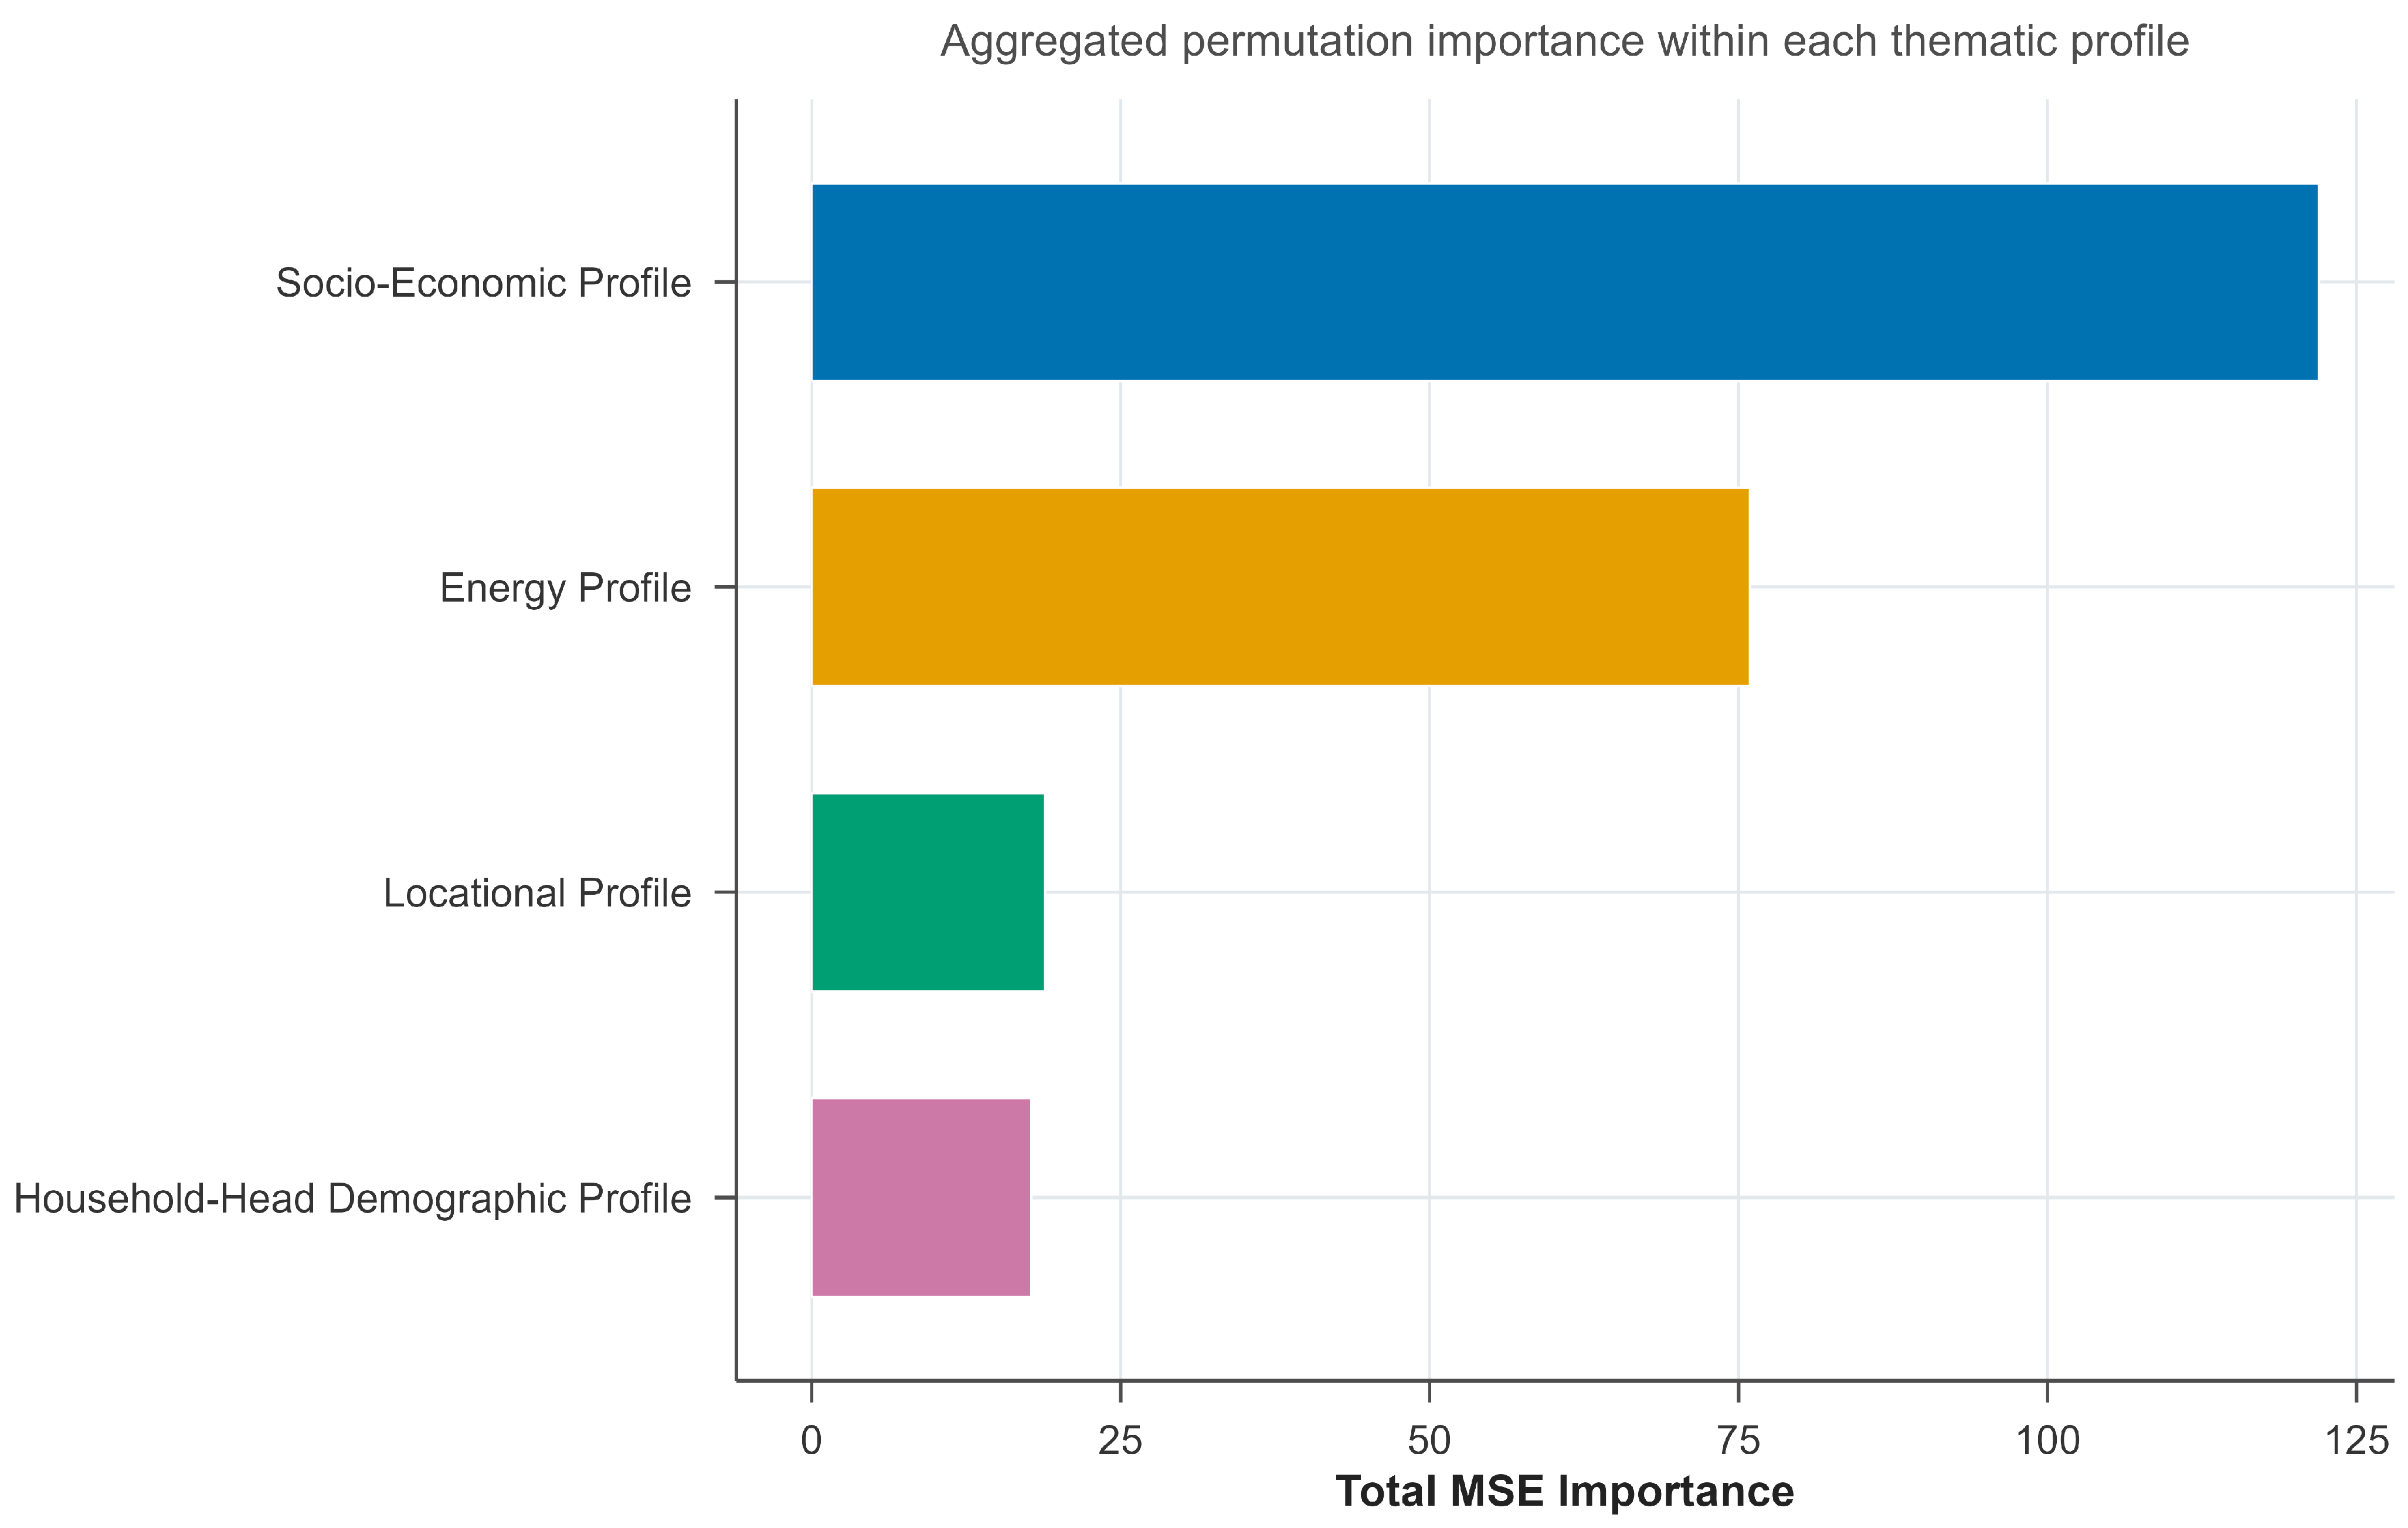
Figure 5, the thematic aggregation confirmed that the socio-economic profile was the most influential domain, with a total MSE increase of 121.973 across four predictors. Since Random Forest importance reflects the contribution of predictors to predictive performance, the cumulative thematic profile provides a grouped interpretation of the broader domains shaping household SDG 7 attainment [
46,
47]. The energy profile ranked second with 75.910 across four predictors, followed by the locational profile (18.890) and household-head demographic profile (17.772). Three socio-economic predictors, all four energy-profile predictors, both locational predictors, and one demographic predictor had significant MSE importance. The grouped results therefore indicate that socio-economic capability and energy use pathways dominate, while location and household-head characteristics provide smaller but non-negligible contributions. Thus, the cumulative factor model indicates that household SDG 7 attainment is driven primarily by socio-economic capability and household energy practices rather than by geography and personal demographics [
46,
47].
5.8. Structural Analysis: Thematic Fingerprint and Nonlinear Behaviour of Income
As income has been identified as the most important predictor, it is essential to understand exactly how income affects the SDG 7 attainment of the household. Therefore, to understand how SDG 7 attainment is predicted by income while keeping the effect of all other variables averaged out, a partial dependence plot has been used [
46]. The partial dependence plot detects nonlinear thresholds and interaction patterns directly from the data [
50].
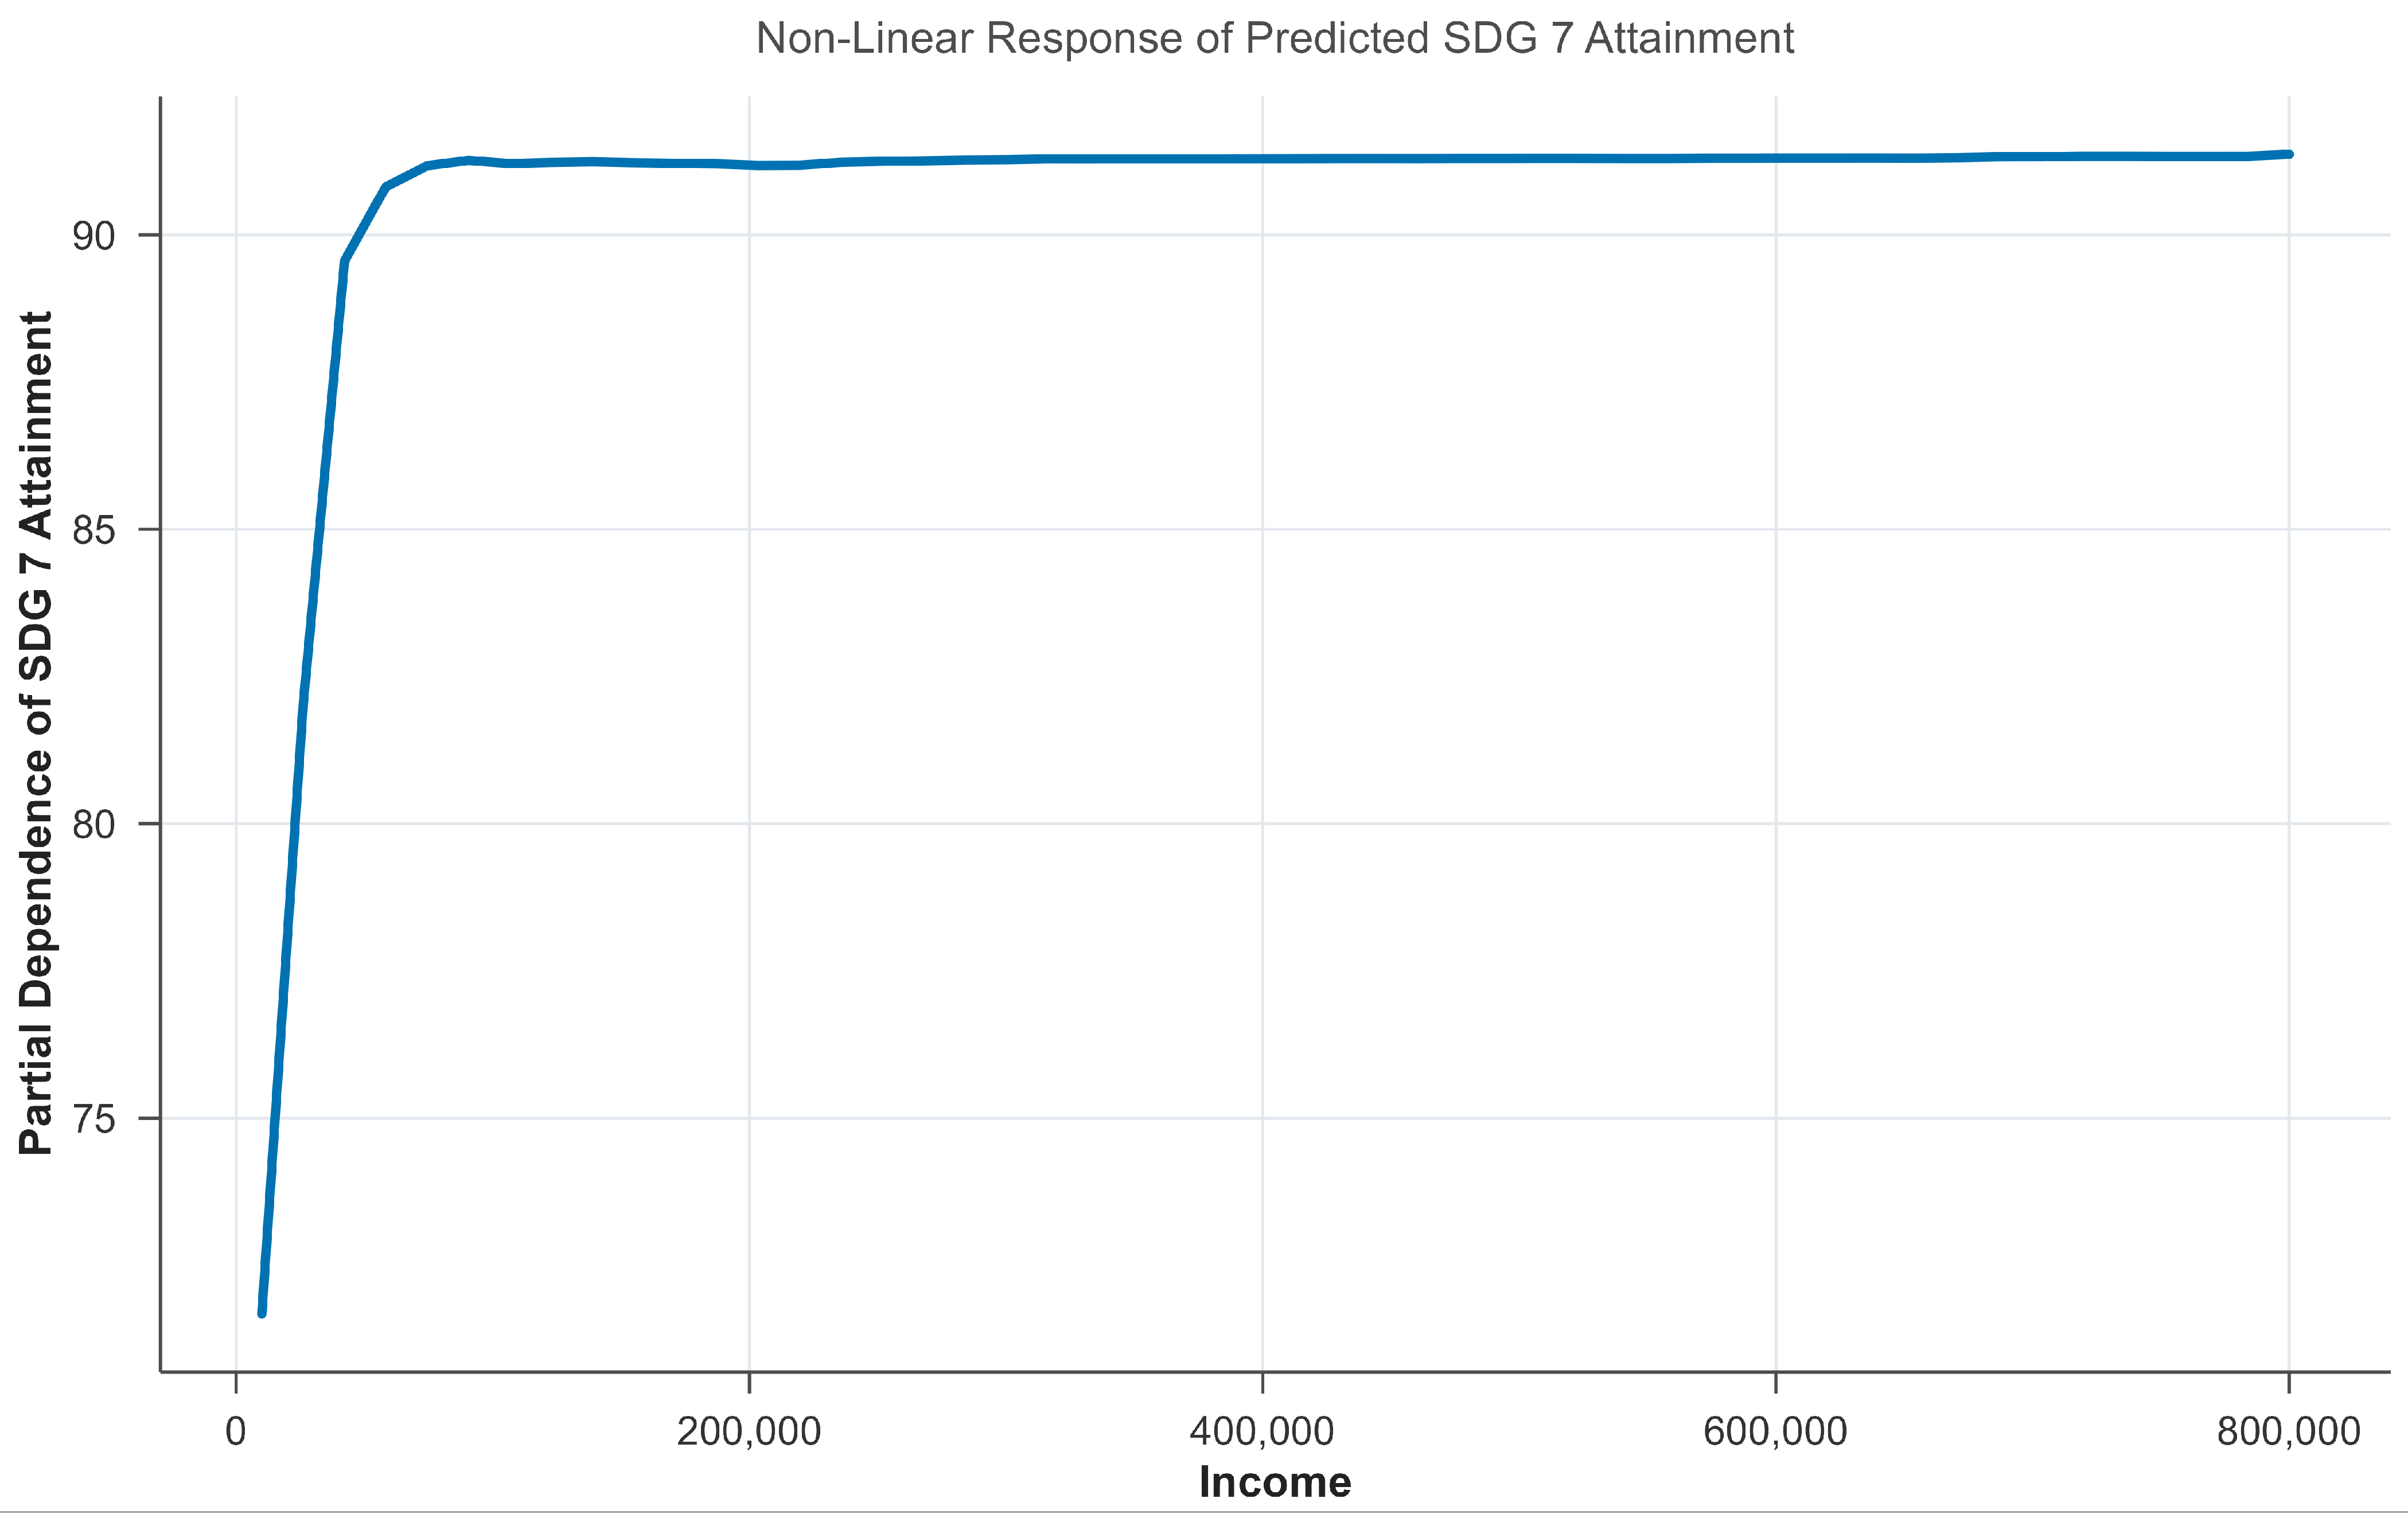
Figure 6 shows that the predicted attainment increased from approximately 71.68 at a monthly income of ₹10,000 to 82.03 at about ₹26,000 and 89.56 at about ₹42,000. It reached approximately 90.82 by ₹58,000 and then remained close to 91 across the higher-income range. The curve therefore shows a steep association at lower income levels followed by a broad plateau. This is a model-based marginal pattern and should not be interpreted as a causal effect or as a universal income-eligibility threshold.
5.9. Local Interpretability: Household-Level Pathways and Case-Based Decomposition
While the global variable importance analysis identifies the major determinants of household SDG 7 attainment at the model level, it does not explain how the predicted score of a specific household is constructed. Therefore, the next step of the analysis is to examine the local interpretability of the Random Forest model. Local interpretability is useful because it decomposes the predicted SDG 7 attainment score of an individual household into the contribution of each predictor and thereby shows how different household characteristics collectively shape the final prediction. In the present study, local explanation was carried out using the DALEX and iBreakDown framework, which allows the Random Forest prediction to be translated into household-level additive contributions of the explanatory variables [
48,
49].
Table 8 presents the local decomposition for ten selected households. In the DALEX/iBreakDown decomposition, 88.670 is the expected Random Forest prediction over the analytic background/reference data supplied to the explainer. It is not the observed score of the focal household. Each household prediction equals 88.670 plus the positive and negative contributions of its predictor values. Thus,
Table 8 provides a household-level decomposition of the Random Forest prediction and explains why one household obtains a higher or lower predicted SDG 7 attainment score relative to the model base value [
48,
49].
Income was the largest local contributor in most cases. It contributed positively in Cases 1, 3, 4, 5, 7, 8, 9, and 10, but negatively in Cases 2 and 6. Case 6 had the lowest predicted score among the selected households (83.837) and the lowest observed score (65.000); income contributed −6.692, education level −1.364, and profile of electric vehicle −1.606, while usage (+2.277) and first device (+1.798) partly offset these effects. Cases 3 and 4 had the highest predicted scores (96.621 and 96.980), supported by positive contributions from income, district of residence, usage, and first device. The di-rection and magnitude of the same predictor varied across households, demonstrating that the model does not impose a single uniform pathway.
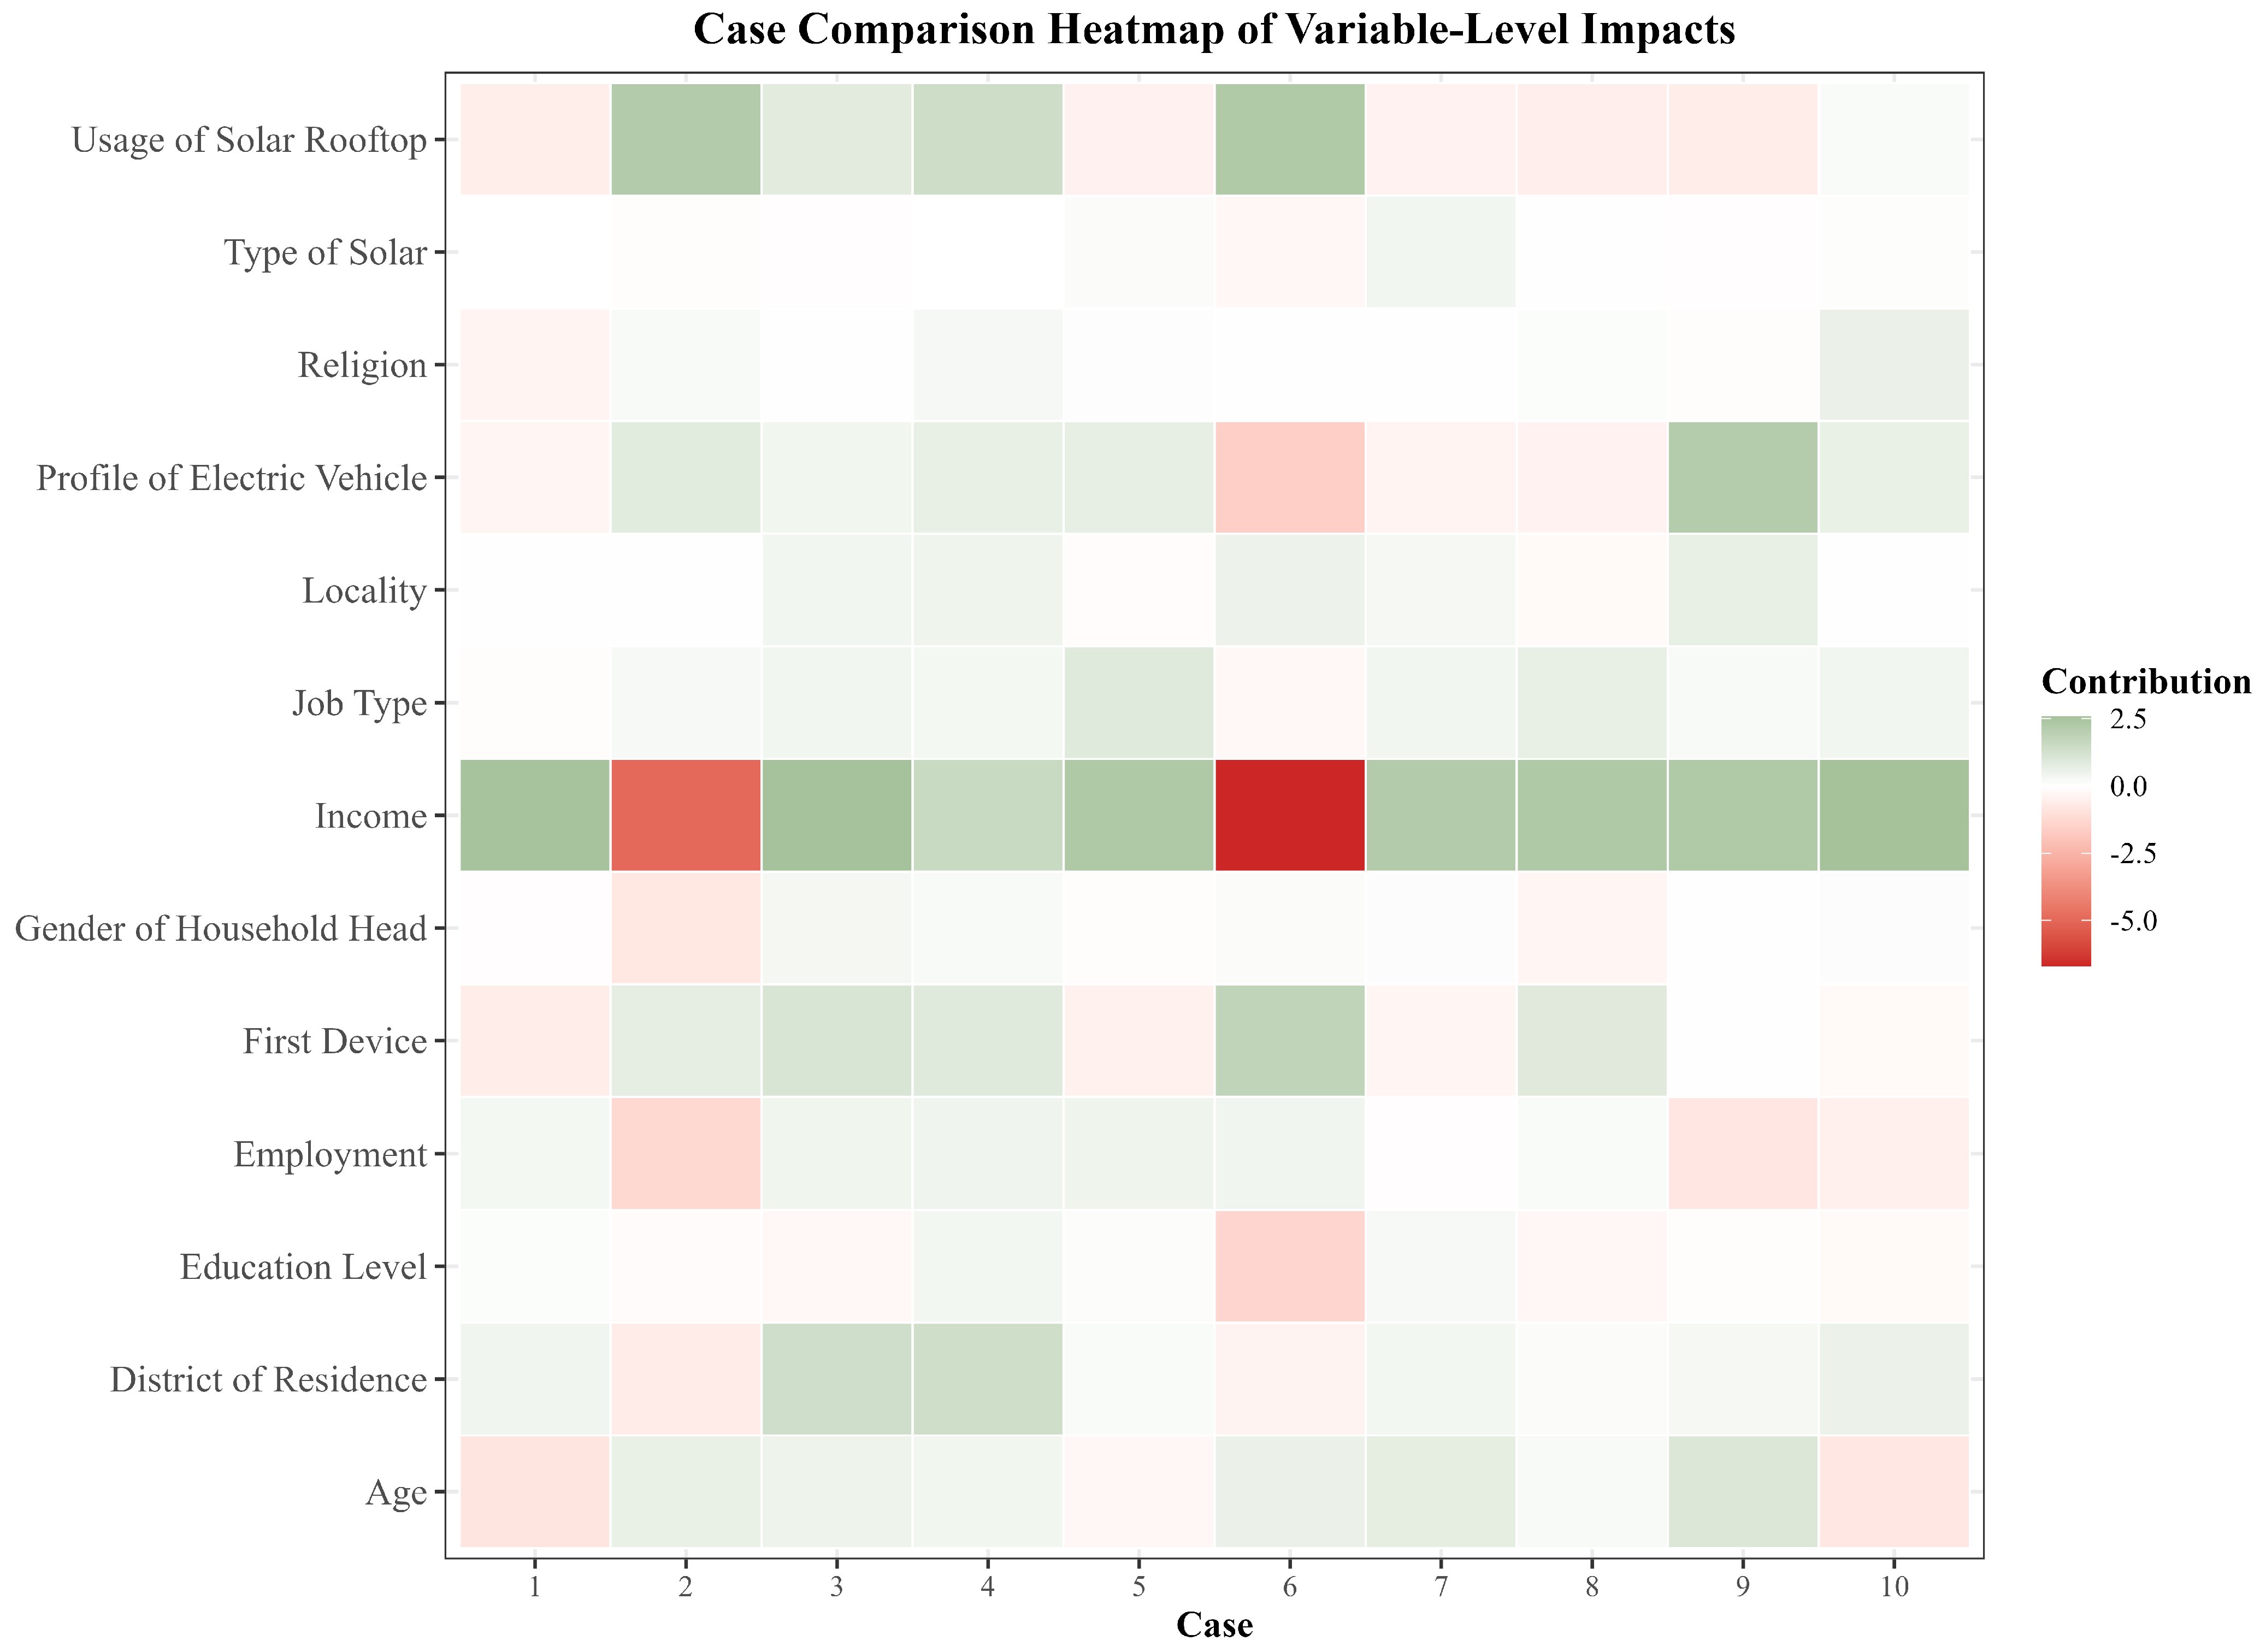
Figure 7 presents the heatmap of predictor contributions for the ten cases reported in
Table 8. Positive values increase the prediction and negative values reduce it, enabling direct comparison of household-specific pathways. The heatmap shown in
Figure 7 serves as a comparative visual summary of the local explanation results presented in
Table 8 and helps to identify cross-case patterns in the structure of the Random Forest predictions [
48,
49].
The heatmap confirms that income has the strongest local variation, with the largest negative contribution in Case 6 and substantial positive contributions in most other cases. Usage, district of residence, first device, education level, and profile of electric vehicle also change direction across households. The figure therefore highlights heterogeneity in the model explanations rather than a uniform effect for each predictor.
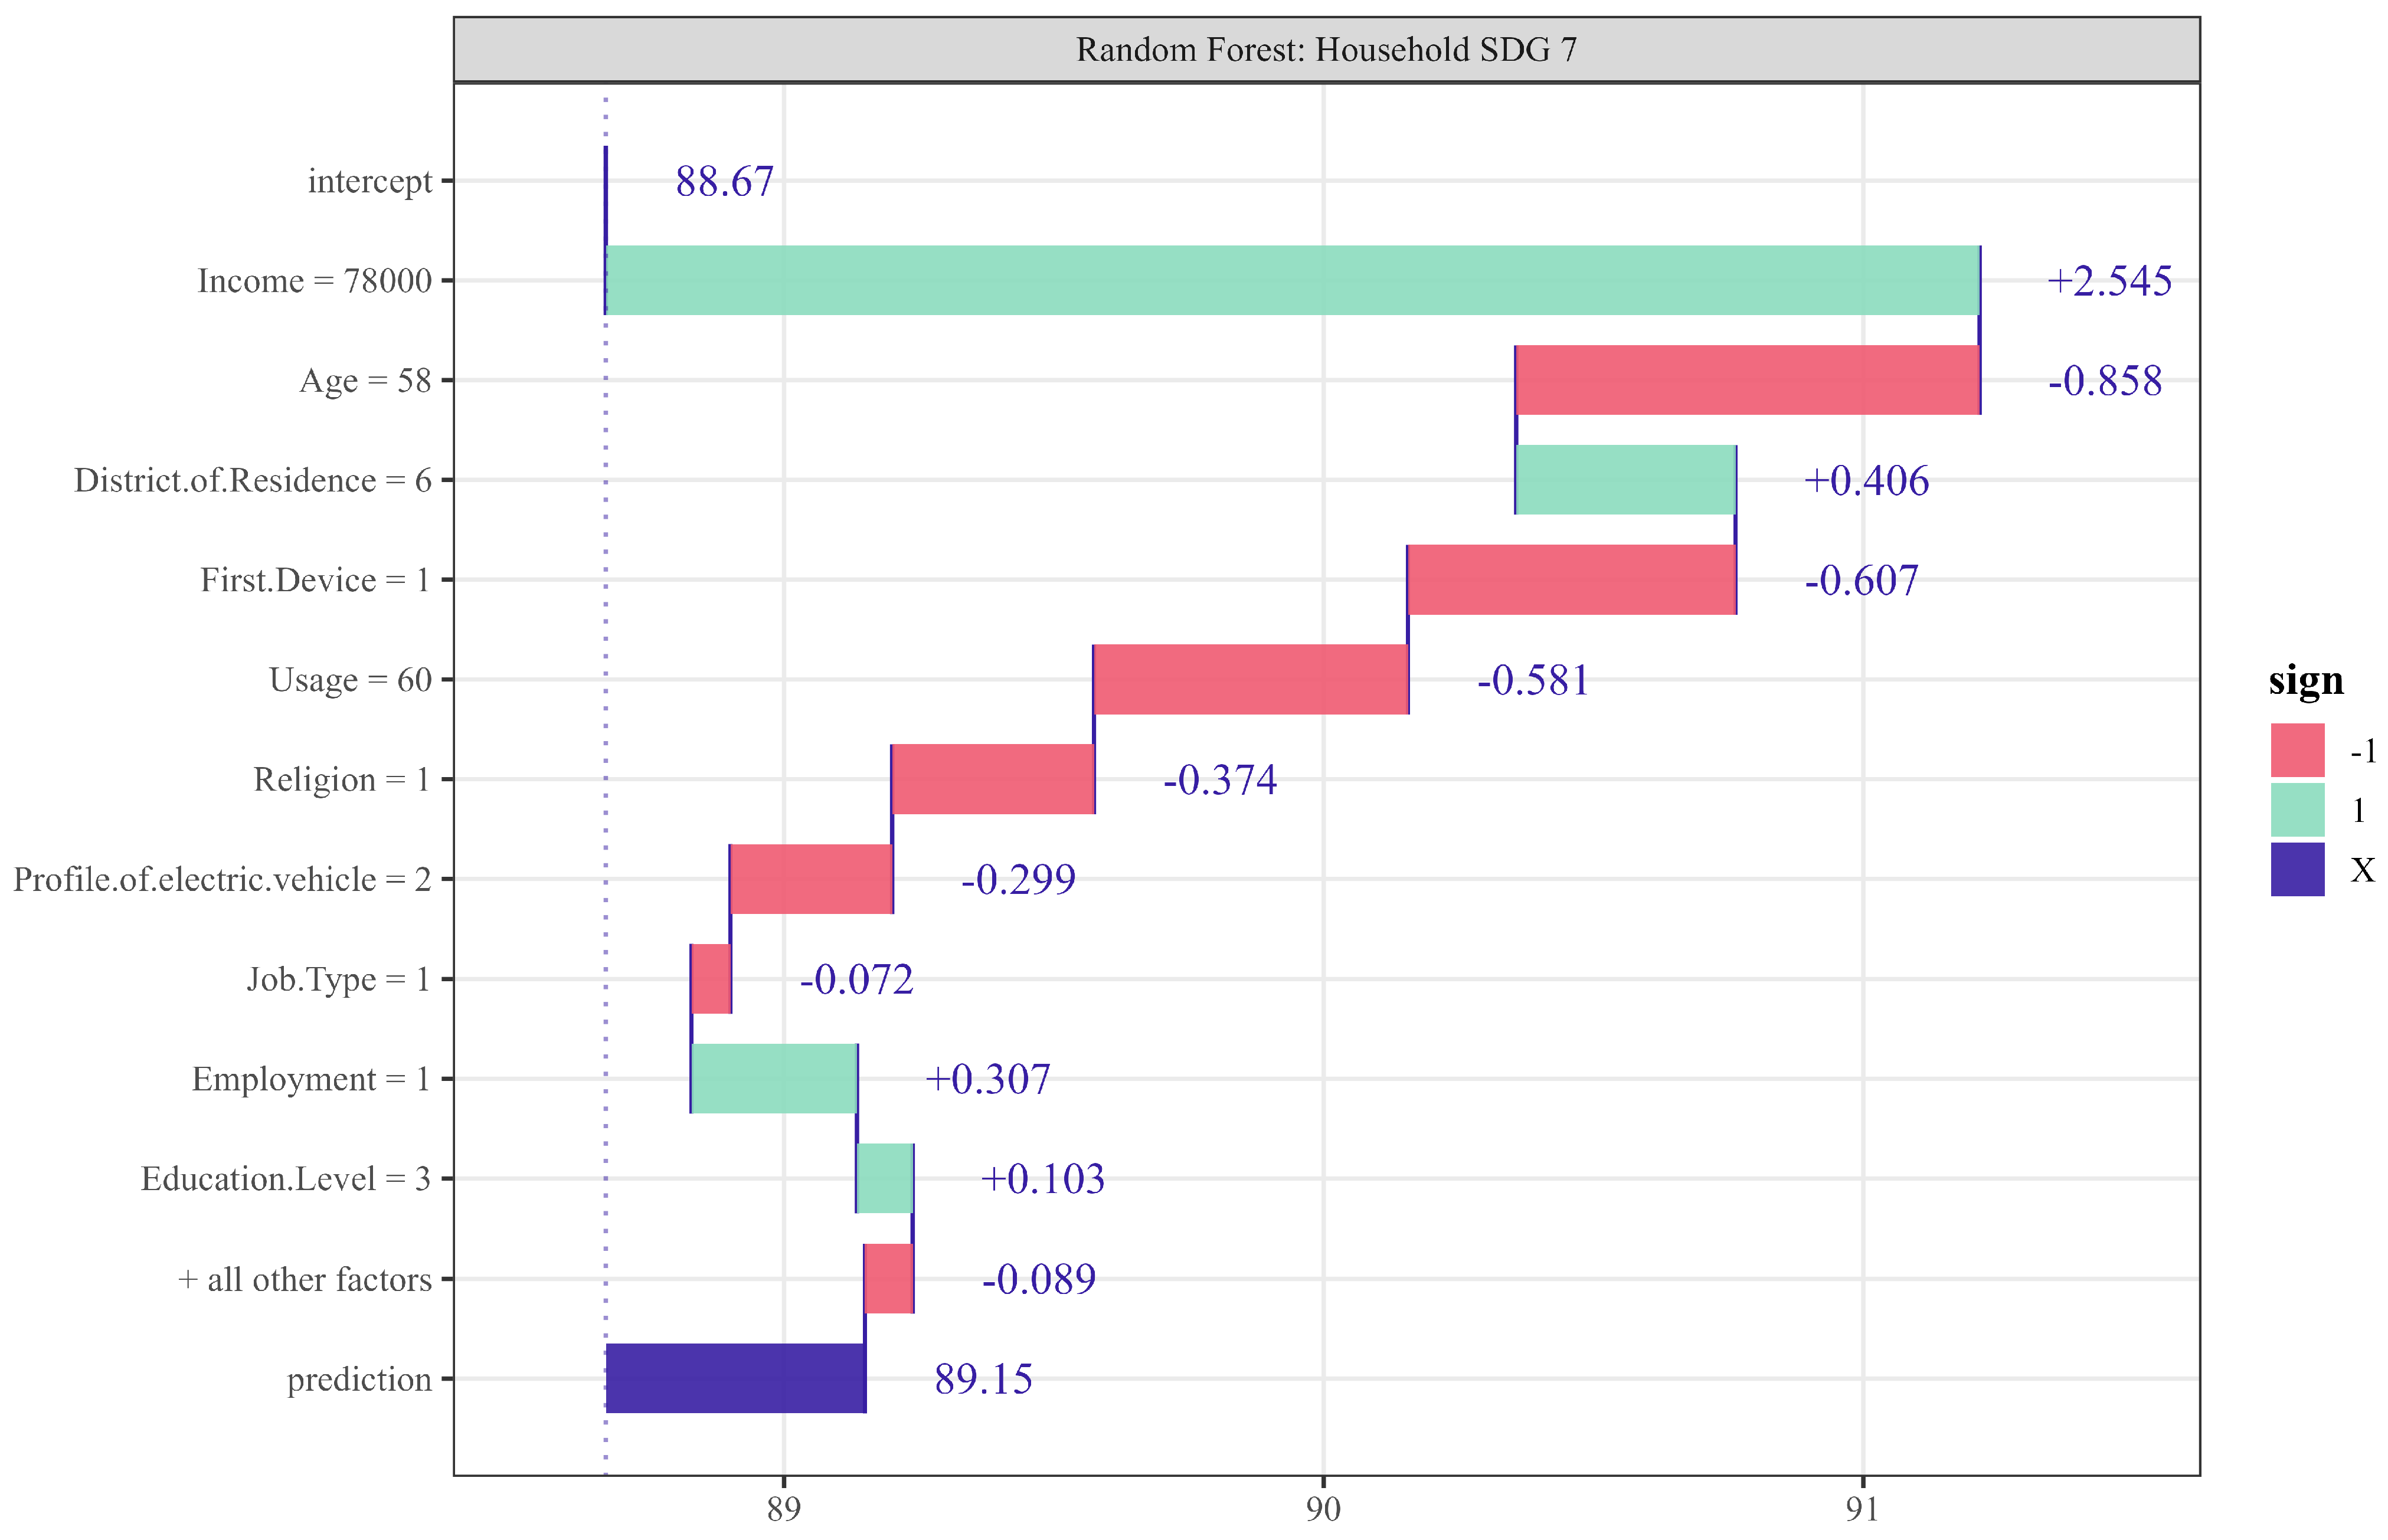
To provide a more detailed explanation of the local structure of prediction, a waterfall breakdown of SDG 7 attainment for a specific case (Case 1) was used. The waterfall plot provides a case-specific explanation of how the final predicted score of a household is constructed from the combined action of its explanatory variables [
48,
49].
Figure 8 presents the waterfall decomposition for Case 1. The explanation starts from the base value of 88.670 and sequentially adds the predictor contributions to obtain the final predicted score of 89.150.
For Case 1, income was the strongest positive contribution (+2.545), followed by district of residence (+0.406), employment (+0.307), and education level (+0.103). The largest negative contributions were age (−0.858), first device (−0.607), usage of solar rooftop (−0.581), religion (−0.374), and profile of electric vehicle (−0.299). These effects produced a predicted score of 89.150 compared with an observed corrected score of 86.580.
Table 8, alongside
Figure 7 and
Figure 8, shows that household predictions result from case-specific combinations of socio-economic, locational, demographic, and energy-profile characteristics. Income is the most consistent local driver, but the contribution of other variables varies in direction and magnitude. Local explanation therefore complements global importance by showing how predictors operate for particular households.
6. Discussion
6.1. Rooftop Solar as a Household SDG 7 Pathway
The corrected results indicate that rooftop solar households had a high average level of household SDG 7 attainment. The mean score was 88.81 (95% bootstrap confidence interval: 88.00–89.52), and the median and mode were both 93.33. However, scores ranged from 50.00 to 99.33 and the distribution retained a lower-attainment tail. Rooftop solar adoption should therefore not be treated as equivalent to complete or uniform attainment.
This interpretation is important because the present study does not follow a counterfactual or before–after causal design. Therefore, the findings should not be interpreted as evidence that rooftop solar caused SDG 7 attainment. Rather, the evidence shows that rooftop solar households demonstrate high SDG 7 attainment, while there were also households remaining constrained by affordability, reliability, sustainability, income, location, or energy use pathway differences. This is consistent with the theoretical position of the study, where rooftop solar deployment is treated as the empirical context for measuring SDG 7 attainment, not as a proxy for attainment. Installation of rooftop solar does not assure SDG 7 attainment by the installing household because households may still face affordability stress, unreliable electricity service, low renewable contribution relative to total energy use, or unequal benefits across socio-economic and locational groups [
3,
26].
6.2. Measurement Contribution: Moving Beyond Binary Access
A major contribution of the study is that it moves SDG 7 monitoring from binary access measurement to household-level attainment measurement. Official SDG 7 indicators remain important for national and international monitoring, but they mainly describe population-level access and do not fully capture the quality, cost, and sustainability of energy experienced by individual households [
1]. The literature section clearly shows that electricity connection or clean cooking access alone may overstate SDG 7 status when households continue to experience high energy burden, frequent outages, voltage instability, or low renewable contribution in the household energy basket [
1,
5,
10,
11].
The Household SDG 7 Index addresses this measurement gap by converting SDG 7 into a household-level 0–100 score based on affordability, reliability, and sustainability. The affordability pillar measures whether energy remains financially manageable at the household level. The reliability pillar captures the service quality of the energy source by taking into account the outage frequency, outage duration, and voltage fluctuation experienced by the household. Finally, the sustainability pillar measures the renewable share of total household energy after converting electricity and fuels into comparable energy units. Therefore, the index improves SDG 7 monitoring by moving from the traditional binary indicators [
3,
5] to a more meaningful measure of how well household energy needs are met.
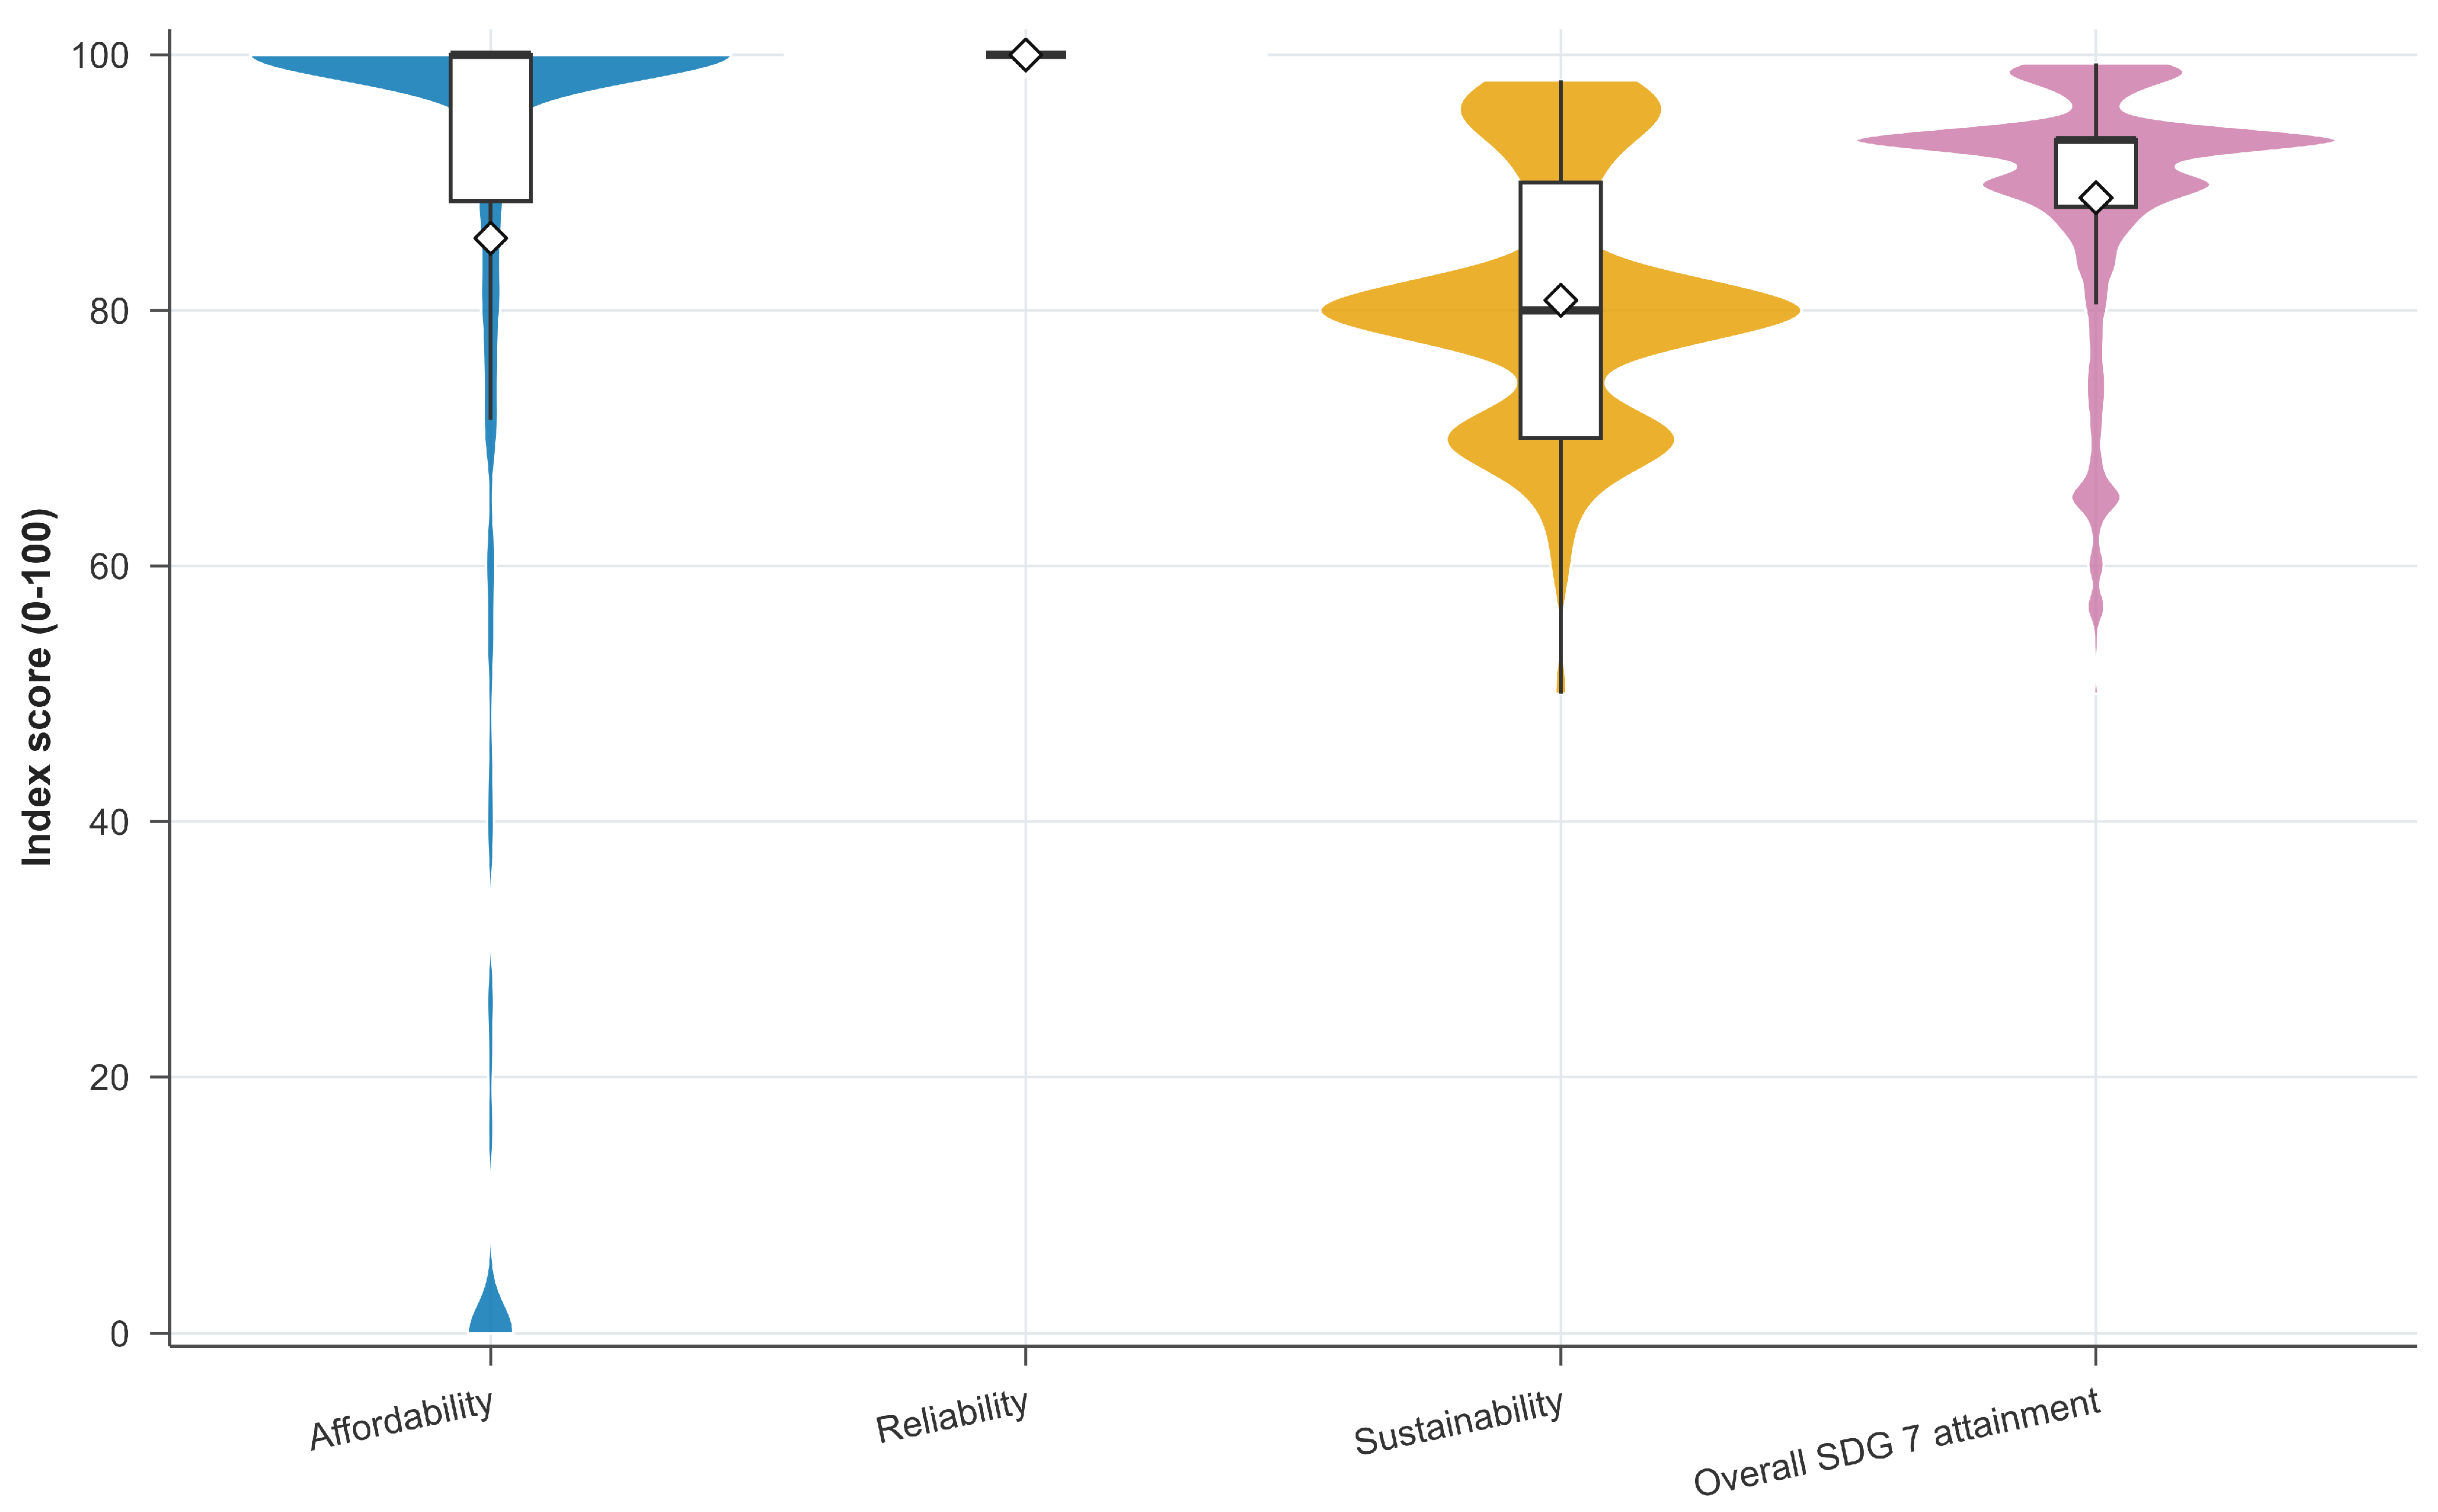
Figure 9 shows that the reliability aspect is concentrated near the upper limit, whereas affordability and sustainability exhibit greater variation. In
Figure 9, the boxplots indicate medians and interquartile ranges, while diamonds indicate means. Therefore, the differences in the overall household SDG 7 attainment are mainly associated with affordability and sustainability.
The robustness analysis strengthens this measurement contribution. Reasonable alternative threshold specifications preserved the broad distribution and produced rank correlations of at least 0.941, but the lenient affordability specification changed membership for 22 of the 132 baseline lower-attainment households. The Monte Carlo analysis similarly showed that most classifications were stable, while a smaller group near the lower-tail boundary remained uncertain. The index is therefore appropriate for broad household diagnosis and screening, but close scores and boundary classifications should be accompanied by uncertainty information and, where policy eligibility is involved, further verification.
6.3. Income as the Gatekeeper of SDG 7 Attainment
The central substantive finding of the study is that income operates as the primary gatekeeper of household SDG 7 attainment. Random Forest identified that the income of the rooftop solar-adopting household recorded the highest MSE increase of 82.852 (
p = 0.001) and a node-purity increase of 16,799.819 (
p = 0.001). This indicates that income is the strongest accuracy-based statistically significant predictor for SDG 7 attainment in the Random Forest model. The dominance of income is also visually evident in the individual importance plot (See,
Figure 3) and in the accuracy–structure trade-off plot (See,
Figure 4), where income is isolated from other predictors and occupies the extreme upper-right position.
This finding is theoretically meaningful because the Household SDG 7 Index operationalises affordability, reliability, and sustainability as its core components. Income directly affects affordability because it determines whether households can absorb energy expenditure without crossing affordability thresholds. It also indirectly affects reliability because households with stronger socio-economic capacity may be better able to maintain rooftop systems, manage repair costs, respond to reliability problems, and invest in cleaner technologies. Further, income supports sustainability because households with higher capacity can integrate renewable energy more effectively into their total energy use. This confirms the theoretical expectation that income directly affects affordability and indirectly affects the household’s capacity to maintain systems, manage reliability deficits, and invest in cleaner technologies [
5,
9,
14].
The local explanations support this interpretation while also showing household heterogeneity. Income was positive in eight of the ten selected cases and negative in Cases 2 and 6. Case 6 had a predicted score of 83.837 and an observed score of 65.000; its income contribution was −6.692, compared with positive contributions from usage (+2.277) and first device (+1.798). Cases 3 and 4 had the highest predictions, 96.621 and 96.980, and both received positive contributions from income, district, usage, and first device. Thus, income disadvantage may offset favourable energy-profile characteristics, but model predictions should still be interpreted as associations rather than causal effects.
6.4. Energy Profile and Geography as Supporting Pathways
After income, the energy profile formed the second most influential thematic domain, with a total MSE increase of 75.910. Usage of solar rooftop (24.364,
p = 0.001), first device (22.557,
p = 0.001), profile of electric vehicle (17.401,
p = 0.001), and type of solar (11.588,
p = 0.003) all had statistically supported permutation importance. These findings indicate that SDG 7 attainment is associated not only with financial capacity but also with how households configure and use their energy technologies. Similar conclusions have been drawn by Schulte et al. [
30]: perceived benefits, behavioural factors, and adoption-related attitudes are important in residential photovoltaic adoption. Their meta-analysis indicates that solar adoption is not merely a technical decision but is shaped by household-level perceptions, benefits, and usage-related pathways.
Further, the results are aligned with the conceptual framework, where the energy profile includes solar usage experience, type of solar system, first solar device adopted, and electric vehicle profile. These variables are included because household energy outcomes depend not only on whether a technology is adopted, but also on how long it has been used, how the system is configured, how it interacts with household electricity demand, and whether additional electricity loads such as electric vehicles affect self-consumption, grid dependence, and affordability [
3,
25,
35].
Geographical location had a smaller but statistically supported contribution. District of residence recorded an MSE increase of 10.892 (
p = 0.031), and locality recorded 7.998 (
p = 0.023). Their household-level effects were context-specific; district contributed positively in most selected cases but negatively in Cases 2 and 6. Geography should therefore be interpreted as a supporting pathway reflecting differences in infrastructure, grid quality, service availability, and spatial energy conditions. This indicates that the geography should not be interpreted as irrelevant. District and locality may matter because energy infrastructure, grid quality, service availability, and spatial energy injustice may differ across places [
10,
11,
43].
6.5. Nonlinear Policy Meaning of the Income Threshold
Figure 6 shows a strong increase in predicted attainment across the lower-income range, followed by a plateau of approximately 91 points after monthly income reaches roughly ₹60,000–₹75,000 in the partial-dependence grid. This turning region is descriptive and model dependent. It should not be interpreted as a causal income effect or as a universal policy cut-off. Similarly, the turning point visible in the plot should not be treated as a universal income cut-off without external validation [
50].
This interpretation is consistent with recent evidence on the distributional effects of rooftop solar. Forrester et al. [
9] found that rooftop solar reduced household energy burden for most adopters, including low- and moderate-income households, but the extent of the benefit varied according to income, region, financing arrangement, and off-bill solar costs. Some households experienced increased energy burden when loan or lease payments exceeded bill savings. Their findings support the present interpretation that income affects a household’s capacity to convert rooftop solar adoption into an affordable energy outcome; ownership of the technology alone does not ensure an equal financial benefit across households.
The result also has an energy-justice implication. A systematic review of 87 studies found that residential rooftop solar adoption remains concentrated among more affluent households and that some incentive arrangements have regressive distributional effects. The review therefore recommends directing subsidies and related support more explicitly towards lower-income households [
59]. The International Energy Agency similarly observes that lower-income households may be excluded from clean-energy transitions when they cannot meet upfront investment requirements, even where clean technologies provide longer-term affordability benefits [
8].
Accordingly, the results support progressive attention to households in the lower-income segment, where income differences are most strongly associated with predicted attainment. For households located on the higher-income plateau, non-income constraints such as energy use practices, system suitability, and local service conditions may deserve greater attention. The partial-dependence pattern should be used as a diagnostic guide rather than as a fixed eligibility boundary.
6.6. Explainable Machine Learning as a Policy Diagnostic Tool
The explainable machine learning framework strengthens the analytical contribution of the study by moving beyond the prediction of household SDG 7 attainment towards an explanation of the factors underlying each prediction. Global variable importance identifies the predictors that matter across the sample, while partial dependence reveals the nonlinear relationship between income and predicted attainment. DALEX and iBreakDown extend this interpretation to the household level by showing how individual predictors increase or reduce the predicted SDG 7 score of a particular household [
48,
49,
50]. This distinction is important for policy because households with similar rooftop solar adoption may not experience the same affordability, reliability, or sustainability outcomes. Even the impact of income on SDG 7 attainment is not consistent and shows a diminishing impact. Therefore, the local decomposition helps to pinpoint the variable responsible for the lower SDG 7 attainment, with income constraints, locational conditions, solar-usage patterns, or energy-technology pathways. Thus, the framework converts the Random Forest model from a general predictive tool into a household-level diagnostic mechanism that can support differentiated interventions rather than uniform policy treatment.
9. Limitations
The study is based on cross-sectional data from 659 rooftop solar households; consequently, all identified relationships are predictive associations and should not be interpreted as causal effects. The adopter-only sample does not establish whether adopters attain SDG 7 more effectively than non-adopters. The composite index assigns equal weight to affordability, reliability, and sustainability, although the relative im-portance of these dimensions may vary across contexts. The threshold sensitivity analysis evaluates a defined ±20% range and does not prove that the baseline thresholds are universally optimal. Likewise, the Monte Carlo intervals are conditional on assumed 5%, 10%, and 15% measurement-error scenarios because repeated observations and empirically calibrated error distributions were unavailable. Household expenditure, fuel consumption, outage experience, and voltage fluctuation may contain recall or reporting error. Random Forest, importance measures, partial dependence, DALEX, and iBreakDown explain model-based predictive patterns rather than causal mechanisms. Finally, the upper-end concentration of the index may reduce discrimination among households with already high attainment. The cross-sectional design also leaves temporal ordering unresolved. The reported relationships should therefore be interpreted as conditional predictive associations rather than causal effects.
10. Future Research
Future research should validate the Household SDG 7 Index across more diverse household and energy contexts. The index may be applied to both rooftop solar adopters and non-adopters so that differences in affordability, reliability, sustainability, and overall SDG 7 attainment can be directly compared. Future validation should compare the equal-weight baseline with prespecified policy scenarios and weights elicited independently from households, energy experts, utilities, and policymakers. Longitudinal studies with before and after rooftop solar installation design would provide stronger evidence on how household energy conditions change over time. The use of alternative predictive models, viz., Gradient Boosting, XGBoost, Support Vector Regression, and interpretable generalized additive models, may be compared with Random Forest to assess the stability of the predictor rankings and nonlinear relationships. This can enhance the reliability and validity of the findings. When suitable comparison or panel data become available, matching, difference-in-differences, and other causal-inference approaches may be used to distinguish the contribution of rooftop solar deployment from pre-existing household characteristics.