1. Introduction
The Xinjiang Uyghur Autonomous Region, China’s largest provincial-level administrative division at approximately 1.66 million km
2, occupies the heartland of Eurasia and serves as a critical node of the Belt and Road Initiative [
1]. Tourism has become a major driver of regional economic transformation, receiving over 300 million visitors and generating RMB 355.2 billion in tourism revenue in 2024 [
2]. This expansion occurs in one of the world’s most water-scarce and ecologically fragile environments: precipitation is sparse and unevenly distributed, settlements are confined to discontinuous oasis corridors, and tourism growth competes with agriculture and ecosystems for limited water and land resources [
3,
4,
5]. Accommodation establishments are among the most spatially fixed and resource-intensive components of tourism supply; their location choices determine not only market performance but also the environmental sustainability of destination development [
6,
7]. Understanding the locational determinants of accommodation and their spatial interaction structure in arid frontier regions is thus both a scientific question and a planning necessity.
Theoretically, the spatial organization of accommodation can be grounded in central place theory and location theory [
8,
9,
10]. Central place theory predicts that service facilities arrange hierarchically according to market thresholds and ranges: higher-order, capital-intensive establishments concentrate in larger urban centers, while lower-order establishments fill peripheral settlements [
8]. Location theory further posits that service facilities trade off transport costs, market accessibility, and land rent, producing predictable spatial regularities—standardized, capital-intensive hotels anchor at the thickest markets such as central business districts and transport nodes [
8,
9,
10]. Hotel location research has repeatedly confirmed these regularities, from early analyses of tourist location preferences to formal theories of intra-urban hotel location [
9,
10]. These classical frameworks anticipate a market hierarchy in which urban centrality, population density, and transport accessibility constitute the primary gravitational fields shaping accommodation location.
Empirical studies of traditional hotels broadly support these expectations. Early point-pattern analyses documented concentrated, center-oriented hotel distributions [
8]; historical case studies traced the co-evolution of hotel location with urban structure and tourism development [
10]; accessibility-based models and concentric-zone models have been validated in multiple cities [
8,
9]. Recurring determinants include transport accessibility and commercial agglomeration, with high-grade and mid-to-high-quality hotels concentrating around transport infrastructure and commercial centers [
11,
12,
13,
14]. Chinese evidence is illustrative: intra-urban analyses of Urumqi have traced the agglomeration of high-grade hotels along transport corridors and commercial centers [
11,
12,
13,
14]. However, most evidence remains at the intra-urban scale [
9]: how these regularities operate at regional scales, across discontinuous oases, mountain corridors, and peripheral destinations, is largely unknown.
Agglomeration economies provide a complementary explanation for why accommodation clusters and why their segments differentiate [
8]. Co-located hotels benefit from localization economies—specialized labor pools, shared supplier networks, and knowledge spillovers—and urbanization economies—diversified amenities, infrastructure, and visitor flows [
8,
9]. However, agglomeration returns are uneven across accommodation types. Standard hotels primarily exploit urbanization economies in city centers, whereas non-standard accommodation—homestays, guesthouses, and agritourism lodges—tends to follow resource-oriented location logics in which natural and cultural assets compensate for thinner local markets [
15]. The Tourism Area Life Cycle (TALC) further predicts that as destinations evolve from exploration through development to consolidation, the accommodation mix shifts from small-scale, resource-dependent establishments toward larger, market-oriented properties, generating divergent spatial trajectories for the two segments [
16,
17]. Shared accommodation research further confirms that non-standard accommodation exhibits systematically different spatial dynamics across the destination life cycle compared with standard hotels [
18]. Together, these theories imply distinct spatial signatures: standard accommodation tracks urban centrality, while non-standard accommodation tracks tourism resource endowments [
16,
17,
19].
Consistent with this expectation, research on non-standard accommodation—particularly homestays and Airbnb listings—has documented agglomeration around scenic areas, transport infrastructure, and culturally distinctive sites. Studies of rural homestays around Beijing identified significant clustering around scenic spots and transport hubs [
20]; Chongqing homestays exhibit a “single-pole, multi-core” structure driven jointly by tourism resource endowments and urban centrality [
21,
22,
23]; comparisons between star-rated hotels and Airbnb in Shanghai revealed divergent spatial logics between standardized and sharing-economy formats within the same urban system [
24,
25,
26,
27]; and the Barcelona case further confirmed that shared accommodation spatial distribution is jointly constrained by tourist attractions and urban morphology, displaying complementary rather than overlapping patterns with traditional hotels [
28]. However, evidence from arid regions of western China remains scarce, and whether non-standard accommodation is systematically more resource-dependent than traditional hotels has rarely been tested at regional scales.
A further theoretical consideration concerns functional form. Classical location models typically assume linear or log-linear driver–response relationships, yet both location theory and evolutionary economic geography suggest that spatial processes are inherently nonlinear and path-dependent [
19,
29]. Market-size thresholds imply that below a critical demand level, investment risk deters entry; above it, agglomeration returns accelerate clustering [
19]. In arid regions, water-body proximity may impose a near-deterministic constraint on resort-type development, producing sharp thresholds rather than smooth gradients. Evolutionary economic geography emphasizes that such thresholds originate from historically contingent, self-reinforcing processes: early entry creates spatial lock-in, subsequent entrants face increasing costs of deviation, and small differences in initial conditions can produce large, divergent spatial outcomes [
19,
30]. Path creation and institutional trigger events in destination evolution further suggest that tourism spatial patterns are not the product of equilibrium processes but the superposition of critical junctures and cumulative causation [
29,
30]. These arguments imply that linear specifications may misidentify driver–response relationships, necessitating interpretable nonlinear methods to recover the underlying spatial-economic mechanisms.
Methodologically, advances in interpretable machine learning and local spatial analysis provide new tools for accommodation geography. The XGBoost–SHAP framework has been widely applied in tourism geography, land-use analysis, and environmental science [
31,
32,
33,
34,
35,
36]; extensions of the co-location quotient capture localized, asymmetric spatial associations between categorical point patterns [
37,
38]. What remains scarce is their staged integration in arid-region accommodation systems—chaining description (NNI, SDE, KDE), decomposition (OPTICS, LCLQ), and explanation (XGBoost–SHAP) into a coherent analytical pipeline, systematically implemented across the full matrix of nine accommodation categories × two perspectives.
Synthesizing the above literature and theoretical analysis, this study identifies five critical gaps: (1) Geographic scale—most empirical studies are confined to single cities or provinces, lacking regional-scale analyses capable of capturing the full spatial heterogeneity of vast, internally diverse territories [
3,
39]; (2) Methodology—linear regression frameworks may produce misleading conclusions by ignoring nonlinear relationships, threshold effects, and complex interactions among drivers [
40,
41]; (3) Theme—standard and non-standard accommodation are rarely integrated within a unified analytical framework, and category-specific nonlinear driving mechanisms have not been systematically decomposed; (4) Spatial association—asymmetric spatial signals (where the prior establishment of one category may directionally influence the subsequent location decisions of another) remain largely unexplored [
42,
43]; (5) Sustainability—the ecological thresholds and spatial planning implications of accommodation expansion in arid regions have not been quantified.
To address these gaps, this study poses three research questions: Q1—What spatial distribution patterns do nine accommodation categories exhibit in Xinjiang, and how do their agglomeration–dispersion characteristics differentiate by type and quality? Q2—Do directional spatial associations exist among categories, and is their hierarchical structure consistent with central place theory and path-dependence expectations? Q3—Which drivers shape these patterns, do their effects exhibit nonlinear thresholds, and can these thresholds provide spatially explicit reference points for sustainable tourism planning?
2. Materials and Methods
2.1. Study Area
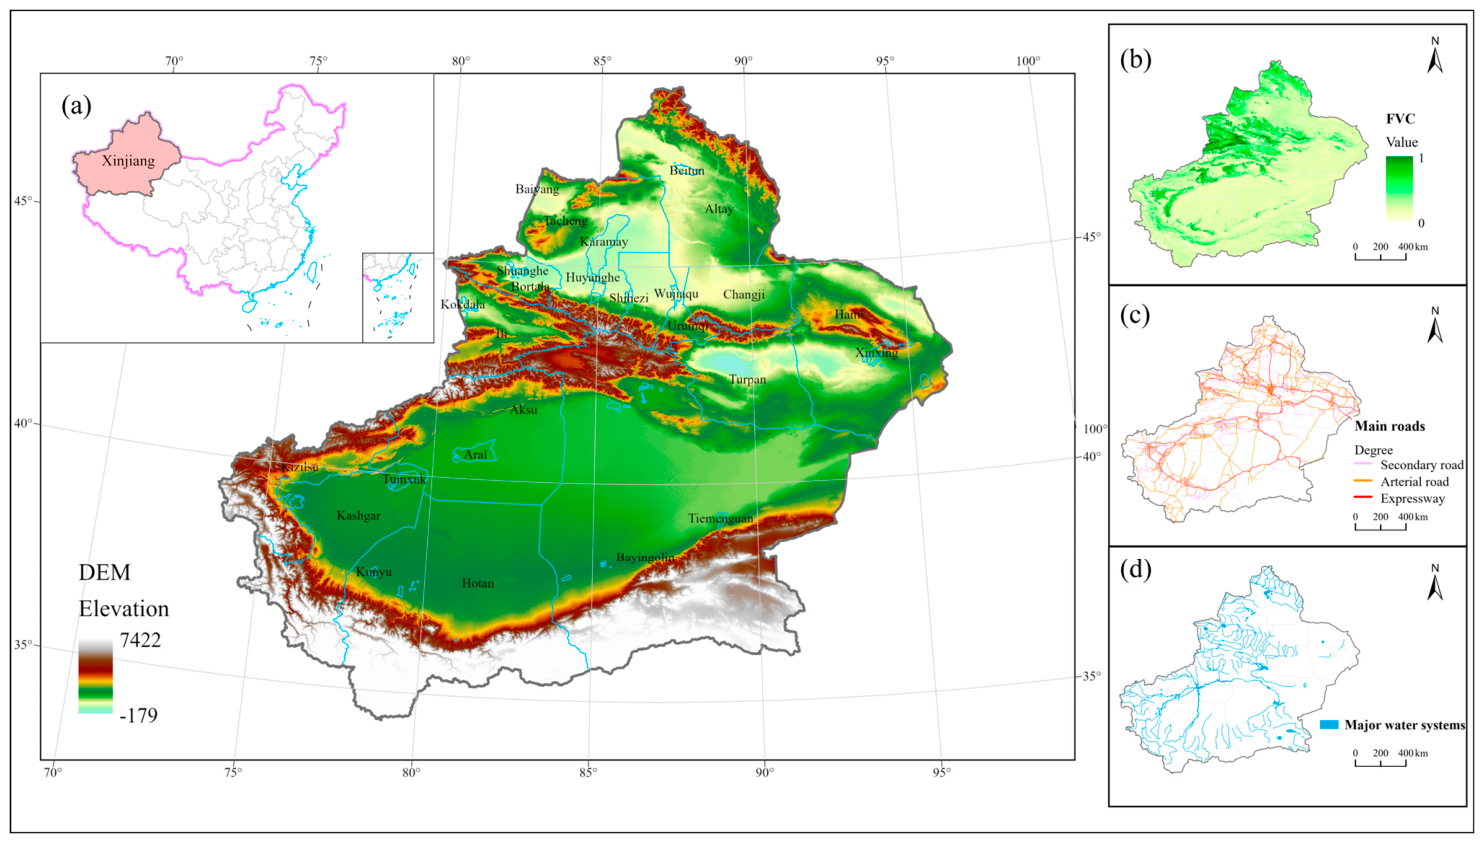
Xinjiang Uyghur Autonomous Region is located in the Eurasian hinterland (73°32′–96°21′ E, 34°22′–49°33′ N) and covers approximately 1.66 million km
2. Its geomorphology is often described as ‘three mountains enclosing two basins’, comprising the Altai Mountains, Junggar Basin, Tianshan Mountains, Tarim Basin and Kunlun Mountains (
Figure 1). This setup is good at generating high spatial variability in climate, hydrology and ecosystem vulnerability. The Oasis settlements are more or less discontiguous along the piedmont alluvial fans and riverbeds, and in contrast to the Gobi and the desert hinterlands, they limit settlement, mobility and tourism development.
The development of tourism in Xinjiang has been rapid. In 2023, the region received 265.44 million tourist visits and RMB 296.715 billion in tourism revenue, year-on-year increases of 117.04% and 226.93% [
44]. In 2024, the number of arrivals had surpassed 300 million, and the spending had reached RMB 359.5 billion. This boom drove the supply-side restructuring, with hotel groups opening hotels in Urumqi, Kashgar, Altay, Yining, and over 600 brand hotels opened by 2024 [
45], and the share of star-rated hotels also decreased, leading to diversified and quality-oriented supply.
This shift was supported by policy. The autonomous region added cultural and tourism to the industrial cluster sequence in 2024, making it “nine major industrial clusters” from “eight.” The Three-Year Action Plan for High-Quality Tourism Development (2024–2026) aims to reach 350 million tourists by 2026 and RMB 420 billion, focusing on spatial optimization of accommodation and high-quality hotel clusters. However, the urban-rural imbalance and lack of coordination between standard and non-standard accommodation and mismatch in supply and demand during the different seasons are still not addressed.
For the purposes of accommodation geography, these conditions make Xinjiang a valuable case. The corridors of the Oasis are segments of settlement and tourism within a large-scale desert space with arid conditions [
3,
4]. Given the multi-ethnic population, there are diverse forms that range from chain hotels to yurt encampments and heritage courtyard guesthouses [
46,
47]. This change in the star ratings of hotels relative to the growth of chain and informal accommodations represents an institutional shift [
5,
48].
These conditions—extreme water-resource constraints, oasis fragmentation, multi-ethnic diverse accommodation forms, and the superposition of institutional transition and policy shocks—make Xinjiang a paradigmatic case for sustainable tourism research: the ecological feasibility boundaries of accommodation expansion are most clearly discernible here, and the governance need for category differentiation is most urgent.
2.2. Data Source and Processing
Data on accommodation were obtained from the Ctrip Open Platform. Available online:
https://open.ctrip.com (accessed on 17 January 2026), the biggest OTA in China. The keyword queries included all 17 prefecture-level divisions, and the return information included the facility name, coordinates, address, diamond rating, type and opening year. Cleaning included coordinate validation (records outside of 73–96° E and 34–50° N were excluded), deduplication using coordinate hashing (±0.001°) with fuzzy name matching and manual verification of ambiguous names. The final data set has 12,073 valid establishments, 11,857 (98.2%) of which have information for the first year of operation. Physiographic, accessibility and socioeconomic variables were assembled (
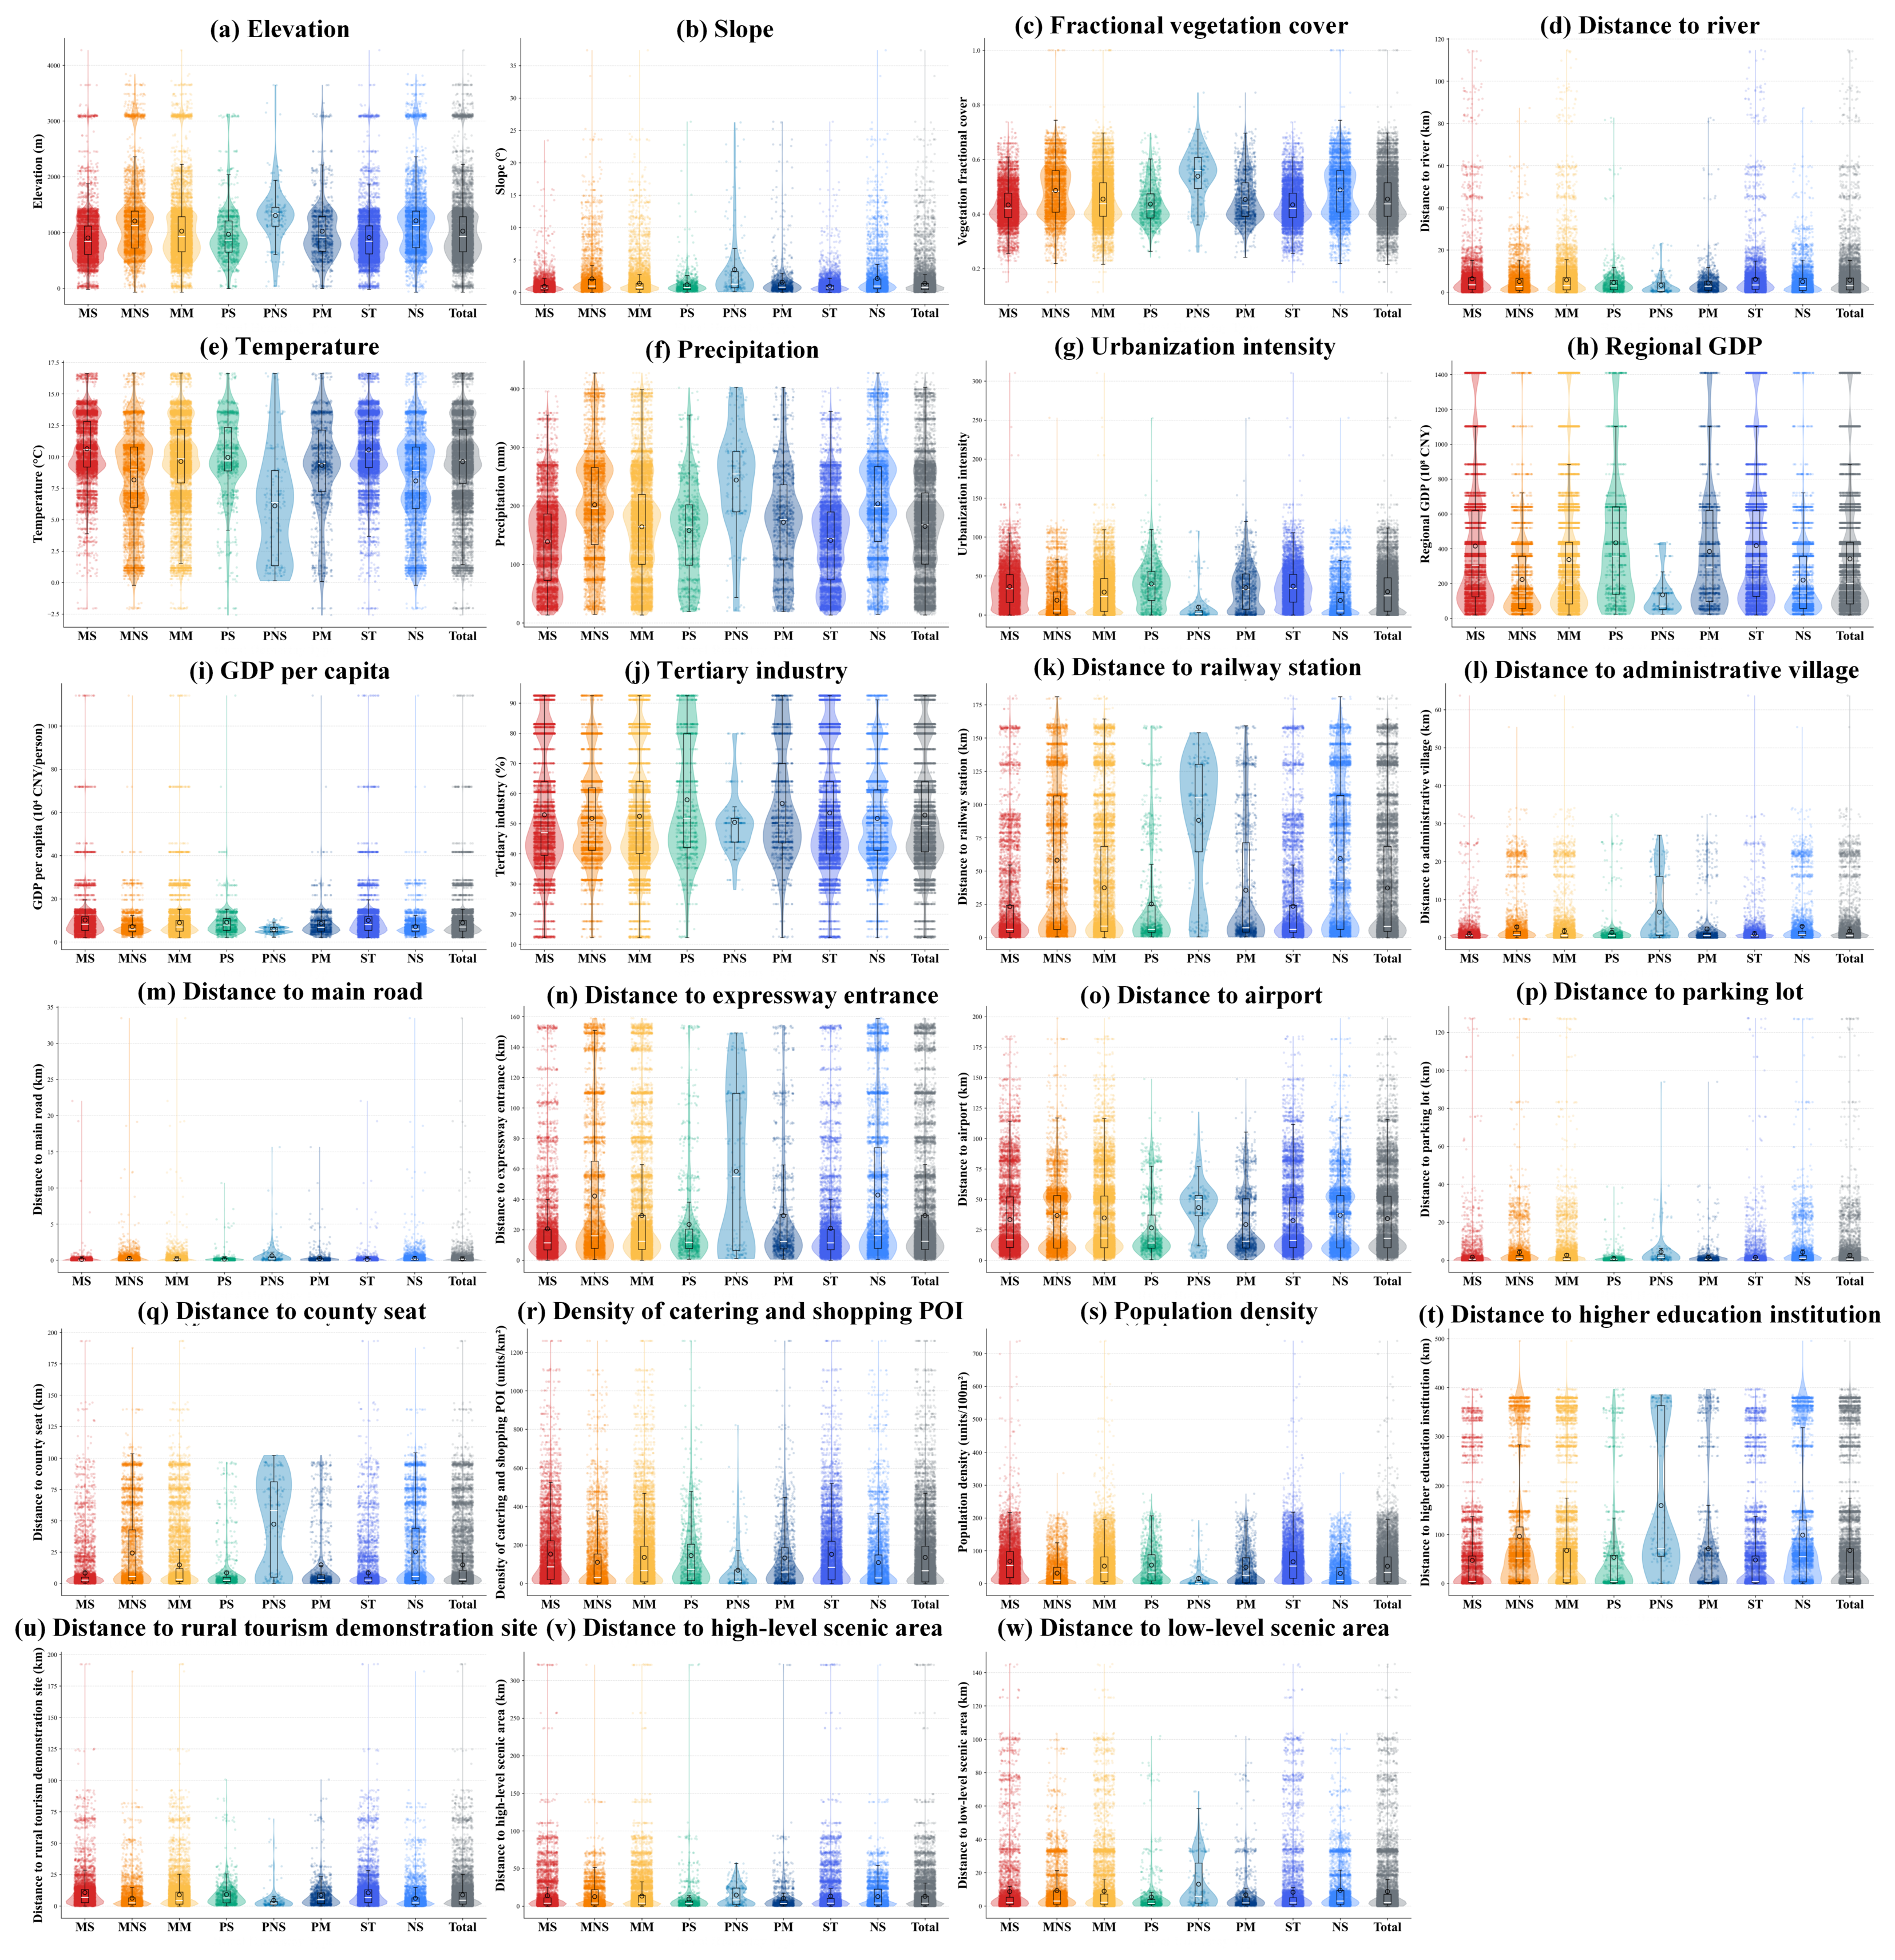
Table 1), such as elevation, slope, vegetation cover, temperature, precipitation, distances from the water and from the road, intensity of urbanization, GDP, share of the tertiary sector, accessibility, population density and distances to the areas that were graded for their scenery. All variables were processed through spatial analysis before being incorporated into the models.
A three-tier hierarchical classification was constructed to capture structural heterogeneity. The first tier distinguishes standard accommodation (n = 7450) from non-standard accommodation (n = 4623). Standard accommodation includes hotels (n = 7189), establishments with ‘binguan’ in their names (n = 229), other standard types (n = 30), and resorts or specialty hotels (n = 2). Non-standard accommodation includes bed-and-breakfasts (n = 4202), inns (n = 108), and other types (n = 313), including youth hostels, agritainment (nongjiale) and serviced apartments. Classification used direct type matching, keyword disambiguation for 242 facilities containing ‘lüguan’ and manual review of remaining ambiguous cases.
The second tier captures quality level. Given the decline in star-rated participation and the frequent exclusion of non-standard accommodation from that system, we used Ctrip diamond ratings (0–5 diamonds), which broadly correspond to star ratings. Economy (0–2 diamonds) and comfort (3 diamonds) categories were merged into a mass-market tier (n = 10,947, 90.67%). Upscale (4 diamonds) and luxury (5 diamonds) categories were merged into a premium tier (n = 1126, 9.33%).
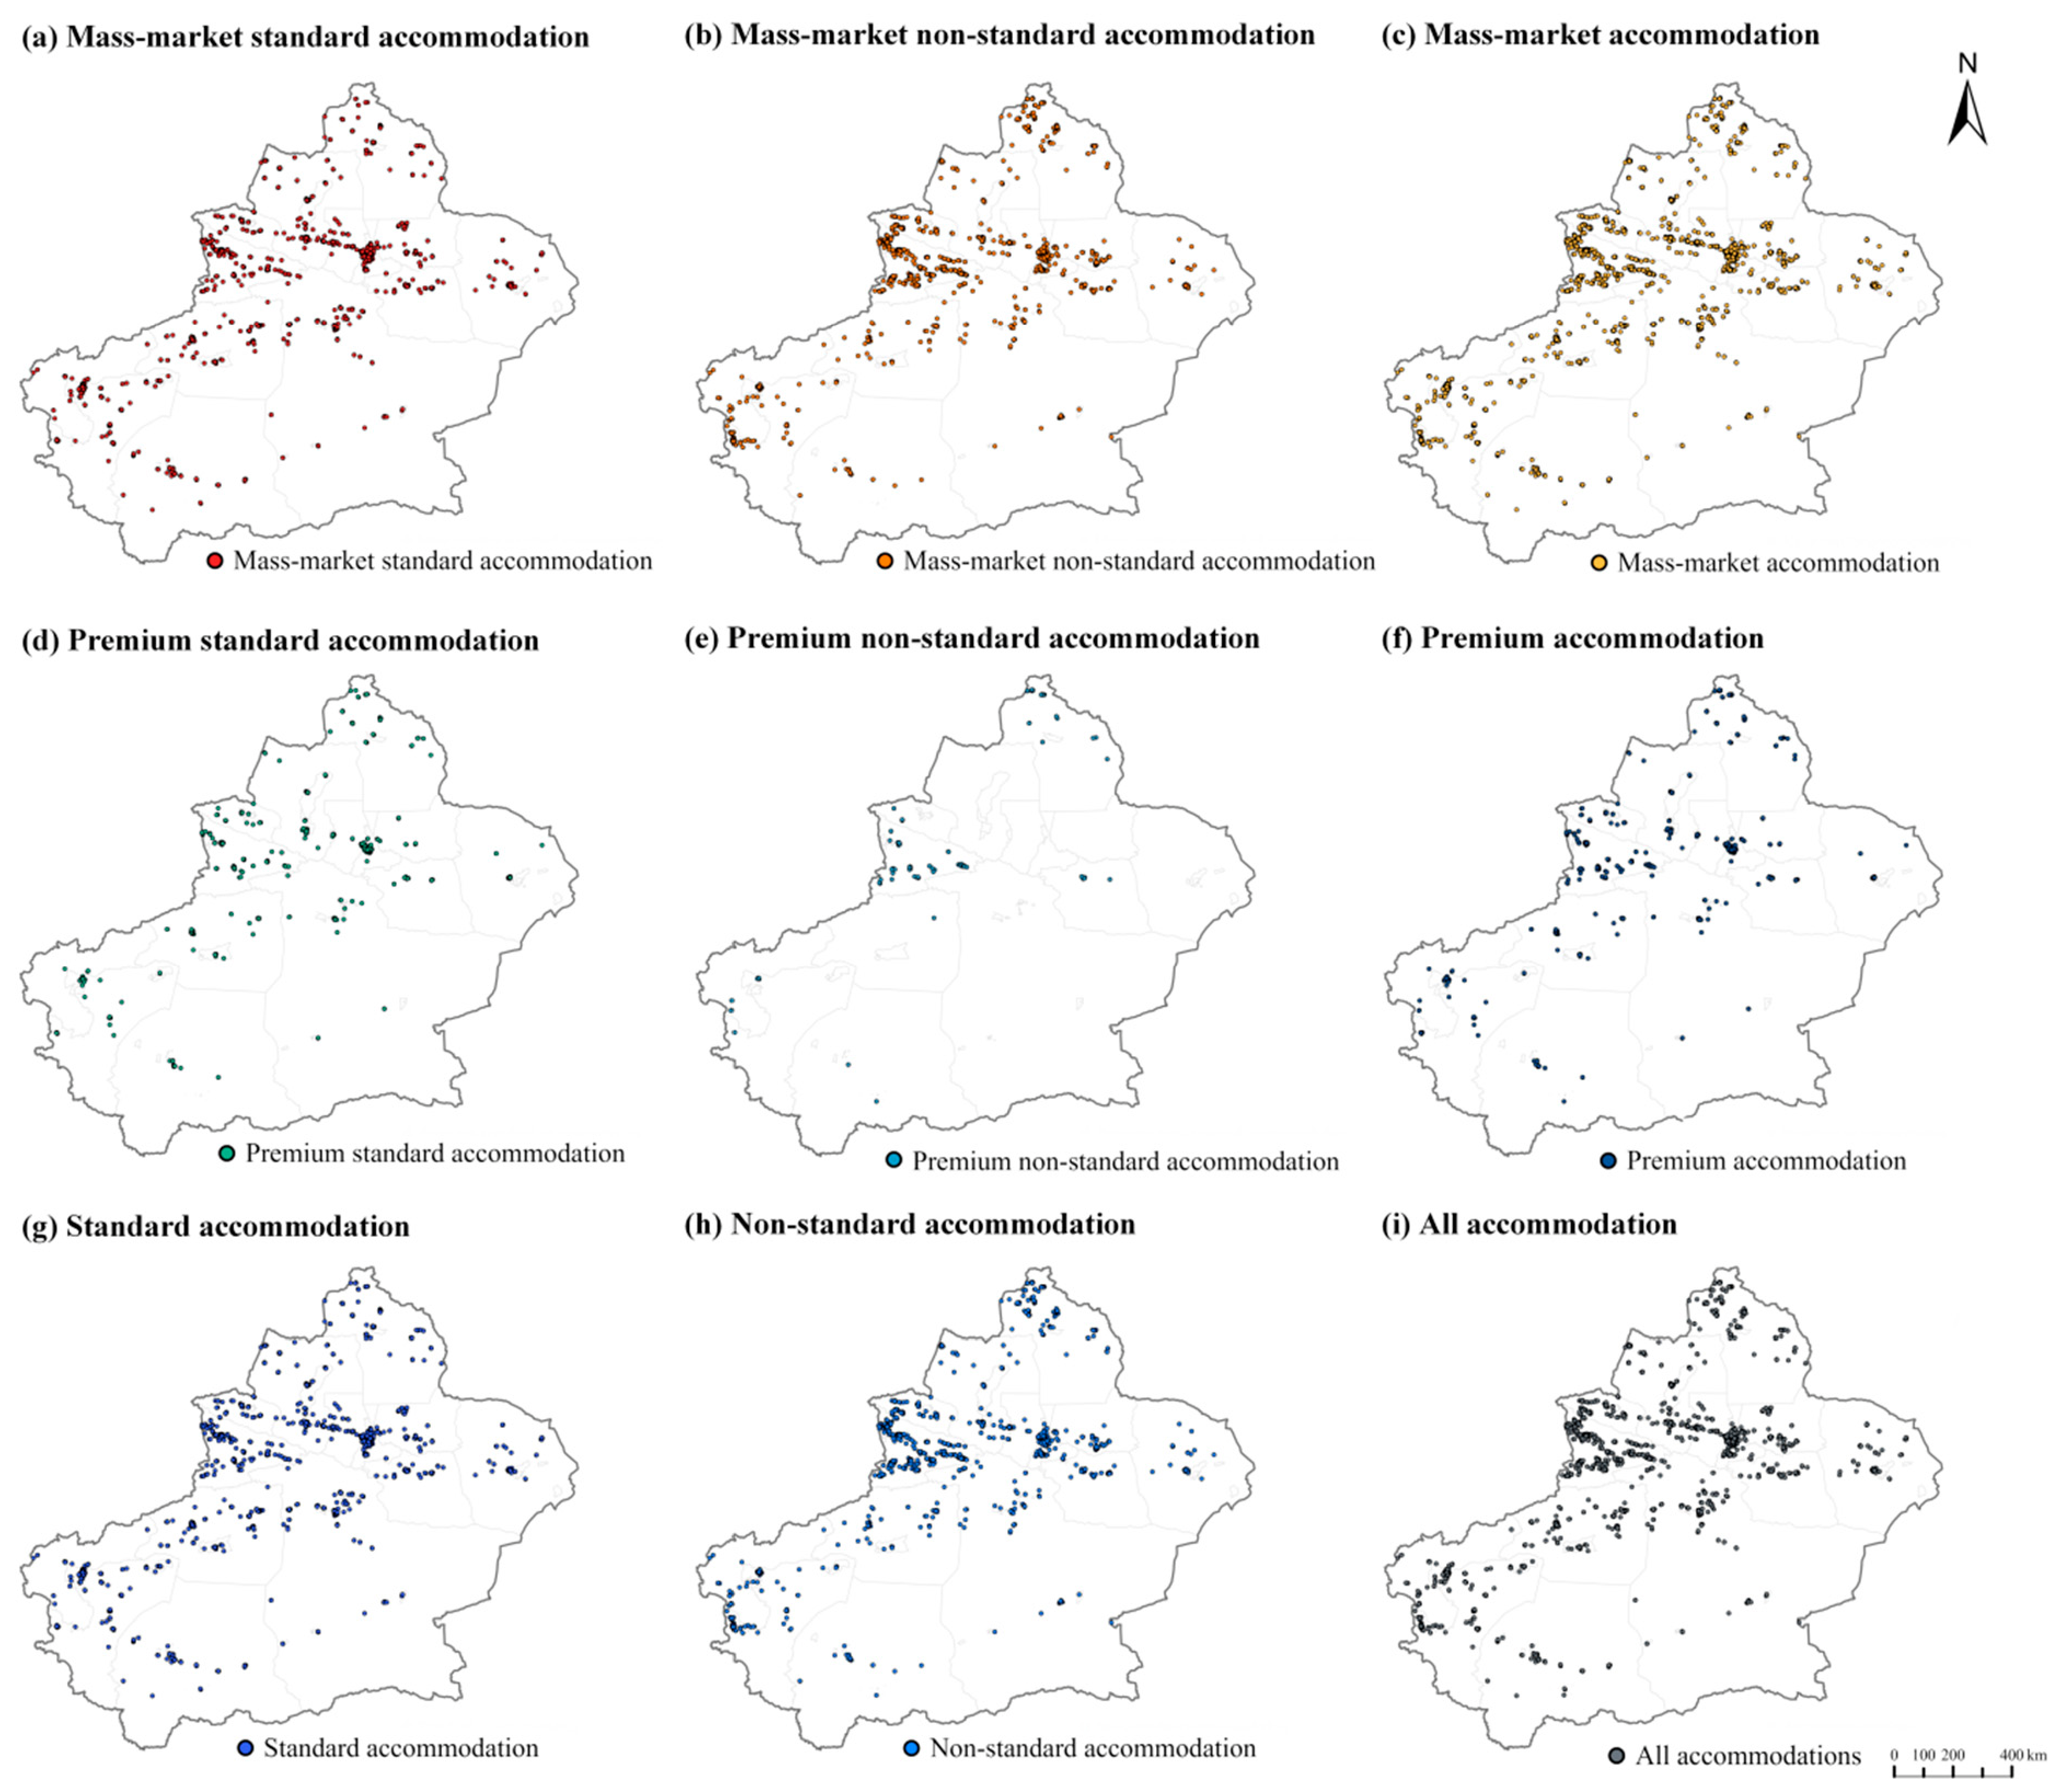
The third tier cross-classifies type and quality, yielding nine categories: mass-market standard (MS, n = 6510), mass-market non-standard (MNS, n = 4437), mass-market total (MM, n = 10,947), premium standard (PS, n = 940), premium non-standard (PNS, n = 186), premium total (PM, n = 1126), total standard (ST, n = 7450), total non-standard (NS, n = 4623), and all accommodations (n = 12,073).
2.3. Variable Selection
Based on existing literature and data availability, 23 explanatory variables were organized into six dimensions: natural conditions, socioeconomic context, transport accessibility, population and market conditions, public service accessibility, and tourism resources (
Table 2). The table reports each variable, symbol, measurement and expected relationship with accommodation distribution [
46,
49,
50,
51,
52,
53,
54].
Variable selection was not purely data-driven but grounded in the operationalization of the theoretical framework outlined above. Specifically: (1) Natural-condition variables (elevation, slope, FVC, temperature, precipitation) correspond to the physical constraint surface in location theory—in arid regions, these variables jointly define the ecological feasibility boundary for human settlement and tourism activity [
49,
55]; (2) Hydrological proximity (distance to rivers/lakes) constitutes a near-deterministic resource constraint in arid regions, where resort-type development depends on water bodies far more than in humid regions [
4]; (3) Transport accessibility variables (distance to railway stations, airports, highway entrances, trunk roads, parking lots) correspond to the transport-cost term in Weberian location theory—standard accommodation, given the time-sensitivity of business travelers, exhibits stronger dependence on transport nodes [
10]; (4) Socioeconomic/market variables (urbanization intensity, GDP, GDP per capita, tertiary industry share) correspond to market thresholds and ranges in Christallerian central place theory—urban centrality and economic structure determine the scale and hierarchy of accommodation demand [
8]; (5) Public service accessibility (distance to county seats, administrative villages, universities; catering and shopping POI density; population density) corresponds to urbanization economies in agglomeration theory—diversified amenities and labor pools provide externality support for hotel operations [
8]; (6) Tourism resource variables (distance to rural tourism demonstration sites, high-grade/low-grade scenic areas) correspond to resource dependence in TALC—non-standard accommodation location logic is expected to track tourism asset distribution more closely [
16]. This six-dimensional framework ensures that each variable has an explicit theoretical role rather than entering solely on the basis of statistical correlation.
2.4. Research Methods
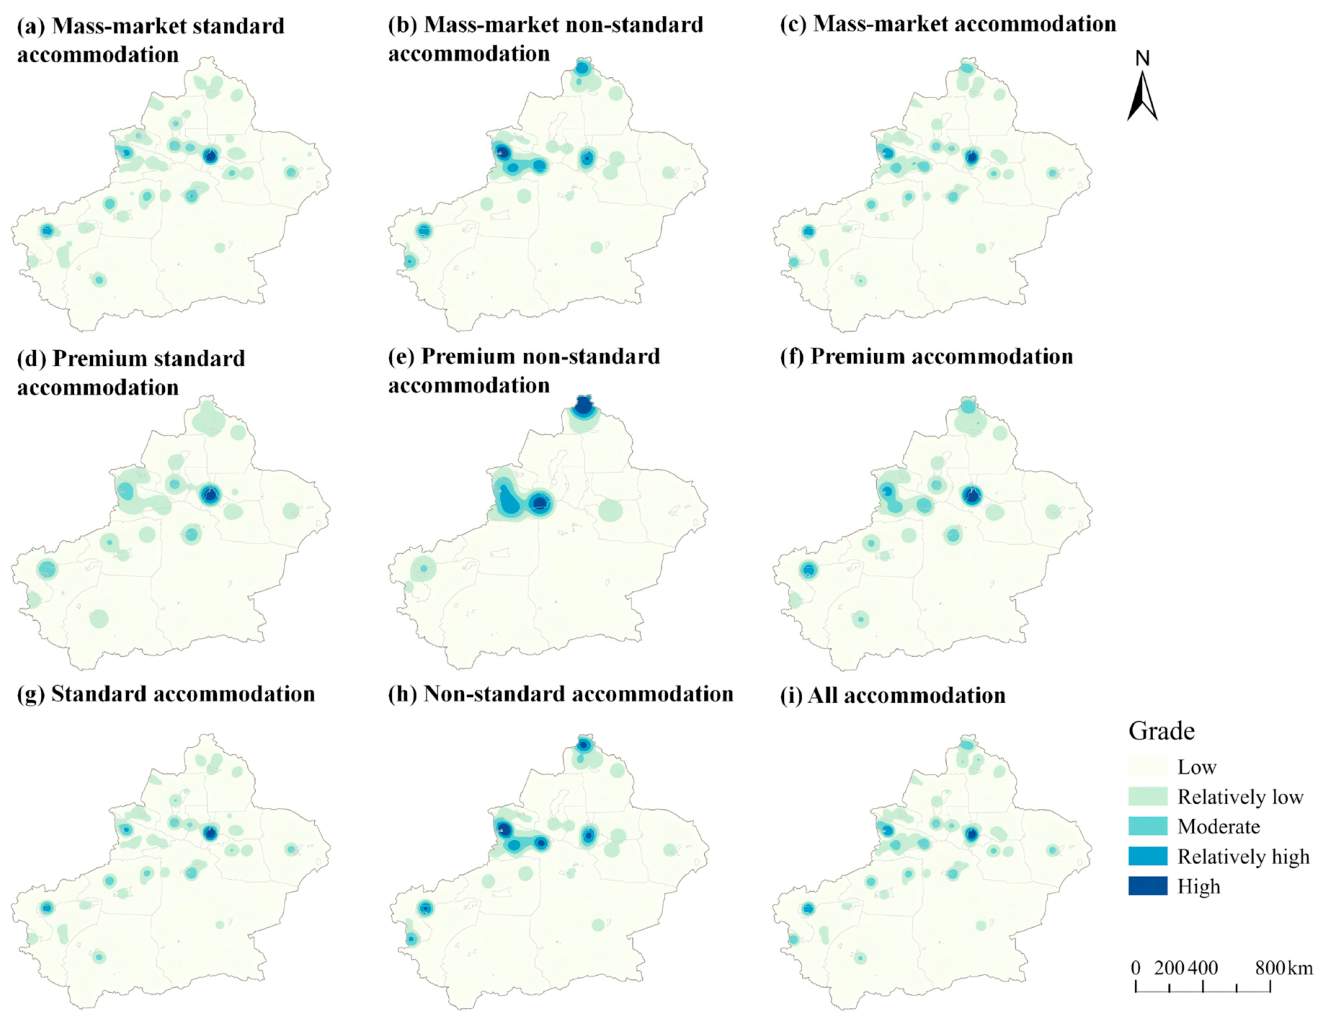
2.4.1. Kernel Density Estimation (KDE) and Dual-Perspective Density Framework
Accommodation patterns show two processes: the supply-side location decisions by the investors and the demand-side consumption by guests. Facility density and demand intensity are not necessarily the same, which may cause the location mechanisms to be confused, so a dual-perspective KDE was used to create two spatial variables: spatial supply intensity (SSI) and market heat-weighted density (MHWD) [
56,
57,
58,
59]. KDE measures neighborhood density as a way of measuring local clustering:
The first dependent variable, Spatial Supply Intensity (SSI), captures supply-side location decisions using standard KDE without demand weighting:
Market Heat-weighted Density (MHWD) assigns weights to each facility, based on the intensity of participation of guests per year. The market heat index is:
where
is the total number of Ctrip reviews,
= 2025 −
+ 1 is the number of years the platform has been operating, and
is the year the platform opened, and min(
, 3) is a correction for the platform’s 3-year rolling review window. The surface of the MHWD is:
The reviews on the platform are not necessarily a reflection of total demand and are interpreted as the “market heat” seen by the platform, as review numbers can be driven by platform penetration, merchant strategies, composition of guests at the platform, and platform pricing and promotion. It is used to compare relative spatial patterns in the same platform environment.
2.4.2. Nearest Neighbor Index (NNI)
The Nearest Neighbor Index (NNI) computes the point clustering as well as the random or dispersed nature of the points:
where
is the observed mean nearest-neighbor distance,
the expected distance under complete spatial randomness,
is the observed mean nearest-neighbor distance,
n the number of features, and A the total area.
< 1: Clustering,
= 1: Randomness,
> 1: Dispersion, tested for significance by Z-value. The Average Nearest Neighbor tool in ArcGIS Pro 3.6 was used to calculate NNI for all nine accommodation categories and for the three macro-regions (Northern, Southern and Eastern Xinjiang).
2.4.3. Standard Deviational Ellipse (SDE)
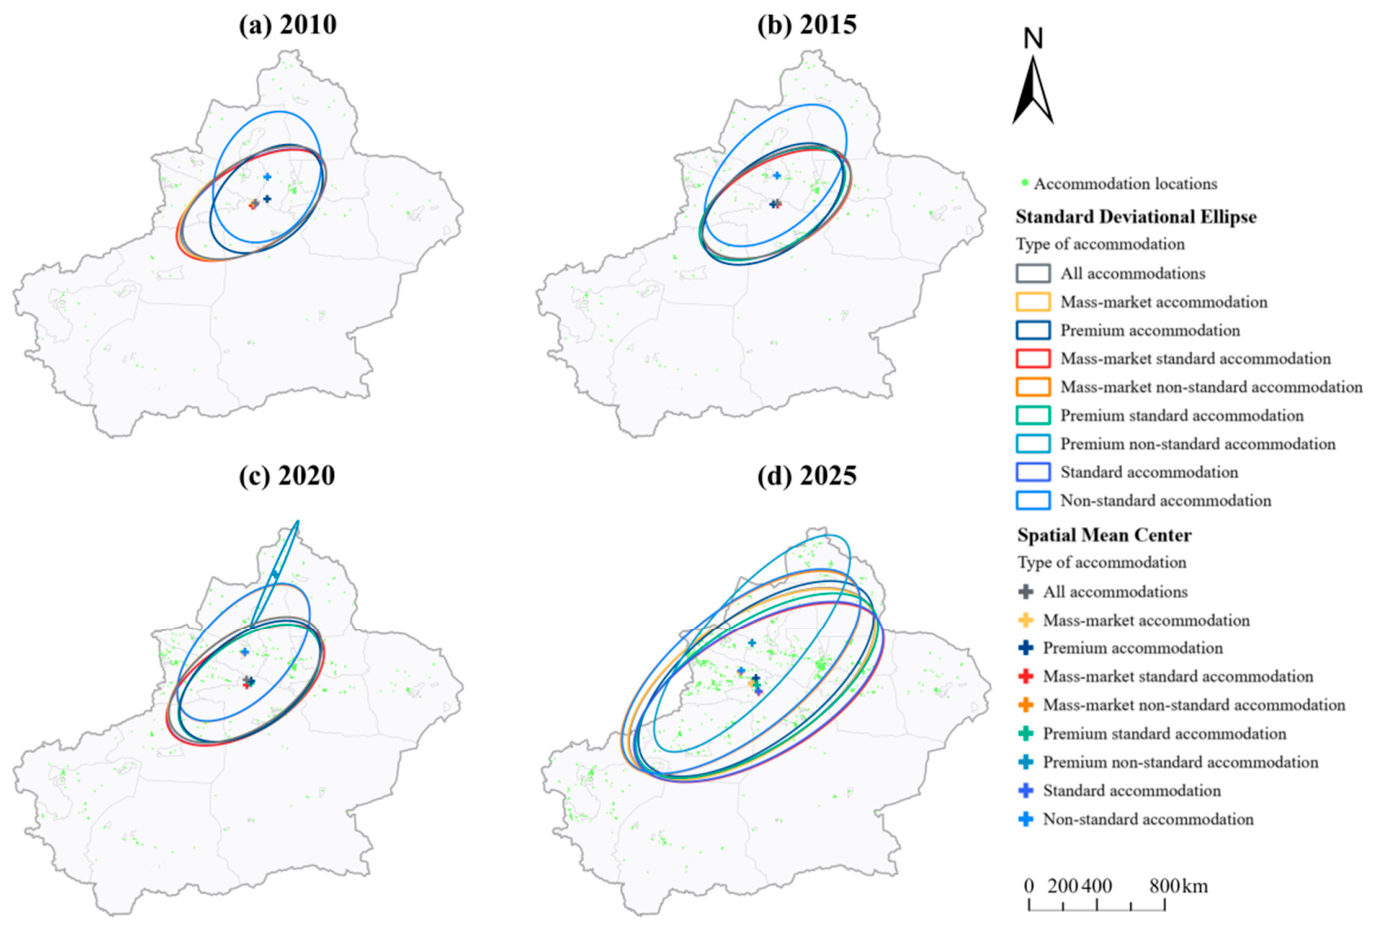
The Standard Deviational Ellipse (SDE) was applied to characterize directional trends and spatial dispersion. It identifies the weighted mean center, orientation and eccentricity of each accommodation category:
where
is the weight assigned to point
,
and
are the coordinates, and
is the rotation angle suggesting the principal directional axis. The Directional Distribution tool in ArcGIS Pro 3.6 was used to generate one-standard-deviation ellipses, covering approximately 68% of points, for each accommodation category.
2.4.4. OPTICS Clustering
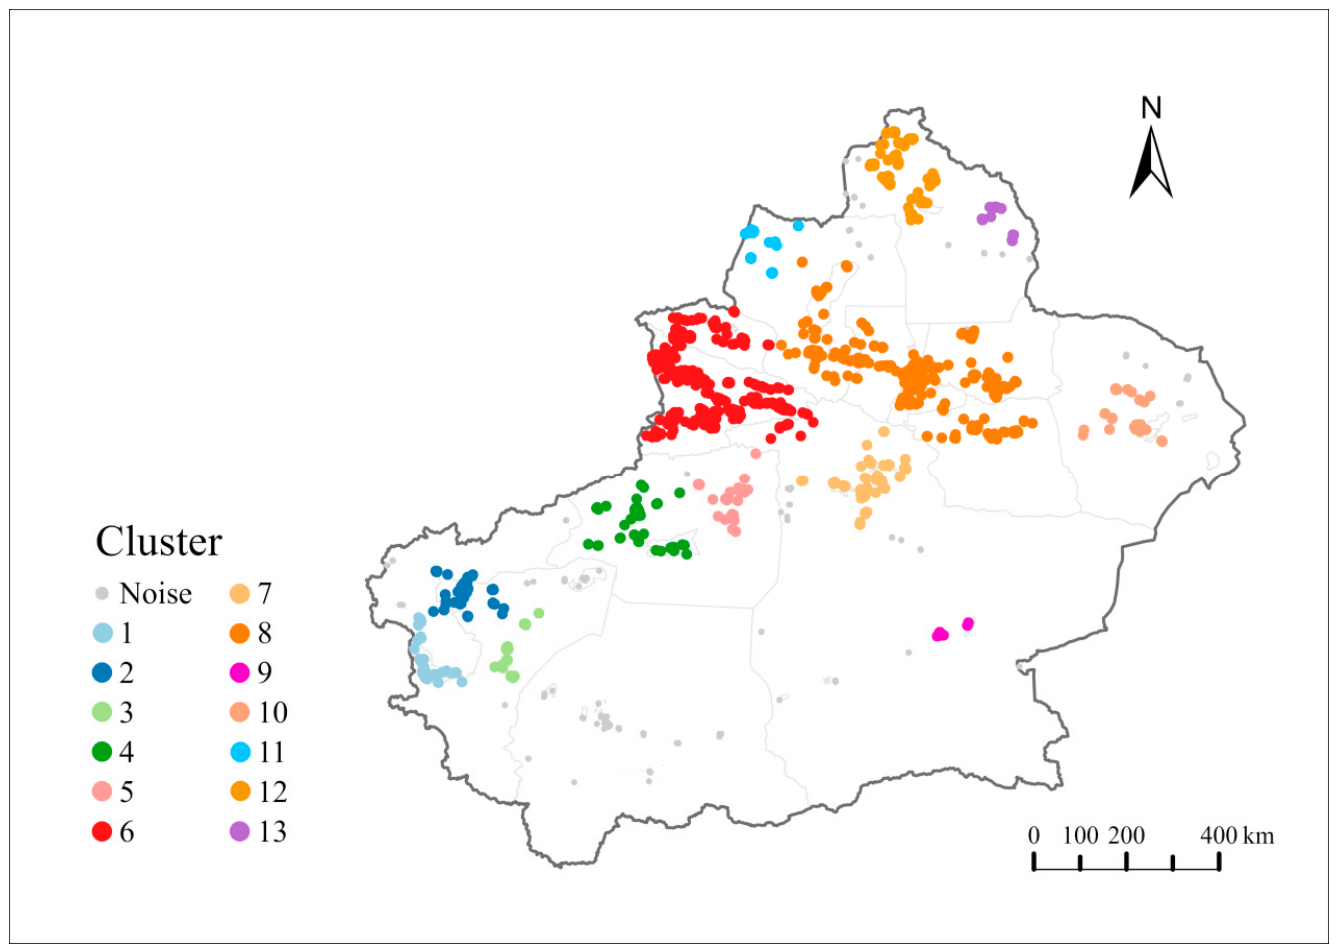
For clustering with varying densities, Ordering Points To Identify the Clustering Structure (OPTICS), an extension of DBSCAN, was used. OPTICS constructs a reachability plot based on core distance (distances to the k-th neighbors, k = MinPts) and reachability distance (maximum of core distance and distance to the neighbor), and thus permits the extraction of clusters of various densities from a single data set. The choice of OPTICS was motivated by the area size of Xinjiang (~1.66 million km2), which creates significant density heterogeneity, so that a single DBSCAN threshold might split urban clusters or fail to identify peripheral clusters. The parameters were calibrated iteratively: MinPts = 100 and = 70 km. In the analysis, 13 clusters were found, comprising 11,382 points (94.3%) and 691 points (5.7%) as noise.
To assess the robustness of clustering results to parameter selection, we re-ran clustering within the same tool across a 16-combination parameter grid of MinPts ∈ {50, 80, 100, 150} × search distance ∈ {30, 50, 70, 100} km, and measured point-level assignment agreement of each partition relative to the baseline configuration (MinPts = 100, search distance = 70 km) using the Adjusted Rand Index (ARI) and Normalized Mutual Information (NMI)
2.4.5. Local Colocation Quotient (LCLQ)
The Local Colocation Quotient (LCLQ) was used to quantify spatial association between categories, a point-pattern statistic that quantifies the extent to which one category is attracted to or repelled from another [
37,
38]. Contrary to global indices, LCLQ goes beyond this and considers the context of each point, which allows for heterogeneous colocation in large, diverse areas [
60]. The LCLQ of category to category is:
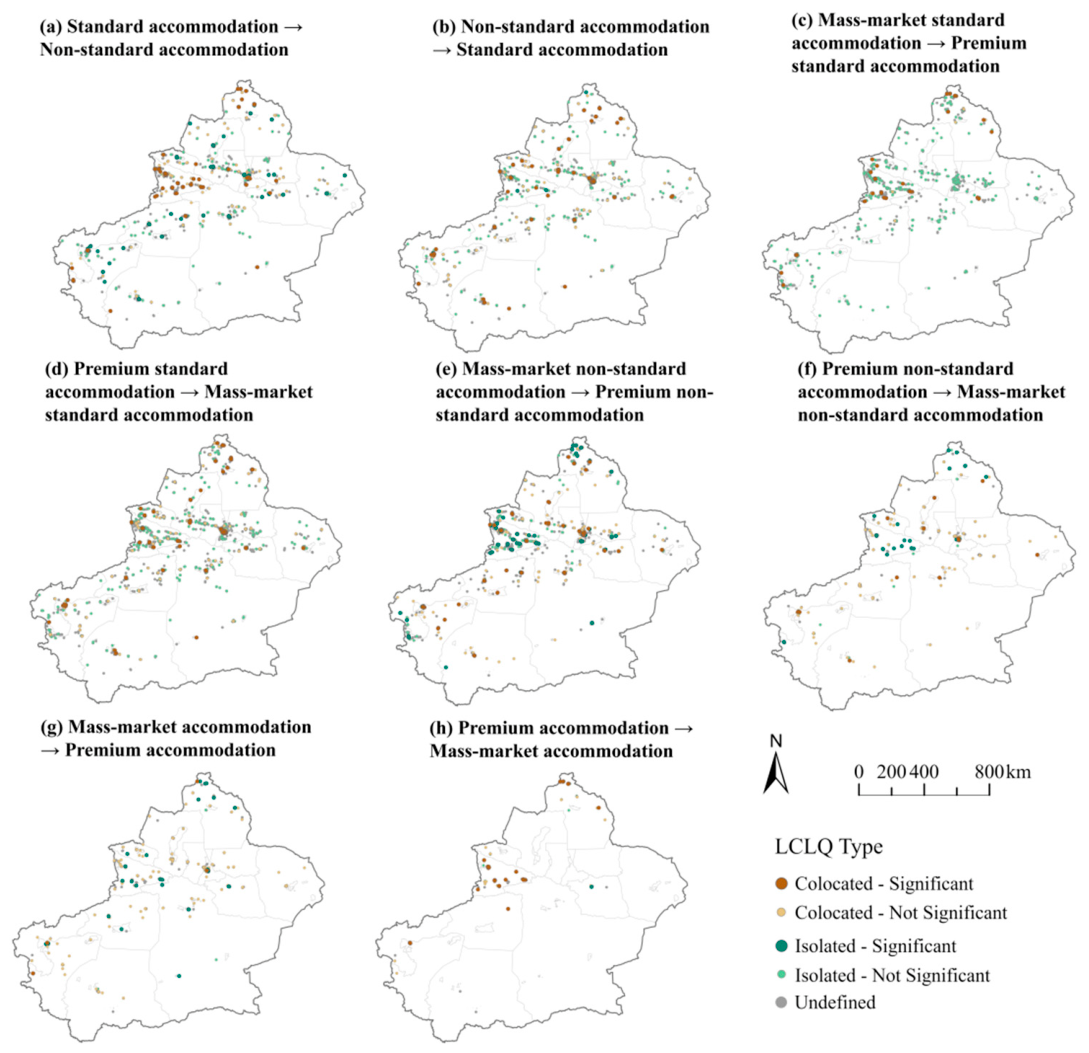
where is the weighted number of points in ‘s neighborhood (temporal precedence), are the total number of points, and N is the total number of points from all categories. LCLQ is asymmetric: LCLQ (A → B) is not the same as LCLQ (B → A), as it represents directional spatial association. This was done in ArcGIS Pro 3.6 using a Gaussian distance-decay kernel, and significance was determined by the 999 Monte Carlo permutations at
p < 0.05 [
61,
62]. This was achieved by excluding facilities open for less than one year, establishing a temporal ordering between prior and subsequent establishments so that the analysis captures sequential spatial association rather than simultaneous co-occurrence [
63,
64]. Of the nine categories, eight directional associations were analyzed.
It must be emphasized that LCLQ measures spatial association, not causal direction. Temporal precedence is a necessary but insufficient condition for causal inference; it cannot eliminate self-selection bias or omitted-variable bias. The sequential spatial emergence of accommodation categories may be driven by unobserved third-party factors. Accordingly, all LCLQ results in this study should be interpreted as “directional spatial associations”—that is, in areas where Category A facilities are dense, the probability of Category B facilities occurring is significantly higher than random expectation—rather than A “guiding” or “driving” B’s location decisions. Any mechanistic interpretation is advanced as a hypothesis requiring further testing with longitudinal data or quasi-experimental designs.
2.4.6. XGBoost Model
XGBoost (eXtreme Gradient Boosting) is a distributed gradient-boosting algorithm built on the GBDT framework. It minimizes the following objective function:
where
is the number of observations;
is the loss function;
is the number of trees; and
is the regularization term penalizing model complexity:
where
is the number of leaves,
denotes leaf weights, and
and
are regularization hyperparameters.
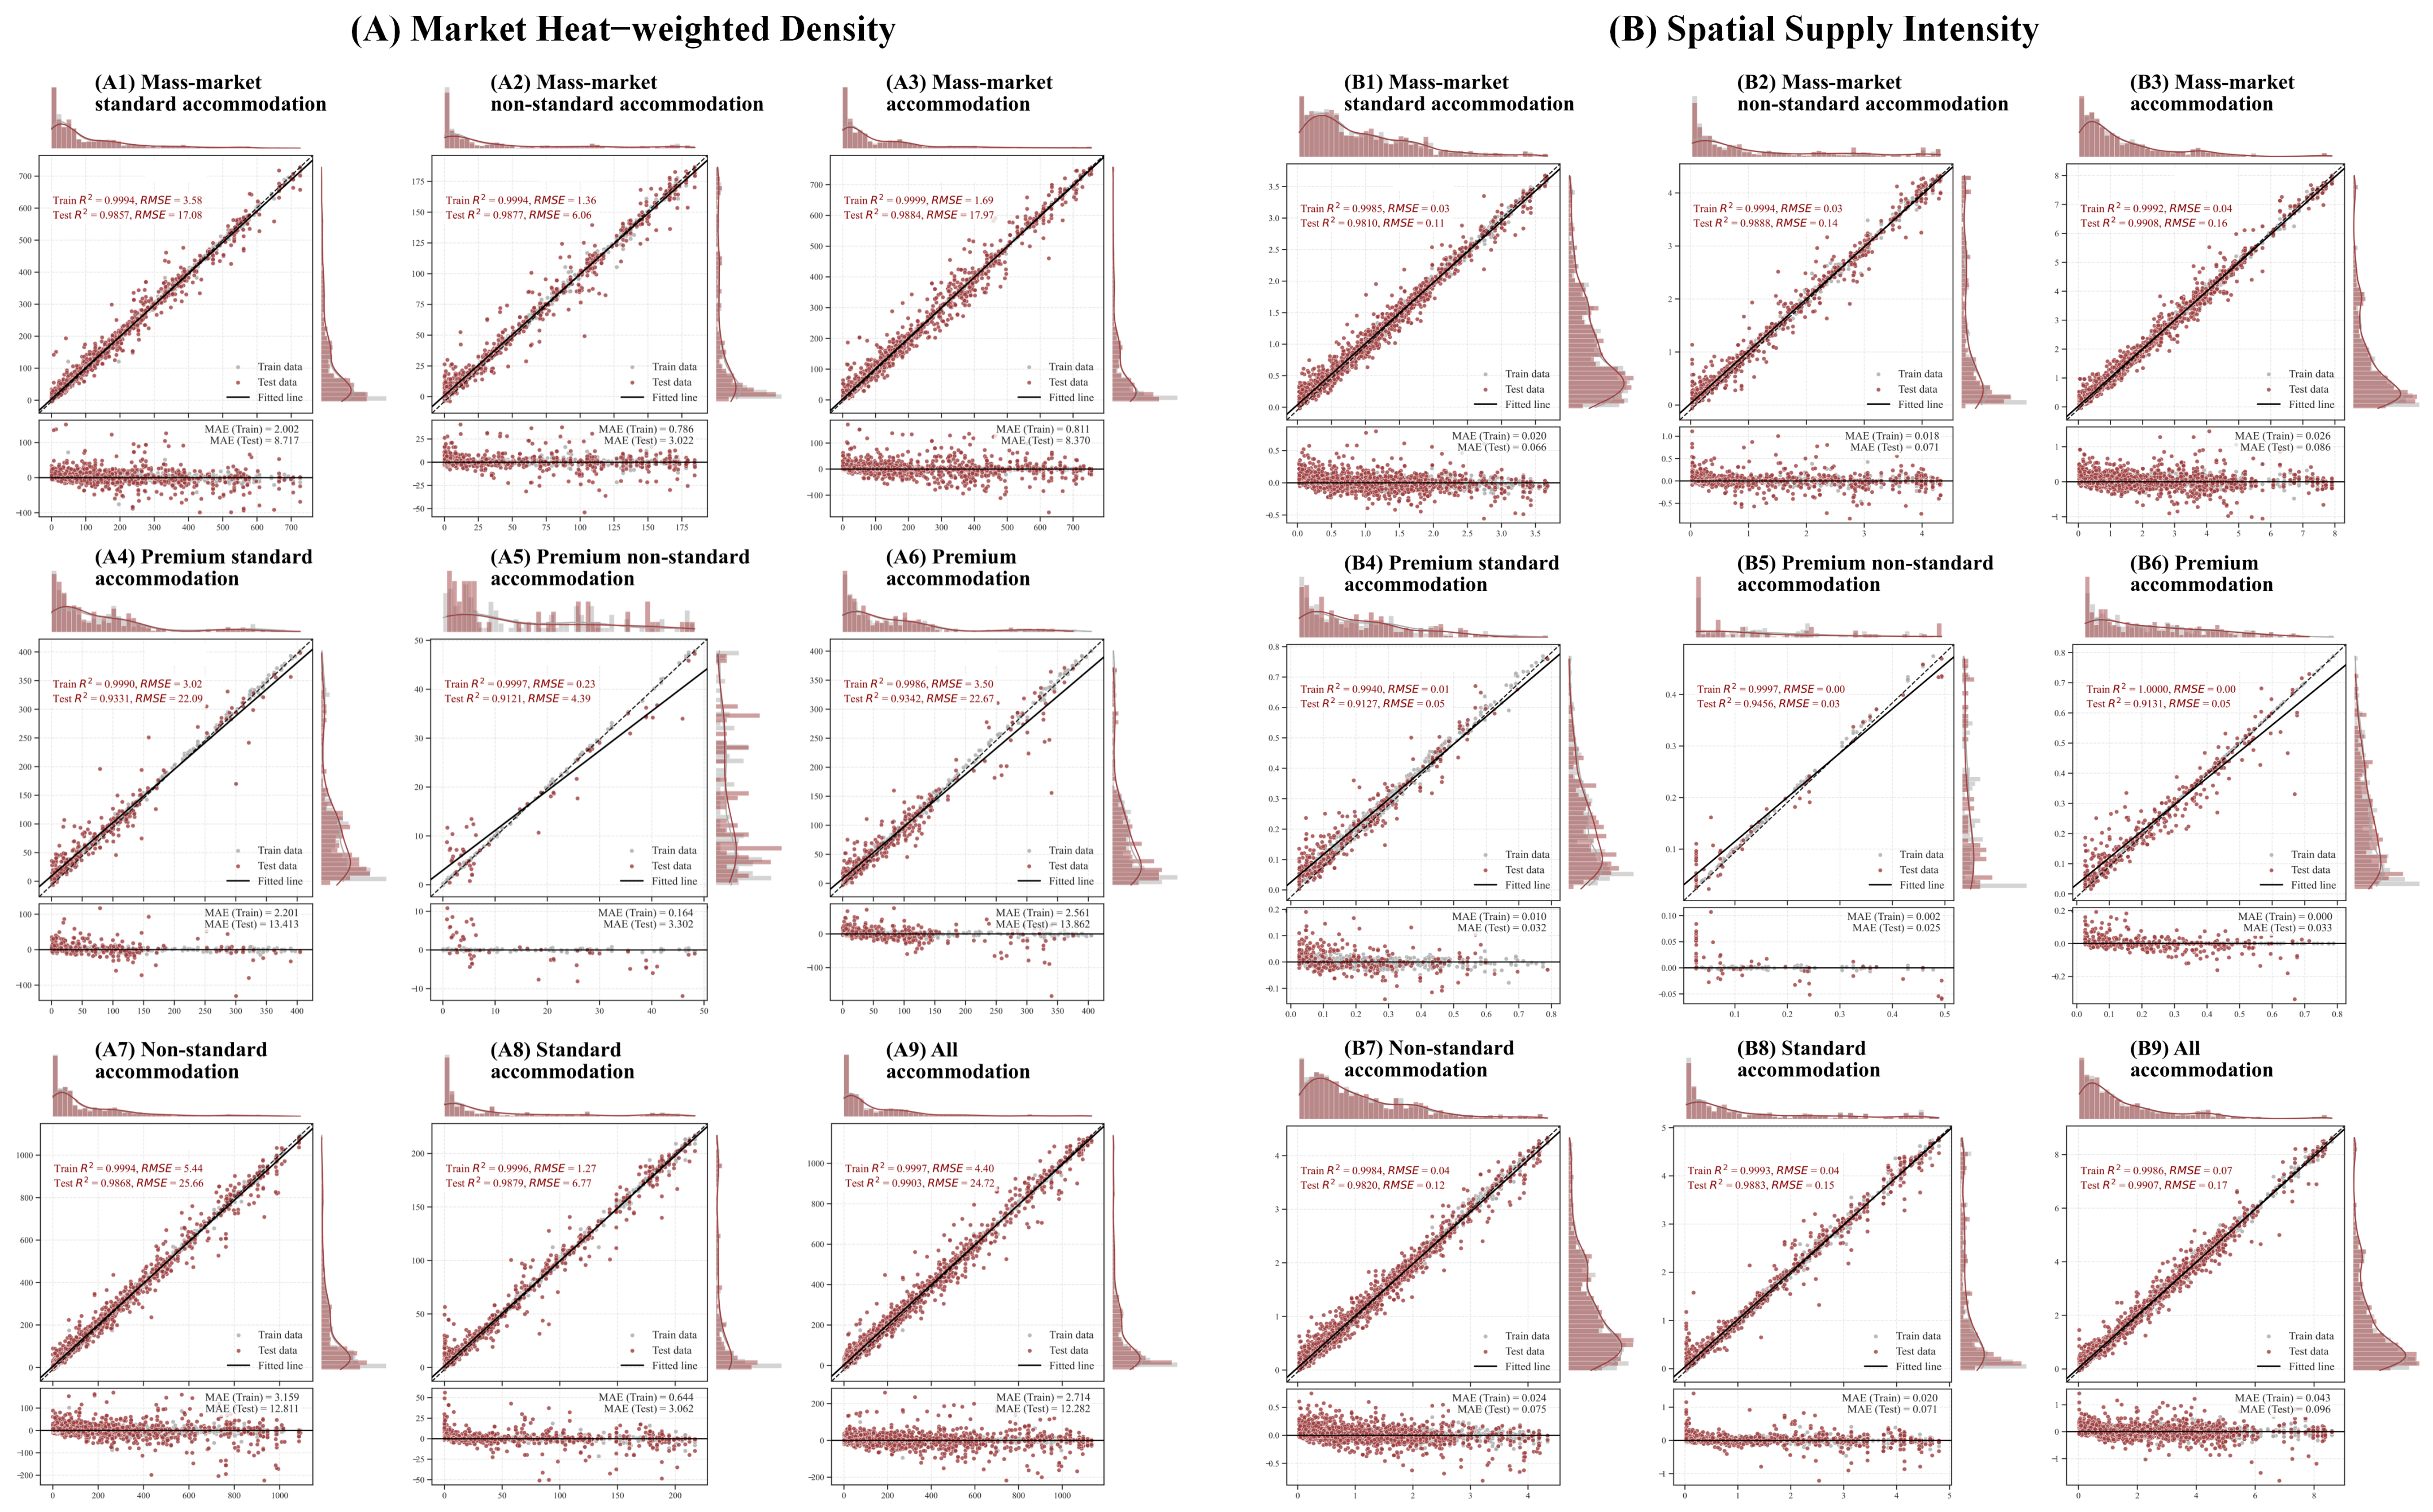
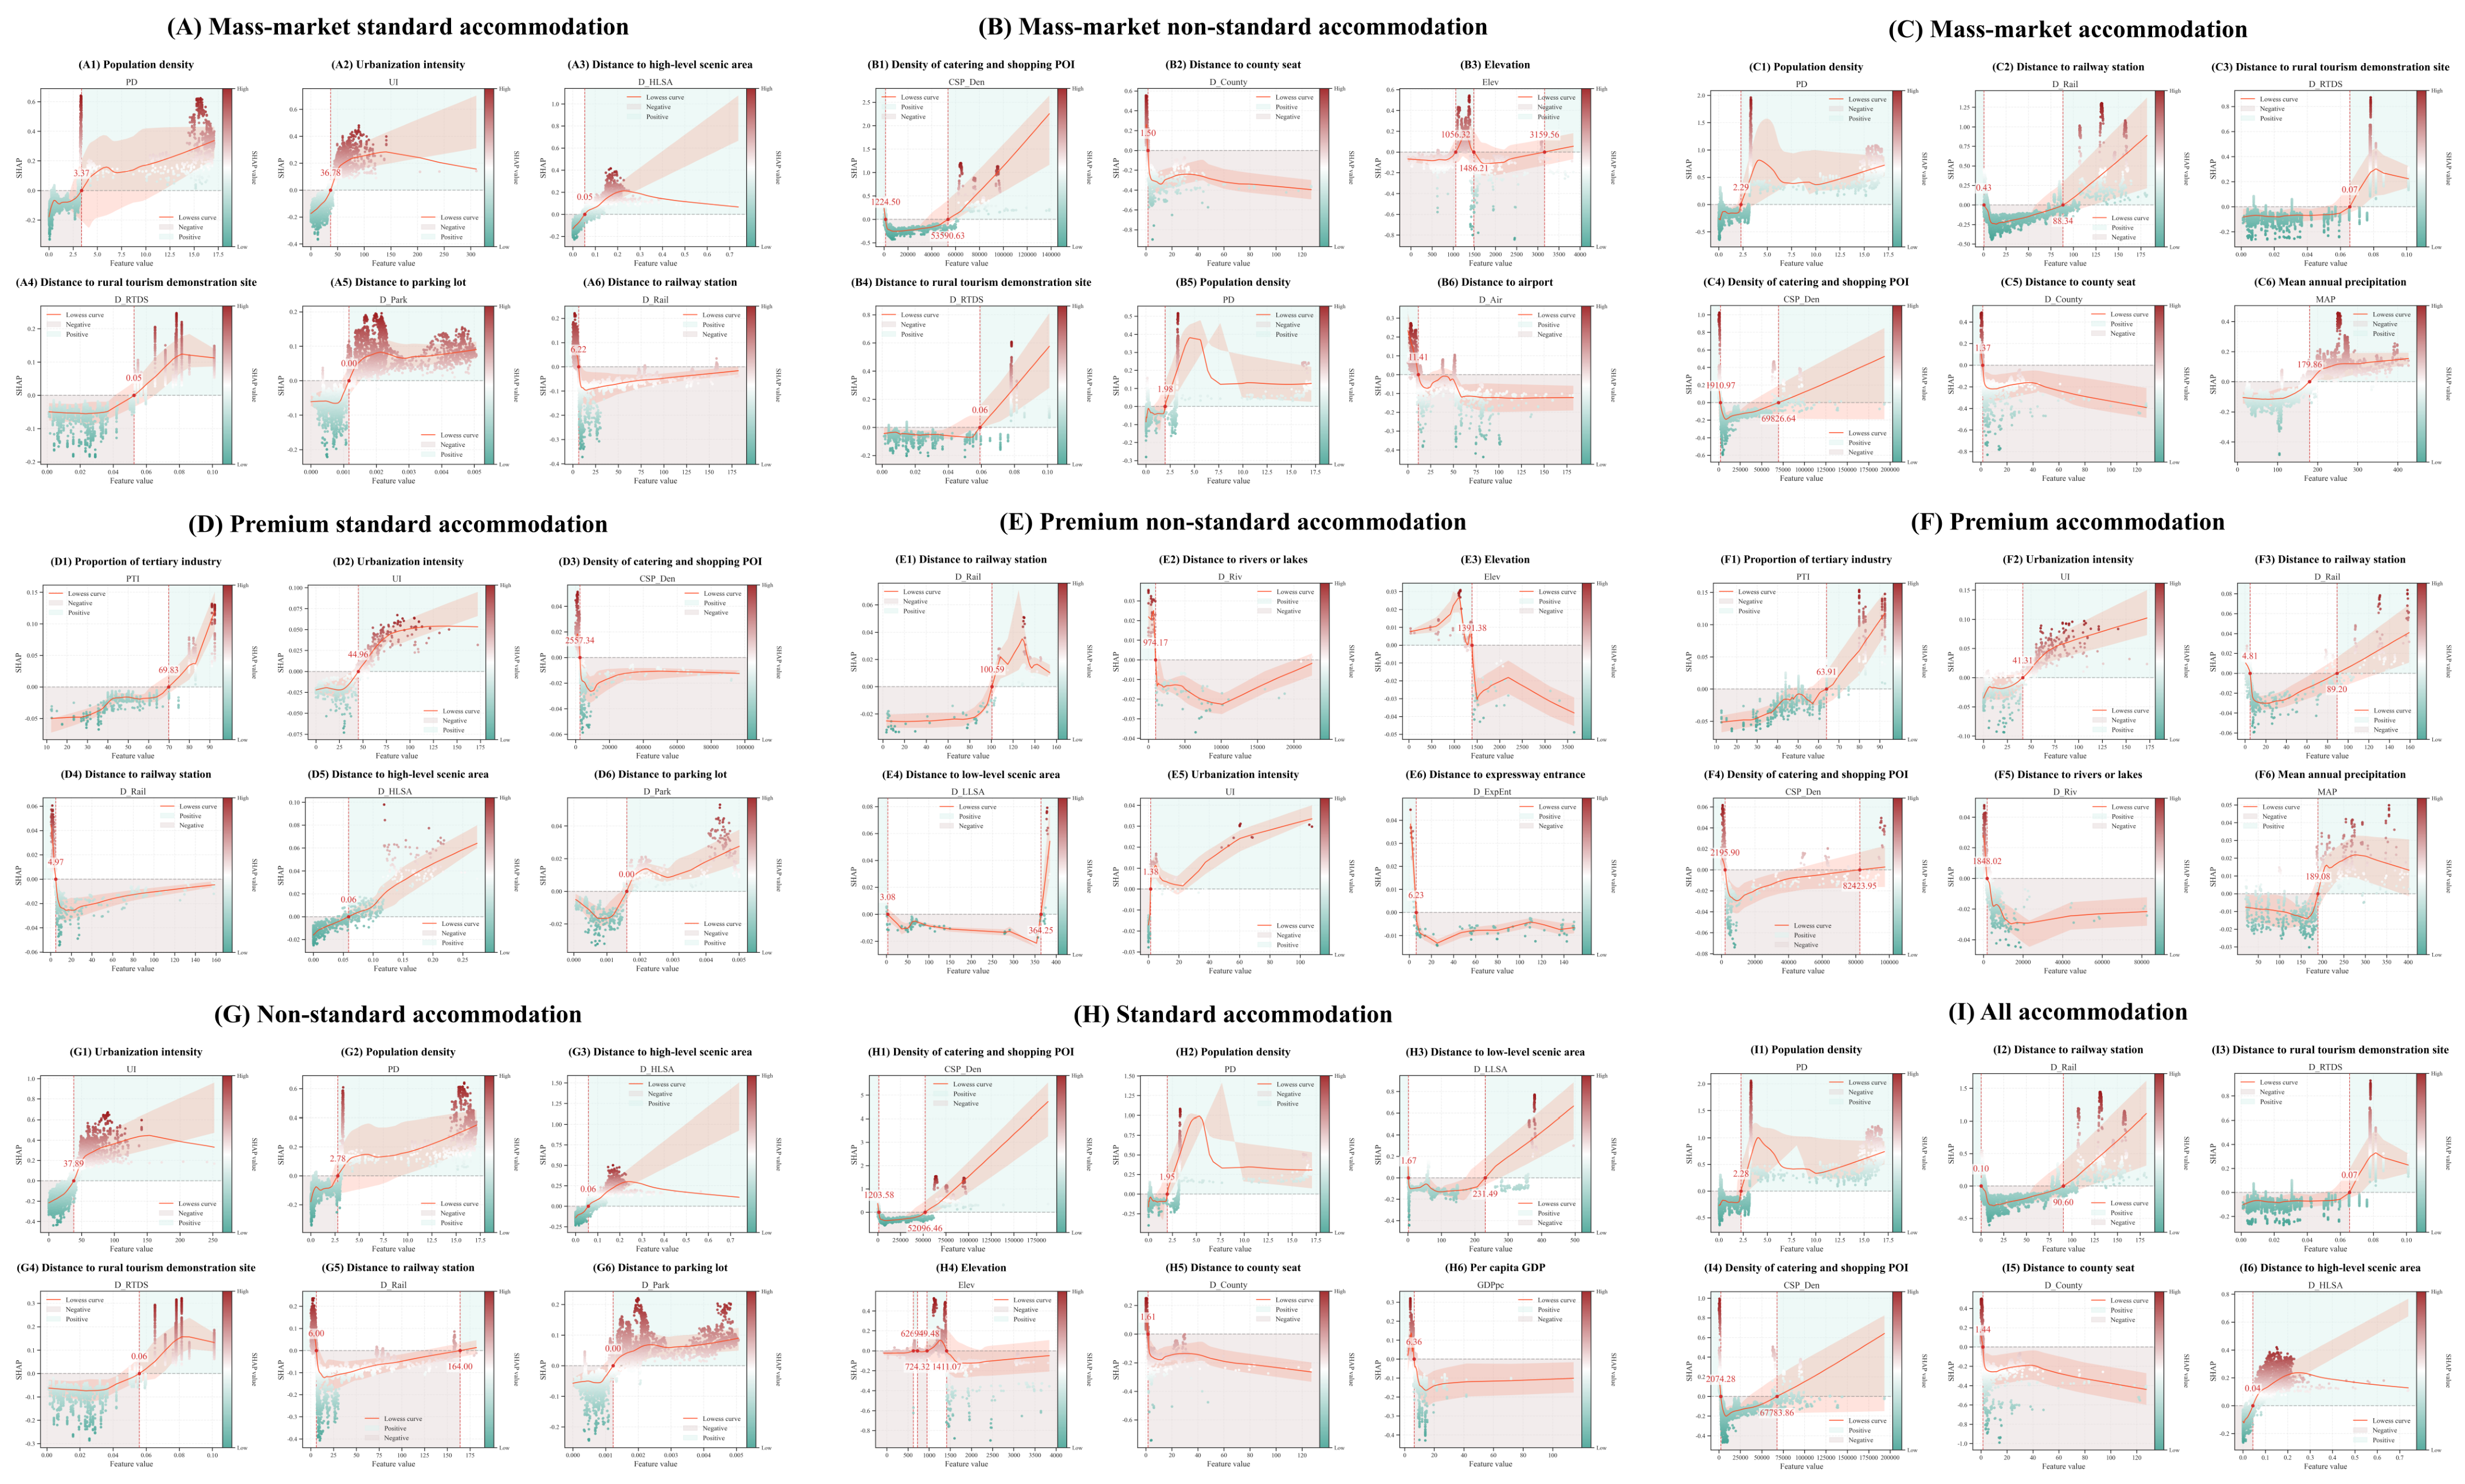
Eighteen XGBoost regression models were constructed (9 categories × 2 density perspectives). The dependent variables were SSI, calculated as standard KDE from coordinates, and MHWD, calculated as demand-weighted KDE using review counts normalized by operational tenure. Data were split 70/30 into training and testing sets through stratified random sampling. Hyperparameters were learning_rate = 0.05, max_depth = 6, n_estimators = 500, subsample = 0.8 and colsample_bytree = 0.8, with early_stopping_rounds = 20. Model performance was evaluated using , RMSE and MAE.
To provide a complementary diagnostic of residual spatial structure, we computed global Moran’s I for all 18 models. Specifically, a k-nearest-neighbor spatial weight matrix was constructed from the longitude–latitude coordinates of each accommodation point. Global Moran’s I was computed for both the dependent variable and model residuals, with significance assessed via 999 random permutation tests. Residual Moran’s I close to the spatial-randomness expectation indicates limited remaining spatial autocorrelation after fitting. However, this diagnostic does not assess out-of-area transferability or by itself rule out optimistic fit arising from a random split; it is therefore interpreted alongside, rather than as a substitute for, spatially blocked validation. This use of a residual spatial autocorrelation diagnostic follows Li et al. [
55].
2.4.7. SHAP Interpretability Analysis
SHAP values were used to interpret XGBoost outputs by estimating each feature’s contribution to model predictions under a cooperative game-theory framework. The SHAP value for each feature is:
where
is the full feature set;
is a subset excluding
;
is the cardinality; and
is the prediction using only subset
.
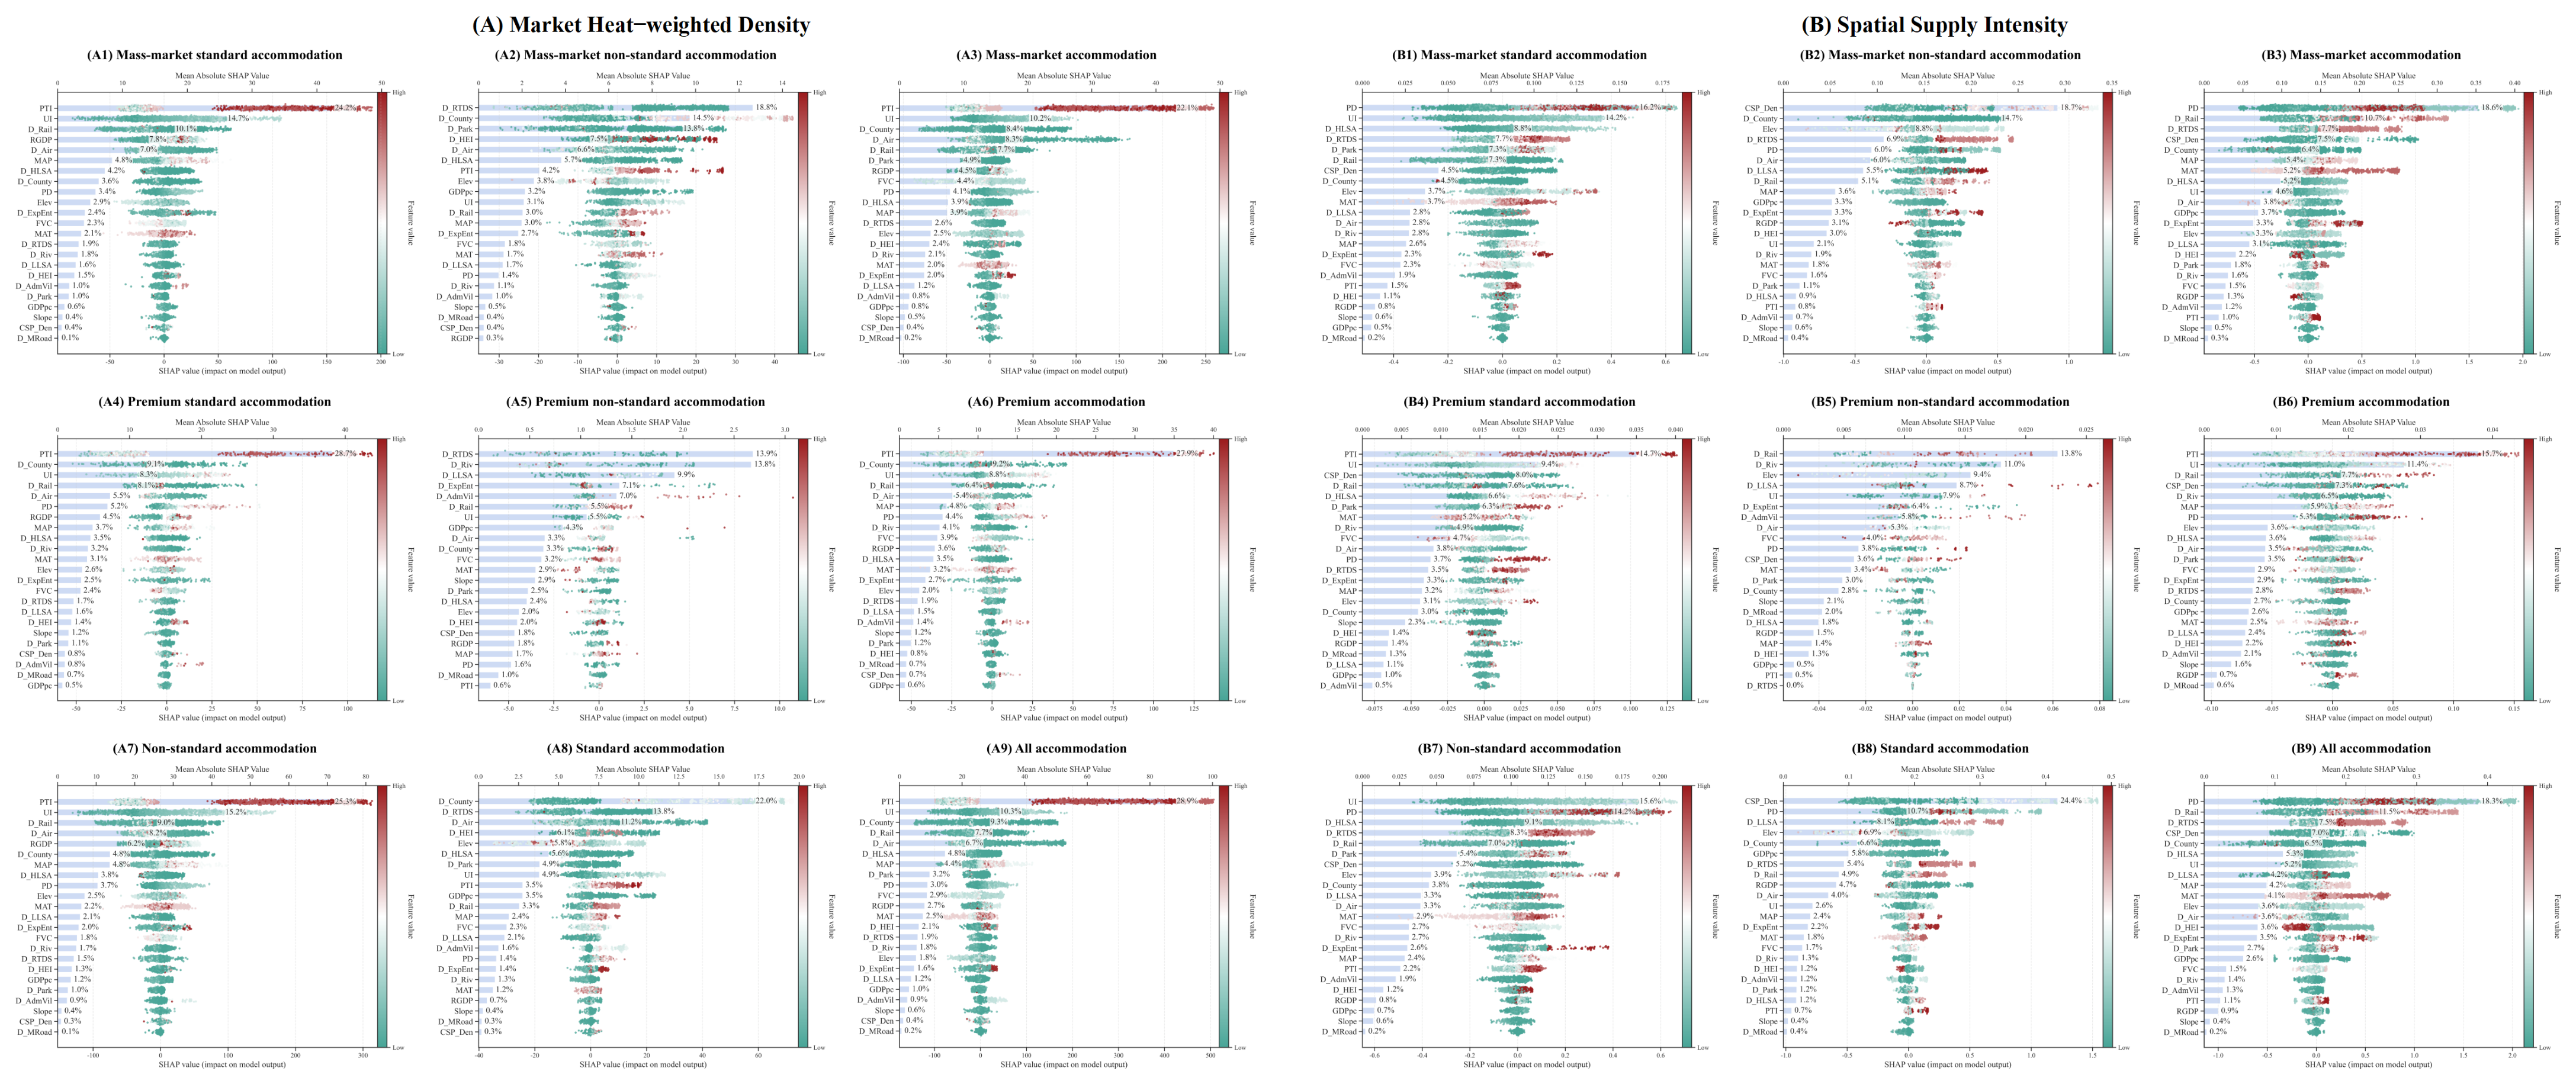
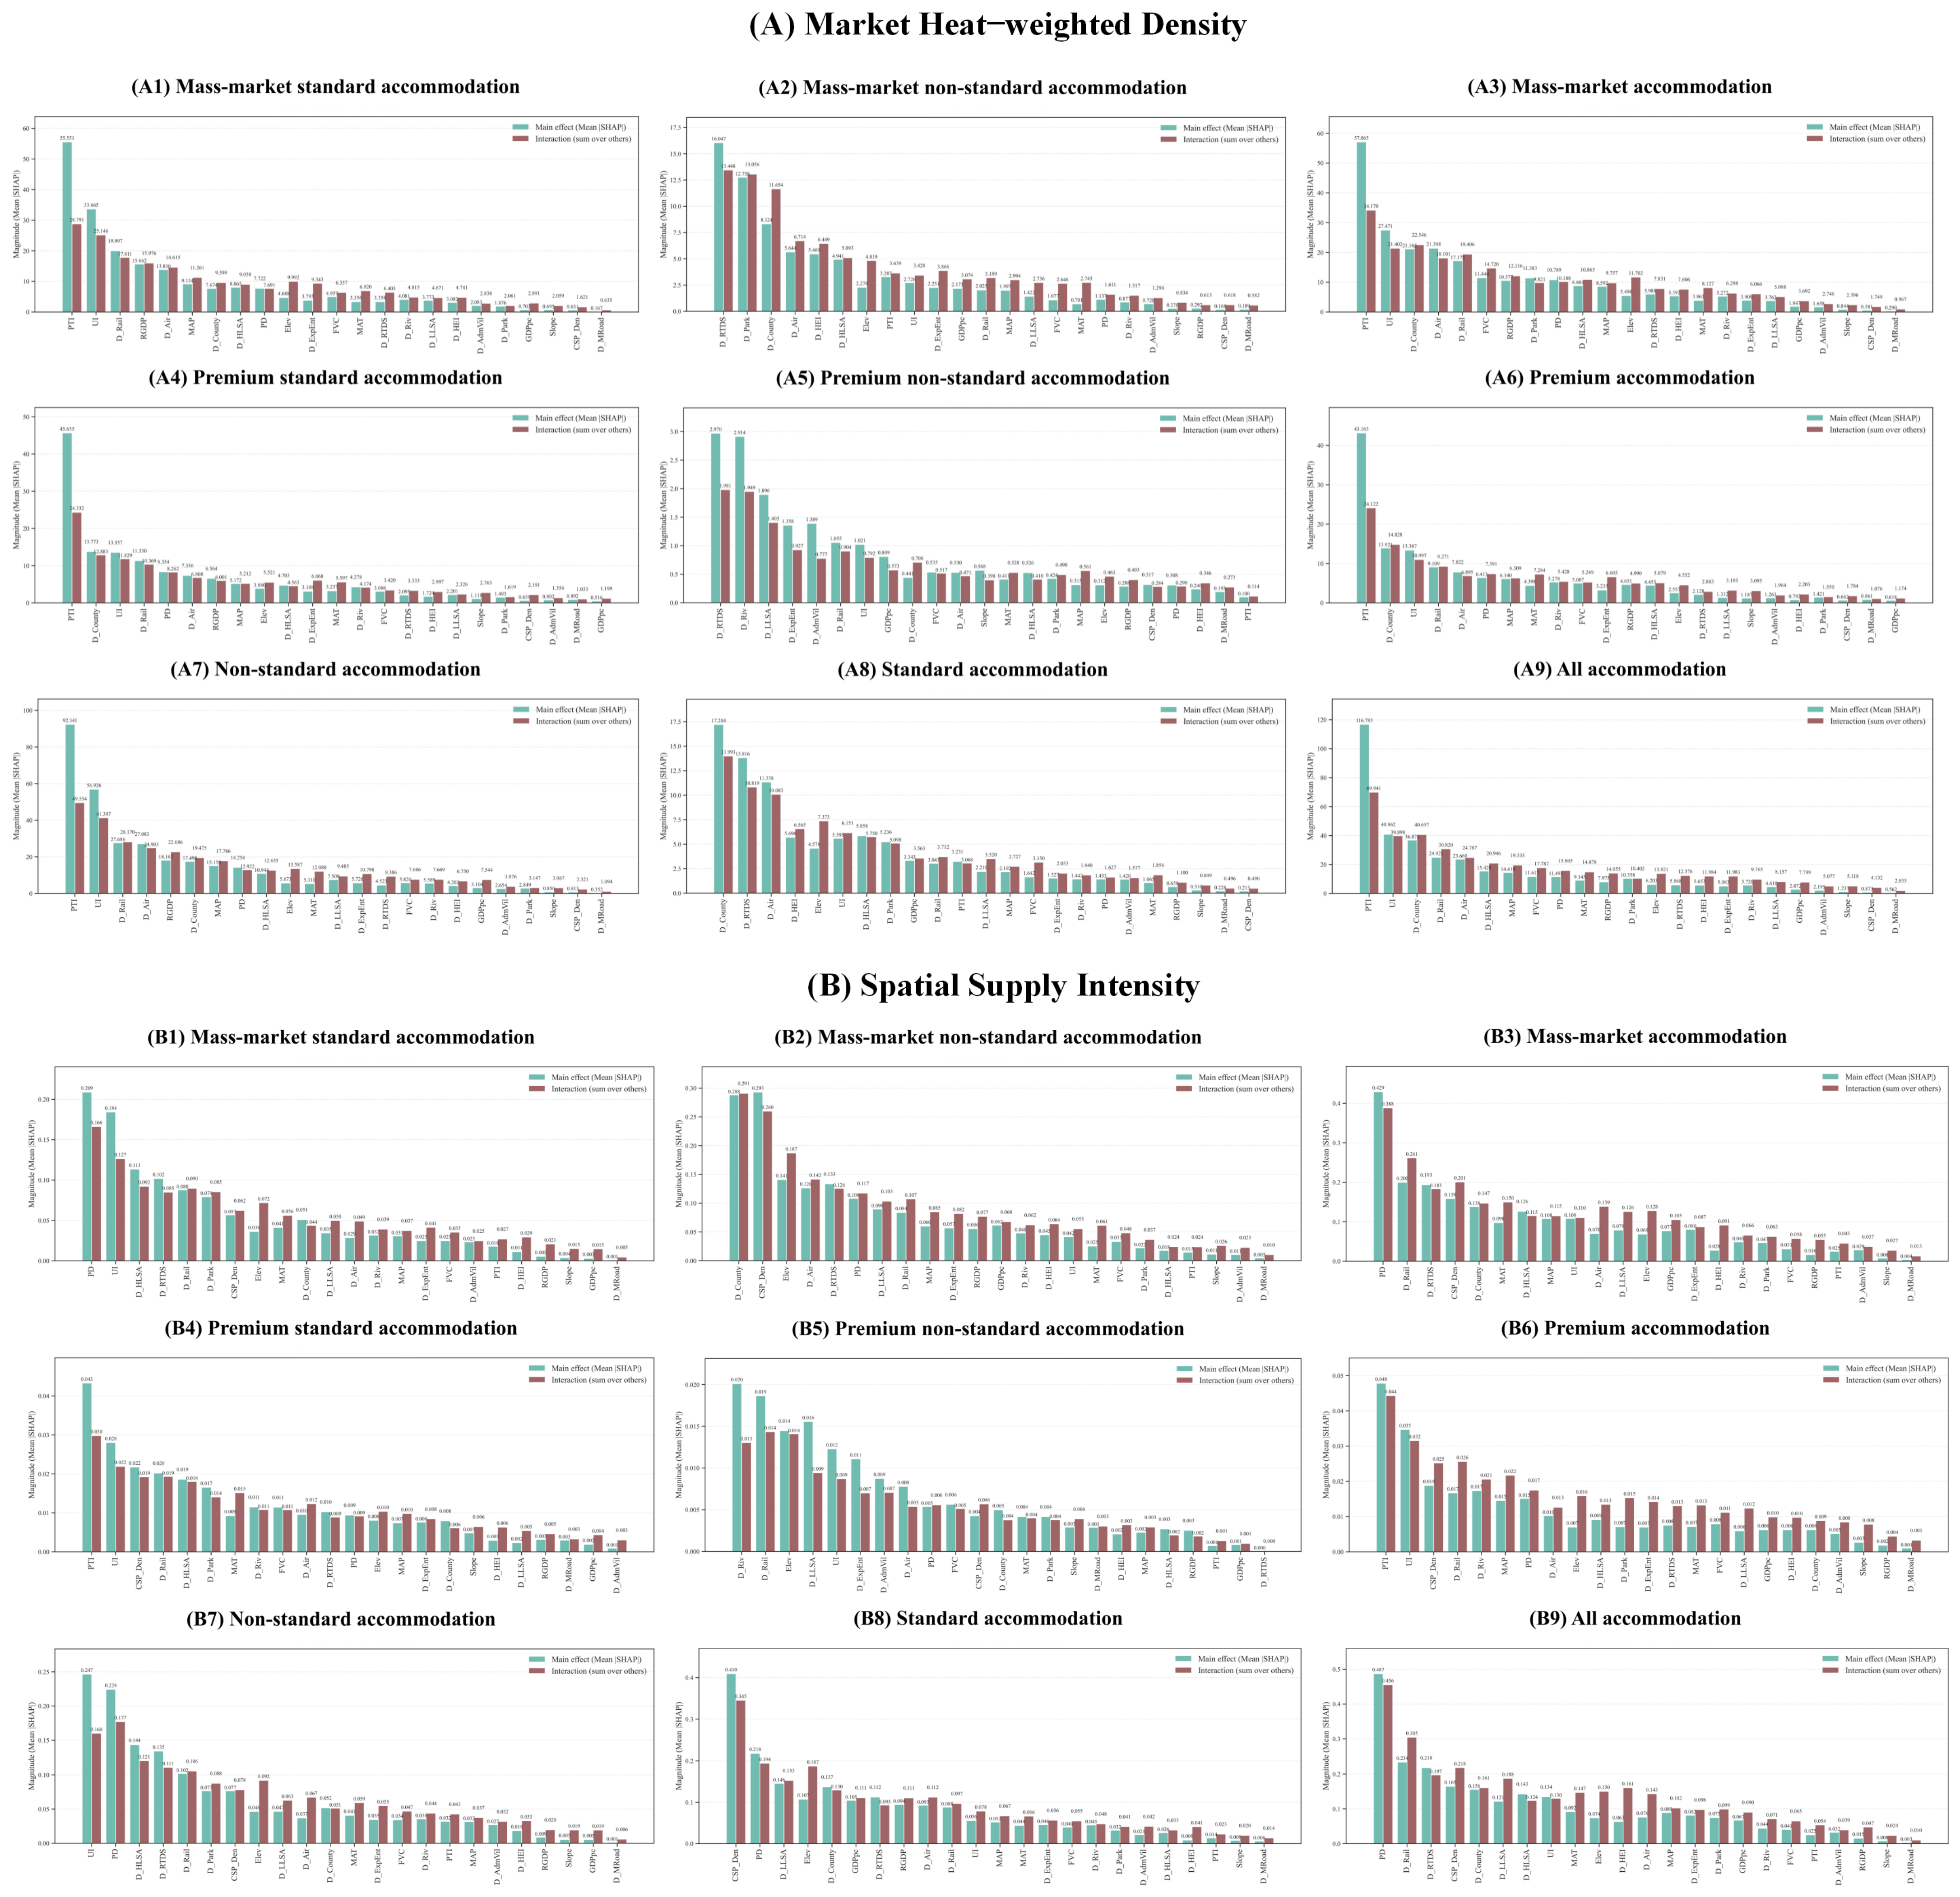
The interpretation included three parts: (1) global feature importance based on mean absolute SHAP values (
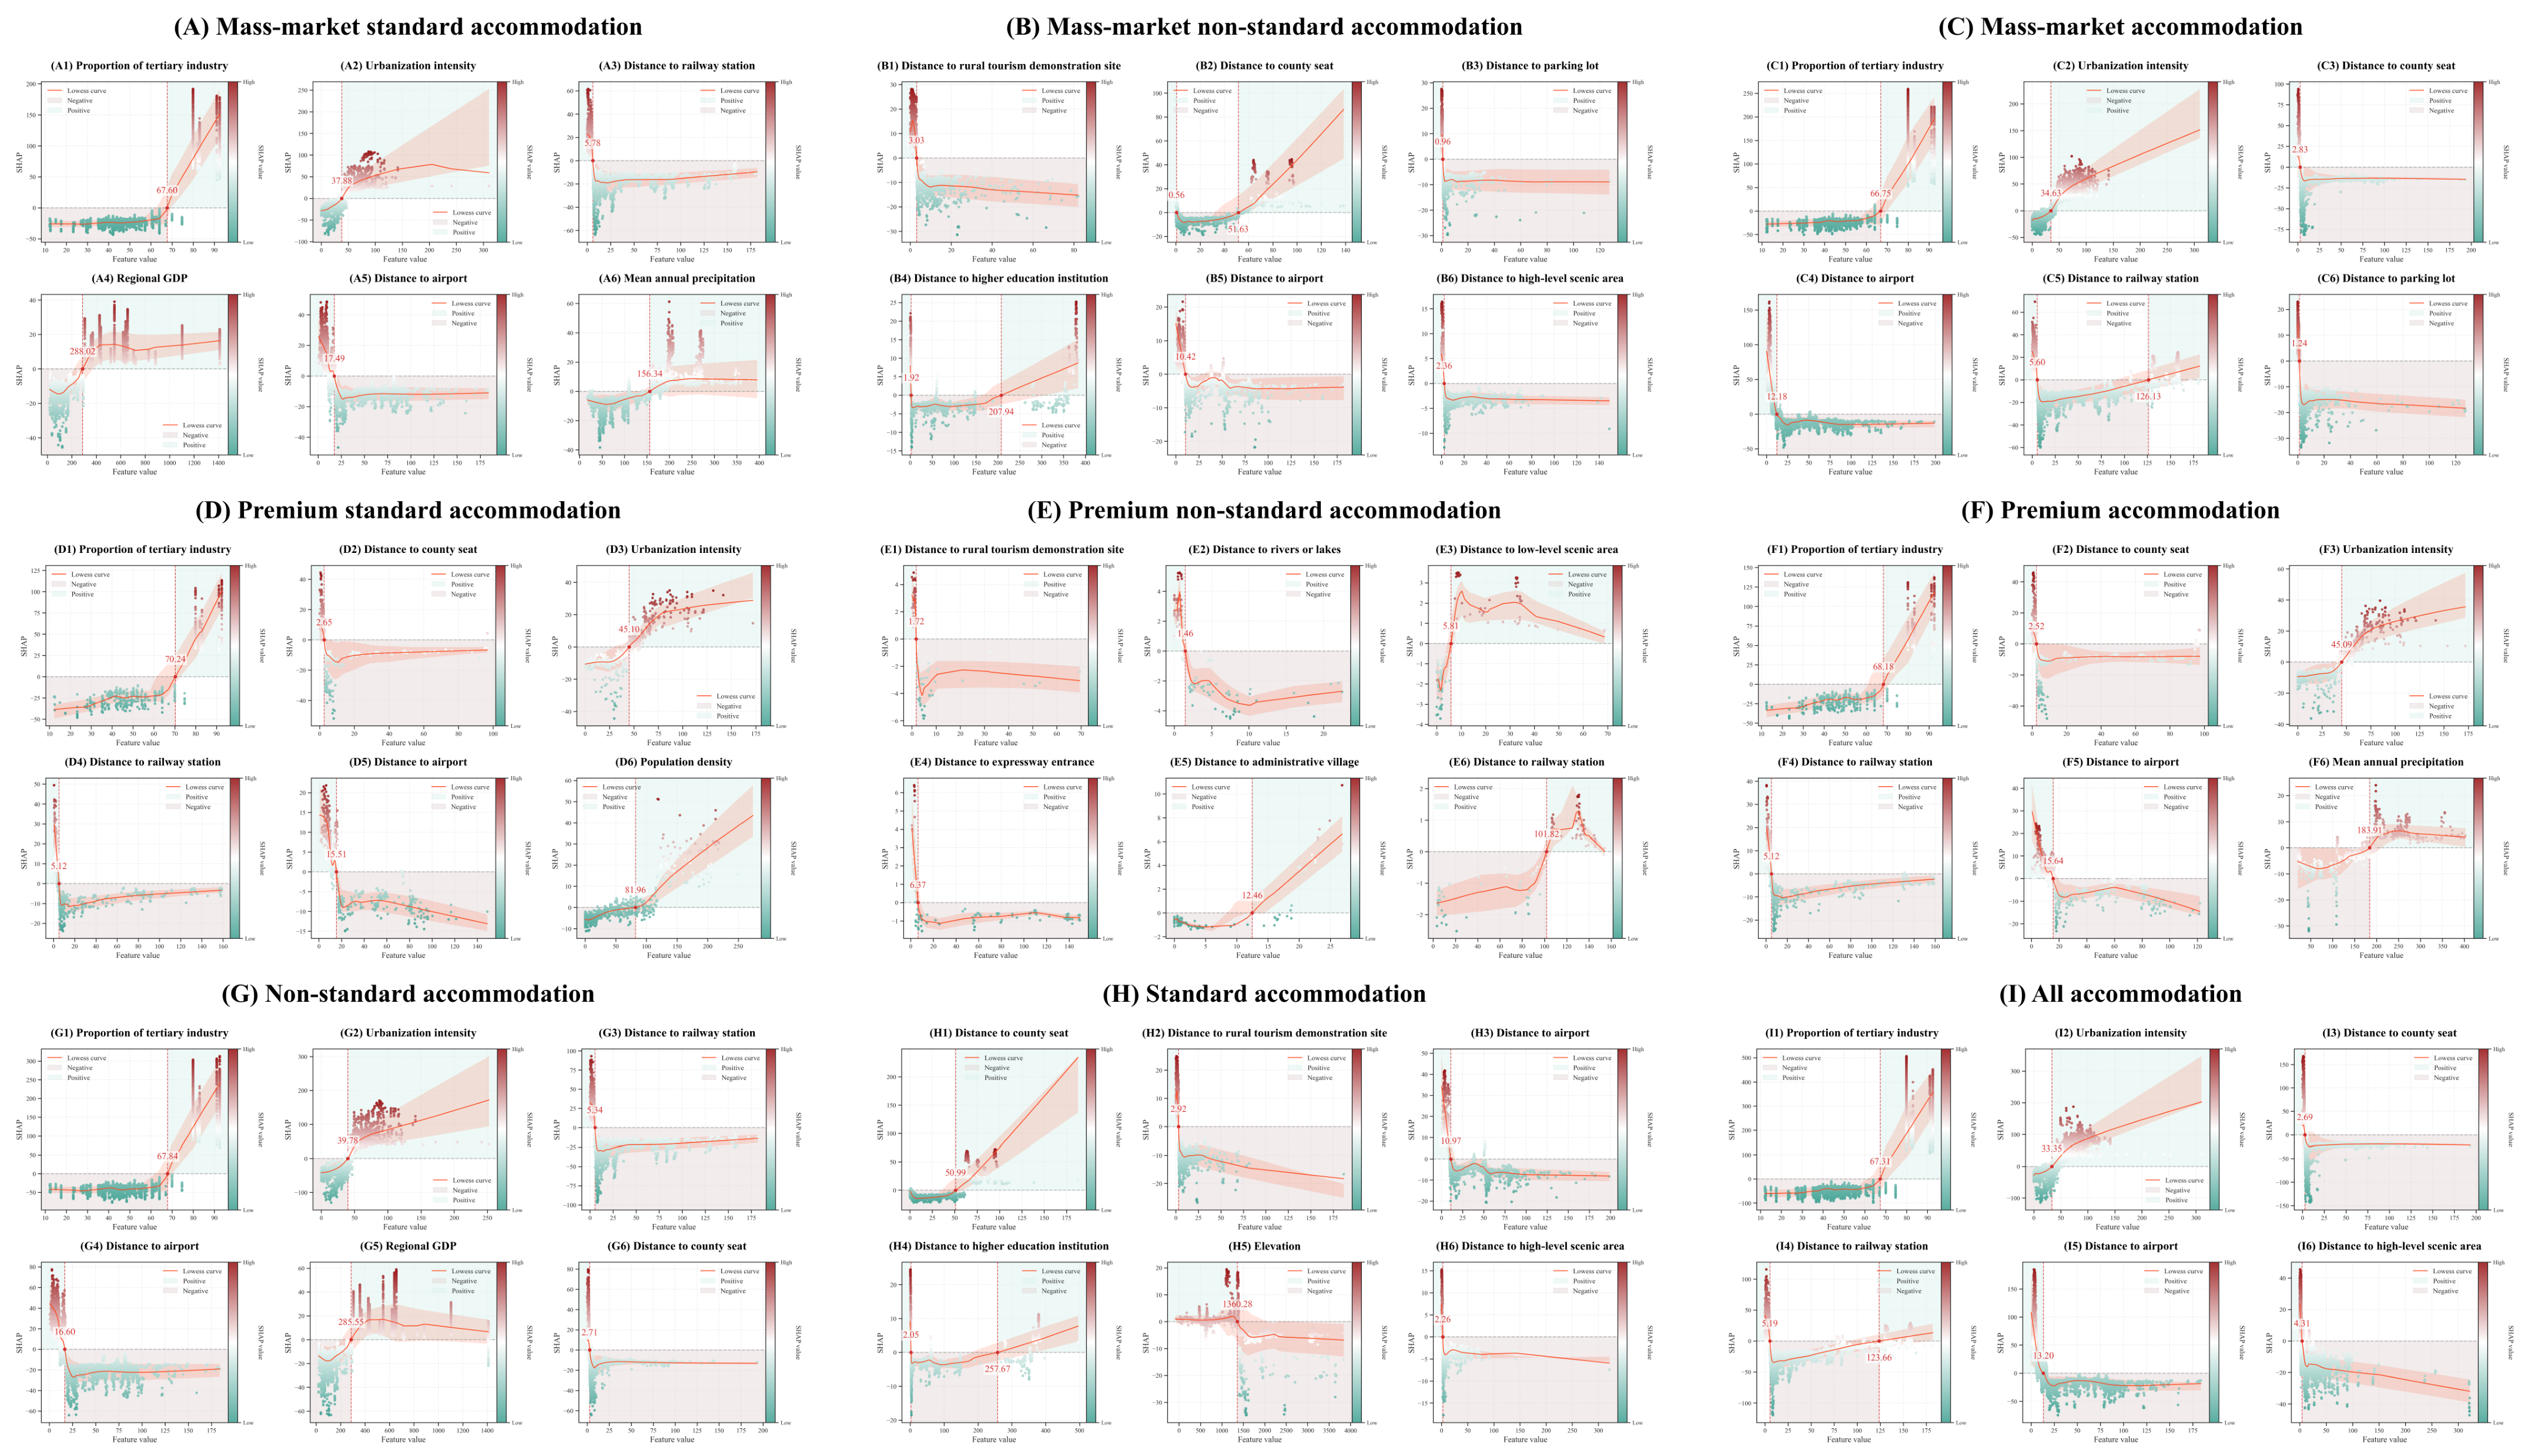
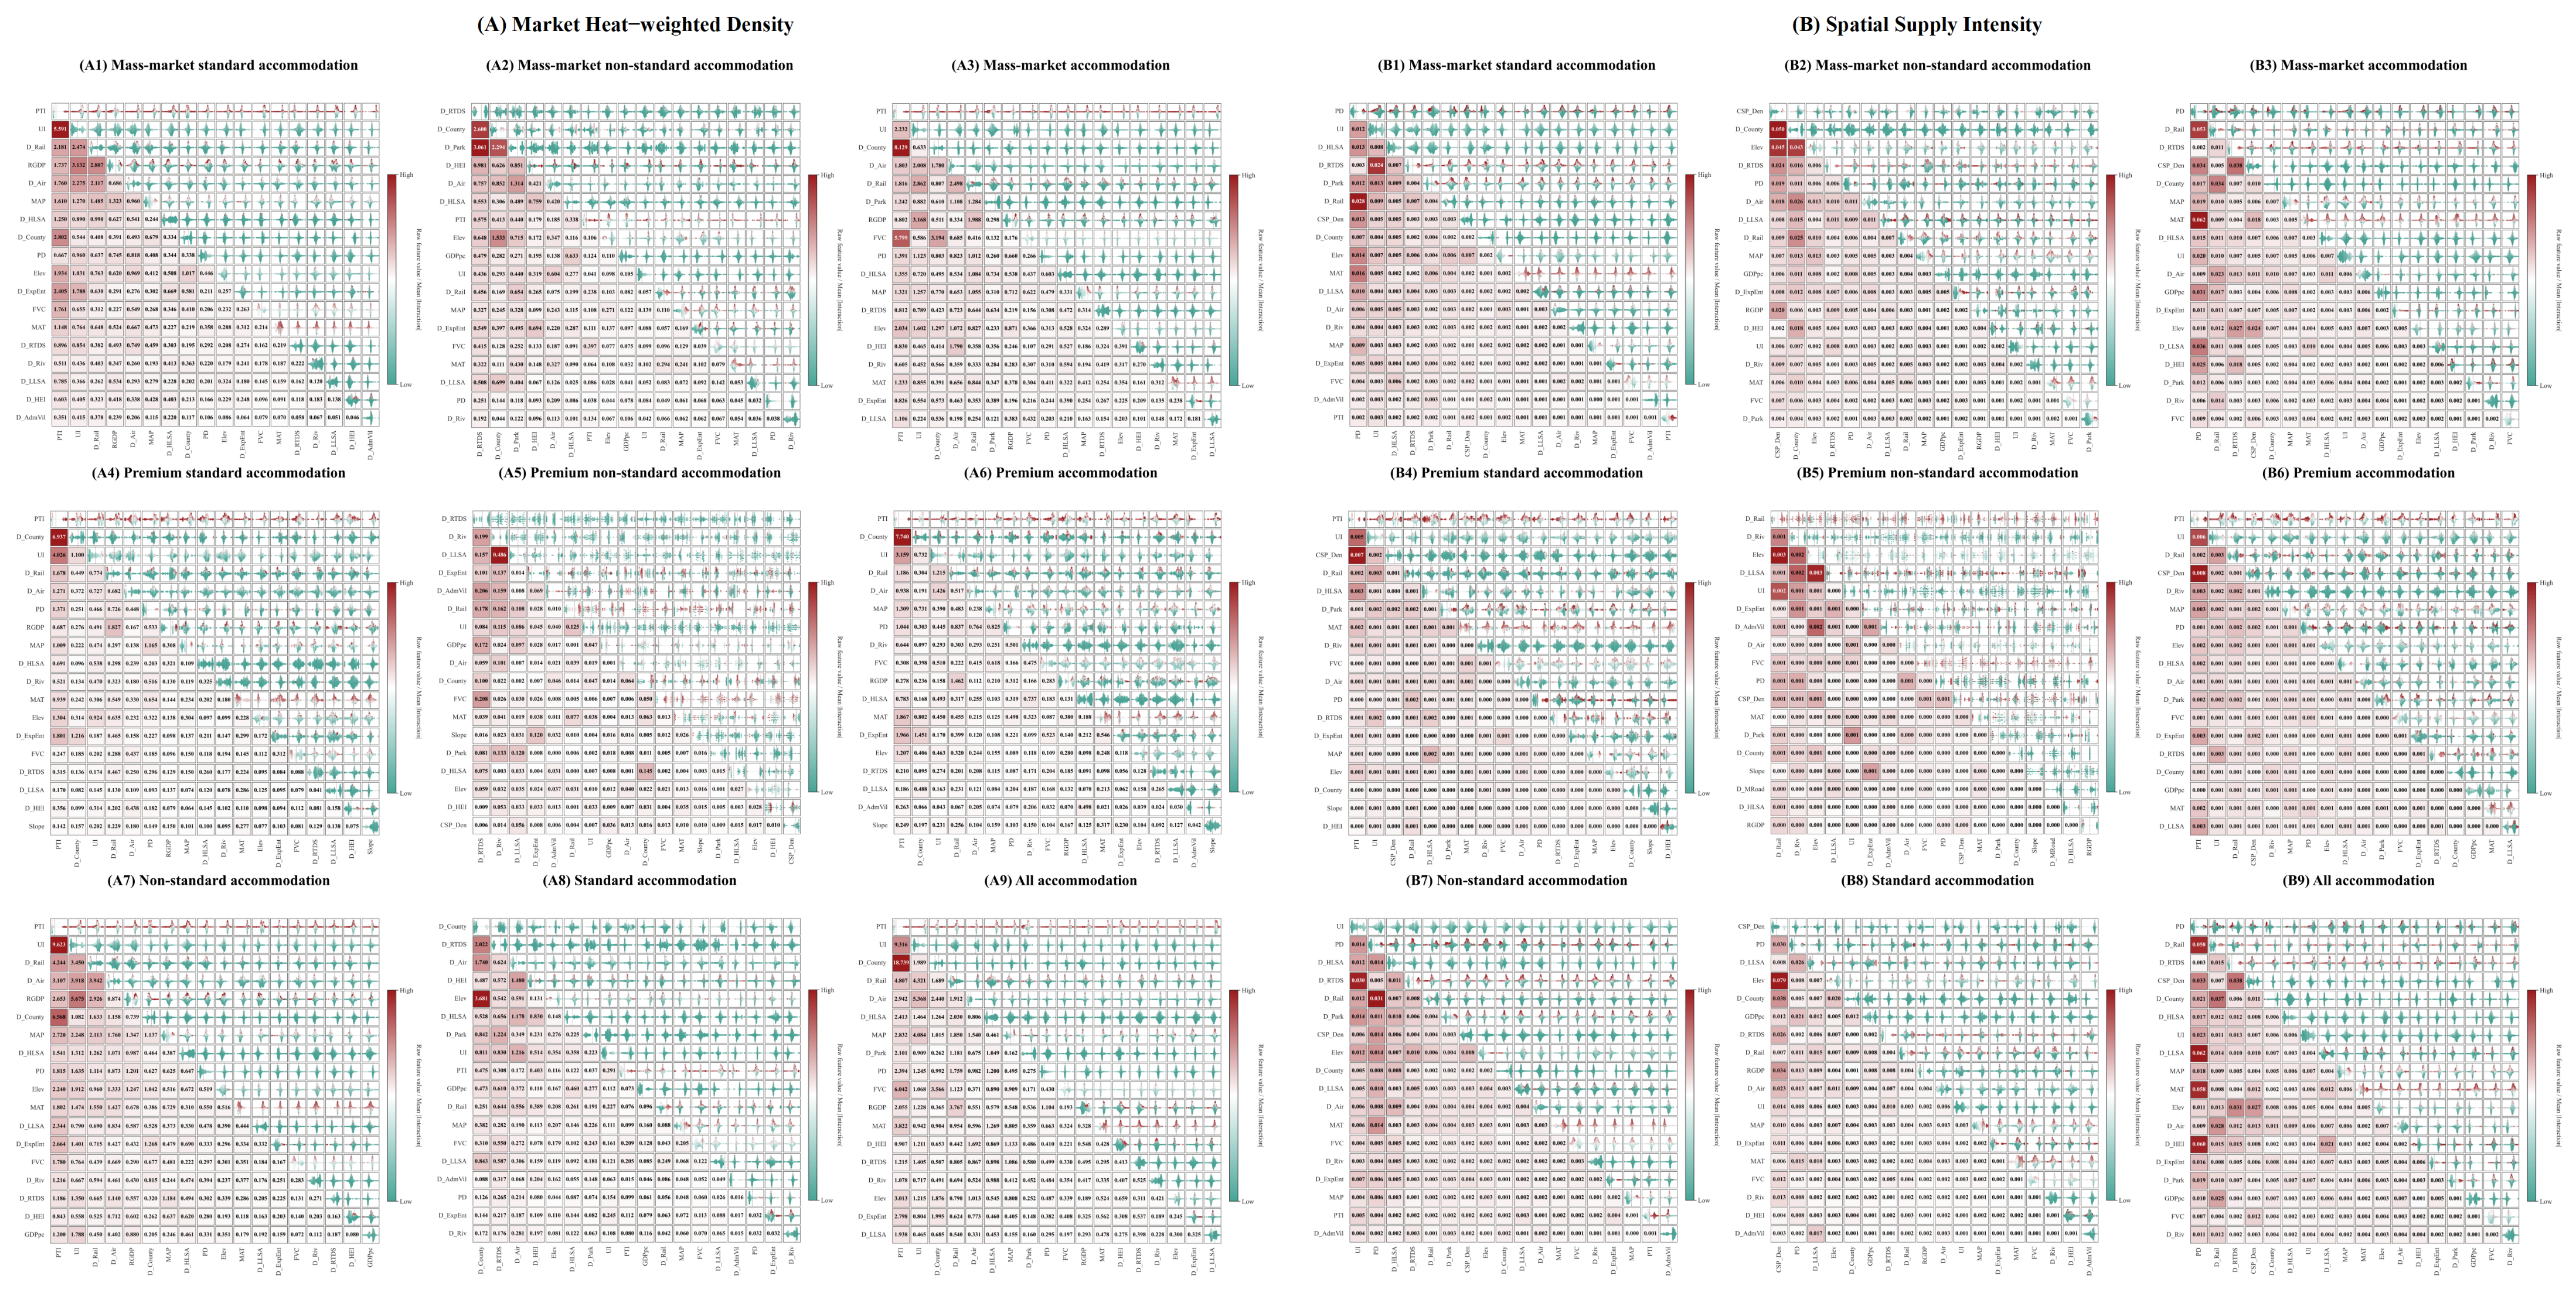
); (2) partial dependence profiles using LOWESS-fitted SHAP-feature scatter plots; and (3) interaction effects based on TreeSHAP pairwise interaction values:
Interaction direction and magnitude were used to classify three interaction types: amplifying, compensating and threshold interactions.
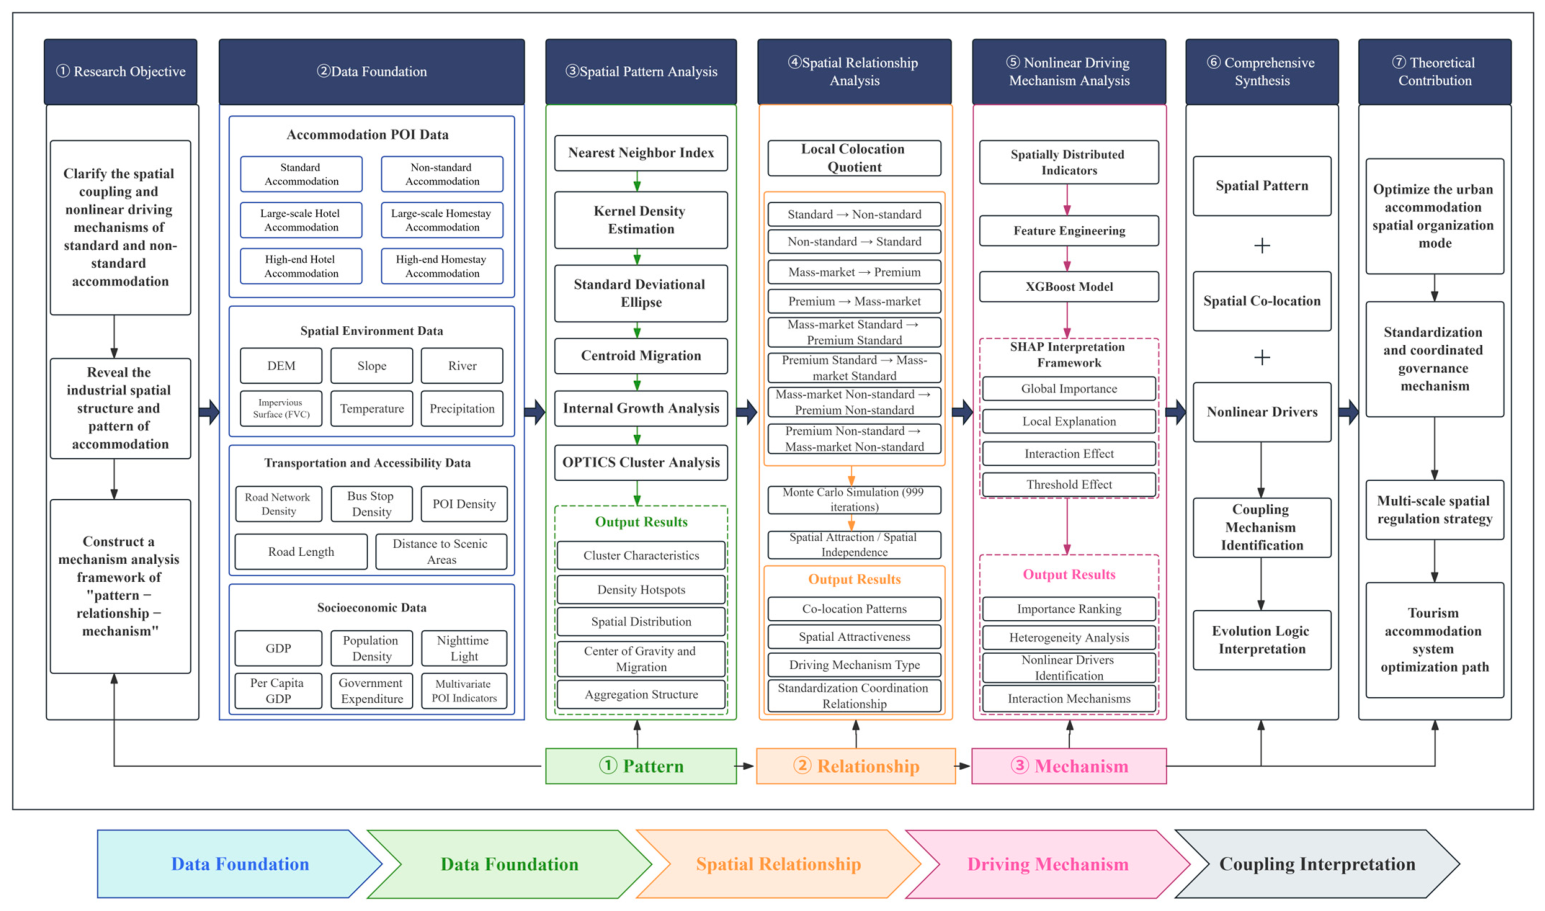
Figure 2 gives the analytical framework.
4. Discussion
4.1. Two Locational Regimes: Spatial Differentiation of Standard and Non-Standard Accommodation
The most central finding of this study is that standard and non-standard accommodation follow systematically different locational logics, a differentiation consistently observed across the full nine-category × two-perspective matrix. For standard accommodation (MS, PS, ST), SHAP importance is dominated by PD (16–18%), UI (14%), and D_Rail (7–11%)—population density, urbanization intensity, and railway accessibility—closely resembling the “urban centrality + transport node” gravitational field predicted by central place theory and location theory [
8,
10]. For non-standard accommodation (MNS, PNS, NS), the importance spectrum shifts toward D_RTDS (distance to rural tourism demonstration sites), D_Riv (distance to water bodies), Elev (elevation), and D_LLSA (distance to low-grade scenic areas), with economic variables contributing minimally. PNS-SSI is most extreme: D_Rail (13.8%) > D_Riv (11.0%) > Elev (9.4%), with economic variables barely entering the top six, exhibiting deep ecological embeddedness.
This differentiation is highly consistent with agglomeration economics predictions [
8]. Standard hotels primarily exploit urbanization economies—diversified labor pools, shared supplier networks, business visitor flows—and therefore anchor in city centers. Non-standard accommodation follows resource-oriented logics, where natural and cultural assets compensate for thinner local markets [
16]. TALC further predicts that as destinations evolve from exploration toward consolidation, the accommodation mix shifts from resource-dependent to market-oriented [
16,
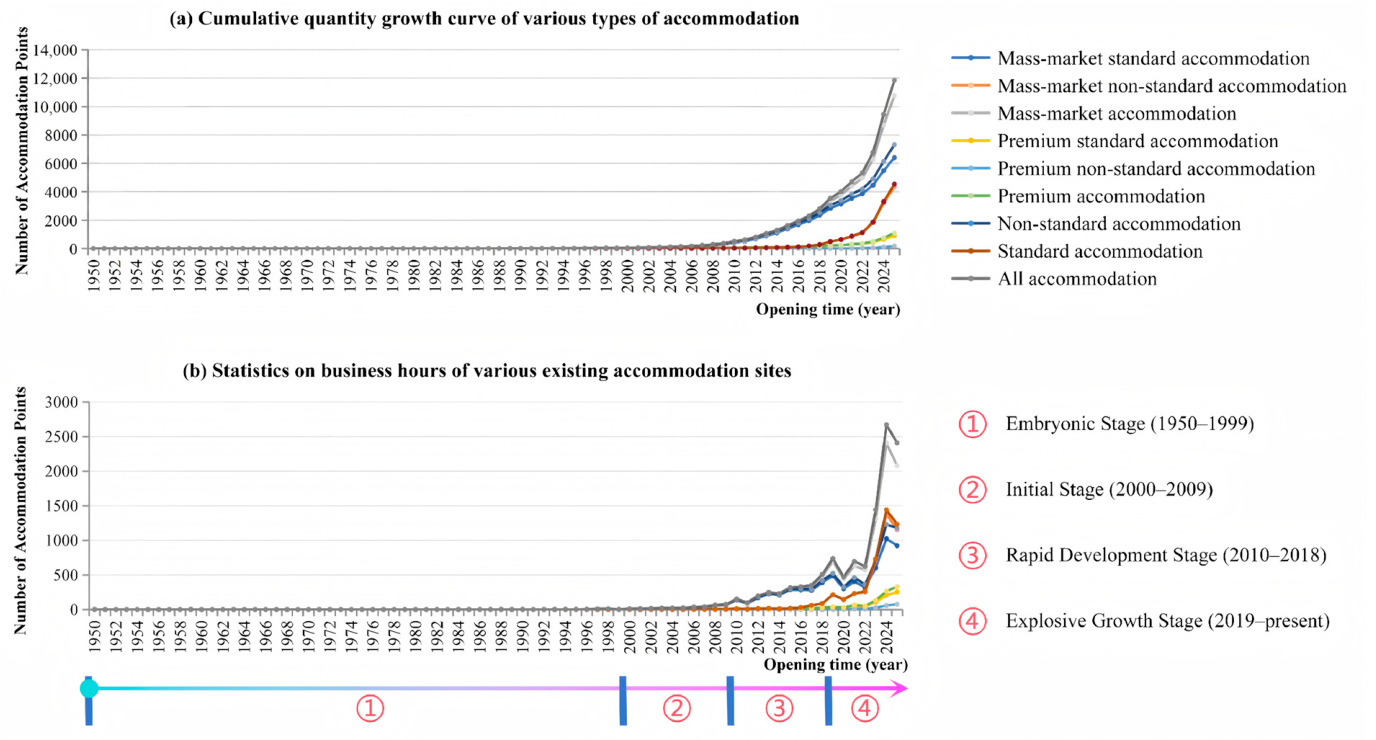
17]. Xinjiang is currently in the early-to-middle stages of this transition: the explosive growth of non-standard accommodation in the Ili Valley and Altay (since 2019) corresponds to TALC’s “involvement → development” stage, while Ürümqi’s standard hotel system has entered the “consolidation” stage.
The contrast between Burqin County and Ürümqi is the most vivid illustration of this differentiation. Ürümqi has 215 premium standard establishments (including 29 five-star) but zero premium non-standard establishments; Burqin has 49 premium non-standard establishments (first among all counties in Xinjiang) but very few premium standard establishments. The two represent entirely different visitor structures and market logics: Ürümqi is dominated by business travelers, where standardized service and brand reputation are core competitiveness; Burqin is dominated by sightseeing and leisure travelers, where local culture and landscape ambiance are core attractions.
4.2. Theoretical Interpretation of Nonlinear Thresholds
The threshold patterns observed in the SHAP partial-dependence plots represent exploratory spatial-economic associations with possible theoretical correspondences. Given the cross-sectional and exploratory nature of the analysis, they should not be interpreted as causal effects or as definitive evidence of the underlying mechanisms. This study identifies three categories of thresholds and their theoretical interpretations:
Market-size thresholds. PTI (tertiary industry share) produces a positive-to-negative transition at approximately 67% (MS-MHWD), corresponding to the qualitative transformation point where economic structure shifts from industry-dominated to service-dominated. Below this threshold, cities may lack the service-sector ecology to sustain chain hotel operations; above it, business visitor flows and service-sector labor pools plausibly render hotel investment viable. This pattern is consistent with Christaller’s market threshold concept [
8], which posits that facility existence requires a minimum demand scale. Similarly, PD thresholds at 3.37 persons/grid (MS-SSI) and 2.28 persons/grid (ALL-SSI) are consistent with the notion of a minimum population base required for accommodation facility operations.
Ecological constraint thresholds. The elevation threshold of 1360 m (ST-MHWD) broadly corresponds to the ecological habitability boundary of the Ili Valley and Kanas Basin—above this elevation, winter heating costs, construction difficulty, and visitor accessibility may deteriorate sharply, and the economic viability of accommodation investment is likely to decline substantially. The threshold effect of D_Riv is consistent with a strong constraint of water bodies on resort-type development in arid regions: in environments with annual precipitation of only 133–244 mm, distance to rivers/lakes may be a key condition governing landscape value and water-supply feasibility.
Agglomeration shadow effects. D_Rail produces dual thresholds at 5.8 km (MS-MHWD) and 90.6 km (ALL-SSI). Within 5.8 km, the effect is positive (passenger-flow dividends from railway stations); between 5.8 and 90.6 km, the effect is negative (the “intermediate zone” that is neither within railway-station radiation range nor in the urban core); beyond 90.6 km, the effect attenuates (remote tourism destinations such as Kanas and Tashkurgan do not depend on railways). This “agglomeration shadow” pattern has a theoretical correspondence in evolutionary economic geography [
19,
29]: early agglomeration around transport nodes is thought to create spatial lock-in, and entrants deviating from the locked-in zone may face increasing costs.
4.3. Directional Spatial Associations and Literature Comparison
The directional spatial associations revealed by LCLQ analysis exhibit hierarchical characteristics consistent with central place theory predictions [
8]. The standard → non-standard directional association concentrates in culturally distinctive destinations such as Kashgar Old City, Yining, Tashkurgan, Xinyuan, and Tekes, indicating that in mature tourism areas, significant positive spatial association exists between prior non-standard accommodation agglomeration and subsequent standard hotel investment. This pattern is consistent with the hierarchical diffusion pattern found by Chen & Wei (2025) [
42] in Chinese urban hotels, but this study further reveals the spatial selectivity of this association in arid regions—it manifests only at nodes where cultural IP is sufficiently strong, rather than being pervasive.
The reverse (standard → non-standard) association concentrates mainly in regional center cities such as Ürümqi and Korla, indicating that in administrative centers, spatial association exists between standard hotel agglomeration and subsequent non-standard accommodation emergence, but in cultural core areas, non-standard accommodation continues to follow cultural landscapes rather than hotel clusters.
The premium → mass-market directional association appears in the urban cores of Ürümqi, Hotan, Korla, and Kuytun, and is consistent with shared destination quality, market structure, and demand conditions [
65]. However, the mass-market → premium direction appears only sporadically, indicating that premium-accommodation locations are more strongly associated with destination quality and market structure than with the density of lower-tier properties.
It must be reiterated that all “associations” described above are spatial-statistical descriptions and do not constitute causal inference. Temporal precedence is a necessary but insufficient condition; unobserved third-party factors (e.g., government tourism functional-zone designation, scenic-area rating upgrades, major transport infrastructure openings) may simultaneously drive location choices across multiple categories.
4.4. Sustainability Implications and Category-Differentiated Governance
The findings of this study carry direct policy implications for sustainable tourism development in arid regions. The identified nonlinear thresholds provide spatially explicit reference points for planning:
Ecological feasibility boundaries. The 1360 m elevation threshold and D_Riv threshold effects jointly define the ecological feasibility envelope for accommodation development. Under the SDG 6 (Clean Water) and SDG 15 (Life on Land) frameworks, development beyond these boundaries faces dual risks of water-resource unsustainability and ecological degradation. Planning tools can incorporate these thresholds as “red-line” parameters to monitor whether accommodation growth is encroaching on ecologically sensitive zones.
Category-differentiated governance. The locational logic of standard accommodation (urban centrality + transport nodes) implies that its expansion is primarily market-driven, and policy intervention should focus on intra-urban land-use coordination and transport connectivity. The locational logic of non-standard accommodation (tourism resources + ecological assets) implies that its expansion directly touches ecologically sensitive zones, and policy intervention should focus on light-touch registration, ecological monitoring, and water-resource auditing. The deep ecological embeddedness of premium non-standard accommodation (PNS)—highest elevation, steepest slopes, lowest urbanization intensity—makes it the highest ecological-risk category, requiring ecological certification, carrying-capacity limits, and digital visibility support.
Cluster-hierarchy planning. The four-tier cluster structure identified by OPTICS provides a spatial framework for differentiated investment: Level 1 (>3000 facilities) requires quality upgrading and capacity management; Level 2 (900–1100) requires connectivity and joint marketing; Level 3 (300–600) requires infrastructure and incentives; Level 4 (<200) requires targeted incubation or development restraint.
4.5. Limitations and Future Directions
This study has several limitations. First, data originate from the Ctrip platform and may not fully cover unregistered or non-platformized accommodation [
27,
66,
67]; diamond ratings and review counts, as platform proxy indicators, may deviate from true market demand. Second, XGBoost-SHAP identifies statistical association rather than causation [
68,
69,
70], and some interaction effects may be influenced by confounding variables; the temporal precedence setting in LCLQ is a necessary but insufficient condition for causal inference. Third, the cross-sectional design limits characterization of dynamic evolutionary processes in the accommodation system. Future research could incorporate multi-period panel data to track temporal evolution of inter-category spatial associations, employ quasi-experimental designs or instrumental variable approaches to explore causal pathways, and conduct comparative studies with other western arid regions (e.g., the Hexi Corridor, Qaidam Basin) to test the external applicability of the present findings.
5. Conclusions
Drawing on 12,073 accommodation establishments from the Ctrip platform, this study constructed a staged analytical framework of “description → decomposition → explanation” and systematically examined the spatial distribution heterogeneity, directional spatial associations, and nonlinear driving mechanisms of accommodation facilities in Xinjiang across the full matrix of nine categories × two perspectives. The principal conclusions are as follows:
(1) Accommodation facilities in Xinjiang exhibit a highly concentrated “single-core, multi-center” structure, with Ürümqi as the absolute core and Kashgar and Yining as secondary anchors, expanding rapidly toward the Ili Valley and Altay since 2019. OPTICS clustering identified 13 spatial urban groups, and parameter sensitivity analysis confirmed that this structure is highly robust within the range of search distances 70–100 km and MinPts 100–150 (ARI ≥ 0.98).
(2) Standard and non-standard accommodation follow systematically different locational logics. The SHAP importance of standard accommodation is dominated by population density, urbanization intensity, and railway accessibility, consistent with the urban-centrality gravitational field predicted by central place theory and location theory; non-standard accommodation shifts toward ecological resource variables including distance to rural tourism demonstration sites, water-body distance, and elevation, with economic variables contributing minimally. This differentiation is consistently observed across all 18 models in the nine-category × two-perspective matrix.
(3) Driving factors exhibit pronounced nonlinear associations: the proportion of tertiary industry shows a positive-to-negative transition at approximately 67%; elevation is associated with an inflection near 1360 m for non-standard accommodation; and railway-station distance and distance to rural tourism demonstration sites show nonlinear association patterns. Residual Moran’s I diagnostics (reduction 83–99.7%) suggest that these findings are unlikely to be artifacts of spatial autocorrelation, while we acknowledge that this diagnostic complements rather than replaces spatially blocked validation.
(4) Directional local co-location quotient analysis reveals hierarchical spatial associations among categories: the positive association between prior non-standard accommodation agglomeration and subsequent standard hotel investment appears only at nodes with sufficiently strong cultural IP (Kashgar Old City, Yining, Tashkurgan) rather than being pervasive; hierarchical association within standard accommodation is characterized by unidirectional spatial information flow; and spatial association of premium non-standard accommodation is constrained by extremely high resource thresholds, manifesting only in a few destinations such as Burqin and Xinyuan.
The contribution of this study lies in integrating XGBoost–SHAP, KDE, OPTICS, and LCLQ into a staged analytical framework and systematically implementing it across the full nine-category × two-perspective matrix of arid-region accommodation systems, thereby identifying two locational regimes, nonlinear thresholds, and directional spatial associations that provide a spatially explicit evidence base for category-differentiated sustainable tourism governance. In practical terms, these findings may offer quantitative references for ecological feasibility screening, differentiated management pathway design, and investment prioritization discussions for accommodation development in arid regions, though their policy translation requires longitudinal monitoring data and local governance context.


_Li.png)