Article

Recycled LDPE–Sand Composites as Cement-Free Construction Materials: Effects of Processing Parameters on Mechanical and Physical Properties


by
Olusola Femi Olusunmade
1,
S. Joseph Antony
1,*,
Eric Danso-Boateng
1 and
Vasilis Sarhosis
2
1
School of Chemical and Process Engineering, University of Leeds, Leeds LS2 9JT, UK
2
School of Civil Engineering, University of Leeds, Leeds LS2 9JT, UK
*
Author to whom correspondence should be addressed.
Sustainability 2026, 18(17), 8641; https://doi.org/10.3390/su18178641
Submission received: 29 July 2026 / Revised: 17 August 2026 / Accepted: 20 August 2026 / Published: 24 August 2026
(This article belongs to the Section Sustainable Engineering and Science)

Abstract

This study investigates recycled low-density polyethylene (LDPE)–sand composites as cement-free materials for selected construction applications. The effects of plastic content (30–50 wt.%), processing temperature (220–260 °C), and particle size (319–1015 µm) on mechanical and physical properties were evaluated using a Taguchi L9 experimental design. Mechanical properties, including compressive, flexural, and tensile strength, and physical properties, including density and water absorption, were assessed using laboratory-scale specimens prepared from moulded composite panels. Processing temperature was the dominant factor controlling strength development and water absorption reduction. The best-performing experimental condition within the investigated range was 30 wt.% LDPE, 260 °C, and 1015 µm particle size, yielding an apparent compressive strength of 65.5 MPa, flexural strength of 20.7 MPa, tensile strength of 4.4 MPa, density of 1595.2 kg/m3, and water absorption of 0.7%. Cross-validation showed good predictive capability for density, tensile strength, flexural strength, and water absorption, but only moderate predictive capability for compressive strength and compressive modulus. Therefore, the regression models are presented as screening tools within the investigated parameter range rather than as general design models. The results indicate that recycled LDPE–sand composites have potential for selected non-structural and limited semi-structural applications, subject to further product-standard testing, durability assessment, fire performance evaluation, and environmental impact analysis.

1. Introduction

Global construction and infrastructure development continue to expand, intensifying environmental pressures associated with material production and resource consumption [1,2,3]. Conventional construction materials, particularly cement and concrete, contribute significantly to global greenhouse gas emissions and energy use, accounting for a substantial proportion of total environmental impact [4,5,6,7,8]. In addition, increasing demand for construction materials accelerates depletion of natural resources and exacerbates environmental degradation [9,10,11,12,13,14]. These challenges highlight the need for alternative materials that are both resource-efficient and environmentally sustainable [15,16].
One promising approach is the incorporation of waste materials into construction products, reducing reliance on virgin resources while improving environmental performance [16]. Among these, plastic waste, particularly low-density polyethylene (LDPE), presents a significant opportunity due to its high production volume and persistence in the environment. LDPE is widely used in packaging applications, with an estimated global production capacity of approximately 23–25 million tons in 2025 [17]. However, it is often inadequately managed at end of life, contributing to widespread accumulation in terrestrial and marine environments [17,18,19,20,21]. This issue is particularly pronounced in regions with limited waste management infrastructure [22,23,24,25,26]. Consequently, increasing attention has been directed toward the reuse of LDPE in construction applications, including its use as a partial aggregate substitute or as an additive in cementitious systems [27,28].
However, such approaches typically result in only partial replacement of conventional materials and limited utilisation of plastic waste. An alternative strategy is the development of plastic–sand composites in which plastic acts as the primary binder, thereby eliminating cement entirely. This approach addresses both cement-related emissions and plastic waste management. Previous studies involving LDPE, HDPE, and PET-based composites have shown that mechanical properties are strongly influenced by the plastic–sand ratio, with strength increasing up to an optimal sand content before declining due to insufficient binder for effective cohesion [29,30,31,32,33]. These systems exhibit behaviour governed by the balance between particle packing and matrix continuity [33,34,35].
In addition to composition, processing conditions play a critical role in determining composite performance. Processing temperature influences polymer viscosity, affecting particle wetting, porosity, and interfacial bonding. Higher temperatures generally improve polymer flow and consolidation, although excessive temperatures may lead to degradation effects [36,37]. Particle size also affects packing density and interfacial characteristics, with finer particles increasing surface area for bonding and coarser particles potentially enhancing mechanical interlocking under suitable conditions [38]. Similarly, plastic content governs the balance between stiffness and ductility, influencing load transfer within the composite. These parameters are interdependent, and their combined effects are not always systematically evaluated.
Despite growing interest in plastic–sand composites, many studies have considered processing variables in isolation or within limited experimental frameworks. Fewer studies have examined the combined influence of plastic content, processing temperature, and particle size using structured experimental design approaches. In addition, while variations in behaviour are frequently observed, interaction effects are often not explicitly addressed, and mechanistic interpretations remain largely qualitative.
This study addresses these gaps by investigating the combined effects of plastic content, processing temperature, and particle size on the mechanical and physical properties of LDPE–sand composites using a Taguchi experimental design. Building on previous work on PET-based composites [39], the study adopts LDPE as the binder and a simplified experimental design to enable the efficient evaluation of processing parameters. LDPE is selected due to its lower melting temperature and higher ductility, which influence melt flow and particle wetting behaviour.
The objectives of this study are to evaluate the influence of processing parameters on composite performance, develop empirical models for property prediction within the investigated range, and assess the potential of LDPE–sand composites as cement-free construction materials. Beyond the technical evaluation, the study contributes to sustainable development by exploring a route for diverting plastic waste from disposal pathways, reducing dependence on conventional cementitious materials, and supporting circular economy strategies for resource-efficient construction. While the study is limited to laboratory-scale evaluation, it aims to improve understanding of parameter interactions in LDPE–sand systems and provide evidence for the development of sustainable construction materials derived from recycled plastics. By combining waste plastic utilisation with cement-free production, the study contributes to ongoing efforts towards circular economy implementation, resource conservation, and reduction of the environmental burden associated with both plastic waste accumulation and conventional construction materials.
Furthermore, the proposed approach is aligned with broader sustainable development objectives by exploring the beneficial reuse of plastic waste and reducing dependence on conventional construction materials. In this regard, the study is relevant to the principles underlying the United Nations Sustainable Development Goals (SDGs), particularly SDG 12 (Responsible Consumption and Production), through its focus on waste valorisation and resource efficiency. However, environmental outcomes relating to waste diversion, pollution reduction, resource conservation, and end-of-life management were not quantified in the present study and therefore require further investigation.

2. Materials and Methods

This study follows the experimental framework reported in Olusunmade et al. [39] for PET-based composites, with two modifications: (i) the use of low-density polyethylene (LDPE) as the binder and (ii) the adoption of a Taguchi L9 orthogonal array in place of the L25 design to reduce experimental runs while enabling efficient parameter screening [40,41].
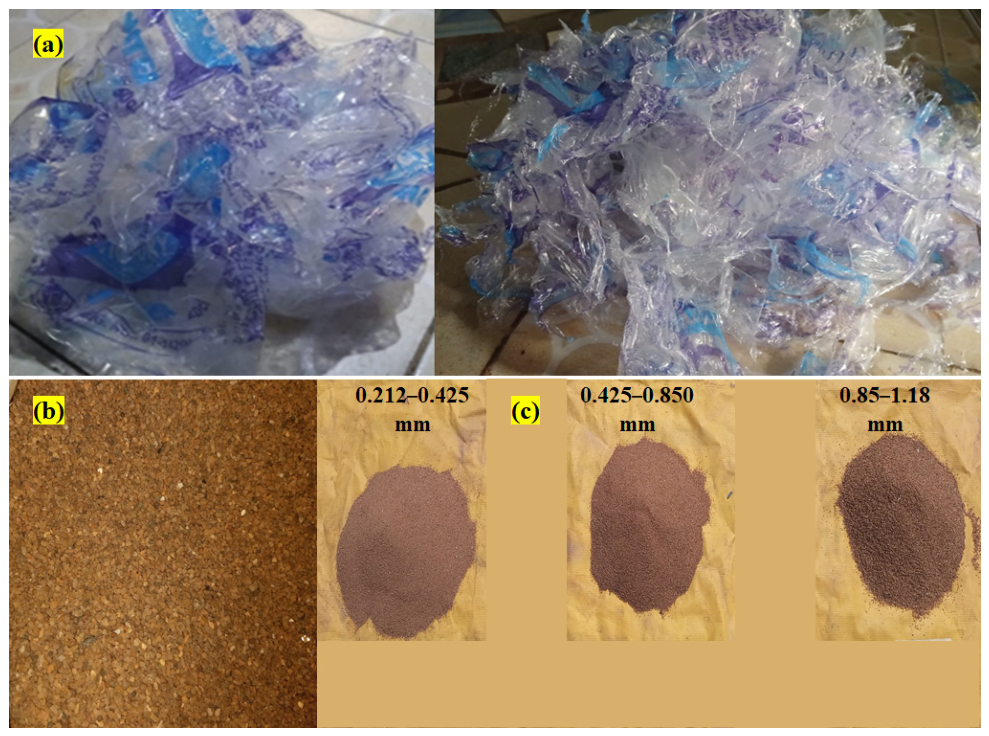
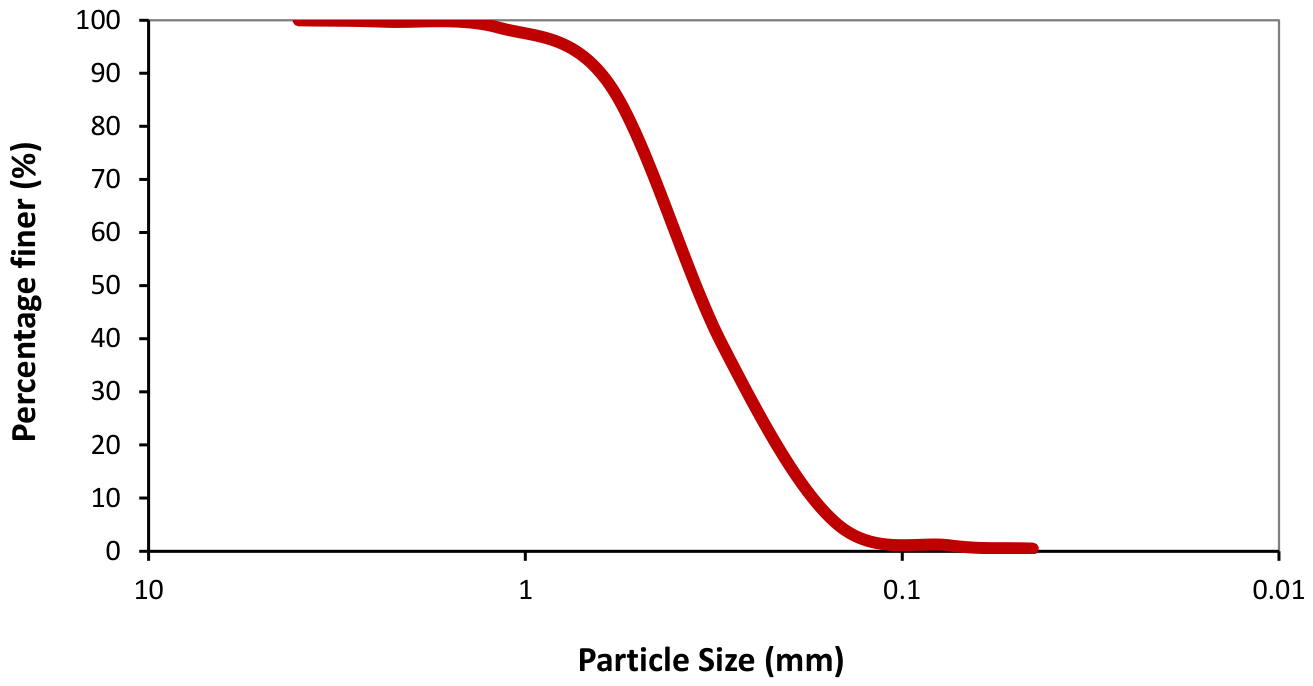
Recycled LDPE was sourced from discarded potable water sachets, as shown in Figure 1a. The materials were manually sorted, washed with recycled greywater, air-dried, and cut into fragments of approximately 5–20 mm to facilitate melting. Natural sand (Figure 1b) was oven-dried and sieved into three particle size ranges (Figure 1c): 0.212–0.425 mm, 0.425–0.850 mm, and 0.850–1.18 mm, corresponding to average particle diameters of 319 µm, 638 µm, and 1015 µm, respectively. These particle sizes span the medium-to-coarse sand fractions according to standard classification systems, with 319 µm representing medium sand, and 638 µm and 1015 µm falling within the coarse sand range [39,42,43]. The particle size distribution obtained from sieve analysis is presented in Figure 2.
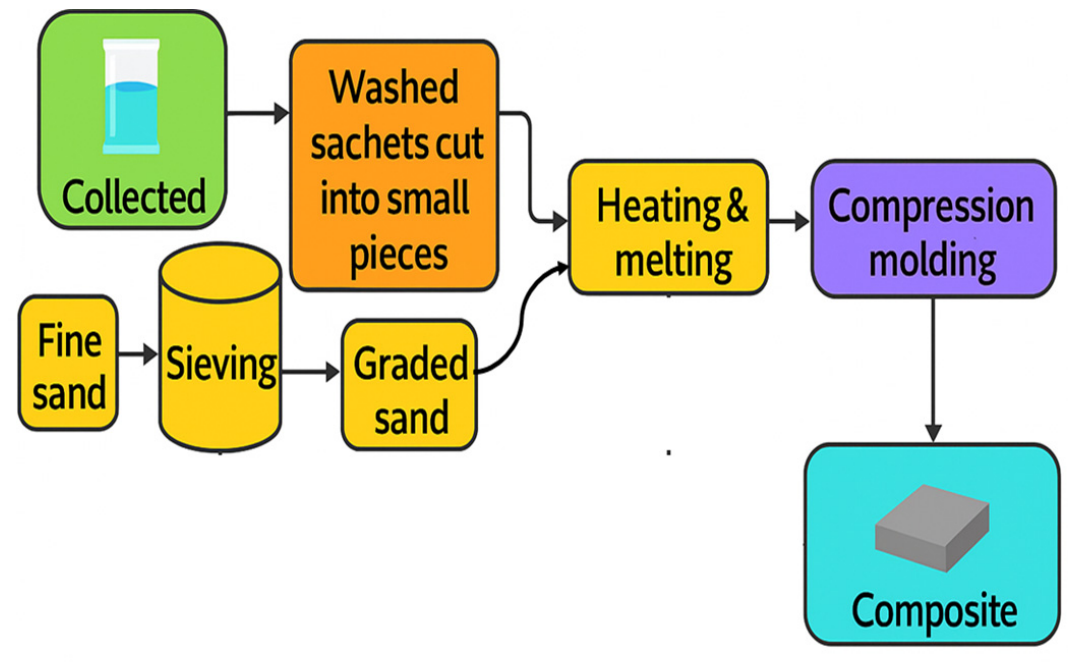
Composite preparation followed the workflow illustrated in Figure 3. LDPE was heated in a 15 L aluminium container for approximately 10 min until fully melted, after which preheated sand was gradually added and mechanically mixed for a further 10 min to ensure uniform coating. The mixture was then transferred into steel moulds and compacted under a uniaxial pressure of approximately 0.5 MPa to form panels measuring 200 × 100 × 15 mm. Processing temperatures ranged from 220 °C to 260 °C, and plastic-to-sand ratios of 30/70, 40/60, and 50/50 wt.% were used. The selected temperature range was based on the thermal behaviour of LDPE and previous studies on polymer–sand composites. LDPE typically exhibits a melting temperature of approximately 105–115 °C, while thermal degradation occurs predominantly between approximately 350 and 500 °C [44]. The selected temperatures were therefore expected to provide adequate polymer flow and particle coating while remaining below the principal thermal degradation range of LDPE, consistent with previously reported polyethylene-based composite systems [39,45].
The experimental design was based on a Taguchi L9 orthogonal array comprising three control factors: plastic content (PC), processing temperature (PT), and particle diameter (PD), each evaluated at three levels. The Taguchi method uses orthogonal arrays to evaluate multiple variables efficiently while reducing the number of experiments required compared with a full-factorial design [40,41]. For the present three-factor, three-level system, the L9 design reduced the required experimental runs from 27 to 9. The factor levels and experimental combinations are presented in Table 1.
Test specimens were prepared by cutting from the moulded panels. Specimens measuring 30 × 30 × 15 mm were used for compressive strength, density, and water absorption measurements; rectangular specimens measuring 100 × 12 × 15 mm were used for flexural testing; and rectangular strip specimens measuring 100 × 10 × 5 mm were used for tensile testing.
Mechanical testing was conducted using an INSTRON universal testing machine (Model 3369, 50 kN capacity; Instron, Norwood, MA, USA). Compressive, flexural, and tensile tests were performed under displacement control at a crosshead rate of 0.50 mm/min until failure, and peak loads were used to determine strength values. Flexural testing was conducted using a three-point bending configuration with a support span of 70 mm, while tensile testing was performed with an initial gauge length of 60 mm. Because the specimens were cut directly from laboratory-scale moulded panels, the measured properties should be interpreted as comparative indicators of material performance rather than direct qualification data for specific construction products.
The compression specimens measured 30 × 30 × 15 mm and therefore represent plate-like specimens rather than standard cubes. Consequently, the reported compressive strengths are apparent values for the adopted specimen geometry and should not be interpreted as equivalent to standard masonry or concrete cube strengths. Similarly, the tensile specimens were rectangular strips and did not employ a standard dog-bone geometry. Therefore, the measured tensile strengths are intended primarily for comparative assessment of processing-variable effects on composite performance.
Density was calculated from the mass-to-volume ratio of each specimen, while water absorption was measured after immersion in water for 24 h at approximately 23 °C.
All experiments were conducted in triplicate, and mean values with corresponding standard deviations are reported. Triplicate testing was adopted to provide an estimate of repeatability while maintaining a practical laboratory-scale testing programme.

3. Results

The measured mechanical and physical properties of the LDPE–sand composites obtained under different processing conditions are summarised in Table 2. Results are presented as mean values ± standard deviations obtained from triplicate testing. Variability differed among the measured responses, with some properties exhibiting greater scatter than others. The influence of plastic content (PC), processing temperature (PT), and particle diameter (PD) was evaluated using statistical analysis (p ≤ 0.05), with parameter effects varying depending on the response considered.

3.1. Mechanical Properties of the Composites

The mechanical properties of the LDPE–sand composites, including compressive strength, compressive modulus, flexural strength, and tensile strength, are discussed in the following sections.

3.1.1. Compressive Strength

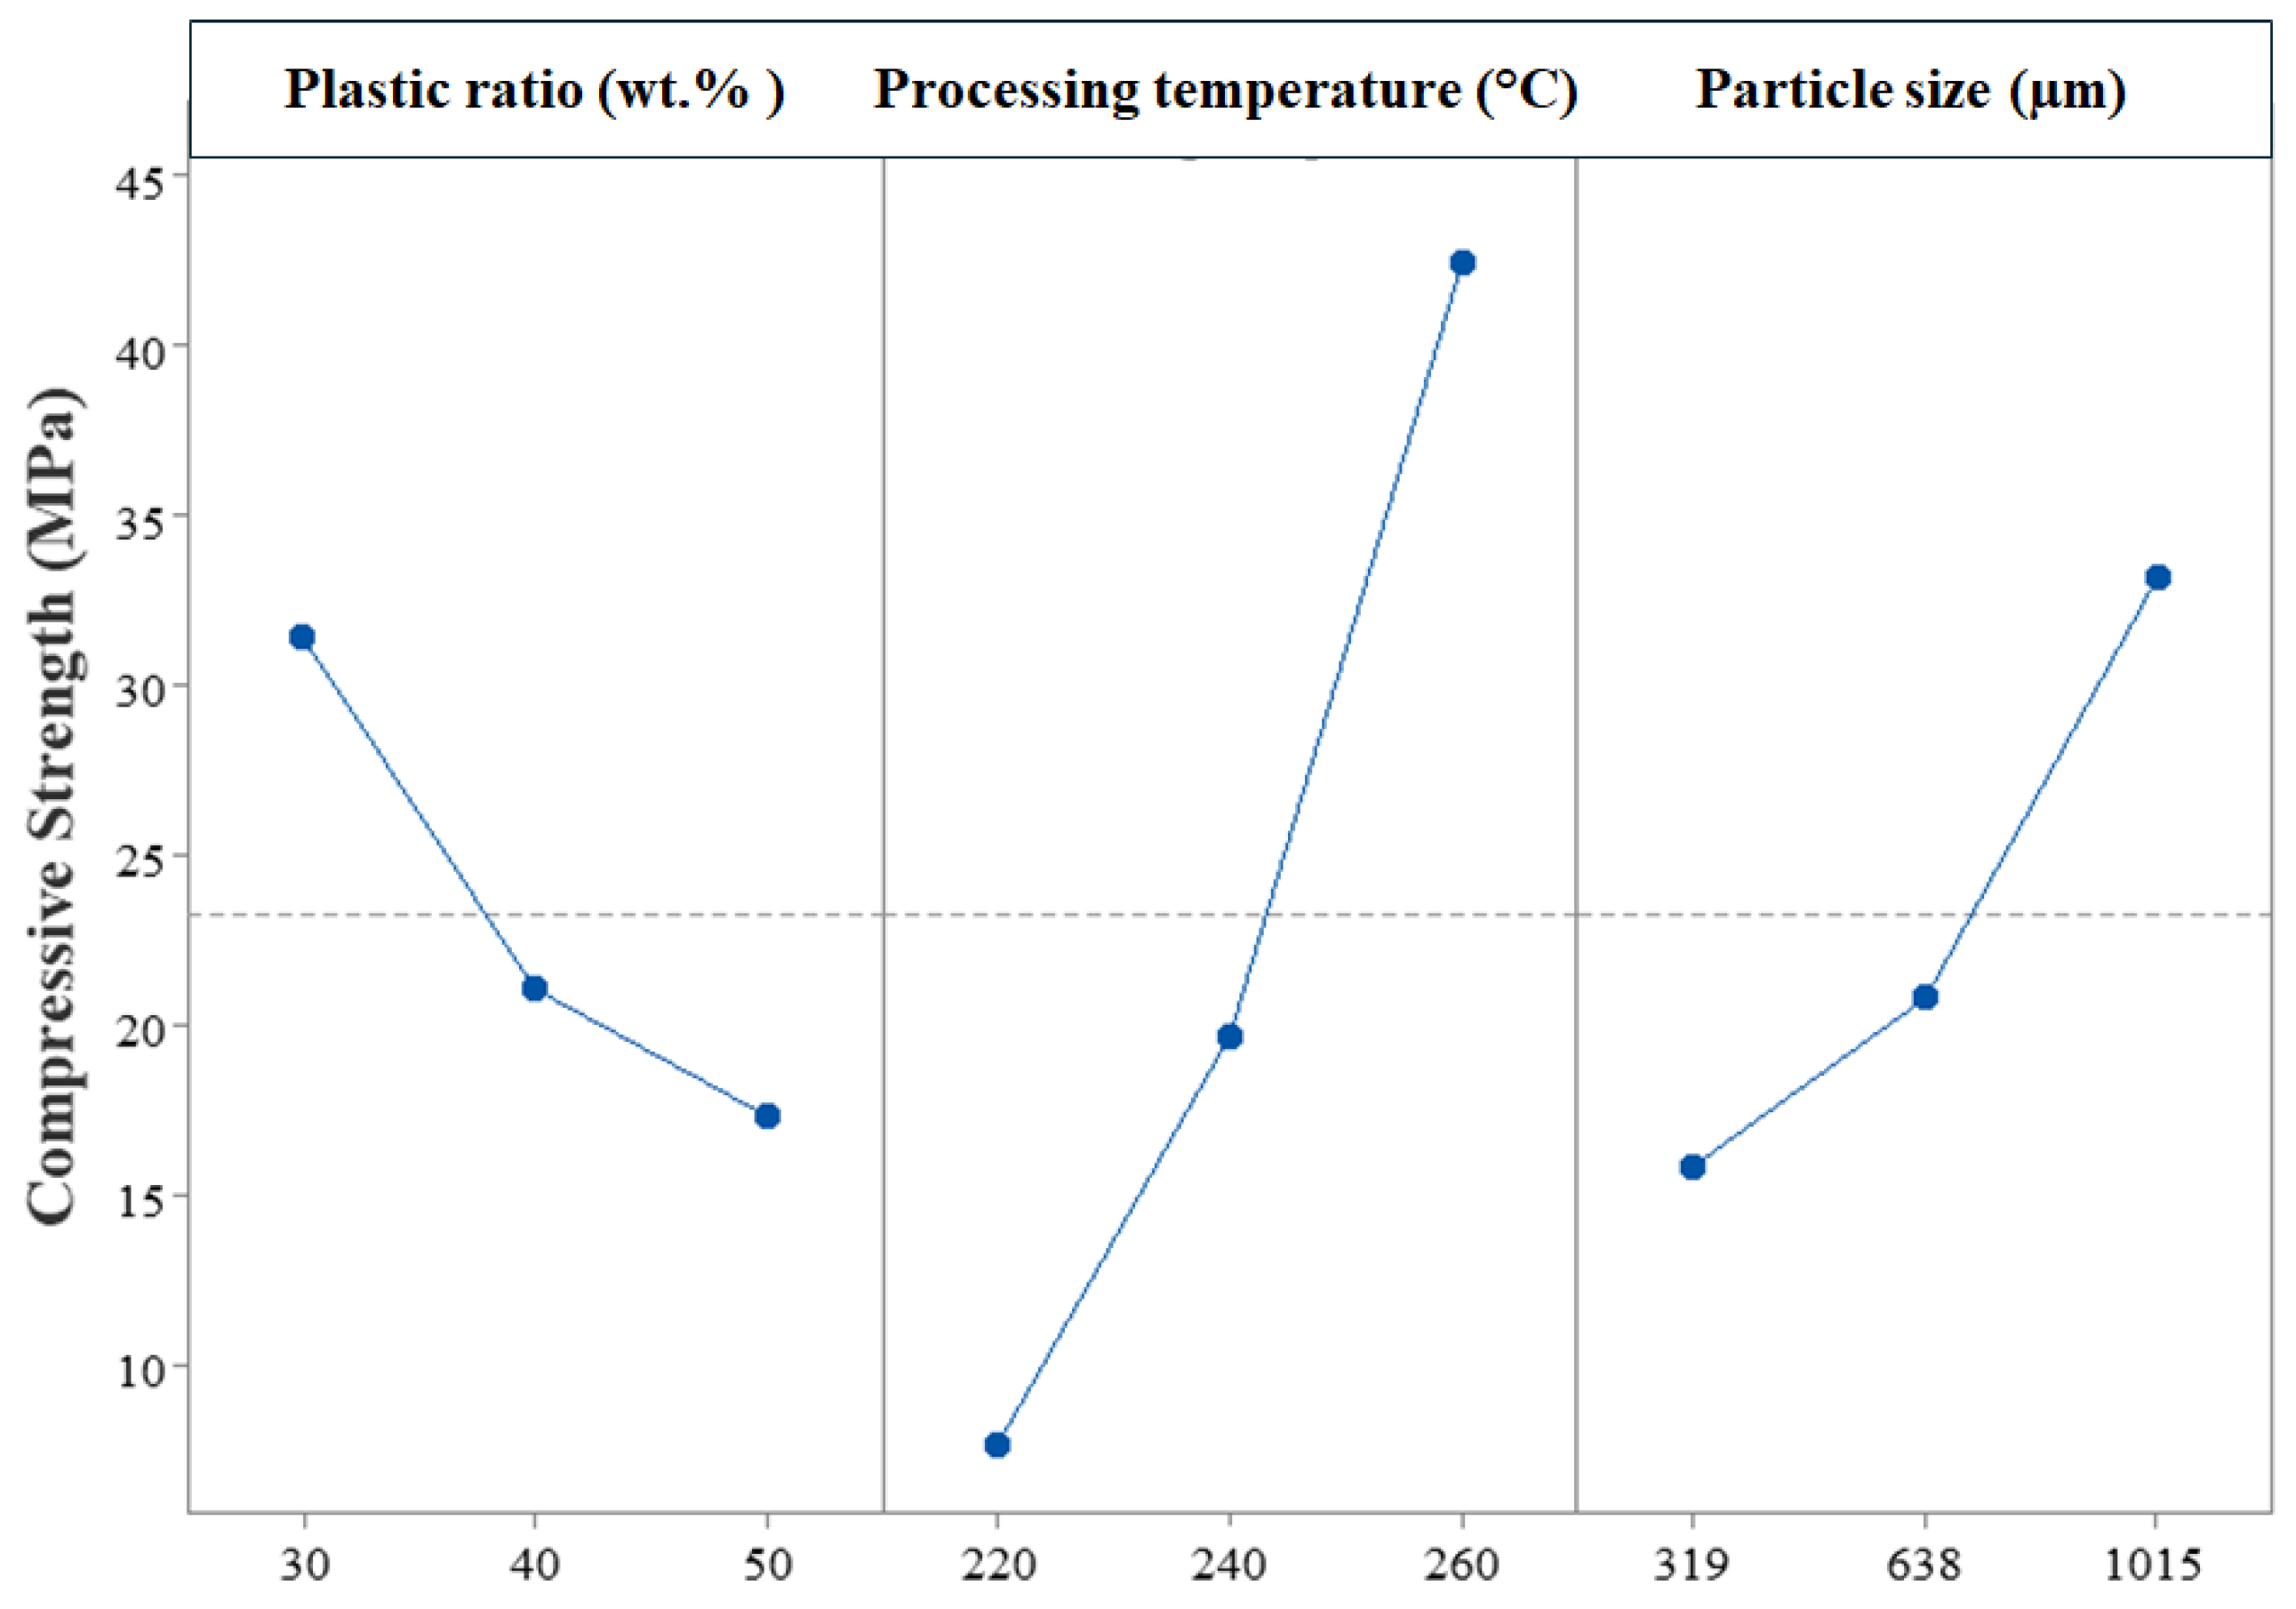
The compressive strength values of the LDPE–sand composites, presented in Table 2, range from 6.7 to 65.5 MPa, demonstrating strong sensitivity to processing conditions. Statistical analysis indicates that plastic content (PC), processing temperature (PT), and particle diameter (PD) all have significant effects on compressive strength (PC: p = 0.047; PT: p = 0.001; PD: p = 0.022), with processing temperature exerting the most pronounced influence.
Increasing plastic content from 30 to 50 wt.% reduces the average compressive strength from 31.4 to 17.4 MPa. This reflects the reduced contribution of the rigid sand skeleton to load transfer as the polymer fraction increases.
Processing temperature shows a strong positive effect on compressive strength. Increasing PT from 220 to 260 °C led to a substantial increase in strength, as illustrated in Figure 4.
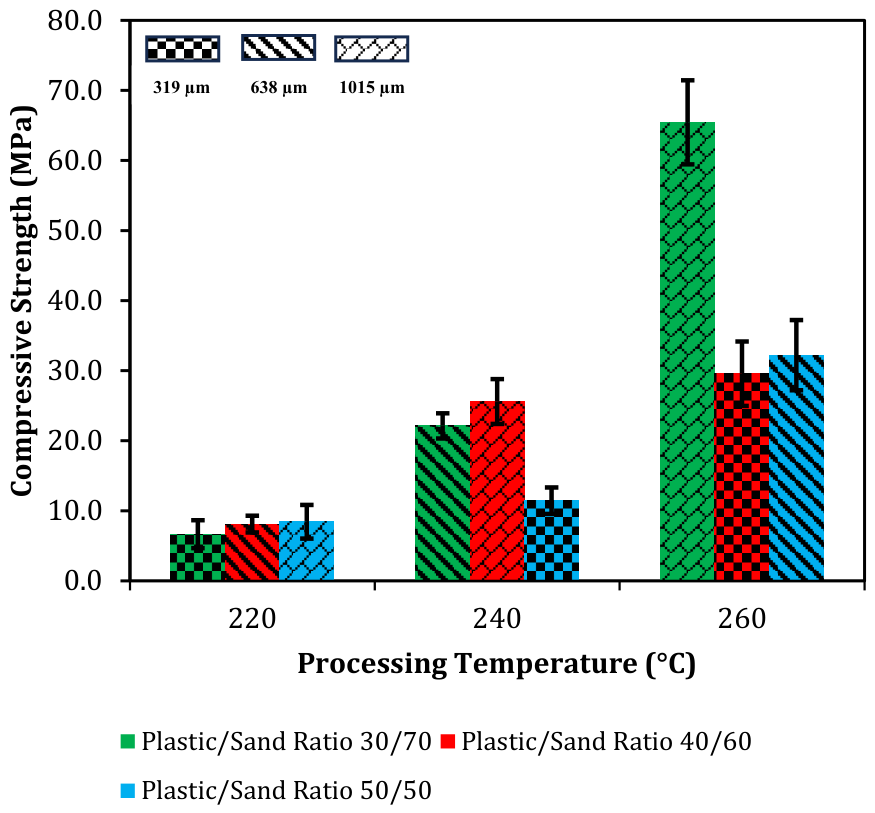
Particle diameter also influenced compressive strength, with values increasing from 15.9 to 33.2 MPa as particle size increased from 319 to 1015 µm. The combined effects of PC, PT, and PD are shown in Figure 5, where higher strengths were observed at lower plastic content and elevated temperatures, particularly for larger particle sizes.

3.1.2. Compressive Modulus

The compressive modulus values of the LDPE–sand composites, presented in Table 2, range from 64.0 to 213.0 MPa, indicating strong dependence on processing conditions. Statistical analysis shows that plastic content (PC), processing temperature (PT), and particle diameter (PD) all have significant effects (PC: p = 0.000; PT: p = 0.002; PD: p = 0.005).
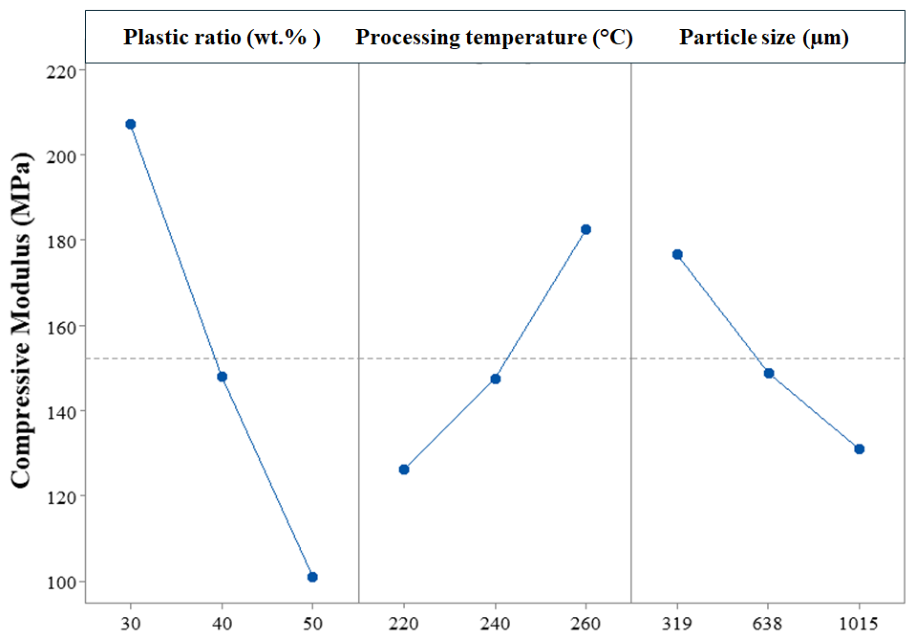
Increasing plastic content from 30 to 50 wt.% resulted in a reduction in compressive modulus from 207.1 to 101.1 MPa. This behaviour reflects the increasing dominance of the polymer phase, which has lower stiffness than the sand particles.
Processing temperature exhibits a positive influence on compressive modulus. Increasing PT from 220 to 260 °C led to an increase in modulus from 126.2 to 182.6 MPa, as shown in Figure 6.
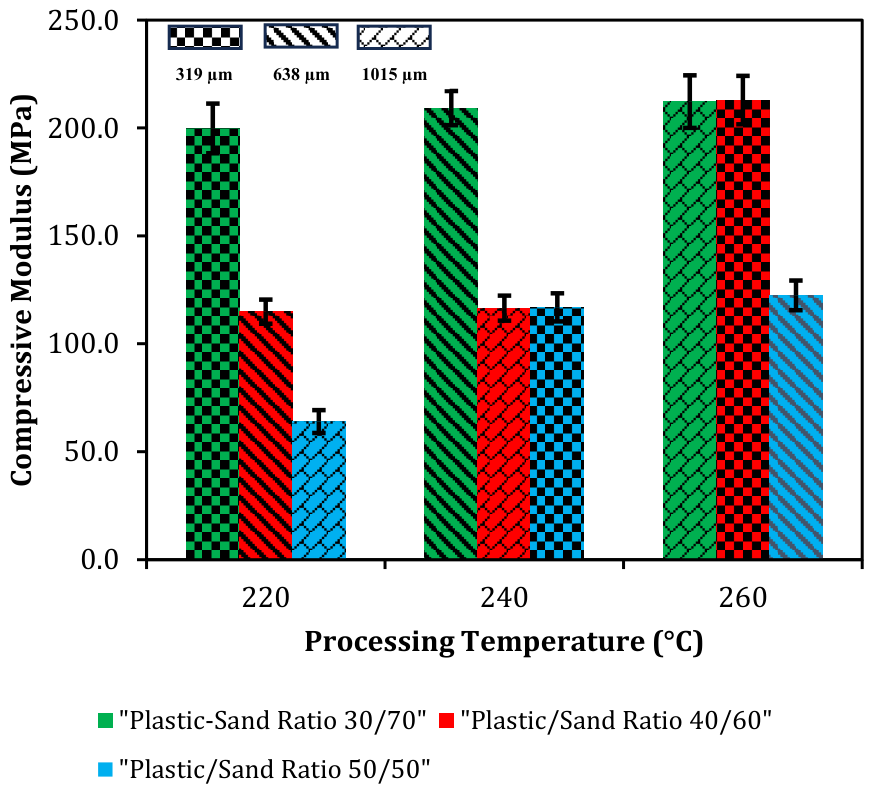
Particle diameter shows an inverse relationship with compressive modulus, with values decreasing from 176.6 to 130.9 MPa as particle size increased from 319 to 1015 µm. The combined effects of PC, PT, and PD illustrated in Figure 7 indicate that higher stiffness is achieved at lower plastic content and finer particle sizes.

3.1.3. Flexural Strength

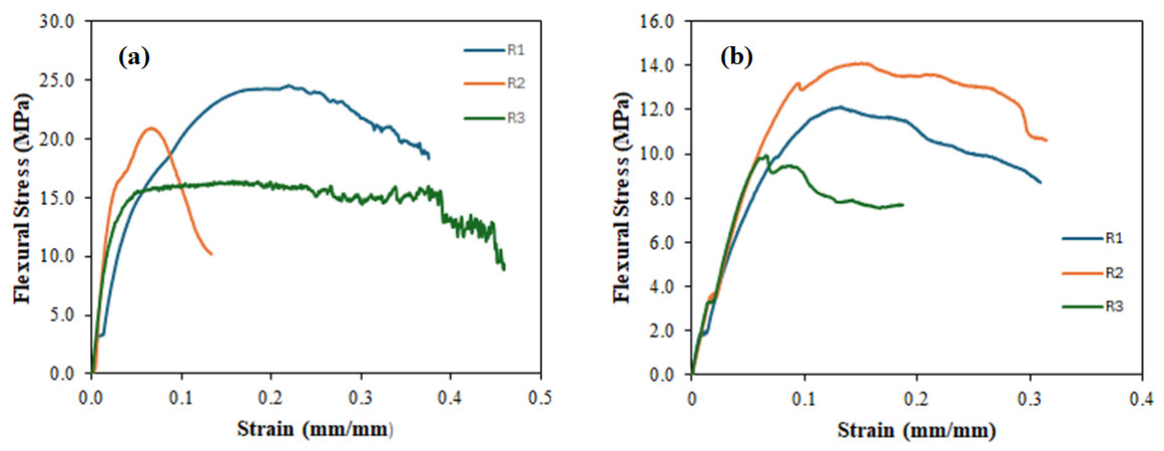
The flexural strength values presented in Table 2 range from approximately 5.8 to 20.7 MPa. The stress–strain response of the composite and plain LDPE is shown in Figure 8. Representative stress–strain responses corresponding to the optimal processing condition are presented for clarity, while results for all experimental runs are summarised in Table 2.
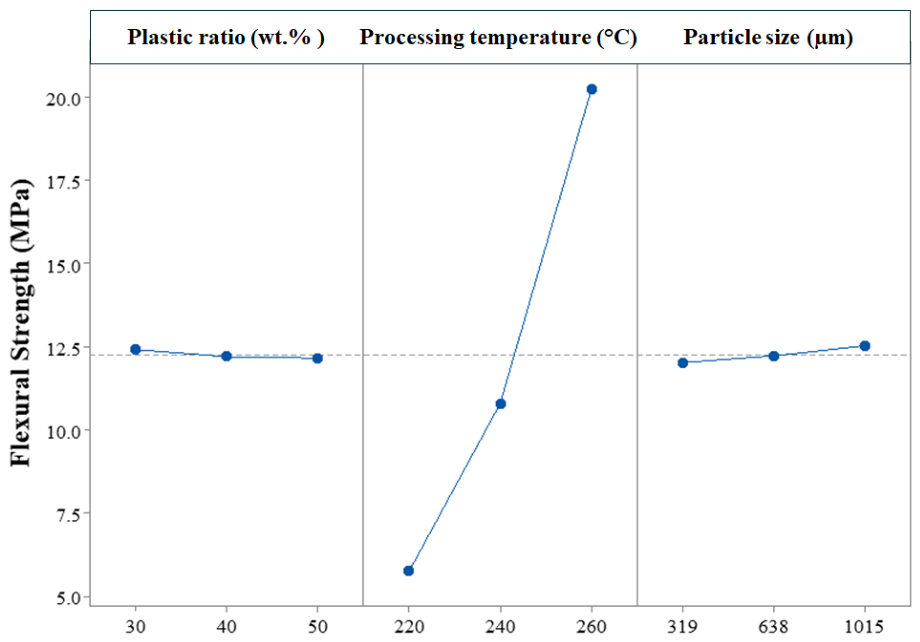
Statistical analysis indicates that processing temperature (PT) is the only parameter with a significant influence on flexural strength (PC: p = 0.829; PT: p = 0.000; PD: p = 0.674). Increasing PT from 220 to 260 °C resulted in a substantial increase in flexural strength from 5.8 to 20.2 MPa, as illustrated in Figure 9.
Plastic content shows no statistically significant effect on flexural strength, with only minor variations observed across the investigated range.
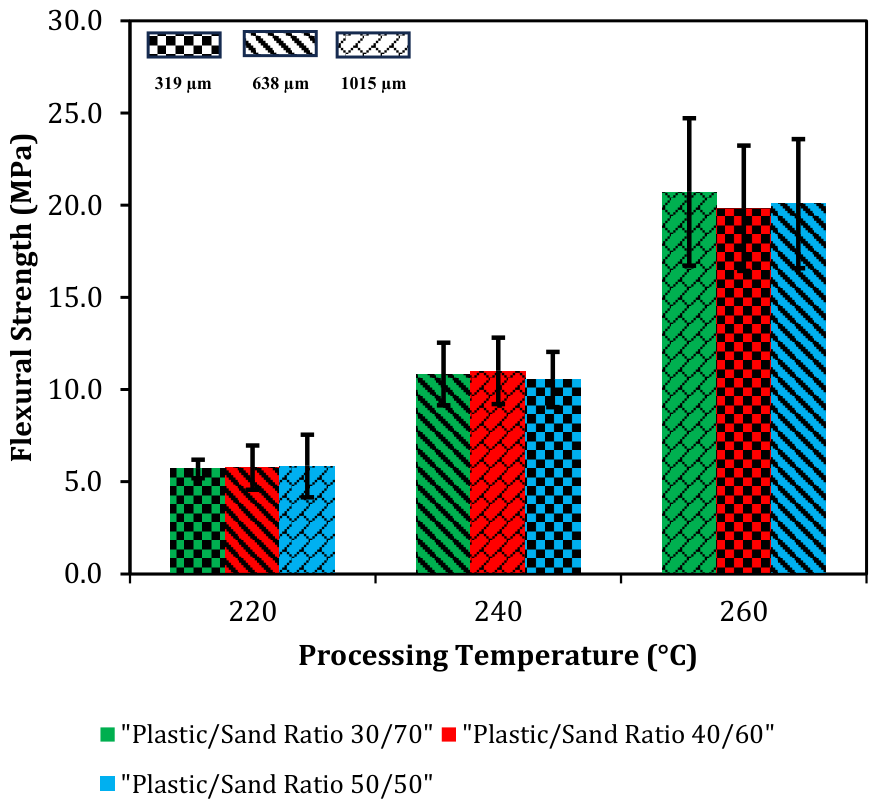
The combined effects of processing parameters illustrated in Figure 10 confirm that flexural strength is dominated by processing temperature, with relatively weak interaction effects from plastic content and particle size.

3.1.4. Tensile Strength

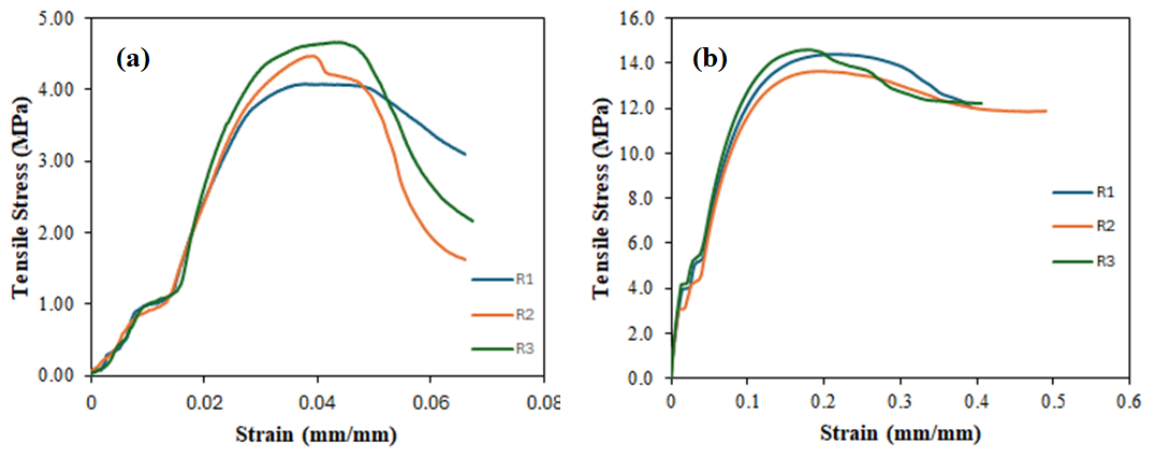
The tensile strength values presented in Table 2 range from 1.6 to 4.4 MPa. The stress–strain behaviour of the composite and plain LDPE is shown in Figure 11. Representative stress–strain responses corresponding to the optimal processing condition are presented for clarity, while results for all experimental runs are summarised in Table 2.
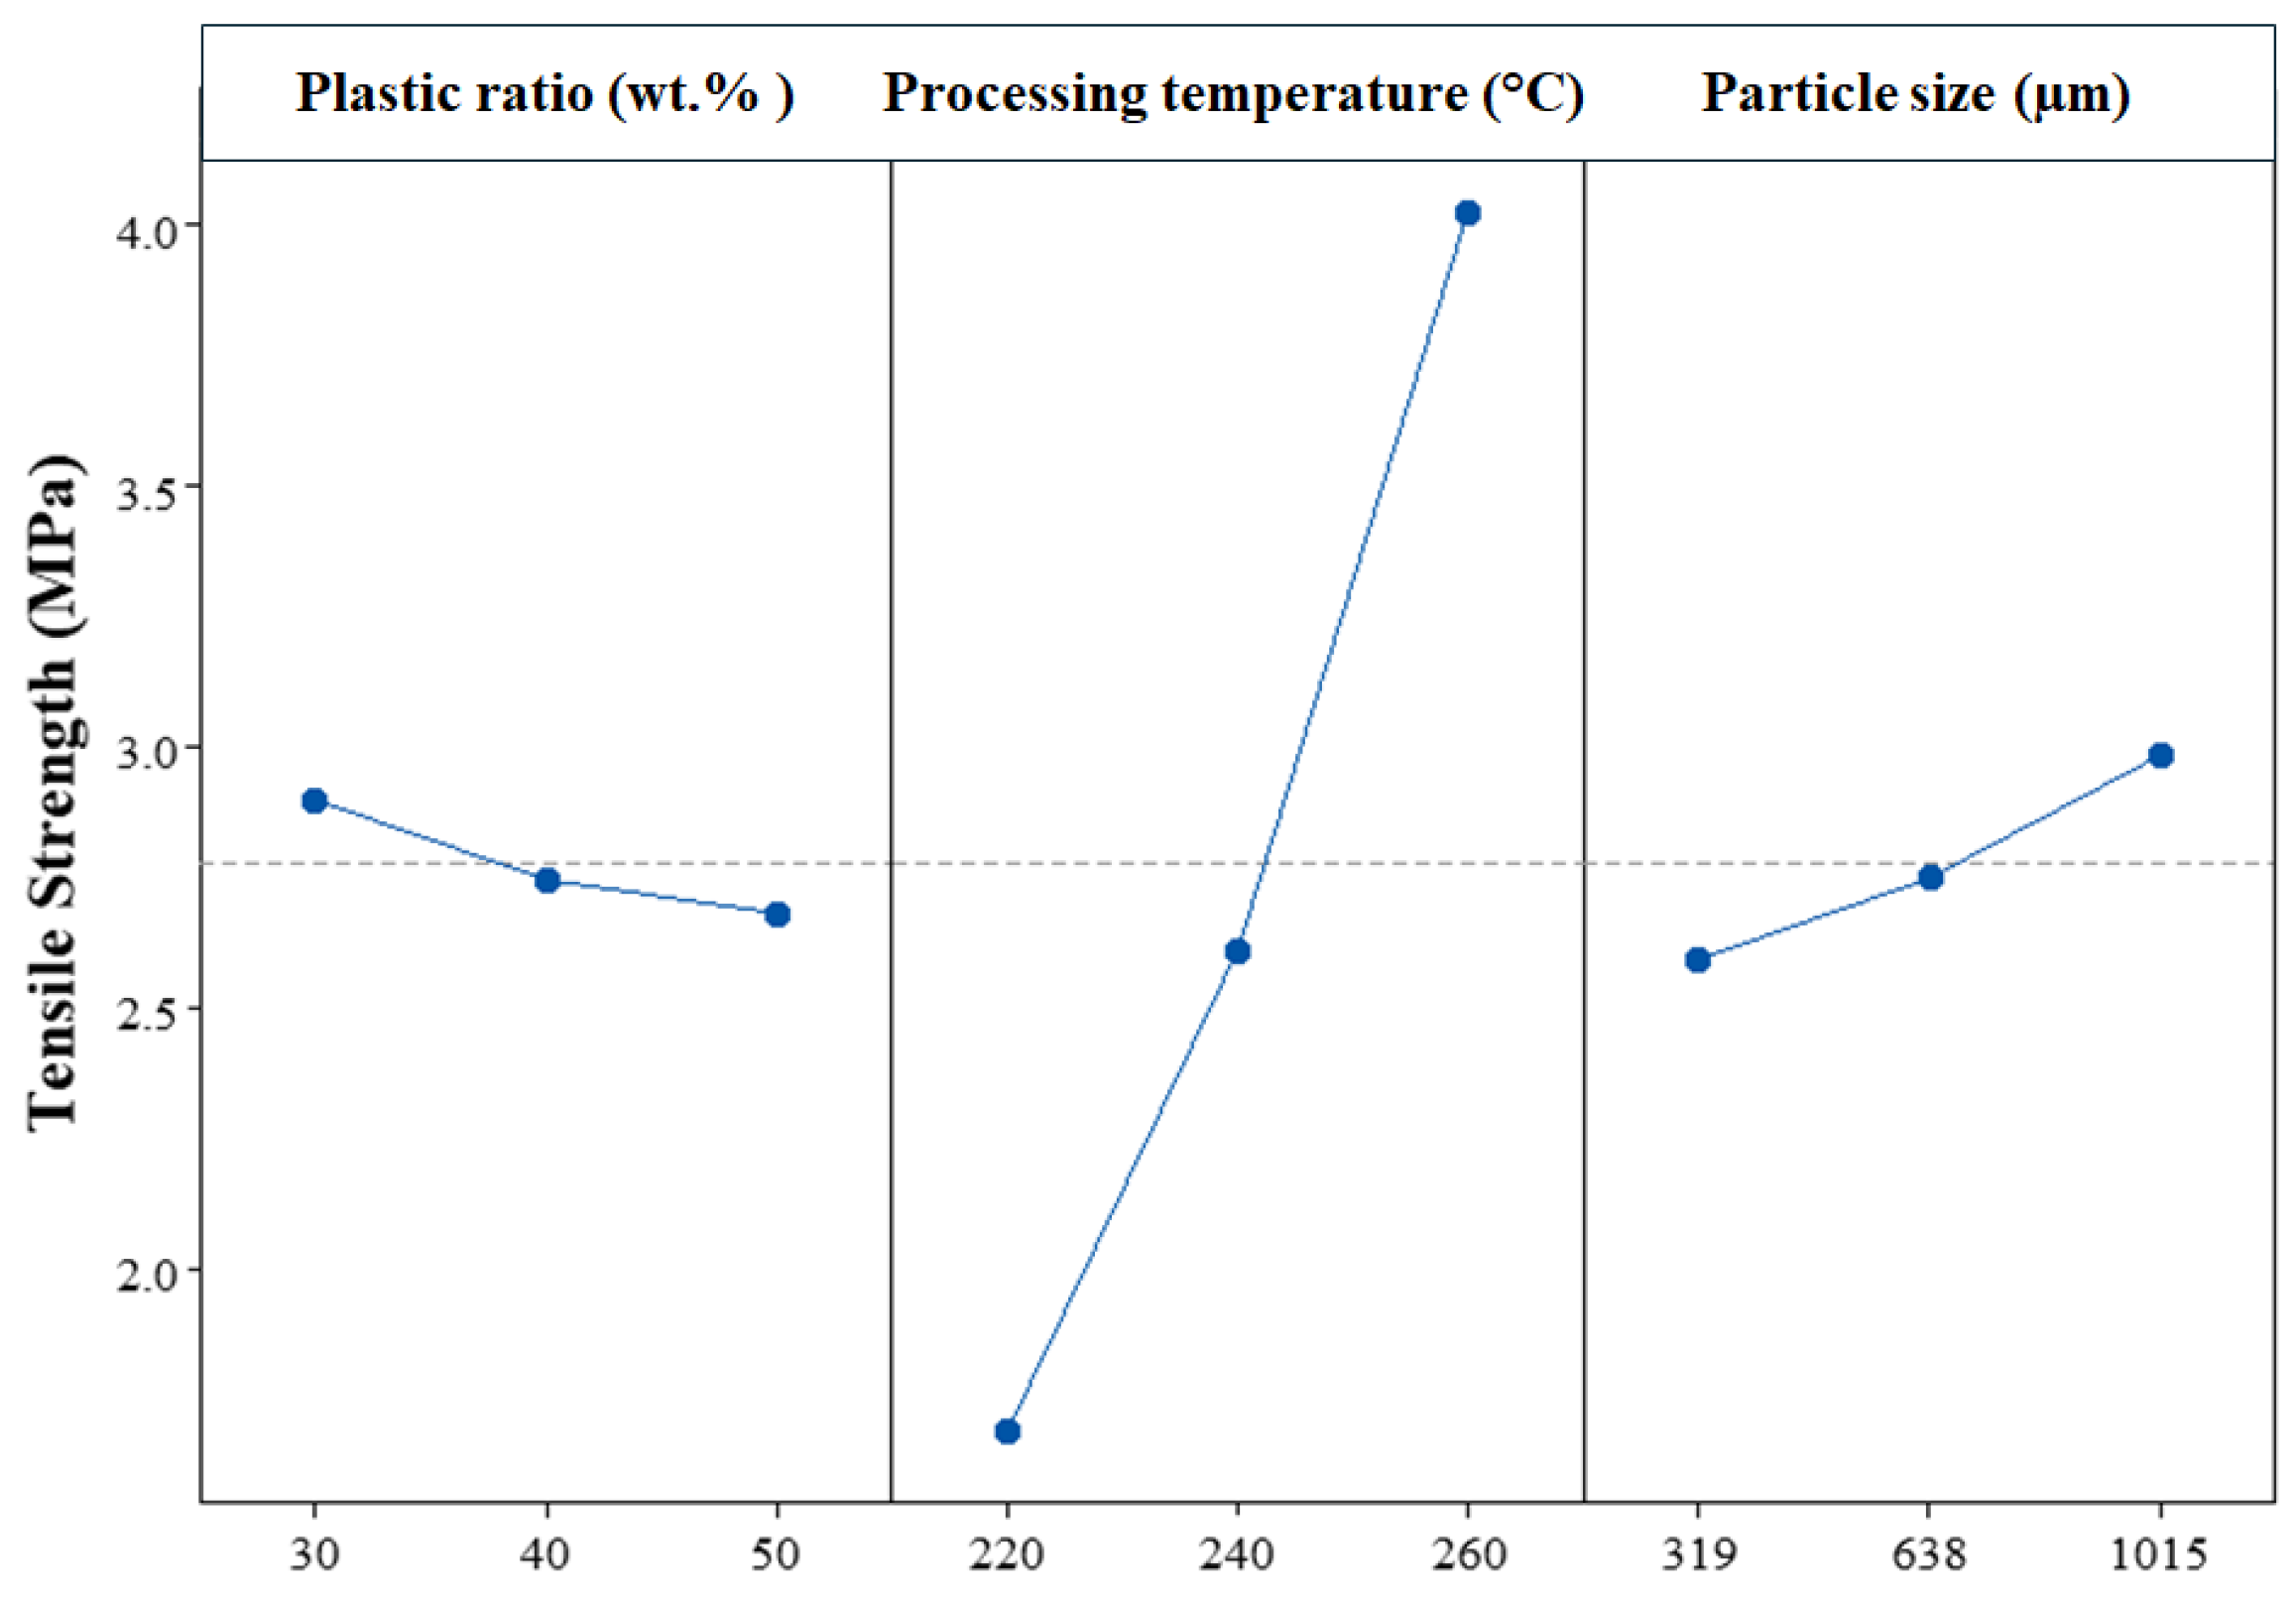
Statistical analysis shows that processing temperature (PT) and particle diameter (PD) have significant effects on tensile strength (PC: p = 0.172; PT: p = 0.000; PD: p = 0.035), while plastic content does not. Increasing plastic content from 30 to 50 wt.% results in only a slight reduction in tensile strength (2.9 to 2.7 MPa), indicating that increasing the polymer fraction does not substantially improve tensile performance.
Processing temperature exerts a strong positive influence on tensile strength. Increasing PT from 220 to 260 °C results in an increase in tensile strength from approximately 1.7 to 4.0 MPa, as shown in Figure 12.
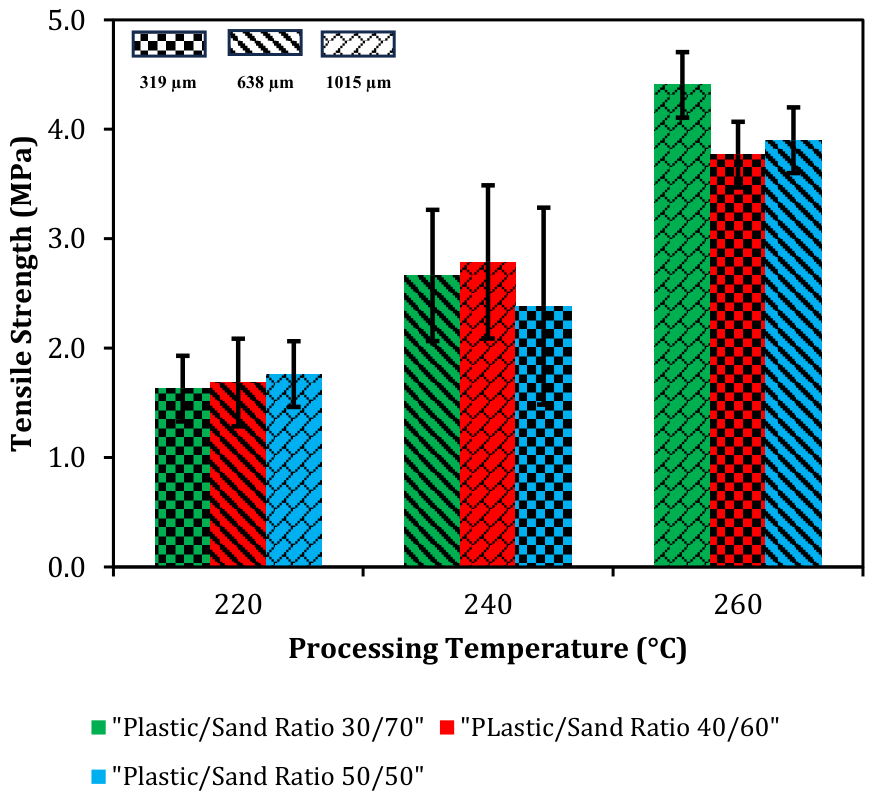
Particle diameter also influenced tensile behaviour, with values increasing from 2.6 to 3.0 MPa as particle size increased from 319 to 1015 µm. The combined effects of PC, PT, and PD illustrated in Figure 13 indicate that higher tensile strength was achieved at elevated temperatures and larger particle sizes.

3.2. Physical Properties of the Composites

The physical properties of the LDPE–sand composites, including water absorption and density, are discussed in the following sections.

3.2.1. Water Absorption

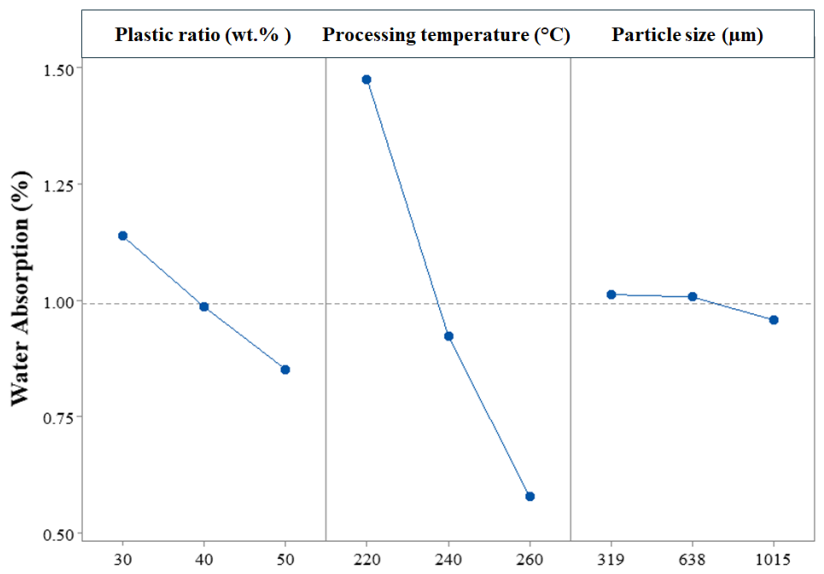
The water absorption values presented in Table 2 range from approximately 0.5 to 1.7%, compared with 0.04% for plain recycled LDPE, reflecting the influence of the particulate phase and internal porosity on moisture uptake. Statistical analysis indicates that plastic content (PC: p = 0.006) and processing temperature (PT: p = 0.000) have significant effects, while particle diameter (PD: p = 0.416) is not statistically significant.
Increasing plastic content from 30 to 50 wt.% reduced water absorption from 1.1% to 0.9%.
Processing temperature also exerted a strong influence. Increasing PT from 220 to 260 °C reduced water absorption from 1.5% to 0.6%, as shown in Figure 14.
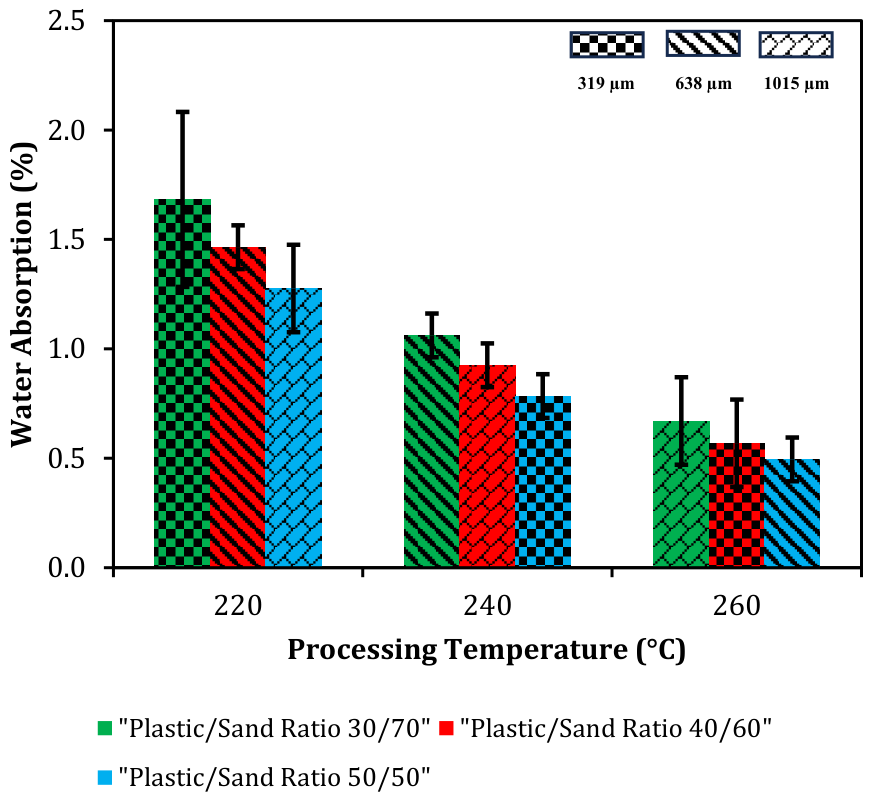
The combined effects of processing parameters illustrated in Figure 15 indicate that lower water absorption is achieved at higher plastic content and elevated processing temperatures.

3.2.2. Density

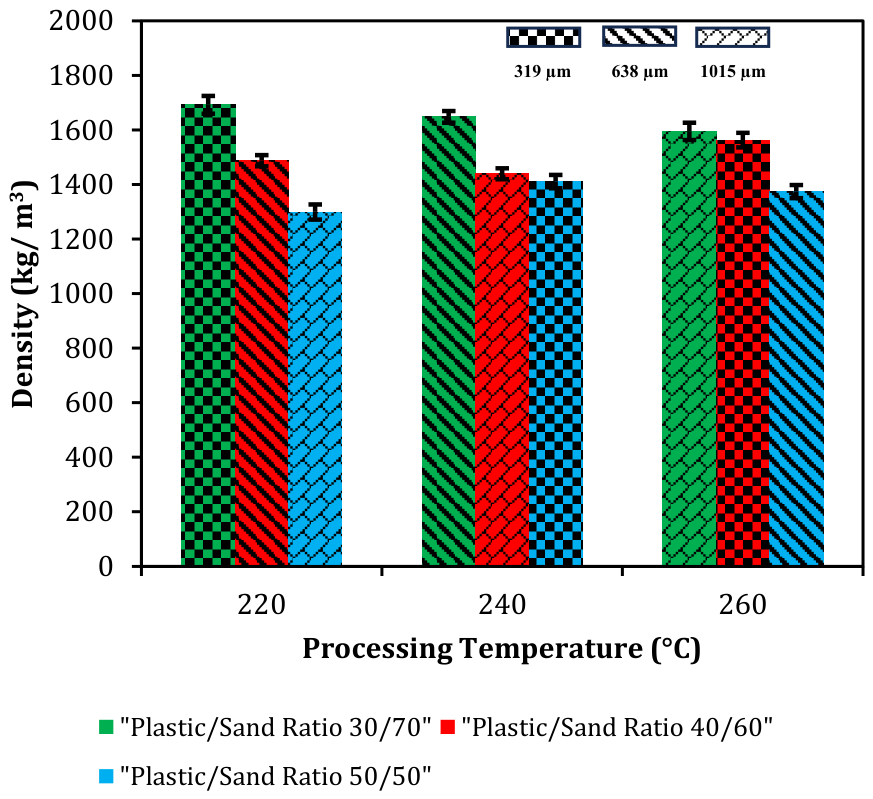
The density values presented in Table 2 range from 1299.4 to 1692.4 kg/m3, compared with approximately 925 kg/m3 for plain recycled LDPE. Statistical analysis shows that plastic content (PC: p = 0.000), processing temperature (PT: p = 0.011), and particle diameter (PD: p = 0.000) all have significant effects on density.
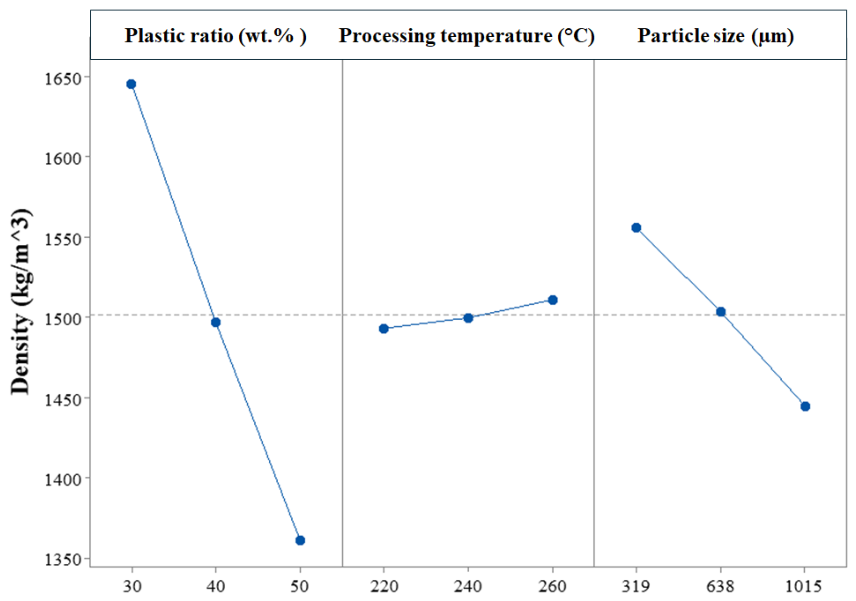
Increasing plastic content from 30 to 50 wt.% reduces density from 1645 to 1361 kg/m3.
Processing temperature had a moderate influence on density, with values increasing slightly from 1493 to 1511 kg/m3 as PT increases from 220 to 260 °C, as shown in Figure 16.
Particle diameter also influences density, with values decreasing from 1556 to 1445 kg/m3 as particle size increases from 319 to 1015 µm. The combined effects illustrated in Figure 17 indicate that higher density is achieved at lower plastic content and finer particle sizes.

3.3. Multi-Response Optimisation of Mechanical and Physical Properties

The combined mechanical and physical responses were optimised using the developed regression models (Equations (1)–(6)) to identify favourable processing conditions within the investigated parameter space. The optimisation objective was to maximise mechanical performance while maintaining low water absorption and appropriate density values.
The optimum parameter combination corresponded to 30 wt.% plastic content, 260 °C processing temperature, and 1015 µm particle diameter. Notably, this combination corresponds to experimentally run M3 rather than a model-extrapolated condition. Under these conditions, the model predicted a compressive strength of 55.0 MPa, flexural strength of 19.2 MPa, tensile strength of 4.2 MPa, water absorption of 0.7%, and density of 1594.2 kg/m3, as presented in Table 3. Compared with the experimental results in Table 2, the model generally captured the observed trends but slightly under-predicted the compressive strength, with the predicted value approximately 16% lower than the measured value of 65.5 MPa obtained for M3. The overall desirability value obtained was 0.92.
ANOVA results (Tables S1–S6) showed that the developed regression models explained a substantial proportion of variability in the measured responses, with R2 values exceeding 0.92 and adjusted R2 values greater than 0.87.
Pearson correlation coefficients are presented in Table 4. Processing temperature exhibited strong positive correlations with compressive strength, flexural strength, and tensile strength, and a strong negative correlation with water absorption. Plastic content showed strong negative correlations with density and compressive modulus. Particle diameter exhibited comparatively weaker relationships with most response variables.
The regression equations describing the relationships between processing parameters and composite performance are presented in Equations (1)–(6). These equations were subsequently used for optimisation and prediction within the investigated range.
C S = 173.1 0.702   P C + 0.867   P T + 0.02505   P D
C M = 68.8 5.299   P C + 1.408   P T 0.0650   P D
F S = 74.36 0.0129   P C + 0.3611   P T + 0.00073   P D
T S = 11.153 0.01087   P C + 0.05831   P T + 0.000564   P D
W A = 6.999 0.01433   P C 0.02242   P T 0.0000806   P D
D E = 2066.9 14.187   P C + 0.443   P T 0.15903   P D
where CS is the compressive strength, CM is the compressive modulus, FS is the flexural strength, TS is the tensile strength, WA is the water absorption, and DE is the density.

3.4. Model Validation and Generalisation Analysis

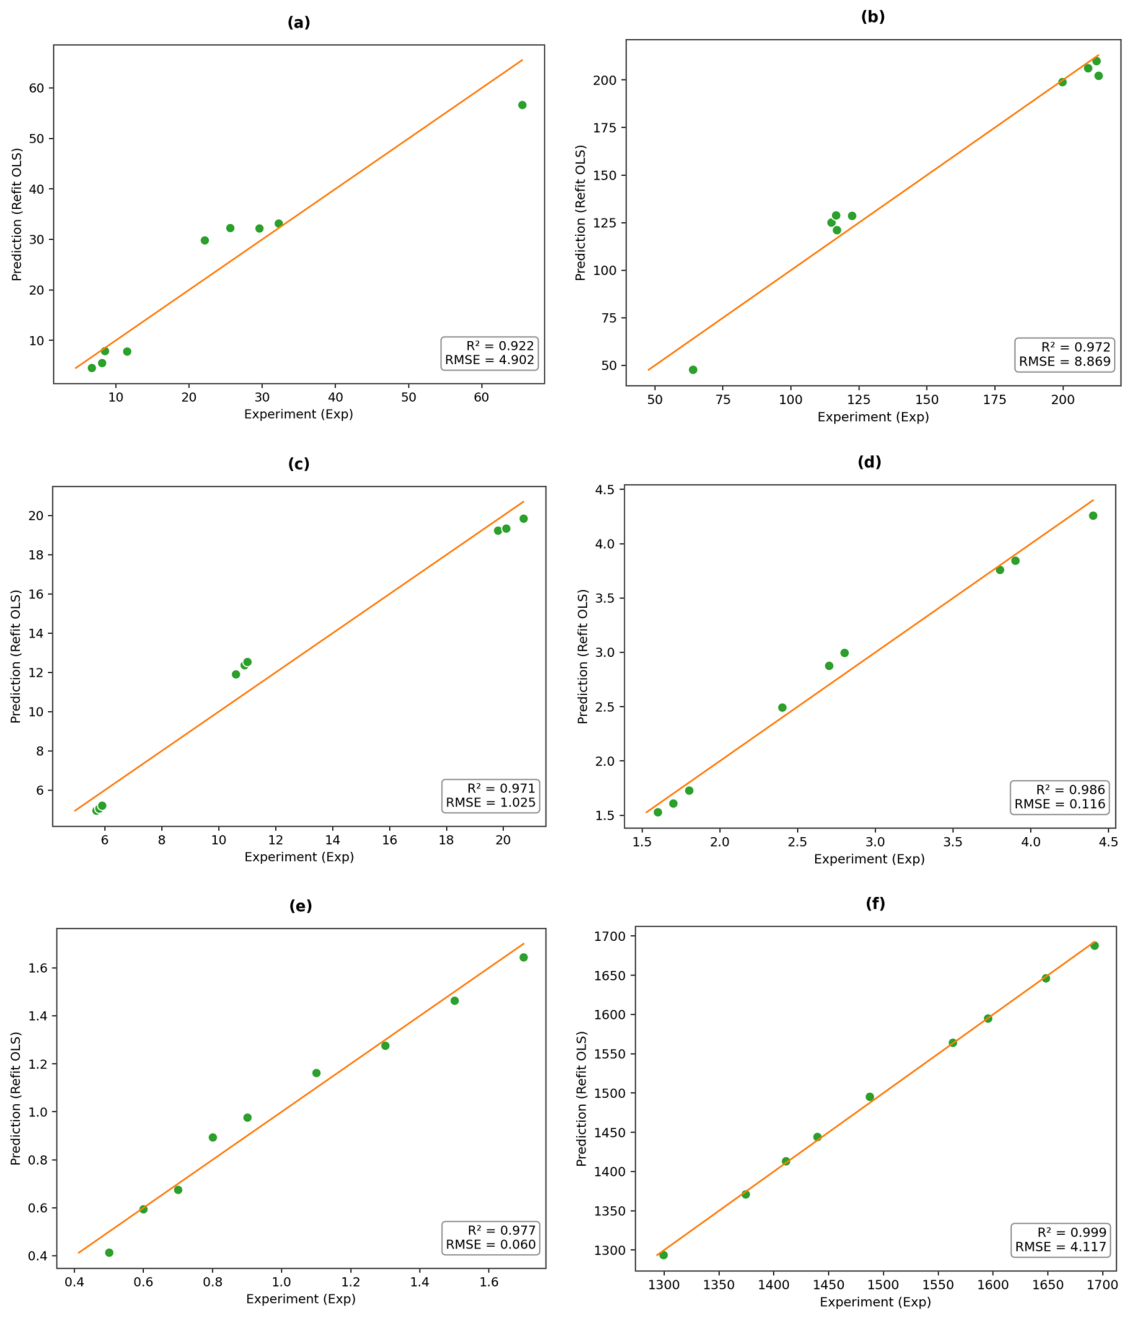
The predictive performance of the regression models was evaluated by comparison of predicted and experimental values together with cross-validation analysis (Table 5). Figure 18 presents the relationship between the predicted and measured values for all investigated responses.
As shown in Figure 18 and Table 5, predictive performance varied among the investigated responses. Density exhibited the highest predictive capability, with LOOCV and 3-fold cross-validation R2 values of 0.996 and 0.993, respectively. Tensile strength, flexural strength, and water absorption also showed good predictive performance, with LOOCV R2 values of 0.954, 0.907, and 0.927, respectively. In contrast, compressive strength and compressive modulus exhibited lower cross-validation performance, with LOOCV R2 values of 0.690 and 0.884, respectively, and correspondingly higher prediction errors.
Overall, the models captured the observed property trends reasonably well, although predictive accuracy differed among the responses. The results indicate that the developed models are suitable for screening and optimisation within the investigated ranges of plastic content, processing temperature, and particle diameter, with density, tensile strength, flexural strength, and water absorption exhibiting stronger predictive performance than compressive strength and compressive modulus.

4. Discussion

4.1. Mechanical Behaviour of LDPE–Sand Composites

4.1.1. Factors Governing Compressive Strength

At lower plastic contents, a greater proportion of sand particles participates in load bearing, whereas higher polymer content shifts the response toward the softer matrix phase. This behaviour highlights the role of plastic content in controlling the balance between matrix continuity and the load-bearing contribution of the granular skeleton.
The strong positive effect of processing temperature may be associated with improved polymer melting and flow, which enhances particle coating, reduces internal voids, and promotes interfacial interaction [36,37]. At lower temperatures, incomplete melting limits effective bonding. This indicates that processing temperature governs composite performance primarily through its influence on polymer flow, consolidation, and reduction of internal defects within the material.
Higher strengths observed at lower plastic content and elevated temperatures, particularly for larger particle sizes, indicate that coarser particles can contribute to improved mechanical interlocking when sufficient polymer flow enables effective wetting. The beneficial effect of larger particle sizes appears more pronounced at higher processing temperatures, where improved polymer flow facilitates effective particle coating and interaction.
These trends are consistent with previous studies (Table 6). Ge et al. [34] reported increasing compressive strength with sand content up to an optimum before declining due to insufficient binder. Similar behaviour has been observed by Kumi-Larbi et al. [29], Ifthikar et al. [30], and Babatunde et al. [33], where strength improved with increasing sand fraction until particle cohesion was limited by reduced polymer content. Solomon et al. [46] reported comparable trends within lower strength ranges.
Particle size effects reported in the literature show some variations. Ifthikar et al. [30] observed decreasing strength with increasing particle size due to reduced bonding surface area, whereas Kumi-Larbi et al. [29] reported behaviour dependent on particle-size range and formulation. Mohan et al. [45] obtained moderate strength values with coarse particles, while Soni et al. [47] reported higher strengths under optimised processing conditions, indicating that particle-size effects depend strongly on processing conditions and degree of polymer flow.

4.1.2. Factors Governing Compressive Modulus

At lower plastic content, the higher proportion of rigid particles enhances load-bearing capacity and stiffness, whereas increasing polymer fraction reduces the overall rigidity of the composite. This trend is consistent with particulate composite systems, where increasing matrix content reduces stiffness [49]. This behaviour highlights the role of plastic content in controlling the balance between the deformable polymer matrix and the rigid particulate skeleton.
The positive influence of processing temperature may be associated with improved polymer melting and flow at higher temperatures, which enhances consolidation, reduces internal voids, and promotes stronger interfacial bonding between the polymer and sand particles [36,37]. At lower temperatures, incomplete melting limits effective bonding and reduces stiffness. This indicates that processing temperature influences stiffness primarily through its effect on polymer flow, consolidation, and reduction of internal defects within the composite.
The higher stiffness achieved at lower plastic content and finer particle sizes may be associated with improved packing efficiency and increased interfacial surface area provided by smaller particles, which enhances stress transfer within the composite system [38]. In contrast, larger particles reduce the available bonding surface and may introduce localised stress concentrations. The influence of particle size appears to interact with processing temperature, as improved polymer flow at higher temperatures may partially compensate for reduced interfacial area in coarser particles.
Similar trends have been reported in the literature (Table 6). Studies on polymer–sand composites indicate that finer particles improve stiffness through increased surface interaction, while higher filler fractions enhance rigidity due to greater load-bearing contribution from the particulate phase [29,30]. Variations in reported values are influenced by differences in processing conditions, particle-size distribution, and polymer characteristics.

4.1.3. Factors Governing Flexural Strength

A substantial increase in flexural strength with increasing processing temperature may be associated with improved polymer melting and flow at elevated temperatures, which enhances particle wetting, reduces interfacial defects, and promotes more effective stress transfer across the composite [36,37]. These interpretations are based on macroscopic observations and were not directly validated through microstructural analysis. This indicates that flexural performance is primarily governed by the quality of matrix continuity and interfacial bonding achieved during processing.
The minor variations observed in flexural strength across the investigated range of plastic content suggest that flexural behaviour in LDPE–sand composites is less sensitive to the nominal plastic–sand ratio and more dependent on the quality of matrix continuity and interfacial bonding. The limited influence of particle diameter suggests that flexural performance is governed primarily by polymer flow and bonding rather than particle size alone.
The improvement in flexural strength at higher temperatures may reflect enhanced consolidation and reduced internal defects, which are critical for resisting bending stresses.
These observations are consistent with previous studies (Table 6). Babatunde et al. [50] reported flexural strengths in the range of 16–16.4 MPa for LDPE-based composites at moderate plastic–sand ratios. Soni et al. [47] observed comparatively lower flexural strength values despite high compressive strength, highlighting the sensitivity of flexural behaviour to interfacial defects and porosity. Similar trends have been reported in polymer–particle composites, where flexural performance depends strongly on matrix continuity and defect distribution rather than composition alone [36,37].

4.1.4. Factors Governing Tensile Strength

The fact that the polymer fraction does not substantially improve tensile performance may reflect the discontinuous structure of the composite, where the presence of rigid particles disrupts stress transfer within the polymer matrix. This suggests that tensile behaviour is governed by matrix continuity and the efficiency of stress transfer across the polymer–particle interface rather than the nominal plastic content alone.
The strong positive influence of increased processing temperature on tensile strength may be associated with improved polymer melting and flow at elevated temperatures, which enhances particle wetting, reduces internal voids, and improves interfacial bonding [36,37]. At lower temperatures, incomplete melting limits effective bonding, resulting in lower tensile strength. This indicates that tensile performance is strongly influenced by processing-induced changes in polymer flow, consolidation, and defect reduction within the composite.
The higher tensile strength achieved at elevated temperatures with larger particle sizes suggests that coarser particles may contribute to improved mechanical interlocking and resistance to crack propagation when adequate polymer coating is achieved, although the effect is less pronounced than for compressive strength. The influence of particle size appears to depend on processing conditions, particularly temperature, which governs the extent of polymer coating and interfacial interaction.
These observations are consistent with findings reported in the literature (Table 6). Ifthikar et al. [30] reported a reduction in tensile strength with increasing sand content, attributing this to reduced matrix continuity and increased brittleness. Similar behaviour has been observed in polymer–particle composites, where the introduction of rigid fillers reduces deformation capacity and promotes earlier failure under tensile loading.

4.2. Physical Behaviour of LDPE–Sand Composites

4.2.1. Factors Governing Water Absorption

The reduced water absorption with increased plastic content reflects the hydrophobic nature of LDPE and its role in reducing capillary pore connectivity within the composite [33]. This indicates that higher polymer fractions promote greater matrix continuity, limiting pathways for moisture ingress. This behaviour highlights the role of plastic content in controlling the porosity and connectivity of internal voids within the composite.
The reduced water absorption as processing temperature increased may be associated with improved polymer melting and flow, which enhances consolidation and reduces internal voids [36,37]. At lower temperatures, incomplete melting resulted in poor particle coating and increased porosity. This indicates that processing temperature governs moisture resistance primarily through its effect on polymer flow, consolidation, and reduction of internal defects within the material.
Particle diameter shows only a limited influence, with values remaining relatively consistent across the investigated range. This suggests that moisture resistance is governed primarily by matrix continuity and porosity rather than particle size alone. The limited influence of particle diameter may further indicate that pore structure is more strongly controlled by processing conditions than by particle size within the investigated range.
These observations are consistent with findings reported in the literature (Table 6). Mohan et al. [45] reported water absorption values of 1.01–1.19% for LDPE–sand composites at similar compositions. Ifthikar et al. [30] observed decreasing water absorption with increasing polymer content, while Solomon et al. [46] reported lower values (0.34–0.64%) under different processing conditions. Soni et al. [47] achieved significantly lower water absorption (~0.15%) under optimised conditions, highlighting the importance of porosity control. Kumi-Larbi et al. [29] similarly associated reduced porosity with improved moisture resistance.

4.2.2. Factors Governing Density

The reduction in density as plastic content increased reflects the lower intrinsic density of LDPE compared with sand, such that increasing polymer fraction reduces the overall bulk density of the composite. Similar trends have been reported in polymer–sand composites, where density decreases with increasing polymer content and increases with higher particulate loading [31,32]. This behaviour highlights the role of plastic content in controlling the balance between the low-density polymer matrix and the higher-density particulate phase.
The moderate influence of processing temperature on density may be associated with improved consolidation and reduced void content at higher temperatures, resulting in a more compact material structure [36,37]. At lower temperatures, incomplete melting may lead to increased porosity and reduced density. This indicates that processing temperature influences density primarily through its effect on polymer flow, consolidation, and reduction of internal defects.
The higher density achieved at lower plastic content and finer particle sizes may reflect improved packing efficiency and reduced void space [38]. Coarser particles tend to reduce packing efficiency and increase void content, leading to lower bulk density. The influence of particle size may interact with processing temperature, as improved polymer flow at higher temperatures may enhance packing and partially mitigate void formation.
These observations are consistent with literature findings (Table 6). Tempa et al. [32] reported increased density with higher sand content, while Jock et al. [31] observed similar behaviour in LDPE-based systems. Olusunmade et al. [39] reported comparable trends in PET-based composites, where higher density was achieved at lower polymer content and finer particle sizes.

4.3. Variability of Measured Responses

The variability of the measured responses was assessed using the reported standard deviations and coefficients of variation (CoV). Density exhibited the lowest average CoV (1.7%), indicating a highly consistent response across the investigated processing conditions and suggesting that bulk material composition and consolidation were relatively uniform. Compressive modulus also exhibited a comparatively low CoV (5.4%), reflecting good repeatability and limited sensitivity to local material heterogeneity.
Higher variability was observed for compressive strength (16.7%), flexural strength (14.9%), and tensile strength (16.9%). This behaviour may be attributed to local differences in particle distribution, polymer coverage, interfacial bonding quality, and defect formation, which can influence load transfer and failure mechanisms within particulate polymer composites [36,37]. The similar CoV values obtained for the three strength-related properties suggest that these responses were affected by common microstructural factors associated with composite processing.
Water absorption exhibited the highest average CoV (18.6%). However, the absolute variation remained small because the measured water absorption values were themselves very low, ranging from 0.5% to 1.7%. Consequently, the higher CoV primarily reflects the sensitivity of percentage-based measurements at low values rather than substantial differences in moisture uptake behaviour.
Overall, the observed variability was moderate relative to the substantial differences in response values across the experimental matrix. This indicates that the effects of plastic content, processing temperature, and particle size exceeded the experimental scatter associated with repeat testing and supports the reliability of the identified trends, statistical analyses, and optimisation results.

4.4. Comparison with PET-Based Composite and Effect of Simplified Optimisation

The performance of the LDPE–sand composites developed in this study is compared with previously reported PET-based systems [39], with particular emphasis on the influence of material characteristics and the use of a simplified Taguchi L9 design.
Compared with PET-based composites reported in previous work [39], the LDPE-based system achieved higher maximum compressive, flexural, and tensile strengths within the investigated range. As shown in Table 2, maximum values of 65.5 MPa compressive strength, 20.7 MPa flexural strength, and 4.4 MPa tensile strength were achieved at 30 wt.% plastic content, 260 °C processing temperature, and 1015 µm particle size. In contrast, PET-based composites achieved lower maximum values under conditions involving higher plastic contents and finer particle sizes [39]. This difference may be associated with the intrinsic material properties of LDPE, particularly its lower melting temperature and greater ductility compared with PET, which may enhance melt flow, particle coating, and consolidation during processing, although these mechanisms were not directly verified through microstructural analysis.
In addition to mechanical performance, differences are observed in physical properties. The LDPE-based composites exhibit water absorption values in the range of approximately 0.5–0.7% under optimal conditions (Table 2), which are comparable to those reported for PET-based systems [39]. Density values in the LDPE system are generally lower than those reported for PET-based composites, reflecting the lower intrinsic density of LDPE relative to PET. These differences highlight the influence of polymer properties on both moisture resistance and bulk material characteristics.
The L9 design captured the influence of processing temperature, plastic content, and particle size on composite performance, as demonstrated by the main-effect and combined-effect plots presented in Figure 4, Figure 5, Figure 6, Figure 7, Figure 9, Figure 10, Figure 12, Figure 13, Figure 14, Figure 15, Figure 16 and Figure 17. As discussed in Section 3.4, predictive performance varied among the measured properties, with compressive strength and compressive modulus exhibiting lower cross-validation performance than density, tensile strength, flexural strength, and water absorption.
From a material perspective, the LDPE-based system achieved higher maximum strength values at lower plastic content and reduced processing temperatures more than the PET-based composites reported in [39]. The comparable water absorption behaviour and lower density indicate the potential for lightweight composite materials with low water absorption, depending on processing conditions and material composition.

4.5. Sustainable Application Prospects of LDPE–Sand Composites

The mechanical and physical performance achieved by the LDPE–sand composites indicates potential for selected construction applications where moderate strength, low water absorption, and reduced density are desirable. The apparent compressive strengths obtained in this study, together with the low water absorption values achieved under optimum processing conditions, indicate that recycled LDPE can function effectively as a cement-free binder within particulate composite systems. However, suitability for specific products such as paving units, masonry blocks, partition elements, or lightweight panels cannot be confirmed from the present dataset alone because product-specific requirements such as abrasion resistance, dimensional stability, creep behaviour, fire performance, and long-term durability were not evaluated.
The comparatively low water absorption achieved under optimum processing conditions may contribute to improved resistance to moisture ingress, while the lower density of the developed composites may provide advantages in handling, transportation, and installation. The ability to achieve favourable performance at relatively low plastic contents further demonstrates efficient utilisation of the polymer binder while maintaining useful engineering properties.
Comparison with previously reported PET-based systems further demonstrates that recycled LDPE can be utilised as a construction binder while achieving competitive mechanical performance at lower processing temperatures. This may offer practical advantages in terms of manufacturing efficiency and broaden the range of recyclable polymers available for composite production.
Several limitations must nevertheless be considered. The thermoplastic nature of LDPE introduces sensitivity to elevated temperatures, which may affect dimensional stability and mechanical performance during fire exposure or prolonged high-temperature service conditions. In addition, long-term durability aspects, including creep behaviour, ultraviolet degradation, abrasion resistance, and performance under cyclic environmental loading, were not evaluated and therefore require further investigation before practical implementation can be recommended. Further work should also assess durability, fire performance, abrasion resistance, and microstructural characteristics to establish the long-term engineering behaviour of LDPE–sand composites under representative service conditions.

4.6. Environmental and Circular Economy Implications

The development of LDPE–sand composites presents a potential pathway for transforming plastic waste into value-added construction materials while reducing reliance on conventional cementitious binders. In the present study, recycled LDPE sourced from discarded water sachets was used as the primary binding phase, thereby providing an alternative utilisation route for waste plastics that would otherwise be disposed of in landfills or enter the natural environment.
Unlike conventional concrete and mortar systems, the developed composites do not require cement as a binder. The elimination of cement from the material formulation is particularly relevant from a sustainability perspective because cement manufacture is recognised as one of the major contributors to industrial greenhouse gas emissions and energy consumption. The International Energy Agency reported a kiln thermal energy intensity of approximately 3.6 GJ per tonne of clinker in 2022, highlighting the energy-intensive nature of cement production [51]. Therefore, the substitution of cement with recycled LDPE has the potential to reduce some of the environmental burdens associated with construction material production, although the magnitude of such benefits was not quantified in the present study.
The proposed approach also supports circular economy principles by enabling waste plastic to remain within the material value chain for an extended period rather than being discarded after a single use. However, circularity cannot be demonstrated solely through material reuse. The long-term environmental performance of LDPE–sand composites will depend on factors such as service-life durability, recoverability, reusability, recyclability, and end-of-life management. Related life-cycle studies on sand–plastic composites have shown that environmental performance is strongly influenced by production scale, processing efficiency, and electricity source, emphasising the importance of considering the full material life cycle when assessing sustainability [52].
In addition, environmental considerations extend beyond material production and service life. Plastic materials may undergo physical and chemical weathering, leading to the generation of microplastics and nanoplastics, while additives, residual monomers, or other plastic-associated compounds may potentially migrate into surrounding environments under certain exposure conditions [53]. In construction applications, microplastics are increasingly recognised as emerging contaminants requiring improved risk management throughout design, construction, use, demolition, and disposal stages [54]. Potential release pathways for LDPE–sand composites could include manufacturing operations, abrasion during service, weathering, demolition activities, and end-of-life disposal. However, these aspects were not evaluated in the present study.
Although the present study demonstrates the technical feasibility of recycled LDPE–sand composites, a full assessment of environmental sustainability requires further investigation. Energy consumption associated with plastic melting and composite manufacturing was not quantified, and no life-cycle assessment (LCA) was conducted. This limitation is important because previous studies have reported that electricity consumption can dominate both cumulative energy demand and carbon footprint in sand–plastic composite production, with impacts varying substantially depending on processing scale and the electricity mix employed [52]. Furthermore, embodied energy, embodied carbon, leaching behaviour, recyclability after service, and end-of-life recovery options were not assessed. Future studies should therefore compare the embodied energy, carbon footprint, economic performance, and environmental impacts of LDPE–sand composites with conventional cement-based materials while also evaluating durability, leaching behaviour, microplastic generation potential, and recovery pathways following service life.

5. Conclusions

This study evaluated the influence of plastic content, processing temperature, and particle diameter on the mechanical and physical performance of LDPE–sand composites using a Taguchi L9 experimental design. The results showed that processing temperature was the most influential parameter governing composite performance. The optimum parameter combination corresponded to 30 wt.% plastic content, 260 °C processing temperature, and 1015 µm particle diameter, yielding an apparent compressive strength of 65.5 MPa, flexural strength of 20.7 MPa, tensile strength of 4.4 MPa, density of 1595.2 kg/m3, and water absorption of 0.7%.
The results demonstrated that recycled LDPE could function effectively as a cement-free binder within particulate composite systems. The developed composites exhibited moderate strength, low water absorption, and reduced density, indicating potential for construction applications where such properties are desirable. However, suitability for specific products cannot be confirmed based on the present dataset alone because product-specific performance requirements and standard-based qualification testing were not evaluated.
The use of recycled LDPE as a binder provides a potential route for converting plastic waste into value-added construction materials while reducing reliance on conventional cementitious binders. This approach is consistent with resource recovery and waste valorisation principles and may contribute to more sustainable material utilisation. However, the environmental benefits of the proposed material system were not quantified in this study. Factors such as embodied energy, embodied carbon, process energy consumption, recyclability, end-of-life management, leaching behaviour, and potential microplastic generation remain to be assessed before broader sustainability claims can be substantiated.
Several limitations should be acknowledged. Long-term durability, fire performance, environmental exposure behaviour, creep, abrasion resistance, and microstructural characteristics were not investigated. Future studies should therefore include durability evaluation, life-cycle assessment, techno-environmental assessment, end-of-life recovery analysis, and environmental impact evaluation to provide a more comprehensive understanding of the long-term performance and sustainability of LDPE–sand composite materials.

Supplementary Materials

The following supporting information can be downloaded at https://www.mdpi.com/article/10.3390/su18178641/s1, Table S1: Analysis of variance (ANOVA) for compressive strength in LDPE–sand composites; Table S2: Analysis of variance (ANOVA) for compressive modulus in LDPE–sand composites; Table S3: Analysis of variance (ANOVA) for flexural strength in LDPE–sand composites; Table S4: Analysis of variance (ANOVA) for tensile strength in LDPE–sand composites; Table S5: Analysis of variance (ANOVA) for water absorption in LDPE–sand composites; Table S6: Analysis of variance (ANOVA) for density in LDPE–sand composites.

Author Contributions

Conceptualization, O.F.O.; methodology, O.F.O.; formal analysis, O.F.O.; investigation, O.F.O.; data curation, O.F.O.; writing—original draft preparation, O.F.O.; writing—review and editing, S.J.A., E.D.-B. and V.S.; visualization, O.F.O. and E.D.-B.; supervision, S.J.A., E.D.-B. and V.S.; project administration, O.F.O. and S.J.A. All authors have read and agreed to the published version of the manuscript.

Funding

This research received no external funding.

Institutional Review Board Statement

Not applicable.

Informed Consent Statement

Not applicable.

Data Availability Statement

All data generated or analysed during this study are included in this published article and are discussed in detail within the manuscript.

Conflicts of Interest

The authors declare no conflicts of interest.

References

  1. Salimi, M.; Al-Ghamdi, S.G. Climate change impacts on critical urban infrastructure and urban resiliency strategies for the Middle East. Sustain. Cities Soc. 2020, 54, 101948. [Google Scholar] [CrossRef] [Scilit]
  2. Liu, T.; Chen, L.; Yang, M.; Sandanayake, M.; Miao, P.; Shi, Y.; Yap, P.S. Sustainability considerations of green buildings: A detailed overview on current advancements and future considerations. Sustainability 2022, 14, 14393. [Google Scholar] [CrossRef] [Scilit]
  3. Osman, A.I.; Chen, L.; Yang, M.; Msigwa, G.; Farghali, M.; Fawzy, S.; Rooney, D.W.; Yap, P.S. Cost, environmental impact, and resilience of renewable energy under a changing climate: A review. Environ. Chem. Lett. 2023, 21, 741–764. [Google Scholar] [CrossRef] [Scilit]
  4. Barbhuiya, S.; Kanavaris, F.; Das, B.B.; Idrees, M. Decarbonising cement and concrete production: Strategies, challenges and pathways for sustainable development. J. Build. Eng. 2024, 86, 108861. [Google Scholar] [CrossRef] [Scilit]
  5. Son, S.; Park, K.; Fitriani, H.; Kim, S. Embodied CO2 reduction effects of composite precast concrete frame for heavily loaded long-span logistics buildings. Sustainability 2021, 13, 1060. [Google Scholar] [CrossRef] [Scilit]
  6. Kc, S.; Gautam, D. Progress in sustainable structural engineering: A review. Innov. Infrastruct. Solut. 2021, 6, 68. [Google Scholar] [CrossRef] [Scilit]
  7. Santamouris, M.; Vasilakopoulou, K. Present and future energy consumption of buildings: Challenges and opportunities towards decarbonisation. E-Prime-Adv. Electr. Eng. Electron. Energy 2021, 1, 100002. [Google Scholar] [CrossRef] [Scilit]
  8. Mostafavi, F.; Tahsildoost, M.; Zomorodian, Z. Energy efficiency and carbon emission in high-rise buildings: A review (2005–2020). Build. Environ. 2021, 206, 108329. [Google Scholar] [CrossRef] [Scilit]
  9. Ricciardi, P.; Belloni, E.; Merli, F.; Buratti, C. Sustainable panels made with industrial and agricultural waste: Thermal and environmental critical analysis of the experimental results. Appl. Sci. 2021, 11, 494. [Google Scholar] [CrossRef] [Scilit]
  10. Aneke, F.I.; Shabangu, C. Green-efficient masonry bricks produced from scrap plastic waste and foundry sand. Case Stud. Constr. Mater. 2021, 14, e00515. [Google Scholar] [CrossRef] [Scilit]
  11. Chen, L.; Huang, L.; Hua, J.; Chen, Z.; Wei, L.; Osman, A.I.; Fawzy, S.; Rooney, D.W.; Dong, L.; Yap, P.S. Green construction for low-carbon cities: A review. Environ. Chem. Lett. 2023, 21, 1627–1657. [Google Scholar] [CrossRef] [Scilit]
  12. Zamora-Castro, S.A.; Salgado-Estrada, R.; Sandoval-Herazo, L.C.; Melendez-Armenta, R.A.; Manzano-Huerta, E.; Yelmi-Carrillo, E.; Herrera-May, A.L. Sustainable development of concrete through aggregates and innovative materials: A review. Appl. Sci. 2021, 11, 629. [Google Scholar] [CrossRef] [Scilit]
  13. Farghali, M.; Osman, A.I.; Mohamed, I.M.A.; Chen, Z.; Chen, L.; Ihara, I.; Yap, P.S.; Rooney, D.W. Strategies to save energy in the context of the energy crisis: A review. Environ. Chem. Lett. 2023, 21, 2003–2039. [Google Scholar] [CrossRef] [Scilit] [PubMed]
  14. Chen, L.; Msigwa, G.; Yang, M.; Osman, A.I.; Fawzy, S.; Rooney, D.W.; Yap, P.S. Strategies to achieve a carbon neutral society: A review. Environ. Chem. Lett. 2022, 20, 2277–2310. [Google Scholar] [CrossRef] [Scilit] [PubMed]
  15. Yang, M.; Chen, L.; Wang, J.; Msigwa, G.; Osman, A.I.; Fawzy, S.; Rooney, D.W.; Yap, P.S. Circular economy strategies for combating climate change and other environmental issues. Environ. Chem. Lett. 2023, 21, 55–80. [Google Scholar] [CrossRef] [Scilit]
  16. Luo, W.; Sandanayake, M.; Hou, L.; Tan, Y.; Zhang, G. A systematic review of green construction research using scientometrics methods. J. Clean. Prod. 2022, 366, 132710. [Google Scholar] [CrossRef] [Scilit]
  17. PlasticsEurope. Plastics the Fast Facts 2025 • Plastics Europe. 2025. Available online: https://plasticseurope.org/knowledge-hub/plastics-the-fast-facts-2025/ (accessed on 11 October 2025).
  18. Britannica. Low-Density Polyethylene (LDPE). In Encyclopedia Britannica; Britannica: Chicago, IL, USA, 2025; Available online: https://www.britannica.com/science/low-density-polyethylene (accessed on 11 October 2025).
  19. Moore, C. Plastic pollution in oceans and on land. In Encyclopedia Britannica; Britannica: Chicago, IL, USA, 2026. [Google Scholar]
  20. Institute for Environmental Research and Education. How Much Plastic is in Landfills? Available online: https://iere.org/how-much-plastic-is-in-landfills/ (accessed on 11 October 2025).
  21. Our World in Data. Share of Plastic Waste that is Recycled, Landfilled, Incinerated and Mismanaged. 2019. Available online: https://ourworldindata.org/grapher/share-plastic-fate (accessed on 11 October 2025).
  22. Chu, J.; Zhou, Y.; Cai, Y.; Wang, X.; Li, C.; Liu, Q. Flows and waste reduction strategies of PE, PP, and PET plastics under plastic limit order in China. Resour. Conserv. Recycl. 2023, 188, 106668. [Google Scholar] [CrossRef] [Scilit]
  23. Di, J.; Reck, B.K.; Miatto, A.; Graedel, T.E. United States plastics: Large flows, short lifetimes, and negligible recycling. Resour. Conserv. Recycl. 2021, 167, 105440. [Google Scholar] [CrossRef] [Scilit]
  24. Eriksen, M.K.; Christiansen, J.D.; Daugaard, A.E.; Astrup, T.F. Closing the loop for PET, PE and PP waste from households: Influence of material properties and product design for plastic recycling. Waste Manag. 2019, 96, 75–85. [Google Scholar] [CrossRef] [Scilit] [PubMed]
  25. Babayemi, J.O.; Nnorom, I.C.; Osibanjo, O.; Web, R. Ensuring sustainability in plastics use in Africa: Consumption, waste generation, and projections. Environ. Sci. Eur. 2019, 31, 60. [Google Scholar] [CrossRef] [Scilit]
  26. Olusunmade, O.F. Plastic wastes separation practice and disposal mechanism by households, hospitals, markets and waste management body. Int. J. Hum. Cap. Urban Manag. 2019, 4, 189–204. [Google Scholar] [CrossRef] [Scilit]
  27. Abduallah, R.; Burris, L.; Castro, J.; Sezen, H. Utilization of different types of plastics in concrete mixtures. Constr. Mater. 2025, 5, 39. [Google Scholar] [CrossRef] [Scilit]
  28. Sarella, V.; Krishna Padavala, H.; Gunneswara Rao, T.D. A Study on the Use of Waste Plastic as Partial Replacement to Sand/Fine Aggregate in Concrete. In Sustainable Construction Resources in Geotechnical Engineering; Hazarika, H., Haigh, S.K., Chaudhary, B., Murai, M., Manandhar, S., Eds.; IC-CREST 2023; Lecture Notes in Civil Engineering; Springer: Singapore, 2024; p. 448. [Google Scholar] [CrossRef] [Scilit]
  29. Kumi-Larbi Jnr, A.; Galpin, R.; Manjula, S.; Lenkiewicz, Z.; Cheeseman, C. Reuse of Waste Plastics in Developing Countries: Properties of Waste Plastic-Sand Composites. Waste Biomass Valorization 2022, 13, 3821–3834. [Google Scholar] [CrossRef] [Scilit]
  30. Iftikhar, B.; Alih, S.C.; Vafaei, M.; Ali, M.; Javed, M.F.; Asif, U.; Ismail, M.; Umer, M.; Gamil, Y.; Amran, M. Experimental study on the eco-friendly plastic-sand paver blocks by utilising plastic waste and basalt fibers. Heliyon 2023, 9, 6. [Google Scholar] [CrossRef] [Scilit] [PubMed]
  31. Jock, A.A.; Akpan, M.L.; Oluwadayo, F.A. Production and Characterization of Sand-Plastic Composite Floor Tiles. Hung. J. Ind. Chem. 2022, 50, 29–32. [Google Scholar] [CrossRef] [Scilit]
  32. Tempa, K.; Chettri, N.; Thapa, G.; Phurba Gyeltshen, C.; Norbu, D.; Gurung, D.; Wangchuk, U. An experimental study and sustainability assessment of plastic waste as a binding material for producing economical cement-less paver blocks. Eng. Sci. Technol. Int. J. 2022, 26, 101008. [Google Scholar] [CrossRef] [Scilit]
  33. Babatunde, Y.O.; Ibrahim, R.A.; Oguntayo, D.O. Effect of mix proportion on the strength and durability of plastic and sand composite for construction applications. Innov. Infrastruct. Solut. 2022, 7, 333. [Google Scholar] [CrossRef] [Scilit]
  34. Ge, Z.; Sun, R.; Zhang, K.; Gao, Z.; Li, P. Physical and mechanical properties of mortar using waste Polyethylene Terephthalate bottles. Constr. Build. Mater. 2013, 44, 81–86. [Google Scholar] [CrossRef] [Scilit]
  35. Mohandesi, J.A.; Refahi, A.; Meresht, E.S.; Berenji, S. Effect of temperature and particle weight fraction on mechanical and micromechanical properties of sand-polyethylene terephthalate composites: A laboratory and discrete element method study. Compos. Part B Eng. 2011, 42, 1461–1467. [Google Scholar] [CrossRef] [Scilit]
  36. Huang, S.; Fu, Q.; Yan, L.; Kasal, B. Characterization of interfacial properties between fibre and polymer matrix in composite materials—A critical review. J. Mater. Res. Technol. 2021, 13, 1441–1484. [Google Scholar] [CrossRef] [Scilit]
  37. Zahran, R.R. Effect of sand addition on the tensile properties of compression moulded sand/polyethylene composite system. Mater. Lett. 1998, 34, 161–167. [Google Scholar] [CrossRef] [Scilit]
  38. Adaveesh, B.; Mahesh, V.; Rakesh, M.; Nithin, H.R.; Channabasavaradhya, S.M.; Disha, I.G. Unveiling the impact of particle size on the physio-mechanical properties of eco-friendly polymer composites. Iran. Polym. J. 2025, 34, 689–701. [Google Scholar] [CrossRef] [Scilit]
  39. Olusunmade, O.F.; Antony, S.J.; Danso-Boateng, E.; Sarhosis, V.; Ogunnigbo, O.C. Development and optimisation of sustainable recycled PET–sand composites for construction applications. Innov. Infrastruct. Solut. 2026, 11, 238. [Google Scholar] [CrossRef] [Scilit]
  40. Pundir, R.; Chary, G.H.V.C.; Dastidar, M.G. Application of Taguchi method for optimizing the process parameters for the removal of copper and nickel by growing Aspergillus sp. Water Resour. Ind. 2018, 20, 83–92. [Google Scholar] [CrossRef] [Scilit]
  41. Thondiyil, D.; Kodakkattu, S.K. Optimization of a shell and tube heat exchanger with staggered baffles using Taguchi method. Mater. Today Proc. 2021, 46, 9983–9988. [Google Scholar] [CrossRef] [Scilit]
  42. Wentworth, C.K. A scale of grade and class terms for clastic sediments. J. Geol. 1922, 30, 377–392. [Google Scholar] [CrossRef] [Scilit]
  43. Venkatarama Reddy, B.V.; Gupta, A. Influence of sand grading on the characteristics of mortars and soil–cement block masonry. Constr. Build. Mater. 2008, 22, 1614–1623. [Google Scholar] [CrossRef] [Scilit]
  44. Aboulkas, A.; El harfi, K.; El Bouadili, A. Thermal degradation behaviors of polyethylene and polypropylene. Part I: Pyrolysis kinetics and mechanisms. Energy Convers. Manag. 2010, 51, 1363–1369. [Google Scholar] [CrossRef] [Scilit]
  45. Mohan, H.T.; Whitaker, F.; Gaskell, D.; Mohan, R.; Mini, K.M. Performance assessment of recycled LDPE with sand fillers. Mater. Today Proc. 2021, 42, 1526–1530. [Google Scholar] [CrossRef] [Scilit]
  46. Solomon, A.A.; Shelton, J.J.; Daniel, C. Turning low-density polyethylene plastic waste into plastics bricks for sustainable development. Mater. Today Proc. 2023, in press. [Google Scholar] [CrossRef] [Scilit]
  47. Soni, A.; Das, P.K.; Yusuf, M.; Kamyab, H.; Chelliapan, S. Development of sand-plastic composites as floor tiles using silica sand and recycled thermoplastics: A sustainable approach for cleaner production. Sci. Rep. 2022, 12, 18921. [Google Scholar] [CrossRef] [Scilit] [PubMed]
  48. Kumi-Larbi, A.; Yunana, D.; Kamsouloum, P.; Webster, M.; Wilson, D.C.; Cheeseman, C. Recycling waste plastics in developing countries: Use of low-density polyethylene water sachets to form plastic bonded sand blocks. Waste Manag. 2018, 80, 112–118. [Google Scholar] [CrossRef] [Scilit] [PubMed]
  49. Wolny, R.; Wiczenbach, T.; Pachocki, L.; Wilde, K.; Rucka, M. The role of sand filler in enhancing the mechanical properties of polymethylmethacrylate composites. Arch. Mech. 2025, 77, 53–66. [Google Scholar] [CrossRef]
  50. Babatunde, O.Y.; Abdalla, T.A.; Alahmari, T.S.; Hassan, R. Adaptive reuse of waste plastic as binders in composites for sustainable construction. Clean. Eng. Technol. 2024, 22, 100812. [Google Scholar] [CrossRef] [Scilit]
  51. International Energy Agency (IEA). Cement; International Energy Agency: Paris, France, 2023; Available online: https://www.iea.org/reports/cement-3 (accessed on 17 July 2026).
  52. Roy, R.; Mottaghi, M.; Woods, M.; Pearce, J.M. Life Cycle Carbon Emissions Savings of Replacing Concrete with Recycled Polycarbonate and Sand Composite. Sustainability 2025, 17, 839. [Google Scholar] [CrossRef] [Scilit]
  53. Iftikhar, A.; Qaiser, Z.; Sarfraz, W.; Ejaz, U.; Aqeel, M.; Rizvi, Z.F.; Khalid, N. Understanding the leaching of plastic additives and subsequent risks to ecosystems. Water Emerg. Contam. Nanoplastics 2024, 3, 5. [Google Scholar] [CrossRef] [Scilit]
  54. CIRIA Microplastics in Construction Projects: What We Know Now and Good Practice Guidance. CIRIA Research Project P3283. Available online: https://www.ciria.org/CIRIA/Research/Projects_underway2/Microplastics%20in%20construction%20projects.aspx (accessed on 17 July 2026).
Figure 1. Constituent materials used in the preparation of LDPE–sand composites: (a) cleaned LDPE sachets, (b) dry sand, and (c) graded sand fractions.
Sustainability 18 08641 g001
Figure 2. Particle size distribution (PSD) of sieved sand fractions.
Sustainability 18 08641 g002
Figure 3. Schematic illustration of the preparation and fabrication process of LDPE–sand composites.
Sustainability 18 08641 g003
Figure 4. Main effects plot showing the influence of processing parameters on compressive strength. The plot shows the mean compressive strength at each factor level, as generated by Minitab 22. The dashed reference line indicates the overall mean response across all experimental runs.
Sustainability 18 08641 g004
Figure 5. Combined effects of processing temperature, plastic–sand ratio, and particle diameter on compressive strength. The plot shows the combined effects of processing temperature, plastic–sand ratio, and particle diameter on compressive strength. Particle diameter values are indicated within the corresponding bars.
Sustainability 18 08641 g005
Figure 6. Main effects plot showing the influence of processing parameters on the compressive modulus of the developed composite. The plot shows the mean compressive modulus at each factor level, as generated by Minitab. The dashed reference line indicates the overall mean response across all experimental runs.
Sustainability 18 08641 g006
Figure 7. Combined effects of processing temperature, plastic–sand ratio, and particle diameter on compressive modulus. The plot shows the combined effects of processing temperature, plastic–sand ratio, and particle diameter on compressive modulus. Particle diameter values are indicated within the corresponding bars.
Sustainability 18 08641 g007
Figure 8. Flexural stress–strain behaviour of (a) LDPE–sand composite produced under optimal processing conditions (30 wt.% LDPE, 260 °C, 1015 µm particle size) and (b) plain recycled LDPE.
Sustainability 18 08641 g008
Figure 9. Main effects plot showing the influence of processing parameters on the flexural strength of the developed composite. The plot shows the mean flexural strength at each factor level, as generated by Minitab. The dashed reference line indicates the overall mean response across all experimental runs.
Sustainability 18 08641 g009
Figure 10. Combined effects of processing temperature, plastic–sand ratio, and particle diameter on flexural strength. The plot shows the combined effects of processing temperature, plastic–sand ratio, and particle diameter on flexural strength. Particle diameter values are indicated within the corresponding bars.
Sustainability 18 08641 g010
Figure 11. Tensile stress–strain responses of (a) LDPE–sand composite at the optimal processing condition (30 wt.% LDPE, 260 °C, 1015 µm particle size) and (b) plain recycled LDPE.
Sustainability 18 08641 g011
Figure 12. Main effects plot showing the influence of processing parameters on the tensile strength of the developed composite. The plot shows the mean tensile strength at each factor level, as generated by Minitab. The dashed reference line indicates the overall mean response across all experimental runs.
Sustainability 18 08641 g012
Figure 13. Combined effects of processing temperature, plastic–sand ratio, and particle diameter on tensile strength. The plot shows the combined effects of processing temperature, plastic–sand ratio, and particle diameter on tensile strength. Particle diameter values are indicated within the corresponding bars.
Sustainability 18 08641 g013
Figure 14. Main effects plot showing the influence of processing parameters on the water absorption of the developed composite. The plot shows the mean water absorption at each factor level, as generated by Minitab. The dashed reference line indicates the overall mean response across all experimental runs.
Sustainability 18 08641 g014
Figure 15. Combined effects of processing temperature, plastic–sand ratio, and particle diameter on water absorption. The plot shows the combined effects of processing temperature, plastic–sand ratio, and particle diameter on water absorption. Particle diameter values are indicated within the corresponding bars.
Sustainability 18 08641 g015
Figure 16. Main effects plot showing the influence of processing parameters on the density of the developed composite. The plot shows the mean density at each factor level, as generated by Minitab. The dashed reference line indicates the overall mean response across all experimental runs.
Sustainability 18 08641 g016
Figure 17. Combined effects of processing temperature, plastic–sand ratio, and particle diameter on density. The plot shows the combined effects of processing temperature, plastic–sand ratio, and particle diameter on density. Particle diameter values are indicated within the corresponding bars.
Sustainability 18 08641 g017
Figure 18. Comparison between predicted and experimental values for (af): compressive strength (CS), compressive modulus (CM), flexural strength (FS), tensile strength (TS), water absorption (WA), and density (DE).
Sustainability 18 08641 g018
Table 1. L9 (3 × 3) orthogonal array showing combinations of plastic content (PC), processing temperature (PT), and particle diameter (PD).
RunFactor 1Factor 2Factor 3Plastic/Sand Ratio (% weight)Processing Temperature (°C)Avg Particulate Diameter (µm)Code
111130/70220319M1
212230/70240638M2
313330/702601015M3
421240/60220638M4
522340/602401015M5
623140/60260319M6
731350/502201015M7
832150/50240319M8
933250/50260638M9
Table 2. Characterisation of the mechanical and physical properties of the LDPE–sand composite materials.
RunPlastic Content (% wt)Processing Temperature (°C)Avg. Particulate Diameter (µm)Compressive Strength (MPa)Compressive Modulus (MPa)Flexural Strength (MPa)Tensile Strength (MPa)Density (kg/m3)Water Absorption (%)Code
1302203196.7 ± 2.0199.8 ± 11.55.7 ± 0.51.6 ± 0.31692.4 ± 32.61.7 ± 0.4M1
23024063822.1 ± 1.8209.2 ± 7.910.9 ± 1.72.7 ± 0.61648.2 ± 21.61.1 ± 0.1M2
330260101565.5 ± 6.0212.3 ± 12.220.7 ± 4.04.4 ± 0.31595.2 ± 31.80.7 ± 0.2M3
4402206388.1 ± 1.2114.9 ± 5.65.8 ± 1.21.7 ± 0.41487.6 ± 20.31.5 ± 0.1M4
540240101525.6 ± 3.2116.5 ± 5.811.0 ± 1.82.8 ± 0.71439.7 ± 20.30.9 ± 0.1M5
64026031929.6 ± 4.6213.0 ± 11.219.8 ± 3.43.8 ± 0.31563.3 ± 26.80.6 ± 0.2M6
75022010158.5 ± 2.464.0 ± 5.35.9 ± 1.71.8 ± 0.31299.4 ± 27.71.3 ± 0.2M7
85024031911.5 ± 1.9116.9 ± 6.510.6 ± 1.52.4 ± 0.91411.0 ± 24.40.8 ± 0.1M8
95026063832.2 ± 5.0122.5 ± 6.920.1 ± 3.53.9 ± 0.31374.1 ± 24.10.5 ± 0.1M9
Table 3. Multiple response prediction of the composite material properties by linear regression.
VariableSetting
Plastic weight fraction (% wt.)30
Processing temperature (°C)260
Particulate diameter (µm)1015
ResponseFitSE Fit95% Cl95% PIDesirability
Score
Compressive strength (MPa)55.05.0(42.1, 67.9)(33.8, 76.2)0.82
Flexural strength (MPa)19.21.1(16.5, 22.0)(14.7, 23.7)0.90
Tensile strength (MPa)4.20.1(3.8, 4.5)(3.6, 4.7)0.91
Water absorption (%)0.70.1(0.6, 0.9)(0.5, 1.0)1.00
Density (kg/m3)1594.24.3(1583.3, 1605.2)(1576.3, 1612.2)0.98
Overall 0.92
Table 4. Pearson correlation matrix (r) for PC, PT, PD vs. CS, CM, FS, TS, WA, DE.
PCPTPDCSCMFSTSDEWA
PC1.0000.0000.000−0.326−0.814−0.016−0.084−0.929−0.312
PT0.0001.000−0.0000.8070.4330.9840.9750.058−0.935
PD0.000−0.0001.0000.406−0.3480.0340.168−0.363−0.071
CS−0.3260.8070.4061.0000.4770.8410.9070.203−0.665
CM−0.8140.433−0.3480.4771.0000.4370.4390.912−0.122
FS−0.0160.9840.0340.8410.4371.0000.9870.061−0.894
TS−0.0840.9750.1680.9070.4390.9871.0000.074−0.883
DE−0.9290.058−0.3630.2030.9120.0610.0741.0000.263
WA−0.312−0.935−0.071−0.665−0.122−0.894−0.8830.2631.000
Table 5. Cross-validation performance metrics for the developed regression models.
ResponseR2 (In-Sample)MAE (In)R2 (LOOCV)MAE (LOOCV)R2 (3-Fold)MAE (3-Fold)
CS0.9223.9840.6907.4250.6846.959
CM0.9727.3290.88413.7780.87314.108
FS0.9710.9630.9071.7580.9041.666
TS0.9860.1040.9540.1900.9520.187
DE0.9993.3740.9966.3020.9938.501
WA0.9770.0520.9270.0940.9280.091
Table 6. Comparison of current study with some other LDPE–sand composites in literature.
S/NCompressive Strength (MPa)Modulus (MPa)Flexural Strength (MPa)Tensile Strength (MPa)Water Absorption (%)Density (kg/m3)DimensionPlastic: Sand (%wt)Plastic TypeProcessingReferences
165.5
29.6
32.2
212.3
213.0
122.5
20.7
19.8
20.1
4.4
3.8
3.9
0.7
0.6
0.5
1595.2
1563.3
1374.1
CS/CM/WA/DE: 30 × 30 × 15 mm
FS: 100 × 12 × 15 mm
TS: 100 × 10 × 5 mm
30:70 (1015 µm)
40:60 (319 µm)
50:50 (638 µm)
LDPEThermalCurrent Study
214.0XXX1.01X 50:50LDPEThermal[45]
314.69
16.50
17.04
16.10
XXX1.86
1.22
1.15
1.04
X50 × 50 × 50 mm20:80
25:75
30:70
40:70
LDPEThermal[30]
43.63
12.23
3.63
XXX0.64
0.59
0.34
X190 × 90 × 90 mm17:83
20:80
25:75
LDPEThermal[46]
544.50X5.13X0.12XCS: 50 × 50 × 50 mm
FS: 75 × 10 × 10 mm
WA: 75 × 30 × 30 mm
50:50LDPEThermal[47]
617.0
20.0
27.3
25.0
22.0
XXXX1910
1760
1460
50 × 50 × 50 mm17:83
20:80
25:75
33:67
50:50
LDPEThermal[48]
717.0
22.5
27.5
23.5
XX
19
X
X
XXCS: 50 × 50 × 50 mmCS: 50 × 50 × 50 mm20:80
25:75
33:67
50:50
LDPEThermal[29]
Disclaimer/Publisher’s Note: The statements, opinions and data contained in all publications are solely those of the individual author(s) and contributor(s) and not of MDPI and/or the editor(s). MDPI and/or the editor(s) disclaim responsibility for any injury to people or property resulting from any ideas, methods, instructions or products referred to in the content.