Article

Public Service Facility Layout Types, Travel Carbon Emissions, and Low-Carbon Renewal Strategies in TOD Blocks


1
College of Civil Engineering and Architecture, Shandong University of Science and Technology, Qingdao 266590, China
2
Natural Resources Bureau of Qingdao West Coast New Area, Qingdao 266555, China
3
Qingdao Urban Planning & Design Research Institute, Qingdao 266071, China
*
Author to whom correspondence should be addressed.
Sustainability 2026, 18(16), 8583; https://doi.org/10.3390/su18168583
Submission received: 14 July 2026 / Revised: 2 August 2026 / Accepted: 6 August 2026 / Published: 21 August 2026

Abstract

The spatial organization of public service facilities within transit-oriented development TOD blocks is closely related to residents’ daily travel conditions and travel-related carbon emissions. This study examined all 172 operating metro station areas in Qingdao using public service facility POIs, buildings, pedestrian road network and population data, field observations, and a resident travel survey. K-means clustering, spatial syntax analysis, Global Moran’s I, spatial regression, FDR-adjusted Pearson correlation analysis, and scenario simulation were jointly applied. Four facility layout types were identified: Spatially Balanced Type, Main-Road-Concentrated Type, Point-Concentrated Type, and Scattered-and-Disordered Type. The survey included 240 valid respondents distributed across all 41 station areas along Qingdao Metro Line 1. The Spatially Balanced Type had the lowest mean weekly per capita travel carbon emissions, followed by the Main-Road-Concentrated Type, whereas the Point-Concentrated and Scattered-and-Disordered types had similarly higher emission levels. The density and accessibility of Commercial and Entertainment facilities, Medical and Health facilities, and total facilities remained negatively associated with travel carbon emissions after FDR correction. Spatial syntax analysis showed that higher road network integration and connectivity were associated with stronger facility agglomeration. Facility density, road density, and population density exhibited significant positive network-based spatial autocorrelation, and the spatial error model provided the best fit, identifying positive associations of facility density with road density and population density. Based on these findings and field observations, three differentiated renewal pathways—node embedding, proximity coordination, and intensive integration—were proposed. Under the specified scenario, a 20% increase in facilities was associated with modeled reductions in aggregate weekly carbon emissions of 32.3% in Li Village, 28.1% in the University of Petroleum station area, and 33.0% in Jinggangshan Road. These results suggest that improving overall facility coverage may support lower-carbon travel across different facility layout contexts. This study connects facility layout typology, spatial structure, travel carbon emission associations, and differentiated renewal strategies at the TOD-block scale.

1. Introduction

City blocks are the cornerstone for achieving low-carbon transition and sustainable development in the urban built environment [1]. Its spatial form and functional structure directly determine the energy consumption patterns and carbon emission levels of residents’ daily activities [2]. At this micro-scale, the layout structure of public service facilities not only serves as the fundamental support for meeting residents’ daily needs but also constitutes a key spatial factor that profoundly influences individual travel choices and transportation mode preferences [3]. Significant variations exist in the carbon emission intensity associated with different modes of transportation. Consequently, the spatial rationality of facility allocation influences the distribution and composition of travel chains, which in turn impacts the overall carbon emissions of a block. This creates a synergistic mechanism linking spatial organization, behavioral choices, and environmental impacts [4]. Within this framework, the spatial configuration of public service facilities, residents’ travel behavior, and travel-related carbon emissions form an interrelated system. Clarifying and optimizing this systemic interconnection not only holds significant theoretical value for enhancing facility service efficiency and promoting low-carbon travel but also provides practical guidance for block-scale spatial renewal and low-carbon governance.
In classifying the scales of low-carbon renewal construction in spatial contexts, some scholars categorize them into three levels: the regional, urban, and block levels [5]. Existing research has largely focused on the regional and urban levels, achieving relatively mature outcomes in planning strategies, policy tools, and technical approaches [6,7,8]. However, mechanisms and intervention methods for low-carbon renewal at the micro-scale—particularly at the block level—remain relatively underdeveloped. This is especially true in the areas of empirical research and detailed design concerning coordinated emission reductions through facility allocation and travel behavior [9]. Therefore, focusing on the block—the fundamental unit for urban spatial governance and low-carbon renewal—to examine the relationship between public service facility layout and residents’ low-carbon travel behavior not only enriches and expands the theoretical framework of “space–behavior” interactions at the micro-scale [10], providing essential micro-level empirical support and theoretical integration for existing meso- and macro-level low-carbon planning systems, but also offers scientific rationale and methodological insights for advancing an integrated low-carbon renewal model encompassing “block units, facility networks, and spatial environments.” By revealing the pathways and intensity of influence through which spatial characteristics of facility configurations affect mode choice, this research provides an empirical foundation for developing refined, differentiated low-carbon block renewal strategies. This, in turn, promotes the coordinated development of optimized urban spatial structures, decarbonized transportation systems, and enhanced residents’ quality of life.
Transit-oriented development (TOD) was first formally and systematically proposed by American urban and architectural designer Peter Calthorpe in his 1993 publication. This model has emerged as a key planning strategy for advancing low-carbon urban transformation and sustainable development, owing to its significant potential in promoting intensive land use, optimizing urban spatial structures, and reducing residents’ reliance on private vehicle travel [11,12]. Guided by the TOD model, urban spaces undergo high-density, mixed-use development centered around public transit stations. This approach effectively increases the share of public transportation usage while reducing carbon emissions from motorized travel [13]. Existing research primarily focuses on analyzing transportation mode composition and travel volume calculations. By constructing carbon emission models under different development scenarios, it quantitatively evaluates the carbon reduction benefits of the TOD model [14]. Empirical findings indicate that enhancing public transportation coverage and appeal, while actively developing continuous and comfortable pedestrian and cycling environments, represents an effective pathway to reduce carbon emissions in the transportation sector [15,16]. However, the root cause of transportation carbon emissions lies in the travel behavior decisions of individual residents, particularly their choice of transportation mode. Therefore, the fundamental approach to achieving a low-carbon transportation system is to guide travel behavior toward greener modes [17]. In this behavioral shift, the spatial distribution of public service facilities and the service efficiency of public transportation systems jointly constitute key influencing mechanisms. The rationality of facility layout directly determines travel distances and accessibility for various daily activities, while the coverage level, service quality, and connectivity efficiency of public transportation systems with slow-moving networks influence residents’ actual mode choices within acceptable time-space constraints [18]. The two complement each other, jointly shaping a low-carbon travel environment dominated by public transit and walking. Therefore, in low-carbon renewal at the TOD block scale, attention should not be limited to development intensity and public transit supply. It is equally crucial to systematically coordinate the allocation logic of public service facilities with the public transit network. Through integrated planning interventions that unify “space–facility–transportation,” low-carbon travel behaviors can be guided at their source, achieving effective reductions in carbon emissions.
Urban public service facilities serve as the essential physical infrastructure sustaining citizens’ daily lives [19]. The configuration level and spatial structure directly impact the convenience, comfort, and overall well-being of residents’ daily lives [20]. As urban development shifts from prioritizing economic growth to enhancing living standards, the concepts of the “15 min block” [21] and the “15 min city” [22] have emerged as key tools for refined governance and people-centered planning. Scholars both domestically and internationally have conducted extensive research on the classification of living zones [23,24,25], the optimization of resource allocation [26,27,28], and the assessment of accessibility [29,30,31,32]. The core principle lies in defining the coverage scope of public service facilities through temporal dimensions, thereby restructuring the logic and prioritization of facility allocation. This concept not only drives a profound shift in public service provision from an “administrative orientation” to a “demand-driven approach” but also exerts a systemic influence on the planning layout, construction standards, and operational management models of such facilities. Therefore, examining the allocation of public service facilities based on the living circle as the fundamental unit enables more precise identification of service gaps and spatial mismatches, thereby providing scientific and detailed planning basis for optimizing the facility system. China’s “Urban Residential Area Planning and Design Standards (GB50180-2018)” formally established a four-tier residential area system comprising “15 min, 10 min, and 5 min living circles” and “residential blocks,” specifying the categories and scales of public service facilities required at each level [33]. Among these, the 15 min living circle aligns closely with the spatial scale of urban blocks. Its development directly guides the networked layout and functional integration of public service facilities at the block level. By promoting the relatively balanced distribution of daily service facilities—such as education, healthcare, and commerce—within walking distance, living circle planning effectively reduces residents’ non-essential motorized travel distances and lowers dependence on private vehicles. This objective aligns intrinsically with the TOD model’s advocacy for “organizing efficient, compact, mixed-use communities centered around transit stations.” The two approaches synergistically reinforce each other at the block scale: the TOD model provides the structural framework and passenger flow support for low-carbon mobility, while the living circle concept fills the network with daily service functions centered on human needs. This deep integration of “transportation nodes” and “living units” collectively shapes a low-carbon-oriented urban spatial development paradigm that balances travel efficiency with quality of life, offering a critical pathway toward achieving green, inclusive, and sustainable cities.
Although current research on urban public service facilities has established a relatively comprehensive theoretical framework and evaluation system, existing findings still exhibit certain limitations in terms of research scale, facility type coverage, and analytical dimensions [34]. First, regarding research scale, most studies focus on macro-level administrative units such as cities and districts, or on the entire urban system, emphasizing macro-level issues like the total supply of regional facilities and spatial equity. Consequently, there is insufficient attention paid to the block—the micro-level physical space where residents’ daily lives and behaviors unfold. As the ultimate point of facility allocation and the direct setting for residents’ perceptions, the layout structure, service coverage, and utilization efficiency of facilities within blocks are critical factors influencing individual travel decisions and the overall carbon footprint of communities. These aspects urgently require more refined examination.
Second, in terms of facility types, existing research has largely focused on evaluating and optimizing the allocation of specific facility categories, lacking comprehensive and systematic studies that encompass multiple types of facilities such as commercial, medical, cultural, sports, and social welfare facilities. For instance, Zhou Zhaosen et al. investigated the configuration standards for urban park facilities in Guangzhou through survey analysis and standard development practices [35]. They proposed categorizing facilities into three types—recreational, service, and management—and recommended rational selection, layout, and quality design based on park type and size variations. As an organic whole, the coordinated configuration and network structure of public service facilities directly influence the formation and mode choice of residents’ composite travel chains. Optimizing a single facility type alone cannot achieve the overall low-carbon transformation of travel behavior. Chen Jinyao et al. analyzed the spatial distribution characteristics of elderly care facilities in Xi’an using multi-source data and GIS technology [36]. They found uneven facility distribution and low accessibility in urban–rural transition zones, recommending optimization of facility layout and service provision based on population distribution and satisfaction levels. Huang Yixin et al., through an analysis of Japan’s “retail facilities + elderly care” model, propose that China should develop a multi-stakeholder “X + elderly care” model [37]. This approach should focus on the needs of ordinary seniors and flexibly deploy affordable elderly care facilities within community living circles. Huang Qiaoli et al. employed ArcGIS 10.8 spatial analysis and the Gaussian two-step travel search method to investigate the spatiotemporal distribution and accessibility of basic education facilities in Shanghai’s suburban areas [38]. Their findings revealed that while facility numbers increased under new town development, significant per capita disparities emerged. Spatially, a pattern of “large dispersion and small clustering” emerged, with accessibility highly overlapping with new town boundaries. Based on the “urban residents” theory, Wang Taize et al. evaluated the allocation of community sports facilities in Xian’s Xincheng District from both subjective and objective dimensions [39]. They found that accessibility and equity significantly influence resident satisfaction and accordingly proposed differentiated optimization pathways for four distinct community types. Therefore, existing research remains fragmented in terms of facility types, with a distinct lack of systematic exploration into the coordinated allocation and networked layout of multiple facilities. Future efforts must urgently focus on enhancing integrated optimization research for diverse public service facilities, adopting a holistic perspective that addresses residents’ complex needs and the low-carbon mobility chain. More importantly, existing research analyzing the impact of facility layout has primarily focused on the supply–demand matching relationship between facilities and static population distribution (such as density and structure), failing to adequately incorporate residents’ dynamic travel behavior as a key mediating variable [40,41,42,43]. The spatial layout of public service facilities not only serves static “population demand” but also dynamically shapes block transportation carbon emissions by influencing travel distance, route selection, and mode choice. Therefore, overlooking the “facility–travel behavior–carbon emissions” transmission mechanism makes it difficult to reveal the underlying mechanisms by which facility layout impacts low-carbon performance and prevents the provision of precise planning interventions for block renewal aimed at carbon reduction [44]. Thus, adopting a systemic perspective that integrates multiple facility types to deeply explore the coupled relationship among facility layout, travel behavior, and carbon emissions at the micro-block scale holds significant theoretical complementarity and practical guidance value.
Compared with existing TOD studies focusing mainly on development density, land-use mix, transit accessibility, and travel mode choice, and 15 min city studies emphasizing facility coverage and accessibility, this study further examines the internal spatial configuration of public service facilities at the block scale. Its main contribution is to identify facility layout types using multiple spatial indicators, examine their relationships with residents’ travel carbon emissions, and propose differentiated renewal strategies for different block types.

2. Research Framework

2.1. The Behavior–Space–Environment Conceptual Framework

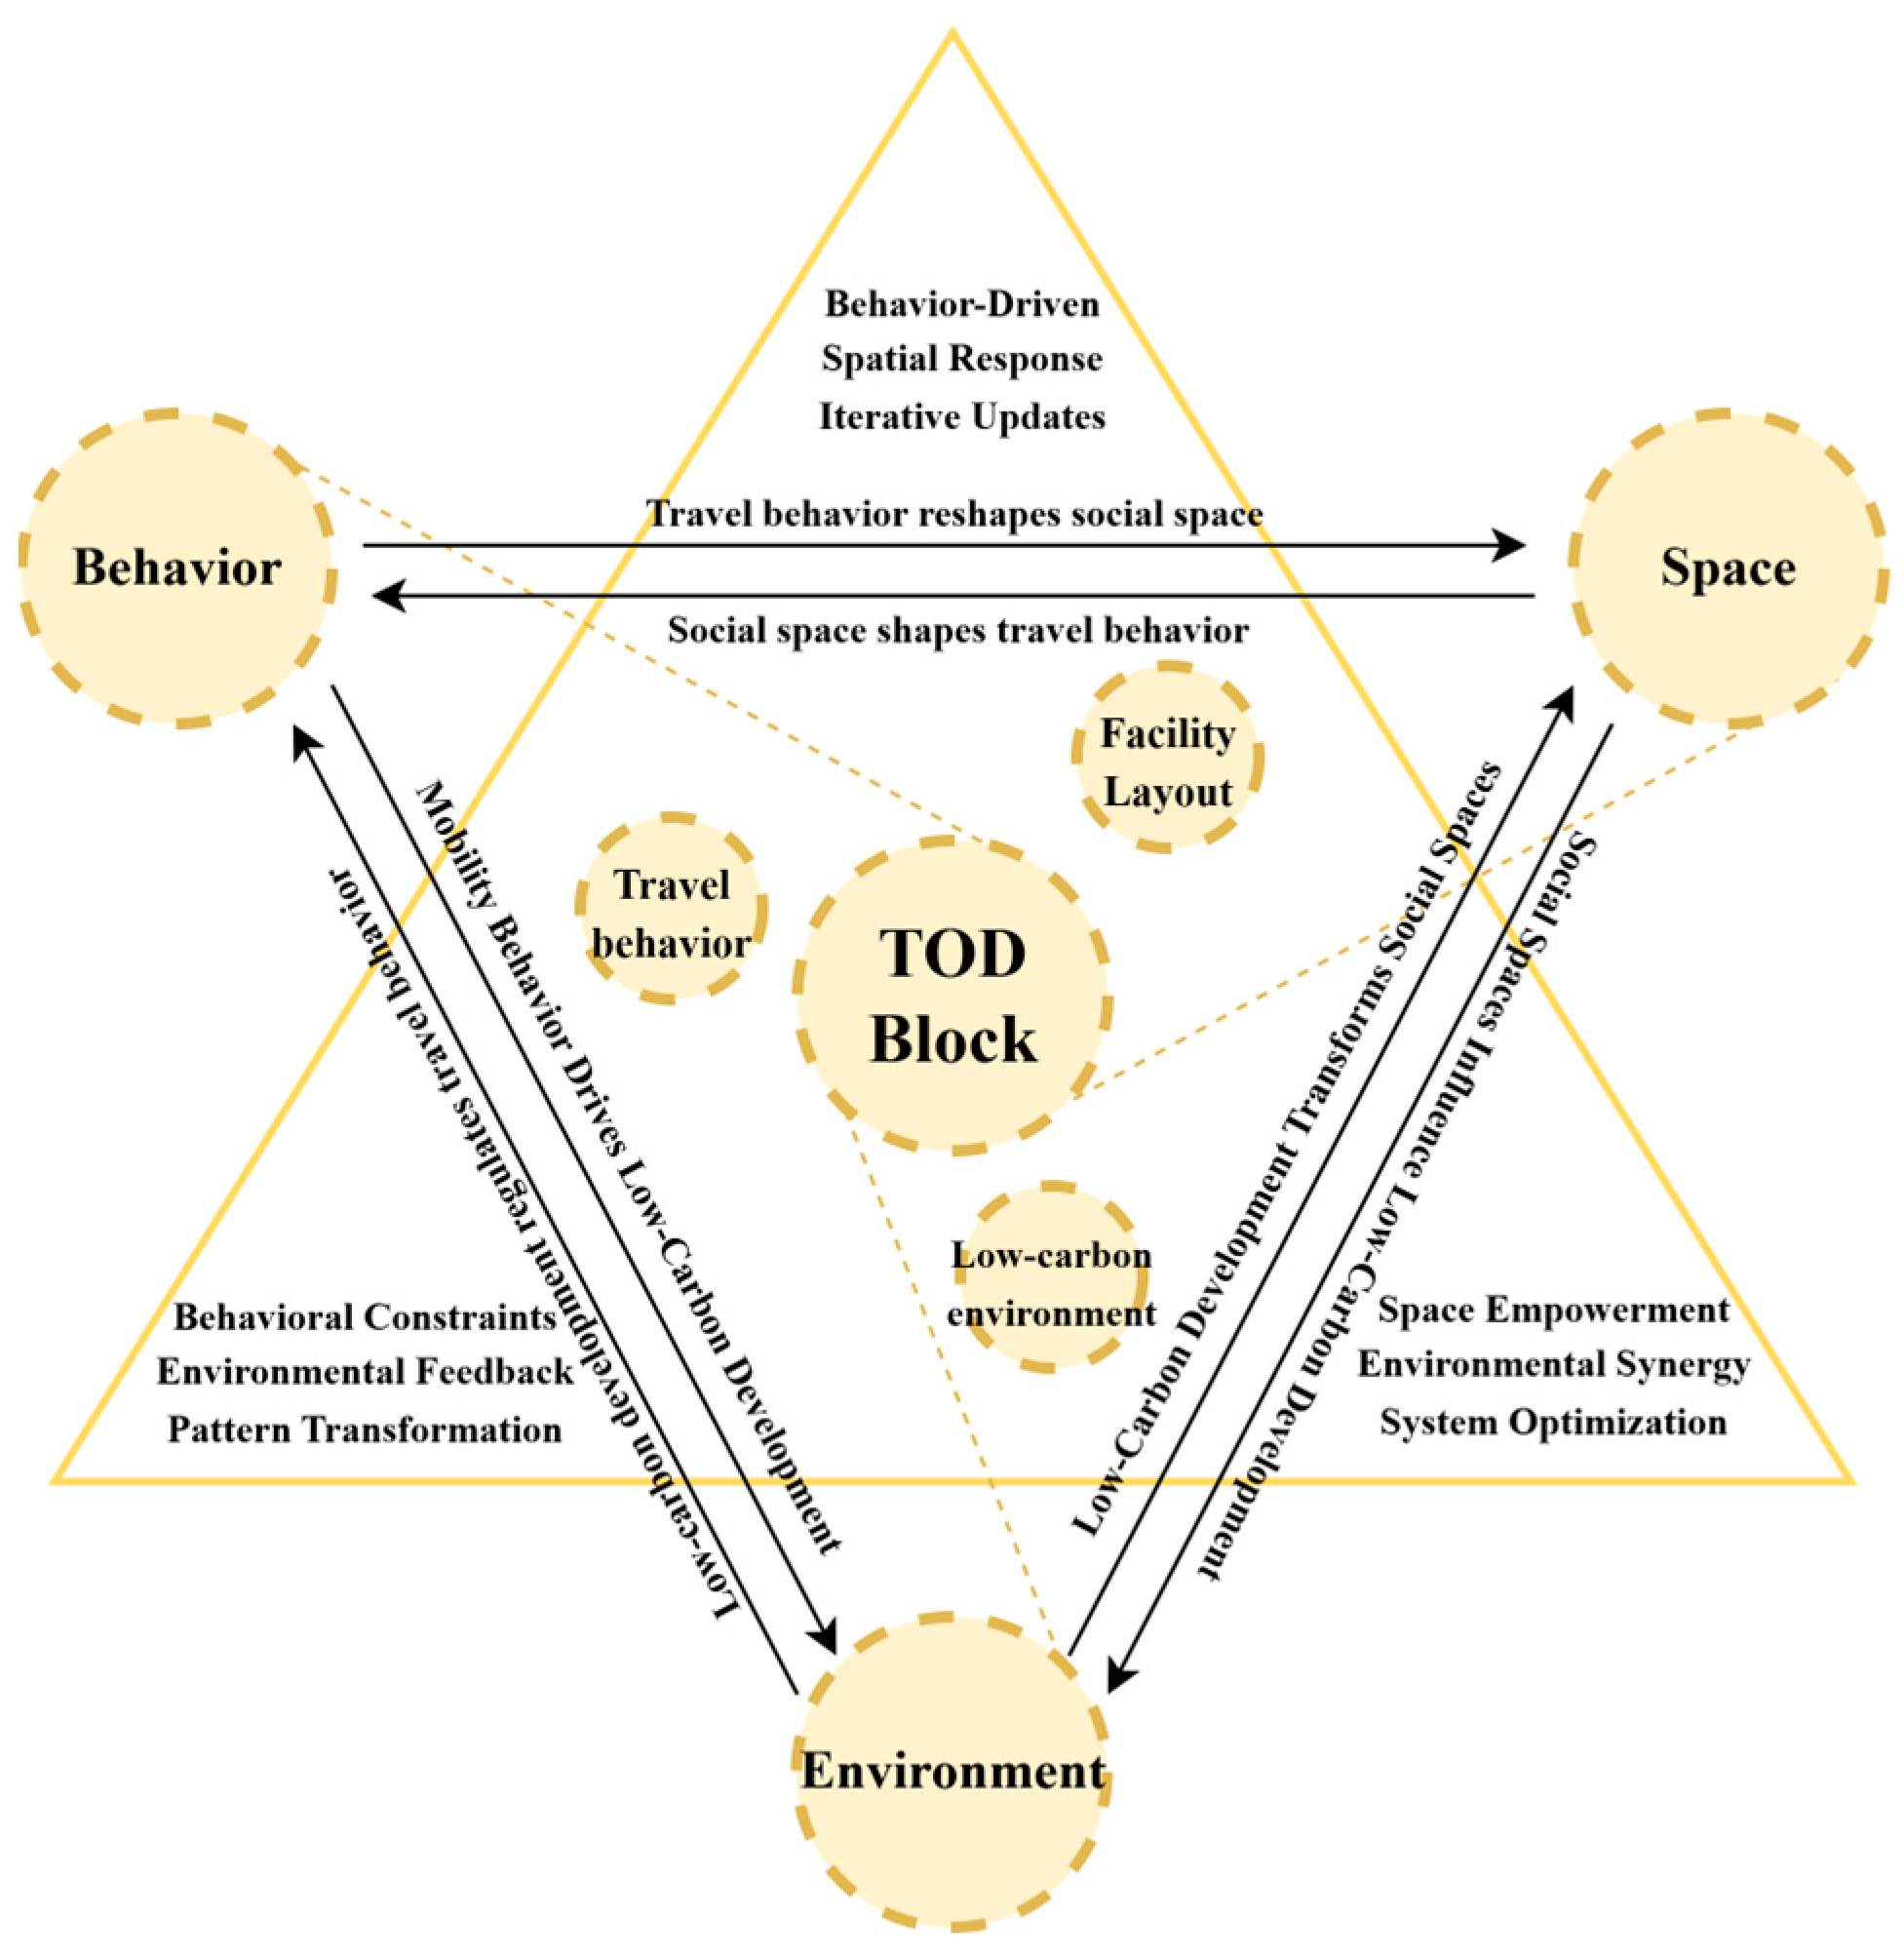
This paper constructs an interactive relationship model among behavior, space, and environment, revealing the intrinsic logic linking travel behavior, social space, and low-carbon development (Figure 1).
Within the behavioral–spatial interaction dimension, travel behavior—as a key manifestation of human activity—possesses the agency to reshape spatial structures. From a behavioral geography perspective, micro-level travel behaviors—such as residents’ choice of transportation modes, route selection, and frequency distribution—accumulate over time and aggregate spatially. This process drives the expansion and contraction of urban functional zones, transforms land-use patterns, and ultimately reshapes social spatial structures. Conversely, social space—as the physical carrier of behavior and a reflection of social relations—follows the principles of spatial determinism in its form, layout, and functional zoning. This profoundly influences travel behavior.
At the spatial–environmental interface, grounded in sustainable development theory, spatial planning serves as a strategic guide across multiple scales—regional, urban, and block. Low-carbon oriented spatial planning reduces energy consumption and pollution emissions from transportation by optimizing land resource allocation and enhancing green transportation networks. This facilitates ecological transformation of social spaces and drives improvements in environmental quality.
Within the realm of behavior–environment interactions, based on environmental behavioral science theory, the low-carbon transformation of travel behavior serves as a key driver for environmental sustainability. When residents opt for green travel modes such as public transit and non-motorized transportation, it effectively reduces carbon emissions, alleviates traffic congestion, and improves urban environments. Simultaneously, enhanced environmental quality acts as positive feedback, fostering greater environmental awareness and behavioral incentives among individuals. This, in turn, promotes the sustained internalization and widespread adoption of green travel practices.
In summary, behavior, space, and environment are interrelated across multiple spatial scales. Clarifying these relationships provides a conceptual basis for examining how facility layout is associated with residents’ travel behavior and travel-related carbon emissions.

2.2. Theory of Natural Movement and Urban Centrality Theory

This study explicitly integrates two complementary theoretical frameworks: Hillier’s (1996) theory of natural movement and Bertaud’s (2004) theory of urban centrality [45,46].
The theory of natural movement posits that the spatial configuration of street networks—particularly their integration and choice—is the primary determinant of pedestrian and vehicular traffic distribution, independent of land-use patterns. This theory provides a causal pathway: highly integrated streets naturally attract pedestrian traffic, thereby becoming ideal locations for commercial and public service facilities. The theory of urban centrality suggests that, compared to monocentric or corridor-style structures, polycentric network structures can reduce average travel distances and dependence on private cars. A well-connected, polycentric urban form supports higher accessibility, shorter travel distances, and lower carbon emissions. Centrality is not merely a geometric attribute but also an economic one—reflecting the clustering of services and employment around highly accessible nodes.
By combining these theories with spatial syntax, this study examines whether empirically derived facility distribution types align with the movement–centrality relationships predicted by the aforementioned theories. This theoretical perspective also provides a basis for low-carbon renewal strategies: enhancing road network integration and promoting polycentricity should reduce motor vehicle travel and carbon emissions.

3. Research Methods and Data Sources

3.1. Study Area and Sample Selection

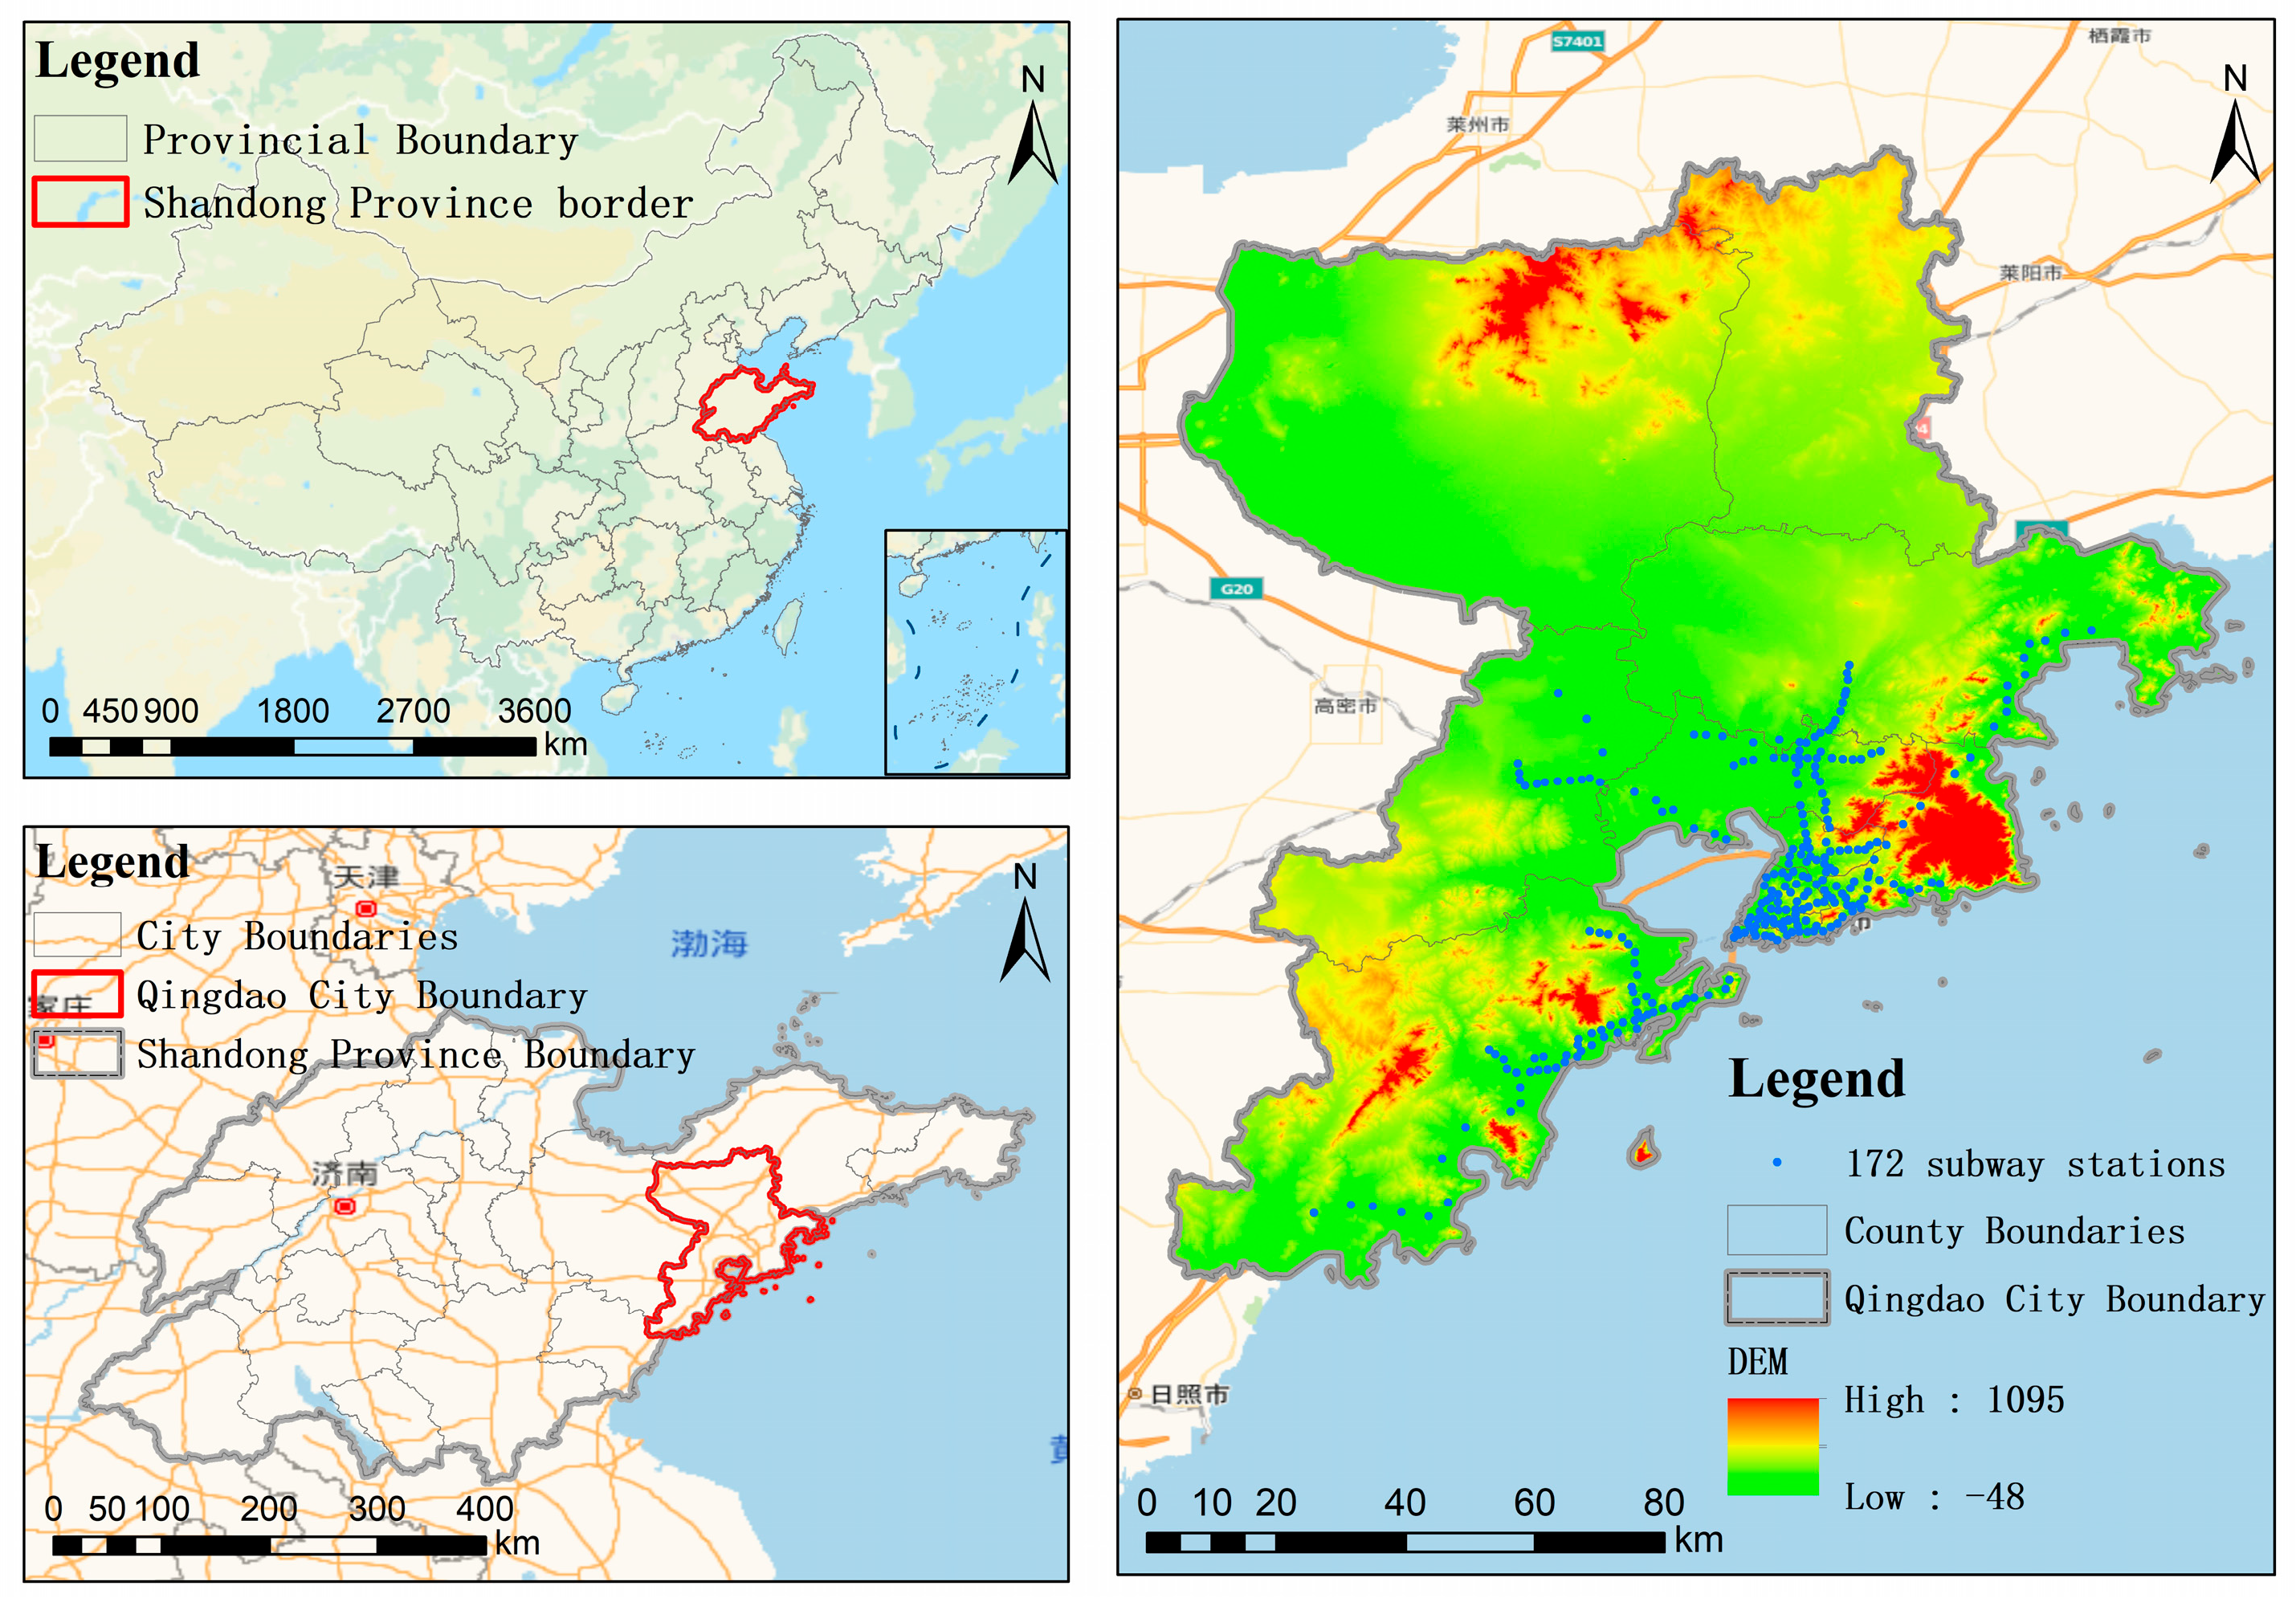
Qingdao was selected as the study area. In 2025, the Qingdao Metro network comprised eight operating lines and 172 stations. Each metro station was treated as one TOD block, while interchange stations were counted only once; therefore, the total number of analytical units was 172. All operating metro stations in Qingdao were included to capture the spatial heterogeneity of the citywide TOD system and to avoid potential bias caused by selecting only typical or well-developed station areas. The inclusion of the full network also enabled comparisons across station areas with different residential distributions, population densities, land-use structures, facility layouts, transit conditions, and road network characteristics, while ensuring the overall availability of POI, building, and road network data. For each station, a 15 min walking service area was generated using the ArcGIS Network Analyst service area tool, with the metro station as the origin and the pedestrian road network as the analytical base. These network-based service areas, rather than fixed-radius circular buffers, were used as the spatial boundaries of the TOD blocks. Figure 2 shows the boundaries of Qingdao, information on its road network, and the exact locations of 172 sites in the city. Station-level information was compiled for all 172 TOD blocks, including service area characteristics, population indicators, the five clustering variables, final K-means membership, squared distance to the assigned cluster center, and bootstrap membership probability. The 172 TOD station areas were used for the citywide spatial classification, K-means clustering, spatial autocorrelation analysis, and spatial regression analysis. The resident travel carbon emission correlation analysis used a separate station area dataset comprising all 41 stations along Qingdao Metro Line 1. Metro Line 1 was selected because its stations form a complete rail corridor within a relatively consistent line-level transport context, thereby reducing inter-line heterogeneity and potential measurement error arising from differences in network position, development stage, surrounding urban functions, and transit service conditions among different metro lines.

3.2. Indicator Framework Establishment

This study selected weekly per capita carbon emissions from all reported daily trips as the core indicator to reflect the carbon footprint characteristics of residents’ high-frequency daily travel. For each respondent, carbon emissions from commuting, shopping, medical care, leisure, and other reported daily trips were aggregated according to travel mode, travel distance, and weekly travel frequency. The final indicator was expressed in kg CO2 per person per week. The mode-specific carbon emission factors were derived from the energy consumption and carbon emission estimates for passenger transport modes in China reported by Knörr and Dünnebeil [47]. Walking and cycling were treated as zero operational emission modes in the carbon emission calculation. In constructing a low-carbon-oriented evaluation system for public service facility layout, a multidimensional measurement framework was established within the 15 min walking service area, encompassing three dimensions: facility density, facility accessibility, and facility completeness.
Facility density reflects spatial agglomeration through the number of facilities per unit area, quantified using kernel density estimation to visually identify high- and low-density zones. Facility accessibility measures convenience in obtaining various services, employing an accumulated opportunity model that integrates facility quantity with spatial barrier effects between facilities and blocks. Because the POI data did not contain consistent information on facility size, floor area, staffing, or actual service capacity, the analysis focused on the spatial distribution and distance-weighted availability of facilities rather than differences in their actual service capacities. Facility completeness evaluates the extent to which the existing facility categories satisfy the categories required by the relevant planning standards. It is calculated as the ratio of the number of facility categories available within a TOD block to the total number of facility categories required by the standards. A higher value indicates a more functionally complete facility system. Facility completeness is expressed as a percentage ranging from 0% to 100%, where 100% indicates that all facility categories required by the relevant planning standards are present within the TOD block. Facility accessibility is a dimensionless weighted-opportunity index with a minimum value of zero and no fixed theoretical upper bound; higher values indicate a greater distance-weighted availability of facilities. These three indicators form a complementary evaluation framework for TOD-block facility configuration, representing facility supply intensity, spatial service accessibility, and functional completeness, respectively (Table 1).

3.3. Research Methods

This study adopted an integrated methodology encompassing spatial characterization, facility layout classification, statistical association analysis, spatial dependence modeling, and computer-based scenario simulation. The technical process followed four successive stages: data integration, feature identification, relationship analysis, and scenario simulation.
During the spatial characterization and typology identification stage, Geographic Information System analysis was conducted using ArcGIS Pro, together with multivariate statistical methods. Building and road network data obtained from open-source mapping platforms and verified through field observations were integrated with the locations of public service facilities extracted from Point of Interest (POI) data. Kernel density estimation was then applied to characterize the spatial agglomeration patterns of public service facilities.
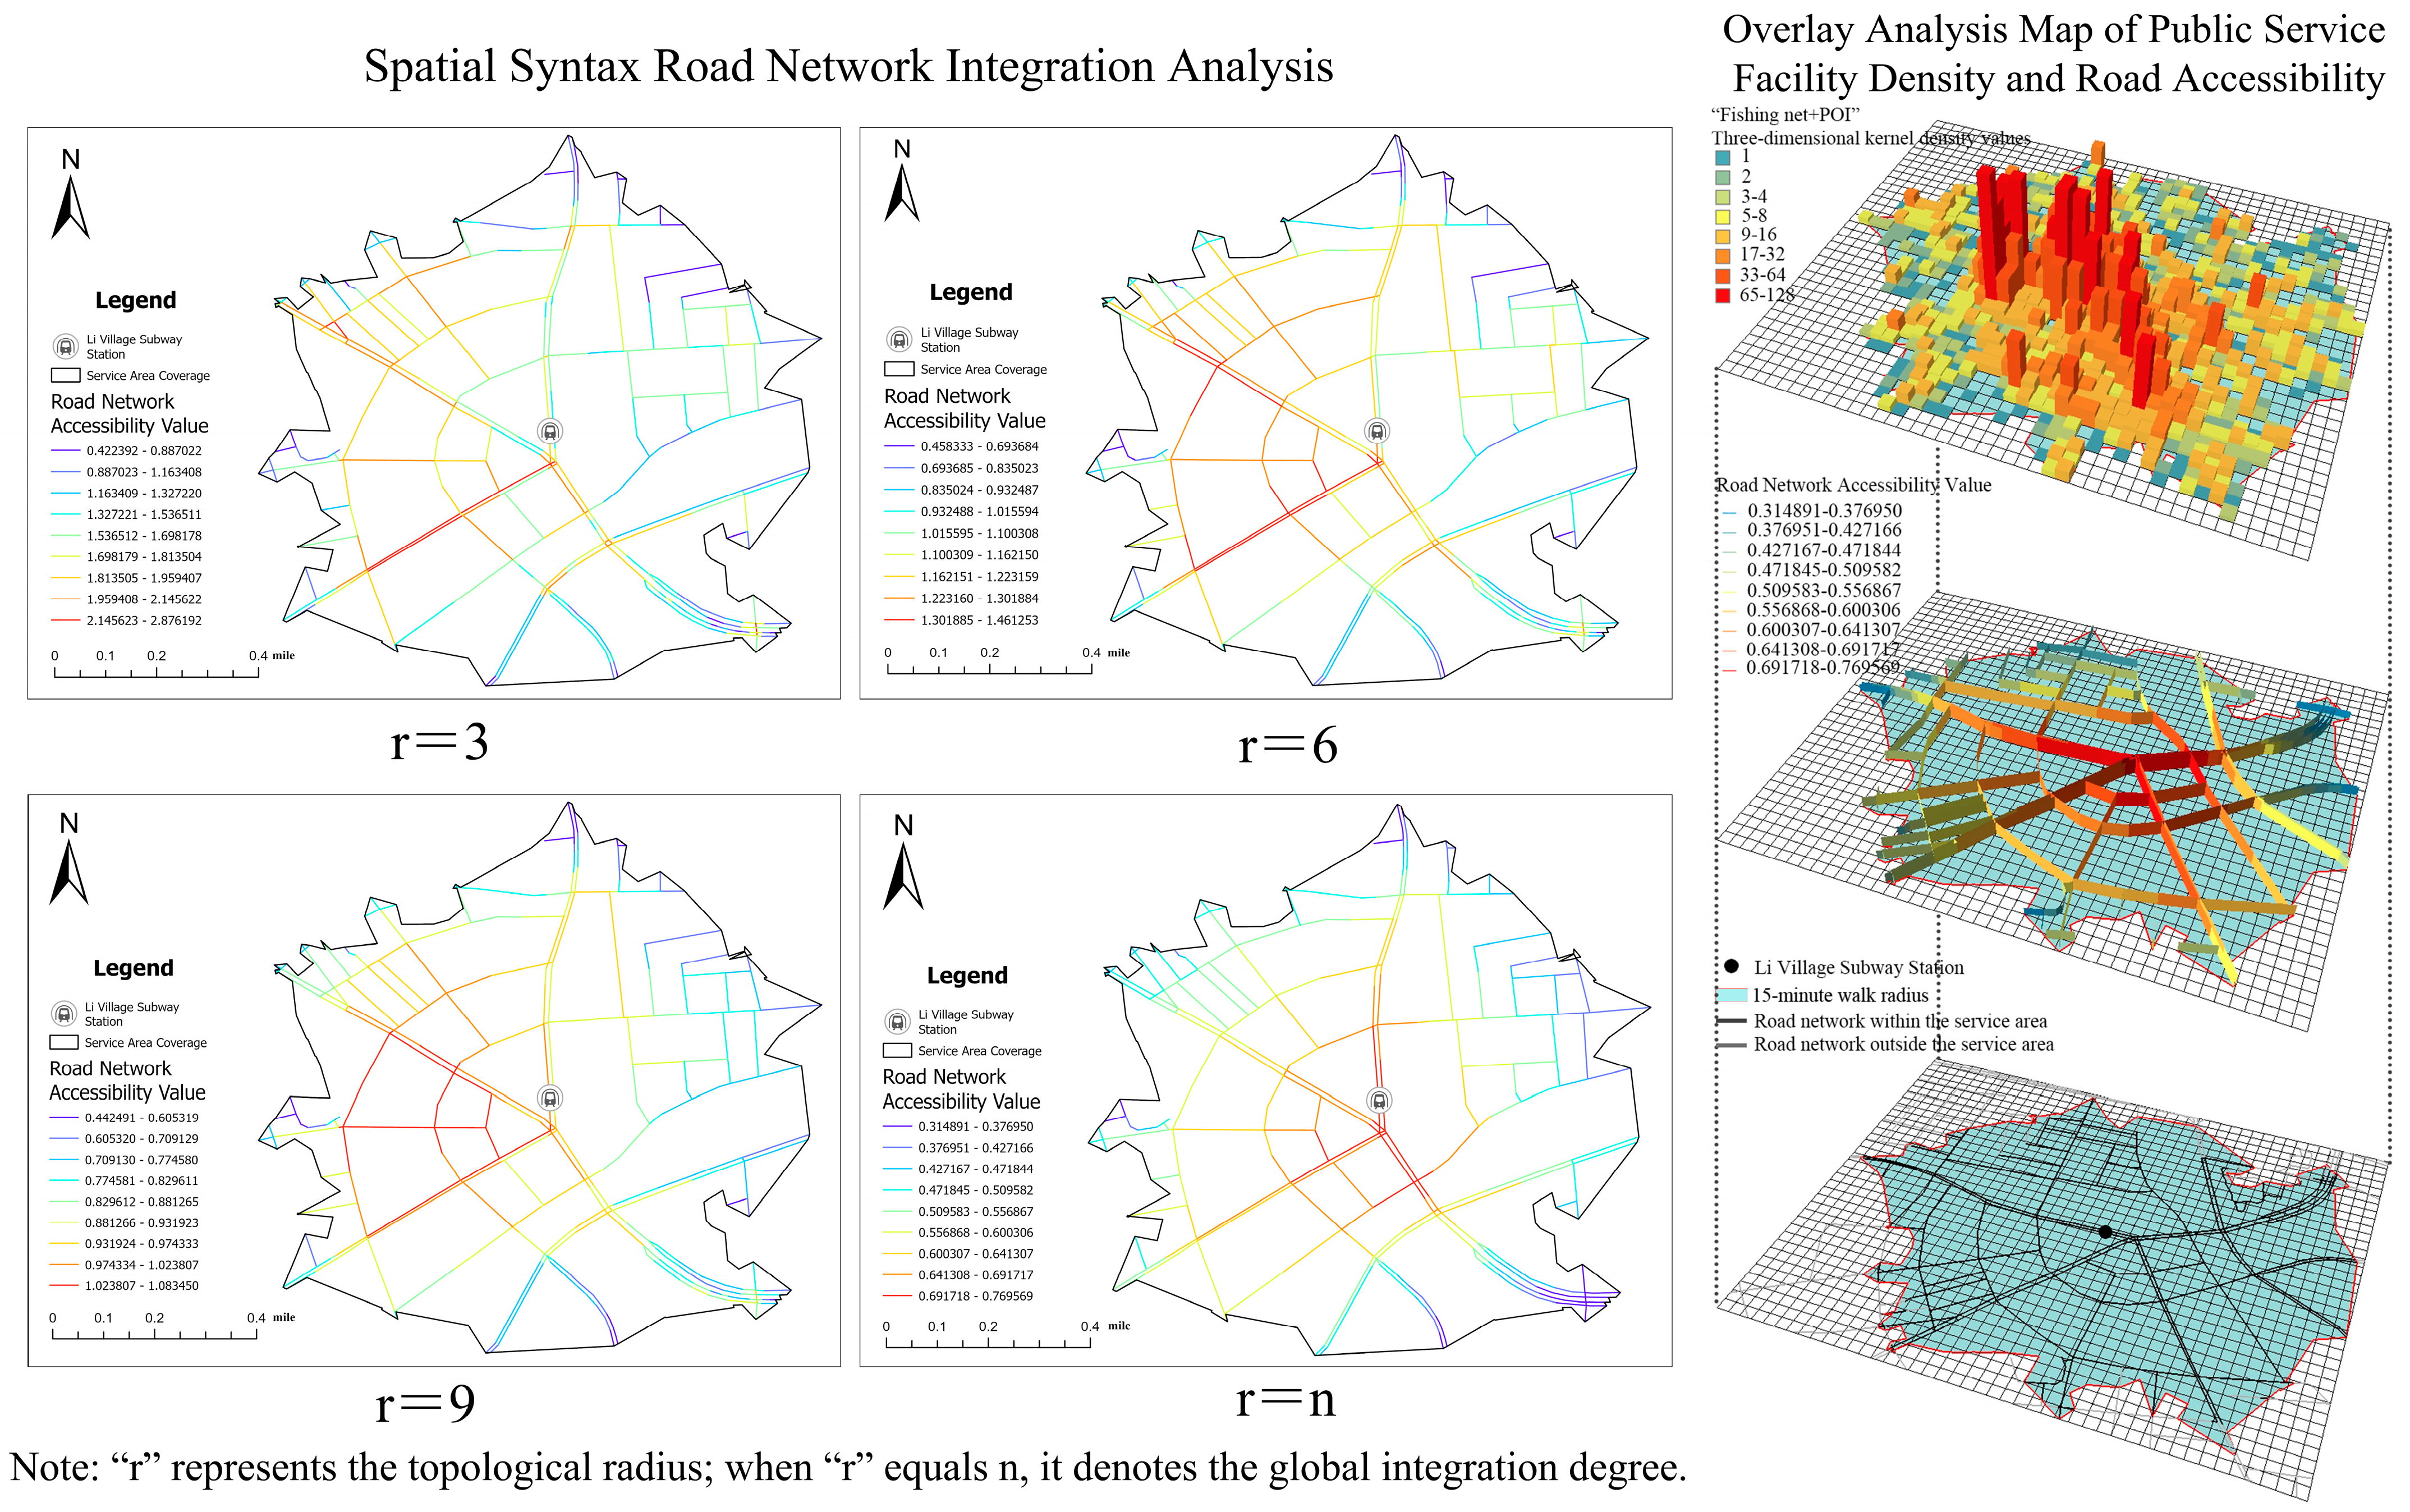
Spatial syntax analysis was conducted using Depthmap + Beta 1.0. The corrected road network was converted into an axial map, and axial analysis was performed using topological distance. Local radii R3, R6, and R9 represented the network areas reachable within three, six, and nine topological steps, respectively, whereas the global radius Rn included all connected axial lines within the analyzed network. Connectivity and control were used to describe the immediate connections and local influence of each axial line. Mean depth and integration were used to evaluate topological depth and network accessibility, while choice/selectivity was used to identify streets with greater potential to accommodate through-movement. These indicators were calculated to compare street network characteristics at different spatial scales and examine their associations with public service facility layouts.
Five variables were included in the K-means clustering analysis: road density, facility density, facility accessibility, facility completeness, and continuous building-interface coverage. Continuous building-interface coverage was defined as the proportion of total street-edge length bordered by continuous building frontages within each TOD block and was expressed as a percentage ranging from 0% to 100%. Before clustering, duplicate records and invalid values were checked against the original POI, road network, and building datasets. Because the five variables had different units and numerical ranges, they were standardized using the z-score method and assigned equal weights.
K-means clustering was implemented using squared Euclidean distance and k-means++ initialization. Each directly estimated K-means solution used 100 random initializations to reduce sensitivity to the selection of initial cluster centers. The maximum number of iterations was set to 500, the convergence tolerance was set to 1 × 10⁻⁴, and the random seed was fixed at 42. Cluster membership was determined using the five standardized variables. The semantic names of the resulting clusters were assigned after clustering by consistently comparing the back-transformed cluster centers and mapped spatial-distribution patterns. These names were used only to interpret the numerical clusters and were not included as inputs to the clustering procedure.
Candidate partitions ranging from k = 2 to k = 6 were evaluated using the within-cluster sum of squares (WCSS), mean silhouette coefficient, Gap statistic, cluster stability, cluster-size structure, parsimony, and substantive interpretability. To maintain direct comparability among the alternative partitions, the k = 3 and k = 2 partitions were obtained by successively merging the pair of clusters that produced the smallest increase in WCSS. The k = 5 and k = 6 partitions were obtained by recursively splitting the cluster that produced the largest reduction in WCSS using two-cluster K-means.
The Gap statistic was estimated using 500 reference datasets generated from uniform distributions within the observed standardized range of each variable. For each reference dataset, 10 k-means++ starts were used. The number of clusters was determined by jointly considering the reduction in WCSS, mean silhouette coefficient, the one-standard-error rule for the Gap statistic, cluster-size structure, cluster stability, parsimony, and substantive interpretability. Under the one-standard-error rule, the smallest value of k satisfying Gap(k) ≥ Gap(k + 1) − SE(k + 1) was retained.
The stability of the three-, four-, and five-cluster partitions was initially compared through 200 repeated resampling evaluations. Each resampled partition was compared with its corresponding reference partition using the adjusted Rand index. For each repetition, the resampled centroids were aligned with the corresponding reference centroids using the Hungarian assignment algorithm. All 172 original TOD blocks were then reassigned to the nearest aligned centroids. Stability was summarized using the mean adjusted Rand index, its standard deviation, and the proportion of repetitions that exactly reproduced the corresponding reference partition.
The stability of the retained four-cluster solution was further assessed using a nonparametric block-level bootstrap. In each of 1000 repetitions, 172 TOD blocks were sampled with replacement from the complete set of analytical units. Duplicate selections were retained, whereas blocks omitted from a particular repetition were treated as out-of-bootstrap observations. A four-cluster K-means model was then refitted using the five standardized variables and the same parameter settings.
Because cluster labels are arbitrary across repetitions, the bootstrap labels were aligned with the retained four-cluster solution using the Hungarian assignment algorithm. A 4 × 4 cost matrix was constructed from the squared Euclidean distances between the bootstrap and reference centroids, and the correspondence that minimized the total centroid distance was retained. Overall partition stability was evaluated using the adjusted Rand index, cluster-specific stability was evaluated using Jaccard similarity, and block-level stability was evaluated using the proportion of bootstrap repetitions in which each block retained its original facility layout type.
During the statistical association stage, Pearson correlation analysis was conducted at the station area level using all 41 stations along Qingdao Metro Line 1. Individual weekly per capita travel carbon emission values were assigned to the corresponding station areas according to respondents’ residential locations and then averaged within each station area. This process produced one mean carbon emission observation for each of the 41 station areas. The station area carbon emission values were subsequently matched with facility layout indicators measured at the same spatial scale.
Fourteen two-sided Pearson correlation tests were conducted. These included facility density and facility accessibility indicators for six facility categories—Commercial and Entertainment, Medical and Health, Education and Research, Culture and Sports, Social Welfare, and Transportation—together with total facility density and total facility accessibility. To control the risk of false-positive findings arising from multiple comparisons, the original p-values were adjusted using the Benjamini–Hochberg false discovery rate procedure. The 95% confidence intervals for Pearson’s correlation coefficients were calculated using Fisher’s z transformation, and statistical significance was assessed using the FDR-adjusted p-values.
A sensitivity-based statistical power analysis was conducted separately for the station area correlation analysis and the individual-level comparison among the four facility layout types. For the Pearson correlation analysis, a sample of 41 station areas provided 80% power to detect a correlation of |r| = 0.418 at a two-sided significance level of 0.05. Under a conservative Bonferroni-adjusted threshold of 0.00357 for 14 tests, the minimum detectable correlation was |r| = 0.537. The station area analysis therefore had adequate statistical sensitivity to identify moderate-to-large associations.
For the individual-level comparison among the four facility layout types, the sample of 240 respondents, comprising 60 respondents in each type, provided 80% power to detect an omnibus effect size of approximately Cohen’s f = 0.215. This corresponded to small-to-moderate overall differences among the four types. A median-centered Levene test was first conducted to assess the homogeneity-of-variance assumption for individual weekly per capita travel carbon emissions. Because the four groups had equal sample sizes and the test did not indicate significant variance heterogeneity, one-way analysis of variance was used as the primary omnibus test. Tukey’s honestly significant difference test was subsequently applied to conduct familywise-adjusted pairwise comparisons. The overall effect size was reported using eta squared, omega squared, and Cohen’s f, while pairwise effect sizes were reported using Hedges’ g. The 95% confidence intervals were calculated for group means and Tukey-adjusted pairwise mean differences. A Kruskal–Wallis test was additionally conducted as a nonparametric robustness check. All tests were two-sided, and statistical significance was assessed at p < 0.05.
To examine network-based spatial dependence among the 172 TOD blocks, a row-standardized first-order metro-network adjacency matrix was constructed. TOD blocks corresponding to consecutive stations on the same metro line were defined as neighbors, while transfer stations connected the relevant line sequences. Global Moran’s I was calculated for facility density, facility accessibility, road density, and population density. Statistical significance was assessed using 9999 two-sided random permutations. Facility density, road density, and population density were standardized before model estimation so that their regression coefficients could be compared on the same scale.
Facility density was subsequently specified as the dependent variable, while road density and population density were included as explanatory variables. An ordinary least-squares model, a spatial lag model, and a spatial error model were estimated and compared. In the spatial error model, spatial dependence in unobserved influences was represented by the spatial error structure u = λWu + ε, where W denotes the row-standardized spatial weights matrix and λ denotes the spatial error coefficient. Model performance was evaluated using the log-likelihood, Akaike information criterion, and Moran’s I of the model residuals or innovations.
During the controlled scenario simulation stage, a Monte Carlo-based agent simulation was used to examine potential changes in travel mode structure and aggregate carbon emissions under alternative facility supplementation scenarios. A low-carbon travel scenario simulation system was developed using Python 3.11.9 (64-bit). The system integrated facility points, road networks, TOD block boundaries, and survey-informed travel behavior parameters within a unified geospatial database. Simulated residential demand points were randomly generated within the service areas, and changes in travel mode probabilities were estimated under different facility layout scenarios.
A “service-gap-filling” algorithm was used to construct generic facility supplementation scenarios. Based on mode-specific carbon emission factors, the modeled travel mode structure and aggregate carbon emissions were calculated and compared before and after facility supplementation. This procedure enabled a standardized comparison of potential travel mode and carbon emission responses under different levels of overall facility supplementation.

3.4. Data Sources

This study used three categories of data: resident travel data, public service facility POIs, and building and road network data. Public service facility locations were identified using Point of Interest (POI) data collected from the AutoNavi Maps API in May 2025. Building footprints and road network data were obtained from OpenStreetMap in June 2025. Before network analysis, the OpenStreetMap road data were imported into AutoCAD 2020 (internal version R24.0.47.0.0) for geometric correction and topological cleaning. Duplicate and overlapping road segments were removed, apparent gaps and invalid intersections were checked, and improperly connected endpoints were corrected with reference to high-resolution remote-sensing imagery and field observations. The corrected road data were subsequently imported into ArcGIS Pro for pedestrian network construction and analysis.
Residents’ daily travel data were collected from June to December 2025 through a stratified quota survey covering all 41 station areas along Qingdao Metro Line 1. The sampling frame consisted of residents living within the corresponding 15 min walking service areas. The 41 station areas were assigned to the four facility layout types according to the final citywide K-means classification. The Metro Line 1 corridor comprised 9 Spatially Balanced station areas, 24 Main-Road-Concentrated station areas, 6 Point-Concentrated station areas, and 2 Scattered-and-Disordered station areas. A balanced stratified quota design was adopted at the facility layout type level. Although the numbers of station areas differed among the four types, equal questionnaire quotas were established to ensure balanced individual-level comparisons. Respondents were recruited from residential communities and public spaces distributed across all 41 station areas.
The questionnaire was administered through both online and offline channels. Online questionnaires were distributed through community resident groups, whereas paper questionnaires were administered through face-to-face surveys. A total of 260 questionnaires were distributed, with 65 allocated to each facility layout type. Of these, 252 were returned, corresponding to an overall response rate of 96.9%. Eight returned questionnaires were excluded because key questions were incomplete. Four additional questionnaires were excluded because respondents lived outside the designated Metro Line 1 station areas, submitted duplicate responses, or provided logically inconsistent travel information.
After screening, 240 valid questionnaires were retained, representing 92.3% of all distributed questionnaires. Exactly 60 valid questionnaires were retained for each facility layout type, producing a balanced individual-level analytical sample. Within each type, the 60 valid questionnaires were distributed among all corresponding Metro Line 1 station areas. All 41 station areas were represented, and each station area contained at least one valid response. Because the quota was established at the facility layout type level rather than at the individual-station level, the number of valid respondents was not required to be equal across individual stations.
The questionnaire recorded departure and arrival times, trip purposes, weekly travel frequency, travel modes, travel distances and durations, frequently visited facility types and locations, residential location, age, occupation, household structure, and evaluations of transportation facilities and service levels.

4. Facility Layout Types and Travel Carbon Emission Relationships

4.1. Identification of Public Service Facility Layout Types in Blocks

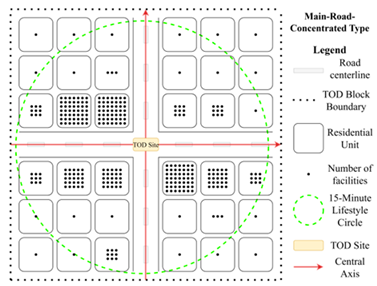
The semantic names of the four clusters were assigned by comparing their back-transformed cluster centers. The Spatially Balanced Type had the highest road density, facility density, accessibility, facility completeness, and continuous building-interface coverage. The Scattered-and-Disordered Type had the lowest facility density, accessibility, facility completeness, and building-interface coverage. The Main-Road-Concentrated Type had the lowest road density and a facility distribution concentrated along a limited number of major corridors. The Point-Concentrated Type had higher road density and accessibility than the Main-Road-Concentrated Type, reflecting facility concentration around several locally accessible nodes.
Based on the retained four-cluster partition, the within-cluster SSE values were 14.0783 for the Spatially Balanced Type, 24.9973 for the Main-Road-Concentrated Type, 21.4948 for the Point-Concentrated Type, and 10.6201 for the Scattered-and-Disordered Type. The total WCSS was 71.1906, and the mean silhouette coefficient was 0.5957.
The WCSS values for the two- to six-cluster partitions were 290.8932, 135.9166, 71.1906, 65.5279, and 60.1557, respectively. The WCSS decreased by 53.3% from two to three clusters and by a further 47.6% from three to four clusters. In contrast, increasing the number of clusters from four to five reduced WCSS by only 8.0%, while increasing it from five to six produced an additional reduction of 8.2%. These results indicate a marked decline in marginal improvement after the four-cluster partition.
The four-cluster partition had a mean silhouette coefficient of 0.5957, which was higher than those of the three-cluster partition (0.5608), the five-cluster partition (0.4880), and the six-cluster partition (0.3519). Although the two-cluster partition had a higher silhouette coefficient of 0.6459, it separated the 30 blocks classified as the Spatially Balanced Type from the remaining 142 blocks and therefore provided an excessively coarse representation of facility layout heterogeneity.
The Gap statistics for the two- to six-cluster partitions were 1.2957, 1.9023, 2.3982, 2.3987, and 2.4070, respectively, with corresponding standard errors of 0.0339, 0.0338, 0.0332, 0.0343, and 0.0349. According to the one-standard-error rule, the four-cluster partition was retained because Gap(4) = 2.3982 was greater than Gap(5) − SE(5) = 2.3644.
The resampling comparison produced mean adjusted Rand indices of 1.0000, 0.9864, and 0.8035 for the three-, four-, and five-cluster partitions, respectively. The corresponding standard deviations were 0.0000, 0.0060, and 0.1193, while the exact recovery rates were 100.0%, 16.0%, and 1.0%, respectively. The three-cluster partition showed the highest resampling stability because it represented a coarser solution that combined the Main-Road-Concentrated Type and the Scattered-and-Disordered Type. The four-cluster partition nevertheless retained high partition-level agreement while preserving these two substantively distinct types, whereas the five-cluster partition showed substantially lower and more variable stability.
Structurally, the three-cluster partition retained the Spatially Balanced Type and the Point-Concentrated Type but combined the 65 blocks classified as the Main-Road-Concentrated Type and the 30 blocks classified as the Scattered-and-Disordered Type into a single 95-block cluster. The five-cluster partition retained the other three facility layout types but divided the 47 blocks classified as the Point-Concentrated Type into subgroups containing 30 and 17 blocks. The six-cluster partition further divided the 65 blocks classified as the Main-Road-Concentrated Type into subgroups containing 42 and 23 blocks.
Considering the substantial WCSS reduction from three to four clusters; the markedly smaller WCSS improvements beyond four clusters; the higher silhouette coefficient of the four-cluster partition relative to the three-, five-, and six-cluster alternatives; the Gap-statistic one-standard-error rule; the high resampling agreement of the four-cluster partition; parsimony; and substantive interpretability, the four-cluster partition was retained. The five- and six-cluster solutions mainly subdivided existing types without producing additional substantively distinct facility layout patterns.
Bootstrap analysis indicated that the retained four-cluster classification exhibited high overall partition stability while identifying two boundary observations. Across the 1000 bootstrap repetitions, the mean adjusted Rand index was 0.9869, with a standard deviation of 0.0062, a minimum value of 0.9681, and a 95% percentile interval of 0.9839–1.0000. The mean Jaccard similarities were 1.0000 for the Spatially Balanced Type, 0.9875 for the Main-Road-Concentrated Type, 1.0000 for the Point-Concentrated Type, and 0.9731 for the Scattered-and-Disordered Type. The corresponding mean block-level membership probabilities were 1.0000, 0.9946, 1.0000, and 0.9845, respectively. Two of the 172 blocks had membership probabilities below 0.90, and no block had a membership probability of zero. Thus, only two TOD blocks showed relatively uncertain cluster membership, whereas the classifications of the remaining 170 blocks were stable.
The 172 station areas cover the old urban core, mature mixed-use districts, suburban new towns, peripheral development areas, and major transport and public service nodes. They therefore represent substantial differences in development stage, population density, land-use composition, transit service conditions, facility provision, and road network structure. Including the entire operating metro network improves the representativeness of the spatial classification and reduces the potential bias associated with selecting only a limited number of typical or highly developed station areas. Specifically, the Spatially Balanced Type performs best across all indicators, followed by the Point-Concentrated Type with moderate values, while the Main-Road-Concentrated Type shows relatively lower values, and the Scattered-and-Disordered Type ranks lowest or nearly lowest in most aspects. These differences are not accidental but reflect systematic deviations in facility configuration under varying development orientations. The Spatially Balanced Type typically benefits from comprehensive public facility planning, with high synergy between road connectivity and facility distribution, enabling residents to accomplish multiple daily purposes within short travel distances. The Point-Concentrated Type relies on local nodes for facility agglomeration yet lacks effective connections between nodes, leading to insufficient service coverage in certain areas. The Main-Road-Concentrated Type over-relies on major-road corridors, which facilitates fast motorized access but neglects pedestrian and slow-traffic connectivity, thereby increasing detour distances. In contrast, the Scattered-and-Disordered Type suffers from a lack of planning guidance, with random facility distribution and numerous service blind spots; residents often need to cross multiple blocks to access services, significantly increasing travel distances and dependence on motorized modes. The quantitative differences among the four facility layout types are summarized in Table 2.
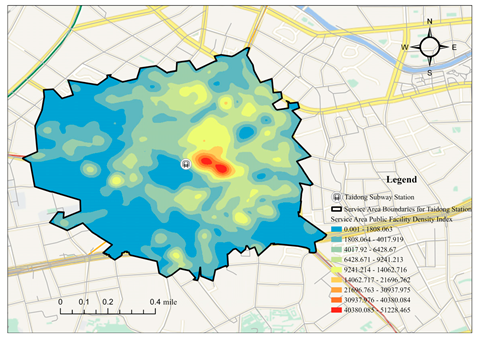
Representative station area examples were selected to further illustrate the spatial characteristics of the four facility layout types. Table 3 compares their graphical representations and facility density patterns, providing a more intuitive basis for interpreting the spatial differences identified by the clustering analysis.
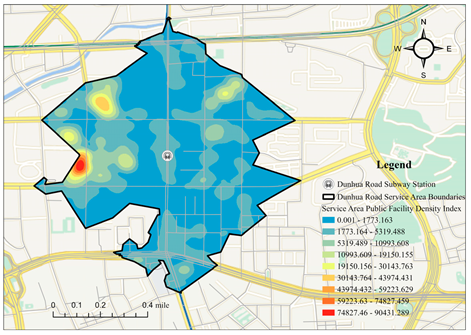
Taking Li Village Station as an example, kernel density analysis showed that public service facilities were distributed relatively evenly within the service area, with facility density generally decreasing from the central area toward the periphery. Rather than forming a single isolated high-density core or concentrating exclusively along one major road, the facilities exhibited a relatively continuous spatial distribution across the surrounding residential and commercial areas. This pattern helps maintain service coverage in different parts of the station area and reduces the occurrence of large service gaps between facility nodes.
Figure 3 presents the spatial syntax analysis of road network accessibility in the Li Village station area. Xiazhuang Road, where Li Village Metro Station is located, had a relatively high accessibility value of 0.75 and functioned as an important structural axis connecting the metro station with surrounding streets and facility nodes. Road network accessibility generally decreased from the central area toward the periphery, showing a spatial pattern broadly consistent with the distribution of facility density. Streets with relatively high accessibility were also associated with more concentrated public service facilities, while areas with lower accessibility generally contained fewer facilities.
The correspondence between facility distribution and road network accessibility suggests that the Spatially Balanced Type is supported not only by a relatively sufficient facility supply but also by a street network capable of connecting different service nodes. A comparatively continuous road network and distributed facility system may allow residents to access multiple daily services through shorter and more direct routes, reduce unnecessary detours, and improve the continuity of walking and cycling connections. At the same time, the distribution of facilities across multiple accessible locations can reduce excessive dependence on a single service center and improve the spatial resilience of the local service system. Therefore, the Li Village case illustrates how the coordination of road network accessibility and facility distribution may provide favorable spatial conditions for improving daily service accessibility and supporting lower-carbon travel within a TOD block.
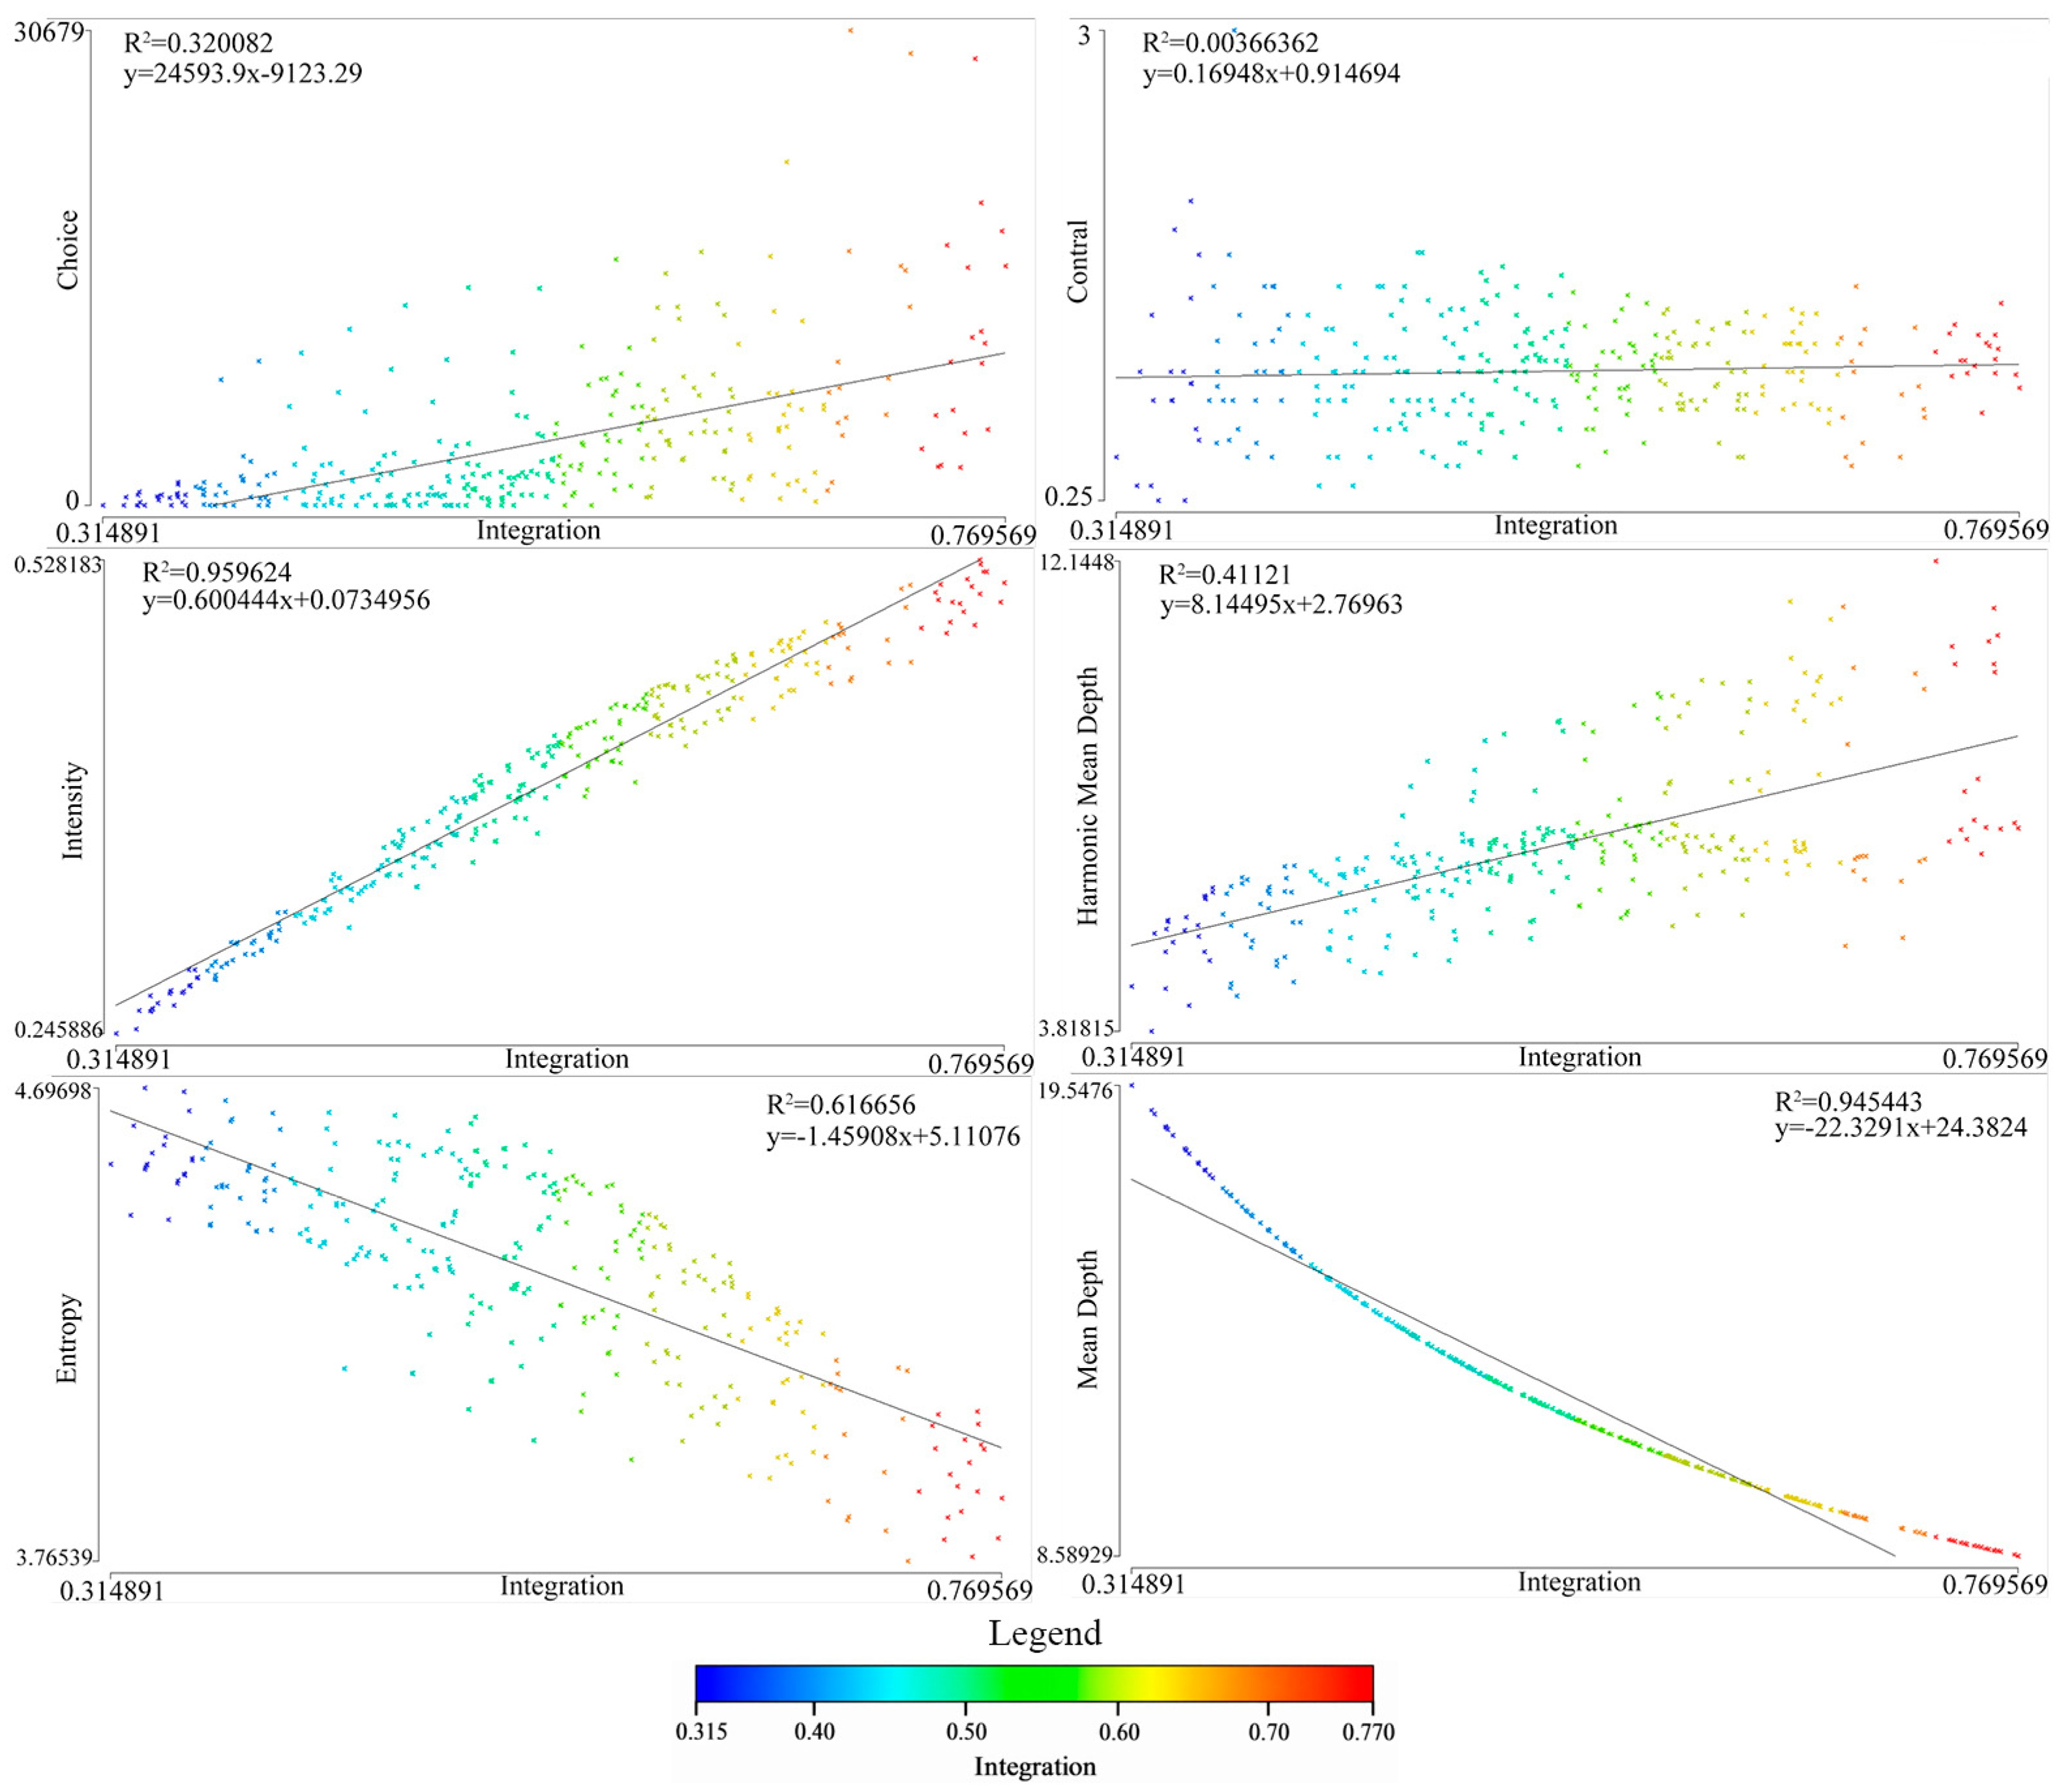
The correlation analysis examined the relationships between global integration and facility agglomeration intensity, mean depth, connectivity, information entropy, choice/selectivity, and control. As shown in Figure 4, global integration was strongly positively associated with facility agglomeration intensity and connectivity and strongly negatively associated with mean depth. Integration also showed a moderately negative association with information entropy, a weak-to-moderate association with choice/selectivity, and a nonlinear relationship with control.
These results indicate that TOD blocks with higher global road network accessibility and more direct street connections tend to exhibit stronger facility agglomeration and a clearer spatial hierarchy. The relationships with choice/selectivity and control further reflect differences in through-movement potential and local street network organization among TOD blocks. Overall, the results highlight the importance of coordinating global road network accessibility, local street connectivity, and movement organization when optimizing public service facility layouts.
Furthermore, the spatial syntax results indicate that road networks with higher integration tend to be associated with a higher density of public service facilities. Compared with more monocentric structures, polycentric road network layouts may also be associated with shorter travel distances and lower travel-related carbon emissions. These observed relationships are consistent with the emphasis of Natural Movement Theory on the connection between road network configuration and pedestrian flow distribution, as well as with Urban Centrality Theory’s interpretation of how polycentric spatial structures may support accessibility and shorter travel distances.
The spatial syntax analysis further reveals structural differences among different road network layouts and shows that road network configuration is associated with facility distribution and travel conditions. Highly integrated and polycentric road networks tend to be associated with more concentrated and better-connected facility patterns and may provide spatial conditions that support walking and cycling. In this sense, space is not merely a passive physical environment; differences in road network accessibility, facility proximity, and travel distance are closely related to residents’ travel preferences, which is consistent with the analytical perspective of the behavior–space–environment framework.
Although the preceding analysis described relationships among road network and facility layout characteristics, it did not account for network-based spatial dependence among neighboring TOD blocks. Global Moran’s I indicated significant positive spatial autocorrelation in facility density (I = 0.2589, p = 0.0007), road density (I = 0.1484, p = 0.0385), and population density (I = 0.7121, p = 0.0001). These results indicate that TOD blocks connected through the metro network tend to exhibit spatial clustering in facility provision, road network development, and population concentration.
An ordinary least-squares model was subsequently estimated with standardized facility density as the dependent variable and standardized road density and population density as explanatory variables. The OLS model produced an R2 of 0.6242 and an AIC value of 325.7674. Road density and population density had positive standardized coefficients of 0.7136 and 0.3251, respectively (both p < 0.001). However, the OLS residuals retained significant positive spatial autocorrelation (I = 0.2571, p = 0.0005), indicating that the non-spatial model did not fully represent the network dependence in facility density.
Spatial lag and spatial error models were therefore estimated and compared. The spatial lag coefficient was positive and statistically significant (ρ = 0.1234, p = 0.0258), and the spatial lag model had an AIC value of 322.9089. The spatial error coefficient was also positive and statistically significant (λ = 0.2740, p = 0.0002). The spatial error model produced the lowest AIC value of 315.1371, compared with 325.7674 for the OLS model and 322.9089 for the spatial lag model.
In the spatial error model, road density and population density remained positively associated with facility density, with standardized coefficients of 0.7396 and 0.2864, respectively (both p < 0.001). After the spatial error structure was incorporated, the innovation-residual Moran’s I decreased to −0.0001 and was no longer statistically significant (p = 0.9375). The lower AIC and the absence of remaining innovation-residual spatial autocorrelation indicate that the spatial error model provided the best fit. The results suggest that both road network intensity and population concentration were positively associated with facility density, with road density showing the larger standardized coefficient in the current model.

4.2. Analysis of Residential Travel Carbon Emissions Across Different Facility Layout Types

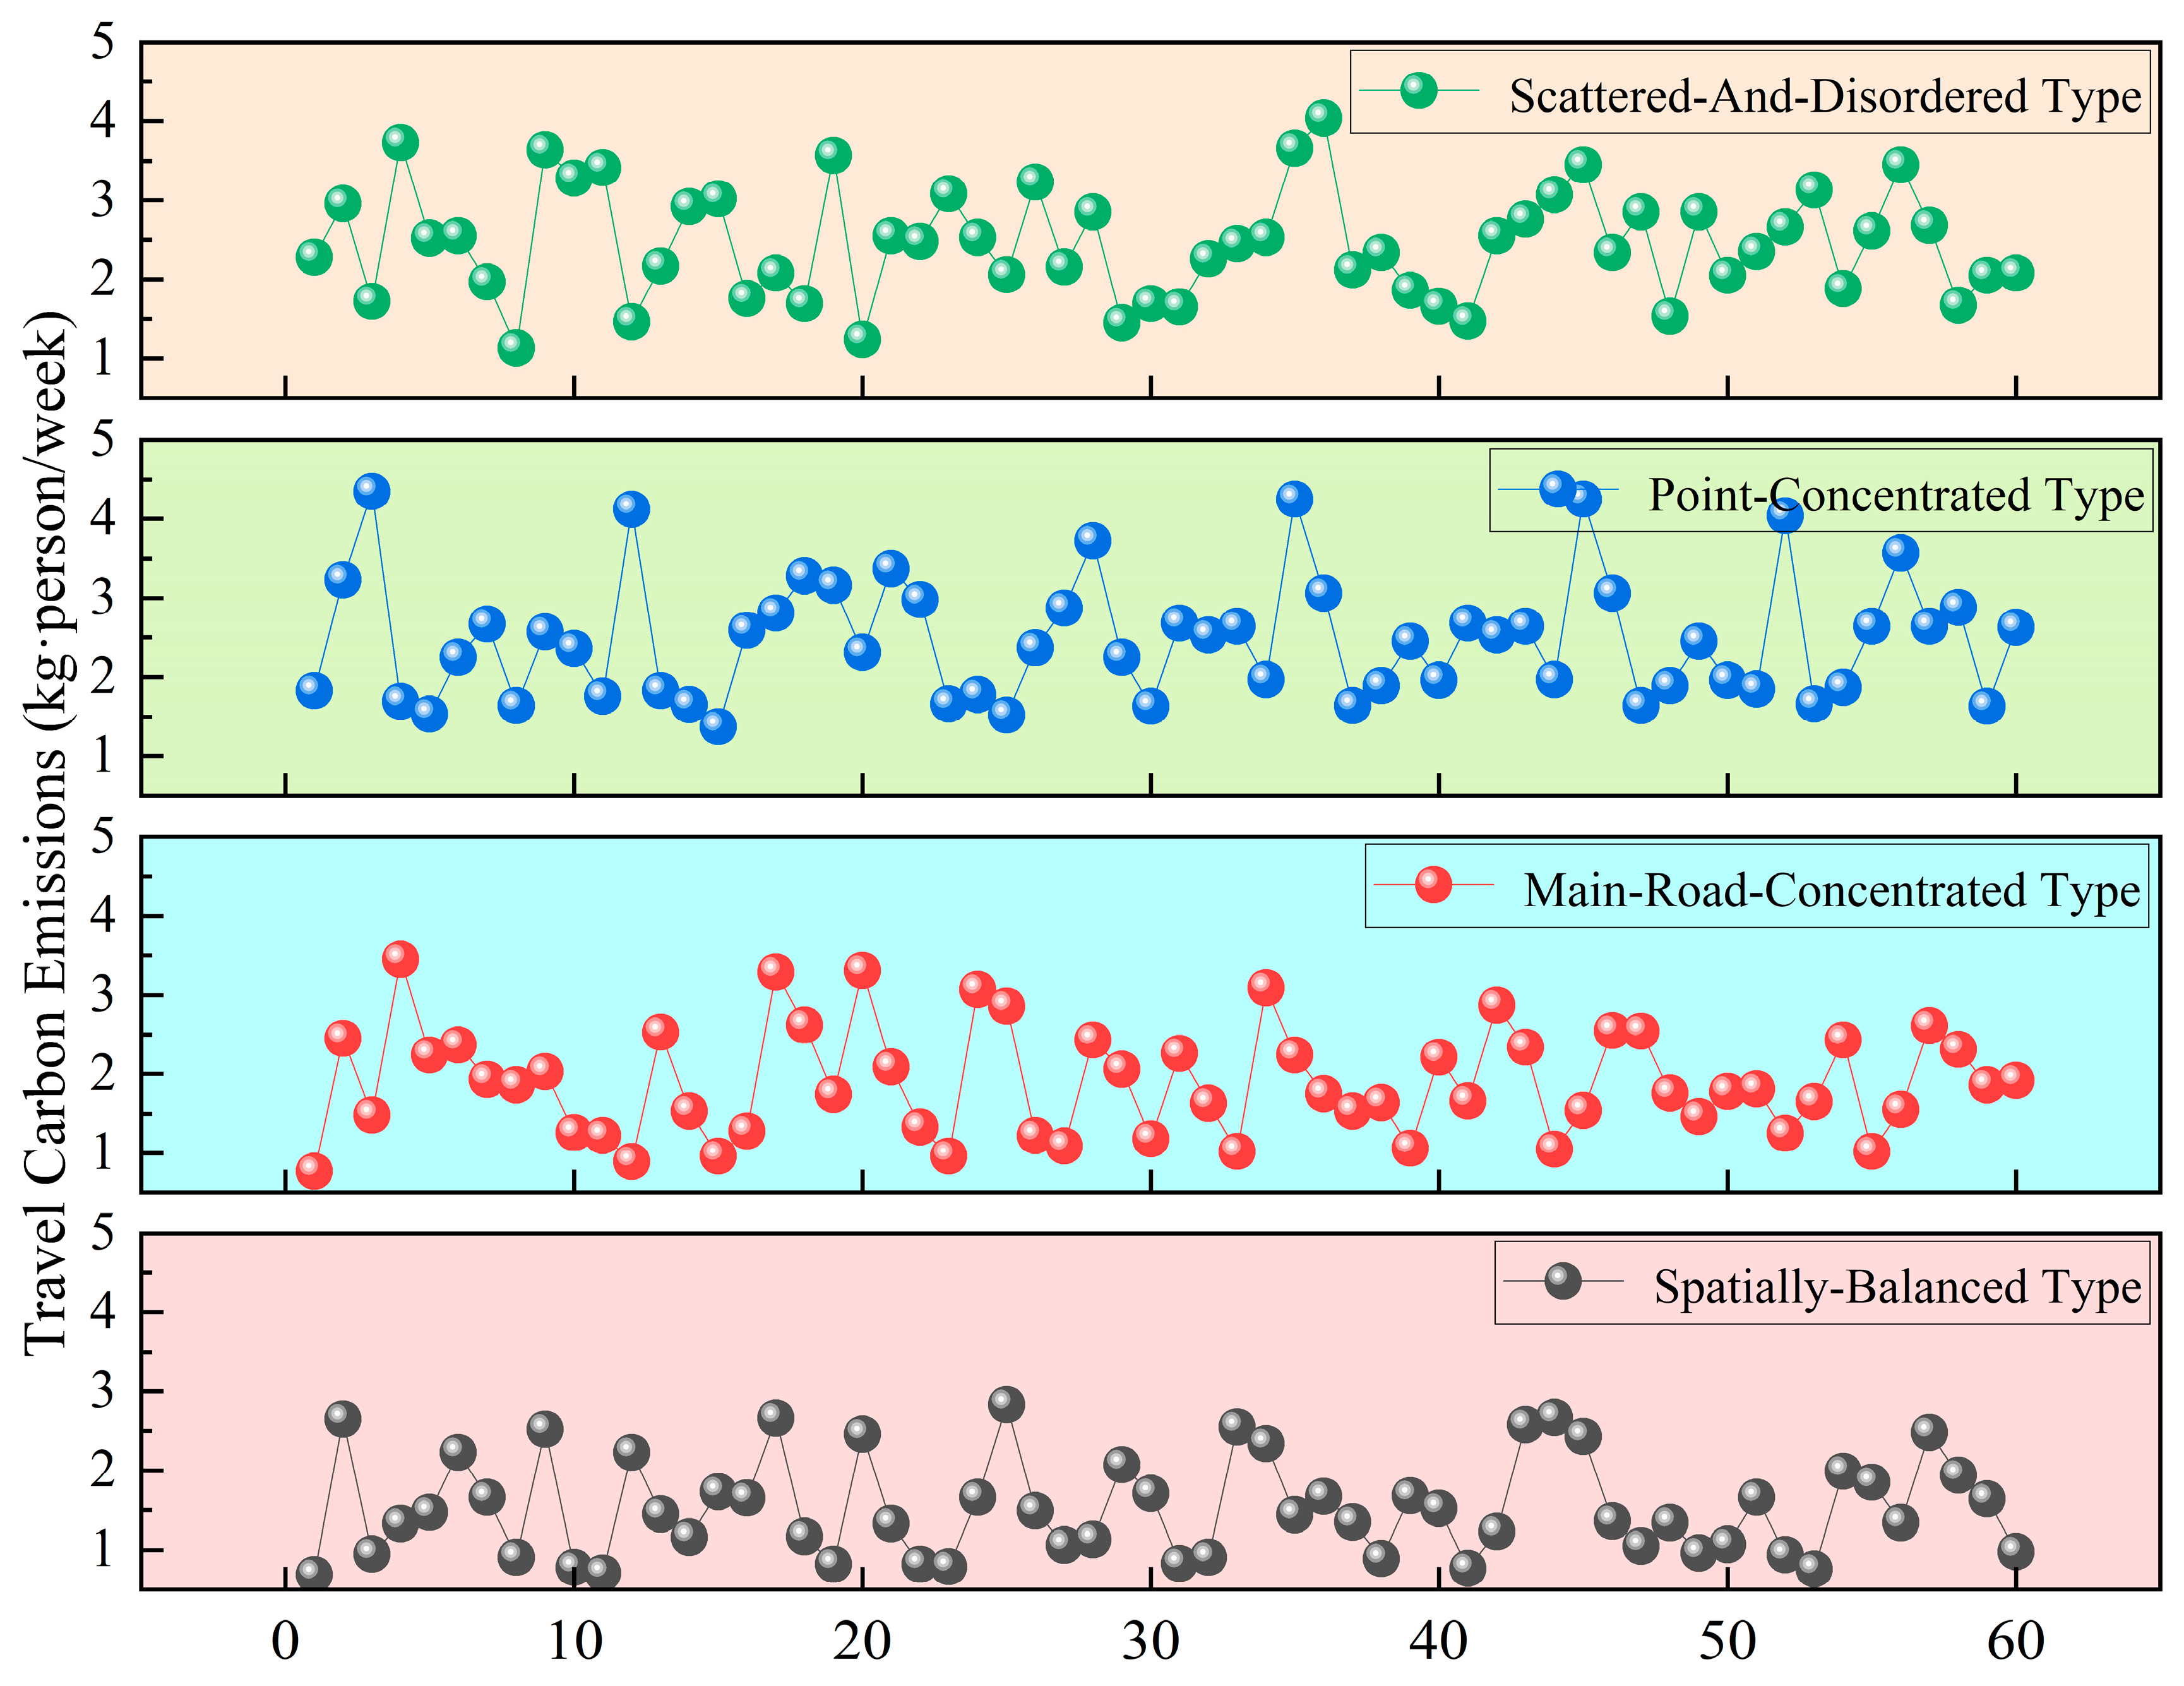
As shown in Figure 5, the 240 individual observations exhibited clear differences in weekly per capita travel carbon emissions among the four facility layout types. The overall mean was 2.096 kg CO2/(person·week), with a standard deviation of 0.797 and a range of 0.69–4.35. The Spatially Balanced Type had the lowest mean emission level, at 1.539 kg CO2/(person·week) (SD = 0.623, 95% CI [1.378, 1.700]), followed by the Main-Road-Concentrated Type, at 1.898 kg CO2/(person·week) (SD = 0.678, 95% CI [1.723, 2.073]). The Point-Concentrated Type and the Scattered-and-Disordered Type showed higher and relatively similar mean emissions, at 2.491 kg CO2/(person·week) (SD = 0.773, 95% CI [2.291, 2.691]) and 2.454 kg CO2/(person·week) (SD = 0.693, 95% CI [2.275, 2.633]), respectively.
The median-centered Levene test did not indicate significant variance heterogeneity, F(3236) = 0.713, p = 0.545. The individual-level comparison was based on a balanced analytical sample comprising 60 respondents in each facility layout type and 240 respondents in total. The one-way analysis of variance showed a statistically significant difference in mean weekly travel carbon emissions among the four facility layout types, F(3236) = 26.313, p < 0.001. The overall effect was large, with η2 = 0.251, ω2 = 0.240, and Cohen’s f = 0.578. Thus, approximately 25.1% of the total variation in individual weekly travel carbon emissions was associated with differences among the four facility layout types in the balanced analytical sample. The Kruskal–Wallis robustness test produced the same overall conclusion, H(3) = 60.636, p < 0.001.
Tukey-adjusted post hoc comparisons showed that the Spatially Balanced Type had significantly lower mean emissions than the Main-Road-Concentrated Type (mean difference = −0.359 kg CO2/(person·week), 95% CI [−0.687, −0.031], adjusted p = 0.0255, Hedges’ g = −0.548), the Point-Concentrated Type (mean difference = −0.952, 95% CI [−1.280, −0.624], adjusted p < 0.001, Hedges’ g = −1.348), and the Scattered-and-Disordered Type (mean difference = −0.915, 95% CI [−1.243, −0.587], adjusted p < 0.001, Hedges’ g = −1.379). The Main-Road-Concentrated Type also had significantly lower mean emissions than the Point-Concentrated Type (mean difference = −0.593, 95% CI [−0.921, −0.265], adjusted p < 0.001, Hedges’ g = −0.810) and the Scattered-and-Disordered Type (mean difference = −0.556, 95% CI [−0.884, −0.228], adjusted p < 0.001, Hedges’ g = −0.805). The difference between the Point-Concentrated Type and the Scattered-and-Disordered Type was not statistically significant (mean difference = 0.037, 95% CI [−0.291, 0.365], adjusted p = 0.9912, Hedges’ g = 0.050).
Taken together, the inferential results support a clear differentiation among the four facility layout types. The Spatially Balanced Type had the lowest travel carbon emissions, followed by the Main-Road-Concentrated Type, whereas the Point-Concentrated Type and the Scattered-and-Disordered Type had similarly high emission levels. These findings demonstrate statistically significant group-level differences but should not be interpreted as independent causal effects of facility layout.

4.3. Associations Between Facility Layout and Travel Carbon Emissions

4.3.1. Correlation Between Travel Carbon Emissions and Overall Facility Layout

Research indicates that when public service facilities adopt a balanced and distributed layout, it effectively shortens residents’ daily travel distances, reduces reliance on private cars, and consequently lowers transportation carbon emissions. Conversely, when facilities are excessively concentrated (e.g., in a mono-centric structure or linearly aggregated along arterial roads), residents are often forced into long-distance commutes, increasing the frequency of motor vehicle use and energy consumption. While a scattered and disordered facility layout might shorten travel distances for some residents, the lack of systematic planning often leads to detours and redundant trips, which is similarly detrimental to carbon reduction.
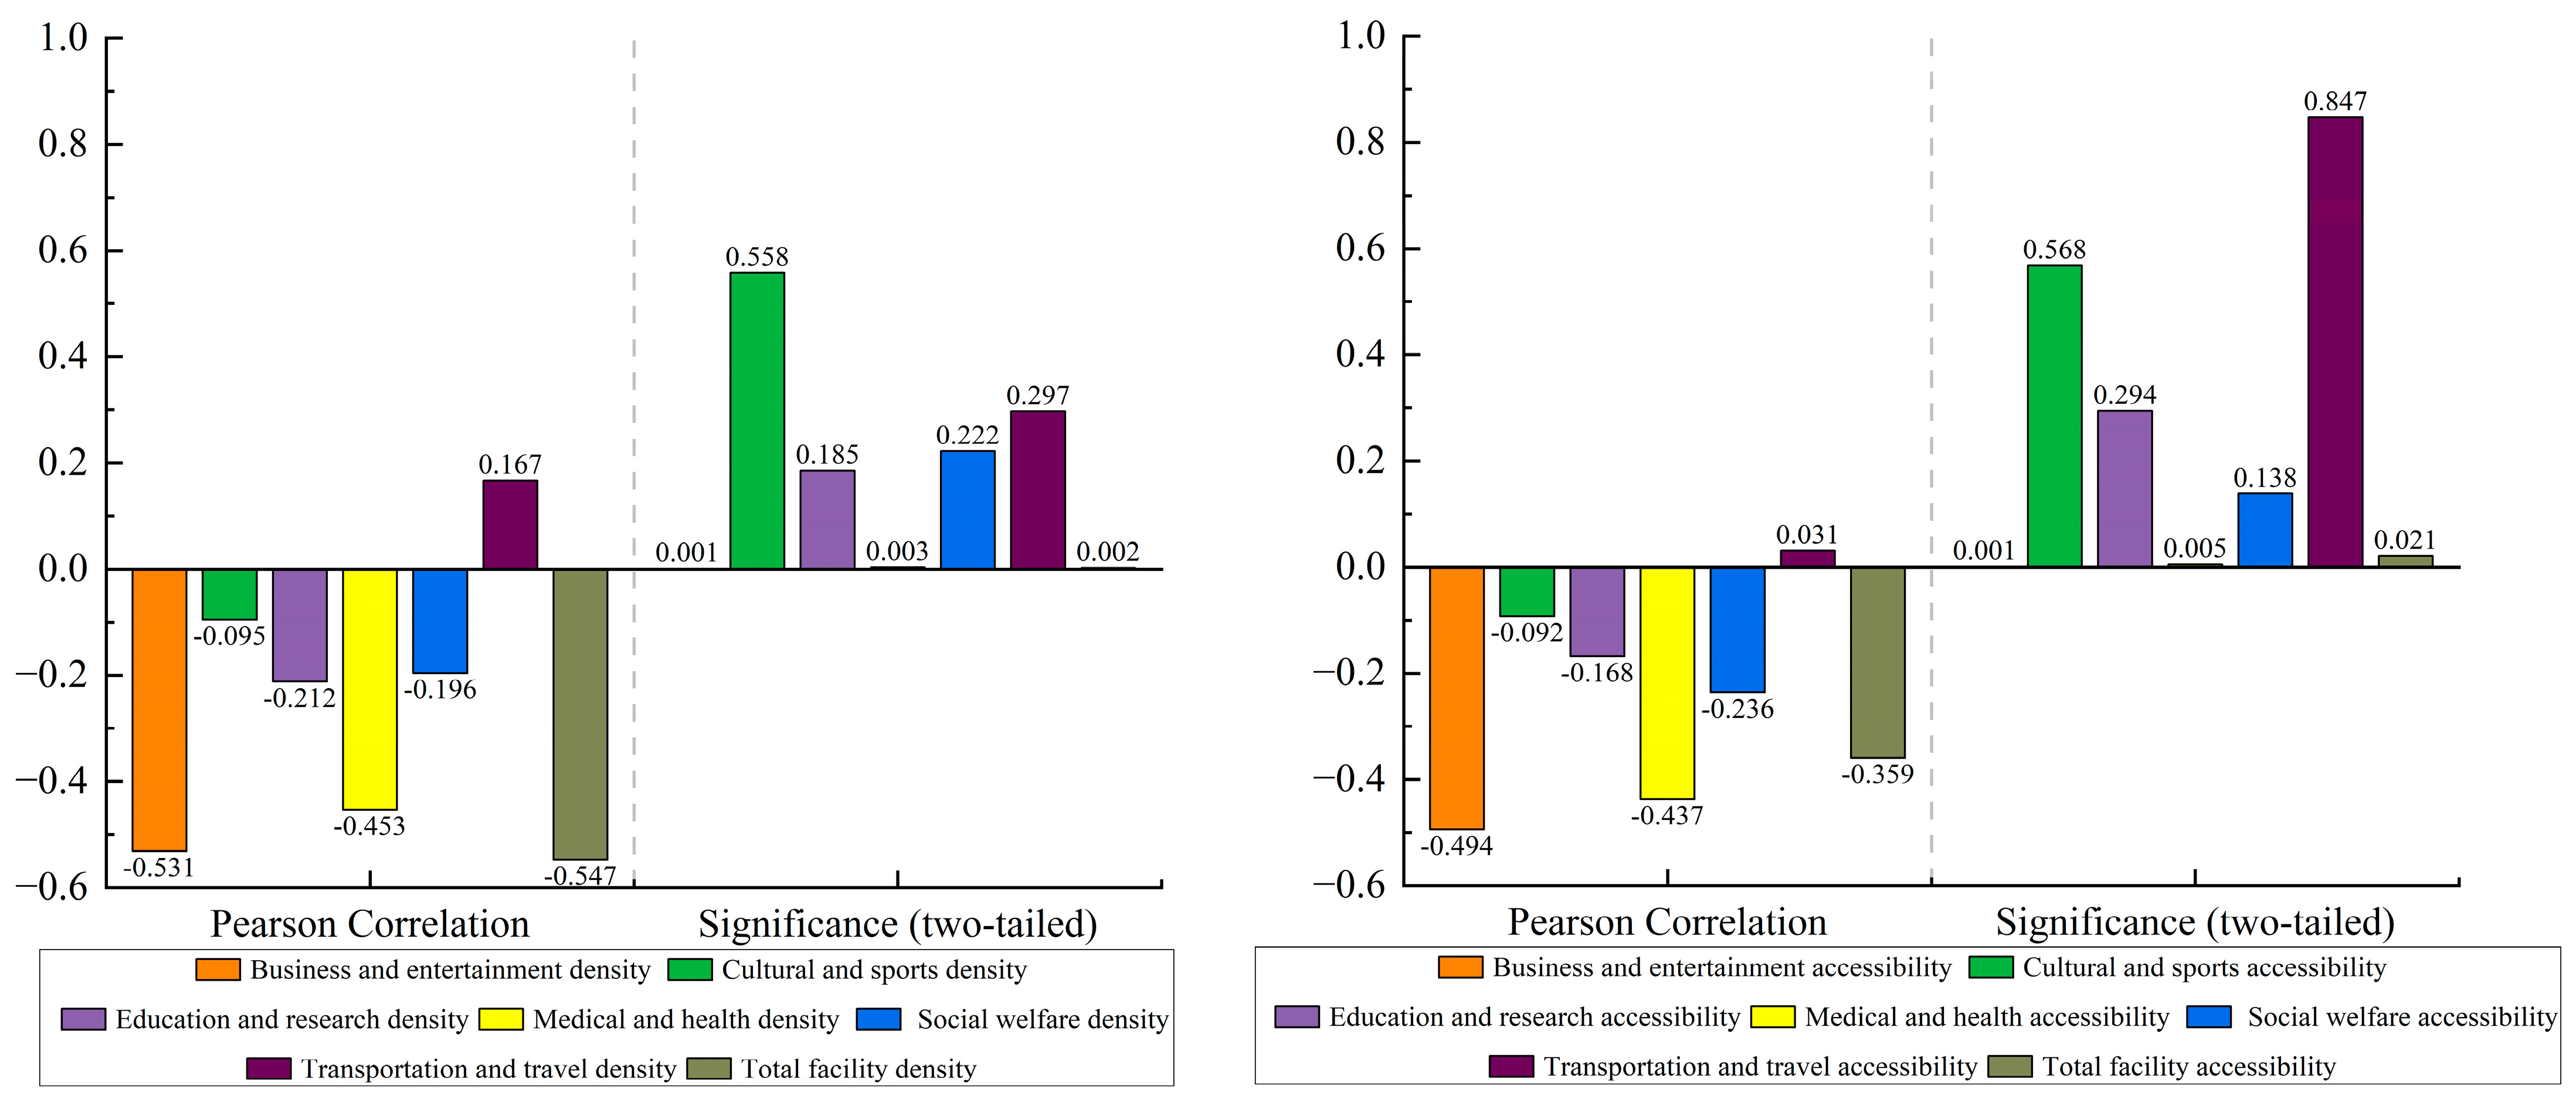
Figure 6 presents the results of the correlation analysis between facility density, accessibility, and travel carbon emissions, utilizing Pearson correlation tests to explore their relationship. The data reveal that Commercial and Entertainment density and accessibility, Medical and Health density and accessibility, total facility density and accessibility exhibit significant negative correlations with travel carbon emissions. These negative correlations indicate that station areas with higher densities of Commercial and Entertainment facilities, Medical and Health facilities, and total facilities tended to have lower mean travel carbon emissions. However, the cross-sectional bivariate analysis does not establish that increasing facility density would independently cause a reduction in carbon emissions. The observed associations may also reflect differences in resident socioeconomic characteristics, public transport service, walkability, population density, land-use structure, parking conditions, and proximity to the urban center. Accordingly, the correlation results are interpreted as planning-relevant associations and as evidence for identifying potential renewal priorities, rather than as estimates of causal intervention effects. In contrast, the correlations for Culture and Sports density, Education and Research density, Social Welfare density, and Transportation density with travel carbon emissions did not reach statistical significance.
After the Benjamini–Hochberg FDR correction, six associations remained statistically significant: Commercial and Entertainment facility density, Medical and Health facility density, total facility density, Commercial and Entertainment facility accessibility, Medical and Health facility accessibility, and total facility accessibility. The remaining eight associations were not statistically significant after correction. As shown in Table 4, the density and accessibility of these high-frequency public service facilities were negatively correlated with station area travel carbon emissions. This finding indicates that improving the provision and spatial accessibility of high-frequency public service facilities is an important consideration for promoting low-carbon travel in TOD blocks.

4.3.2. Correlation Between Travel Carbon Emissions and the Layout of Individual Facility Types

The associations between travel carbon emissions and the density and accessibility of different facility categories varied across facility types. Commercial and Entertainment facilities, Medical and Health facilities, and the total-facility indicators were negatively correlated with station area travel carbon emissions, whereas the associations for Culture and Sports, Education and Research, Social Welfare, and Transportation facilities were not statistically significant after FDR correction. These results identify facility indicators with clear planning relevance to lower travel carbon emissions and highlight the importance of prioritizing the provision and accessibility of high-frequency daily service facilities in low-carbon TOD renewal.
Commercial and Entertainment facilities show a significant negative correlation with travel carbon emissions. As core destinations for residents’ high-frequency daily trips, a higher local density of these facilities may be associated with shorter shopping and leisure travel distances. When these facilities are evenly distributed with high density within the 15 min walking circle, residents are more inclined to choose non-motorized transport like walking or cycling, reducing motor vehicle use frequency and thus lowering carbon emissions.
Medical and Health facilities also demonstrate a significant negative correlation with travel carbon emissions. The accessibility of these facilities directly influences residents’ healthcare travel behavior, particularly for groups like the elderly and individuals with chronic conditions. When medical facilities are evenly distributed within the block at appropriate distances, residents can access healthcare via short walks or community shuttle services, reducing reliance on motor vehicles for long-distance medical trips.
In contrast, the correlation for Education and Research facilities did not reach statistical significance. This is primarily because the service scope of educational facilities is relatively fixed, and the travel habits for picking up/dropping off children (especially younger students) exhibit a strong reliance on private vehicles. Even with increased density of educational facilities within a block, the “private car pickup” model is difficult to change in the short term. Research has shown that students’ commuting distances are influenced not only by the spatial distribution of schools but also, to a significant extent, by the socio-spatial context of their residential areas and variations in school quality. When parents actively choose schools outside their catchment areas, improvements in the spatial accessibility of educational facilities do not necessarily translate directly into shorter commuting distances or reduced carbon emissions. Furthermore, research facilities like universities often serve populations commuting across wider regions, whose travel distances are not influenced by the facility density within a specific block, leading to an overall weak correlation.
Similarly, the correlation for Culture and Sports facilities was not significant. The usage frequency of cultural and sports facilities is relatively low, and residents’ sensitivity to their quality often outweighs sensitivity to distance, making them willing to travel longer distances for high-quality resources. Consequently, the density of these facilities within a block has a limited impact on overall carbon emissions.
The correlation for Social Welfare facilities also did not reach significance. The target user base for social welfare facilities is relatively narrow, and some facilities suffer from a “mismatch between supply and demand,” meaning that increases in density may not effectively serve the intended population groups, thus showing no significant impact on overall travel carbon emissions.
Finally, the correlation for Transportation facilities was not significant. Although TOD blocks inherently possess a relatively well-developed public transport system, the environmental benefits exhibit a trend of marginal diminishment with continuous increases in facility density. Additionally, some blocks face “last-mile” connectivity issues, leading residents to choose private cars even when transport facilities are within close proximity, thereby weakening the observable correlation.

5. Low-Carbon Renewal Optimization Model and Simulation Results

5.1. Differentiated Low-Carbon Renewal Strategies for Four Facility Layout Types

For the Spatially Balanced Type, the node-embedding strategy is adopted. This type had the highest facility density center (613.26 units/km2), facility accessibility center (1842.71), facility completeness center (63.35%), and continuous building-interface coverage (64.78%) among the four types, while its weekly per capita carbon emissions were the lowest, at 1.539 kg CO2/(person·week). Although its facility completeness was the highest among the four types, the value of 63.35% indicates that some required facility categories remained absent. Thus, node-embedding supplements missing community-level micro-facilities. Micro-facilities such as daytime care centers for the elderly, child-minding points, and community canteens should be embedded within coverage gaps of the 15 min walking circle, further shortening travel distances for high-frequency daily services, and concurrently, optimize pedestrian and bicycle network continuity by adding footbridges and underpasses to eliminate barriers like dead-end roads and wall blockages. Promoting functional mixing (e.g., integrating community services into commercial facilities) can reduce single-purpose trips and achieve one-stop service coverage, further lowering carbon emissions.
For the Main-Road-Concentrated Type, the proximity coordination strategy is adopted. This type had the lowest road density center (6.64 km/km2), while its facility density, accessibility, facility completeness, and continuous building-interface coverage were 316.78 units/km2, 948.82, 30.57%, and 32.70%, respectively. Together with weekly per capita carbon emissions of 1.898 kg CO2/(person·week), this profile indicates that services were concentrated along a limited number of major corridors and provided weaker coverage of surrounding residential areas. The proximity-based synergistic strategy leverages existing corridors to distribute facilities to adjacent areas within walking distance. Specifically, facility nodes should be embedded along branch roads within a 500 m radius—adding small convenience stores, community health stations, and fresh produce pick-up points—to disperse service load and shorten daily travel distances. Slow-traffic connections should be optimized by establishing dedicated bicycle lanes and pedestrian isolation belts along arterials, creating a “branch-artery connected” slow-traffic network. Simultaneously, mixed-use land redevelopment should be promoted along arterial corridors, transforming single-use buildings into integrated complexes combining “commerce + community services + culture,” thereby reducing cross-district travel.
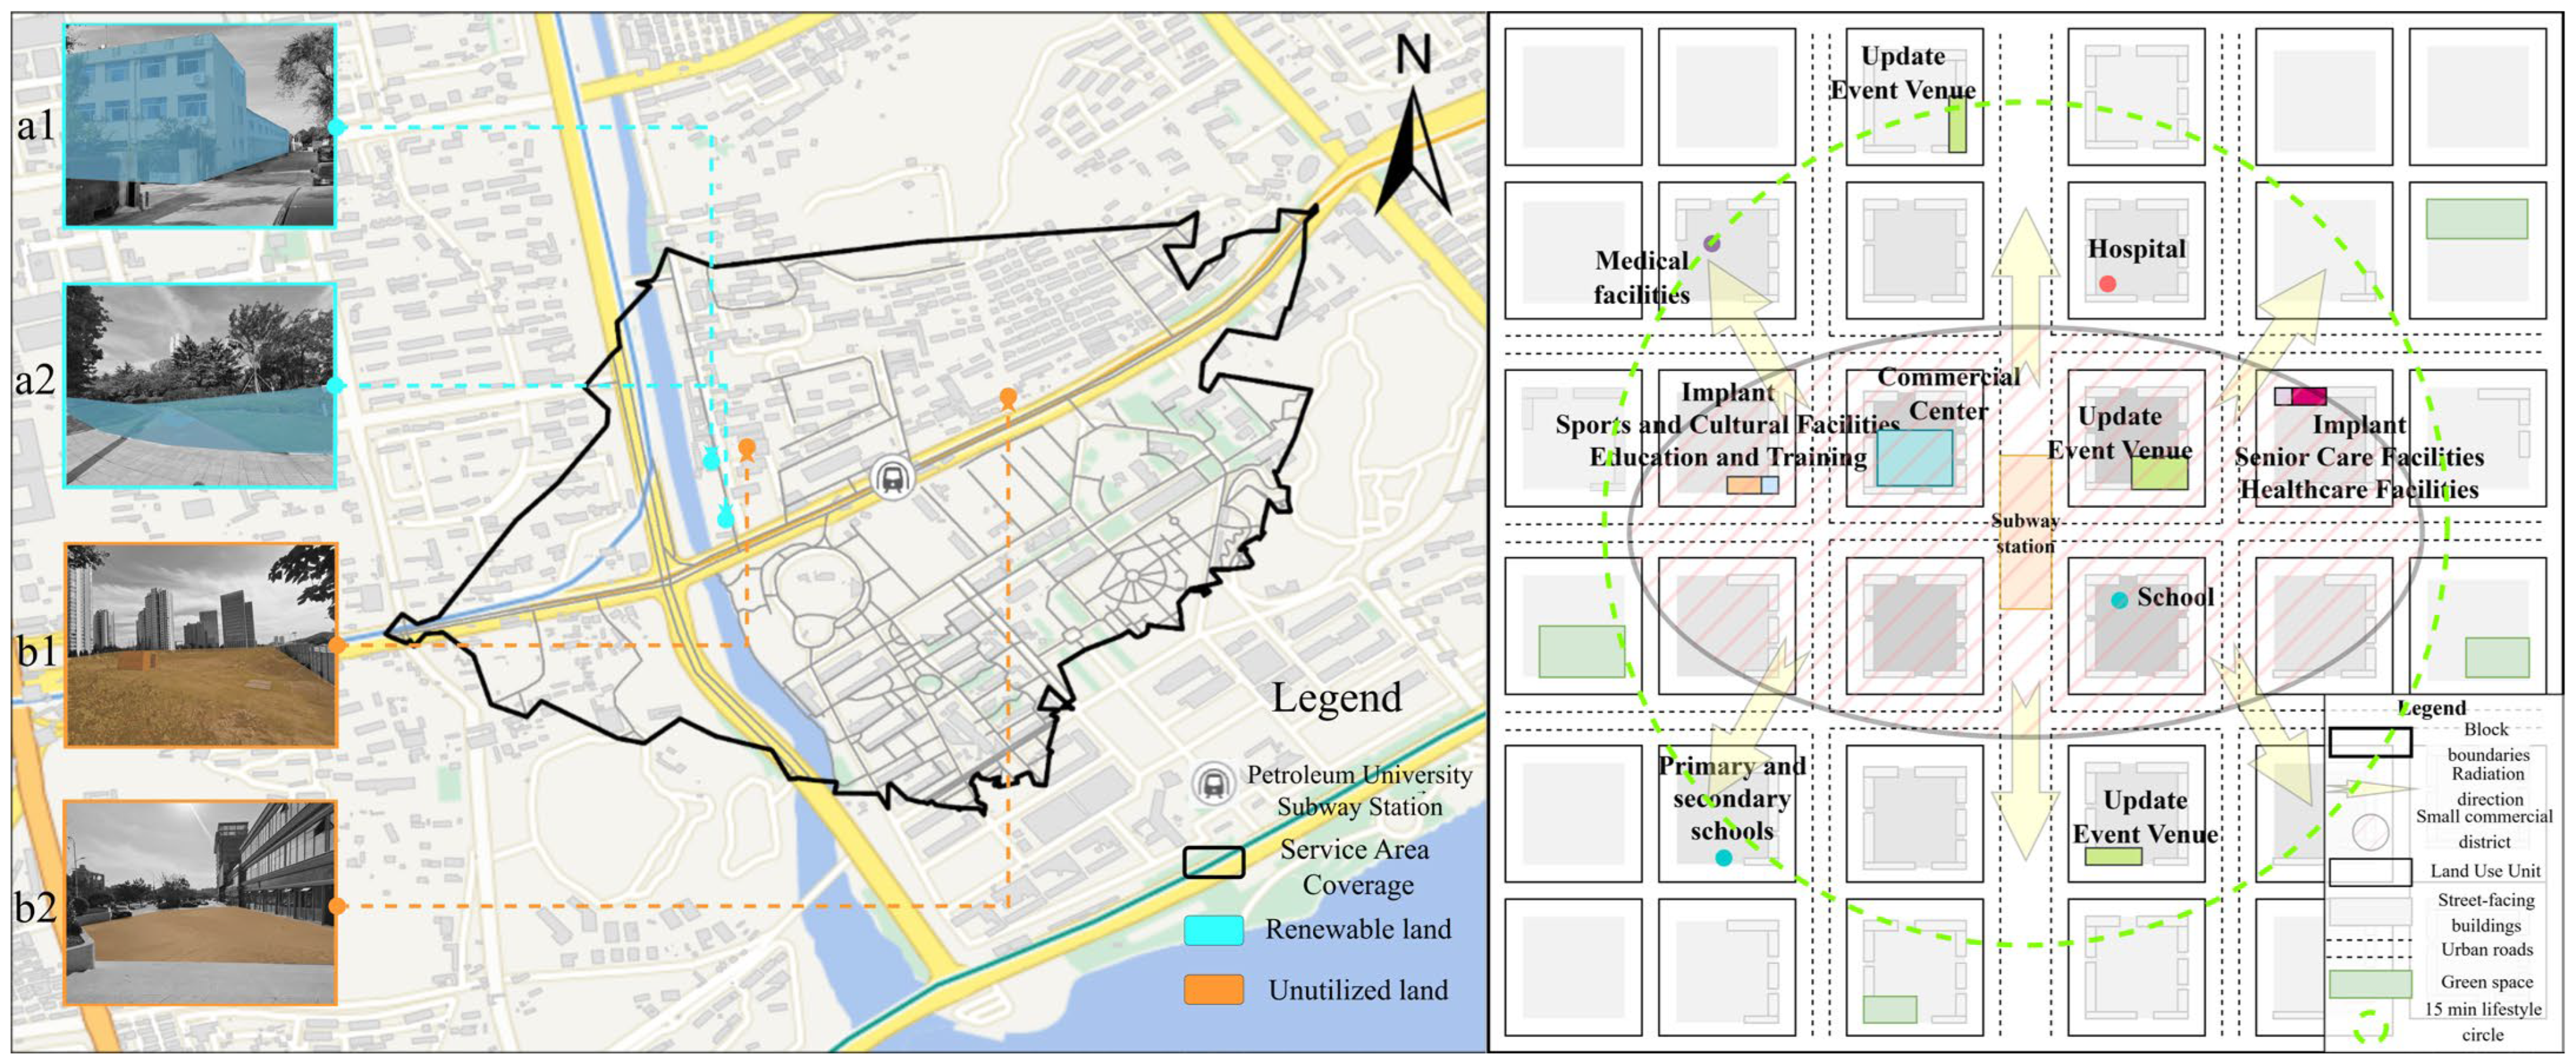
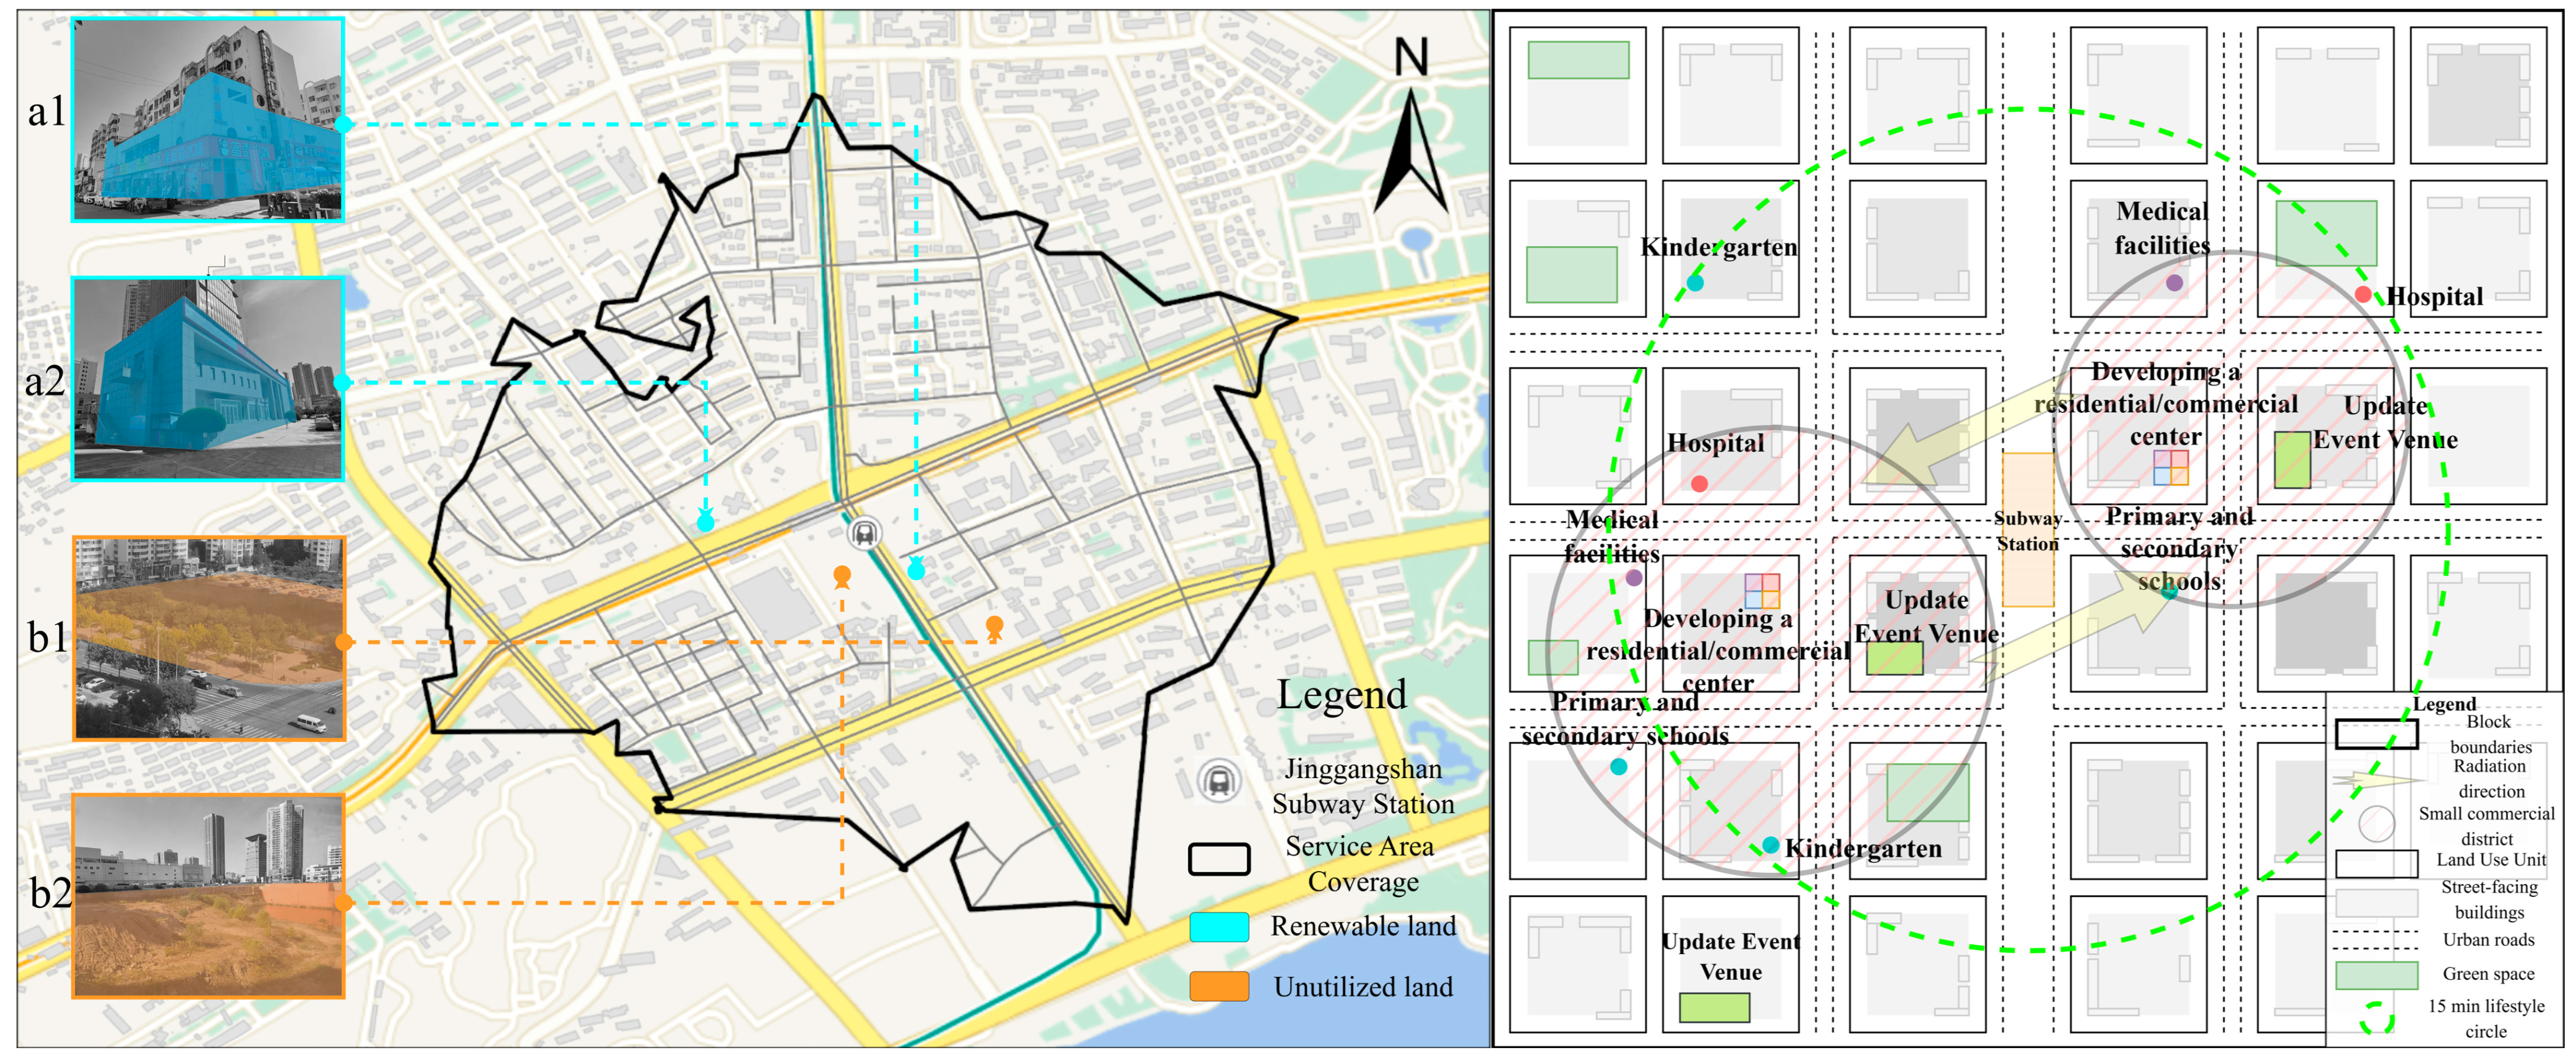
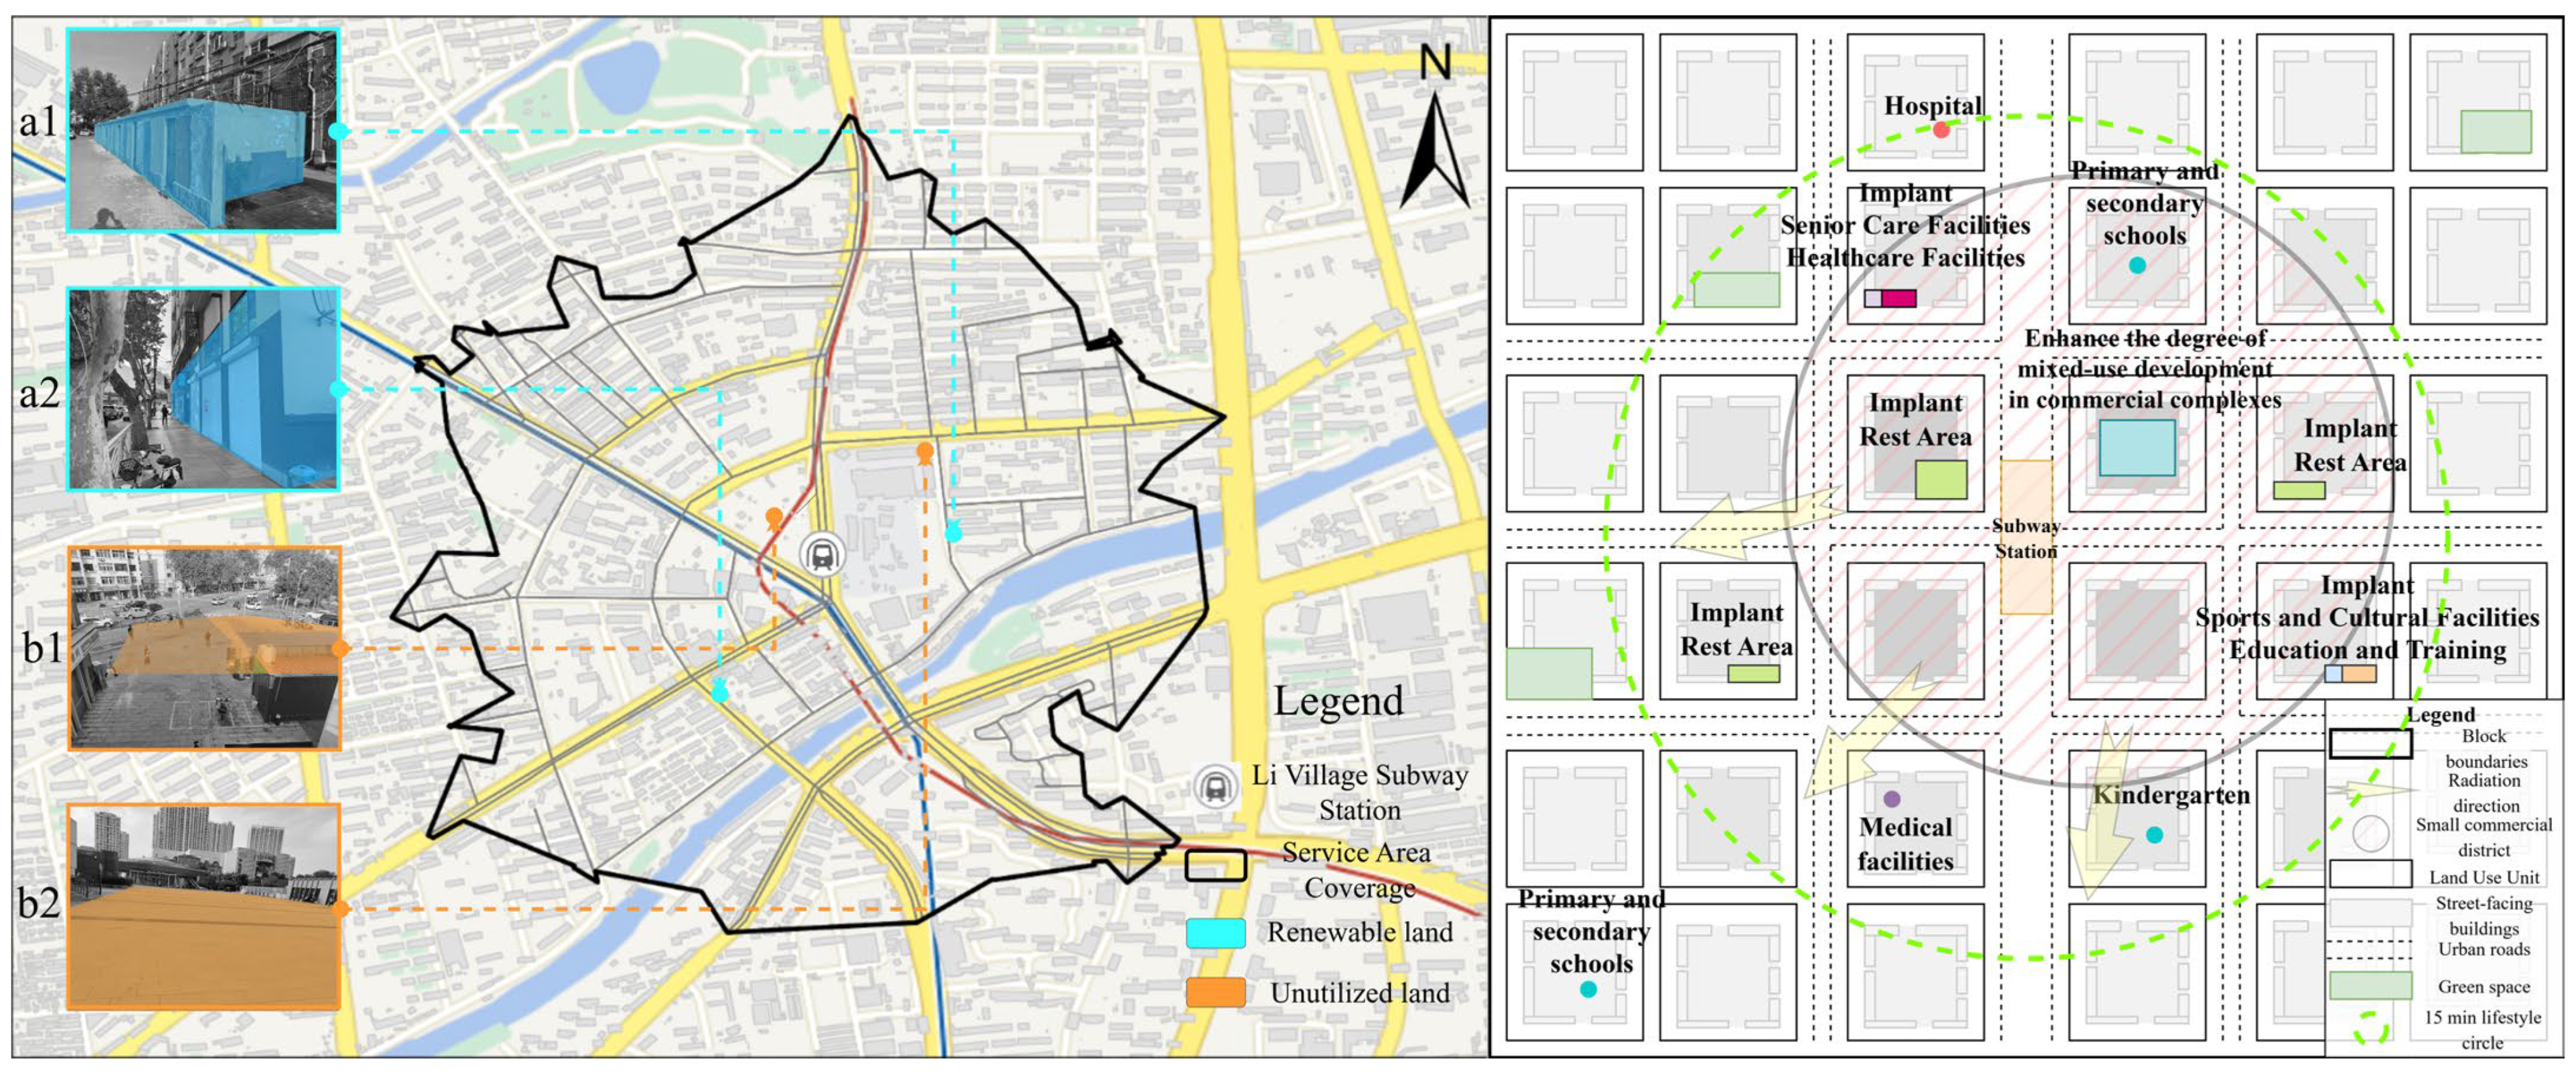
For the Point-Concentrated Type and the Scattered-and-Disordered Type, the intensive-integration strategy is adopted. The Point-Concentrated Type had intermediate road density (11.69 km/km2), facility density (363.09 units/km2), accessibility (1403.18), facility completeness (33.06%), and continuous building-interface coverage (43.45%), indicating that relatively favorable accessibility remained concentrated around localized nodes rather than being evenly distributed. In contrast, the Scattered-and-Disordered Type had the lowest facility density (276.84 units/km2), accessibility (926.21), facility completeness (11.49%), and continuous building-interface coverage (21.13%), indicating fragmented and weakly coordinated facility provision. Their weekly per capita carbon emissions were 2.491 and 2.454 kg CO2/(person·week), respectively, both higher than those of the Spatially Balanced Type and the Main-Road-Concentrated Type. For blocks classified as the Point-Concentrated Type, a “main center + secondary nodes” structure should be adopted: large facilities should be retained at core nodes while supplementing secondary nodes with community markets and block service centers, forming a radially balanced network. For blocks classified as the Scattered-and-Disordered Type, existing facilities should be systematically cataloged, inefficient ones phased out, and land consolidated to construct integrated community service centers combining commercial, medical, cultural, and other functions. Additionally, low road density and poor connectivity should be addressed by opening up micro-circulation roads and widening branch roads, coupled with bike-sharing and community shuttle services, to reduce private car dependence and achieve synergistic low-carbon transformation. Figure 7, Figure 8 and Figure 9 illustrate the type-specific renewal interventions proposed for the Li Village, University of Petroleum, and Jinggangshan Road station areas, respectively.

5.2. Simulation Methods and Results

5.2.1. Simulation Methods

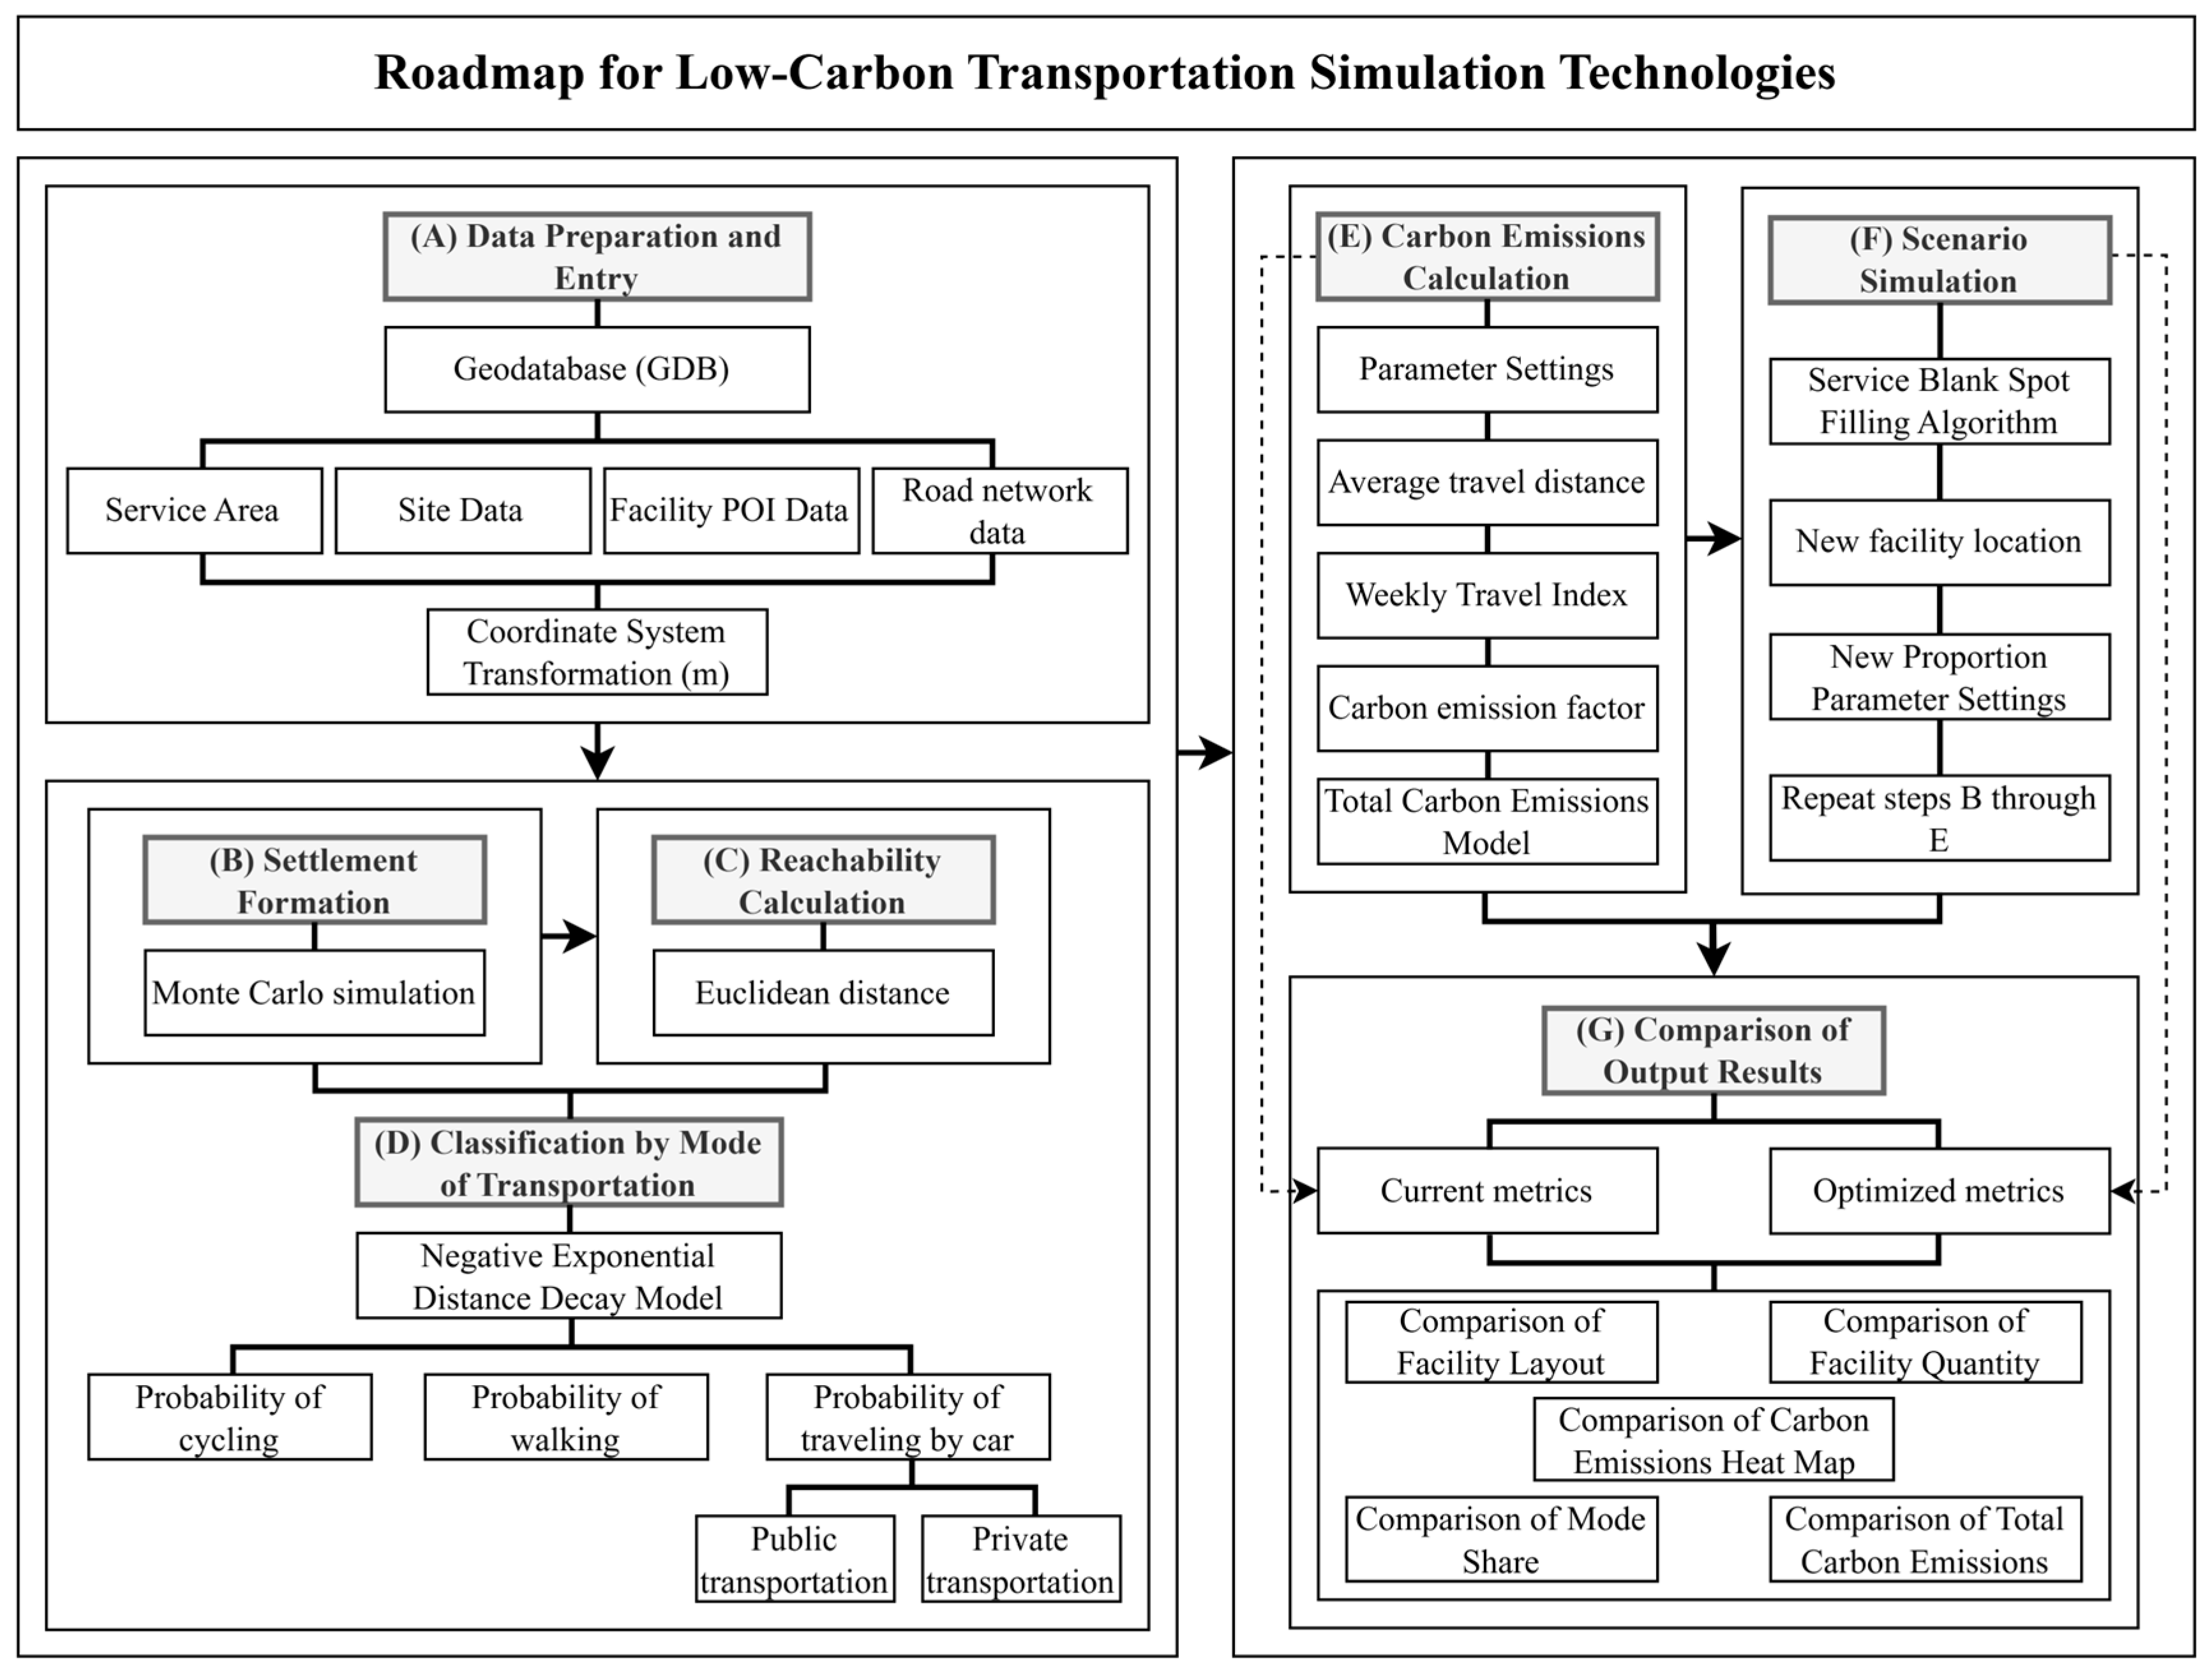
The low-carbon mobility simulation system established an integrated analytical framework based on geospatial data and probabilistic modeling to assess potential changes in residents’ travel mode structure and travel-related carbon emissions under different public service facility layouts. As shown in Figure 10, the system used a Geodatabase (GDB) as its primary data source and incorporated service area polygons, transit stops, public service facility points, and road networks. All spatial data were transformed into a unified projected coordinate system to ensure consistent distance measurement. Nearest-facility analysis provides a static description of accessibility at observed locations but has limited ability to represent the spatial distribution of residential demand under hypothetical facility layouts. Gravity-based models focus on aggregate destination allocation and are sensitive to the specification of facility attraction weights, whereas discrete-choice models emphasize individual decisions within predefined choice sets. In comparison, the Monte Carlo approach can generate a standardized spatial representation of residential demand, retain consistent demand points and behavioral assumptions across scenarios, and flexibly simulate changes in facility configuration. Therefore, the Monte Carlo approach was adopted to evaluate facility proximity, model travel mode structure, and aggregate carbon emissions within a unified scenario simulation framework.
For each representative station area, 500 residential demand points were randomly generated within the service area polygon to represent the spatial distribution of residential demand. Each point was treated as one simulated residential demand point. The same 500 demand points were retained across the baseline and facility supplementation scenarios to ensure direct comparability. The Euclidean distance from each simulated residential point to the nearest public service facility was used as a simplified facility proximity variable. This measure represented relative spatial proximity rather than complete pedestrian accessibility because detailed route barriers and walking conditions were not fully incorporated into the simulation. Travel mode probabilities were modeled using distance-decay functions. Walking probability followed a negative exponential function, reflecting the rapid decline in walking willingness as travel distance increased. Cycling probability also followed an exponential decay pattern after excluding short-distance demand already assigned to walking, thereby representing its substitution role for medium-distance trips. The remaining travel demand was categorized as motorized travel and was further divided into public and private transport according to fixed proportions. Carbon emissions were calculated by combining modeled mode shares, weekly travel frequency, representative travel distance, and mode-specific emission factors.
Based on the overall travel frequency pattern recorded in the resident questionnaire, weekly travel frequency was set at 80 one-way trip legs per simulated resident across all travel modes, including walking, cycling, public transport, private cars, and taxis. A representative motorized trip distance of 5 km was specified with reference to the travel distance ranges reported in the questionnaire and the spatial context of the pedestrian network-based service areas. Walking and cycling were assigned zero operational emission factors. The emission factors for motorized modes included 0.230 kg CO2/(passenger·km) for private cars and 0.065 kg CO2/(passenger·km) for buses. Expected weekly carbon emissions were first calculated separately for each simulated residential demand point on the basis of the modeled travel mode probabilities, weekly travel frequency, representative motorized trip distance, and mode-specific emission factors. Aggregate weekly carbon emissions were then obtained by summing the estimates across the fixed sample of 500 demand points and were expressed in kg CO2/week. These aggregate values represent the modeled totals for the fixed simulation sample rather than population-weighted estimates of the actual weekly carbon emissions of the entire station area population.
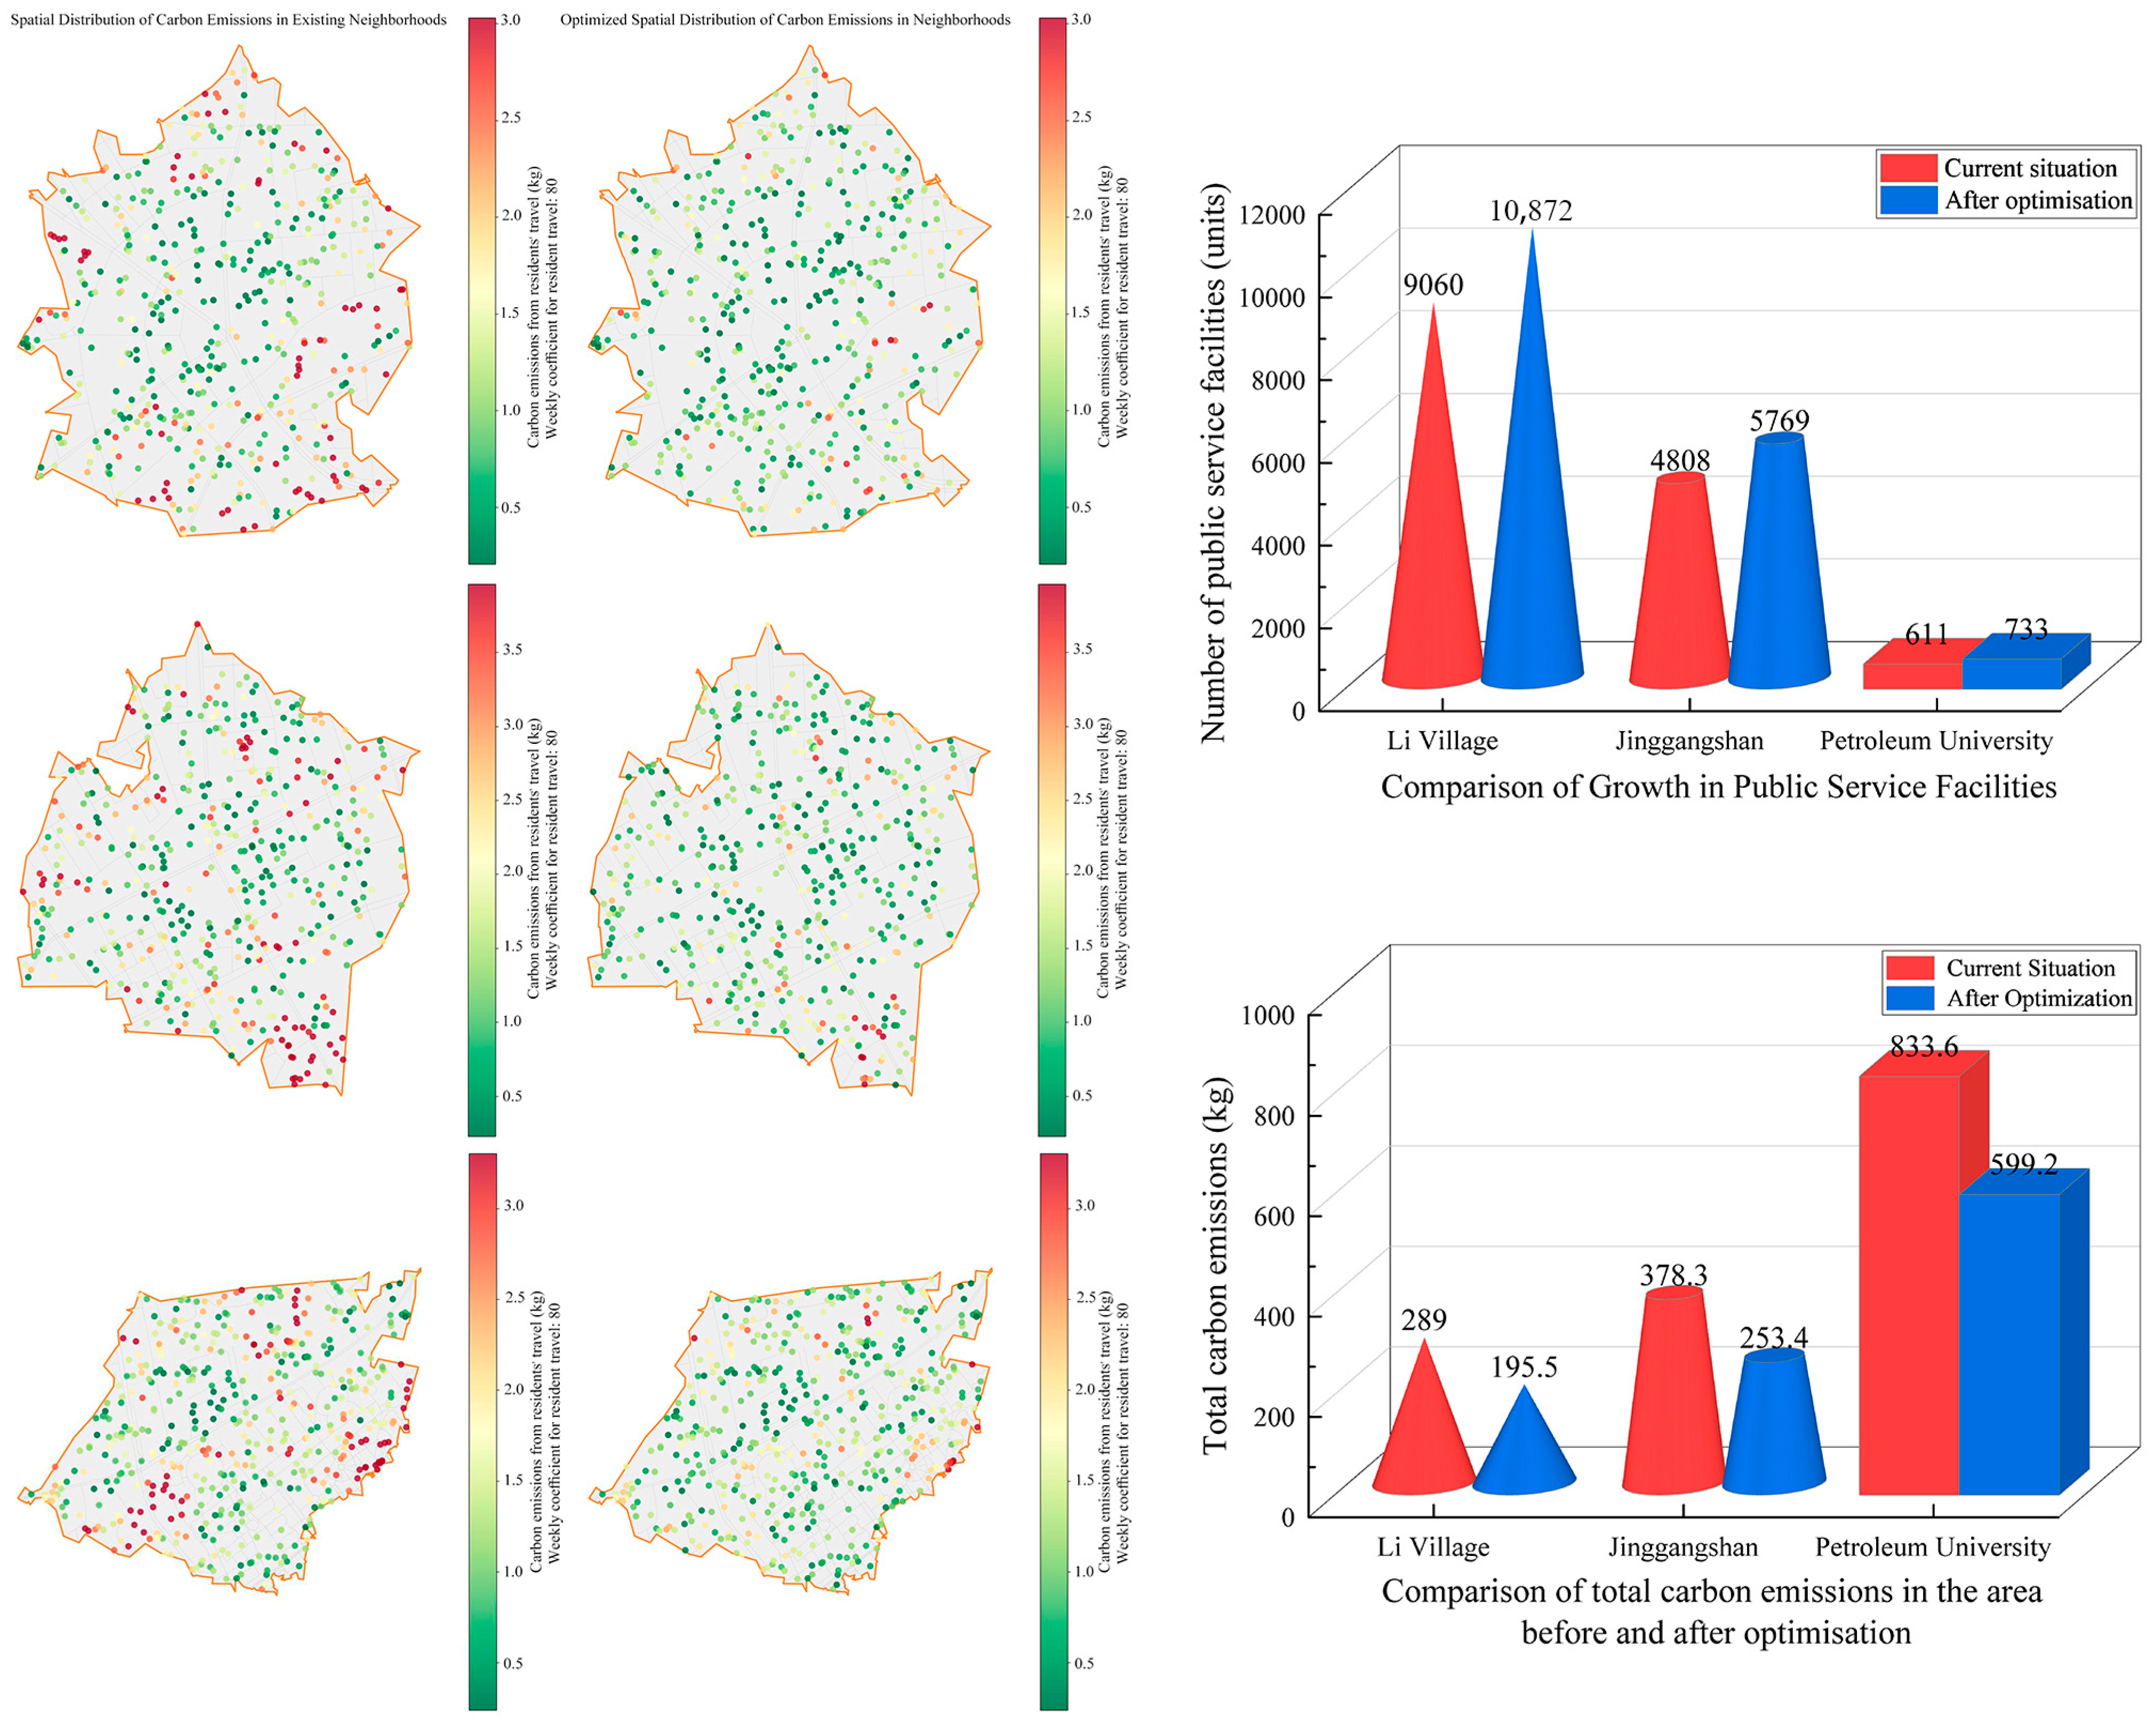
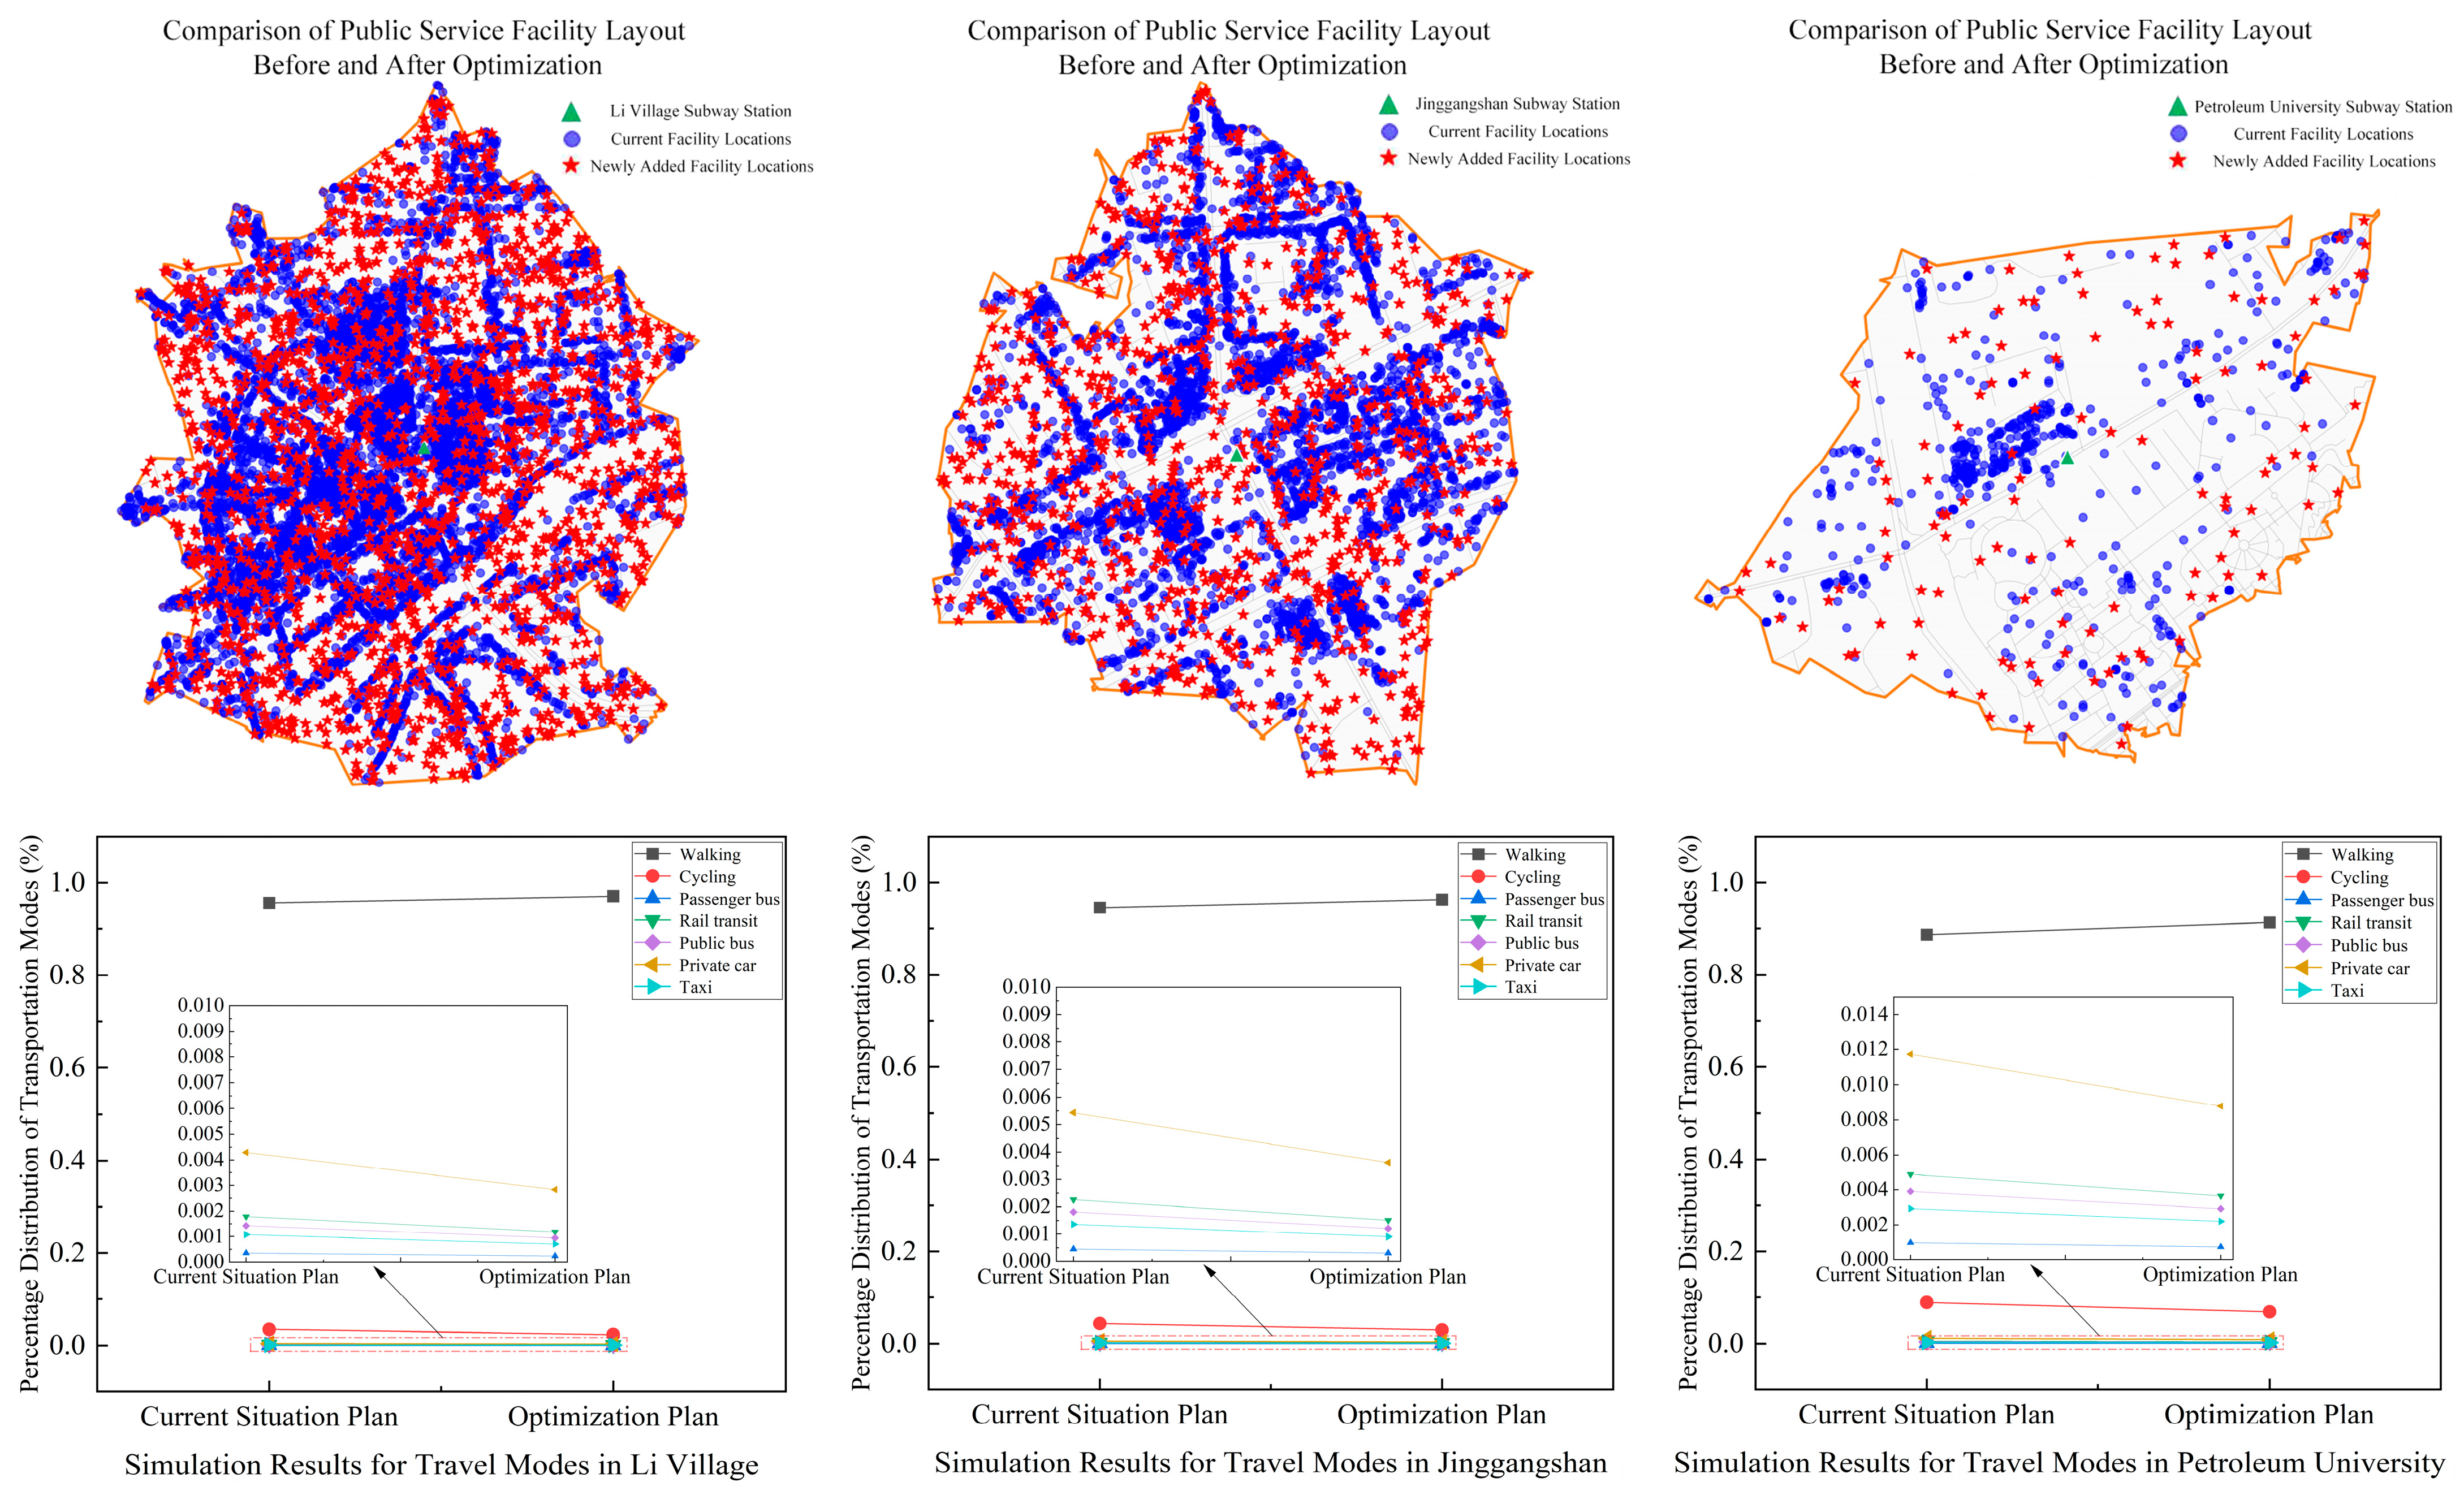
Facility supplementation scenarios were constructed using a “service-gap-filling” algorithm, with the number of facility points increased by 10%, 20%, and 30%. These levels represented relatively low, moderate, and high facility supplementation intensities, respectively. To ensure direct comparability, the same residential demand points, facility placement rule, travel behavior parameters, weekly travel frequency, representative motorized trip distance, and mode-specific emission factors were retained across the baseline and supplementation scenarios. The 20% facility supplementation scenario was selected as the benchmark for detailed spatial visualization and cross-case comparison, while the 10% and 30% scenarios were used to examine the sensitivity of the modeled results to different supplementation intensities. The simulation was implemented using Python geocomputing libraries and generated facility layout comparisons, carbon emission heatmaps, modeled travel mode share diagrams, and aggregate carbon emission comparison charts. Together, these outputs formed a technical workflow covering spatial-data input, scenario generation, simulation calculation, and result visualization.

5.2.2. Analysis of Simulation Results

The comparison among the 10%, 20%, and 30% facility supplementation scenarios showed that the modeled carbon emission reductions did not increase in strict proportion to the number of additional facilities. Under the 10% scenario, facility proximity and modeled carbon emissions improved, but the change in spatial coverage was relatively limited, and some existing service gaps remained insufficiently addressed. The 20% scenario produced more evident improvements in facility proximity, modeled walking and cycling shares, and aggregate carbon emissions. The 30% scenario generated further improvements; however, the additional benefit relative to the 20% scenario was smaller than the corresponding increase in facility quantity, indicating diminishing marginal gains at the higher supplementation level. Considering both the modeled response and the facility supplementation intensity, the 20% scenario was retained as the benchmark for detailed cross-case comparison.
Under the retained 20% facility supplementation scenario, modeled carbon emission reductions ranged from 28.1% to 33.0% across the three representative station areas. Jinggangshan Road showed the highest reduction rate, at 33.0%, followed by Li Village, at 32.3%, while the University of Petroleum showed the lowest relative reduction, at 28.1%. This variation may be related to differences in the baseline facility configurations and modeled travel mode structures of the three station areas. After facility supplementation, both Jinggangshan Road and Li Village showed marked increases in the modeled shares of walking and cycling, indicating that the newly added facilities improved proximity to services in previously underserved areas and increased the modeled feasibility of short-distance low-carbon travel.
The University of Petroleum had the highest modeled baseline aggregate weekly carbon emissions across the fixed sample of 500 residential demand points, at 833.6 kg CO2/week, and the largest absolute modeled reduction, at 234.4 kg CO2/week. However, its relative reduction rate was lower than those of the other two station areas. This may reflect its stronger baseline dependence on motorized travel and the limited extent to which some longer-distance travel demand could be shifted through localized facility supplementation. Differences in road network structure and population distribution may also have constrained the modeled potential for travel mode shifts. Under the facility supplementation scenario, modeled private-car use decreased across all three station areas, accompanied by increases in public transport and non-motorized travel, as shown in Figure 11.
This pattern illustrates the modeled sequence linking improved facility coverage, shorter facility-proximity distances, higher expected shares of low-carbon travel modes, and lower aggregate carbon emission estimates. Comparative carbon emission heatmaps also showed a reduction in high-emission zones after facility supplementation, indicating a broader spatial decline in modeled travel-related carbon emissions. Overall, the scenario results suggest that improving facility coverage may support shifts toward lower-carbon travel modes and reduce modeled aggregate carbon emissions under the specified spatial and behavioral assumptions. These results provide a scenario-based reference for considering facility coverage in low-carbon TOD renewal and future spatial planning analysis.
To complement the spatial and travel mode comparisons, Figure 12 compares the modeled aggregate weekly carbon emissions and facility quantities before and after the 20% facility supplementation scenario across the three representative station areas.
Across the three representative station areas, the increase in facility quantity was consistently accompanied by a decline in modeled aggregate weekly carbon emissions. Because the residential demand points, facility placement rule, travel behavior parameters, weekly travel frequency, representative motorized trip distance, and mode-specific emission factors were held constant, these differences represent conditional model responses to changes in facility configuration and facility proximity under the specified scenario. The results provide a standardized quantitative reference for comparing the potential carbon emission responses of different station area contexts to facility supplementation and further indicate the planning relevance of improving overall facility coverage in low-carbon TOD renewal.

6. Discussion

6.1. Facility Layout, Spatial Structure, and Travel Carbon Emissions

From the perspective of low-carbon TOD operation, public service facilities are not only components of land-use supply but also spatial links connecting residential activities, street networks, and transit use. Previous TOD studies have generally emphasized development intensity, land-use mix, transit accessibility, and travel mode composition, while studies of 15 min living circles have focused more on facility quantity, service coverage, and average accessibility. These approaches provide important measures of overall development and service levels but often pay less attention to differences in facility completeness; aggregation patterns; service node hierarchy; and connections between facilities, residential areas, and metro stations. The present study therefore introduces facility layout classification to further distinguish the internal spatial organization of TOD blocks and relate this organization to residents’ travel carbon emissions.
The findings are consistent with the core TOD principle of integrating compact development, mixed functions, public transport, and walkable environments. They also support previous findings that compact service provision, higher accessibility, and favorable walking conditions are associated with lower-carbon travel. The Spatially Balanced Type combined relatively complete facility provision, a connected road network, and the lowest travel carbon emissions, whereas the higher emissions of the Point-Concentrated and Scattered-and-Disordered types indicate that isolated facility agglomeration or dispersed supply may not effectively support daily low-carbon travel. This pattern may arise because facility proximity and functional completeness reduce unnecessary long-distance trips, while connected streets and continuous service nodes improve access to facilities and increase the feasibility of walking, cycling, public transport, and combined travel chains. However, the formation of travel carbon emissions is not limited to the variables examined in this study. Station centrality, land-use composition, transit service frequency, development intensity, parking supply, employment distribution, household characteristics, and residents’ travel preferences may also play important roles. The observed differences should therefore be understood as the combined outcome of facility organization, spatial structure, transport conditions, and individual travel choices.

6.2. Contextual Implications for TOD Blocks

The four facility layout types identified in Qingdao reflect the interaction between its regional spatial characteristics and different stages of urban development. Qingdao’s coastal and hilly terrain has contributed to a multi-centered and corridor-oriented urban structure, while its metro network connects mature old-city districts, established commercial and residential areas, suburban new towns, and peripheral areas undergoing continued development. Mature districts generally have denser street networks and more established service systems, whereas some corridor-oriented and newly developed areas contain facilities concentrated along major roads, around individual centers, or dispersed within incompletely developed residential areas. Differences in terrain constraints, development period, road network structure, population distribution, and functional composition have therefore produced substantial heterogeneity among TOD blocks.
Under these conditions, a uniform increase in facility quantity cannot adequately address the different spatial problems of TOD blocks. Spatially Balanced blocks mainly require the targeted supplementation of remaining service gaps; Main-Road-Concentrated blocks require stronger connections between arterial-road facilities and surrounding residential areas; and Point-Concentrated and Scattered-and-Disordered blocks require the integration of fragmented facility resources, stronger connections among existing and secondary service nodes, and the establishment of a more continuous and clearly organized service network. The three renewal pathways therefore represent different forms of spatial adjustment rather than simple differences in facility investment. More broadly, low-carbon TOD renewal should coordinate facility completeness, service node organization, road network connectivity, and residential population distribution. Planning evaluation should consider whether missing services are located near areas of actual demand; whether primary and secondary service nodes form a coherent hierarchy; whether facilities are distributed continuously rather than excessively concentrated along individual roads or nodes; and whether residential areas, facilities, and metro stations are connected through direct and continuous walking and cycling routes. The planning focus should thus shift from whether facilities are present to how their functions, spatial organization, and network connections respond jointly to residents’ daily service and travel needs.

7. Conclusions

Grounded in the behavior–space–environment framework, the theory of natural movement, and urban centrality theory, this study examined the relationships among public service facility layout, road network structure, residents’ travel behavior, and travel-related carbon emissions at the TOD-block scale. The main contribution is to connect the quantitative identification of facility layout types with station area travel carbon emissions and differentiated low-carbon renewal strategies, thereby extending conventional TOD and 15 min-city research from facility coverage and accessibility assessment toward the internal spatial organization and low-carbon renewal of urban blocks. Taking 172 TOD station areas in Qingdao as the analytical units, this study integrated POI, building, pedestrian road network, population, field survey, and resident questionnaire data. ArcGIS spatial analysis, K-means clustering, bootstrap stability evaluation, spatial syntax, Global Moran’s I, spatial regression, station area Pearson correlation analysis, and group difference tests were jointly applied to identify facility layout characteristics and examine their relationships with road network conditions, population distribution, residents’ travel behavior, and carbon emissions. The TOD station areas were classified into four types: Spatially Balanced, Main-Road-Concentrated, Point-Concentrated, and Scattered-and-Disordered. Based on the typology, statistical results, and field investigations, differentiated low-carbon renewal strategies were proposed for the four types. In addition, a low-carbon travel simulation system was developed using Python. The system incorporated Monte Carlo service-gap-filling, travel mode adjustment, and carbon emission estimation to conduct controlled scenario simulations for three representative station areas and to examine the potential travel mode and carbon emission responses to improvements in overall facility coverage. The main conclusions are as follows:
(1)
Significant differences in individual weekly per capita travel carbon emissions were identified among the four facility layout types. The Spatially Balanced Type had the lowest mean emission level at 1.539 kg CO2/(person·week), followed by the Main-Road-Concentrated Type, whereas the Point-Concentrated and Scattered-and-Disordered types had similarly high emission levels.
(2)
After FDR correction, the density and accessibility of Commercial and Entertainment facilities, Medical and Health facilities, and total facilities were significantly negatively correlated with station area travel carbon emissions. These results highlight the planning relevance of improving the provision and spatial accessibility of high-frequency daily service facilities.
(3)
Facility density, road density, and population density exhibited significant positive network-based spatial autocorrelation. Among the three candidate models, the spatial error model provided the best fit and identified positive associations of facility density with both road density and population density. Road density had the larger standardized coefficient, and no significant spatial autocorrelation remained in the innovation residuals.
(4)
Three differentiated renewal strategies were proposed for the four facility layout types. The node-embedding strategy was proposed for Spatially Balanced blocks, the proximity coordination strategy for Main-Road-Concentrated blocks, and the intensive-integration strategy for Point-Concentrated and Scattered-and-Disordered blocks.
(5)
Under the specified 20% facility supplementation scenario, the simulation estimated aggregate weekly carbon emission reductions of 32.3% for Li Village, 33.0% for Jinggangshan Road, and 28.1% for the University of Petroleum station area. The simulated mode shares shifted toward walking and cycling and away from private-car use in all three cases, indicating the potential response to improved overall facility coverage under the modeled conditions.
Taken together, the results are consistent with the behavior–space–environment framework. Spatial syntax analysis showed that greater road network integration and connectivity were associated with stronger facility agglomeration, while the network-based spatial regression identified positive associations of facility density with road density and population density. The station area correlation analysis further showed that higher density and accessibility of high-frequency service facilities were associated with lower travel carbon emissions. The controlled scenario simulation illustrated the potential travel mode and carbon emission response to improved facility coverage in the three representative cases.
Although this study examines the relationship between public service facility layout and low-carbon renewal in TOD blocks, several limitations remain. The analysis is confined to Qingdao, and the travel survey is based on self-reported cross-sectional data, which may be affected by recall bias and cannot establish temporal or causal relationships. The available data also did not support separate distributive-equity comparisons among vulnerable population groups. In addition, POI data record facility locations and categories but do not consistently reflect facility scale, service capacity, quality, or actual utilization. Although spatial dependence and K-means stability were examined, the results may still be affected by the specification of the spatial-weight matrix, omitted confounding factors, the selected clustering variables, and clustering settings. Carbon emission estimates depend on fixed mode-specific emission factors. The simulation also applies simplified distance-decay and mode allocation rules, stochastic residential-point generation, and a service-gap-based facility placement rule, and it has not been externally validated using observed post-renewal travel and carbon emission data. These constraints should be considered when interpreting the generalizability of the findings and their planning implications. Future studies may address these limitations by expanding the analysis to multiple cities and longitudinal samples, incorporating more detailed facility and behavioral data, and validating the simulation with observed post-renewal outcomes.

Author Contributions

Conceptualization, P.D. and Y.W.; methodology, K.W.; software, K.W.; validation, Z.W.; formal analysis, A.X.; investigation, A.X.; resources, Y.X. and Z.W.; data curation, Y.X. and A.X.; writing—original draft preparation, K.W.; writing—review and editing, K.W. and Z.Z.; visualization, Z.Z. and Y.W.; supervision, P.D. and Y.W.; project administration, P.D. All authors have read and agreed to the published version of the manuscript.

Funding

This research received no external funding.

Institutional Review Board Statement

This study involved a non-medical and non-life-science questionnaire survey concerning urban planning and residents’ travel behavior. In accordance with Article 3 of the Ethical Review Measures for Life Science and Medical Research Involving Humans (2023 No. 4) issued by the National Health Commission, the Ministry of Education, the Ministry of Science and Technology, and the National Administration of Traditional Chinese Medicine of China, this study was exempt from formal institutional ethical review. All research procedures complied with the applicable national ethical requirements.

Informed Consent Statement

Before participation, all respondents were informed of the study purpose, survey content, voluntary nature of participation, right to withdraw, intended academic use of the data, and privacy-protection measures. Informed consent was obtained from all respondents before completion of the questionnaire. No directly identifiable personal information was collected, and all responses were anonymized and analyzed in aggregate.

Data Availability Statement

The original contributions presented in this study are included in the article. Further inquiries can be directed to the corresponding author.

Conflicts of Interest

The authors declare no conflicts of interest.

References

  1. Sun, J. Methodology of Integrated Planning Toward Urban Block-Level Carbon Reduction. Urban Plan. Forum. 2022, 6, 102–109. [Google Scholar]
  2. Zhang, X.; Yang, H. Research on Low-Carbon Renewal Mode of Community Life Circles Based on Facility Layout Form Types. City Plan. Rev. 2025, 49, 43–51. [Google Scholar]
  3. Wang, Y.; Xie, H.; Hua, Y.; Jin, B.; Qiu, Z. Theoretical framework of life circles in chinese small towns and the optimization of spatial layout for public service facilities based on residents’ distance sensitivity. Humanit. Soc. Sci. Commun. 2024, 11, 1741. [Google Scholar] [CrossRef] [Scilit]
  4. Zhang, Y.; Zhou, W. Nonlinear and interactive effects of complex built environment on travel-related CO2 emissions. Sustain. Cities Soc. 2025, 130, 106574. [Google Scholar] [CrossRef] [Scilit]
  5. Li, M.; Chen, T.; Zuo, M. Impacts of Urban Spatial Morphology on Carbon Emissions from a Multi-Scale Perspective: Paths and Key Issues. City Plan. Rev. 2025, 49, 105–114. [Google Scholar]
  6. Wu, A.; Liu, Y. Reflections on the Low-Carbon Development Path of High-Density Urban Areas in the Guangdong-Hong Kong-Macao Greater Bay Area Under the “Double Carbon” Goal: Taking Luohu District as an Example. Urban Dev. Stud. 2024, 31, 80–88. [Google Scholar]
  7. Zhang, Y.; Wang, Z.; Lin, H. Research on the Paths of Urban Renewal Planning under the Background of “Carbon Neutrality and Carbon Emission Peak”: The Case Study of Huangshi. Urban Dev. Stud. 2024, 31, 13–18. [Google Scholar]
  8. Zhou, J.; Gu, Y.; Xiao, S. Establishing the High-quality Urban Renewal System Towards the Vision of “Carbon Peak and Carbon Neutrality”: Changde, Hunan Province. Planners 2022, 38, 96–101. [Google Scholar]
  9. Li, W.; Zheng, Y.; Zhang, Q.; Zeng, Q. Construction of and Low-Carbon Optimization Strategies for Block-Level Carbon Emission Control Unit. Landsc. Archit. 2025, 32, 71–78. [Google Scholar] [CrossRef] [Scilit]
  10. Xu, Y.; Li, Z.; Wei, H.; Wang, S.; Zhang, G.; Yang, H.; Zhang, C.; Yang, H.; Zhou, S.; Wang, Y. How autonomous vehicles reshape commuting and economic boundaries: A behavioral-spatial analysis based on kentucky statewide survey data. J. Transp. Geogr. 2026, 131, 104550. [Google Scholar] [CrossRef] [Scilit]
  11. Li, Y.; Gu, K. Urban morphology and transit-oriented development (TOD): Planning and managing urban change in New Zealand. Cities 2025, 167, 106407. [Google Scholar] [CrossRef] [Scilit]
  12. Liu, X.; Chen, X.; Pan, H. From “Station-City Integration” to “Corridor Integration”: TOD Framework and Model Optimization from the Perspective of Space of Flows. Urban Plan. Forum. 2024, 4, 34–40. [Google Scholar]
  13. Lee, S.; An, Y.; Kim, K. Relationship between transit modal split and intra-city trip ratio by car for compact city planning of municipalities in the Seoul metropolitan area. Cities 2017, 70, 11–21. [Google Scholar] [CrossRef] [Scilit]
  14. Liu, R.; Feng, H.; Lu, H. Mechanism Analysis and Calculation Method of Traffic Carbon Reduction Effect Based on TOD Mode. Urban Dev. Stud. 2022, 29, 56–62. [Google Scholar]
  15. Liu, Q.; Li, Z.; Yang, Y.; Lai, Y. Method Study of Building Continuous Walking Network in TOD Area: Historical Experience and Enlightenment of Kohoku New Town in Japan. Shanghai Urban Plan. Rev. 2024, 6, 139–146. [Google Scholar]
  16. Ramos, C.D.G.; Mourato, J.; Sousa, V.D. Uncovering walkability: A chronological literature review. Transp. Rev. 2026, 46, 109–130. [Google Scholar] [CrossRef] [Scilit]
  17. Malekzadeh, M.; Smith, L.; Reuschke, D.; Farber, S.; Long, J. Urban mobility and carbon emissions: Decoding the influence of sociodemographic factors, trip-level built environment, and travel behaviour of workers in three UK cities. Cities 2025, 167, 106321. [Google Scholar] [CrossRef] [Scilit]
  18. Yuen, W.; Lee, L.; Leong, W.; Carmon, Z.; Chen, C.; Ng, K.; Chong, W. Perceived accessibility of public transport predicts intention to give up car ownership but objective accessibility does not. J. Transp. Geogr. 2025, 129, 104418. [Google Scholar] [CrossRef] [Scilit]
  19. Tan, Y.; Wang, J.; Du, J. Layout Optimization and Mechanism Improvement of Public Service Facilities from the Perspective of Life Circle: A Case Study of Built-up Areas in Zhengzhou City. Areal Res. Dev. 2025, 44, 79–85. [Google Scholar]
  20. Zhong, L.; Xu, L. Research on the Matching Relationship between Service Facilities and Populations in Community Living Circle Based on Multi-source Data: A Case Study of Ningbo Downtown. Shanghai Urban Plan. Rev. 2022, 2, 101–107. [Google Scholar]
  21. Lv, D.; Zhou, D.; Shao, L. Accurate Provision of 15-Minute Community Life Circle Elements. Planners 2023, 39, 139–144. [Google Scholar]
  22. Pellicelli, G.; Marinelli, L.J.; Caselli, B.; Zazzi, M.; Rossetti, S. Operative methodology for the assessment of pedestrian accessibility to facilities for the 15-minute city neighbourhood-scale planning scenarios. Sustain. Cities Soc. 2025, 134, 106953. [Google Scholar] [CrossRef] [Scilit]
  23. Chai, Y.; Yang, Z.; Xiao, M. Delineation and Comparison of Ideal and Actual Community Life Circles: A Case Study of Dangdai Community and Yimei Community in Beijing. Shanghai Urban Plan. Rev. 2025, 3, 1–7. [Google Scholar]
  24. Editorial Department of Urban Planning Forum. Concepts, Methods, and Practices: An Analysis of the Core Principles of the “15-Minute Block” Planning Framework Academic Dialogue. Urban Plan. Forum. 2020, 1, 1–8. [Google Scholar]
  25. Huang, H.; Liu, Q.; Han, H.; Chen, T.; Pan, L. Delimitation of Urban Life Circle Based on the Principle of Equity and Sharing. Planners 2021, 37, 81–86. [Google Scholar]
  26. Jiang, M.; Tian, W. Research on Functional Configuration Characteristics, Trend and Development Strategy of 15-Minute Community-Life Circle in Metropolis of China—A Case Study of Beijing, Tianjin and Shanghai. Hebei Acad. J. 2022, 42, 140–150. [Google Scholar]
  27. Xu, L.; Tong, Y.; Yu, L.; Zheng, L.; Qin, H. Community Public Service Facilities Configuration Planning Path from the Perspective of Demand-Supply Matching: The Urban Community Construction Planning of Fuyang District, Hangzhou. Planners 2024, 40, 128–136. [Google Scholar]
  28. Zhao, P.; Luo, J.; Hu, H. Character of the Elderly’s Life Circle and Public Service Facilities Configuration by Using Big Data: A Case of Beijing. Geogr. Sci. 2022, 42, 1176–1186. [Google Scholar]
  29. Han, F.; Tao, D. Evaluation of Residents’ Daily Life Convenience Degree from the Viewpoint of Daily Life Circle, Nanjing. Planners 2020, 36, 5–12. [Google Scholar]
  30. Shen, Y.; Tong, Z. A Convenient Method of Evaluating Community Life Circles on the Human-oriented Scale. South Archit. 2022, 7, 72–80. [Google Scholar]
  31. Xie, Q.; Zhao, C. Convenience measurement of Guiyang City living circle based on POI and AOI data. J. Hum. Settl. West China. 2024, 39, 133–138. [Google Scholar]
  32. Zhou, X. Assessing the Distribution of Public Service Facilities in Unit Planning Based on the Perspective of the 15-minute Community-life Circle: Evidence from Huangpu District of Shanghai. Urban Plan. Forum. 2020, 1, 57–64. [Google Scholar]
  33. GB 50180-2018; Standard for Urban Residential Area Planning and Design. China Architecture & Building Press: Beijing, China, 2018.
  34. Li, J.; He, Z.; Lu, J.; Wang, Y. Impact of urban block morphology on seasonal solar irradiation in high-density urban canyons. Build. Environ. 2026, 291, 114221. [Google Scholar] [CrossRef] [Scilit]
  35. Zhou, Z.; Lin, G. Research on Configuration Standard and Design Principle of Urban Park Facilities—A Case of Guangzhou. Chin. Landsc. Archit. 2024, 40, 56–62. [Google Scholar]
  36. Chen, J.; Song, Y.; Li, Z.; Hou, C.; Wang, Z.; Zheng, Y.; Lang, Q. Spatial configuration characteristics and optimization decisions of elderly service facilities layout in Xi’an based on multi-source data. J. Shaanxi Norm. Univ. (Nat. Sci. Ed.) 2025, 53, 84–101. [Google Scholar]
  37. Huang, Y.; Ling, C.; Yang, J.; Zeng, E. Inclusive Home-Based Community Elderly Care Services: Implication of the Japan’s “Retail Facility + Elderly Care” Model. Urban Plan. Int. 2025, 41, 95–103. [Google Scholar]
  38. Huang, Q.; Shao, L. The Spatial and Temporal Distribution and Accessibility Research of Basic Education Facilities in Shanghai Suburbs Driven by the Development of New Cities. J. Fudan Univ. (Nat. Sci.) 2025, 64, 218–228. [Google Scholar]
  39. Wang, T.; Cui, C.; Li, Z.; Cao, M. The Evaluation and Optimization of Community Sports Facilities Configuration Based on Urbanite Theory: A Case Study of the New District of Xi’an. Planners 2025, 41, 111–118. [Google Scholar]
  40. Li, Y.; Zhang, J.; Bi, Y.; Chen, X.; Wu, J. “Human Oriented” Public Service Facilities Configuration. Planners 2022, 38, 64–69, 87. [Google Scholar]
  41. Liu, H.; Lu, Y.; Niu, B.; Gao, L. Spatial Matching Relationship between the Accessibility of Elderly Health and Recreation Facilities and the Distribution of Elderly Population: A Case Study of Sichuan Province. Trop. Geogr. 2025, 45, 860–873. [Google Scholar]
  42. Xu, Q.; Cao, K.; Gao, W.; Feng, W.; Wang, X. Spatial Balance of Urban Public Sports Facilities and Population Distribution: An Empirical Study Based on “15-Minute Community Fitness Circle” in Shanghai. J. Wuhan Sports Univ. 2023, 57, 22–29. [Google Scholar]
  43. Xu, Y.; Luo, F.; Chen, S.; He, B. Spatial Coordination of Public Service Facilities and Population Distribution in Shenzhen Metropolitan Area. Urban Plan. Forum. 2022, S1, 70–76. [Google Scholar]
  44. Jung, M.; Wang, T.; Kang, M.; Dyson, K.; Dawwas, E.; Alberti, M. Urban landscape affects scaling of transportation carbon emissions across geographic scales. Sustain. Cities Soc. 2024, 113, 105656. [Google Scholar] [CrossRef] [Scilit]
  45. Hillier, B. Space is the Machine: A Configurational Theory of Architecture; Space Syntax: London, UK, 1996; pp. 125–127. [Google Scholar]
  46. Bertaud, A. The Spatial Organization of Cities: Deliberate Outcome or Unforeseen Consequence? Working Paper No. 2004-01; Institute of Urban and Regional Development, University of California: Berkeley, CA, USA, 2004. [Google Scholar]
  47. Institute for Energy and Environmental Research Heidelberg; Institute of Comprehensive Transportation, National Development and Reform Commission of China. Transport in China: Energy Consumption and Emissions of Different Transport Modes; Institute for Energy and Environmental Research Heidelberg: Heidelberg, Germany, 2008. [Google Scholar]
Figure 1. “Environment–behavior–space” relationship diagram.
Sustainability 18 08583 g001
Figure 2. Overview of the study area and distribution of the 172 metro stations in Qingdao.
Sustainability 18 08583 g002
Figure 3. Relationship between distribution of public service facilities and road accessibility.
Sustainability 18 08583 g003
Figure 4. Scatter plot showing correlations between spatial syntax indicators and integration levels.
Sustainability 18 08583 g004
Figure 5. Weekly per capita travel carbon emissions across the four facility layout types (n = 240; 60 respondents per type).
Sustainability 18 08583 g005
Figure 6. Pearson correlations of facility density and accessibility with station area travel carbon emissions along Qingdao Metro Line 1 (n = 41).
Sustainability 18 08583 g006
Figure 7. Schematic diagram of the areas eligible for regeneration and the regeneration models within the Li Village service area. Note: (a1) Several idle standalone buildings, dilapidated from years of neglect. (a2) Vacant ground-floor commercial space, 2nd and 3rd floors available, with potential for leasing opportunities. (b1) The broad, curved open space at the street corner can be repurposed as a recreational area. (b2) Large open plazas with sparse greenery and inadequate facilities present significant potential for renewal.
Sustainability 18 08583 g007
Figure 8. Schematic diagram of the areas eligible for redevelopment and the redevelopment models within the Petroleum University service area. Note: (a1) Machinery Factory, 2–3 stories, outdated and deteriorating facilities. (a2) The park grounds feature only walking paths alongside greenery, lacking activity spaces and recreational facilities. (b1) Large tracts of untouched, uncultivated land remain in a state of undeveloped potential. (b2) Larger vacant areas can be utilized to increase commercial density and expand land-use types.
Sustainability 18 08583 g008
Figure 9. Schematic diagram of the areas eligible for renewal and the renewal models at the Jinggangshan Service Area. Note: (a1) Low-rise buildings along the street, with the second floor underutilized and outdated facilities. (a2) A standalone vacant commercial building is currently available for leasing. (b1) Large tracts of vacant land with no facilities other than green spaces. (b2) Undeveloped land, located near a subway station, with potential for development into a commercial complex.
Sustainability 18 08583 g009
Figure 10. Roadmap for simulation technologies for low-carbon mobility.
Sustainability 18 08583 g010
Figure 11. Changes in facility layout and modeled travel mode shares before and after the 20% facility supplementation scenario.
Sustainability 18 08583 g011
Figure 12. Comparison of modeled aggregate weekly carbon emissions and facility quantities before and after the 20% facility supplementation scenario in the three representative station areas.
Sustainability 18 08583 g012
Table 1. Definitions and calculation methods of carbon emission and facility layout indicators.
Indicator NameFormula Calculation Method
Carbon Emission Characteristic Indicators E t o t a l = i = 1 n S i × d i  
In the formula: E t o t a l —weekly per capita carbon emissions from all reported daily trips, including commuting, shopping, medical care, leisure, and other reported purposes (kg CO2/(person·week)). S i —carbon emission intensity (kg CO2/(person·km)) corresponding to the transportation mode used for the i-th trip. d i —distance for the i-th trip (km). n —number of trips within a week.
Facility Layout Characteristic IndicatorsFacility Accessibility R i t = j = 1 n f i , j P j
In the formula: R i t —accessibility index for obtaining t-type facilities within a 15 min walking radius of block i. P j —the supply weight of facility j . Because consistent information on facility scale and actual service capacity was unavailable, all facility POIs were assigned an equal supply weight of P j = 1 . f i , j —representative distance attenuation coefficient.
f i , j = 0.5 β d i j 0.5 d i j β 0.5 < d i j < 1.5 0 d i j 1.5
In the formula: β is the distance-decay parameter, set to 1 , and d i j is the distance between TOD block i and facility j , measured in kilometers. When d i j 0.5   k m, the accessibility weight remains constant because the distance-decay effect is considered negligible. When 0.5 < d i j < 1.5   k m, the weight decreases monotonically with distance according to an inverse-distance function. The function is continuous at 0.5 km because the adjacent expressions produce the same value. A distance of 1.5 km is defined as the operational upper boundary of the walking service range; therefore, facilities at or beyond this distance are assigned an accessibility weight of zero.
Facility Density D i = N / A
In the formula: D i —facility density within a 15 min walking radius of block i (units/km2). N —total number of facilities within this range (units). A —the area covered by this range (km2).
Facility Completeness F C i = C i / C s
In the formula: F C i —the facility completeness of TOD block i. C i —the number of facility categories available within the block. C s —the total number of facility categories required by the relevant planning standards.
Table 2. Cluster sizes and spatial characteristics of the four facility layout types.
TypeNumber of TOD BlocksPercentage (%)Road Density
Average (km/km2)
Facility Density
Average (Units/km2)
Accessibility
(Dimensionless Index)
Facility Completeness (%)Continuous Building-Interface Coverage (%)Within-Cluster SSE
Spatially Balanced Type3017.414.51613.261842.7163.3564.7814.0783
Point-Concentrated Type4727.311.69363.091403.1833.0643.4521.4948
Main-Road-Concentrated Type6537.86.64316.78948.8230.5732.7024.9973
Scattered-and-Disordered Type3017.49.74276.84926.2111.4921.1310.6201
Note: K-means clustering was conducted using five z-score-standardized variables. The cluster centers shown in the table were transformed back to their original measurement scales for interpretation. Within-cluster SSE was calculated in the standardized five-dimensional variable space.
Table 3. Typical examples and spatial characteristics of the four facility layout types.
TypeGraphical RepresentationAnalysis of Core Density of Typical Block Facilities
Point-Concentrated TypeSustainability 18 08583 i001Sustainability 18 08583 i002Sustainability 18 08583 i003
Main-Road-Concentrated TypeSustainability 18 08583 i004Sustainability 18 08583 i005Sustainability 18 08583 i006
Spatially Balanced TypeSustainability 18 08583 i007Sustainability 18 08583 i008Sustainability 18 08583 i009
Scattered-and-Disordered TypeSustainability 18 08583 i010Sustainability 18 08583 i011Sustainability 18 08583 i012
Table 4. Correlations between facility layout indicators and station area travel carbon emissions along Qingdao Metro Line 1 (n = 41).
Facility Layout IndicatorPearson’s r95% CIUnadjusted
p-Value
FDR-Adjusted
p-Value
Commercial and Entertainment Facility Density−0.531[−0.721, −0.267]0.0010.007
Culture and Sports Facility Density−0.095[−0.391, 0.219]0.5580.612
Education and Research Facility Density−0.212[−0.488, 0.102]0.1850.324
Medical and Health Facility Density−0.453[−0.668, −0.169]0.0030.014
Social Welfare Facility Density−0.196[−0.475, 0.119]0.2220.345
Transportation Facility Density0.167[−0.148, 0.451]0.2970.378
Total Facility Density−0.547[−0.731, −0.288]0.00020.0025
Commercial and Entertainment Facility Accessibility−0.494[−0.696, −0.220]0.0010.007
Culture and Sports Facility Accessibility−0.092[−0.389, 0.222]0.5680.612
Education and Research Facility Accessibility−0.168[−0.452, 0.147]0.2940.378
Medical and Health Facility Accessibility−0.437[−0.656, −0.149]0.0050.014
Social Welfare Facility Accessibility−0.236[−0.507, 0.077]0.1380.276
Transportation Facility Accessibility0.031[−0.279, 0.335]0.8470.847
Total Facility Accessibility−0.359[−0.600, −0.057]0.0210.0497
Notes: Pearson’s r values and unadjusted p-values were obtained from two-sided tests. The 95% confidence intervals were calculated using Fisher’s z transformation. The p-values were adjusted across the 14 correlation tests using the Benjamini–Hochberg false discovery rate procedure. CI, confidence interval; FDR, false discovery rate.
Disclaimer/Publisher’s Note: The statements, opinions and data contained in all publications are solely those of the individual author(s) and contributor(s) and not of MDPI and/or the editor(s). MDPI and/or the editor(s) disclaim responsibility for any injury to people or property resulting from any ideas, methods, instructions or products referred to in the content.