1. Introduction
Small- and medium-sized enterprises (SMEs) operate in increasingly digital, customer-facing, and resource-constrained environments. Digital transformation has changed how firms communicate with customers, collect market information, organise internal processes, develop products and services, and create value [
1,
2,
3,
4]. For SMEs, however, digital transformation is not simply a matter of adopting new technologies. Many SMEs face limited financial resources, digital expertise, managerial capacity, and access to structured market information. Consequently, the sustainability value of digital technologies depends on whether firms can connect these technologies with customer understanding, innovation, organisational learning, external knowledge acquisition, and business performance.
Artificial intelligence (AI)-enabled customer tools and social media platforms have become important mechanisms through which SMEs interact with markets. AI chatbots can support automated customer communication, service responses, product or service presentation, marketing-content assistance, operational efficiency, and customer-information management [
5,
6,
7,
8]. Recent developments in generative AI-enabled customer service have further expanded the potential role of conversational technologies in customer interaction [
9]. Nevertheless, SMEs differ considerably in technological readiness and may use rule-based, AI-assisted, platform-integrated, or more advanced large language model-based chatbot functions. Accordingly, AI chatbot usage in this study refers broadly to the practical use of AI-enabled conversational tools in SME customer communication and business operations.
Social media marketing provides another accessible mechanism for customer interaction. SMEs use social media to strengthen brand visibility, communicate product and service information, obtain customer feedback, develop relationships, and reach target markets at comparatively low cost [
10,
11,
12,
13,
14]. Social media marketing therefore functions not only as a promotional channel but also as a source of customer and market information. Customer value anticipation complements these digital interaction mechanisms but represents a conceptually different capability. Whereas AI chatbot usage and social media marketing provide channels through which SMEs interact with customers, customer value anticipation reflects the internal strategic ability to interpret customer signals, identify emerging expectations, and anticipate the value that customers may seek from future products, services, and interactions [
15,
16,
17,
18,
19].
Previous research has established that digital technologies, customer knowledge, service innovation, organisational learning, external networks, and business performance can contribute to SME competitiveness and sustainability [
3,
4,
14,
17,
20,
21,
22,
23,
24,
25,
26,
27]. Resource-based and dynamic capability perspectives explain that resources create sustained value when firms can integrate, deploy, and reconfigure them in response to environmental change [
20,
21,
22,
28]. The knowledge-based view and organisational learning perspectives further explain that information must be acquired, shared, interpreted, and applied before it becomes organisational knowledge or supports innovation [
24,
29,
30,
31,
32,
33,
34]. Open business model research similarly emphasises the importance of knowledge flows involving customers, partners, suppliers, platforms, and other external actors [
28,
35,
36,
37,
38].
Despite these advances, three connected theoretical gaps remain.
First, previous studies frequently examine AI adoption, social media use, customer orientation, innovation, learning, performance, and sustainability through separate relationships. This fragmented treatment provides limited explanation of the process through which customer-facing digital interaction and strategic customer sensing are converted into an internal organisational capability. AI chatbot usage and social media marketing may provide customer access and information, while customer value anticipation may support interpretation of customer signals. However, these mechanisms cannot be assumed to produce sustainable value unless SMEs can transform the resulting information into service improvement, learning routines, organisational action, and performance outcomes. The first unresolved issue is therefore not whether digital technologies are used, but how their information and interaction benefits are converted into internal transformation capability.
Second, service innovation and internal learning are usually distinguishable conceptually, but their relationship may be particularly close in resource-constrained SMEs. Service innovation concerns the development or improvement of products, services, processes, and delivery methods, whereas internal learning concerns the acquisition, sharing, and application of knowledge within the firm [
17,
23,
24,
29,
30]. In SMEs, however, service improvement may occur through informal experimentation, employee knowledge sharing, operational adjustment, customer-feedback interpretation, and continuous learning rather than through separate formal innovation and learning systems. Existing research provides limited explanation of whether service innovation and internal learning remain independent capabilities or function as tightly coupled routines through which SMEs convert knowledge into practical business adaptation.
Third, most studies of SME digital transformation and sustainability rely primarily on net-effect reasoning. Such models assess whether an independent variable has a statistically positive or negative relationship with an outcome across a sample. This approach is important for testing hypothesised relationships, but it may not fully represent the differences among SMEs. Firms may reach business sustainability through different combinations of digital interaction, strategic customer sensing, internal transformation, external learning, and performance capabilities. A capability that is statistically significant on average may not be necessary in every successful SME, while one capability may compensate for the weakness or absence of another. Consequently, a complete explanation requires both analysis of average relationships and analysis of alternative sufficient configurations [
39,
40,
41,
42,
43].
These gaps also reveal why the theoretical perspectives underpinning this study are useful individually but do not fully explain the problem when considered separately. Resource-based and dynamic capability perspectives explain why valuable resources and organisational reconfiguration matter, but they do not by themselves specify how customer-facing digital interactions are converted into learning and service innovation in SMEs. Knowledge-based and organisational learning perspectives explain the acquisition and application of knowledge, but they provide less direct explanation of how different capability combinations may produce equivalent sustainability outcomes. Open business model logic explains the strategic relevance of knowledge crossing organisational boundaries, but external knowledge supports sustainability only when firms can interpret, absorb, and convert it into internal routines and business performance. Integrating these perspectives therefore enables the study to examine not only the resources possessed by SMEs, but also the capability-conversion processes and alternative configurations through which those resources may support sustainability.
To address these gaps, this study develops and tests a sequential capability framework for Thai SMEs. AI chatbot usage and social media marketing are positioned as customer-facing digital interaction mechanisms, while customer value anticipation is positioned as an internal strategic customer-sensing capability. Service innovation and internal learning represent the internal processes through which customer and market information may be converted into service improvement, knowledge application, and business action. These two constructs were initially treated as conceptually distinct during instrument development, while the quantitative measurement assessment subsequently examined whether their empirical separation remained defensible. The final model represents their empirically consolidated form as service innovation–internal learning capability (SILC). External learning, business performance, and business sustainability represent the downstream learning, viability, and sustainability components of the proposed capability pathway.
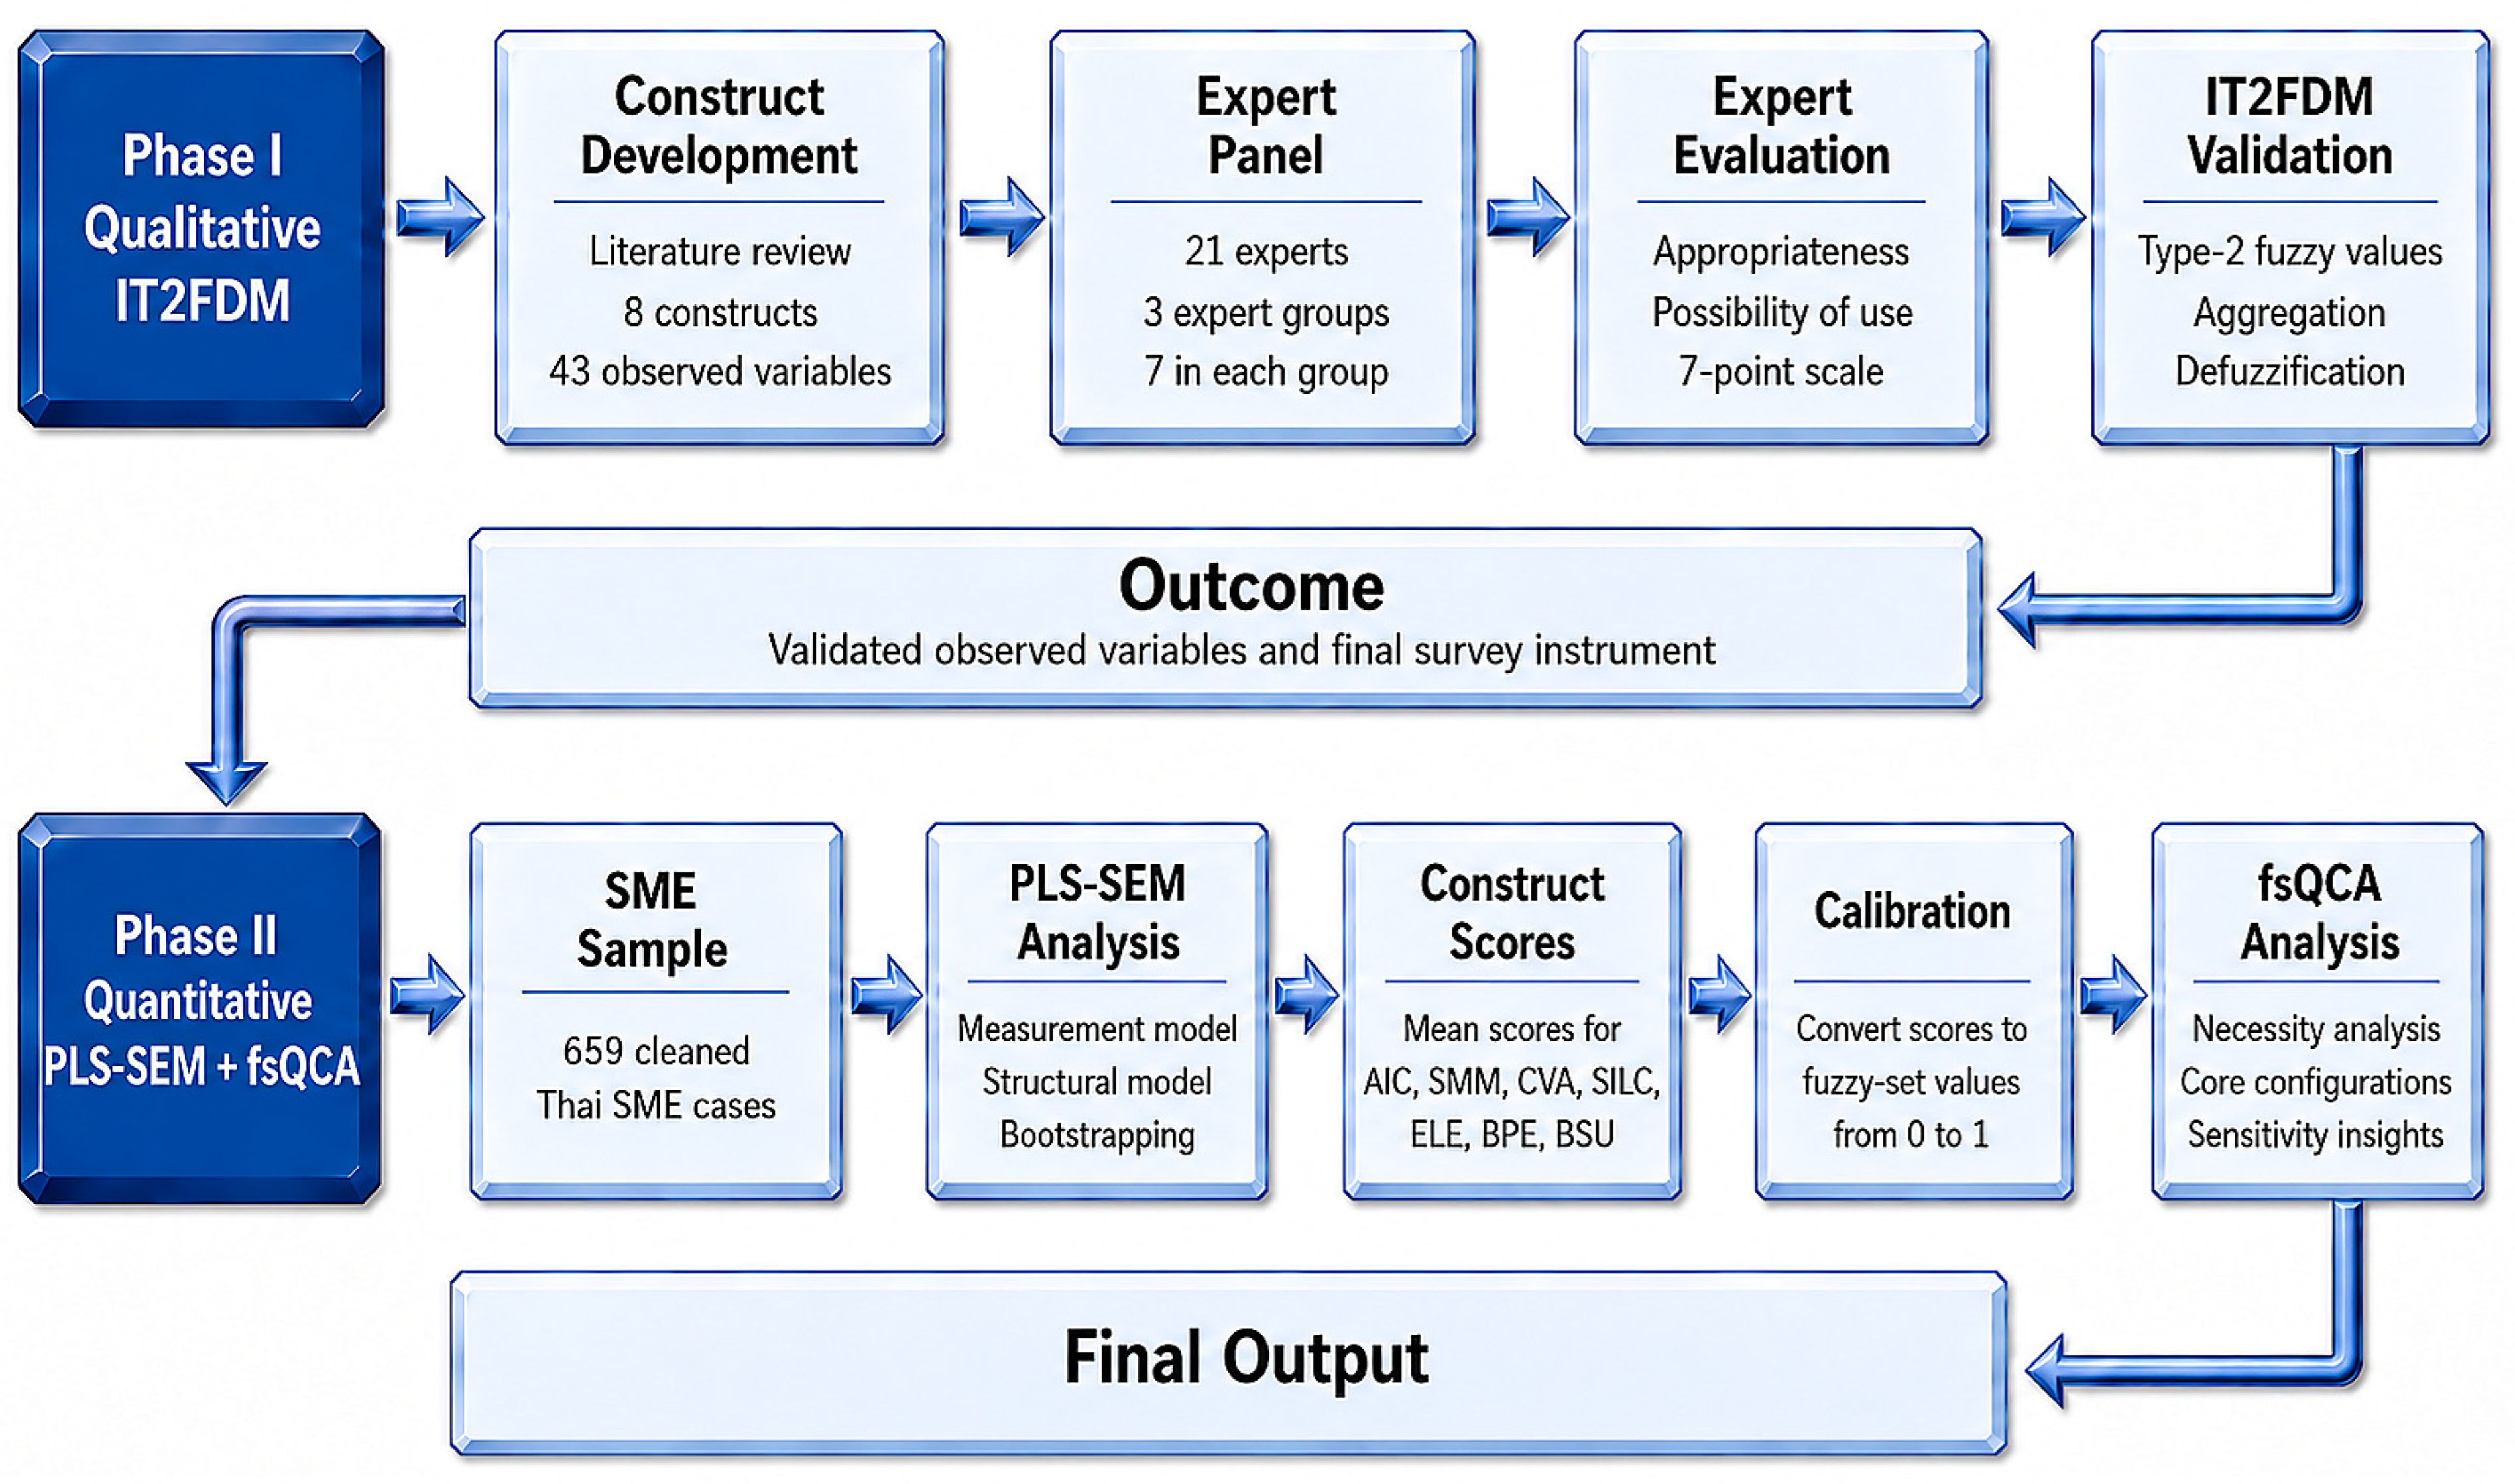
The study applies three sequential analytical stages because each addresses a different part of the research problem. First, the Interval Type-2 Fuzzy Delphi Method (IT2FDM) is used to assess whether the proposed observed variables are conceptually appropriate and practically applicable to the Thai SME context under conditions of expert-judgement uncertainty. This validation stage is necessary because the instrument integrates indicators from multiple literature streams—including AI, social media marketing, customer value, innovation, organisational learning, performance, and sustainability—and applies them within one SME capability framework. Second, Partial Least Squares Structural Equation Modelling (PLS-SEM) is used to assess the measurement properties of the constructs and test the hypothesised net-effect relationships. Third, fuzzy-set Qualitative Comparative Analysis (fsQCA) is used to identify alternative combinations of conditions associated with high business sustainability [
39,
40,
41,
42,
44,
45,
46]. The methods are therefore complementary: IT2FDM addresses contextual measurement suitability, PLS-SEM addresses relationships across the full sample, and fsQCA addresses configurational heterogeneity.
This logic leads to three research questions with distinct but connected purposes. RQ1 addresses the methodological requirement for contextual measurement validation. RQ2 addresses the capability-conversion process and the relationships among digital interaction, customer sensing, internal transformation, external learning, performance, and sustainability. RQ3 addresses the possibility that different capability configurations can lead to the same sustainability outcome.
RQ1: Which observed variables do experts validate as conceptually appropriate and practically applicable for measuring the proposed SME capability framework?
RQ2: How do AI chatbot usage, social media marketing, customer value anticipation, service innovation–internal learning capability, external learning, and business performance relate to business sustainability in the PLS-SEM model?
RQ3: Which combinations of digital interaction, strategic customer sensing, innovation–learning capability, external learning, and business performance are associated with high business sustainability among Thai SMEs?
The study makes three principal theoretical contributions corresponding to the identified theoretical gaps and substantive findings.
First, the study advances the explanation of SME digital transformation from digital adoption to capability conversion. It distinguishes customer-facing interaction mechanisms—AI chatbot usage and social media marketing—from customer value anticipation as an internal strategic sensing capability and examines how these mechanisms are converted through SILC into external learning, business performance, and business sustainability. The contribution therefore lies not in asserting that digital technologies independently generate sustainability, but in explaining the internal capability pathway through which customer interaction and customer knowledge can acquire organisational value.
Second, the study refines capability and organisational learning reasoning through the concept of integrated innovation–learning transformation. The empirical consolidation of service innovation and internal learning into SILC indicates that these processes may function as tightly coupled routines in resource-constrained SMEs. This provides a basis for understanding service innovation not only as an output of learning, but as part of an integrated internal capability through which knowledge is converted into service improvement, operational adaptation, and business action.
Third, the study contributes a configurational and compensatory explanation of SME business sustainability. By combining PLS-SEM and fsQCA, it distinguishes between capabilities that have statistically significant average relationships and capabilities that are necessary or sufficient within particular combinations. This dual explanation recognises equifinality and allows the study to identify whether strong internal transformation, external learning, and performance capabilities can compensate for weaker digital or customer-facing conditions in some SMEs.
The Thai SME setting provides a relevant emerging-market context in which these capability-conversion and configurational questions are particularly important because firms commonly face limitations in financial, technological, and managerial resources. Methodologically, the sequential integration of IT2FDM, PLS-SEM, and fsQCA provides complementary evidence concerning measurement suitability, net-effect relationships, and alternative sustainability pathways. These contextual and methodological features support the three principal theoretical contributions but are not presented as substitutes for them.
2. Literature Review and Theoretical Background
2.1. Overview of Study Constructs
Table 1 defines the constructs used in this study and clarifies their operational scope. The constructs are organised according to their roles in the proposed capability pathway. AI chatbot usage (AIC) and social media marketing (SMM) represent customer-facing digital interaction mechanisms. Customer value anticipation (CVA) represents an internal strategic customer-sensing capability through which SMEs interpret customer signals and anticipate future value expectations. Service innovation–internal learning capability (SILC) represents the internal transformation capability that converts digital interaction and strategic customer insight into service improvement, learning routines, and business action. External learning (ELE), business performance (BPE), and business sustainability (BSU) represent the downstream learning, viability, and sustainability outcomes of the model.
In Phase I, service innovation and internal learning were treated as conceptually distinct constructs. However, the PLS-SEM measurement assessment later indicated that these two constructs formed a single empirical dimension in the survey data. Therefore, the final quantitative model uses SILC as a consolidated internal capability construct.
2.2. Theoretical Foundations for Digital, Learning, and Sustainability Configurations
This study is grounded in a capability-based explanation of SME business sustainability. Resource-based logic suggests that firms achieve superior outcomes when they possess valuable, rare, difficult-to-imitate, and organisationally embedded resources [
20,
21,
22,
28]. However, in SME digital transformation contexts, digital tools alone rarely constitute a sustainable advantage. AI chatbot usage and social media marketing can be imitated, outsourced, or adopted through widely available platforms. Their value depends on whether SMEs can integrate them with customer understanding, internal learning, service innovation, external knowledge acquisition, and performance management [
48,
49].
Dynamic capability theory extends this logic by emphasising how firms sense opportunities, seize them, and reconfigure resources under changing environments. This perspective is especially relevant to SMEs because digital markets change rapidly, while SMEs often face limited financial, technical, and managerial resources. In this study, AIC and SMM are positioned as customer-facing digital interaction mechanisms that support market contact and customer communication. CVA is positioned as an internal strategic customer-sensing capability that helps SMEs interpret customer signals and anticipate future value expectations. SILC then represents the internal transformation capability through which these signals are converted into service improvement and learning routines.
The knowledge-based view and organisational learning literature provide a further foundation. Digital information and customer feedback do not automatically create value; they must be acquired, shared, interpreted, and applied within the firm [
24,
29,
30,
31,
32,
33,
34,
50]. Internal learning enables SMEs to convert customer and market information into operational knowledge, while external learning allows SMEs to access knowledge from customers, partners, suppliers, platforms, and business networks. Therefore, this study treats learning not as a background condition but as a central mechanism connecting digital interaction, strategic customer sensing, performance, and sustainability.
Open business model logic also supports the framework. SMEs often lack the resource depth of larger firms, making knowledge flows across organisational boundaries important for innovation and sustainability [
28,
35,
36,
37,
38]. Customer feedback, social media interaction, chatbot data, partner knowledge, and platform-based learning can all contribute to value creation. However, open business model logic requires stronger empirical explanation in SME contexts because external knowledge only supports sustainability when it is absorbed and converted into internal capability and business performance. This study addresses that gap by linking digital interaction, strategic customer sensing, internal transformation, external learning, and sustainability outcomes in one integrated framework.
2.3. Digital Interaction, Strategic Customer Sensing, and Open Business Models
Digital transformation has reshaped how SMEs communicate with customers, collect market information, and create value [
1,
2,
3,
4]. In this study, digital customer interaction is represented by AI chatbot usage and social media marketing. AI chatbot usage refers to the use of AI-enabled conversational tools to support customer communication, automated responses, product or service presentation, operational support, and responsible customer-information handling. The construct is defined broadly because SMEs may use different levels of chatbot sophistication, including rule-based chatbots, AI-assisted chatbots, platform-integrated chatbot functions, and emerging generative AI-enabled or large language model (LLM)-based chatbot applications [
5,
8,
9]. Therefore, the construct captures the practical level of AI-enabled chatbot use among SMEs rather than assuming that all respondents use advanced generative AI systems.
Social media marketing represents another customer-facing digital interaction mechanism. For SMEs, social media is not only a promotional channel; it also supports customer relationship development, customer feedback collection, market visibility, and low-cost communication [
10,
11,
12,
13,
14]. Social media platforms allow SMEs to observe customer preferences, communicate product and service information, and respond to changes in market demand.
CVA differs from AIC and SMM because it is not simply an external customer-facing tool. It is an internal strategic customer-sensing capability. CVA reflects the firm’s ability to interpret customer signals, anticipate future customer expectations, and use this insight in product, service, and business decisions [
15,
16,
17,
18,
19]. Therefore, AIC and SMM provide interaction channels, while CVA reflects strategic interpretation of customer knowledge.
From an open business model perspective, these three conditions represent different ways in which SMEs access, interpret, and use knowledge beyond organisational boundaries. AIC and SMM help SMEs interact with customers and collect external signals, while CVA helps SMEs convert those signals into internal strategic understanding. This distinction is important because customer interaction alone does not create sustainability unless the firm can translate the information into innovation, learning, performance, and long-term adaptation.
2.4. Service Innovation–Internal Learning Capability and Digital Value Creation
Digital interaction and strategic customer sensing do not automatically produce business sustainability. SMEs must transform customer and market information into improved services, internal routines, and business action. Service innovation reflects the development or improvement of products, services, delivery methods, and customer-facing processes. Internal learning reflects knowledge acquisition, sharing, and application within the firm [
17,
23,
24,
29,
30]. Although these constructs can be conceptually separated, they may operate together in SMEs because service improvement often occurs through informal learning routines, practical experimentation, employee knowledge sharing, and operational adjustment.
The final quantitative model therefore uses SILC as an integrated internal transformation capability. SILC captures the mechanism through which SMEs convert digital interaction, customer-value insight, and internal knowledge into practical innovation and learning-based improvement. This framing is consistent with capability and organisational learning logic because the value of digital tools depends on how firms transform information into routines, capabilities, and action.
This theoretical refinement also responds to the empirical structure observed in the data. The initial model treated service innovation and internal learning as separate constructs, but the measurement assessment showed that they were not sufficiently distinct. Rather than forcing two empirically overlapping constructs to remain separate, the final model treats SILC as a more defensible representation of how Thai SMEs integrate service improvement and internal learning in practice.
2.5. External Learning, Business Performance, and Business Sustainability
External learning is included because SMEs rarely depend only on internal knowledge. They often acquire useful knowledge from customers, suppliers, partners, industry networks, platforms, universities, government agencies, and SME support ecosystems [
24,
27,
31,
32]. External learning allows SMEs to access ideas, practices, and market information that may not be available internally. It therefore represents the capability to learn from external actors and complements SILC.
Business performance is included as an economic and operational viability mechanism. Business sustainability requires long-term adaptation, but SMEs cannot sustain digital transformation, learning routines, or innovation if these efforts are not connected to performance outcomes [
3,
4,
28,
51]. BPE therefore represents the market, operational, financial, and customer-related outcomes that allow SMEs to continue investing in capability development.
BSU is the final outcome because the study focuses on long-term SME viability and responsible business development rather than short-term performance alone. In this model, sustainability is not treated as the direct result of technology adoption. Instead, it is explained through a sequence in which digital interaction and strategic customer sensing support SILC, SILC supports external learning and performance, and these capabilities contribute to sustainability [
25,
26,
50].
2.6. PLS-SEM and fsQCA as Complementary Approaches
The theoretical logic of the study requires both net-effect and configurational explanation. PLS-SEM is suitable for testing whether the hypothesised relationships among AIC, SMM, CVA, SILC, ELE, BPE, and BSU are statistically supported across the full sample. It provides evidence on measurement quality, path coefficients, indirect effects, explanatory power, and model reliability [
44,
45,
46].
However, SME sustainability may not follow one single pathway. Different SMEs may achieve sustainability through different combinations of digital interaction, strategic customer sensing, internal transformation, external learning, and performance. fsQCA is therefore used to identify sufficient configurations leading to high business sustainability. This approach recognises equifinality, conjunctural causation, and causal asymmetry [
39,
40,
41,
42,
43]. In practical terms, it allows the study to examine whether different combinations of conditions can lead to the same sustainability outcome.
The use of both methods is therefore not intended to demonstrate methodological complexity for its own sake. PLS-SEM answers whether the proposed relationships are statistically supported, while fsQCA answers which combinations of capabilities are sufficient for business sustainability. Together, they provide a fuller explanation of SME sustainability than either method alone.
2.7. Conceptual Framework, Hypotheses, and Configurational Proposition
The conceptual framework follows the theoretical logic that SME business sustainability depends on the alignment of digital interaction, strategic customer sensing, internal transformation, external learning, and business performance. AIC and SMM are expected to support SILC because digital interaction provides customer communication, feedback, service information, and market contact. CVA is also expected to support SILC because strategic interpretation of customer value helps SMEs identify how services, processes, and offerings should be improved.
SILC is expected to support ELE because internal learning and service innovation make SMEs more capable of acquiring, absorbing, and using knowledge from external actors. SILC is also expected to support BPE and BSU because internal transformation capability helps firms improve service quality, operational responsiveness, customer value creation, and adaptive capacity. ELE is expected to support BPE because external knowledge can strengthen market responsiveness, operational improvement, and competitiveness. BPE is expected to support BSU because financial, operational, and customer-related performance provides the viability foundation for sustained business development.
Accordingly, the PLS-SEM component tests the following hypotheses: H1—AIC positively affects SILC. H2—SMM positively affects SILC. H3—CVA positively affects SILC. H4—SILC positively affects ELE. H5—SILC positively affects BPE. H6—SILC positively affects BSU. H7—ELE positively affects BPE. H8—BPE positively affects BSU.
The fsQCA component complements these hypotheses by recognising that SMEs may achieve business sustainability through different combinations of conditions. Therefore, the configurational proposition is as follows: SME business sustainability is linked to multiple combinations of digital interaction, strategic customer-sensing, internal transformation, external learning, and performance conditions rather than any single condition alone.
4. Results
4.1. Results of Phase I: Interval Type-2 Fuzzy Delphi Validation
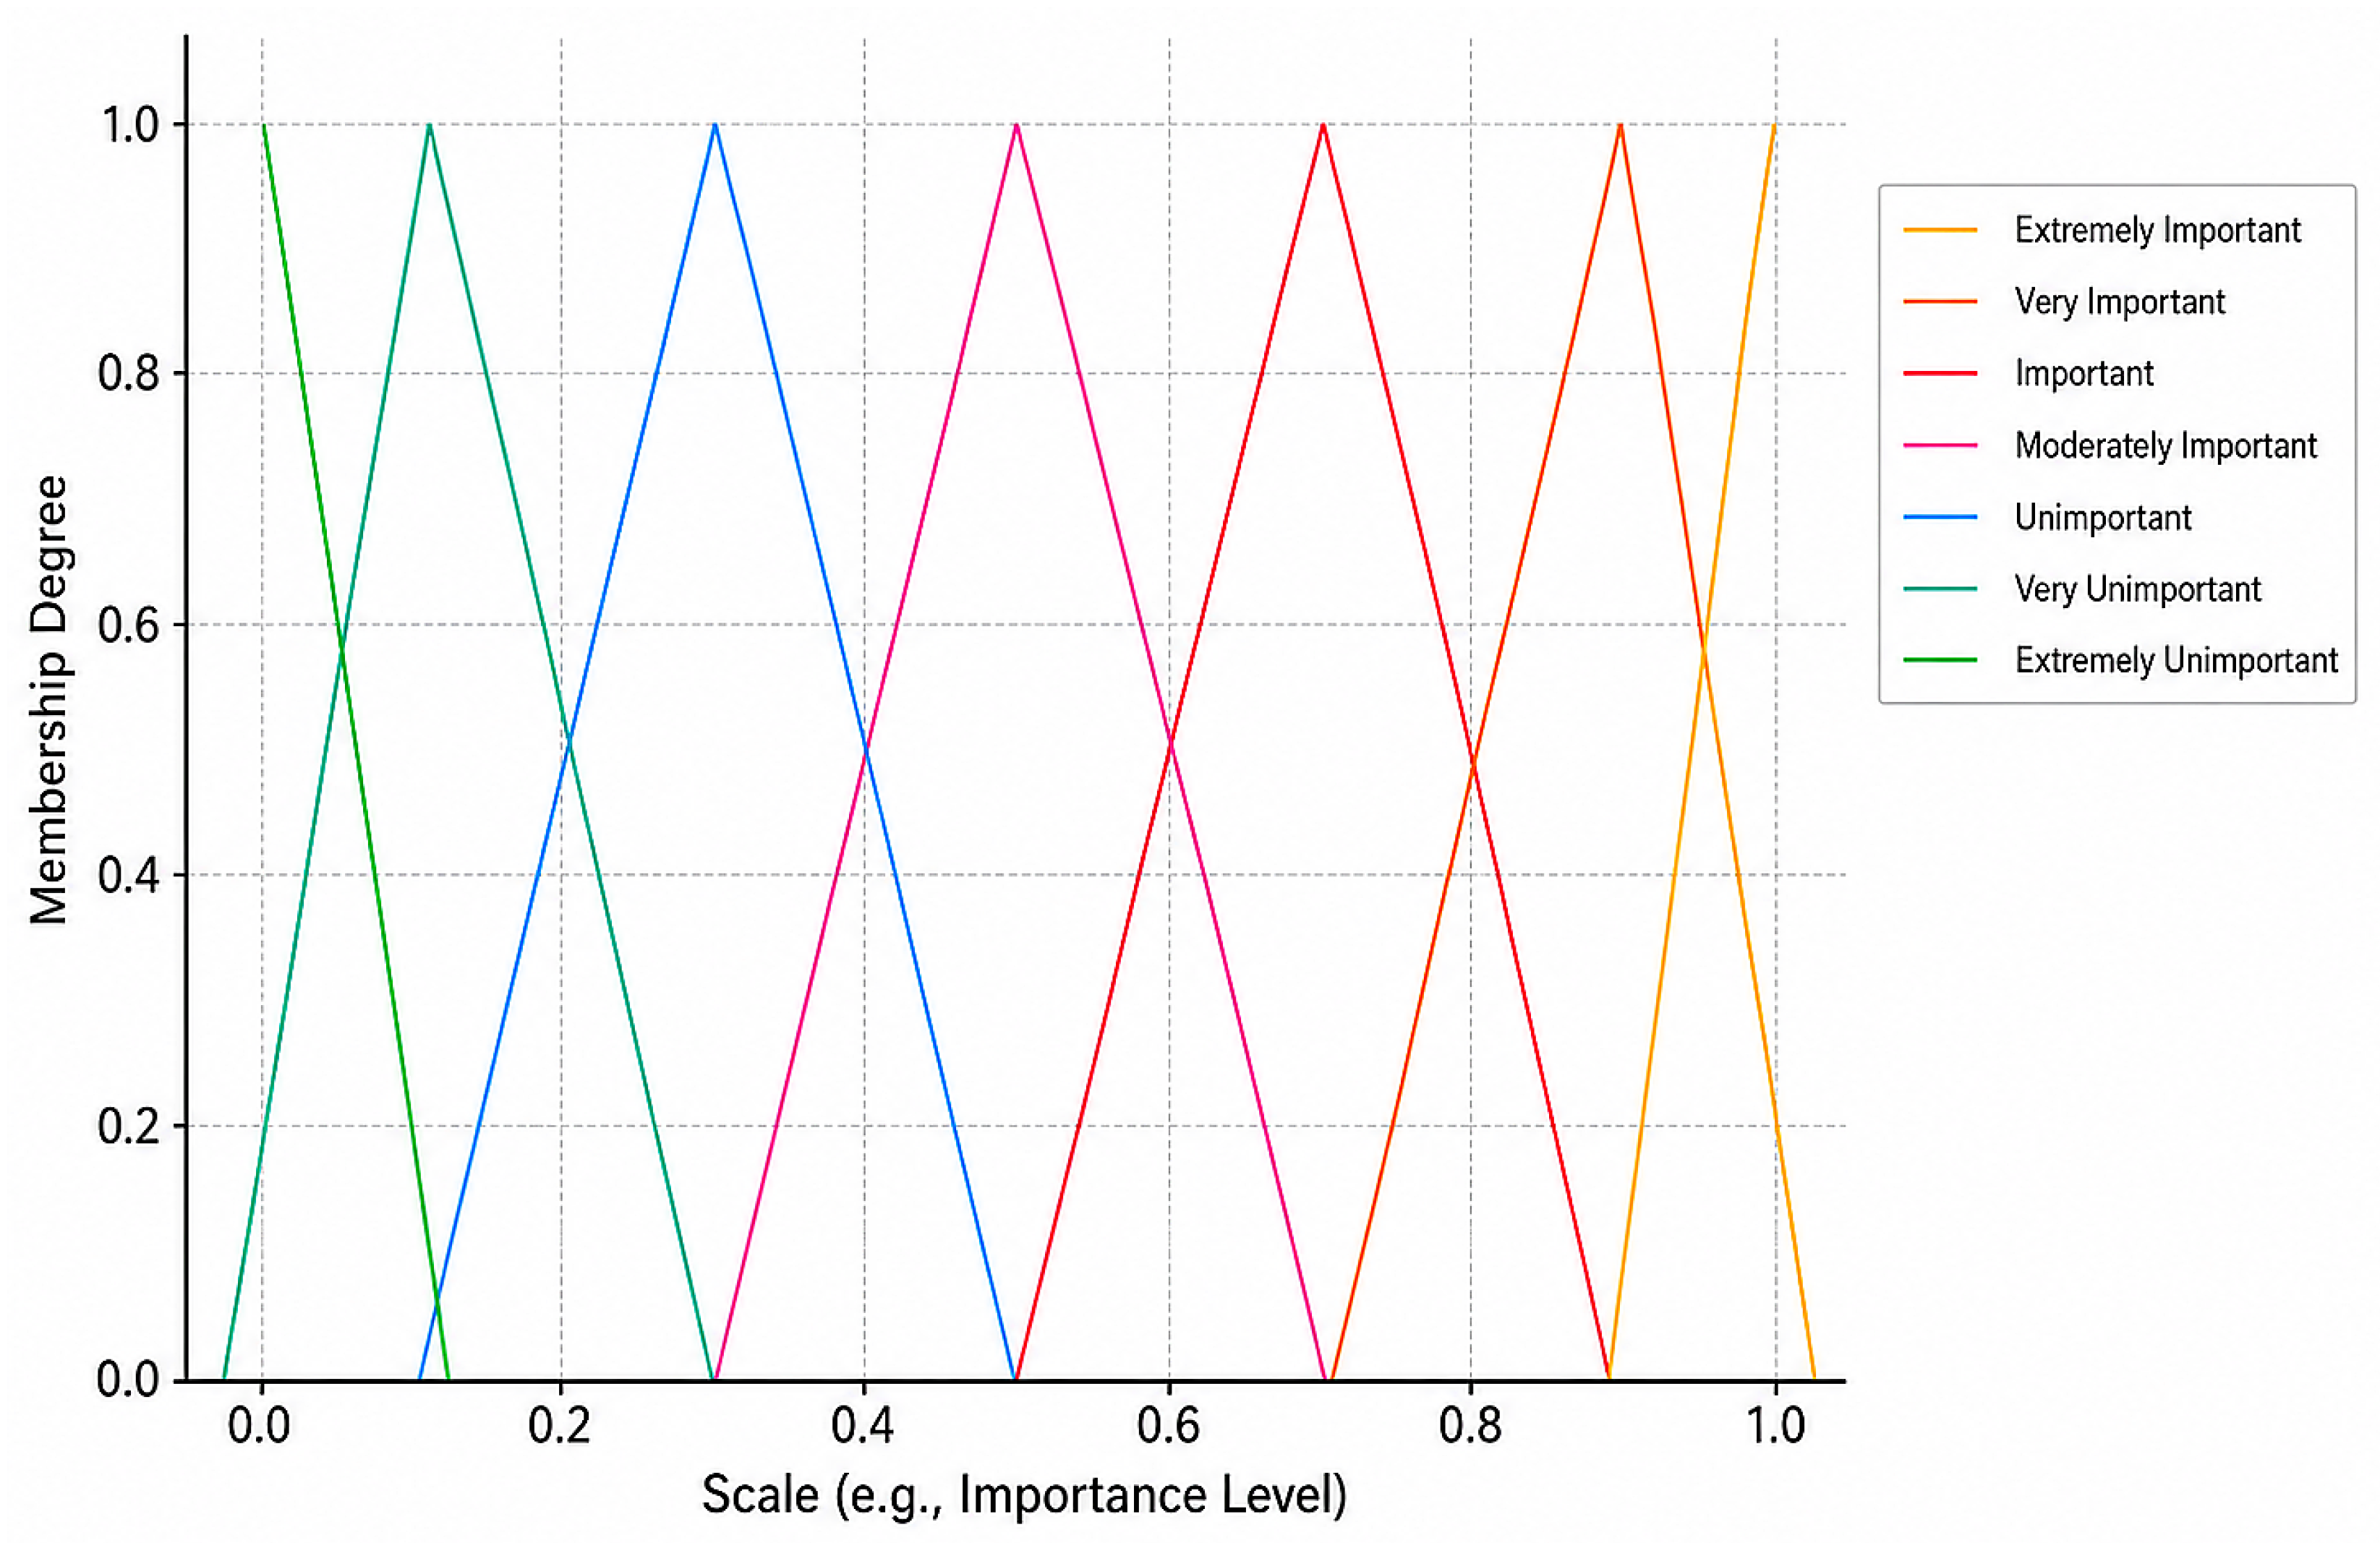
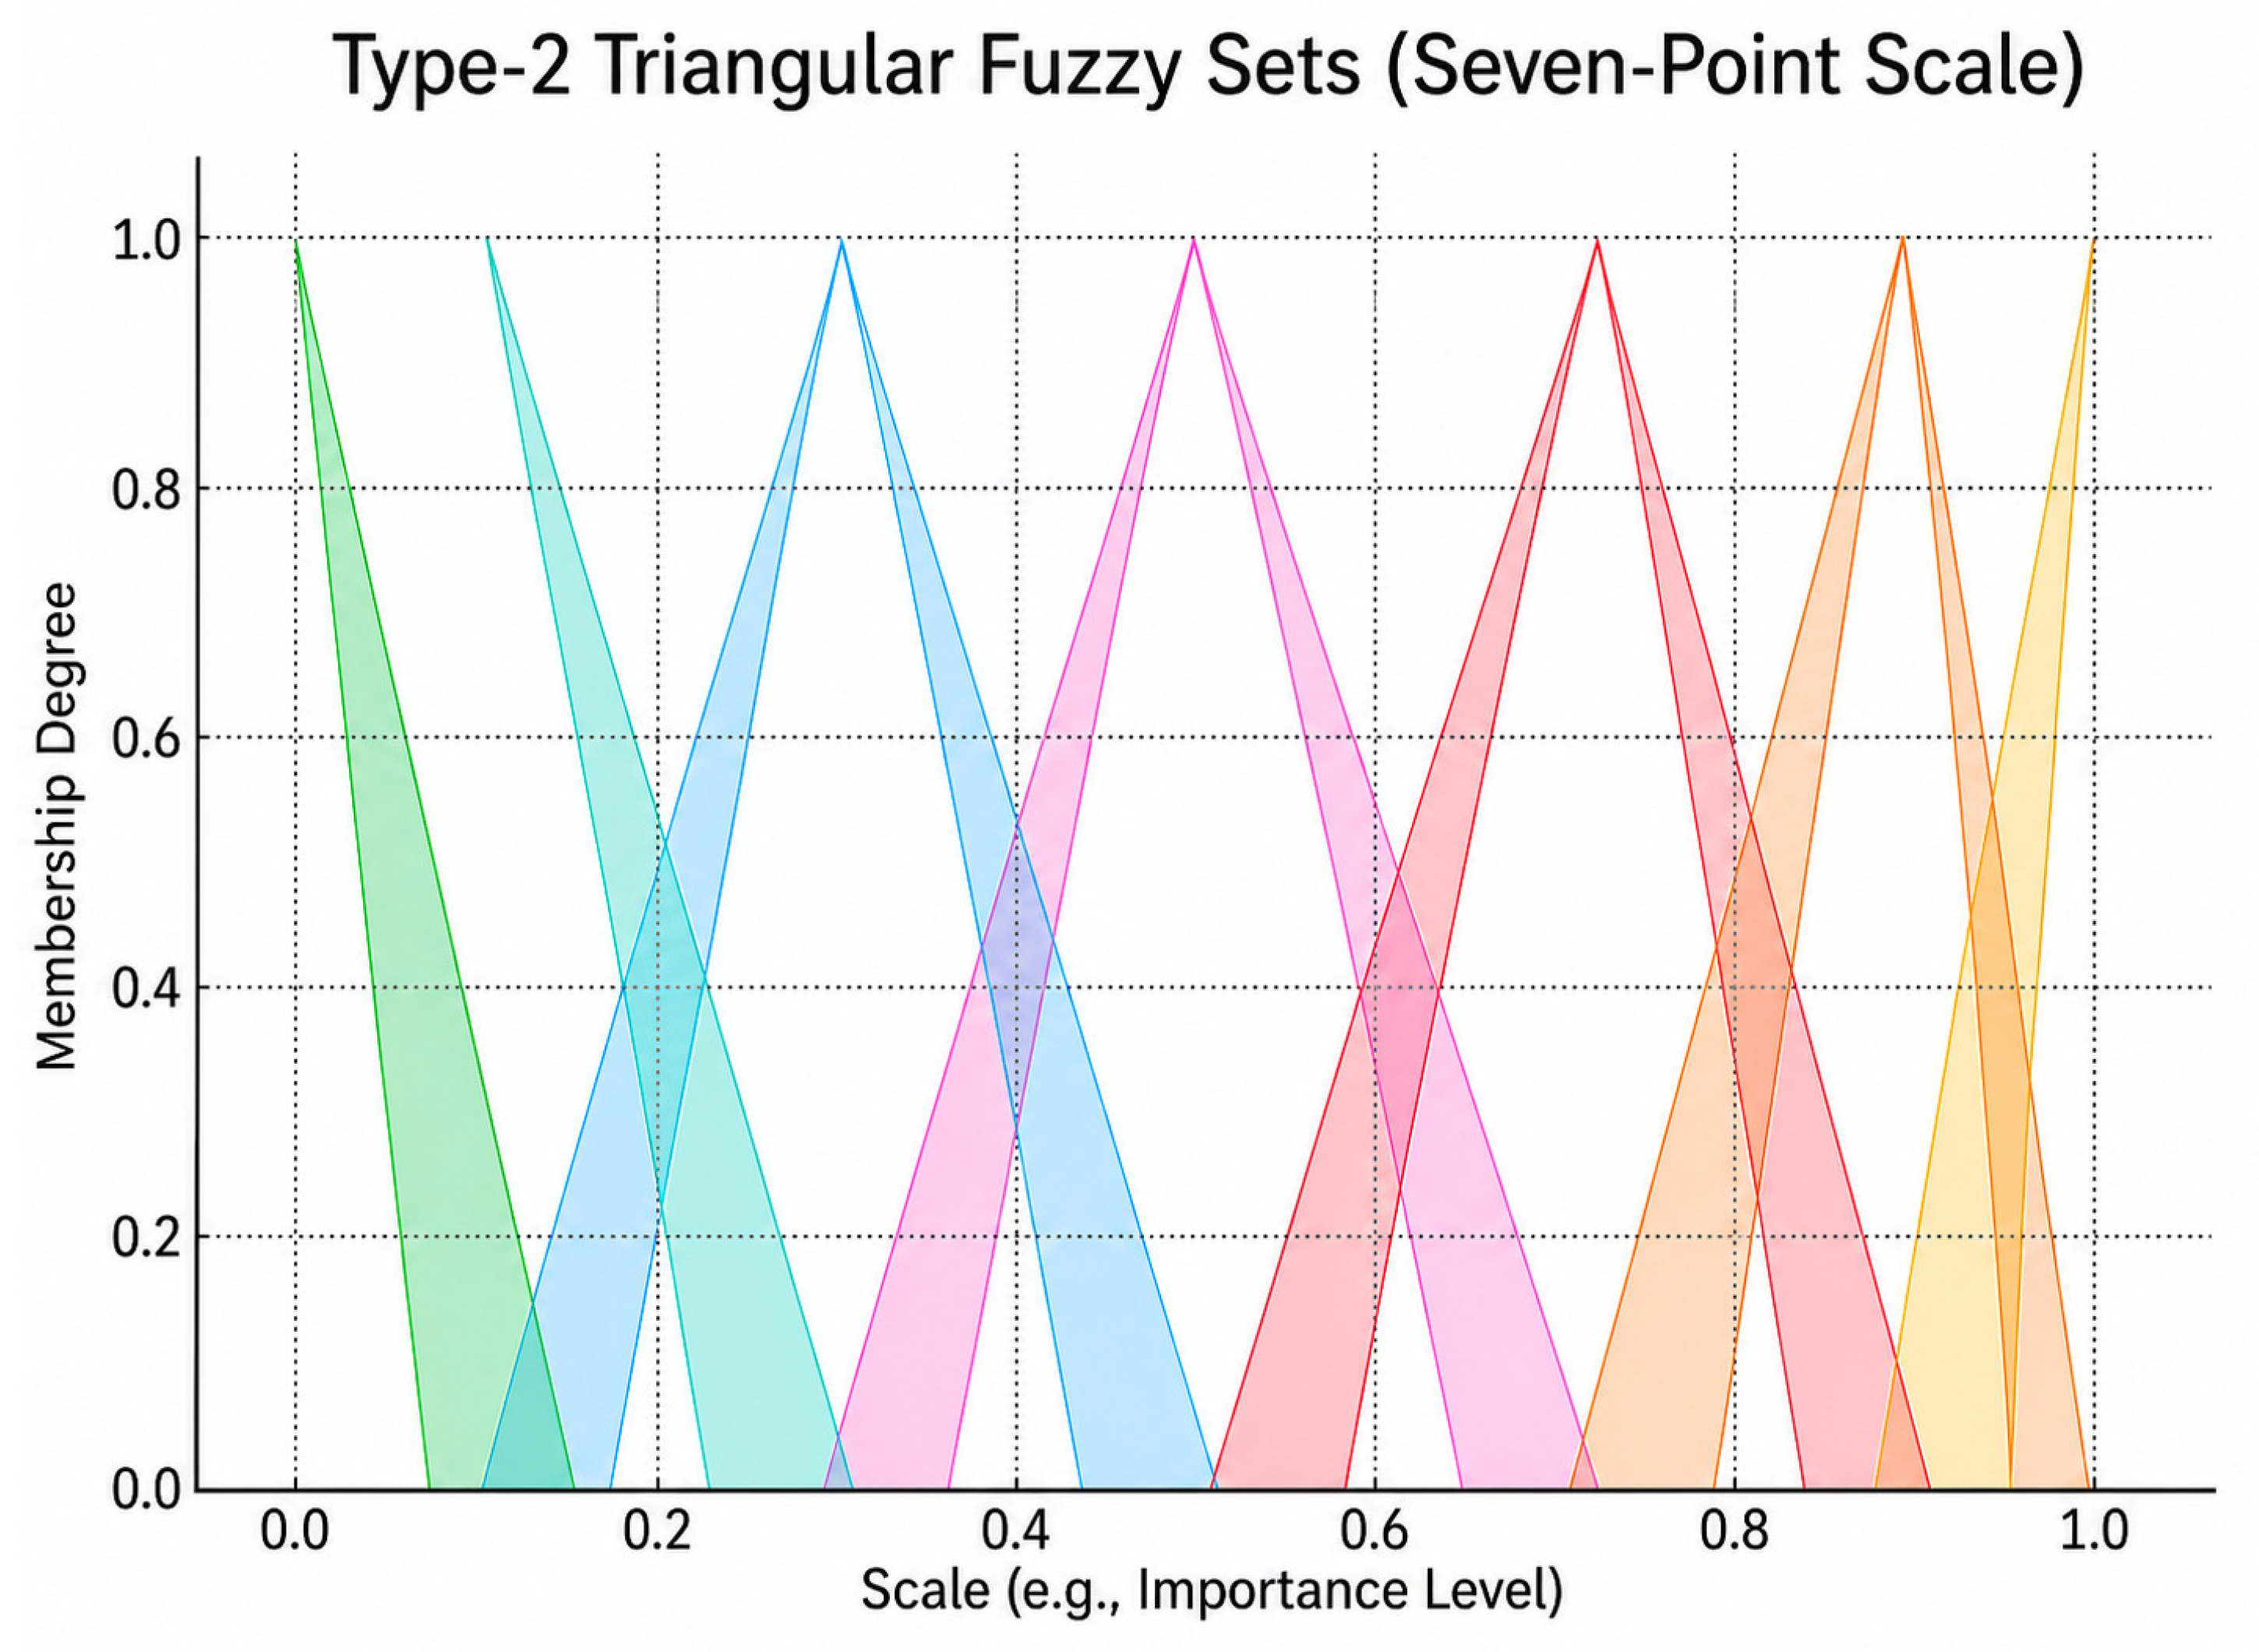
In Phase I, we applied the IT2FDM to validate the observed variables. Each expert evaluated 43 observed variables from 2 perspectives: appropriateness and the possibility of application in SME survey research. The final IT2FDM score was calculated using the lower value between the two scores. The acceptance threshold was 0.65.
All 43 observed variables exceeded the required threshold. The final IT2FDM scores ranged from 0.836 to 0.925, indicating strong expert agreement. Therefore, all 43 observed variables were retained for the Phase II survey instrument.
The IT2FDM validation results are summarised in
Table 2.
4.2. PLS-SEM Measurement Model
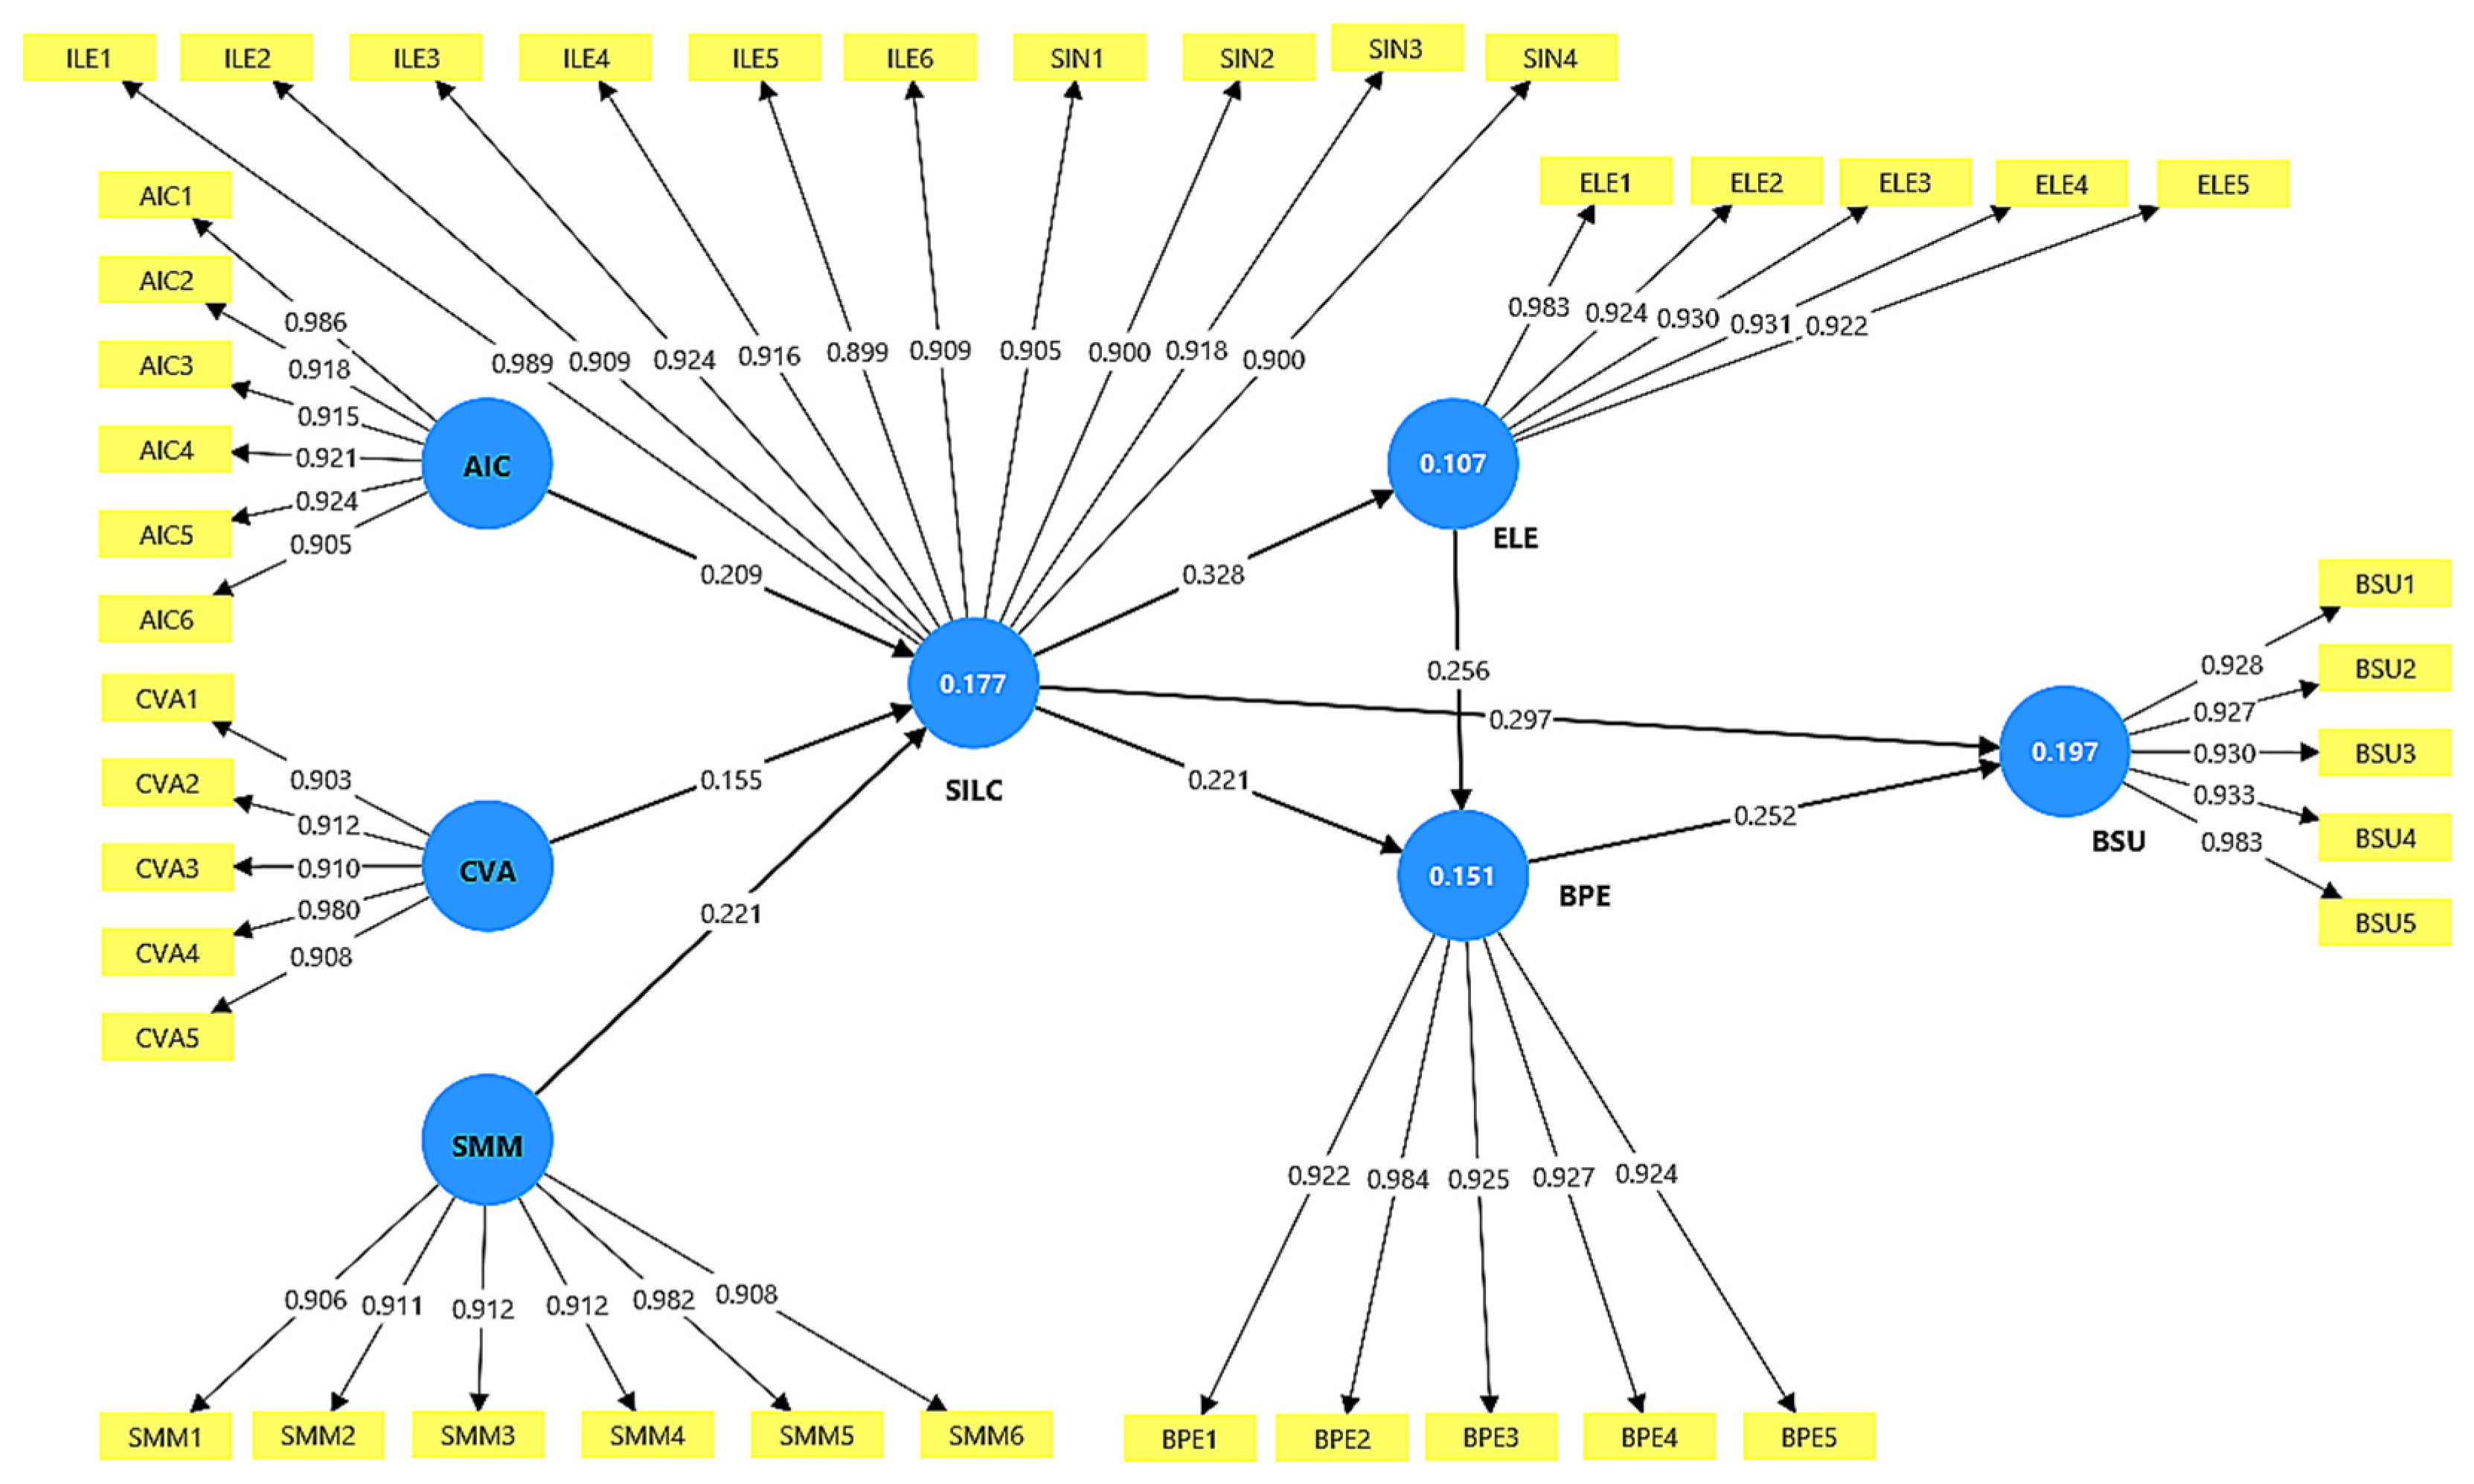
The PLS-SEM measurement model was assessed before testing the structural model. All retained indicator loadings ranged from 0.899 to 0.989. Reliability and convergent validity were satisfactory, with Cronbach’s alpha values between 0.956 and 0.979, composite reliability values between 0.966 and 0.981, and AVE values between 0.841 and 0.885. These values support the reliability and convergent validity of the final measurement model; however, they are interpreted cautiously because very high reliability may also indicate conceptual proximity among retained indicators.
Before estimating the final PLS-SEM structural model, the measurement model was refined based on the initial assessment of service innovation and internal learning.
Table 3 summarises the diagnostic evidence and revision decisions that led to the final SILC construct.
The final SILC construct demonstrated satisfactory measurement quality. Its retained indicators loaded between 0.899 and 0.989, with Cronbach’s alpha of 0.979, composite reliability of 0.981, and AVE of 0.841. These results support the use of SILC as an integrated internal capability construct in the final PLS-SEM and fsQCA analyses. Detailed diagnostic evidence is provided in
Supplementary Materials, Table S2.
The reliability and convergent validity results for the final measurement model are reported in
Table 4.
Discriminant validity was also supported. The maximum HTMT value was 0.384, which is below the conservative 0.850 threshold and the more liberal 0.900 threshold. The Fornell-Larcker results also showed that the square root of AVE for each construct was greater than its correlations with other constructs. Therefore, the final model provides evidence that the retained constructs were empirically distinguishable after the measurement refinement process.
Selected HTMT ratios are reported in
Table 5.
4.3. PLS-SEM Structural Model
The final PLS-SEM structural model tested eight hypotheses. All direct paths were statistically significant at p < 0.001. The strongest direct relationship was that between SILC and ELE (beta = 0.328), followed those between SILC and BSU (beta = 0.297), ELE and BPE (beta = 0.256), BPE and BSU (beta = 0.252), SMM and SILC (beta = 0.221), SILC and BPE (beta = 0.221), AIC and SILC (beta = 0.209), and CVA and SILC (beta = 0.155).
The final PLS-SEM structural model is shown in
Figure 4.
Table 6 reports the bootstrapped direct path results for the final PLS-SEM structural model.
Table 7 summarises the explanatory power, collinearity assessment, and effect-size results for the endogenous constructs.
The R-square values indicate that the model explained 17.7% of SILC, 10.7% of ELE, 15.1% of BPE, and 19.7% of BSU. These values are modest and should be interpreted in relation to the theoretical scope of the study. The model does not aim to explain all determinants of SME sustainability; rather, it focuses on a specific capability pathway linking customer-facing digital interaction, strategic customer-sensing capability, internal transformation capability, external learning, business performance, and business sustainability. The modest explanatory power therefore suggests that other organisational, financial, institutional, market, and environmental factors may also contribute to SME sustainability. Inner VIF values were low, ranging from 1.000 to 1.133, indicating that structural collinearity was not a concern.
The indirect effects were also significant. AIC, SMM, and CVA influenced BSU indirectly through SILC and downstream paths. SILC also showed both direct and indirect links on BSU through ELE and BPE, confirming that the internal capability mechanism is central to the model.
Selected indirect effects are reported in
Table 8.
4.4. fsQCA Calibration and Necessity Analysis
The fsQCA analysis used the revised condition set AIC, SMM, CVA, SILC, ELE, and BPE, with BSU set as the outcome. Calibration transformed raw construct scores into fuzzy-set membership values using the 95th, 50th, and 5th percentiles as full membership, crossover, and full non-membership anchors, respectively.
The calibration thresholds are reported in
Table 9.
Necessity analysis showed that no single present or absent/low condition reached the 0.90 necessity threshold. Therefore, business sustainability is better explained by combinations of conditions rather than any single required factor.
The necessity-analysis results are summarised in
Table 10.
4.5. Core fsQCA Configurations Leading to Business Sustainability
The primary fsQCA model applied a frequency threshold of five cases, a raw consistency threshold of 0.800, and a PRI consistency threshold of 0.700. The complex, parsimonious, and intermediate solutions were identical. The intermediate solution identified three configurations leading to business sustainability, with solution coverage of 0.491 and solution consistency of 0.883.
The three primary configurations are reported in
Table 11.
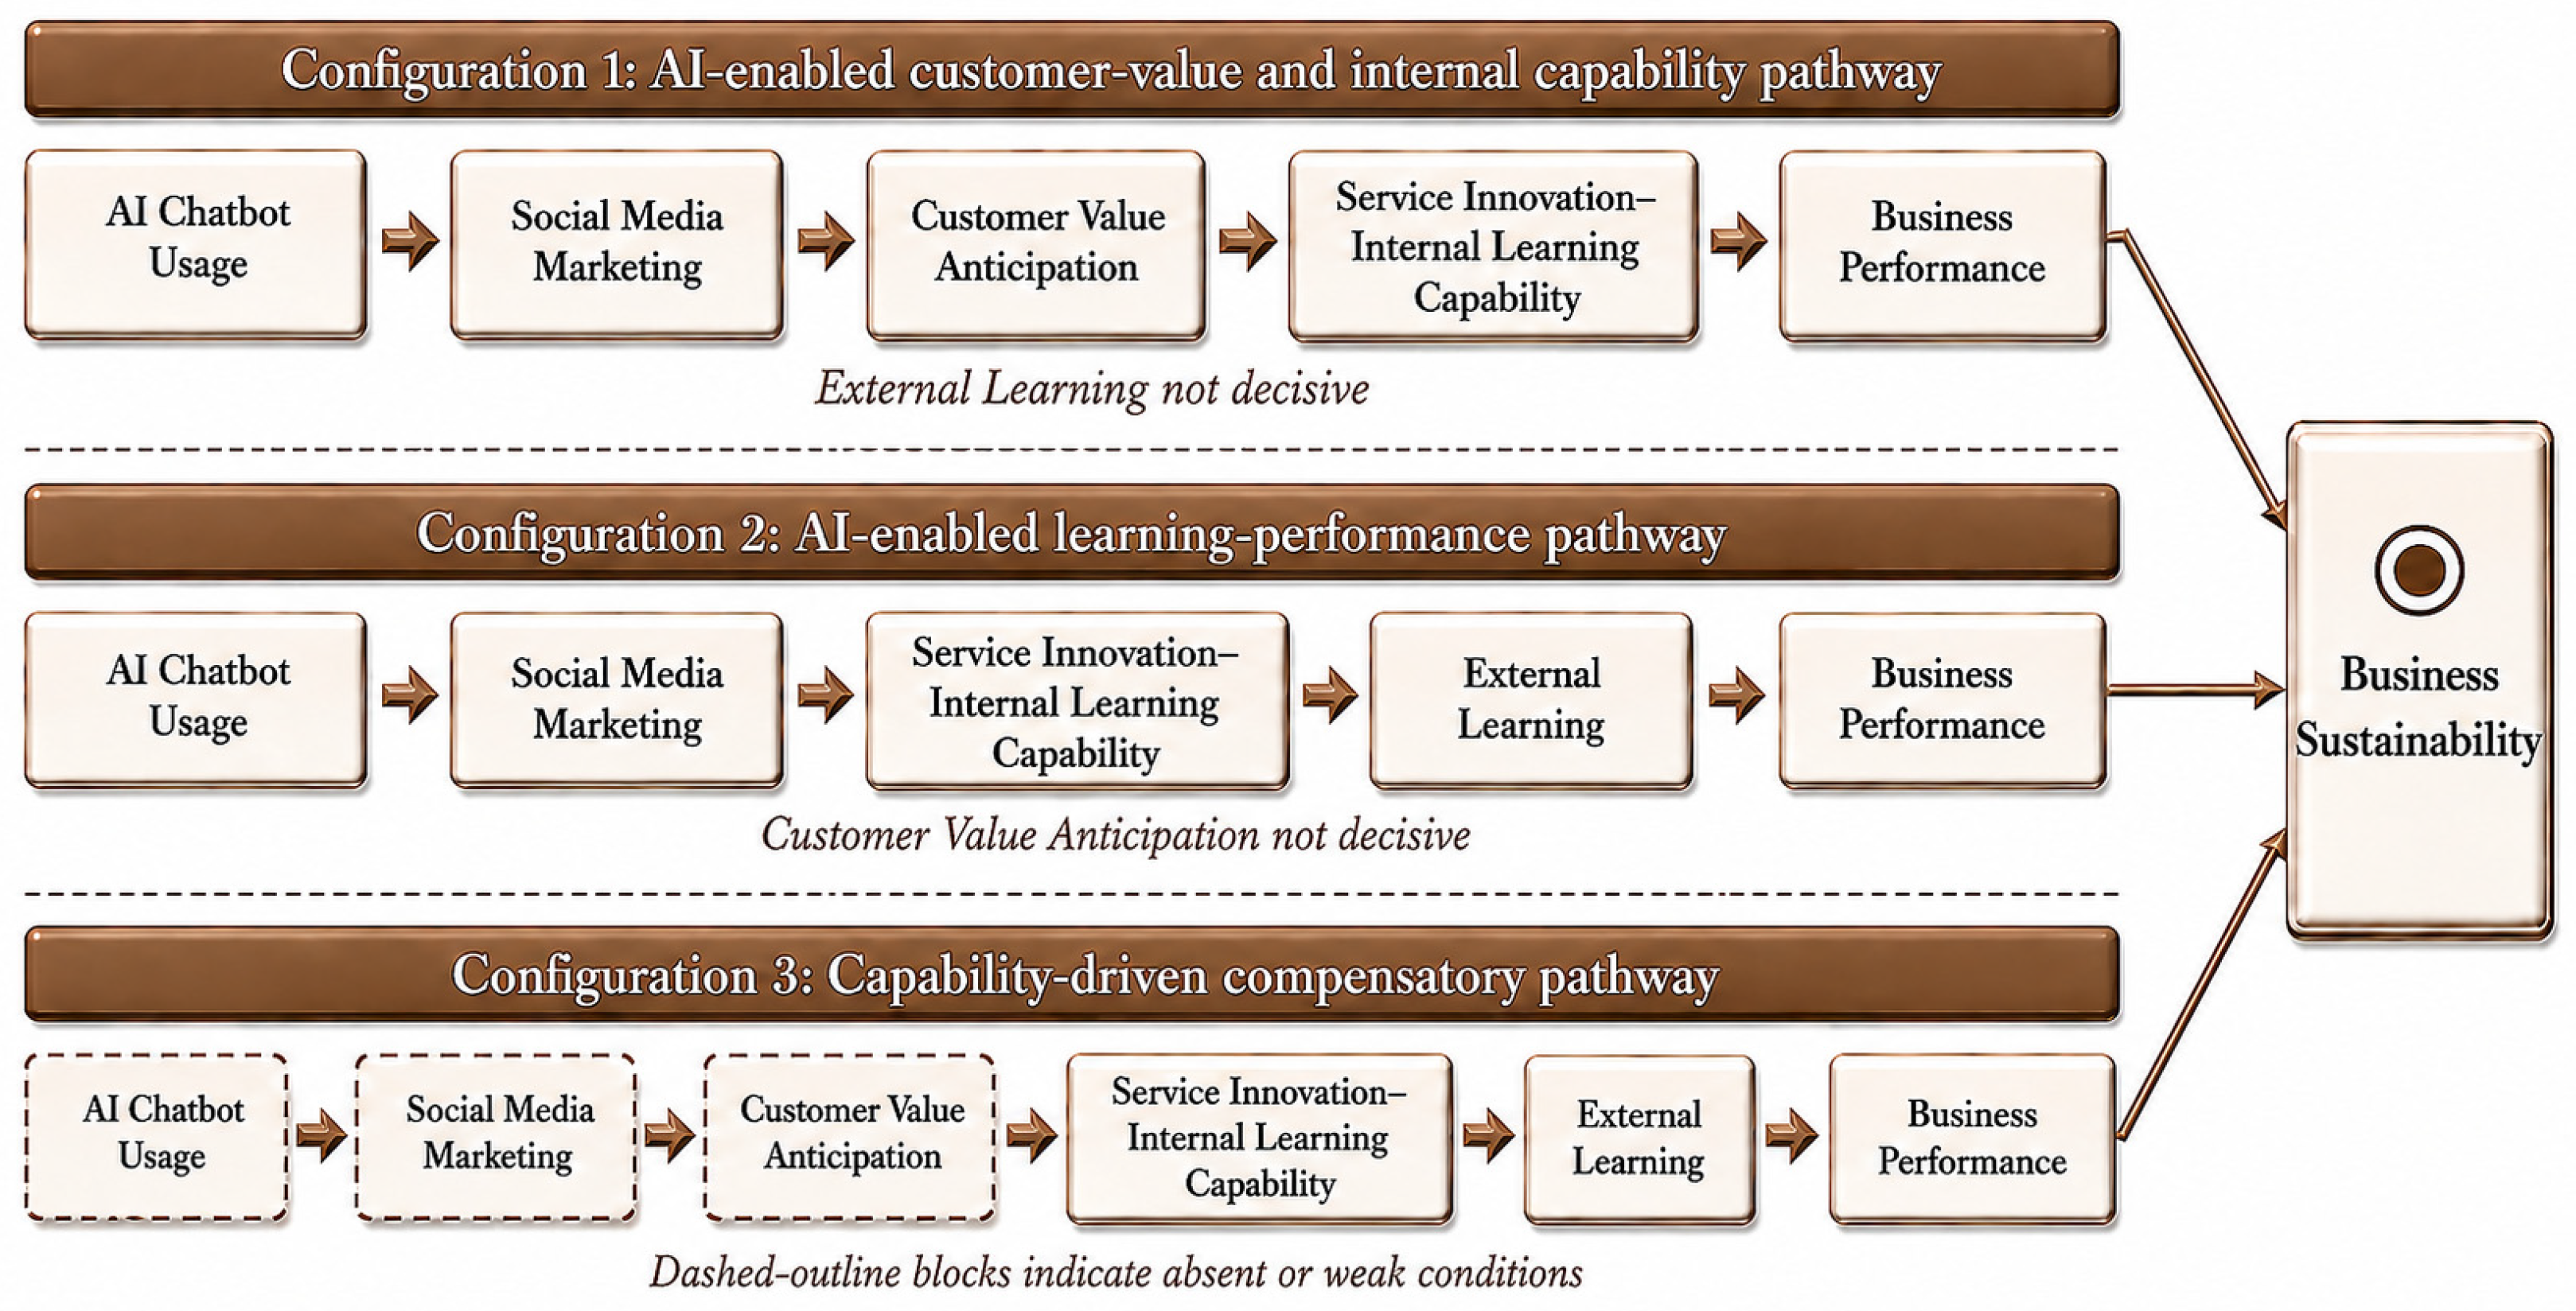
Configuration 1 is an AI-enabled customer value and internal capability pathway combining AIC, SMM, CVA, SILC, and BPE. Configuration 2 is an AI-enabled learning-performance pathway combining AIC, SMM, SILC, ELE, and BPE. Configuration 3 is a capability-driven compensatory pathway in which AIC, SMM, and CVA are absent/low, while SILC, ELE, and BPE are present. This suggests that strong internal innovation-learning capability, external learning, and business performance can compensate for weaker digital/customer-facing conditions in some SMEs.
The three primary configurations are visualised in
Figure 5.
4.6. Robustness and Sensitivity Checks
Robustness and sensitivity checks were conducted because fsQCA solutions can be affected by calibration and threshold choices. The robustness check examined whether the main interpretation remained stable when the frequency threshold was increased from five to seven cases while retaining a raw consistency threshold of 0.800 and a PRI consistency threshold of 0.700. Two configurations remained unchanged, while the third shifted to a pathway combining SMM, CVA, SILC, ELE, and BPE. The robustness solution retained acceptable explanatory quality, with solution coverage of 0.470 and solution consistency of 0.899.
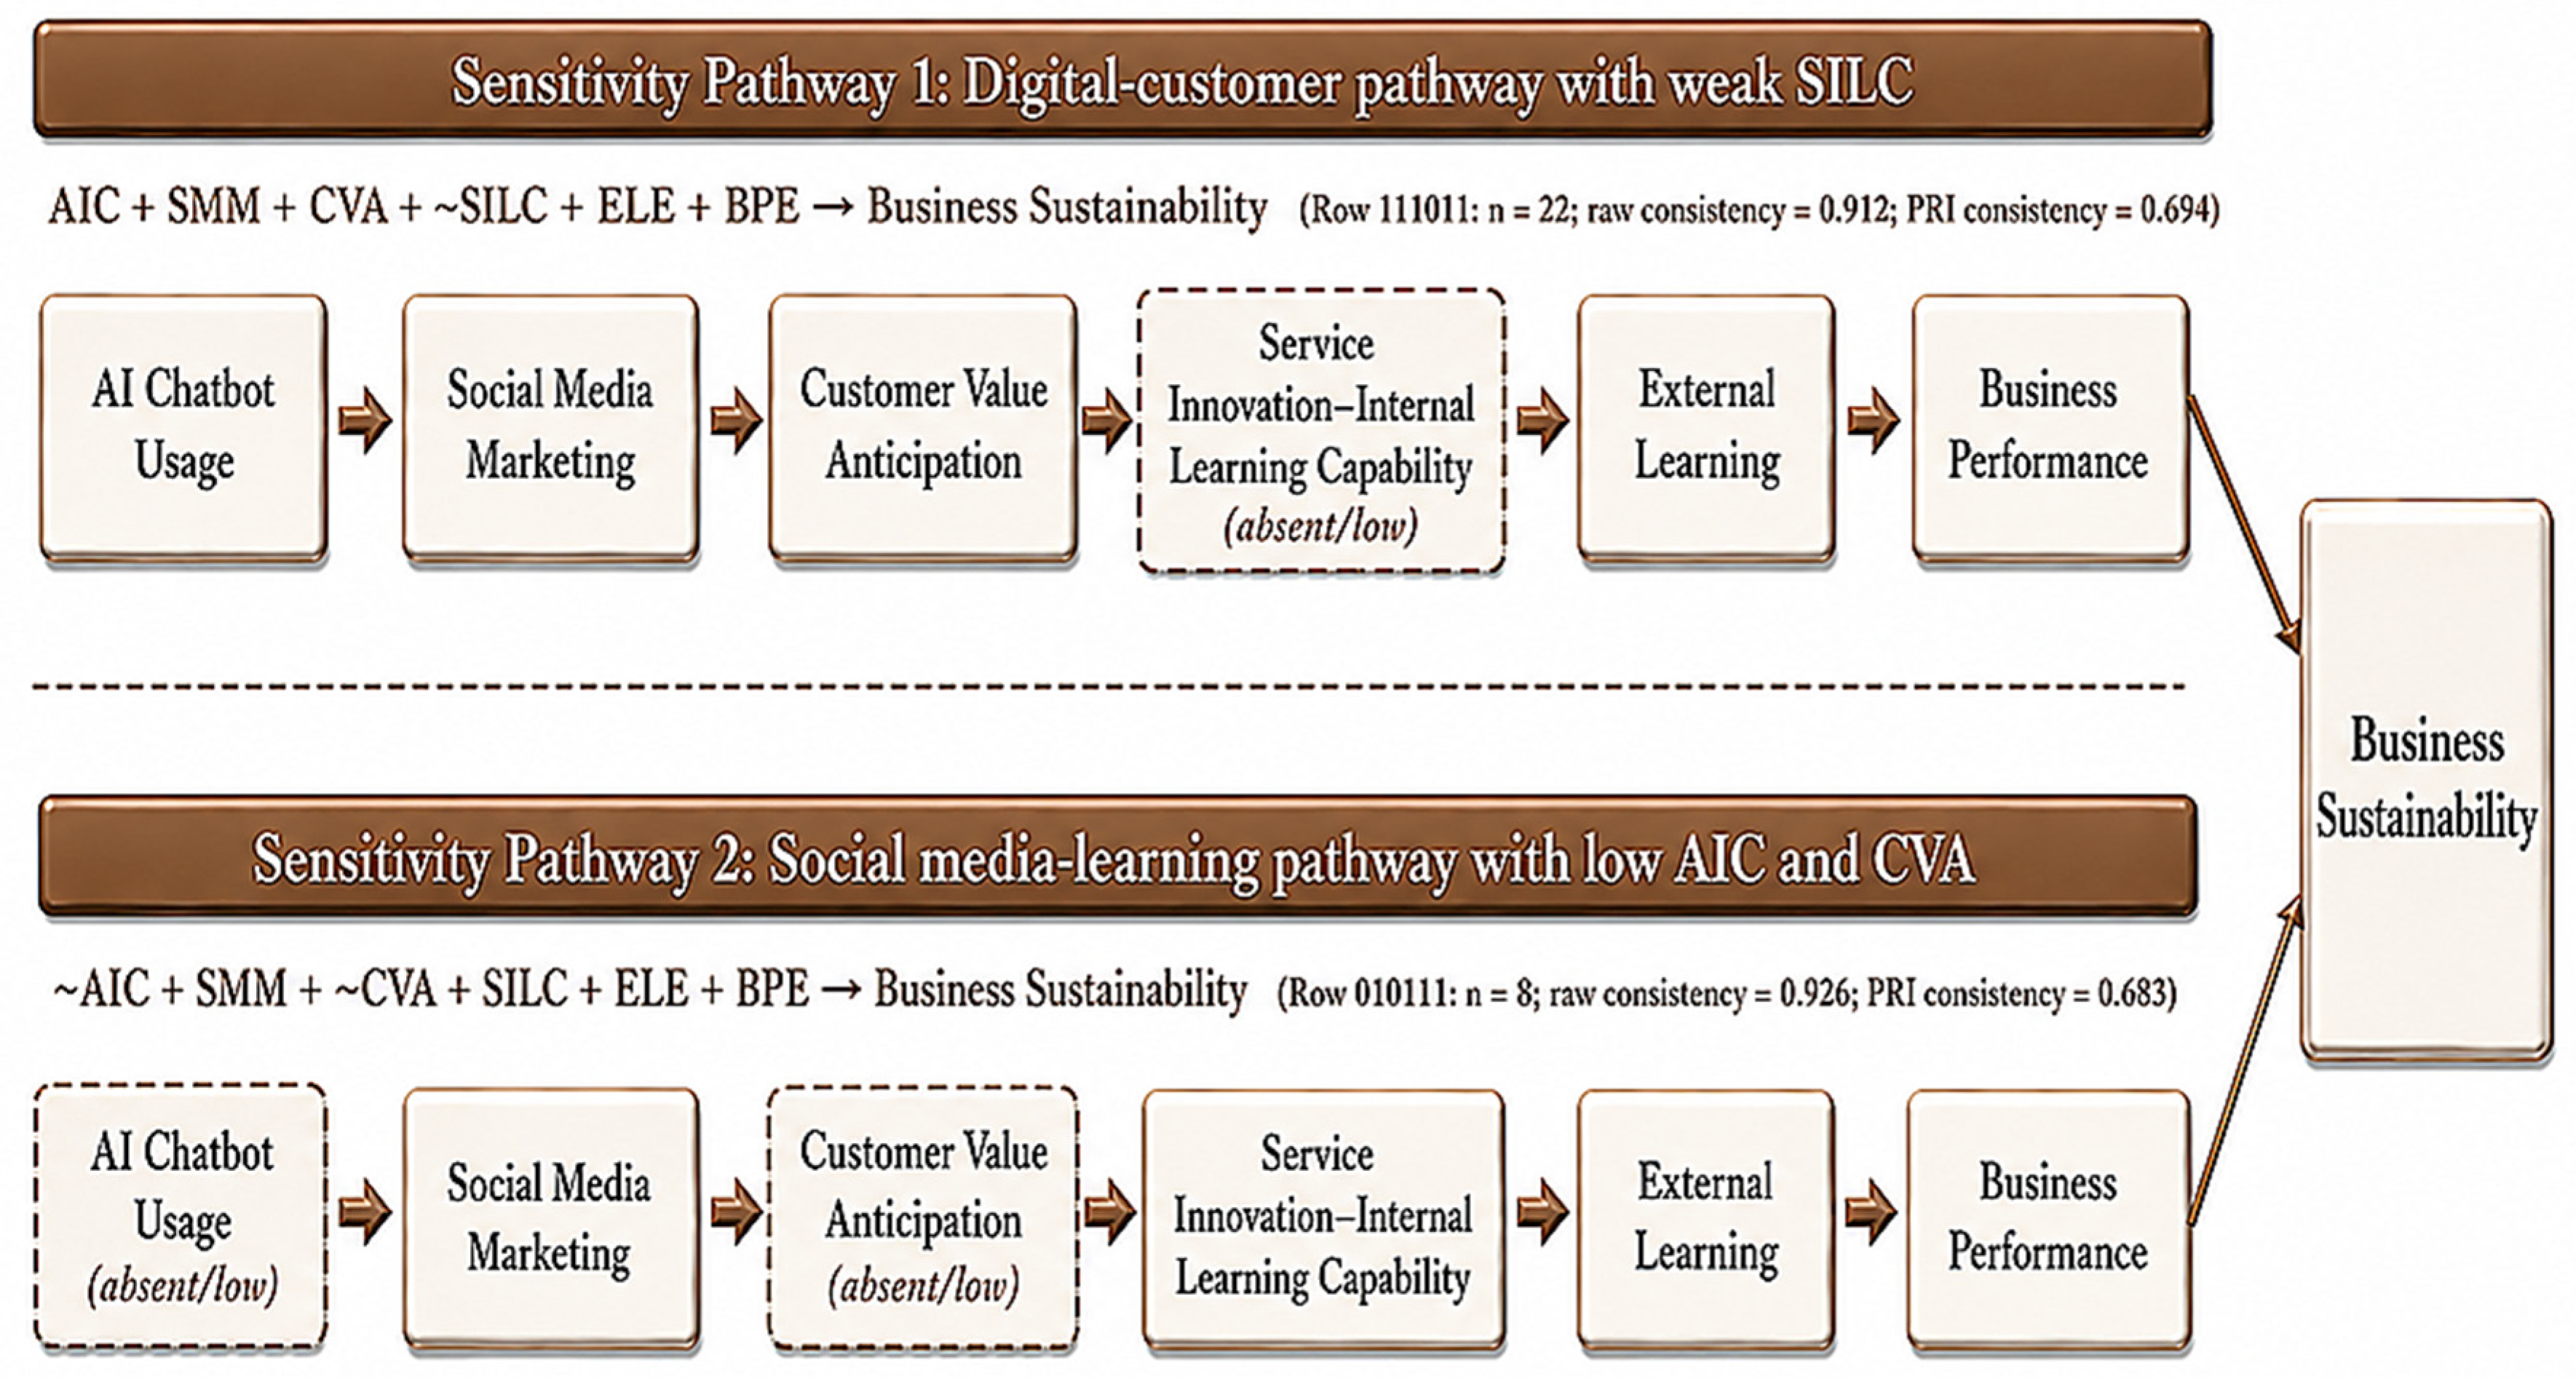
The sensitivity analysis relaxed the PRI consistency threshold from 0.700 to 0.650 to explore near-threshold pathways that may be meaningful for resource-constrained SMEs. This broader model increased solution coverage to 0.579 but reduced solution consistency to 0.856. Therefore, the primary fsQCA solution remains preferable because it is more conservative and theoretically clearer; the sensitivity results are interpreted only as supplementary near-threshold insights.
Table 12 reports the robustness and sensitivity assessment of the fsQCA solution. The primary solution identified three sufficient configurations, which are visualised in
Figure 5. The robustness check retained three configurations under a stricter frequency threshold, supporting the stability of the primary configurational logic. The sensitivity check produced six configurations under a relaxed PRI threshold; however,
Figure 6 visualises only two theoretically meaningful near-threshold pathways to illustrate how alternative sustainability pathways may emerge under less restrictive conditions. Therefore,
Figure 6 should be interpreted as an illustrative sensitivity insight rather than a complete visualisation of all six sensitivity configurations.
Figure 6 illustrates two near-threshold sensitivity pathways. The first pathway shows that AI chatbot usage, social media marketing, customer value anticipation, external learning, and business performance may still support business sustainability when SILC is absent or weak. The second pathway shows that social media marketing, SILC, external learning, and business performance may form a near-threshold pathway even when AI chatbot usage and customer value anticipation are absent or weak. These pathways are interpreted as sensitivity insights only, not as primary sufficient configurations.
4.7. Summary of Integrated Findings
The Phase I IT2FDM results confirmed that all 43 observed variables were valid and suitable for the Phase II survey. The PLS-SEM results supported all eight hypothesised paths and showed that SILC is the central mechanism linking AI chatbot usage, social media marketing, and customer value anticipation to external learning, business performance, and business sustainability. The fsQCA results showed that no single condition was necessary for achieving business sustainability, but three sufficient configurations were identified. Across the integrated results, SILC and BPE appear to be the most important mechanisms for explaining SME business sustainability.
5. Discussion
5.1. Interpretation and Critical Comparison of the Main Findings
This study examined how Thai SMEs connect customer-facing digital interaction, strategic customer sensing, internal innovation–learning capability, external learning, business performance, and business sustainability. The integrated findings show that SME sustainability cannot be adequately explained by technology adoption or any single organisational capability. Instead, the PLS-SEM results indicate a capability-conversion sequence across the full sample, while the fsQCA results show that different combinations of capabilities can lead to the same sustainability outcome. These findings therefore require interpretation at two complementary levels: the average relationships among capabilities and the configurations through which those capabilities operate together.
The Phase I and Phase II findings also demonstrate the distinction between contextual content validation and empirical measurement assessment. All 43 proposed observed variables met the IT2FDM thresholds for conceptual appropriateness and practical applicability. Nevertheless, the subsequent PLS-SEM assessment removed SIN5 and showed that service innovation and internal learning were not empirically distinguishable in the quantitative sample. Expert validation and empirical measurement refinement therefore provided different forms of evidence. The IT2FDM established that the proposed items were relevant and usable in the Thai SME context, whereas PLS-SEM determined how those items behaved empirically across 659 SME responses.
The first substantive finding is that AIC, SMM, and CVA were positively associated with SILC. This result supports previous digital-transformation research arguing that digital transformation is not primarily a technological event but a process of strategic and organisational renewal [
62]. Recent SME research similarly emphasises that digital transformation depends on the development and coordination of dynamic capabilities, knowledge exchange, and ecosystem relationships rather than technology acquisition alone [
63]. Evidence from SMEs also indicates that the sustainable performance benefits of AI adoption are strengthened through organisational learning and employee capability development [
64].
The present study confirms this general capability-based reasoning but also provides a more differentiated explanation of the conversion process. AIC and SMM represent mechanisms through which SMEs interact with customers and obtain external signals, whereas CVA reflects the internal strategic ability to interpret those signals and anticipate future customer value. Their significant relationships with SILC suggest that digital interaction and customer sensing become organisationally valuable when translated into service improvement, internal learning routines, and practical business action. The findings therefore shift the explanation from whether SMEs possess or use digital tools to how they convert digitally generated customer knowledge into internal transformation capability.
The second major finding concerns the consolidation of service innovation and internal learning into SILC. Previous studies generally conceptualise organisational learning and innovation as related but distinct mechanisms. For example, organisational learning has been positioned as a mechanism through which organisational flexibility supports service innovation [
65], while recent SME research treats innovation as a mediator and organisational learning capability as a condition that strengthens the dynamic capability–innovation relationship [
66]. These studies demonstrate that learning supports innovation, but they maintain a conceptual and empirical distinction between the two constructs.
The present results do not contradict that literature; rather, they identify a contextual refinement. In the Thai SME sample, service innovation and internal learning were so closely associated that maintaining them as separate reflective constructs was not empirically defensible. Their consolidation suggests that, in resource-constrained SMEs, learning and service improvement may occur through tightly coupled routines rather than through separate formal systems. Employees may acquire knowledge, share practical experience, adjust operating processes, and improve services within the same cycle of organisational activity. SILC should therefore not be interpreted as universally replacing service innovation and organisational learning as separate concepts. Instead, it represents a context-specific internal transformation capability observed in this sample, in which knowledge application and service adaptation function together.
The significant relationships from SILC to ELE, BPE, and BSU further support the role of internal transformation capability. The SILC–ELE relationship was the strongest direct path in the structural model, indicating that SMEs with stronger internal innovation–learning routines may also be better positioned to recognise, absorb, and use knowledge from customers, partners, suppliers, platforms, and business networks. This interpretation is consistent with leading open-innovation research showing that the benefits of external knowledge practices depend on firms’ strategic and operational reconfiguration capabilities [
67]. External openness does not generate innovation outcomes automatically; firms require internal capabilities that allow external knowledge to be integrated and applied.
The present study confirms this reconfiguration logic but extends it to an SME sustainability pathway. SILC was associated not only with external learning but also directly with business performance and business sustainability. ELE was also positively related to BPE, while BPE was positively related to BSU. The findings therefore indicate that boundary-spanning knowledge contributes to sustainability when supported by an internal transformation mechanism and connected to operational and economic viability. This qualifies a simple open-business-model interpretation in which greater access to external knowledge is assumed to be inherently beneficial. The results instead suggest that the value of openness depends on the firm’s capacity to convert and apply knowledge in practice.
The fsQCA findings provide a third level of interpretation. No single present or absent/low condition reached the necessity threshold, despite all eight hypothesised PLS-SEM paths being statistically significant. These results are not contradictory. PLS-SEM estimates whether relationships are supported across the sample, whereas fsQCA assesses whether specific conditions or combinations are necessary or sufficient for high membership in the outcome. A capability can therefore have a statistically significant average relationship with sustainability without being required in every successful configuration.
The three sufficient configurations demonstrate equifinality. The first two configurations combine digital interaction, SILC, and BPE, with CVA or ELE contributing differently across the pathways. These configurations support the capability-conversion argument: customer-facing digital mechanisms contribute to sustainability when they are combined with internal transformation and performance capability. They also show that no single digital pattern represents all sustainable SMEs.
The third configuration provides the most distinctive insight. In this pathway, AIC, SMM, and CVA are absent or weak, whereas SILC, ELE, and BPE are present. This configuration indicates that strong internal innovation–learning capability, external learning, and business performance can compensate for weaker digital interaction and customer-sensing conditions in some SMEs. The finding does not imply that digital capabilities are unimportant. Rather, it qualifies any universal claim that advanced digital/customer-facing capability is a necessary precondition for SME sustainability.
This compensatory result is consistent with research showing that openness and performance relationships can be conditional and nonlinear rather than uniformly positive [
68]. It extends that reasoning by demonstrating a configurational form of substitution: different capability bundles may provide alternative routes to sustainability. For resource-constrained SMEs, internal learning, practical service innovation, network-based knowledge, and business viability may sustain adaptation even where sophisticated AI, social media, or customer-anticipation capabilities remain limited.
The results should nevertheless be interpreted within the explanatory boundaries of the model. The R-square values for the endogenous constructs were modest, indicating that the framework explains a specific capability pathway rather than all determinants of SME sustainability. Financial resources, leadership, institutional support, competition, industry conditions, regulation, and environmental pressures may also influence sustainability. The theoretical value of the results therefore lies not in offering a complete universal model, but in identifying how digital interaction, customer sensing, innovation–learning, external knowledge, and performance operate jointly and differently across Thai SMEs.
5.2. Theoretical Contributions
The first theoretical contribution is to shift the explanation of SME digital transformation from digital adoption to capability conversion. Resource-based reasoning explains the strategic importance of valuable organisational resources, while dynamic capability research emphasises sensing, seizing, and resource reconfiguration. However, digital tools such as chatbots and social media platforms are increasingly accessible and imitable; their possession alone is unlikely to constitute a sustained advantage. The present findings refine this reasoning by distinguishing customer-facing interaction mechanisms from internal strategic sensing and transformation. AIC and SMM provide access to customer interaction and information, CVA interprets emerging customer-value signals, and SILC converts these inputs into service improvement, learning routines, and organisational action. The theoretical contribution therefore lies in specifying the conversion mechanism through which broadly available digital resources can acquire firm-specific organisational value.
The second theoretical contribution is the identification of integrated innovation–learning transformation. Knowledge-based and organisational learning perspectives generally explain how firms acquire, share, and apply knowledge, while innovation research considers how firms convert knowledge into new or improved offerings and processes. The empirical consolidation of service innovation and internal learning into SILC indicates that these processes may operate as tightly coupled routines in resource-constrained SMEs. This refines theories that assume a clear empirical separation between learning as an antecedent and innovation as an outcome. In the present context, knowledge development and service adaptation appear to form an integrated capability through which SMEs repeatedly interpret information, share experience, adjust operations, and implement service improvements. SILC is therefore advanced as a context-sensitive theoretical refinement rather than a universal replacement for the original constructs.
The third theoretical contribution is a configurational and compensatory explanation of SME sustainability. Net-effect models assume that relationships can be assessed through average independent effects, whereas configurational reasoning recognises conjunctural causation, equifinality, and asymmetry. By combining PLS-SEM and fsQCA, this study demonstrates that statistically significant capabilities are not necessarily required in every sufficient pathway. In particular, the configuration combining SILC, ELE, and BPE with weak or absent AIC, SMM, and CVA shows that downstream organisational capabilities can compensate for weaker upstream digital/customer-facing capabilities. The study therefore advances dynamic capability and SME sustainability reasoning by identifying not only complementarity among capabilities but also conditional substitution across capability configurations.
Together, these contributions provide a more precise explanation of how resource-based, dynamic capability, knowledge-based, organisational learning, and open business model perspectives intersect. The study does not propose that these theories are replaced or unified into one new theory. Rather, it clarifies their complementary roles: digital resources provide interaction opportunities; strategic sensing interprets customer signals; innovation–learning capability converts knowledge into internal adaptation; external learning broadens access to knowledge; and business performance provides the viability foundation for sustainability. The configurational results further show that the relative importance of these elements varies across successful SME pathways.
The Thai SME context and the integration of IT2FDM, PLS-SEM, and fsQCA strengthen the empirical and methodological contribution of the study. However, these features support rather than substitute for the three theoretical contributions. The principal theoretical advancement lies in explaining capability conversion, integrated innovation–learning transformation, and configurational compensation in SME business sustainability.
5.3. Practical Implications for Thai SMEs
For SME managers, the findings suggest that investment in AI chatbots and social media marketing should not be treated as isolated technology adoption. These tools should be connected to routines for interpreting customer information, improving services, sharing knowledge internally, and learning from external partners. Managers should therefore focus not only on adopting digital tools, but also on building the internal capability to convert customer interaction into service innovation, learning, and performance improvement.
AI chatbot usage and social media marketing should be connected with internal learning and service improvement. SMEs should avoid adopting chatbots only as automation tools. Chatbot data, social media feedback, and customer value signals should be used to identify service problems, improve offerings, and guide performance monitoring.
SILC is the central managerial mechanism. SMEs should develop simple internal routines for learning and service improvement, such as customer feedback meetings, staff knowledge-sharing sessions, reviews of service problems, and dashboard-based monitoring. These routines are not necessarily expensive, but they help SMEs to convert customer information into business action.
The fsQCA configurations also show that SMEs may follow different pathways. Some SMEs may rely on AI-enabled digital and customer-value capabilities. Others may rely more on social media, external learning, and business performance. A third group may compensate for weak digital/customer-facing conditions through strong SILC, external learning, and performance strength.
5.4. Robustness, Sensitivity, and Resource-Constrained SME Strategy
The robustness and sensitivity checks help to translate the fsQCA results into tentative practical guidance. The primary model is retained as the main result because it provides the clearest and most conservative solution. The robustness check shows that the central role of SILC and BPE remains stable when the frequency threshold is increased. The sensitivity analysis shows that broader near-threshold pathways exist, but these pathways should not replace the primary solution because consistency decreases when the PRI threshold is relaxed.
For resource-constrained SMEs, this implies that managers do not need to adopt every digital capability simultaneously. However, they should prioritise the conversion of digital and customer knowledge into internal innovation-learning capability and measurable business performance. External learning can help SMEs to compensate for internal resource limitations by providing access to partner, customer, platform, and ecosystem knowledge.
5.5. Policy and Ecosystem Implications
The findings have implications for policymakers, SME support agencies, industry associations, universities, and digital transformation support organisations in Thailand. Support programmes should not focus only on technology adoption or basic digital training. The results suggest that SME support should also develop capabilities in customer-value analysis, service innovation, organisational learning, external networking, and performance management. Such capability-oriented support may be especially important in emerging-market SME contexts, where firms often face resource limitations and may lack specialised digital or analytical expertise.
SME support should be staged according to readiness. Some SMEs may be ready for using AI chatbots, while others may need to begin with social media marketing, customer feedback systems, internal learning routines, external learning activities, or service innovation. This staged approach is consistent with sustainable digital transformation roadmaps for SMEs [
69].
Policymakers should support SME learning networks. External learning appears in several configurations and remains important for capability development. Government agencies, universities, and industry associations can facilitate peer-learning communities, mentoring networks, digital clinics, and collaboration platforms.
6. Conclusions
6.1. Main Conclusions and Answers to the Research Questions
This study developed and tested a sequential mixed-method capability framework to explain business sustainability among Thai SMEs. Phase I applied the Interval Type-2 Fuzzy Delphi Method (IT2FDM) with 21 experts to validate the proposed measurement instrument. Phase II used Partial Least Squares Structural Equation Modelling (PLS-SEM) and fuzzy-set Qualitative Comparative Analysis (fsQCA) to analyse 659 usable SME responses.
Regarding RQ1, the experts validated all 43 proposed observed variables as conceptually appropriate and practically applicable to the Thai SME context. The subsequent quantitative measurement assessment retained 42 indicators after SIN5 was removed because of its weak empirical loading. Service innovation and internal learning were also consolidated into service innovation–internal learning capability (SILC) because the two original constructs were not empirically distinguishable in the quantitative sample. The findings therefore demonstrate that expert-based content validation and statistical measurement assessment provide complementary rather than interchangeable forms of evidence.
Regarding RQ2, all eight hypothesised PLS-SEM relationships were statistically supported. AI chatbot usage, social media marketing, and customer value anticipation were positively associated with SILC. SILC was positively associated with external learning, business performance, and business sustainability. External learning was positively associated with business performance, while business performance was positively associated with business sustainability. These results indicate that customer-facing digital interaction and strategic customer sensing contribute to sustainability primarily when SMEs convert the resulting information into internal innovation, learning routines, operational adaptation, and performance outcomes.
Regarding RQ3, no single present or absent/low condition was individually necessary for high business sustainability. Instead, the fsQCA analysis identified three sufficient configurations. SILC and business performance appeared in all three primary pathways, indicating their central configurational role. The third configuration further showed that strong SILC, external learning, and business performance can support high business sustainability even when AI chatbot usage, social media marketing, and customer value anticipation are weak or absent. Business sustainability therefore follows multiple capability pathways rather than one universal digital-transformation route.
Taken together, the PLS-SEM and fsQCA findings provide complementary explanations. PLS-SEM identifies statistically supported relationships across the sample, whereas fsQCA demonstrates equifinality and shows how different combinations of capabilities can generate the same outcome. The integrated evidence indicates that digital technologies are not sufficient by themselves; their sustainability value depends on the organisational capabilities through which customer and market knowledge is interpreted, transformed, and connected to business viability.
6.2. Contributions to Knowledge
This study makes three principal theoretical contributions.
First, it advances the explanation of SME digital transformation from digital adoption to capability conversion. AI chatbot usage and social media marketing provide customer-interaction mechanisms, while customer value anticipation provides strategic interpretation of customer signals. Their relationships with SILC demonstrate that broadly accessible digital resources acquire organisational value when SMEs convert customer information into internal learning, service improvement, and business action.
Second, the study identifies integrated innovation–learning transformation as a context-sensitive capability mechanism. The empirical consolidation of service innovation and internal learning into SILC suggests that these processes may operate through tightly coupled routines in resource-constrained SMEs. In this context, knowledge acquisition, knowledge sharing, practical experimentation, operational adjustment, and service improvement appear to form an integrated internal transformation capability rather than fully separate organisational mechanisms.
Third, the study provides a configurational and compensatory explanation of SME business sustainability. Statistically significant capabilities were not necessarily required in every sufficient pathway. The fsQCA results show that different capability combinations can lead to high business sustainability and that strong internal transformation, external learning, and performance capabilities may compensate for weaker digital and customer-facing conditions in some SMEs.
The Thai SME setting provides an emerging-market context in which these capability-conversion and compensatory mechanisms are particularly relevant because firms frequently operate under financial, technological, and managerial constraints. The sequential integration of IT2FDM, PLS-SEM, and fsQCA further strengthens the evidence by combining contextual instrument validation, net-effect analysis, and configurational explanation. These contextual and methodological features support the theoretical contributions but do not replace them.
6.3. Managerial and Policy Implications
For SME managers, the findings indicate that AI chatbots and social media marketing should not be implemented as isolated technologies. Digital interaction should be connected to routines for interpreting customer information, sharing knowledge internally, improving services, and monitoring business performance. SMEs should therefore evaluate digital investments according to their ability to strengthen internal transformation capability rather than adoption alone.
SILC represents the most consistent managerial priority across the integrated findings. SMEs can strengthen this capability through practical routines such as structured customer-feedback reviews, employee knowledge-sharing sessions, technology-skills development, service-problem analysis, experimentation with new delivery methods, and regular evaluation of operational improvements. These activities may be particularly appropriate for resource-constrained SMEs because they can be implemented incrementally without requiring sophisticated technological infrastructure.
The configurational findings also indicate that SMEs do not need to follow one identical digital-transformation pathway. Some firms may rely on stronger AI-enabled customer interaction and customer-value capabilities, whereas others may depend more heavily on internal learning, external networks, and business performance. Managers should therefore develop capability portfolios that reflect their existing resources, market conditions, and digital readiness.
For policymakers, universities, industry associations, and SME support organisations, the results suggest that support programmes should move beyond basic technology-adoption training. Programmes should also strengthen customer-value interpretation, service innovation, internal learning, external networking, and performance management. Staged and capability-oriented support may be more effective than assuming that every SME is immediately ready to adopt advanced AI applications.
6.4. Limitations and Future Research
Several limitations define the scope of the findings.
First, the quantitative phase used cross-sectional survey data. The results should therefore be interpreted as theory-based associations rather than definitive temporal causal relationships. Longitudinal studies could examine how digital interaction, strategic customer sensing, innovation–learning capability, external learning, performance, and sustainability develop over time.
Second, the study relied on self-reported data from one respondent per SME. Procedural controls and statistical assessments indicated that common method bias was not a serious threat, but future studies could use multiple respondents, archival records, objective performance indicators, or longitudinal business data.
Third, the empirical setting was limited to Thai SMEs. Institutional conditions, digital infrastructure, regulatory environments, industry structures, and access to SME support may differ across countries. Future research should test the framework in other emerging and developed economies and compare whether the same capability relationships and configurations remain evident.
Fourth, the consolidation of service innovation and internal learning into SILC was empirically justified in this sample. Future research should examine whether these constructs remain integrated in other industries, countries, firm sizes, or stages of digital maturity, or whether they become empirically distinguishable under different organisational conditions.
Fifth, Phase I used a purposively selected and multidisciplinary panel of 21 experienced experts. Although the panel was designed to provide relevant theoretical, institutional, and practical coverage, its judgements were specific to the Thai SME context. Future studies could extend the validation process to expert panels from other industries, countries, or institutional settings.
Sixth, fsQCA findings depend on calibration anchors, frequency thresholds, consistency thresholds, and directional assumptions. The present study addressed this limitation through primary, robustness, and sensitivity analyses, but future research could examine alternative calibration procedures and replicate the configurations using independent samples.
Finally, the model explains a specific capability pathway rather than all determinants of SME business sustainability. Future studies could incorporate leadership, digital maturity, financial resources, competitive intensity, institutional support, government policy, environmental regulation, industry characteristics, and external shocks. Such extensions could clarify the conditions under which capability conversion and configurational compensation become more or less important.