3.1. Research Design and Overall Framework
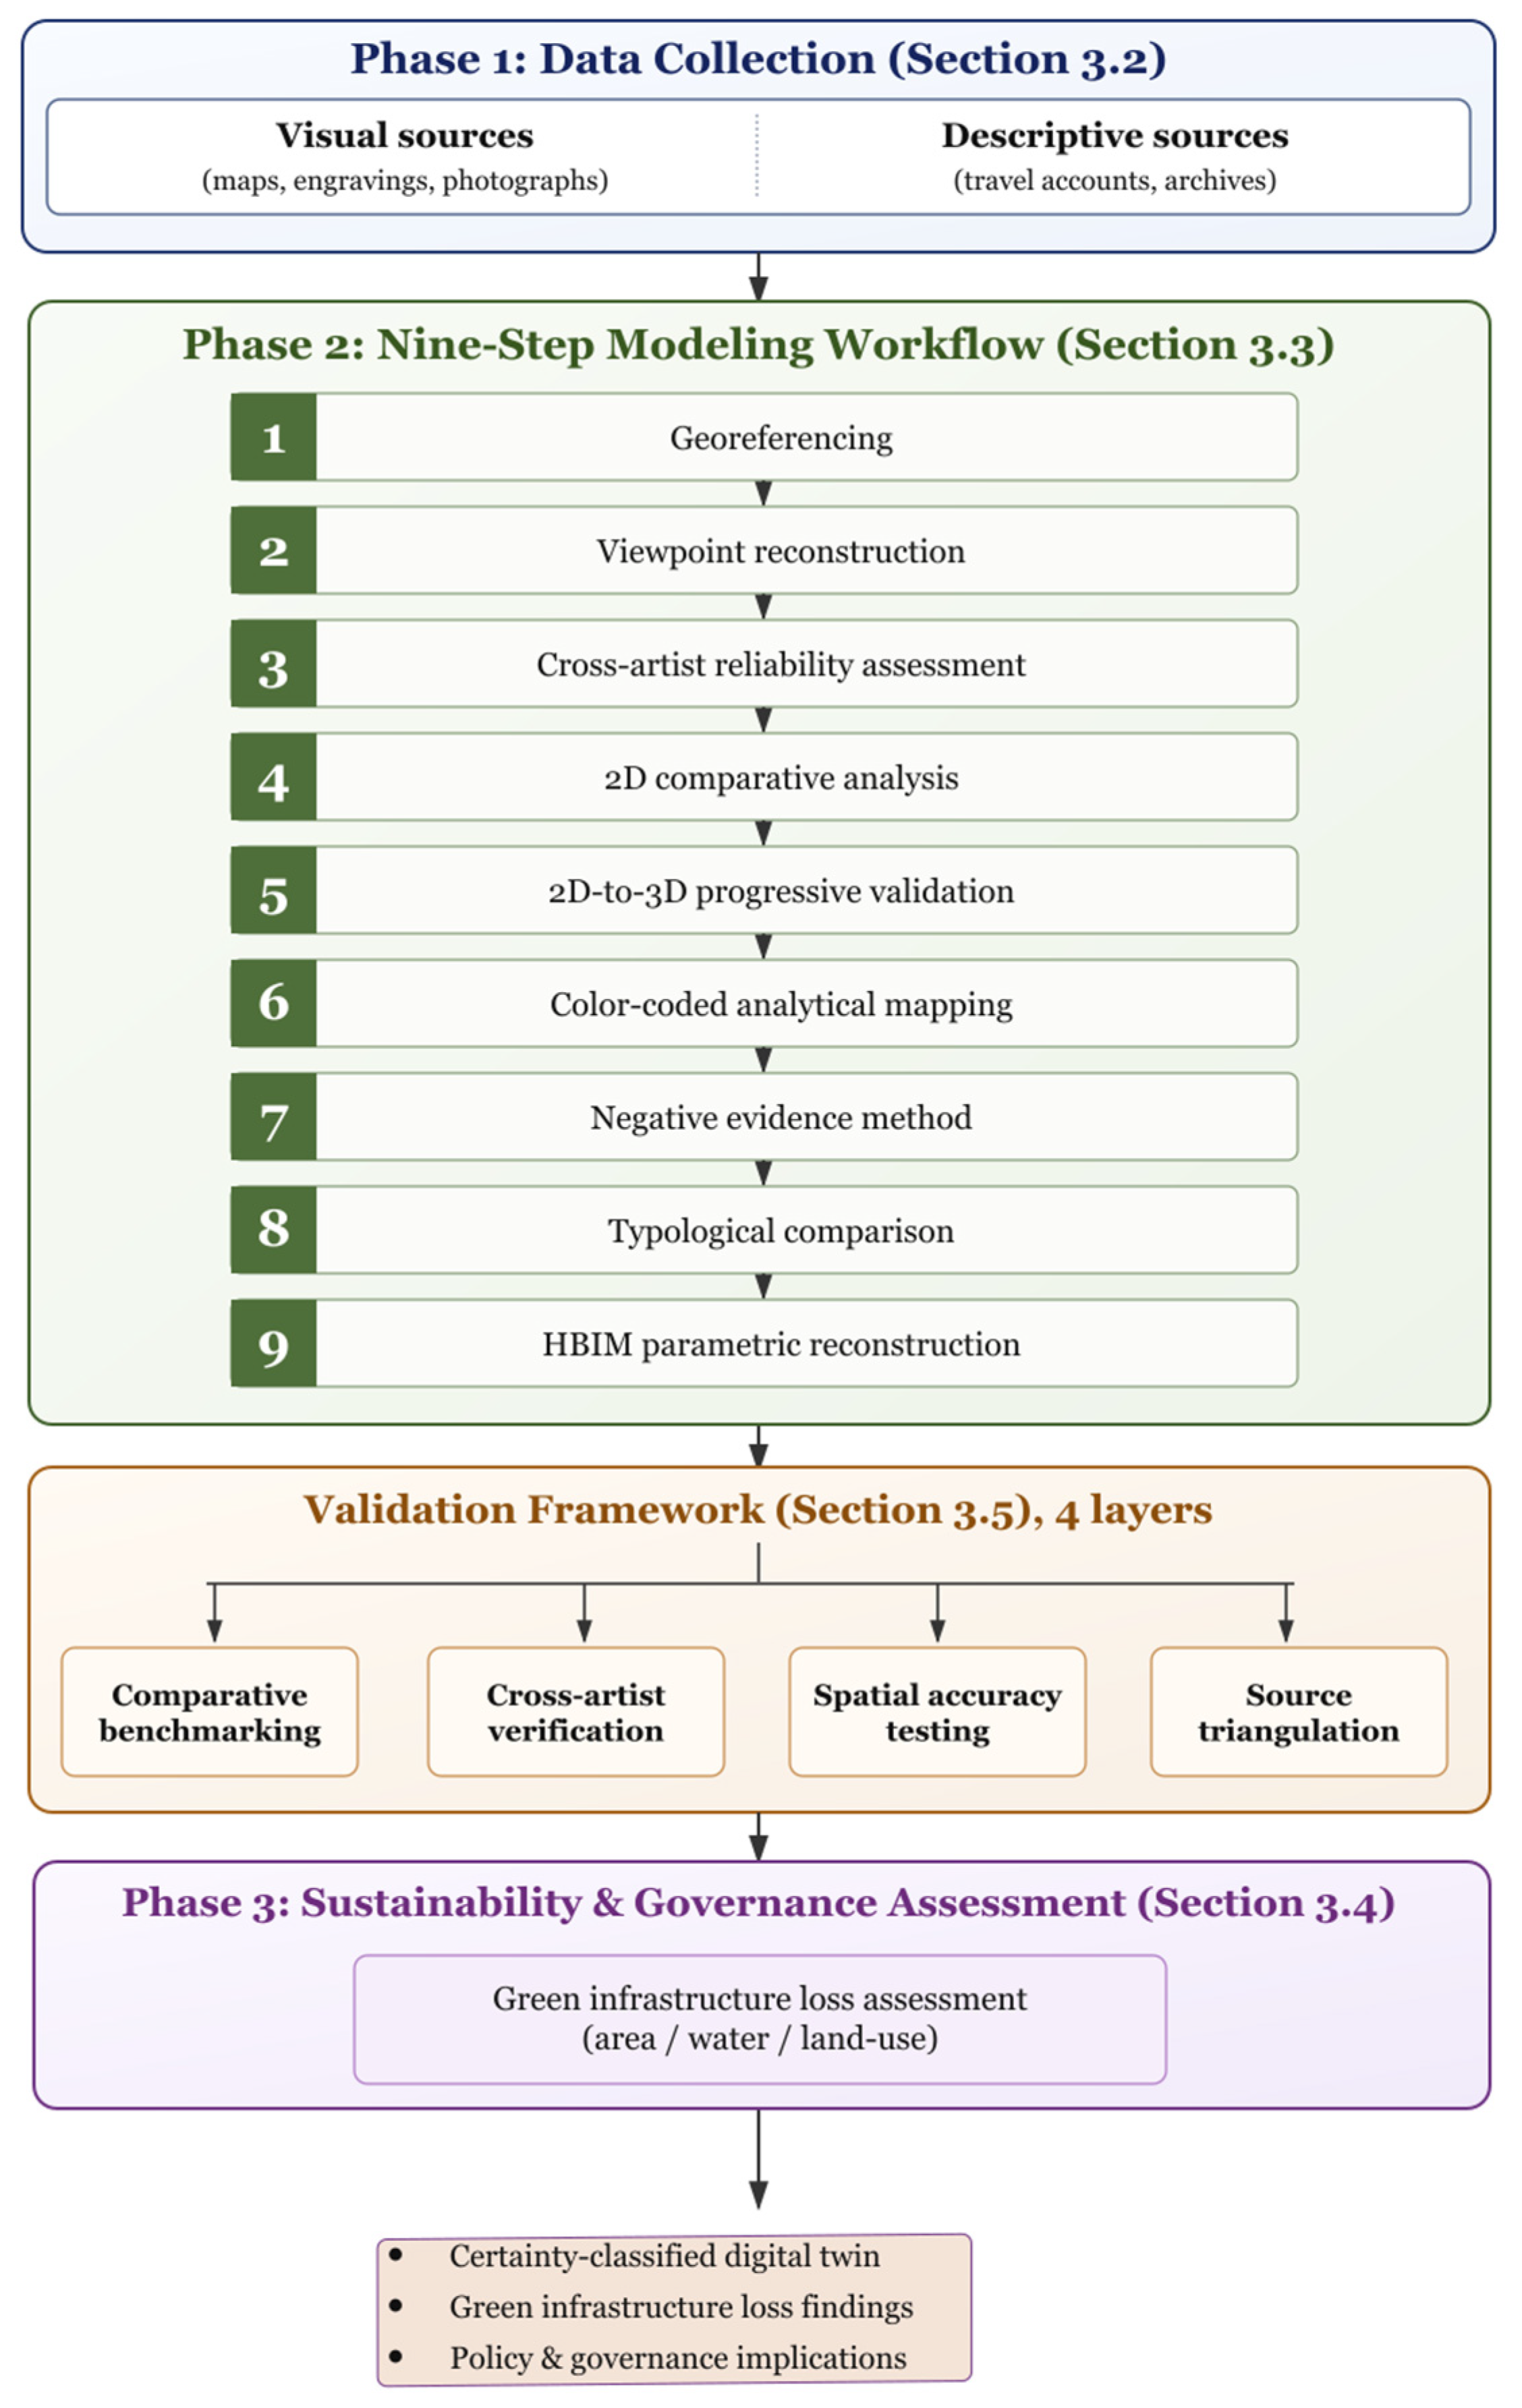
This study adopts a multidisciplinary research design combining qualitative and quantitative methods. It draws on three categories of data: library and archival sources, field observations, and digital modeling outputs. The overall framework is guided by the Historic Urban Landscape (HUL) approach, treating the historic street as a layered system of built, natural, and documentary evidence spanning multiple historical periods. The research follows three sequential phases: (1) collection and systematic analysis of descriptive and visual documentation from the Safavid period to the present; (2) application of parametric and geospatial modeling to reconstruct lost architectural and landscape elements; and (3) a sustainability and governance assessment examining the role of historic green infrastructure and drawing implications for urban regeneration policy and evidence-based heritage governance.
Figure 1 presents a technical roadmap of this workflow.
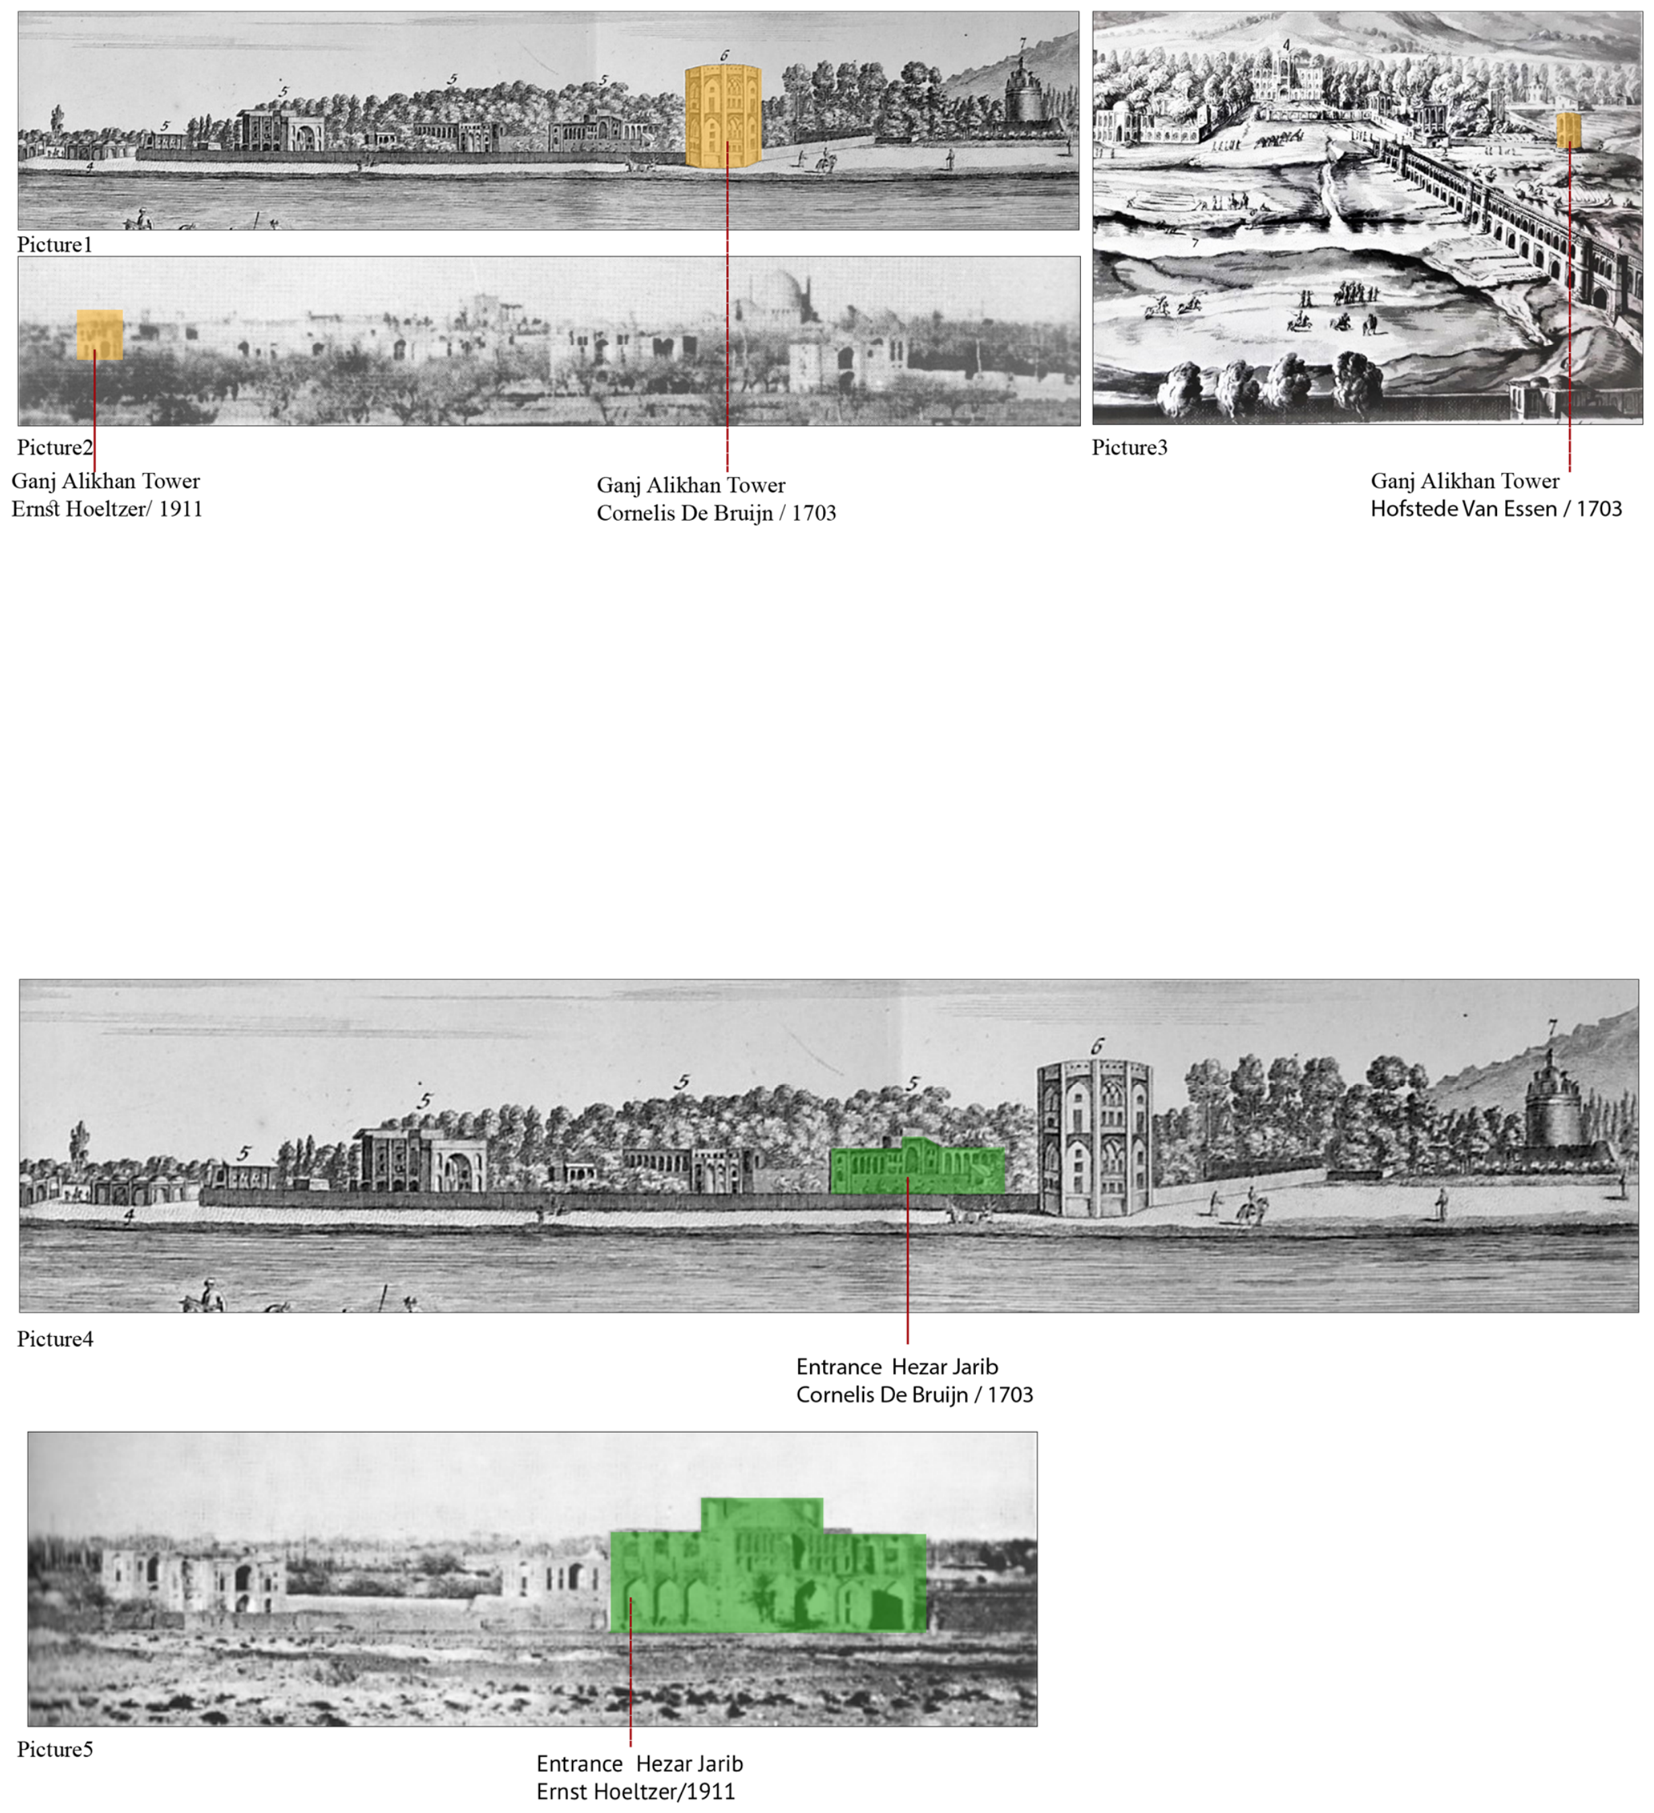
It is important to state at the outset how this study defines and assesses accuracy, since it differs from the paradigm used for digital twins of standing structures. Where a physical structure still exists, accuracy can be reported numerically, as a point-cloud or GIS deviation between the model and a present-day scan or survey. Chahar-Bagh Bala Street’s royal garden entrances, towers, and water features no longer exist: no current physical structure is available against which to measure metric deviation. Accuracy in this study is therefore assessed through the convergence of independent documentary evidence rather than through deviation from a present-day ground truth. Over a documentation and modeling effort spanning fifteen years and more than one hundred successive modeling iterations, every reconstructed element was checked against all available visual sources using three original verification tools: negative evidence analysis, in which the absence of a feature from a given image is explained through the recorded distance and angle of that view rather than treated as disproof; artist’s and photographer’s viewpoint reverse engineering, in which the physical position from which a painting or photograph was made is itself reconstructed, so that the depicted feature can be correctly and independently geo-located; and multi-creator historical reliability verification, in which the same feature as depicted by different artists, photographers, or cartographers at different times is cross-checked for consistency. Where an individual sketch or photograph lacked sufficient detail to model a feature on its own, this was resolved by triangulating additional independent visual sources rather than by accepting the incomplete source alone. This documentary convergence approach, rather than a numerical GIS deviation threshold, is the basis for the confirmed/inferred/provisional classification used throughout this study (
Section 3.5).
This study develops a documentary-based Urban Digital Twin framework for reconstructing demolished historic urban landscapes through the integration of archival documentation, geospatial analysis, and parametric modeling. This workflow is specifically designed for sites where scan-based documentation methods are unavailable because no physical structures remain [
12,
19]. A step-by-step UDT development process that integrates data sources, simulation functions, and key performance indicators enables systematic assessment of urban regeneration scenarios and supports evidence-based design decisions [
29] (p. 127). This framework is distinguished from existing UDT approaches by its reliance on documentary evidence rather than physical scanning, extending the applicability of digital twin methodologies to demolished or severely degraded heritage sites that are currently underrepresented in the UDT heritage literature [
13].
3.2. Data Collection: Descriptive and Visual Documentation Sources
The data collection process drew on two categories of sources: archival documents and contemporary geospatial data.
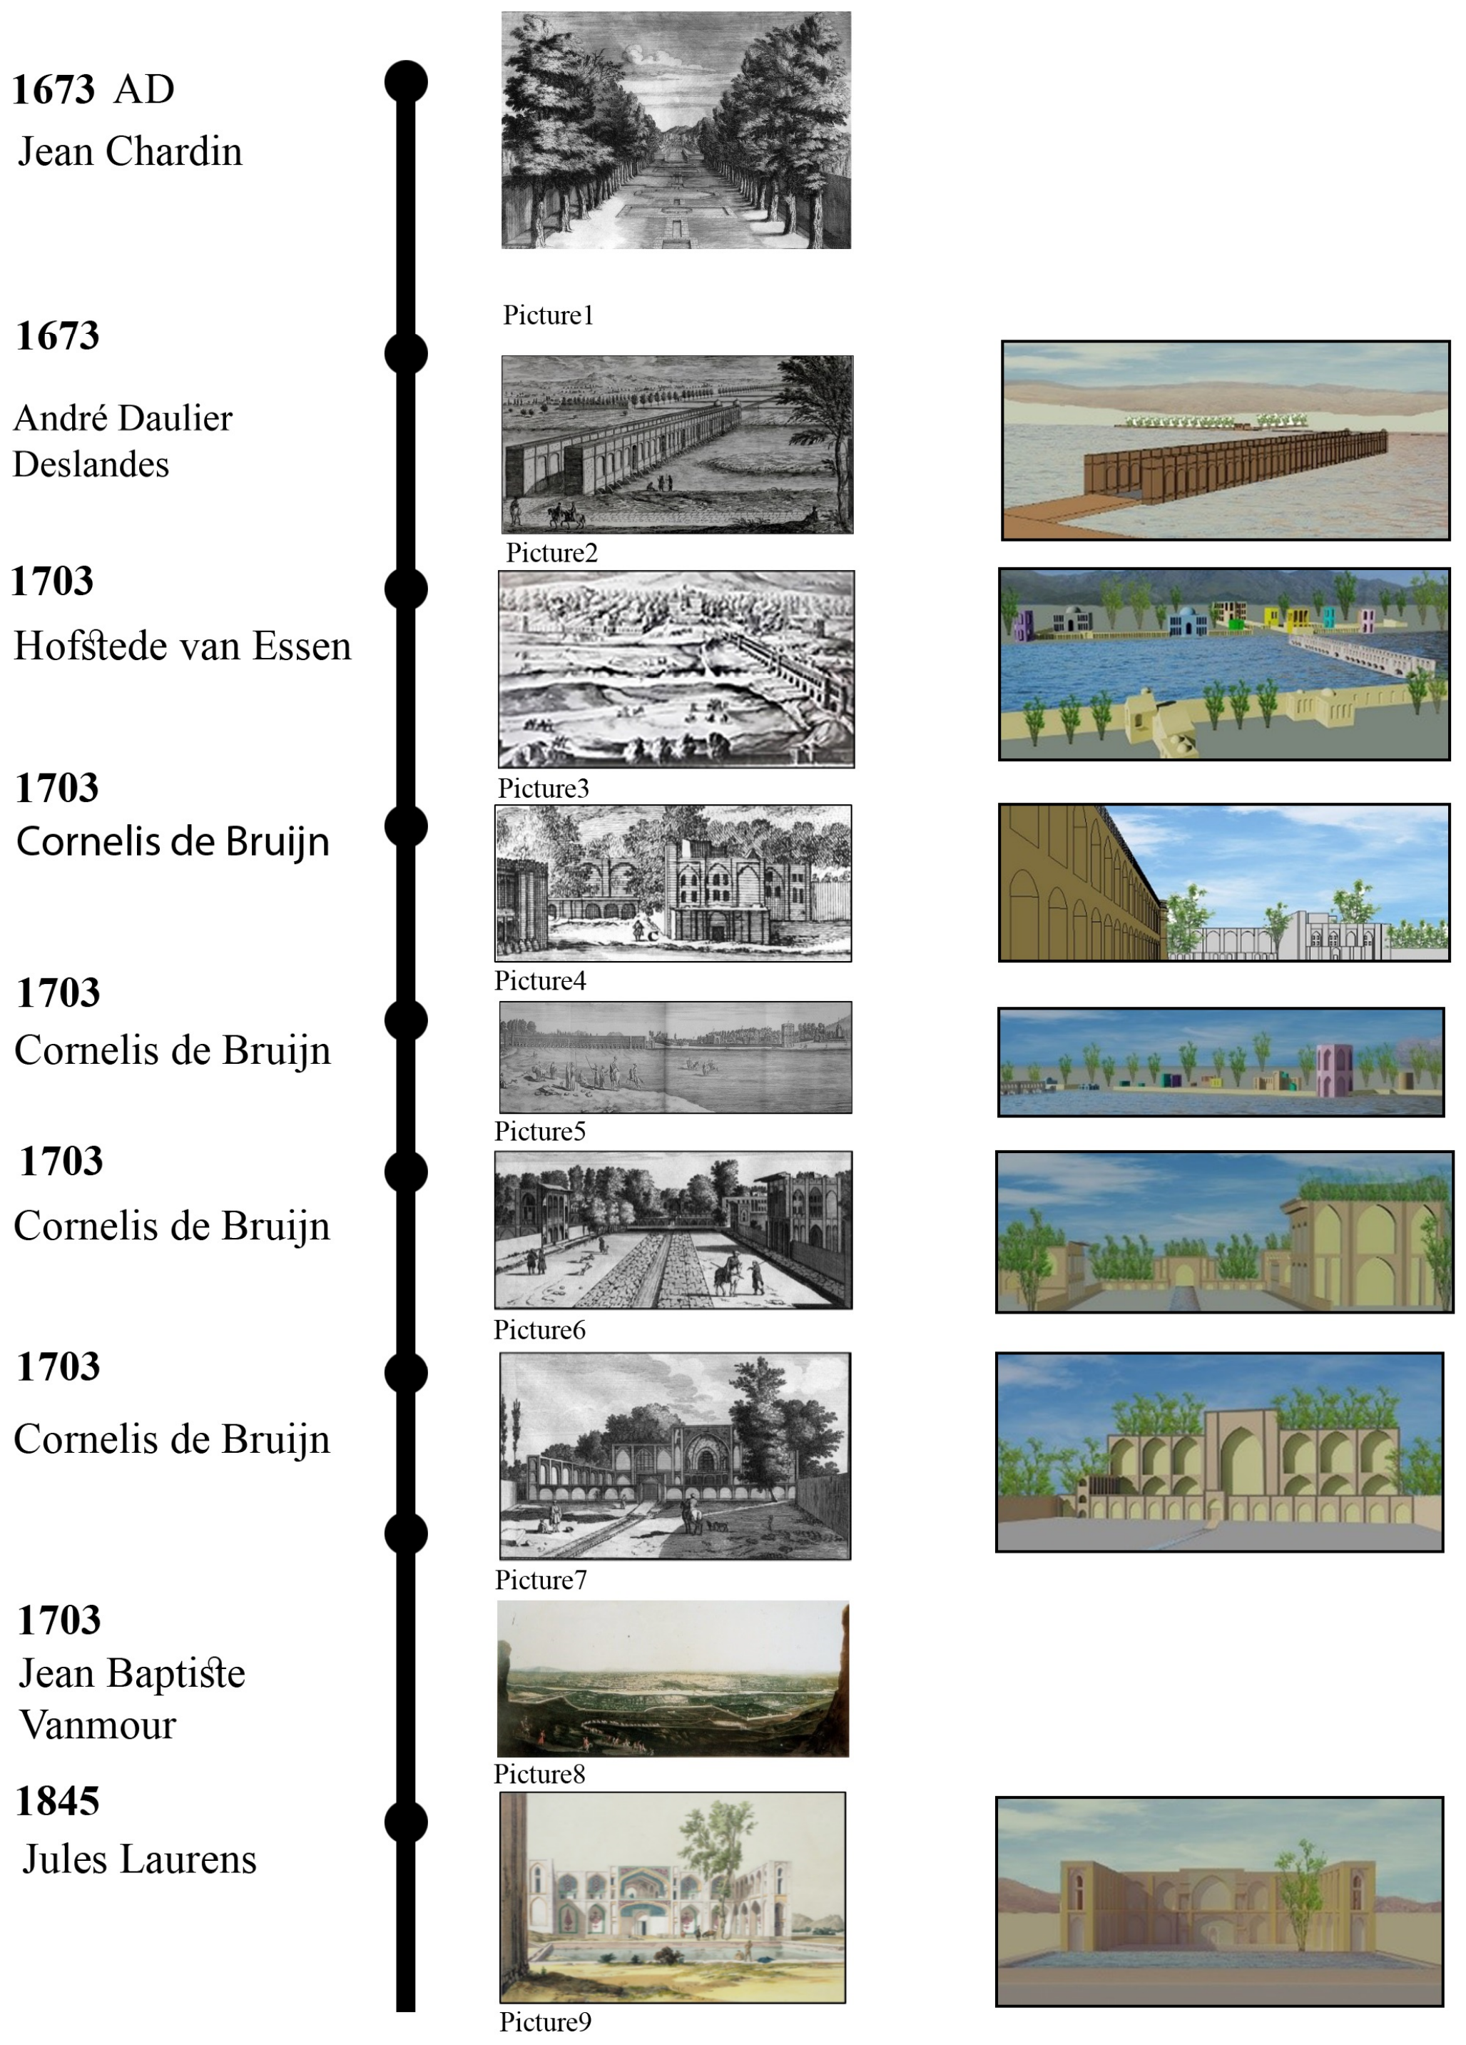
Figure 2 presents the timeline of historical images of Chahar-Bagh Bala Street from 1673 to 1845, showing original visual documents alongside parametric digital twin reconstructions [
4,
63,
64,
65,
66,
67].
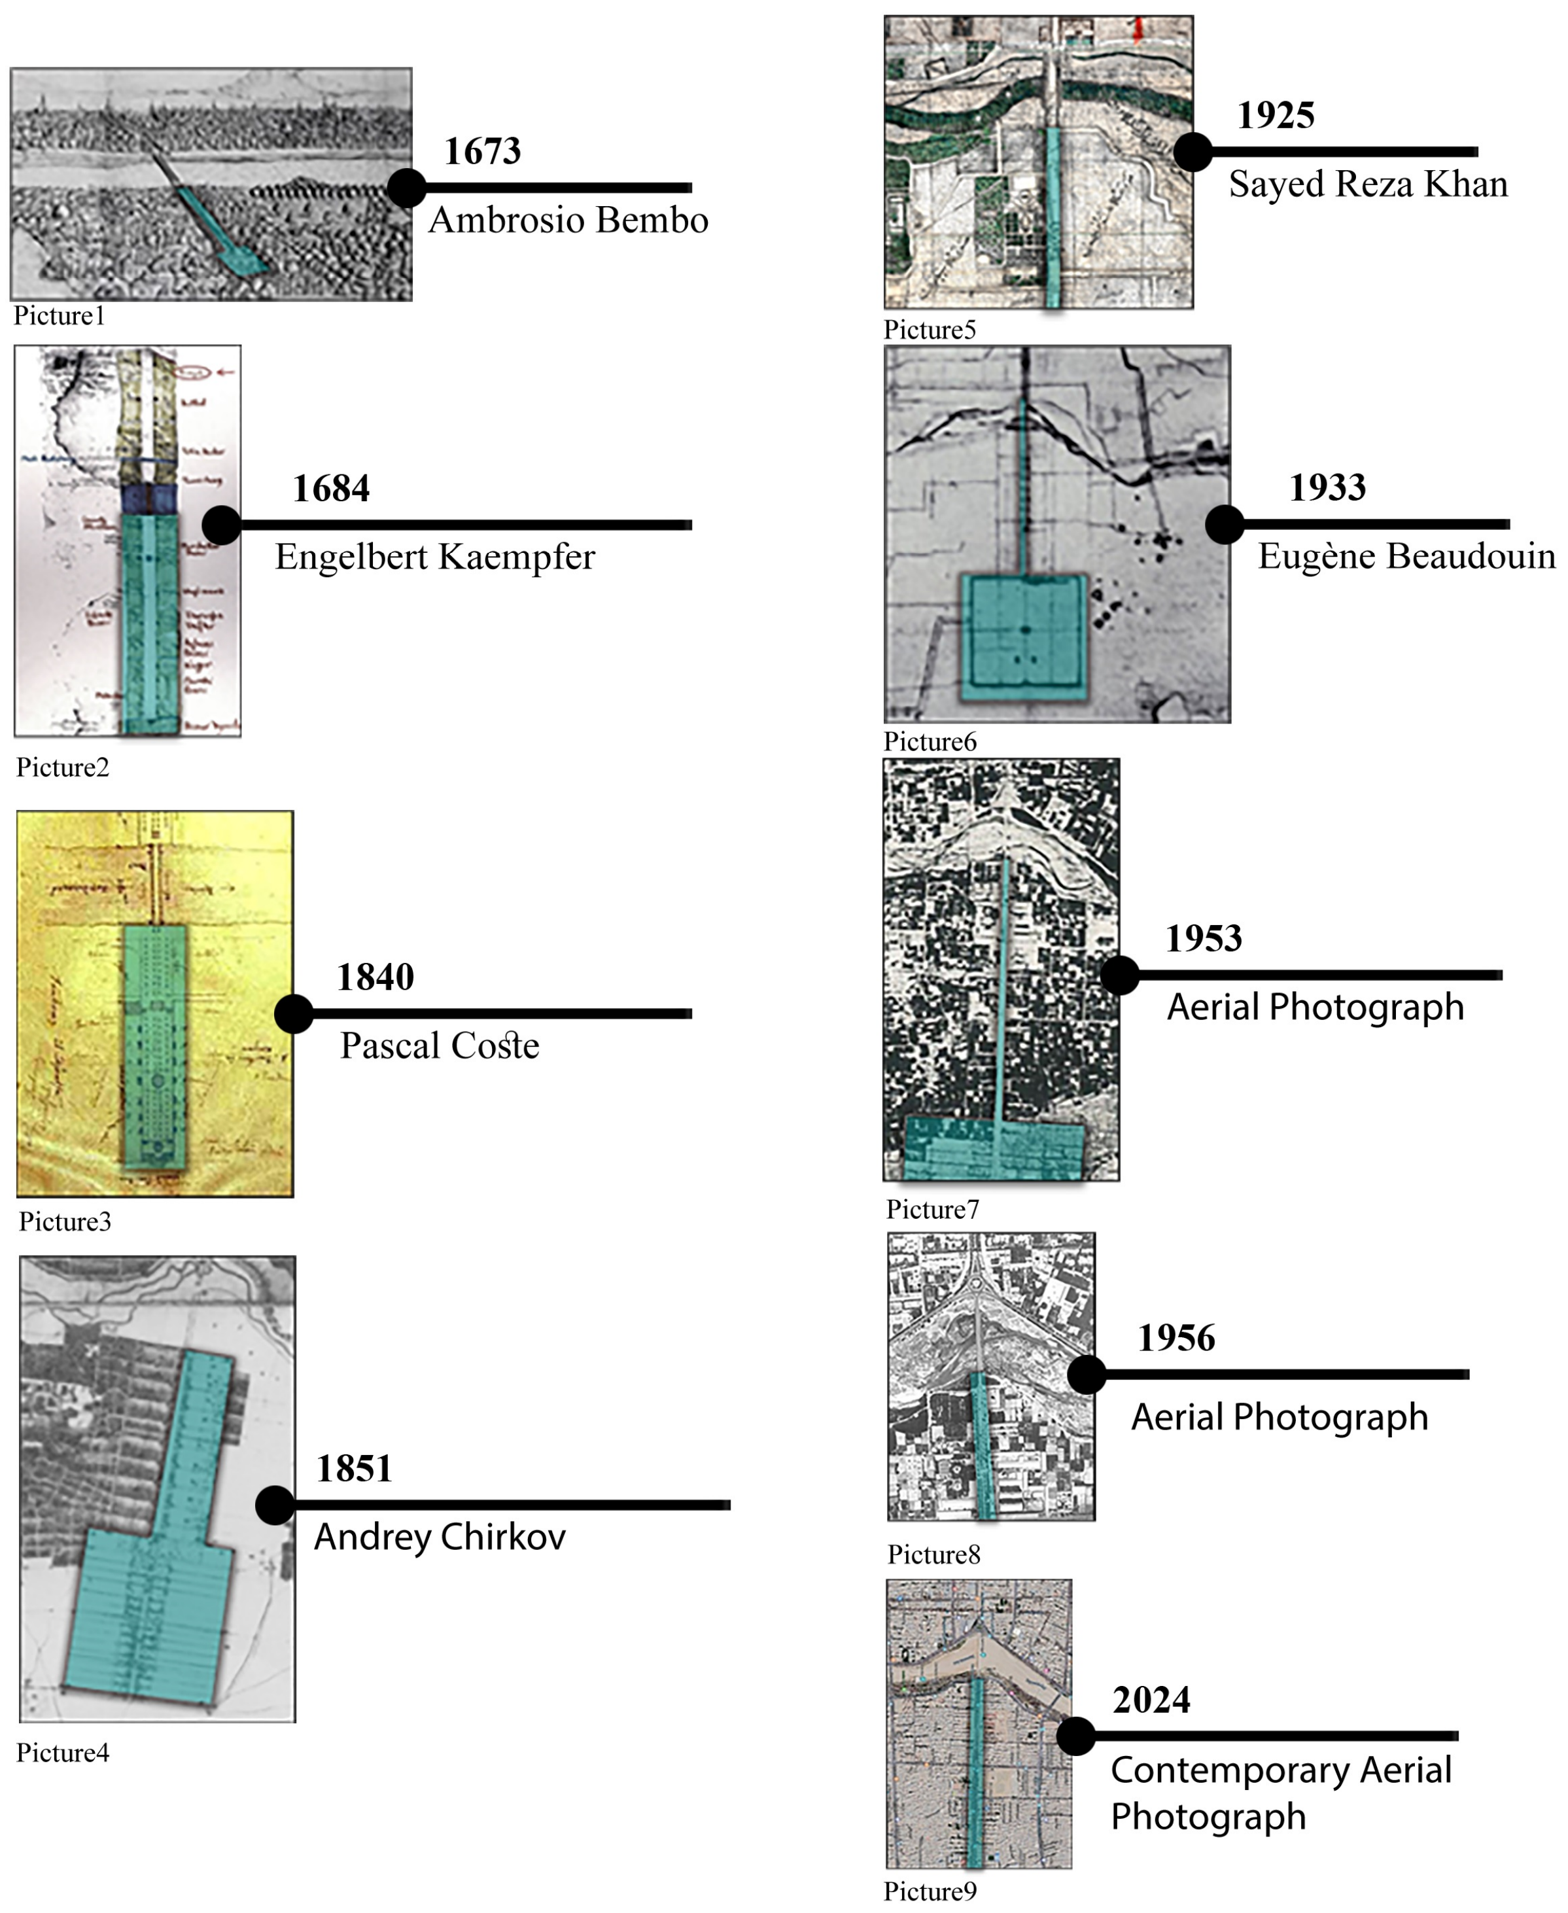
Figure 3 presents the localization of Chahar-Bagh Bala Street on historical maps and contemporary aerial photographs spanning from 1673 to 2024, showing the continuity of the street axis and the location of lost garden boundaries [
57,
68,
69,
70].
Documentary sources include: Jean Chardin [
4], Andre Daulier Deslandes [
63], Hofstede van Essen [
64], Cornelis de Bruijn [
65], Jean Baptiste Vanmour [
66], Jules Laurens [
67], and Ernst Holtzer (late nineteenth century). Spatial records include the Pascal Coste plan [
71] and the Andrey Chirkov map [
70]. Aerial photographs from 1925, 1933, 1953, 1956, and 2024 were obtained from the Archive of the Cultural Heritage Organization of Isfahan. Persian archival records by Honarfar [
58] and Rafiee Mehrabadi [
59], and accounts by European travelers including Della Valle [
5], Chardin [
4], and Tavernier [
55] complete the dataset.
Table 1 summarizes these descriptive and visual sources.
Figure 2.
Modeling of historical images of Chahar-Bagh Bala Street from the late sixteenth century to the present, showing original visual documents (center column) and parametric digital twin reconstructions (right column). Each reconstruction was constrained and evaluated through documentary comparison, viewpoint analysis, and spatial relationships derived from the historical sources, rather than assessed against a single resemblance criterion. Sources: Chardin [
4] [Picture 1]; Deslandes [
63] [Picture 2]; Holtzer [
72] [Picture 3]; De Bruijn [
65] [Pictures 4–7]; Vanmour (n.d.) [Picture 8]; Hommaire [
73] [Picture 9]; Authors [reconstructions, right column].
Figure 2.
Modeling of historical images of Chahar-Bagh Bala Street from the late sixteenth century to the present, showing original visual documents (center column) and parametric digital twin reconstructions (right column). Each reconstruction was constrained and evaluated through documentary comparison, viewpoint analysis, and spatial relationships derived from the historical sources, rather than assessed against a single resemblance criterion. Sources: Chardin [
4] [Picture 1]; Deslandes [
63] [Picture 2]; Holtzer [
72] [Picture 3]; De Bruijn [
65] [Pictures 4–7]; Vanmour (n.d.) [Picture 8]; Hommaire [
73] [Picture 9]; Authors [reconstructions, right column].
Figure 3.
Localization of Chahar-Bagh Bala Street on historical maps and contemporary aerial photographs (1673–2024), showing the continuity of the street axis and the location of lost garden boundaries. The figure presents nine spatial records spanning from the Safavid period to the present, enabling systematic georeferencing of the historic street corridor. Sources: Bembo [
68] [Picture 1]; Kaempfer [
69] [Picture 2]; Rouzrokh & Mair [
57] [Picture 3]; Mehriar et al. [
70] [Picture 4]; Archive of Cultural Heritage Organization of Isfahan, Sayed Reza Khan Map [Picture 5]; Archive of Cultural Heritage Organization of Isfahan, Eugene Beaudouin Map [Picture 6]; Archive of Cultural Heritage Organization of Isfahan, Aerial Photo of Isfahan, 1953, 1956, 2024 [Pictures 7–9].
Figure 3.
Localization of Chahar-Bagh Bala Street on historical maps and contemporary aerial photographs (1673–2024), showing the continuity of the street axis and the location of lost garden boundaries. The figure presents nine spatial records spanning from the Safavid period to the present, enabling systematic georeferencing of the historic street corridor. Sources: Bembo [
68] [Picture 1]; Kaempfer [
69] [Picture 2]; Rouzrokh & Mair [
57] [Picture 3]; Mehriar et al. [
70] [Picture 4]; Archive of Cultural Heritage Organization of Isfahan, Sayed Reza Khan Map [Picture 5]; Archive of Cultural Heritage Organization of Isfahan, Eugene Beaudouin Map [Picture 6]; Archive of Cultural Heritage Organization of Isfahan, Aerial Photo of Isfahan, 1953, 1956, 2024 [Pictures 7–9].
3.3. Parametric and Geospatial Modeling Workflow
The reconstruction workflow consists of nine sequential steps that together constitute the core methodological contribution of this study.
Table 2 summarizes the input data, processing approach, and key parameters for each step before the detailed description that follows.
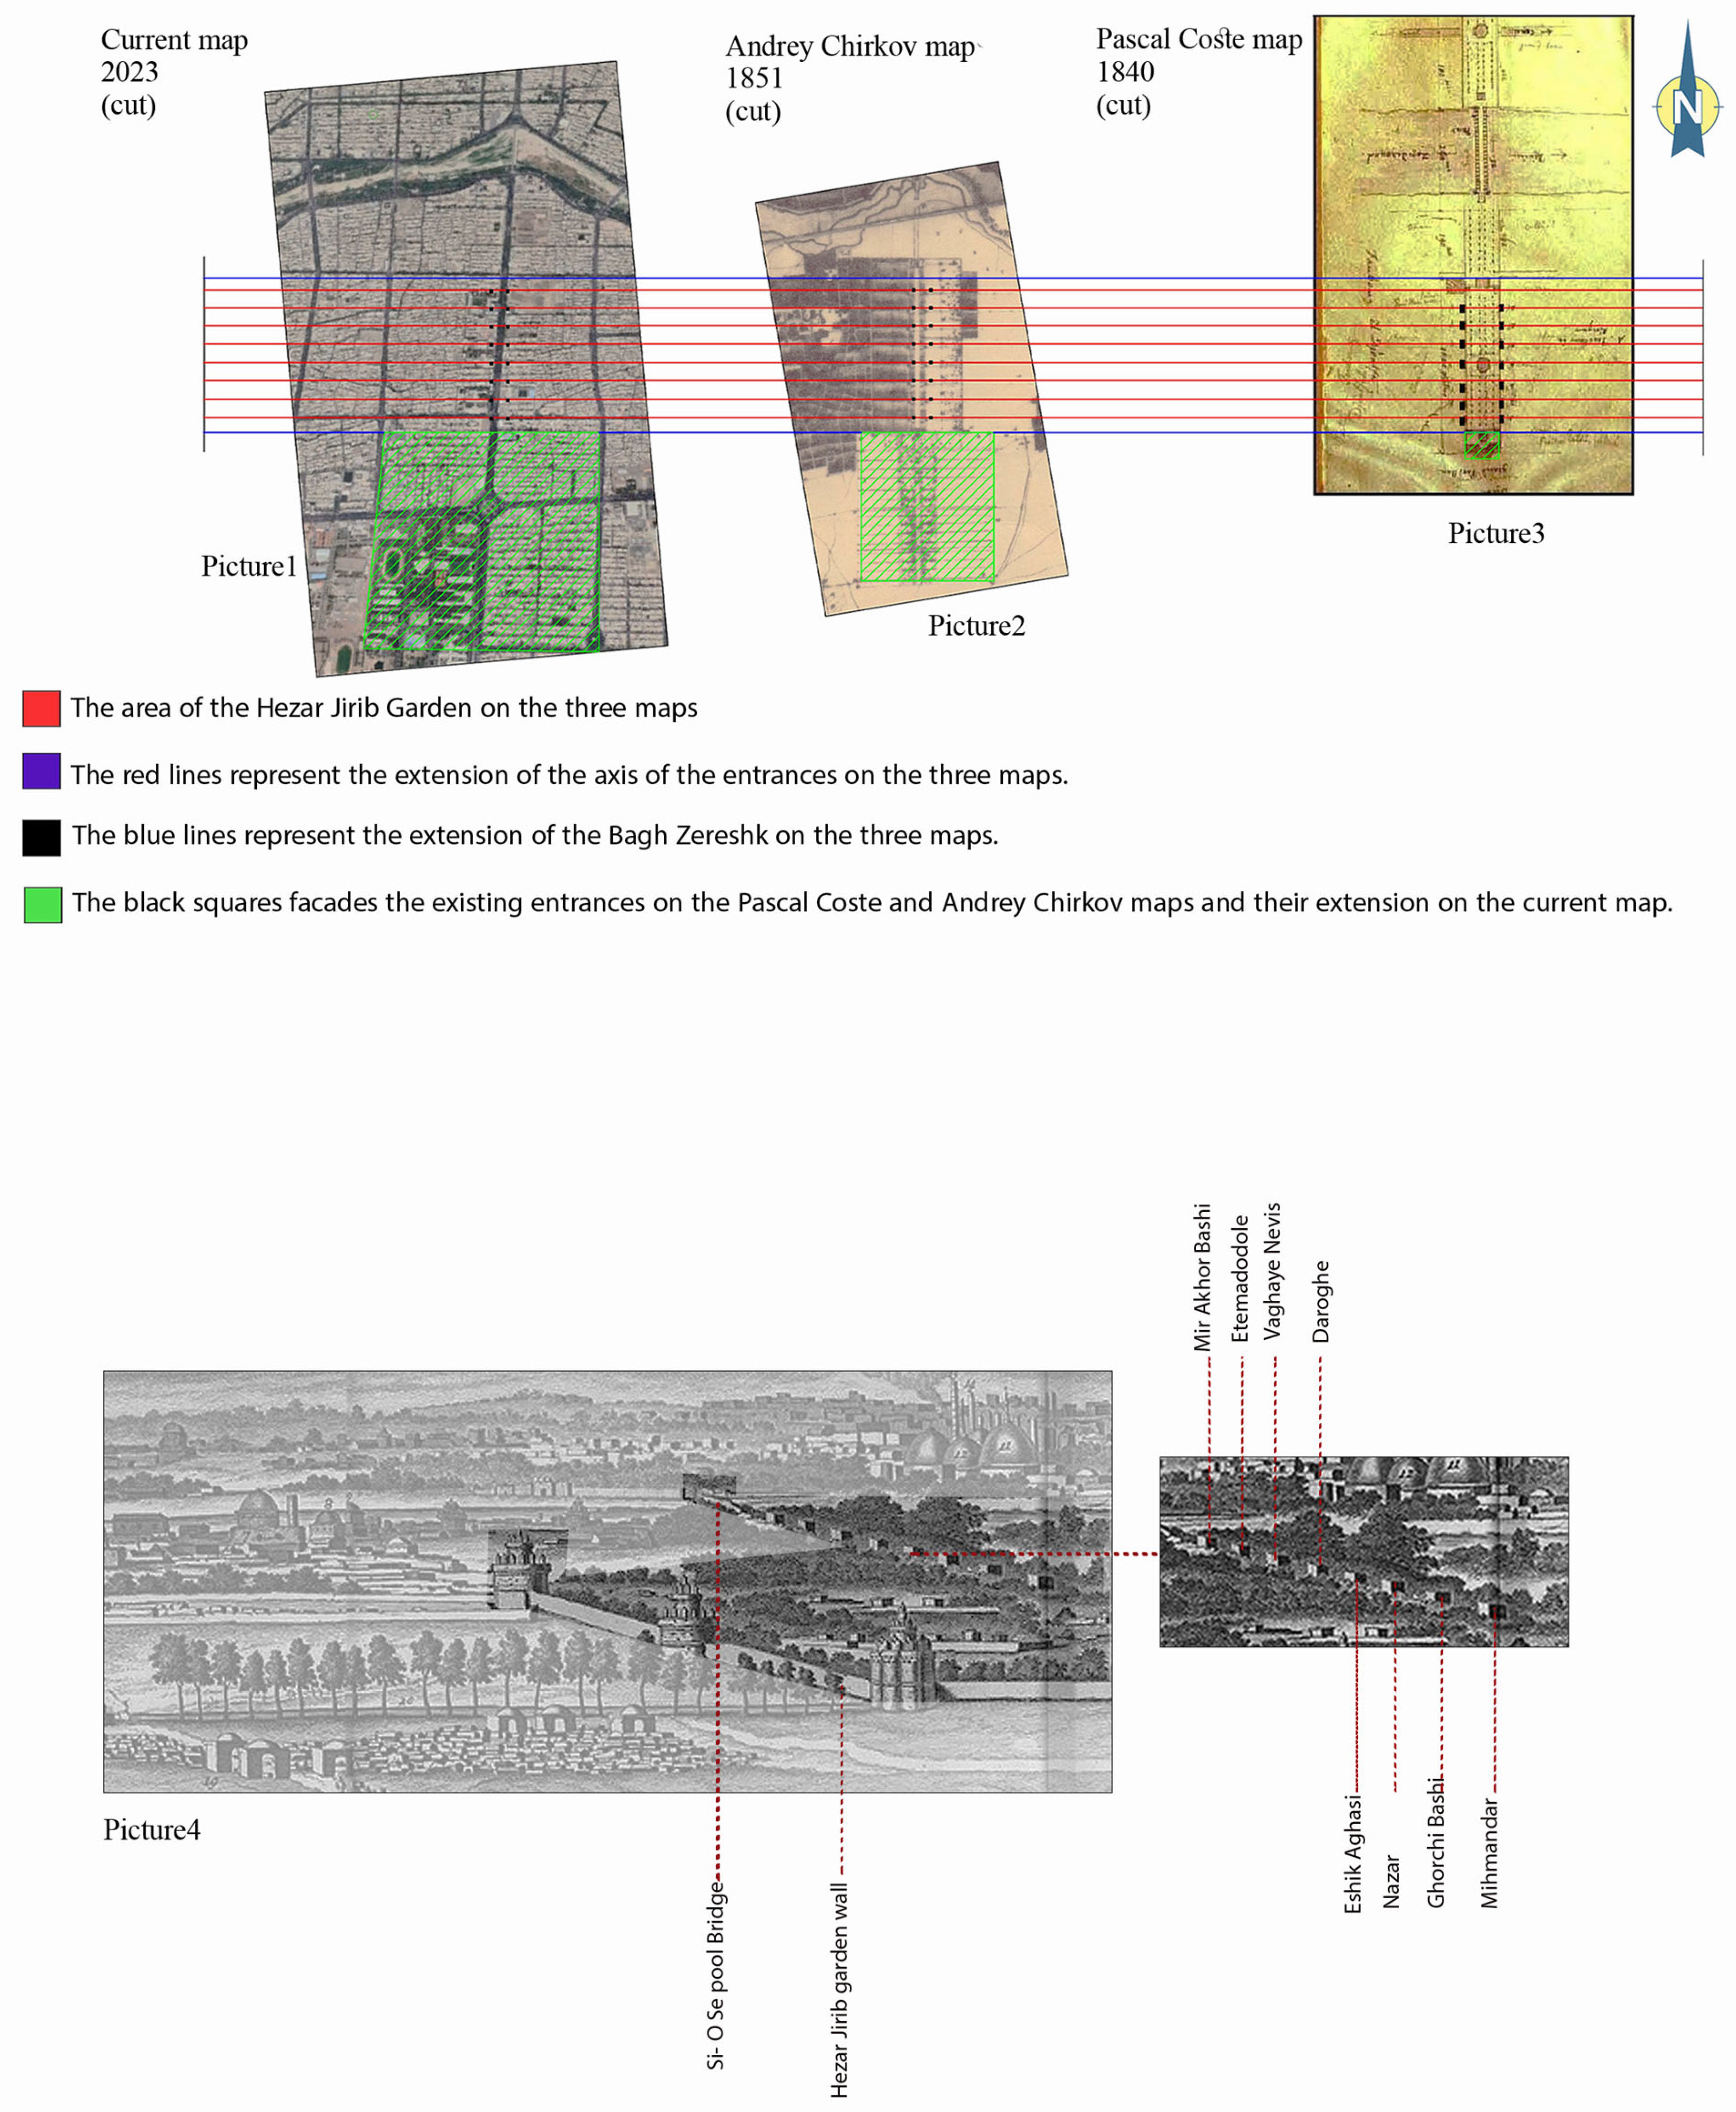
Step 1: Georeferencing. The historical maps of Pascal Coste [
71] and Andrey Chirkov [
70] were placed alongside a contemporary satellite image of Isfahan (Google Maps) and manually aligned by matching relative size, orientation, and the angles between shared reference features, including the Si-o-Se Pol Bridge, the Zayandeh Rud River, and stable street intersections [
44], rather than through a formal coordinate transformation in a GIS environment. This manual visual alignment method was developed specifically for this study: a numerical positional-error metric requires a ground truth of known coordinates, and because the entrances and towers being located no longer exist, no such ground truth is available against which to compute one. The resulting alignment was cross-checked and refined using two independent methods: viewpoint reverse engineering of surviving historical photographs, in which the position and angle from which each photograph was taken is itself reconstructed (Step 2), and comparison against additional independent visual sources depicting the same features.
Figure 4 presents the georeferencing results, showing the alignment of the Pascal Coste map [
71], Andrey Chirkov map [
70], and the contemporary map (2023); the locations of the Hezar Jarib entrance and Zereshk Garden wall are consistently positioned across all three maps [
57,
70], reflecting convergent visual alignment across independent sources rather than a quantified positional error.
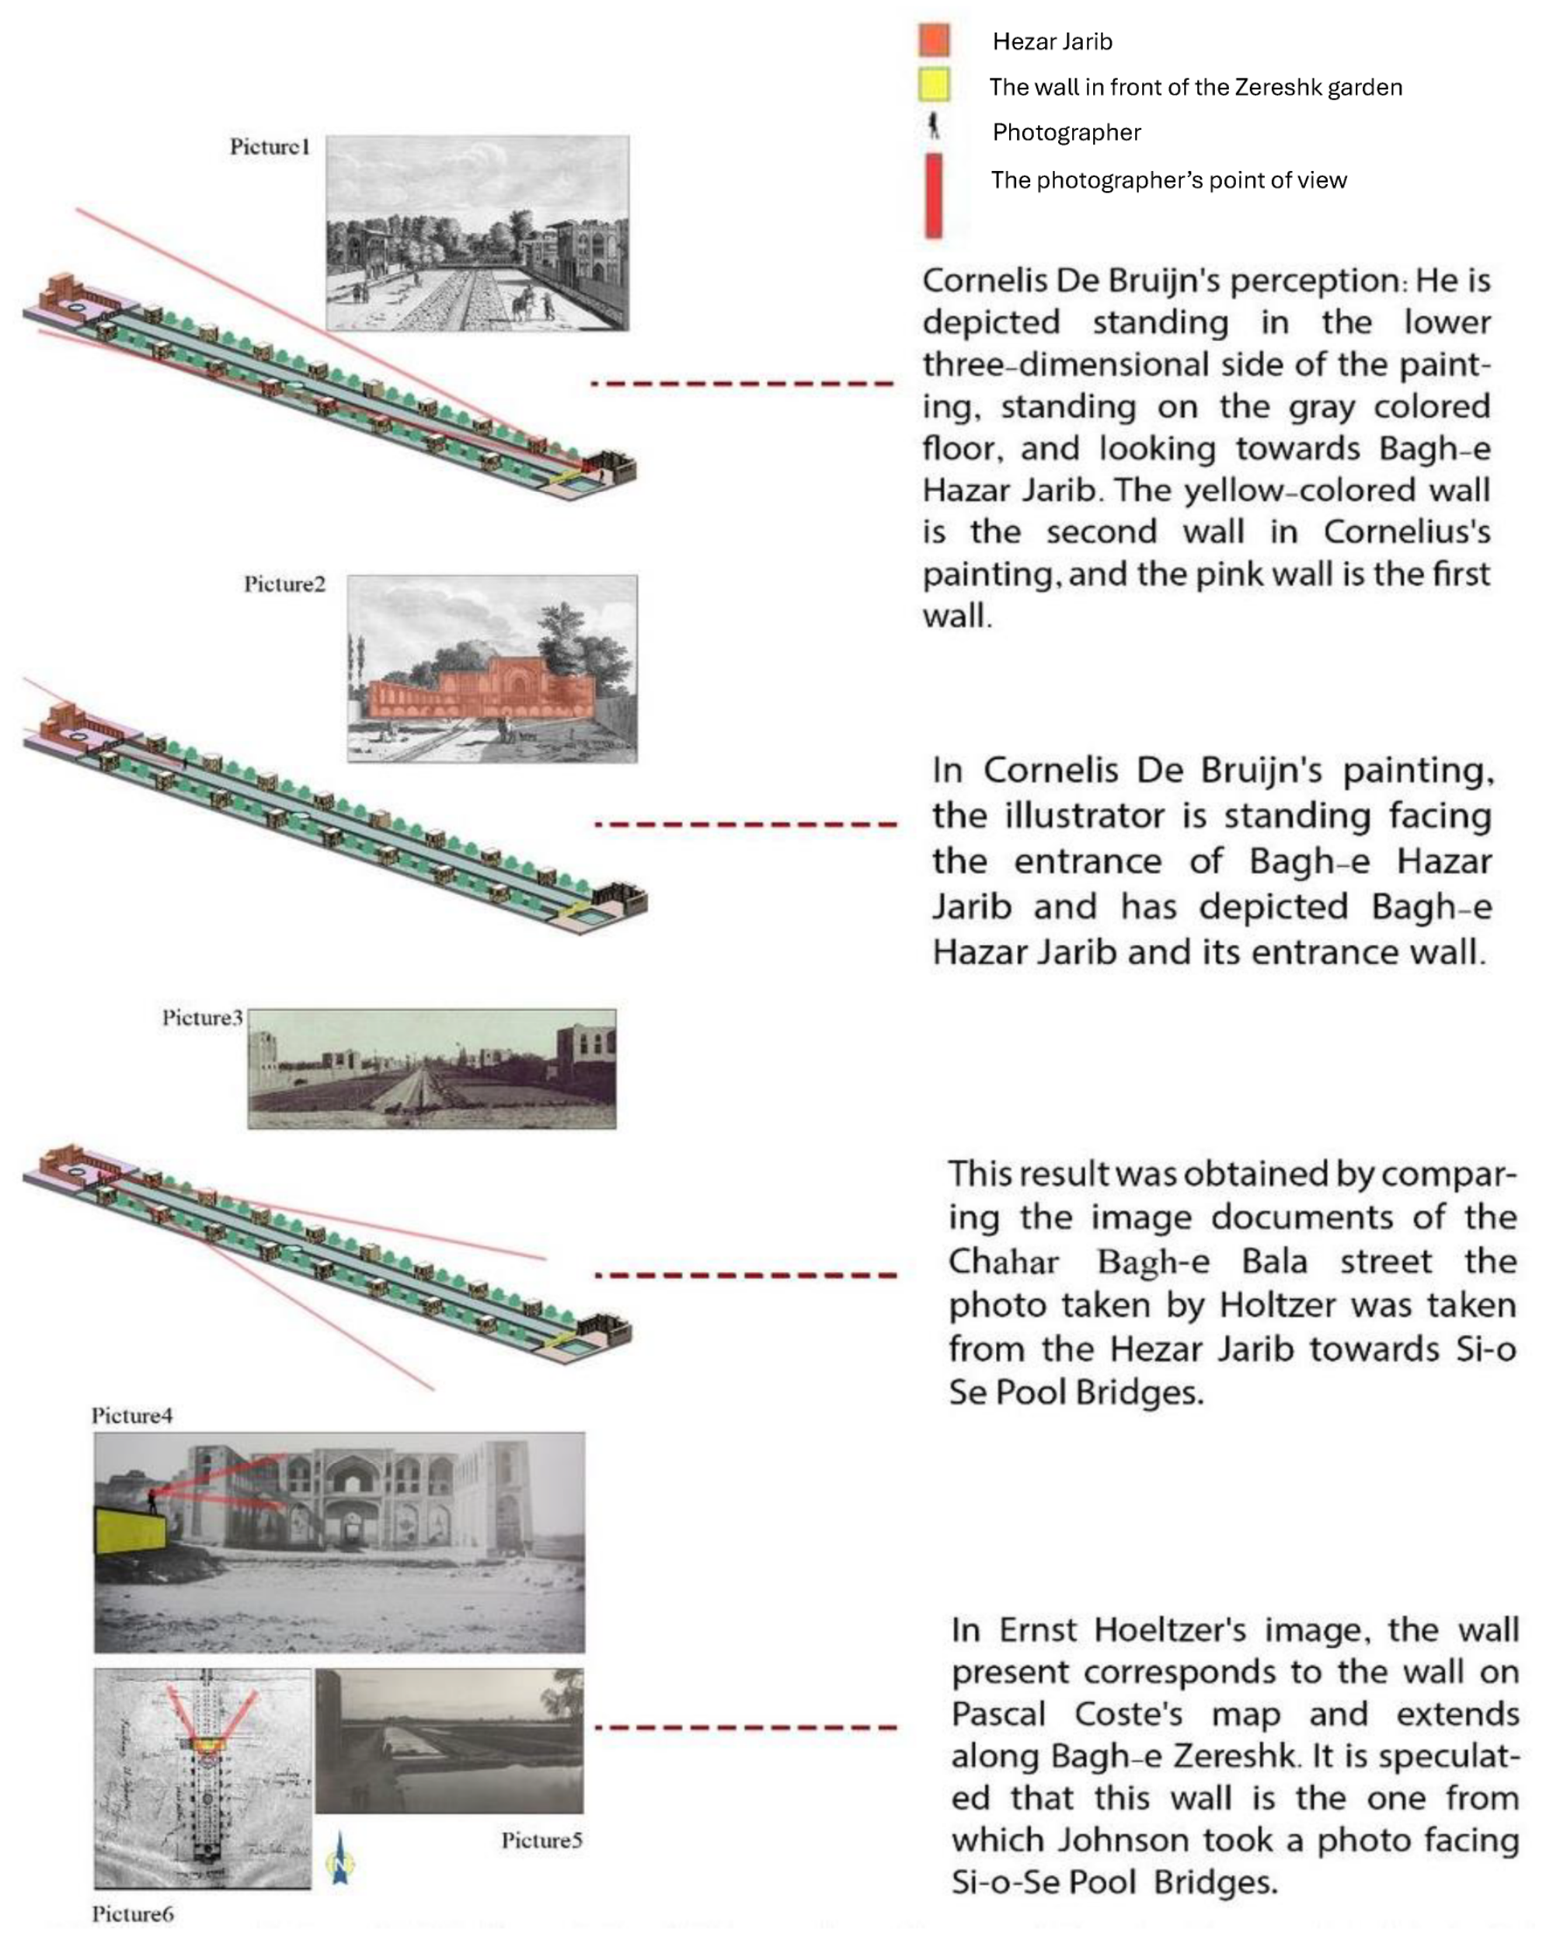
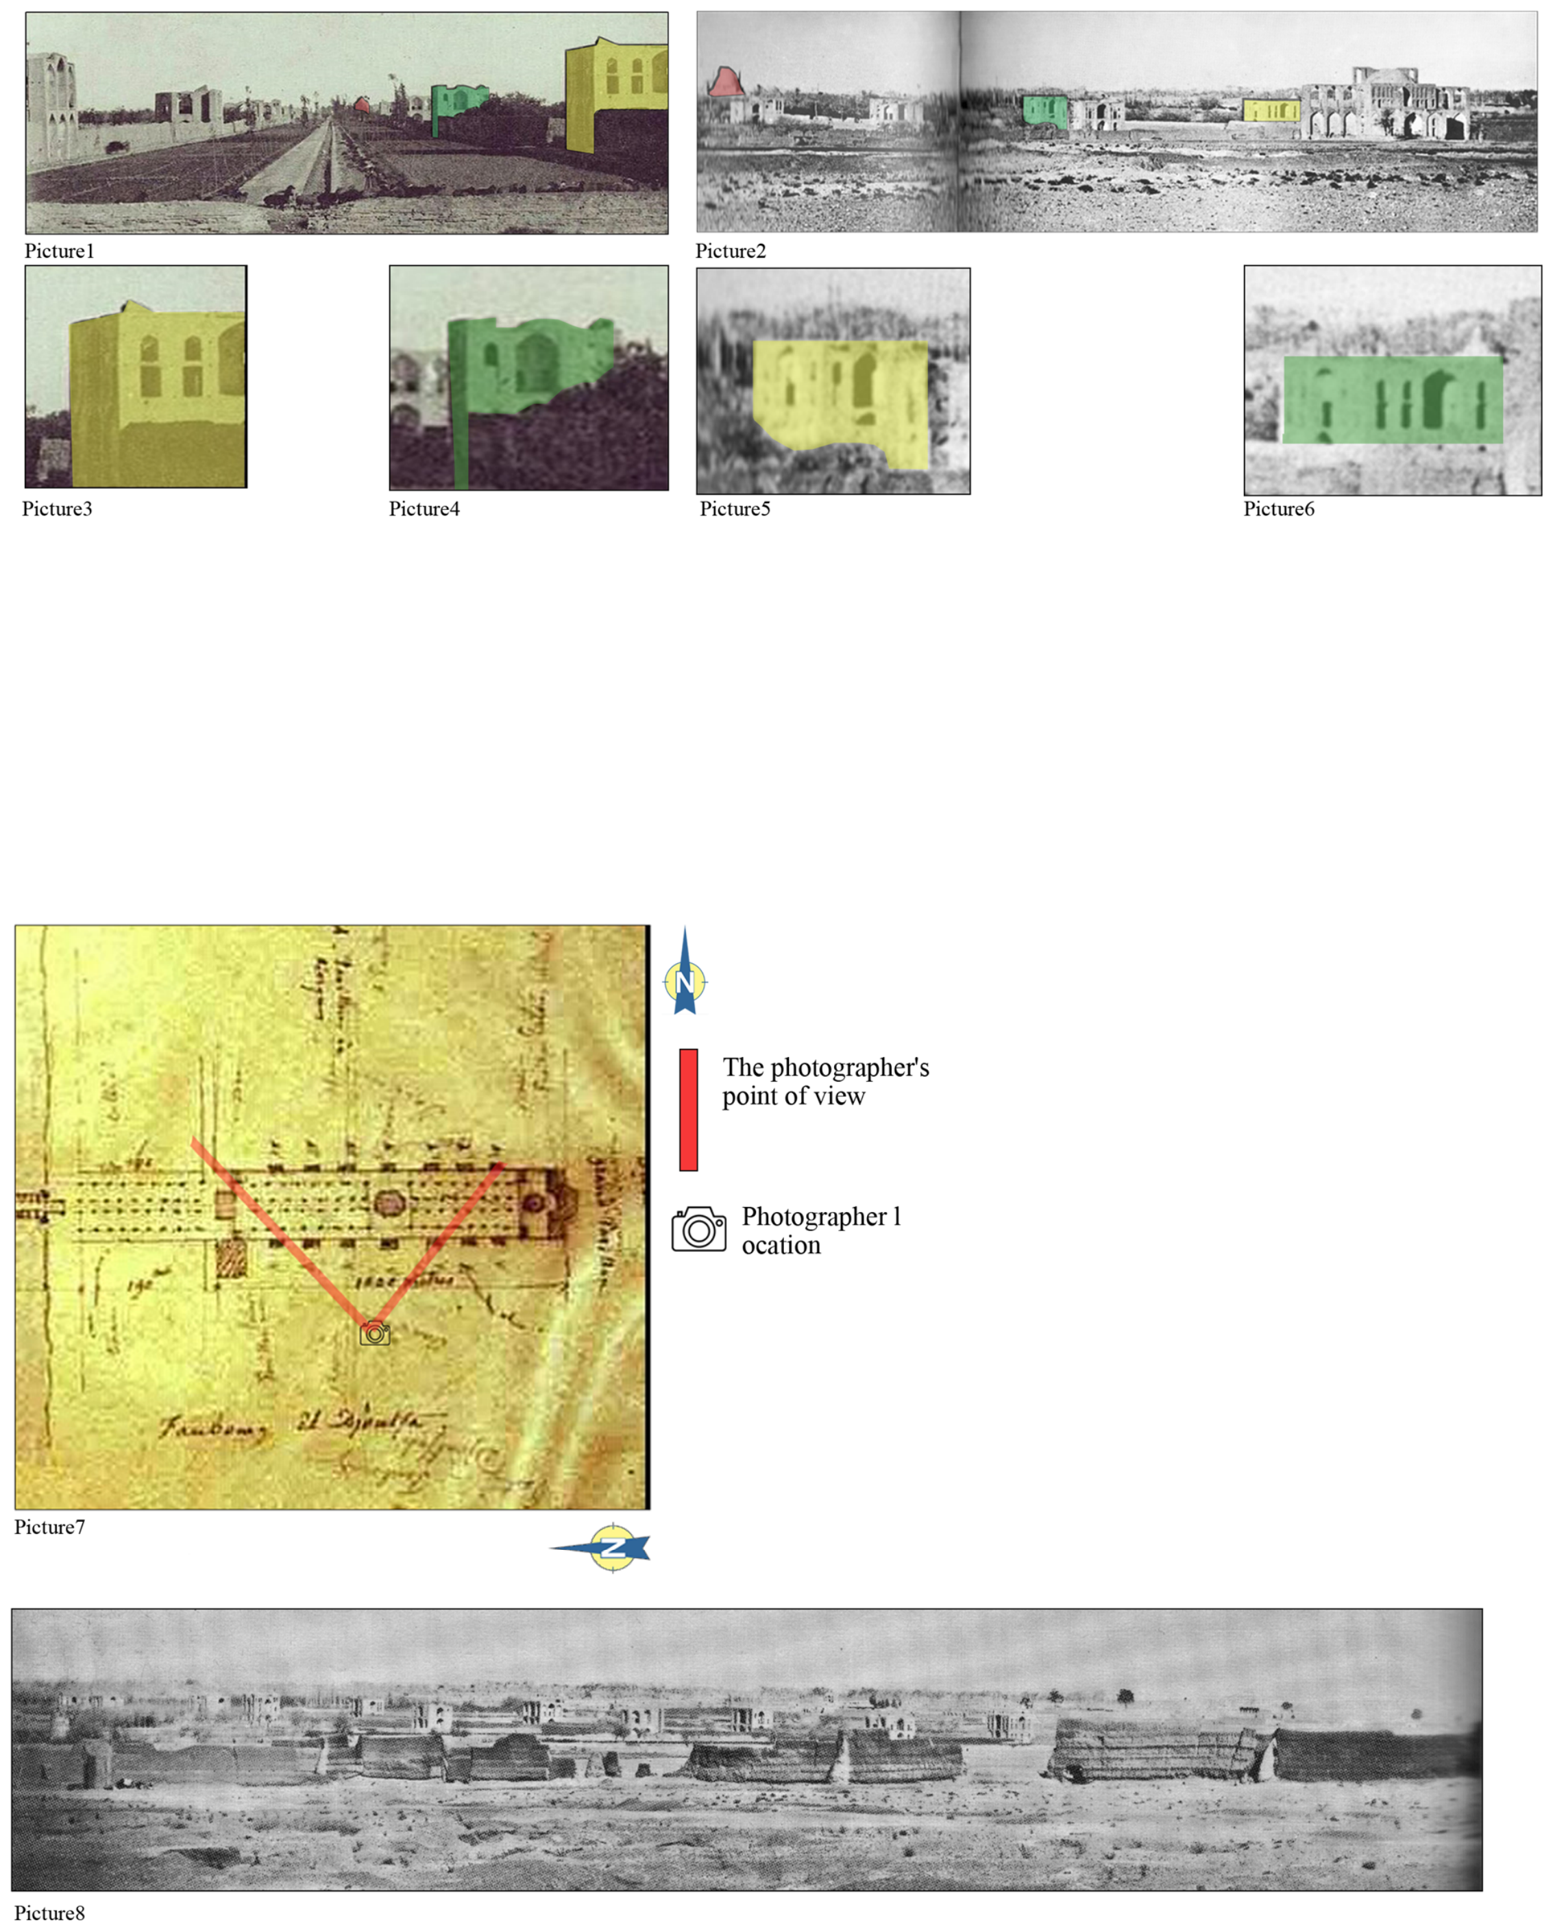
Step 2: Historical–spatial viewpoint reconstruction. For each engraving and photograph, the position and viewing angle of the artist was determined through analysis of perspective geometry, horizon lines, and the relative positions of identifiable features [
45]. This step functions as a historical–spatial verification methodology: locating an artist’s physical position within the urban fabric provides independent spatial evidence about the layout and elements of the streetscape at the time of recording.
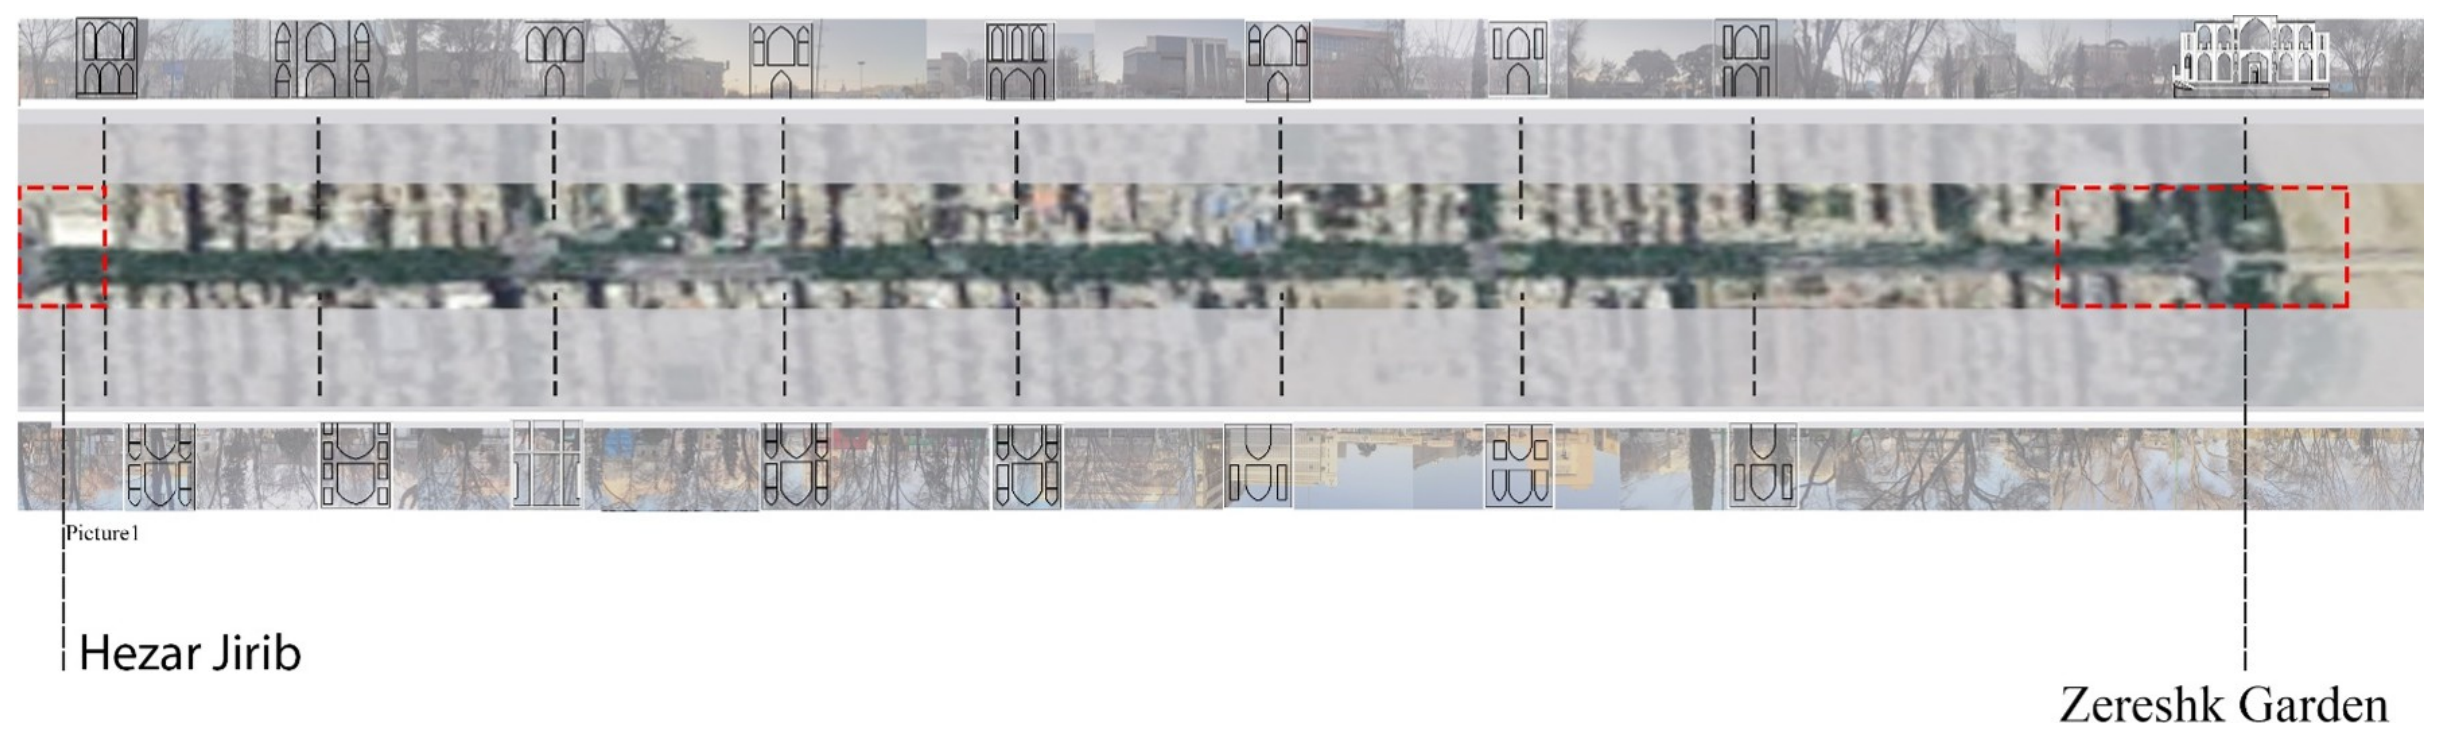
Figure 5 presents the historical–spatial viewpoint analysis, determining the position and viewing angle of each artist and photographer in relation to the street corridor [
57,
65,
72,
74].
Step 3: Cross-artist reliability assessment. An artist might have illustrated a map of a forgotten section of the city that has not been captured by others. To verify the accuracy of this map, it can be evaluated by comparing it with existing designs and analyzing its proportions. If the artist has also photographed other cityscapes with structures and urban features that are still present, the precision of those depictions can be compared to the map to gauge its accuracy [
65,
72]. Each artist who depicted Chahar-Bagh Bala Street also depicted surviving structures in Isfahan. By comparing their depictions of surviving structures with actual built form, the accuracy level of each artist was established before using their images as reconstruction evidence.
Step 4: Two-dimensional comparative analysis. All two-dimensional documents were compared systematically. Common features visible across multiple sources were identified and cross-referenced to resolve inconsistencies.
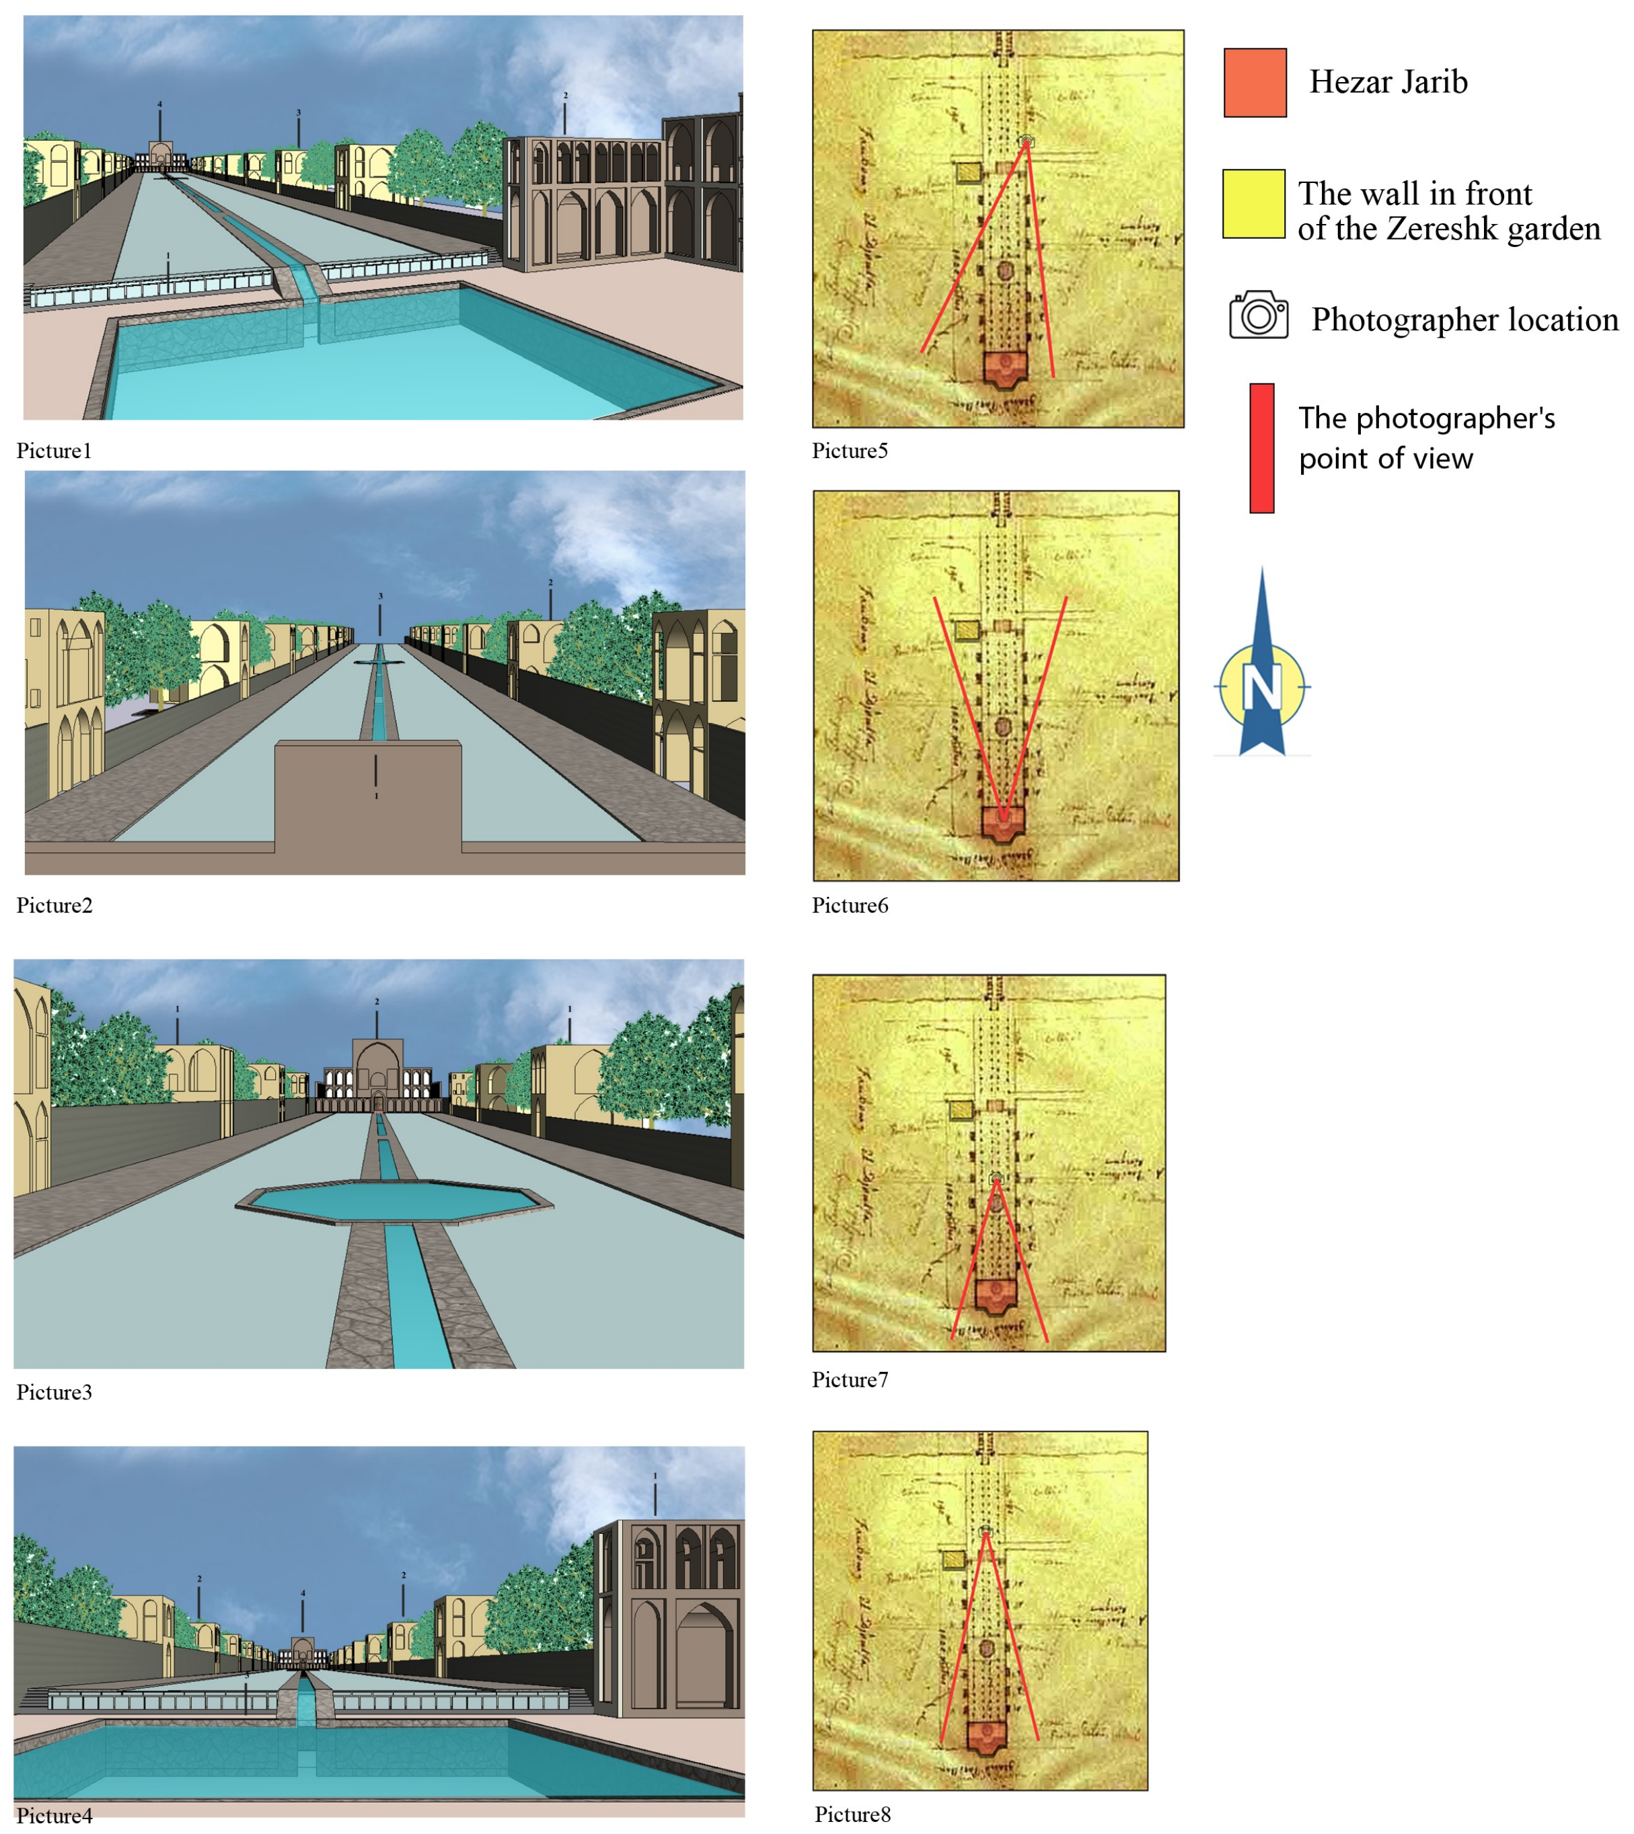
Step 5: Two-dimensional to three-dimensional progressive validation. Documents were redrawn digitally and converted into three-dimensional models. The models were then compared back against the original two-dimensional sources to verify consistency.
Figure 6 presents the three-dimensional parametric models of various landscape perspectives of Chahar-Bagh Bala Street derived from the Pascal Coste map [
71], with sightline diagrams showing photographer positions in relation to the Hezar Jarib Garden and Zereshk Garden wall [
57].
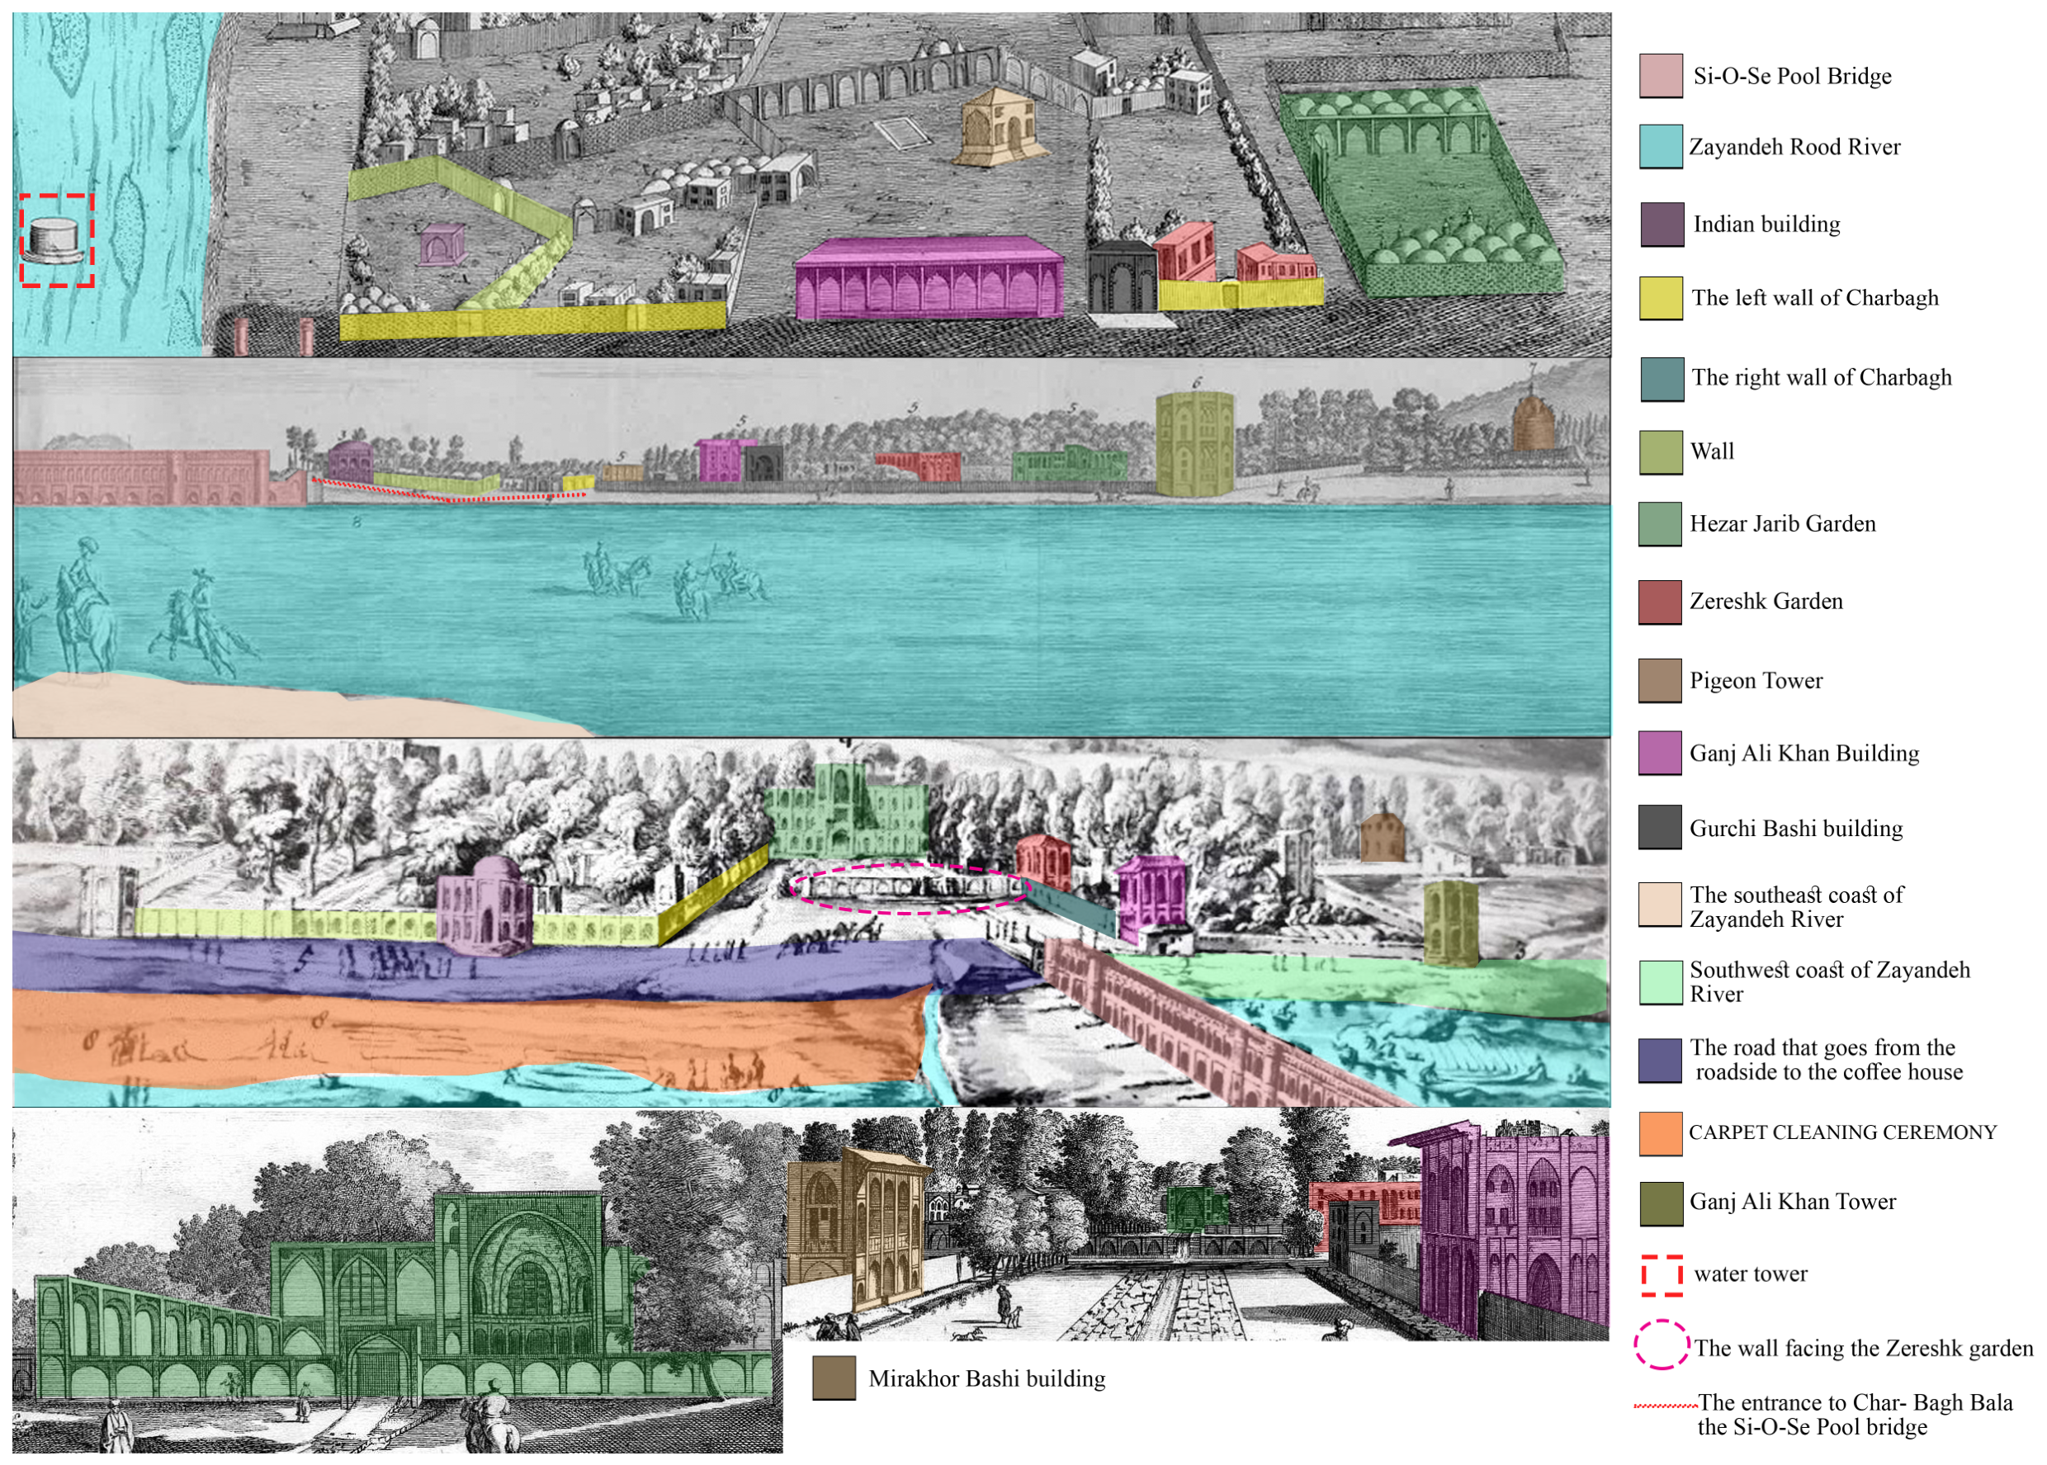
Step 6: Color-coded analytical mapping. Panoramic images were analyzed using a color-coding system in which each identifiable architectural element was assigned a distinct color and labeled.
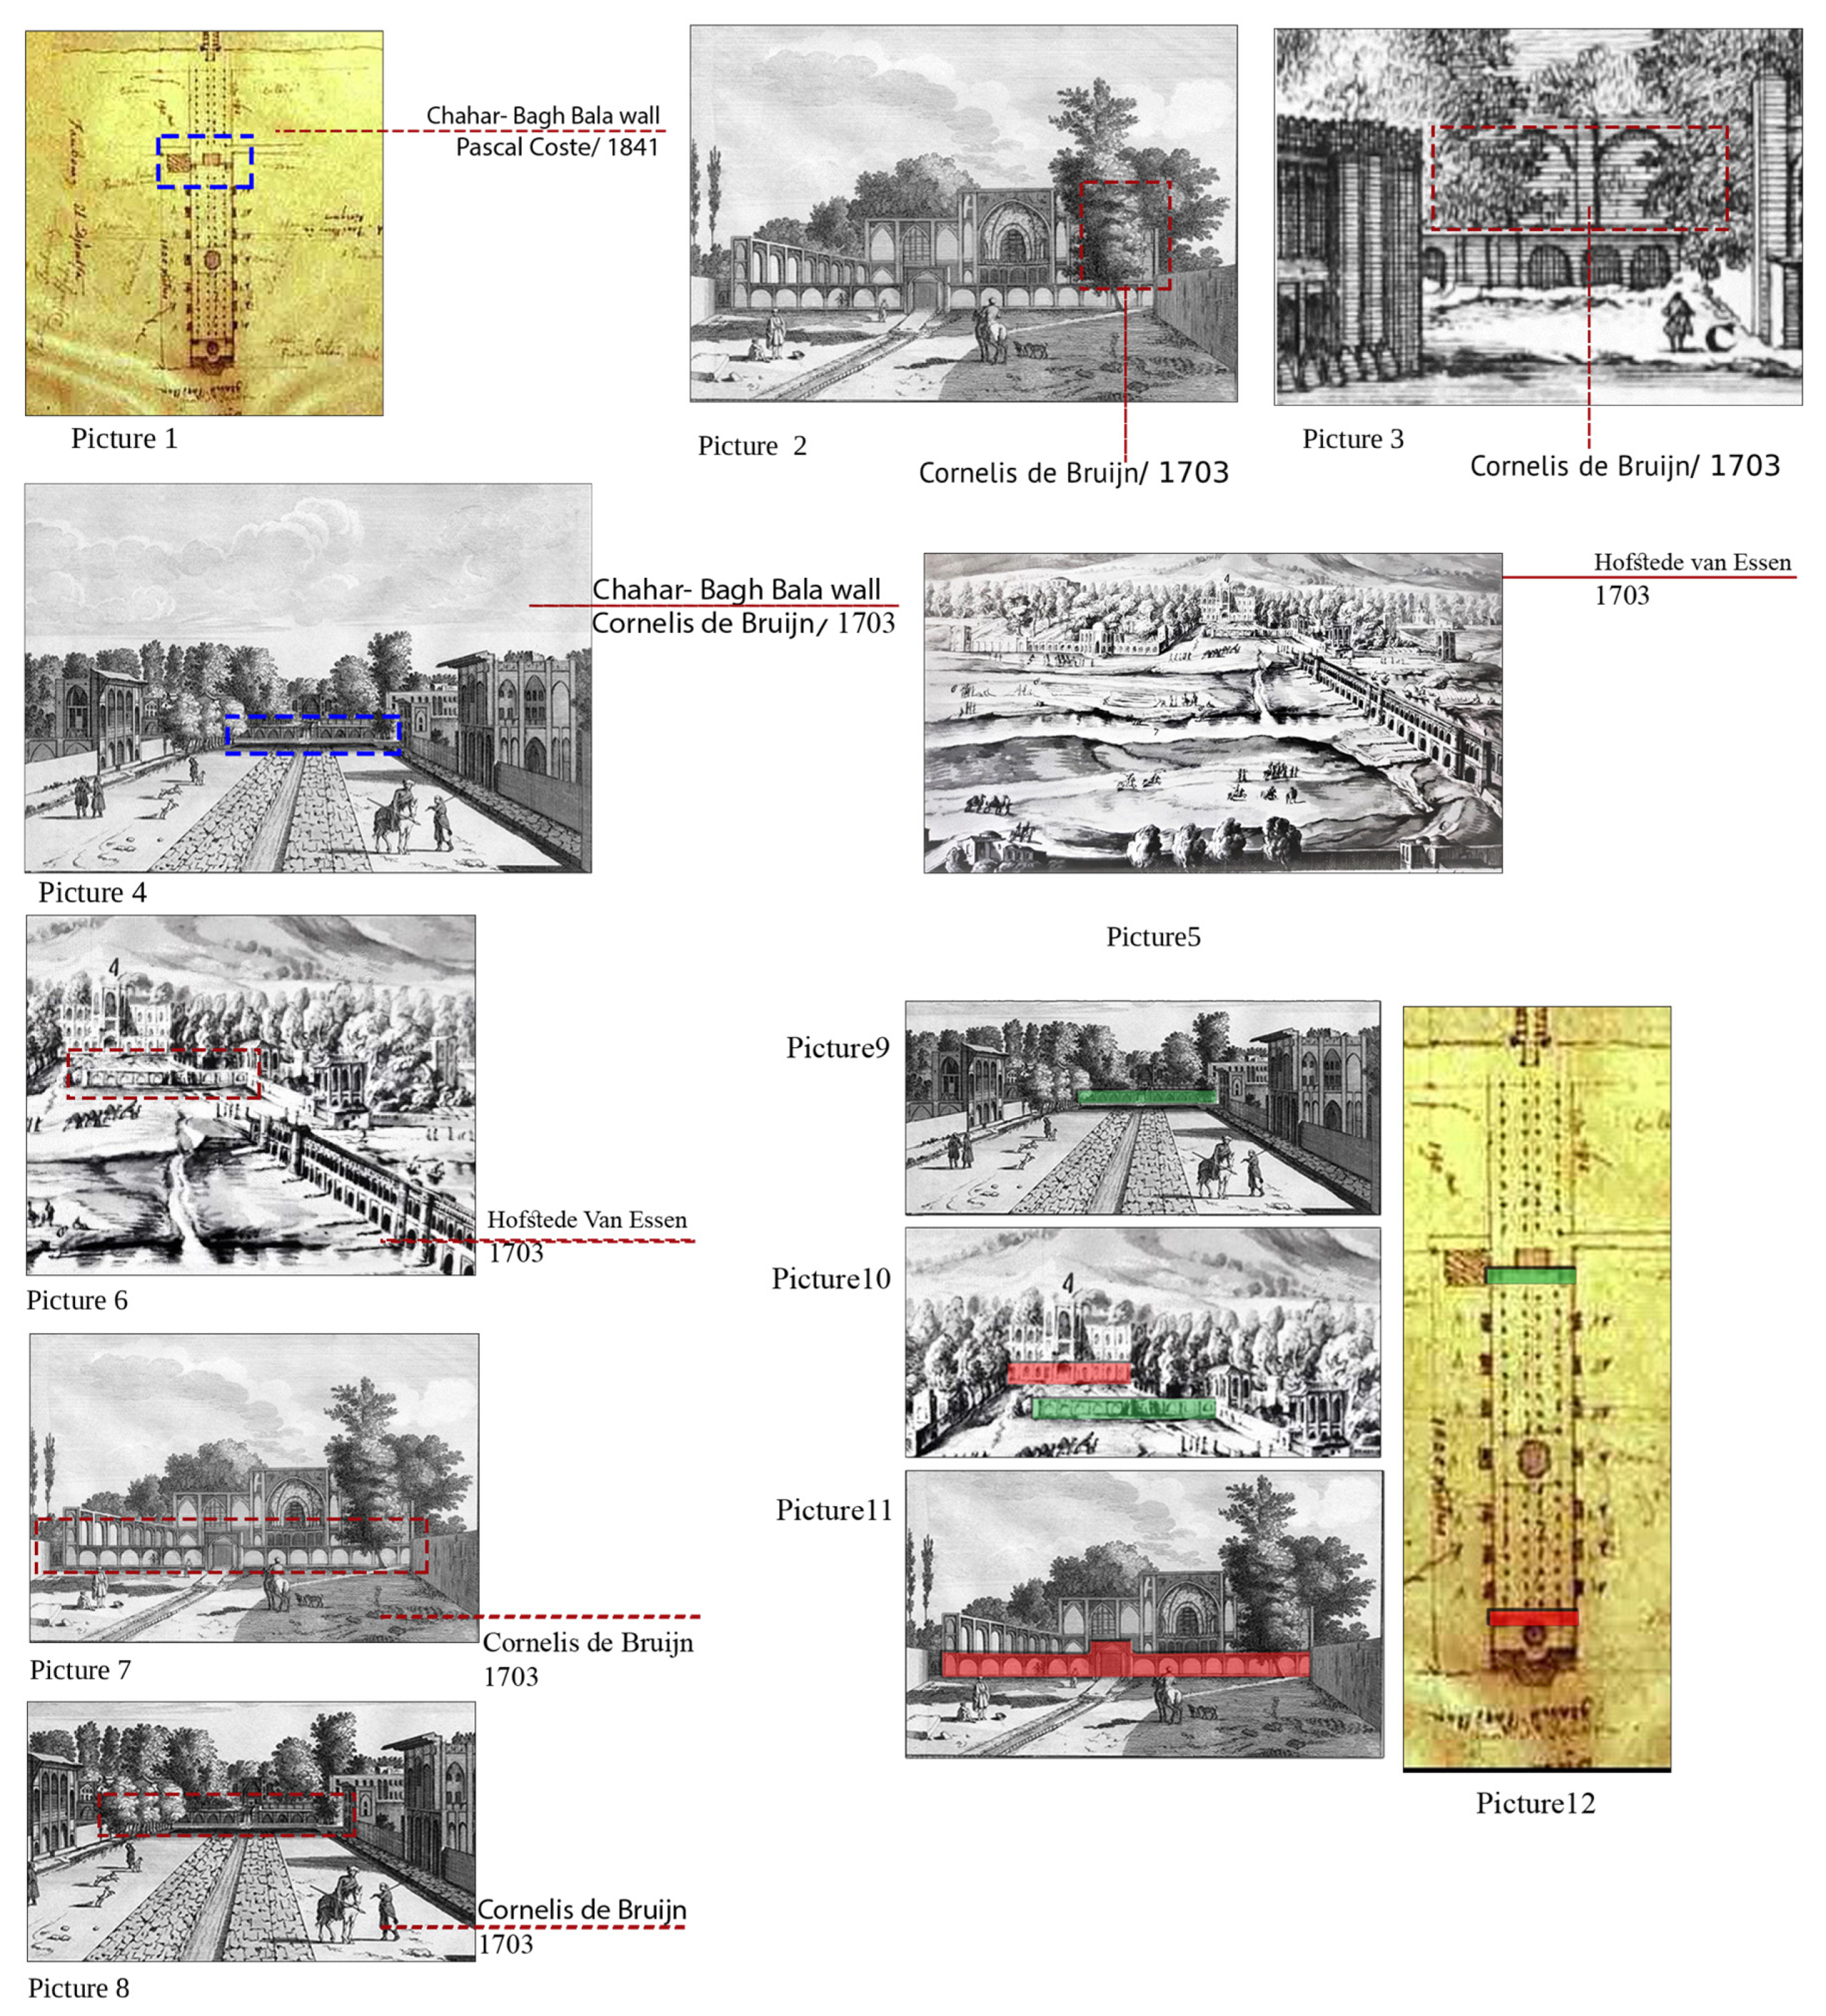
Step 7: Negative evidence method. This study introduces a negative evidence approach in which absence within visual records is analytically interpreted through viewpoint geometry and visibility conditions, rather than treated as direct evidence of nonexistence. In some images, structures expected to be visible based on their known location were absent. The study analyzed the viewing angle, distance, and field of view to explain this absence. This method confirmed the existence of the two major garden entrances.
Step 8: Typological comparison with surviving Safavid buildings. Where documentary evidence was insufficient, lost elements were compared with surviving structures from the same period, including Bagh-e Fin in Kashan and elements of the Naqsh-e Jahan Square complex in Isfahan, to infer proportions and spatial organization.
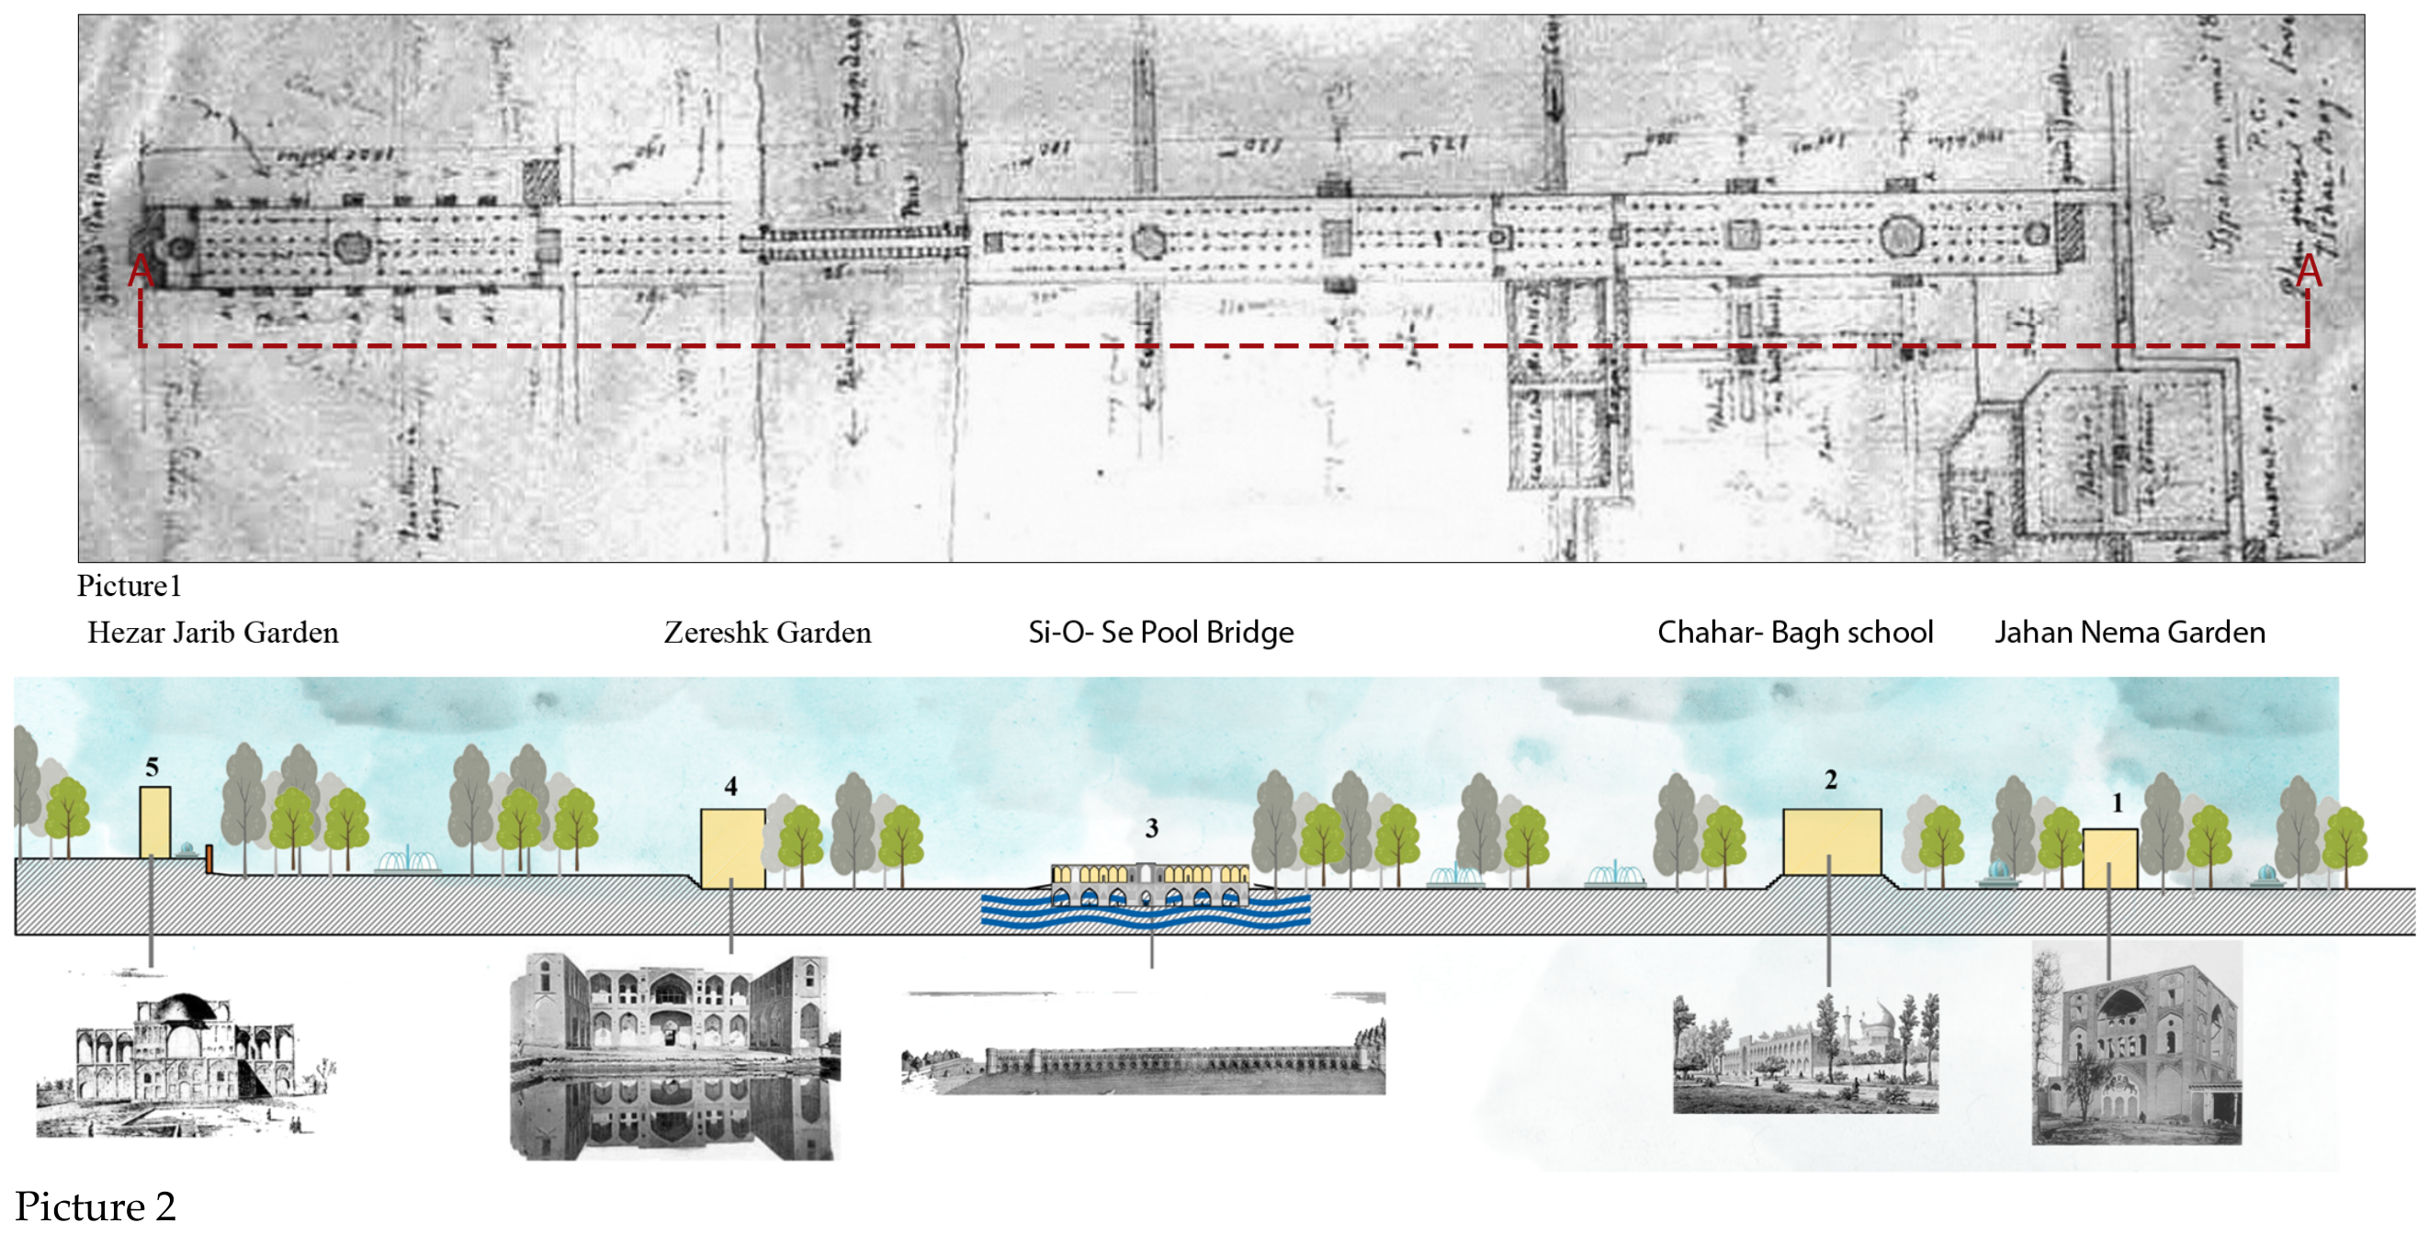
Step 9: HBIM parametric reconstruction. The information gathered through Steps 1 to 8 was used as input for parametric modeling in REVIT software, following HBIM workflows. In the current implementation, each reconstructed element is linked to its documentary source and certainty classification through the external evidentiary record maintained alongside the model, rather than through metadata fields embedded in the REVIT components themselves. Embedding a structured source-and-certainty parameter directly within each BIM component, so that this documentary linkage travels with the model file itself, is identified as a priority extension of this workflow (
Section 5.3). A longitudinal section of the full royal axis was produced, extending from Hezar Jarib Garden through Si-o-Se Pol Bridge to Jahan Nema Garden.
To illustrate the metadata schema proposed as a priority extension of this workflow (
Section 5.3),
Table 3 shows a worked example of the fields such a schema would record for a single element, using the Hezar Jarib Garden entrance as an illustrative case. This schema is a recommendation for future implementations rather than a field already embedded in the present REVIT model, in which this linkage is currently maintained externally.
3.4. Sustainable Urban Landscape and Green Infrastructure Analysis
In addition to the architectural reconstruction, this study conducts a sustainability and governance analysis focused on the historic green infrastructure of Chahar-Bagh Bala Street. The madi canal network was a central element of the urban landscape of Isfahan since its earliest residential nuclei, integrated throughout the Safavid urban extensions and providing the water and vegetation infrastructure that defined the ecological character and urban cooling capacity of the garden corridor [
6]. This network represents an early form of blue–green infrastructure that combined ecological services, including stormwater management, urban cooling, and biodiversity support, with productive agricultural functions [
10,
11].
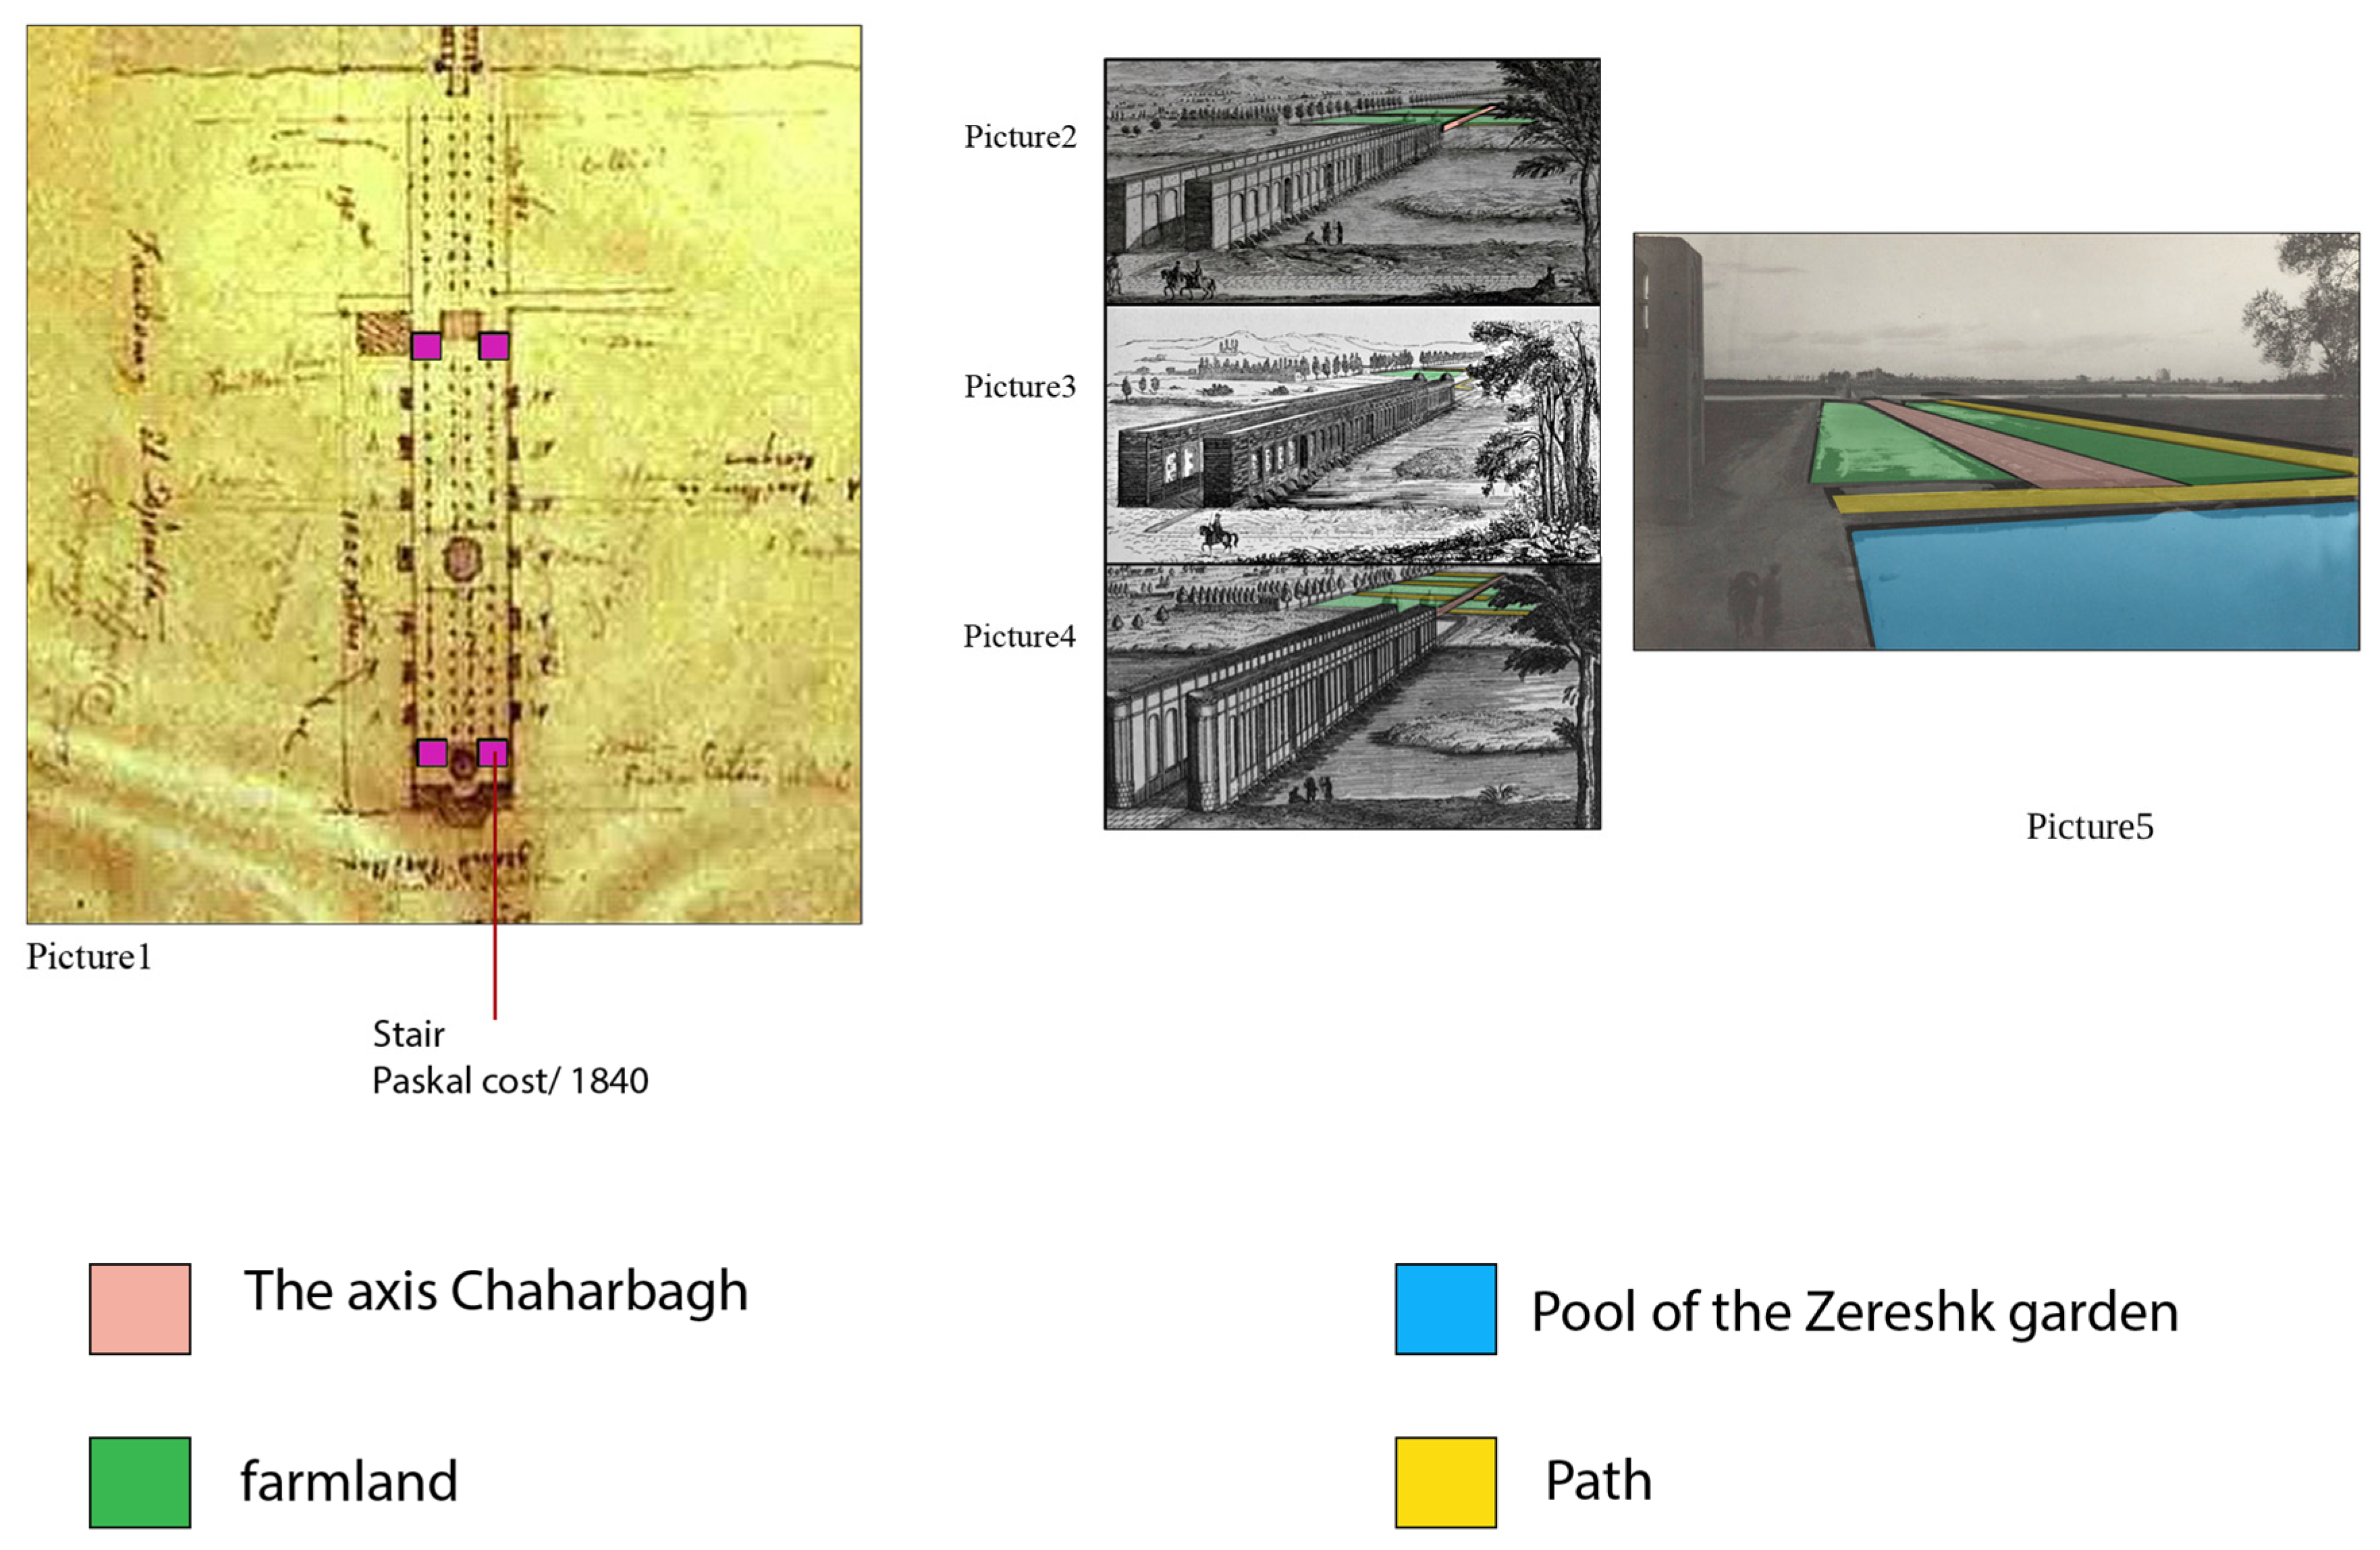
To avoid relying on a single evaluation dimension, the quantitative assessment used archival maps and contemporary aerial photographs to evaluate green infrastructure loss along three complementary dimensions. The first dimension is the areal footprint: the boundaries of the major gardens were traced on the earliest available visual documents (historical maps and images) and compared against current satellite imagery (Google Maps) of the same corridor to estimate the proportion of the original garden area that has been lost. The second dimension is water-system continuity: the documented madi canal network, stone channels, and fountains were mapped from historical sources and cross-checked against contemporary aerial photography and field conditions to determine whether each documented feature survives, is degraded, or has been lost entirely. The third dimension is land-use and vegetation-type transition: the color-coded period maps (
Section 4.1) distinguish original garden cover from the farmland and, subsequently, non-green urban land uses that replaced it, allowing the change in vegetation character, not only areal extent, to be tracked across periods. Water features were also mapped and compared with the current state of the street. The qualitative evaluation drew on findings from this three-dimensional loss assessment to identify implications for urban regeneration policy, climate adaptation planning, and ecological resilience in the historic corridor [
1,
10,
11,
53]. This analysis positions the documentary-based UDT framework as a tool not only for heritage reconstruction but also for evidence-based urban regeneration and landscape governance planning.
Table 4 makes explicit, for each loss dimension, the historical and current reference used, the delineation method applied, and the resulting estimate. We emphasize that these are estimates obtained through visual comparison and overlay rather than a formal GIS area computation with a quantified error margin, consistent with the accuracy paradigm stated in
Section 3.1: the reconstructed elements no longer exist to provide a surveyed ground truth against which a numerical error could be computed.
3.5. Validation Framework
The validation framework consists of four layers, applied jointly to determine the certainty classification of every reconstructed element. The first layer is source triangulation: rather than relying on any single source, each candidate element is checked against all available documentary sources of different types, including measured cartographic surveys, aerial photographs, artist engravings and panoramas, and travel accounts. An element is classified as confirmed only when at least two independent sources of different types corroborate both its existence and its location; as inferred when only one primary source documents it directly, provided its form and position can additionally be cross-checked through typological comparison with confirmed analogues elsewhere in the corridor; and as provisional when no source directly depicts the element and its position is reconstructed solely from indirect spatial reasoning, such as continuity with the confirmed alignment of adjacent elements or negative-evidence analysis. This classification is never based on a single reference for any element in the model: source count, source type, geometric consistency with georeferenced control features, and typological precedent are combined jointly in every case, consistent with the multi-criteria geometric logic of the reconstruction as a whole rather than a fixed numerical distance threshold. The second layer is spatial accuracy testing: all georeferencing operations were validated using the Si-o-Se Pol Bridge and the Zayandeh Rud River as fixed reference features. The third layer is cross-artist verification: where the same architectural element was depicted by multiple artists, the depictions were compared and contradictions were resolved through the reliability assessment from Step 3. For example, the Ganjali Khan Tower and the Hezar Jarib entrance were each cross-verified against depictions by de Bruijn, Holtzer, and Hofstede van Essen. The fourth layer is comparative methodological benchmarking: the documentary-based UDT workflow was compared with global UDT heritage projects including the Roman Forum and Al Zubarah to assess the relative completeness and analytical rigor of the approach applied in this study [
46]. A related concern is that the same historical sources could, in principle, be used both to reconstruct an element and to validate it, making the validation circular. This is avoided structurally rather than assumed away: no element is confirmed on the strength of a single source validating itself. Confirmed elements require at least two independent sources of different types (
Section 3.5, first layer); cross-artist verification (third layer) checks one artist’s depiction of the study corridor against that same artist’s depiction of independently verifiable surviving structures elsewhere in Isfahan, rather than against another depiction of the same lost element; and the negative evidence method (Step 7) uses the documented absence of a feature in one source, explained through that source’s viewing geometry, as independent corroboration rather than reusing the same positive evidence twice. In this way, no confirmed element in the reconstruction relies on a single source to both establish and validate its existence.