Article

Digital Infrastructure and Industrial Green Innovation in China: An Empirical Study on Efficiency Measurement and Impact Assessment


by
Xuemei Du
and
Zhuwentian Zhou
*
School of Economics and Management, Tongji University, Shanghai 200092, China
*
Author to whom correspondence should be addressed.
Sustainability 2026, 18(16), 8501; https://doi.org/10.3390/su18168501
Submission received: 4 July 2026 / Revised: 11 August 2026 / Accepted: 17 August 2026 / Published: 19 August 2026
(This article belongs to the Section Economic and Business Aspects of Sustainability)

Abstract

As emerging economies navigate the global “twin transition”, decoupling industrial growth from environmental degradation has become an urgent imperative. This study investigates the fundamental role of digital infrastructure in driving Industrial Green Innovation Efficiency (IGIE). Utilizing panel data from 30 Chinese provinces spanning 2012 to 2022, we first measure the environment-adjusted IGIE employing a three-stage global SBM-DEA model to mitigate external environmental interferences and statistical noise. Subsequently, a two-way fixed-effects model, fortified by a Bartik-type instrumental variable (IV-2SLS) approach, is constructed to identify causal impacts. The descriptive results reveal that China’s overall IGIE exhibits a fluctuating upward trajectory, although absolute efficiency levels remain low. Furthermore, significant regional variations characterize the national landscape, manifesting as Eastern leadership, Central catch-up, Western improvement, and Northeastern volatility. Crucially, empirical baseline estimations confirm that digital infrastructure exerts a robust positive effect on IGIE. Mechanism analyses further demonstrate that this efficiency enhancement is primarily driven by the promotion of digital inclusive finance and localized technological diffusion. These findings theoretically enrich the understanding of digital empowerment and provide a practical blueprint for policymakers globally to formulate targeted infrastructure investments and differentiated regional transformation strategies.

1. Introduction

Entering a new stage of development, China’s economic and social development is undergoing a critical period of deep structural adjustment and systemic transformation. Green, low-carbon transition and digital transformation have increasingly become the two core drivers of high-quality development. Under the “dual carbon” strategic goals, the industrial sector, characterized by high energy consumption and high emissions, has become a key area for green transformation. However, deeply influenced by a long-standing extensive growth model, China’s industrial sector still faces prominent issues such as an overly heavy industrial structure, a coal-dominated energy structure, insufficient green technology innovation capabilities, and low resource allocation efficiency. These challenges not only restrict the progress of industrial green and low-carbon transformation but also impede the realization of the “dual carbon” goals. The essence of industrial green transformation lies in improving resource allocation efficiency and environmental performance through technological progress and factor reconstruction. Measuring and improving Industrial Green Innovation Efficiency (IGIE) is therefore imperative. It is crucial to evaluate whether the level of digital infrastructure, as an important carrier of new quality productive forces, genuinely impacts IGIE, which holds significant theoretical value and provides empirical evidence for policymaking.
The conceptualization of digital infrastructure in the academic literature has evolved considerably. Early contributions characterized it as a multi-layered socio-technical system integrating physical communication networks, data centers, and software protocols [1,2]. Subsequent research has extended this view, recognizing digital infrastructure as a novel factor that embeds computing power and algorithmic capabilities [3]. Building on these foundations, various evaluation frameworks have been proposed, ranging from basic indicators such as broadband density to comprehensive hierarchical systems [4,5,6,7]. These studies have provided valuable methodological references for quantifying digital endowments across regions [8,9].
One aspect worth further examination concerns the prevailing practice of constructing composite indices that simultaneously incorporate supply-side hardware metrics and demand-side utilization outcomes. When the dependent variable of interest is economic or innovation performance, this aggregation may complicate the interpretation of infrastructure’s exogenous contribution, as utilization metrics tend to be endogenous to regional development trajectories [10,11,12]. While this observation does not diminish the value of existing measurement frameworks, it suggests that a more granular treatment of infrastructure components could enrich our understanding of their distinct economic functions.
Similarly, the methodology for measuring Industrial Green Innovation Efficiency (IGIE) has undergone substantial refinement. Early applications of traditional radial DEA and Malmquist indices provided foundational tools for efficiency assessment [13,14,15]. In response to growing environmental concerns, scholars have incorporated non-desirable outputs such as energy consumption and pollution emissions to reflect the green attributes of industrial innovation [16,17,18,19]. Recent advances have employed super-efficiency SBM models to further differentiate efficient decision-making units [20,21]. Despite these methodological improvements, most existing studies do not fully isolate the confounding effects of external environmental conditions and statistical noise. While several studies have adopted three-stage DEA frameworks [22,23], they typically rely on contemporaneous frontiers, which may constrain cross-temporal comparability due to shifting production possibility sets. This methodological consideration motivates our use of a global frontier in conjunction with a three-stage framework.
The empirical literature on determinants of IGIE presents findings that, while collectively illuminating, exhibit some degree of heterogeneity. For instance, certain studies suggest that Foreign Direct Investment (FDI) may exert pressure on environmental performance, while others report positive spillover effects of external openness on green innovation [24,25,26,27]. These contrasting findings imply that the relationship between FDI and green efficiency may be context-dependent, potentially shaped by regional absorptive capacity and institutional quality—factors that merit more systematic investigation in future research.
In the intersection of digital transformation and green development, existing studies have generated valuable and thought-provoking insights [28]. That said, the majority of this literature treats the “digital economy” as an aggregate construct, leaving the distinct role of digital infrastructure—as opposed to other digitalized economic activities—relatively underexplored. The specific mechanisms through which infrastructure alleviates information asymmetry and factor misallocation to facilitate green transitions [29,30] call for more refined theoretical articulation and empirical testing. Furthermore, given the well-documented correlation between infrastructure deployment and regional economic development, conventional panel regressions face potential challenges related to reverse causality and omitted variables. Strengthening the identification of causal effects between infrastructure and green efficiency represents a fruitful direction for advancing this line of inquiry.
Building on the literature reviewed above, this study aspires to contribute to the existing body of knowledge in three principal directions.
First, refined conceptual boundary. Rather than employing broad digital economy aggregates, this study narrows the analytical focus to digital infrastructure as a distinct construct. In constructing our core explanatory variable, we maintain a structured distinction between supply-side hardware indicators and demand-side utilization measures, with the aim of more clearly capturing the independent effect of infrastructure deployment on green innovation efficiency.
Second, methodological enhancement. In measuring IGIE, we develop a global frontier, three-stage SBM-DEA model that incorporates undesirable outputs to reflect the green dimension of industrial innovation. The second-stage Stochastic Frontier Analysis (SFA) is employed to strip out the confounding influences of external environmental conditions and statistical noise, thereby improving the comparability of efficiency estimates across provinces and over time. For causal inference, we adopt a Bartik-style shift-share instrumental variable strategy, complemented by Wild Cluster Bootstrap procedures to address finite-sample inferential concerns and provide more robust empirical evidence.
Third, structured mechanism identification. Theoretically, we distinguish two parallel transmission channels through which digital infrastructure may influence green efficiency: digital inclusive finance and local technological diffusion via mitigation of information asymmetry. Within an integrated mechanism framework, this study empirically examines the two parallel transmission pathways. This dual-channel mechanism analysis not only reveals the underlying working mechanisms, but also offers a more nuanced theoretical interpretation of the relationship between digital infrastructure and green innovation efficiency.

2. Theoretical Analysis

2.1. Connotations of Digital Infrastructure and IGIE

Digital infrastructure, acting as the fundamental carrier of data elementization and industrial digitization, exerts a profound impact on modern industrial systems. Leveraging its unique advantage of seamless connectivity and massive computing capacity, digital infrastructure breaks through geographical and spatial barriers, promoting the efficient flow and optimal allocation of production factors within and across regional boundaries.
Industrial Green Innovation Efficiency (IGIE) incorporates both the effectiveness of green innovation outputs and the resource-environmental costs expended in achieving this effectiveness. It reflects the synergistic optimization of economic value creation, knowledge output, and pollution reduction for a given combination of innovation inputs.

2.2. Theoretical Analysis and Research Hypotheses

This study constructs a theoretical framework by combining endogenous growth theory, information economics, and structural transformation perspectives. Modern digital infrastructure functions as a quintessential general-purpose technology, transcending traditional physical capital to become an empowering core that reconfigures the industrial production function. Rather than a single direct impact, digital infrastructure influences IGIE through direct technological empowerment and indirect structural and informational mechanisms.

2.2.1. Direct Empowerment of Digital Infrastructure on IGIE

The integration of data elements drives profound operational efficiencies within industrial systems. Digital elements can drive the rational flow of industrial factors, enhance efficiency and facilitate structural restructuring through the deep integration of data, algorithms and platform systems [31]. Through high-resolution monitoring and real-time feedback systems, digital infrastructure enables the visualization of critical nodes such as energy consumption and pollutant emissions. This data-driven perception directly enhances industrial enterprises’ ability to identify production constraints, thereby curtailing redundant inputs, optimizing process flows, and directly mitigating negative environmental externalities. Based on this, the following hypothesis is proposed:
Hypothesis 1. 
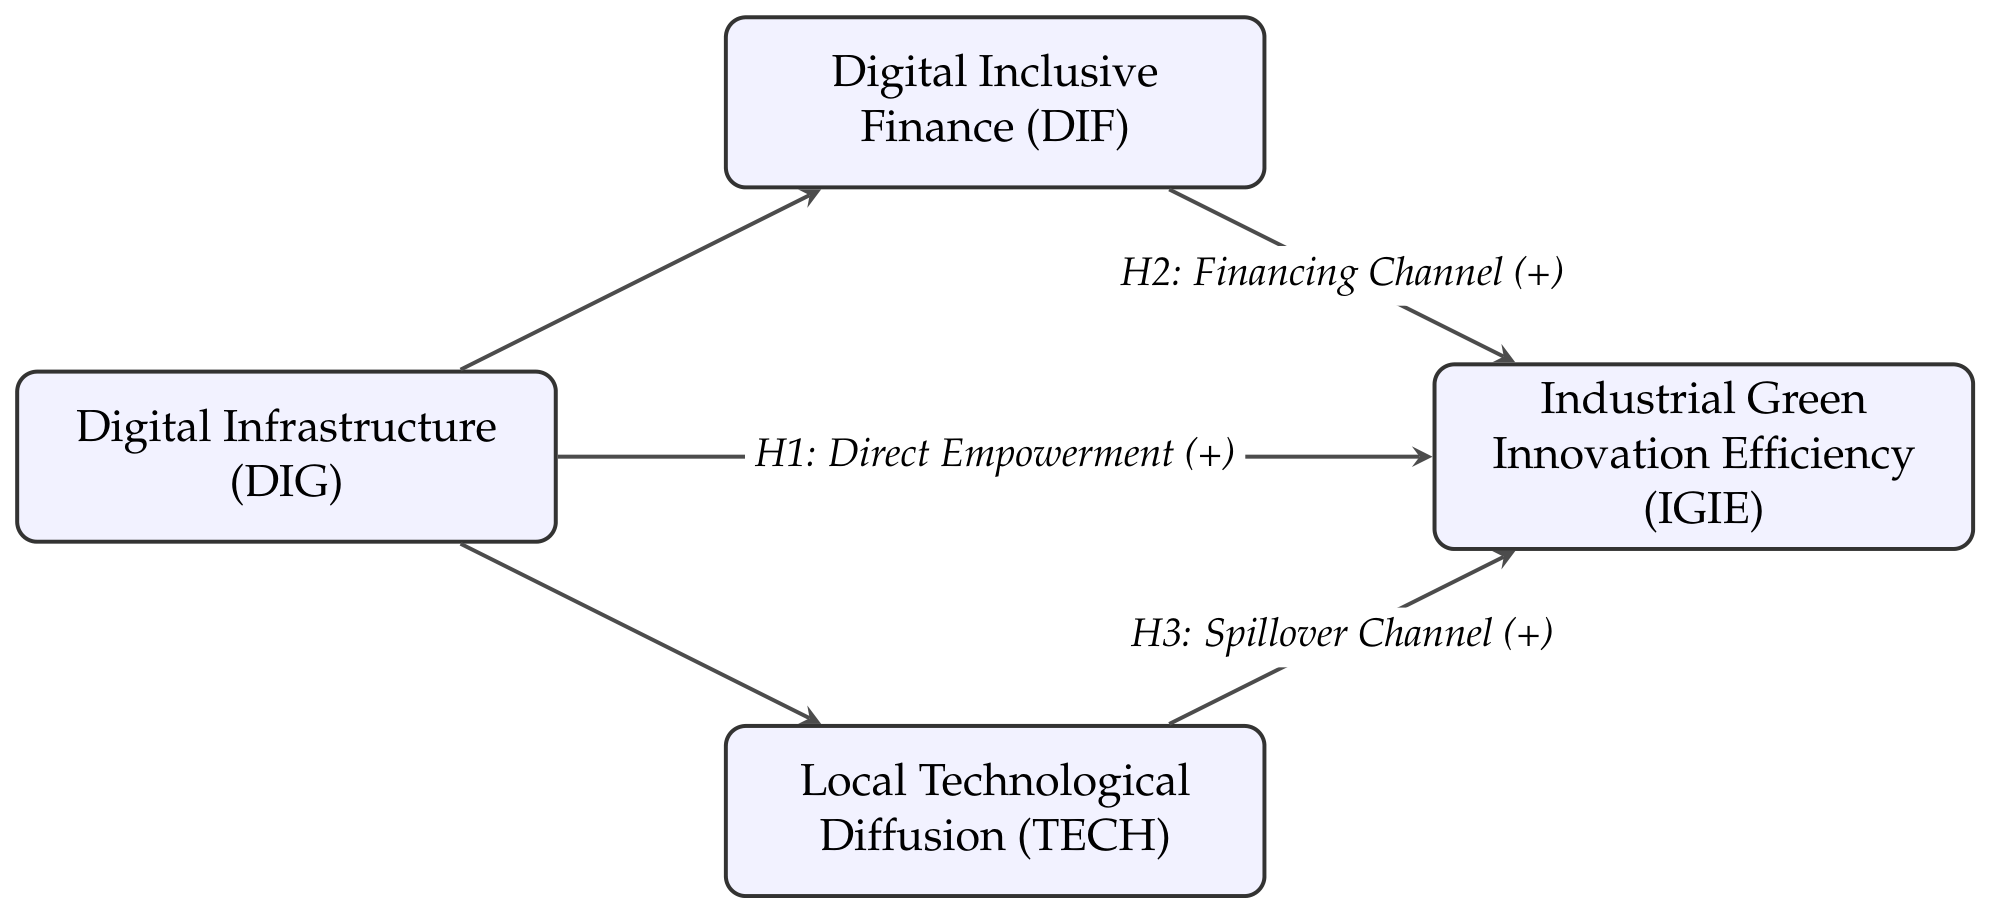
The continuous enhancement of digital infrastructure construction levels exerts a significantly positive direct effect on industrial green innovation efficiency.

2.2.2. Mechanism 1: Alleviating Financing Constraints Through Digital Inclusive Finance

Beyond its direct technological empowerment effect, digital infrastructure serves as the indispensable physical backbone for digital inclusive finance. It enables the collection, transmission, and processing of massive non-traditional data, such as firms’ digital transaction records and supply-chain interactions, which form the core input for algorithm-based credit assessments. Furthermore, it expands the geographical reach of financial services, allowing fintech platforms to penetrate industrial clusters in less-developed regions that lack physical bank branches. This technological foundation structurally relaxes financing constraints, providing the necessary capital for industrial green transition [32].
Inherently, industrial green innovation entails high sunk costs, prolonged R&D cycles, and substantial technological uncertainty. Traditional financial institutions, constrained by information asymmetry and a rigid reliance on collateral, tend to ration credit to projects with uncertain and long-term environmental returns. This structural mismatch is particularly pronounced for industrial firms engaged in green retrofitting, as their assets are often highly specialized and difficult for banks to value ex ante. Consequently, green innovation projects face systematic underfinancing relative to conventional capacity expansion projects [33].
Digital inclusive finance addresses this capital bottleneck primarily by altering the information structure of credit supply. Rather than relying heavily on traditional fixed assets, digital financial platforms utilize operational data, including utility payments, real-time energy consumption, and environmental compliance records, to assess creditworthiness. This shift is particularly critical for industrial green retrofitting, where the primary value lies in future energy savings and emission reductions rather than collateralizable machinery.
Furthermore, this mechanism helps bridge the structural gap in the current green finance market. While conventional green bonds and syndicated loans tend to favor mega-sized state-owned enterprises, ordinary above-scale industrial firms, especially private manufacturers, are often marginalized due to their lack of qualified collateral despite facing the most urgent need for technological upgrading. By lowering the marginal cost of risk assessment, digital inclusive finance extends credit access to this vast backbone of the industrial sector.
Additionally, the underlying digital networks enable a degree of post-lending monitoring of firm operations and energy trajectories, which helps mitigate moral hazard and prevents “greenwashing.” By fulfilling the unmet financing needs of these specific industrial enterprises, digital inclusive finance essentially provides the necessary capital support for the broader adoption of green technologies [34].
Based on this, the following hypothesis is proposed:
Hypothesis 2. 
Digital infrastructure indirectly enhances industrial green innovation efficiency by promoting digital inclusive finance.

2.2.3. Mechanism 2: Mitigating Information Asymmetry and Promoting Local Technological Diffusion

Beyond reshaping the external financing environment, digital infrastructure enhances the allocation efficiency and circulation of knowledge-based factors within local markets. As a foundational general-purpose technology (GPT), digital infrastructure systematically mitigates frictions in information search, supply–demand matching, and transaction execution across the entire technology market. Reduced frictions improve market liquidity, which in turn accelerates the diffusion of both digital and environmental technologies to industrial firms. Knowledge spillovers serve as a core transmission channel underlying this process. Empirical evidence from Sheng and Li (2024) [35] corroborates this logic, documenting that knowledge spillovers act as a critical transmission channel the relationship between digital infrastructure and the diffusion of green technological innovation.
The acceleration of local technology diffusion improves industrial green innovation efficiency through two interrelated channels. On the input side, a liquid technology market enables manufacturing firms to acquire mature modular green technologies via external licensing, circumventing the high trial-and-error costs and failure risks associated with in-house R&D. This reduces redundant R&D investment and allows firms to reallocate capital toward more productive green transition activities, directly enhancing the input–output efficiency of green innovation. On the output side, the rapid commercialization of transferred technologies facilitates green process upgrading of production lines, which simultaneously improves product quality and economic returns while reducing pollutant emissions from manufacturing processes. In this way, firms achieve higher output at a lower environmental cost, which translates directly into improvements in green total factor productivity (GTFP). Sun et al. (2020) [36] confirm that technology market activity significantly boosts regional GTFP by advancing capital market integration and optimizing capital allocation efficiency.
Furthermore, technology market vitality drives efficiency gains through multiple complementary innovation pathways, including optimized R&D resource allocation and inter-firm collaborative innovation. A highly liquid technology market establishes institutional linkages and network connections that support collective efficiency improvements across the industrial sector. From a technology trading network perspective, Yang and An (2025) [37] validate this mechanism, showing that embeddedness in technology trading networks significantly enhances manufacturing total factor productivity through innovation resource integration and improved supply–demand matching.
Based on this, the following hypothesis is proposed:
Hypothesis 3. 
Digital infrastructure indirectly drives industrial green innovation efficiency by mitigating information asymmetry and promoting local technological diffusion.
Taken together, we propose the Conceptual Framework of Digital Infrastructure’s Impact on IGIE, as illustrated in Figure 1.

3. Materials and Methods

3.1. Study Area and Data Sources

This study encompasses 30 provincial-level administrative regions in China (excluding Tibet, Hong Kong, Macao, and Taiwan due to data unavailability). These regions are of strategic importance to the country’s high-quality economic transition. Geographically and economically, they are divided into four major areas: the eastern, central, western, and northeastern regions.
To systematically evaluate Industrial Green Innovation Efficiency (IGIE) and assess the impact of digital infrastructure, the raw data are rigorously sourced from authoritative statistical publications and databases spanning the 2012–2022 period. The primary sources include the China Statistical Yearbook, China Industry Statistical Yearbook, China Science and Technology Statistical Yearbook, and China Environmental Statistical Yearbook, supplemented by annual provincial statistical yearbooks. Patent-related data were obtained from the China National Intellectual Property Administration (CNIPA) database, while macroeconomic and enterprise-level aggregated data were cross-verified using the CSMAR database. For a minimal number of continuous variables with sporadic missing values, a linear interpolation method based on adjacent years was applied to ensure a strongly balanced panel.

3.2. Research Methods

3.2.1. Three-Stage SBM-DEA Model

Data Envelopment Analysis (DEA) is widely utilized to determine the relative efficiency of Decision-Making Units (DMUs) with multiple inputs and outputs. However, conventional radial DEA models neglect input and output slacks and cannot handle undesirable environmental externalities. While the non-radial slacks-based measure (SBM) addresses these issues, it fails to account for external environmental factors and statistical noise, often leading to biased efficiency scores. To resolve this, this study employs a three-stage SBM-DEA model.
(1) First Stage: Global SBM Model under VRS Assumption
Before evaluating the efficiency, the global frontier and returns-to-scale settings must be clarified. Unlike traditional contemporary frontiers that construct separate reference sets for each year, this study constructs a global frontier by enveloping all Decision-Making Units (DMUs) across the entire observation period (2012–2022) into a single, unified benchmark technology. This approach effectively avoids the issue of shifting frontiers and ensures the dynamic comparability of efficiency scores across different years. Furthermore, considering the profound disparities in economic scale, resource endowment, and industrial structure among China’s 30 provinces, it is highly unrealistic to assume that all provinces operate at their optimal scale. Therefore, the Variable Returns to Scale (VRS) assumption is adopted. By relaxing the constant scale assumption, the model isolates scale efficiency and accurately captures the Pure Technical Efficiency (PTE) of industrial green innovation.
Based on these settings, the fractional programming of the global SBM model with undesirable outputs is constructed as follows:
ρ = min 1 1 m i = 1 m s i x i k t 1 + 1 s + q r = 1 s s r + y r k t + p = 1 q s p b b p k t s . t . x i k t = τ = 1 T j = 1 n λ j τ x i j τ + s i , i = 1 ,   ,   m y r k t = τ = 1 T j = 1 n λ j τ y r j τ s r + , r = 1 ,   ,   s b p k t = τ = 1 T j = 1 n λ j τ b p j τ + s p b , p = 1 ,   ,   q τ = 1 T j = 1 n λ j τ = 1 λ j τ 0 , s i 0 , s r + 0 , s p b 0
where ρ represents the pure technical efficiency (PTE) score of industrial green innovation, globally bounded between 0 and 1. The variables x, y, and b denote the inputs, desirable outputs, and undesirable outputs, respectively, with m, s, and q indicating the total number of indicators in each respective category. For a specific province k evaluated at time t, its performance is benchmarked against a global reference set. Within this global frontier formulation, τ ( τ = 1 ,   ,   T ) and j ( j = 1 ,   ,   n ) index the time periods and provinces, respectively, encompassing all n × T observations (inclusive of the evaluated province k at time t). The variable λ j τ serves as the intensity weight vector. The terms s i , s r + , and s p b represent the slack variables capturing input redundancy, desirable output shortfall, and undesirable output excess, respectively. Finally, the convexity constraint τ = 1 T j = 1 n λ j τ = 1 strictly enforces the Variable Returns to Scale (VRS) assumption, ensuring that the evaluated DMU is benchmarked exclusively against peers of a comparable operational scale.
(2) Second Stage: SFA Regression and Input Modification
The solution to the First-Stage SBM model yields an input slack variable, denoted as s i k , for each evaluated province k and input i. This slack variable mathematically quantifies the extent of input redundancy that could be eliminated without compromising current output levels. Crucially, these initial slacks conflate three distinct factors: (i) managerial inefficiency, (ii) adverse external environmental conditions, and (iii) random statistical noise. It is important to note that the Stage 1 efficiency score ρ measures how close a province is to the frontier (higher is better), whereas the slack variable s i k measures the magnitude of inefficiency (larger is worse).
To decompose this composite term, in Stage 2 of SFA, we utilize the slack values from Stage 1 as dependent variables; thereafter, we adjust the inputs in accordance with Fried et al. (2002) [38]. Specifically, the SFA regression is specified as follows to precisely isolate the pure managerial inefficiency component from the confounding factors:
s i k = f ( z k ; β i ) + v i k + u i k , i = 1 ,   ,   m ; k = 1 ,   ,   n
where z k denotes observable external environmental factors, and β i represents the corresponding parameter vector to be estimated. The composite error term structurally differentiates statistical noise v i k N ( 0 ,   σ v i 2 ) from managerial inefficiency u i k N + ( 0 ,   σ u i 2 ) . A positive coefficient on an environmental variable indicates that the external condition exacerbates input redundancy (i.e., worsens efficiency), whereas a negative coefficient implies that the condition mitigates input slack (i.e., improves efficiency).
Upon completing the SFA estimation, the original empirical data must undergo a comprehensive “decompression and purification” process to isolate pure managerial performance. The modified input x i k is calculated as follows:
x i k = x i k + max k f ( z k ; β ^ i ) f ( z k ; β ^ i ) + max k ( v ^ i k ) v ^ i k
In this “modified input” equation, x i k is the original input observed in Stage 1. max k f ( z k ; β ^ i ) denotes the maximum fitted environmental effect across all provinces, representing the most unfavorable external condition; max k ( v ^ i k ) denotes the maximum estimated random error, representing the worst statistical luck. The term max k f ( z k ; β ^ i ) f ( z k ; β ^ i ) mathematically adjusts all evaluation units to the most unfavorable environmental condition, thereby penalizing provinces with favorable environments. Simultaneously, max k ( v ^ i k ) v ^ i k places all units under identical worst-case statistical luck. By applying these adjustments, all provinces are placed in a common external environment, ensuring that the Stage 3 efficiency scores reflect only genuine differences in managerial capabilities.
(3) Third Stage: Adjusted SBM Model and Environment-Adjusted Efficiency Estimation
Upon obtaining the adjusted input variables x i k from the second-stage SFA adjustment, we proceed to the third stage. The core operation is straightforward: the original inputs x i k in the Stage 1 SBM model are replaced by the adjusted inputs x i k , while both desirable and undesirable outputs remain unchanged. We then re-solve the global SBM model (Equation (1)) following the identical global frontier and VRS assumptions. The resulting efficiency scores are the environment-adjusted estimates for each province, which serve as the core dependent variable of this study—namely, the Industrial Green Innovation Efficiency (IGIE). These adjusted scores, after mitigating the confounding effects of heterogeneous external environments and statistical noise through the prior adjustments, reflect only relative differences in provincial managerial and technological capabilities.
For the convenience of presentation, the complete operational sequence of the entire three-stage procedure is summarized below:
1.
Step 1 (Stage 1—Initial SBM): Input the original input matrix X, the desirable output matrix Y, and the undesirable output matrix B. Solve Equation (1) to obtain initial efficiency scores ρ and isolate input slack variables s i k .
2.
Step 2 (Stage 2—SFA Regression): Estimate the SFA regression (Equation (2)) with s i k as the dependent variable and environmental factors Z as independent variables. This decomposes the slack into three components: environmental effects f ( z k ; β i ) , statistical noise v i k , and managerial inefficiency u i k .
3.
Step 3 (Stage 2—Input Purification): Apply the adjustment mechanism. Execute Equation (3) to compute the environment-adjusted inputs x i k .
4.
Step 4 (Stage 3—Adjusted SBM Evaluation): Replace the original inputs X with the adjusted inputs X . Re-solve the global SBM model (Equation (1)) under the identical global frontier and VRS settings to yield the final, environment-adjusted Industrial Green Innovation Efficiency (IGIE) scores.

3.2.2. Baseline Regression Model

To accurately identify the driving mechanism of digital infrastructure on IGIE, a two-way fixed effects model was constructed. This model controls for unobservable province-specific characteristics and macro-level time shocks, ensuring the rigorous extraction of causal effects. The baseline econometric model is specified as follows:
I G I E i t = β 0 + β 1 D I G i t + j = 1 n λ j C o n t r o l j i t + μ i + ν t + ε i t
In Equation (4), I G I E i t is the explained variable, namely the adjusted industrial green innovation efficiency of province i in year t adjusted via the three-stage SBM model. D I G i t is the core explanatory variable representing the level of digital infrastructure. To account for other potential confounding factors, C o n t r o l j i t refers to the j-th control variable. Furthermore, μ i stands for the province-specific individual fixed effect to control for time-invariant regional heterogeneity, while ν t represents the time fixed effect of each year to absorb unobservable macroeconomic shocks common to all provinces. Finally, ε i t is the random disturbance term. The coefficient of primary interest is β 1 , which captures the net causal effect of digital infrastructure on IGIE. To ensure statistical robustness against arbitrary forms of heteroscedasticity, autocorrelation, and unobserved spatial cross-sectional dependence, the model is estimated using Driscoll–Kraay standard errors.

3.2.3. Mechanism Analysis Model

In real economic data generating processes, the data inevitably exhibit high complexity, making it difficult to find a fully exogenous research setting. Meanwhile, the widespread existence of “partial mediation” phenomena challenges the reliability of traditional mediation testing methods. Furthermore, when control variables are introduced as mediators in the conventional three-step regression, the estimated coefficients of the core explanatory variables may be biased [39]. Therefore, we employed a mechanism analysis approach rather than the traditional mediation effect test. Following Jiang (2022) [39] and keeping the same specification as the baseline regression, the mechanism model is estimated as:
M i t = β 0 + β 1 D I G i t + j = 1 n λ j C o n t r o l j i t + μ i + ν t + ε i t
where M i t denotes the mechanism variable for province i in year t, which is replaced by digital inclusive finance ( D I F i t ) and local technological diffusion ( T E C H i t ), respectively, in the empirical analysis. D I G i t is the core explanatory variable measuring digital infrastructure development. The meanings of all other parameters are identical to those in the baseline regression (Equation (4)).

3.3. Establishment of IGIE Evaluation Indicators

Operationally, IGIE is defined as the Pure Technical Efficiency (PTE) of transforming industrial innovation inputs into marketable economic outputs while strictly minimizing environmental externalities. Mathematically, it is quantified as a bounded score ranging from 0 to 1, calculated using a global SBM model under the VRS assumption. Specifically, this measurement captures the optimal allocation of R&D resources (R&D labor and capital) to desirable outputs, including technological outputs (valid invention patents) and economic outputs (sales revenue of new products), while incorporating undesirable environmental outputs (industrial SO2 emissions) as penalty terms. Evaluating Industrial Green Innovation Efficiency (IGIE) requires a comprehensive framework that captures the complex transformation of technological resources into economic value, subject to stringent environmental constraints. Grounded in the theory of green endogenous growth and existing robust empirical practices, this study constructs a multidimensional input–output indicator system. The selection strictly adheres to the principles of data reliability, theoretical representativeness, and statistical continuity across the provincial panel dataset covering the 2012–2022 period. The specific indicators are delineated as follows (Table 1):
(1) Innovation Inputs
Industrial green innovation is inherently a resource-intensive activity driven by core human capital and financial investments. To ensure statistical consistency and focus on the primary engines of industrial R&D, data from “industrial enterprises above designated size” are utilized.
  • Labor Input: Measured by the full-time equivalent of R&D personnel. This indicator accurately captures the actual human effort dedicated to technological advancement, effectively filtering out the statistical noise associated with part-time or administrative involvement [40,41].
  • Capital Input: Represented by the total R&D expenditure. This denotes the direct financial commitment required to overcome green technological bottlenecks, upgrade equipment, and sustain long-term innovation cycles [42,43].
(2) Desirable Outputs
A robust evaluation of green innovation output must account for both the novelty of technological breakthroughs and successful market commercialization.
  • Technological Output: Measured by the number of valid invention patents. Unlike gross patent applications or utility models, valid invention patents undergo rigorous substantive examination. Utilizing this variable mitigates the upward bias caused by “strategic but low-quality” patenting behaviors, providing a genuine proxy for high-level green technological capability [44,45]. Regarding cross-provincial and inter-temporal comparability, several methodological rationales are clarified: first, the unified substantive examination standards of the China National Intellectual Property Administration (CNIPA) preclude regional discrepancies in patent approvals; furthermore, employing “valid invention patents” inherently filters for sustained commercial value via renewal fees, while the DEA distance-function mathematically accommodates the dimensional differences between patent counts and monetary revenue.
  • Economic Output: Represented by the sales revenue of new products. Technological innovation is only fully realized when it passes the market test. This indicator captures the economic premium and market viability generated by the application of green processes and novel products [46]. Specifically, new product sales revenue is adopted as the economic indicator because it precisely captures the commercialization capability of recent innovation outcomes. By explicitly isolating the financial returns of new R&D endeavors from the revenue generated by mature, non-innovative production lines, this metric directly reflects the exact market value and economic transformation efficiency of recent technological advancements. Furthermore, it serves as a rigorously targeted indicator that measures direct market acceptance across the entire industrial spectrum, ensuring that incremental green innovations and technological upgrades within traditional manufacturing sectors are comprehensively evaluated. Although new product sales revenue is measured in nominal terms without provincial PPI deflation, the corresponding capital input (R&D expenditure) is also nominal. Consequently, macroeconomic inflation effects synchronously offset each other within the SBM-DEA relative efficiency ratio.
(3) Undesirable Outputs
To accurately reflect the environmental externalities inherent in industrial production, it is crucial to incorporate pollution as an unintended byproduct of the innovation process.
  • Environmental cost: Industrial SO2 emission is selected as the core proxy for environmental pressure. Given the structural reliance on coal in China’s industrial sector during the observation period, SO2 represents a primary, highly regulated pollutant. Its emission trajectory strongly correlates with both the intensity of heavy industrial activity and the efficacy of regional environmental governance. Therefore, it serves as a highly representative and statistically robust indicator for measuring the true environmental cost of industrial growth [47,48,49].
In the second stage of the three-stage SBM-DEA model, to effectively isolate genuine managerial inefficiency from statistical noise and external influences, it is imperative to introduce appropriate environmental variables. These variables serve to account for the passive redundancies in innovation inputs caused by uncontrollable regional conditions, thereby aligning all DMUs on a comparable baseline for the third-stage evaluation. Following the modeling principles, the selected variables must be strictly exogenous (beyond the subjective control of enterprise management), theoretically correlated with green innovation efficiency, and relatively stable over the observation period. Based on these criteria, this study selects four macroscopic environmental variables (Table 2):
  • Economic Foundation (Logarithm of per capita GDP): Regional economic development inherently dictates the baseline of innovation resource endowment. Developed regions typically possess mature R&D infrastructure, high-quality talent pools, and abundant financial capital, which systematically facilitate the efficient absorption of green technologies and mitigate input slacks. A logarithmic transformation is applied to this indicator to eliminate potential heteroscedasticity and narrow dimensional disparities across provinces.
  • Degree of Openness (FDI as a proportion of GDP): Foreign direct investment serves as a critical conduit for cross-border knowledge spillovers. A higher penetration of foreign capital introduces advanced international green manufacturing processes and sophisticated management paradigms into the local market. This spillover effect optimizes local green innovation conditions and significantly reduces passive resource redundancies.
  • Government Technological Support (Ratio of government S&T expenditure to GDP): This variable captures the intensity of local institutional backing for innovation. Robust fiscal support in science and technology lowers the external costs and risks associated with corporate R&D activities, encouraging efficient resource utilization. Conversely, insufficient public support may lead to a fragile regional innovation ecosystem, resulting in higher input slacks due to inadequate technology supply.
  • Industrial Structure (Proportion of secondary industry to GDP): The scale of the secondary sector reflects a region’s path dependence on traditional manufacturing. A high proportion of heavy industry often implies a rigid structural reliance on energy-intensive and high-emission operations. This path dependence can exacerbate environmental costs and hinder the agile, efficient allocation of green R&D inputs, thereby directly impacting the magnitude of input slacks in the SFA regression.
While the theoretical mechanisms above elucidate how these macroscopic factors influence input slacks, it is equally critical to address their strict exogeneity to rule out potential internal overlap and contemporaneous reverse causality, as stipulated by the foundational premise of the three-stage DEA framework (Fried et al., 2002) [38]. To rigorously satisfy this assumption, the four variables selected in this study are macro-level regional endowments that operate at the provincial-year scale, fundamentally insulated from the short-term fluctuations of industrial green innovation. Specifically, per capita GDP captures the macroeconomic trajectory dictated by historical agglomeration and initial resource endowments. Given its structural inertia, it acts as a predetermined systemic constraint within a single observation year. FDI penetration is fundamentally driven by global capital dynamics and national macro-policies, functioning as an exogenous macroeconomic shock rather than an endogenous outcome of sectoral innovation. The government S&T expenditure share reflects top-down fiscal allocations, serving as an institutional parameter rather than a responsive metric to micro-level enterprise performance. Finally, industrial structure is highly path-dependent and evolves over long economic cycles; it operates as a rigid macroeconomic boundary that cannot be instantaneously reconfigured by concurrent green innovation activities within a specific province.
Furthermore, it is theoretically and mathematically imperative to distinguish the structural mechanism of these variables in the SFA stage from their subsequent application as control variables in the baseline panel regression. In Stage 2, these macroeconomic aggregates operate exclusively as environmental filters: they are regressed against the input slacks to extract and neutralize heterogeneous environmental advantages or penalties. This operation calibrates the raw input data to ensure a uniform evaluation baseline, devoid of any causal inference regarding the environmental variables themselves. Conversely, in the subsequent two-way fixed-effects panel regression, control variables are introduced to absorb residual regional heterogeneity and identify the net causal impact of digital infrastructure on the IGIE—an entirely distinct econometric operation performed on the adjusted efficiency scores.

3.4. Core Explanatory Variable and Other Variables

3.4.1. Digital Infrastructure Measurement (DIG)

Digital infrastructure is a multi-dimensional and structurally complex system that extends beyond mere hardware deployment. Following the authoritative frameworks of Zhao (2025) [50] and Sun et al. (2025) [51], this study constructs a comprehensive digital infrastructure indicator system encompassing two core dimensions: supply and utilization. The supply dimension reflects the foundational conditions, spatial density, and structural endowments of regional digital resources (e.g., optical cables, base stations, and professional ICT personnel), acting as the physical prerequisite for digital transformation. Conversely, the utilization dimension captures the actual market penetration and operational intensity of these facilities. This distinction is crucial, as the utilization phase represents the exact mechanism through which latent digital potential is converted into tangible technological and economic capabilities.
Furthermore, to rigorously evaluate this composite system and completely eliminate the inherent biases associated with subjective weighting methods, the entropy weight method (EWM) is employed. Rather than weighting the “supply” and “utilization” dimensions independently, all fundamental indicators across both dimensions are evaluated in conjunction within a unified global panel to directly synthesize the final composite index. Prior to the EWM iteration, any sporadic missing values in the raw dataset were supplemented using linear interpolation. The exact procedural steps for formulating the Digital Infrastructure (DIG) index are mathematically delineated as follows:
Step 1: Data Standardization. Given that the selected indicators for digital infrastructure fundamentally represent positive technological and economic endowments, they are all classified as benefit (positive) indicators. The raw data x i , j t (denoting province i, indicator j, at year t) is normalized to eliminate dimensional discrepancies:
x i , j t = x i , j t min ( x j ) max ( x j ) min ( x j )
Step 2: Non-Negative Translation. Because the subsequent entropy calculation involves logarithmic functions, zero values generated during the standardization process would render the equations mathematically undefined (i.e., ln ( 0 ) ). To strictly prevent this mathematical anomaly, a minimal translation constant ( ϵ = 0.0001 ) is uniformly added to all standardized values:
Y i , j t = x i , j t + 0.0001
Step 3: Proportion and Information Entropy Calculation. The proportional contribution of the i-th province for the j-th indicator at year t, denoted as P i , j t , and the subsequent information entropy E j , are computed across the total number of observations ( N = n × T ):
P i , j t = Y i , j t t = 1 T i = 1 n Y i , j t
E j = 1 ln ( N ) t = 1 T i = 1 n P i , j t ln ( P i , j t )
Step 4: Weight Assignment and Final Index Synthesis. Finally, the objective weight W j for each indicator is determined based on its information dispersion ( 1 E j ). The composite Digital Infrastructure (DIG) index is then calculated via linear weighting:
W j = 1 E j j = 1 m ( 1 E j )
D I G i t = j = 1 m W j × x i , j t
The specific indicators, along with their precise calculated weights, are detailed in Table 3.

3.4.2. Mechanism Variables

To rigorously examine the transmission channels through which digital infrastructure influences industrial green innovation efficiency, this study incorporates two mechanism variables corresponding to the preceding theoretical framework:
  • Digital Inclusive Finance (DIF): Proxied by the China Digital Financial Inclusion Index compiled by the Digital Finance Research Center of Peking University (Guo et al., 2020) [52]. This indicator comprehensively captures the breadth of coverage, depth of usage, and degree of digitalization of regional financial services, serving as a robust measure of financial inclusivity and credit accessibility. Source: Peking University Digital Financial Inclusion Index (PKU-DFIIC), Digital Finance Research Center of Peking University & Ant Group Research Institute.
  • Technological Diffusion (TECH): Proxied by the ratio of regional technology market turnover to regional GDP. Drawing on the evaluation framework of high-quality regional economic development by Sun et al. (2020) [53], this metric quantifies the activity level and liquidity of the regional technology market. It serves not only as an effective proxy for the mitigation of information asymmetry but also as a core driver reflecting the extent to which cutting-edge green technologies are disseminated, shared, and absorbed across diverse sectors within the local region to foster high-quality economic development. Source: China Science and Technology Statistical Yearbook & Provincial Statistical Yearbooks.

3.4.3. Control Variables

To mitigate potential omitted variable bias arising from time-varying confounding factors that could simultaneously influence digital infrastructure deployment and regional industrial green innovation, this study incorporates five control variables guided by established endogenous growth and regional economics theories (Table 4):
  • Economic Development Level ( g d p ): Quantified by the natural logarithm of per capita GDP. Regions with advanced economic development typically possess more robust industrial foundations and superior resource allocation capacities, which serve as critical prerequisites for green innovation. The logarithmic transformation is applied to alleviate potential heteroscedasticity.
  • Higher Education Level ( e d u ): Measured by the ratio of students enrolled in higher education institutions to the total regional population. This metric proxies the educational attainment and skill structure of the regional labor force. A higher density of human capital corresponds to enhanced knowledge absorptive capacity and technological assimilation capabilities.
  • Foreign Direct Investment ( f d i ): Evaluated as the ratio of actual utilized FDI to regional GDP. This variable captures the extent of regional integration into global production networks. FDI inflows may trigger technology transfer effects by introducing advanced green manufacturing processes, whilst concurrently exerting competitive pressures that compel domestic enterprises to optimize technical efficiency.
  • Entrepreneurial Vitality ( f i r m s ): Proxied by the number of newly registered enterprises per 100 residents. This indicator reflects the density of micro-level innovation entities and the dynamism of the regional innovation ecosystem. A higher startup rate typically accelerates knowledge diffusion and technological iterations.
  • Government Science and Technology Support ( g o v ): Assessed by the proportion of local fiscal expenditure allocated to science and technology relative to regional GDP. This measure accounts for institutional financial interventions in technological innovation, which fundamentally alleviate corporate R&D risk exposure and guide the trajectory of regional green transitions.

4. Results

4.1. SFA Regression Results

Stochastic Frontier Analysis (SFA) is employed to decompose the input slacks derived from the first-stage SBM model. The slacks of R&D personnel and R&D expenditure are set as dependent variables, while the four external environmental factors(Economic foundation, Opening degree, Government S&T support intensity, Industrial structure) are treated as independent variables. The SFA regression isolates the impacts of external environment and random noise on managerial inefficiency, setting the stage for input adjustments. The empirical results, estimated via Maximum Likelihood Estimation (MLE), are presented in Table 5.
As shown in Table 5, the values of γ for the slacks of R&D personnel and R&D expenditure are 0.9676 and 0.9664, respectively, and both are statistically significant at the 1% level. This implies that approximately 97% of the composite error variance stems from managerial inefficiency rather than random statistical noise. Furthermore, the Likelihood Ratio (LR) test values (86.27 and 87.04) significantly reject the null hypothesis at the 1% level, validating the necessity of employing the SFA model for input adjustment. The regression coefficients reflect the relationship between external environmental factors and input slacks. A positive coefficient implies that the environmental variable exacerbates input redundancy (unfavorable to efficiency), whereas a negative coefficient indicates a mitigation of input slacks (favorable to efficiency). Specifically:
  • Economic Foundation ( g d p ): The coefficients of g d p are significantly positive, suggesting that regions with higher levels of economic development also experience greater R&D input redundancy. Regions with a better economic foundation typically possess stronger resource-carrying capacities and R&D investment capabilities, making them more prone to large-scale R&D characteristics. Consequently, the growth rate of R&D resource inputs exceeds the formation speed of innovation outputs, leading to increased slacks on the input side. Moreover, in economically developed regions, industrial enterprises pursuing technological leadership often increase R&D capital investments in exchange for potential breakthrough outputs. Such strategic investments can also lead to structural redundancy.
  • Opening degree ( f d i ): The coefficients of f d i on both input slacks are significantly positive, indicating that higher openness leads to greater input redundancy. In regions with a higher degree of openness, the redundancy of R&D factor inputs is greater. A high degree of openness may induce the expansion of industrial scale and the rapid agglomeration of innovation resources. Especially in regions with a high proportion of foreign trade and foreign-invested enterprises, R&D activities often exhibit capital-driven expansion characteristics—that is, the growth rate of R&D resource inputs outpaces the improvement in output conversion efficiency, thereby causing structural slacks on the input side.
  • Government S&T Support ( g o v ): The coefficients of g o v are significantly negative, confirming that robust fiscal support systematically lowers R&D redundancies. Higher government technology expenditure provides a stable resource foundation and stronger resource constraints, allowing enterprises to maintain clearer directional focus and higher efficiency in utilizing innovation elements.
  • Industrial Structure ( i n d ): The variable i n d exerts a significant positive effect on both types of input slacks, indicating that regions with a higher proportion of the secondary industry face greater redundancy in R&D personnel and expenditure inputs. The secondary industry is dominated by manufacturing and construction, with production activities characterized as capital- and resource-intensive. In regions with a high secondary industry proportion, the industrial structure is relatively concentrated, and the pressure for technological renewal is intense. In R&D activities, enterprises are more likely to choose to continuously expand their R&D investment scale to maintain their competitive positions, though this may not immediately result in effective innovation outputs. This characteristic leads to a certain degree of resource redundancy on the R&D input side.
Overall, the various environmental variables exert impacts on the two types of input slacks, subjecting the industrial green innovation levels across regions to disparate developmental environments. This causes the innovation efficiency scores calculated using original input–output data to deviate significantly from the actual situation. Therefore, based on the SFA regression described above, environmental adjustments and noise elimination are applied to the two types of original inputs to obtain effective input levels under uniform external conditions.

4.2. The Adjusted Industrial Green Innovation Efficiency

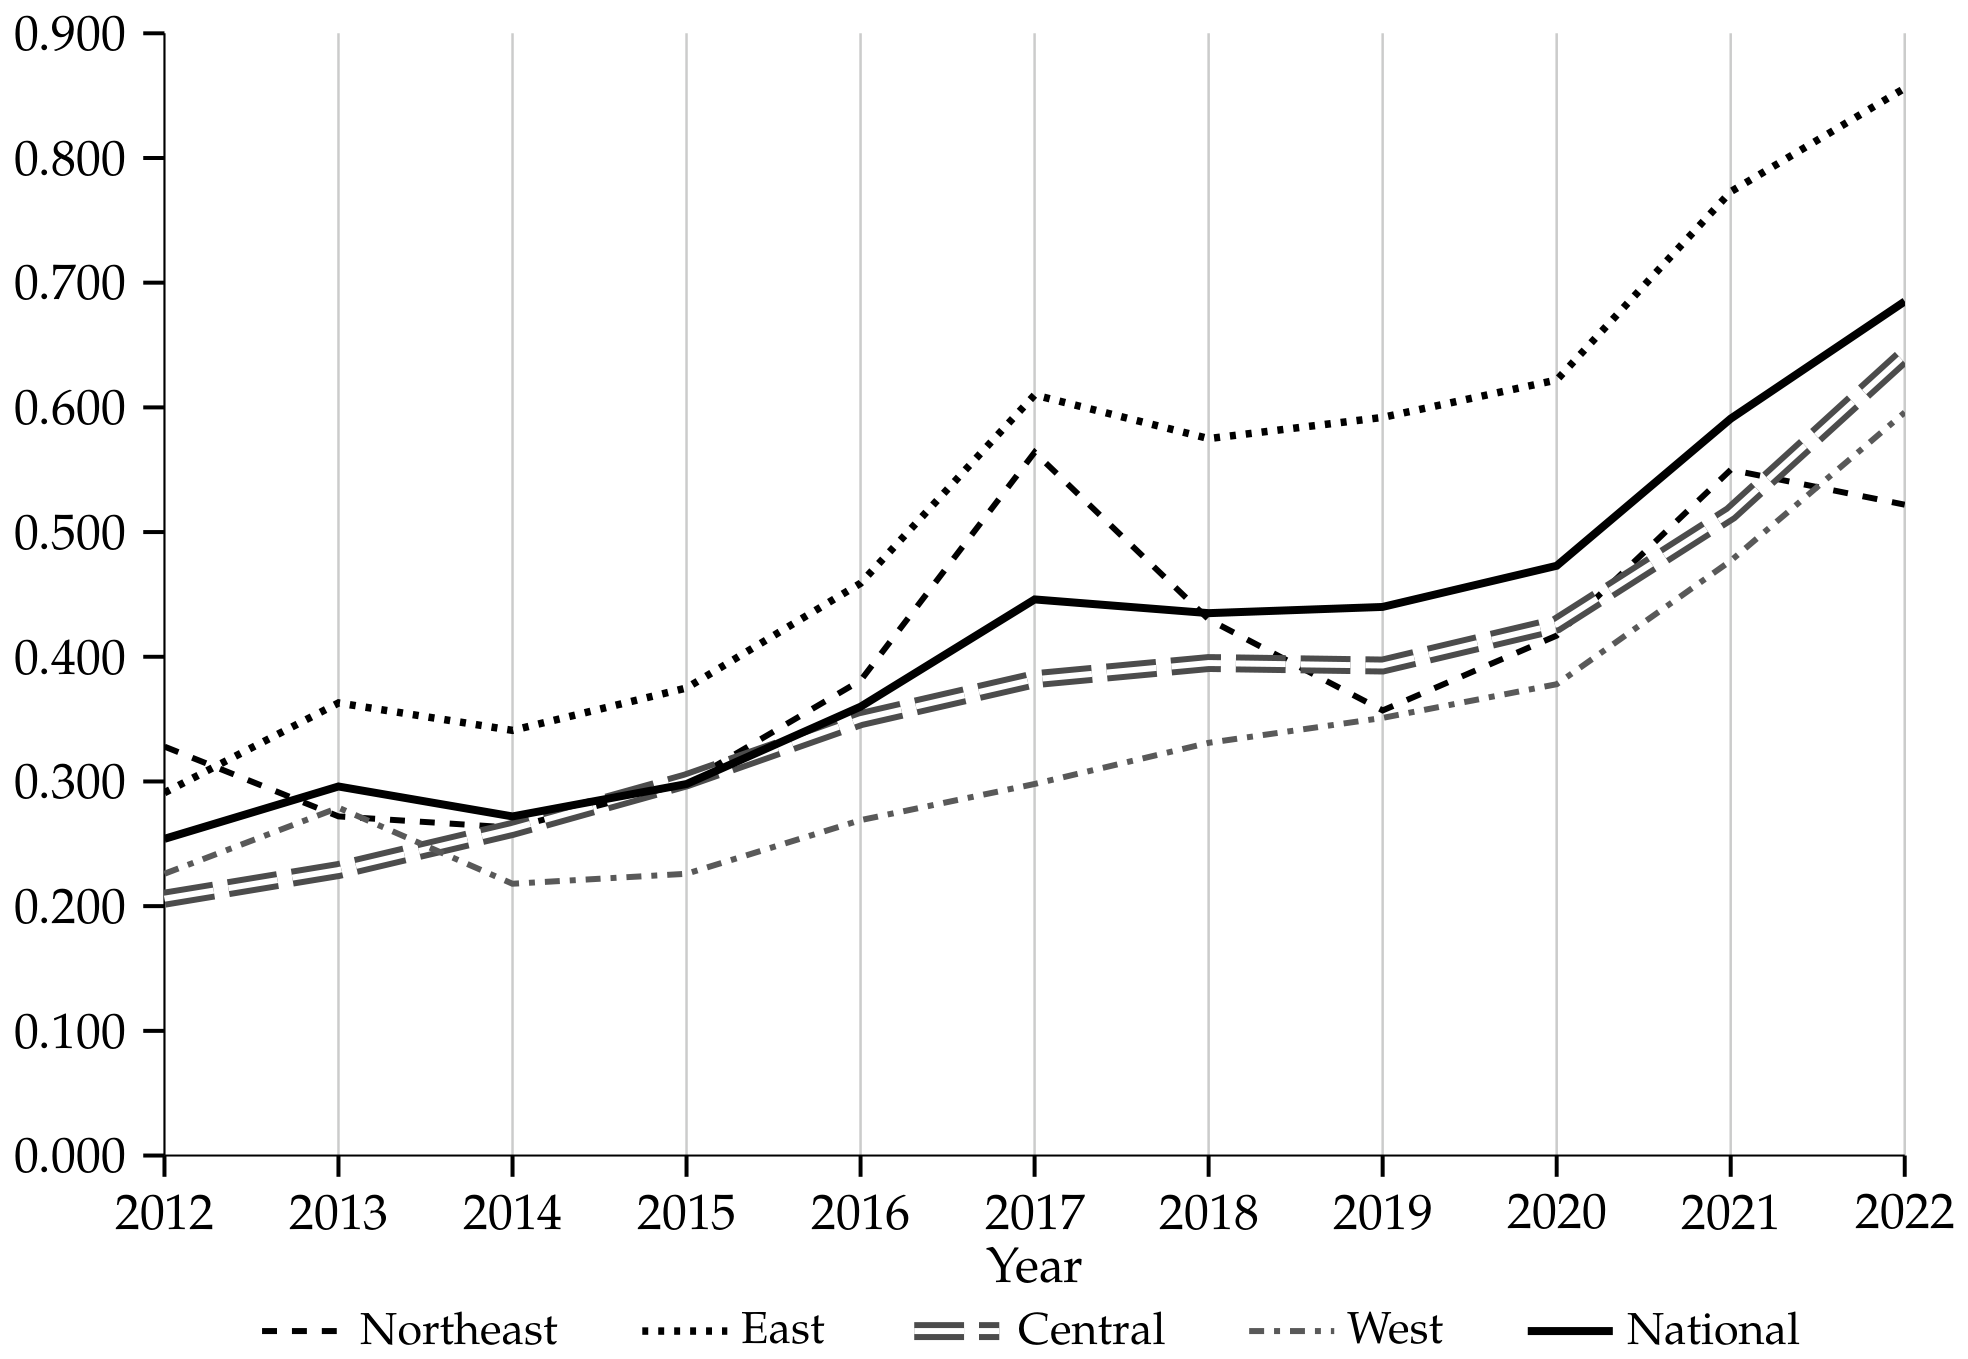
After removing external environmental factors and statistical noise in Stage II, Table 6 presents the adjusted Industrial Green Innovation Efficiency (IGIE), which reflects the relative managerial and technological capabilities of each province. Figure 2 shows the trends in IGIE at national level and across the four major regions from 2012 to 2022.
Overall, China’s national IGIE showed a fluctuating upward trend from 2012 to 2022. The average efficiency score increased significantly from 0.254 to 0.685, indicating that China has made phased progress in its industrial green transformation. This growth can be divided into two phases. From 2012 to 2015, the national average remained low (below 0.300). This was mainly because the traditional industrial structure was too heavy, and enterprises lacked the active motivation to innovate under early environmental policies. However, after 2016, and especially from 2019 to 2022, efficiency grew rapidly. This acceleration was primarily driven by the supply-side structural reform, the implementation of the Environmental Protection Tax Law in 2018, and the proposal of the “Dual Carbon” goals in 2020, which forced high-emission enterprises to reduce costs through green innovation.
Regionally, China’s IGIE exhibits a regional disparities: high in the east, rising in the center, improving in the west, and fluctuating in the northeast. The Eastern region consistently leads the country, with its average efficiency rising from 0.291 in 2012 to 0.856 in 2022, benefiting from its mature innovation ecosystem and strict environmental regulations. The Central region (reaching 0.642 in 2022) shows steady improvement and has been narrowing its efficiency gap with the eastern region over the sample period. The Western region (0.596 in 2022) shows continuous improvement, but its absolute efficiency remains below the national average. Meanwhile, the Northeastern region shows obvious volatility; its efficiency rebounded strongly around 2017 due to revitalization policies but remains unstable due to its deep reliance on traditional heavy industries.
At the provincial level, efficiency remains highly uneven. Eastern provinces like Jiangsu, Beijing, Zhejiang, and Guangdong frequently reached the efficiency frontier (score of 1.000) between 2019 and 2022. It is necessary to clarify that a DEA score of 1.000 represents relative efficiency against the specific sample threshold rather than absolute perfection, and this maximum boundary is intrinsically shaped by the chosen variables and VRS assumptions. Nonetheless, their consistent frontier status is fundamentally driven by their advanced industrial systems and strong policy support. In contrast, traditional industrial provinces such as Shanxi, Heilongjiang, Guizhou, and Gansu remained at lower efficiency levels due to weak technological foundations. However, some provinces like Anhui, Hubei, and Shaanxi are catching up rapidly through industrial upgrading. Additionally, provinces like Tianjin, Hainan, and Qinghai showed large efficiency fluctuations, indicating that their green innovation capabilities rely more on short-term policies rather than a stable, sustainable innovation system.

4.3. Comparison of Stage-I and Stage-III Mean Efficiencies

To validate the necessity of the three-stage DEA model and clarify the specific impacts of external environmental factors, we compared the mean efficiency scores between Stage I and Stage III (Table 7).
At the macro level, external environments generally suppress China’s industrial green innovation efficiency (IGIE). The national average score increased from 0.368 in Stage I to 0.413 in Stage III. This upward correction indicates that without stripping away environmental constraints, the true managerial and technological potential of Chinese industrial enterprises is significantly underestimated. However, the average of 0.413 remains far from the efficiency frontier (1.000), suggesting that China’s overall industrial green transformation is still in a climbing phase. Regionally, all four major areas experienced upward corrections. The Central region showed the largest adjustment (from 0.307 to 0.373), indicating that its relative efficiency was previously masked by unfavorable conditions, such as a rigid industrial structure and a relatively weak economic foundation. The Eastern region maintained its absolute lead (0.487 to 0.532), while the Western and Northeastern regions saw minor improvements.
At the provincial level, the removal of environmental factors and statistical noise significantly altered efficiency rankings, revealing three distinct categories of provinces:
  • Robust Frontier: Provinces such as Guangdong (0.745 → 0.764), Jiangsu (0.560 → 0.584), and Zhejiang (0.534 → 0.560) maintained high efficiency levels with minor upward adjustments. Their consistent leadership demonstrates that their high performance stems from effective technological management and efficient resource allocation, rather than merely relying on favorable macroeconomic environments.
  • Environmentally Suppressed: Provinces including Inner Mongolia (0.193 → 0.580), Tianjin (0.343 → 0.685), Shaanxi (0.218 → 0.414), and Fujian (0.196 → 0.337) experienced substantial efficiency surges in Stage III. This finding underscores the necessity of the three-stage model: their initial low scores were not caused by internal management failures but were constrained by harsh objective environments (e.g., heavy industrialization). Removing these negative external noises reveals their highly underestimated relative potential.
  • Environmentally Boosted: In contrast, provinces like Hainan (0.767 → 0.449), Qinghai (0.588 → 0.305), and Gansu (0.259 → 0.170) suffered significant efficiency drops in Stage III. Their superficially high scores in Stage I were largely statistical illusions driven by small input scales or specific ecological policy dividends. Stripping away these favorable environmental advantages exposes their deep-rooted structural weakness in relative technological innovation capabilities.

4.4. Descriptive Statistics and Correlation Analysis

Table 8 reports the descriptive statistics for all variables employed in the empirical analysis. Specifically, the dependent variable, industrial green innovation efficiency (IGIE), has a mean value of 0.413 with a standard deviation of 0.229, and ranges from 0.040 to 1.000, indicating considerable variation across Chinese provinces over the sample period. The core explanatory variable, digital infrastructure index (DIG), exhibits a mean of 0.174 and a standard deviation of 0.131, reflecting marked provincial disparities in digital development. Regarding the mechanism variables, Digital Inclusive Finance (DIF) records a mean of 262.394 with a standard deviation of 92.242 (ranging from 61.470 to 460.691), while Local Technological Diffusion (TECH) presents a mean of 0.019 (SD = 0.031), suggesting that financial inclusion and technology market activity remain unevenly distributed across regions. Among the control variables, GDP per capita (gdp) shows a mean of 10.946, whereas foreign direct investment (fdi) displays the largest relative dispersion with a standard deviation of 1.738 (ranging from 0.002 to 12.099). Furthermore, human capital (edu), industrial agglomeration (firms), and government intervention (gov) display means of 0.156, 1.493, and 0.473, respectively, all falling within reasonable statistical bounds and verifying the data quality for subsequent econometric estimation.
The Pearson correlation matrix presented in Table 9 provides preliminary insights into the bivariate relationships among variables. DIG is positively and significantly correlated with IGIE ( r = 0.564 , p < 0.1 ), offering initial support for our core hypothesis that digital infrastructure is associated with higher green innovation efficiency. Furthermore, both mechanism variables—Digital Inclusive Finance (DIF) and local technological diffusion (TECH) exhibit strong and statistically significant positive correlations with DIG and IGIE. Notably, other control variables also display positive correlations with the dependent variable. However, these bivariate correlations should be interpreted with caution, as they do not account for unobserved province-specific characteristics or confounding factors, which will be addressed in the two-way fixed effects regression framework (Equation (4)).
To diagnose potential multicollinearity among the independent variables, we compute the Variance Inflation Factors (VIF), reported in Table 10. The VIF values range from 1.50 (firms) to 6.63 (edu), with a mean VIF of 3.48. Although edu exhibits a slightly higher VIF, all values are well below the conventional threshold of 10. This confirms that multicollinearity does not pose a serious concern in our regression specifications, and all variables can be simultaneously included in the multivariate models without compromising estimation precision.

4.5. Spatial Autocorrelation Diagnosis

To investigate whether the provincial Industrial Green Innovation Efficiency (IGIE) and Digital Infrastructure (DIG) exhibits significant spatial dependence, this study employs the global Moran’s I index for spatial autocorrelation diagnosis. The spatial weight matrix is specified as an economic–geographic nested matrix, which simultaneously accounts for geographic proximity and economic similarity. Specifically, the geographic weight is constructed based on the reciprocal of the squared spherical distance between provincial capitals, while the economic weight is based on the reciprocal of the absolute difference in average per capita GDP across provinces. These two weights are equally weighted to form the nested matrix. This configuration captures both the technological radiation effects arising from geographic adjacency and the innovation factor competition or imitation effects driven by comparable economic development levels, rendering it more economically rational than a single geographic weight.
As shown in Table 11, the global Moran’s I for IGIE fails to pass the significance test in most years. Except for marginal significance at the 10% level in 2018 and 2020, the p-values for the remaining years are well above 0.1, with index values fluctuating closely around zero (ranging from −0.046 to 0.094) and unstable signs. This indicates that provincial industrial green innovation efficiency across China exhibits a relatively random spatial distribution pattern, failing to exhibit a strong global spatial agglomeration.
In contrast, the global Moran’s I for digital infrastructure (DIG) is significantly positive across all years, maintaining a stable range between 0.080 and 0.105, which demonstrates marked spatial clustering characteristics. This aligns with existing observations that eastern coastal provinces have established high-level digital infrastructure clusters due to their first-mover advantages, whereas central and western regions remain relatively low-level digital valleys.
The coexistence of these two outcomes reveals an important spatial reality: although digital infrastructure possesses inherent network attributes and tends to cluster spatially, the spatial distribution of industrial green innovation efficiency remains relatively random at the global level. We acknowledge that an insignificant global Moran’s I does not definitively rule out the presence of local spatial clusters, nor does it preclude unobserved spatial correlation in the regression residuals. However, given that our core research objective is to identify the localized, intra-regional empowerment effect of digital infrastructure on green innovation, we employ a two-way fixed-effects (TWFE) model as our baseline estimation strategy. Crucially, to rigorously address any potential concerns regarding unmodeled local spatial spillovers and cross-sectional dependence in the error terms, we estimate the baseline TWFE model using Driscoll–Kraay standard errors. This approach avoids imposing the strong structural assumptions required by full spatial econometric models, while ensuring that our statistical inferences are fully robust to spatial and temporal dependence of unknown forms.

4.6. Baseline Regression Analysis

This study employs a two-way fixed-effects model, coupled with Driscoll–Kraay standard errors, to examine the direct impact of digital infrastructure on industrial green innovation efficiency (IGIE). The application of Driscoll–Kraay standard errors rigorously accounts for potential heteroscedasticity, within-province serial correlation, and importantly, cross-sectional dependence across provinces. Table 12 presents the baseline regression results. To ensure the reliability of the estimations and directly address model specification concerns, control variables are introduced stepwise from Column (1) to Column (3).
Column (1) reports the baseline estimation without control variables, where the coefficient of digital infrastructure (DIG) is 0.766 and highly significant at the 1% level (t = 4.35). Crucially, Column (2) explicitly excludes all control variables that overlap with the external environmental factors previously utilized in the second-stage SFA (i.e., gdp, fdi, and gov). In this strictly non-overlapping specification, the coefficient of DIG remains significantly positive at the 1% level (0.714, t = 4.09), demonstrating that the promotional effect of digital infrastructure is highly robust and not a statistical artifact driven by overlapping variable configurations. Column (3) reports the full model incorporating all time-varying control variables. The coefficient of DIG continues to be highly significant and positive at the 1% level (0.686, t = 4.83), providing robust support for Hypothesis 1 (H1). Furthermore, as anticipated, the selected control variables do not exhibit statistical significance in the full model, primarily because the high-dimensional two-way fixed effects have effectively absorbed the majority of the within-province macro-level variations.

4.7. Robustness and Endogeneity Tests

4.7.1. Alternative Measure of the Independent Variable

To verify the reliability of the baseline results, we re-estimate the model using an alternative measurement for the independent variable. Following Liu (2025) [54], we apply Principal Component Analysis (PCA) instead of the entropy weight method to construct a new composite index for digital infrastructure, denoted as D I G p c a . As shown in Column (1) of Table 13, the coefficient of D I G p c a is 0.061 and is highly significant at the 1% level, confirming the robustness of the original conclusion to alternative variable constructions.

4.7.2. Excluding Special Samples

Municipalities directly under the central government (Beijing, Shanghai, Tianjin, and Chongqing) differ significantly from regular provinces in economic structure, administrative hierarchy, and digital infrastructure intensity. To prevent these potential outliers from biasing the estimates, we exclude them from the sample, following the approach of Shen (2025) [55]. The regression results for the remaining provinces are presented in Column (2) of Table 13. The coefficient of DIG remains significantly positive at the 10% level (1.395), demonstrating that the baseline findings are not driven by special regional attributes.

4.7.3. Alternative Estimation Method: Panel Tobit Model

As previously defined, the dependent variable, Industrial Green Innovation Efficiency (IGIE), is a truncated variable rigorously bounded between 0 and 1, derived from the SBM-DEA model. While the baseline two-way fixed-effects model effectively controls for unobservable, time-invariant regional characteristics, applying standard linear panel models to censored data may theoretically induce estimation bias. To systematically address this specific data distributional characteristic and verify the robustness of our baseline model choice, we employ a random-effects panel Tobit model as an alternative estimation strategy.
As presented in Column (3) of Table 13, after accommodating the censored nature of the dependent variable, the coefficient of DIG remains robustly positive and statistically significant (Coefficient = 0.504, z = 2.08 , p = 0.037 ). This consistency suggests that our baseline estimations are not driven by the specific choice of the econometric model, thereby ensuring the reliability of the causal inference.

4.7.4. Robustness to Finite Clusters: Wild Cluster Bootstrap

While our baseline specification employs Driscoll–Kraay standard errors to account for cross-sectional dependence, classical panel inferences may also be sensitive to the number of clusters. Given the finite number of geographic clusters in our sample (N = 30 provinces), we further employ the wild cluster bootstrap method (Cameron et al., 2008 [56]; Roodman et al., 2019 [57]) as a stringent complementary check against potential over-rejection of the null hypothesis.
Based on 9999 bootstrap replications utilizing the Webb weight distribution, the wild cluster bootstrap p-value for the core explanatory variable (DIG) is 0.073, which remains statistically significant at the 10% level. This finding aligns with our baseline estimations. Furthermore, the 90% confidence interval is [0.044, 1.711], which strictly excludes zero. This rigorous test confirms that our baseline findings are highly robust and not artifacts of standard error estimation bias stemming from the finite cluster structure.

4.7.5. Frontier-Sensitivity Analysis and Outlier Diagnostics

To directly address the estimation uncertainty associated with the DEA-generated dependent variable, we conducted a rigorous frontier-sensitivity analysis. Since IGIE is a relative efficiency score constrained by the estimated global production frontier, its distribution could be sensitive to extreme decision-making units, particularly those provinces whose scores abruptly reached the maximum boundary (IGIE = 1.000). To strictly rule out the possibility that our baseline results are driven by these extreme outliers, we dropped all 24 observations situated exactly on the production frontier and re-estimated the model. As reported in Column (5) of Table 13, the coefficient of DIG is 0.563 and remains significantly positive at the 1% level. This formally confirms that the driving effect of digital infrastructure on green innovation efficiency is highly robust and not an artifact driven by extreme boundary jumps.

4.7.6. Endogeneity and Identification Strategy

Although the baseline two-way fixed effects model effectively absorbs time-invariant regional heterogeneity and common temporal shocks through the inclusion of province and year fixed effects, potential endogeneity concerns may still undermine the validity of causal inference. These concerns primarily arise from two sources: first, reverse causality, whereby provinces with higher green innovation efficiency may invest more aggressively in digital infrastructure; second, time-varying unobserved confounders could simultaneously affect both digital infrastructure deployment and green innovation performance. To mitigate these identification challenges and establish causality, we construct a Bartik-style shift-share instrument following the approach of Yu et al. (2025) [58].
The instrument is rigorously constructed using a leave-one-out procedure to satisfy the exclusion restriction and to avoid any mechanical correlation. Specifically, the instrument for province i in year t is defined as:
I V i t = D I G i , t 0 × 1 + g i , t
where D I G i , t 0 denotes the initial stock of digital infrastructure in province i in the base year 2012 (the share component), and g i , t represents the cumulative growth rate of digital infrastructure in all other provinces except i from 2012 to year t (the shift component). By explicitly excluding the focal province’s own information, this construction ensures that any province-specific green innovation shock does not contaminate the shift component, thereby reinforcing the instrument’s exogeneity.
A valid shift-share identification strategy must address two potential threats to the exogeneity of both the shift and the share components. Regarding the shift component, the aggregate growth of digital infrastructure in other provinces may reflect nationwide policy shifts, such as national digital economy strategies. To absorb this common macro-level confounding, our specification saturates the model with year fixed effects, which algebraically purge any homogeneous macroeconomic shocks and uniform policy interventions in a given year. Notably, conditional on year fixed effects, demeaning the shift component is equivalent to a linear transformation of its raw form and thus does not alter the 2SLS coefficient estimate. Hence, we retain the raw growth rate for conceptual clarity. Regarding the share component, the initial level of digital infrastructure in 2012 is inherently correlated with provincial historical economic conditions, innovation capacity, and industrial bases, which may give rise to heterogeneous long-term trends in green innovation efficiency. To rigorously rule out violations of the exclusion restriction through this channel, we further include the interaction term between the logarithm of base-year GDP per capita and a linear time trend ( c . g d p _ 2012 # c . t i m e _ t r e n d ) in the second-stage regression. This specification permits provinces with different initial economic endowments to follow distinct evolutionary paths over the sample period, thereby effectively blocking the direct influence of baseline conditions on the outcome variable via unobserved channels.
The two-stage least squares (2SLS) estimates are reported in Table 14, with standard errors clustered at the province level to account for intra-group serial correlation and heteroskedasticity. The first-stage results reveal that the Bartik instrument exerts a strong and highly significant predictive power over the current level of digital infrastructure ( β = 0.163 ,   p < 0.001 ). Critically, the Kleibergen–Paap rk Wald F statistic equals 18.09, comfortably exceeding the Stock–Yogo critical value of 16.38 at the 10% maximal IV size, which decisively rejects the null of weak identification. The under-identification test is also rejected at the 1% significance level, confirming model identifiability.
The second-stage estimate shows that, after fully accounting for endogeneity and heterogeneous trends stemming from initial conditions, the coefficient on digital infrastructure (DIG) remains positive and stable ( β = 1.593 ), with a nominal p-value of 0.057, significant at the 10% level. Recognizing that the conventional 2SLS estimator relies heavily on the exclusion restriction in the just-identified case, we further report the Anderson--Rubin (AR) test, which is robust to weak instruments and even to mild violations of perfect exogeneity. The AR Wald test yields an F ( 1 ,   29 ) statistic of 5.85 with a p-value of 0.022, indicating that the null hypothesis of a zero coefficient on the endogenous regressor is rejected at the 5% significance level under a conservative setting that relaxes the strict exogeneity assumption. This provides more robust statistical support for the existence of a causal effect.

4.8. Mechanism Analysis

Based on the mechanism model specified in Equation (5), we empirically test whether digital infrastructure significantly promotes the two mechanism variables: digital inclusive finance and local technological diffusion.
Column (1) of Table 15 reports the regression results with digital inclusive finance ( D I F ) as the dependent variable. The estimated coefficient of D I G is 111.124 and is statistically significant at the 1% level. This result supports Hypothesis 2. The finding suggests that digital infrastructure serves as a critical physical foundation for digital inclusive finance. By enabling the collection and processing of large-scale non-traditional data, it helps to reduce information asymmetry in credit markets and expands the geographical coverage of financial services. This expansion of digital inclusive finance, in turn, helps to relax financing constraints and collateral requirements faced by industrial enterprises. Consequently, it provides sustained financial support for green technological retrofitting, which ultimately contributes to industrial green innovation efficiency.
Column (2) examines the local technological diffusion mechanism ( T E C H ). The estimated coefficient of D I G is 0.109 , which is significantly positive at the 5% level, thereby validating Hypothesis 3. As theoretically deduced, although T E C H captures aggregate market turnover rather than purely green patents, its significant expansion confirms that digital infrastructure successfully mitigates overall technology matching frictions. This enhanced market liquidity inherently accelerates the intra-regional dissemination of advanced modular technologies, efficiently providing the necessary external knowledge inputs for firms’ green retrofitting.

5. Discussion

5.1. The Driving Role of Digital Infrastructure and Mechanism Insights

The empirical results robustly confirm that digital infrastructure exerts a significant positive effect on enhancing Industrial Green Innovation Efficiency (IGIE). This finding aligns with the broader consensus in recent literature regarding the environmental dividends of the digital economy [28,29,30]. However, our study provides a more granular perspective by isolating foundational physical and network hardware from generalized digital applications. The adjusted three-stage SBM-DEA results indicate that while China’s overall IGIE is on a fluctuating upward trajectory, the absolute efficiency level remains relatively low. This suggests that the initial sunk costs and energy consumption associated with large-scale digital deployment are being gradually offset by its long-term innovation dividends, though the industrial sector is still in a transitional climbing phase.
Regarding the transmission channels, our findings directly answer how digital infrastructure translates into green efficiency. First, it drives IGIE by promoting digital inclusive finance. By serving as the physical backbone for fintech and big-data credit assessment, digital infrastructure helps alleviate the severe financing constraints and collateral bottlenecks traditionally faced by industrial green innovation projects, thereby channeling crucial capital into sustainable manufacturing upgrades.
Second, the enhancement of IGIE is realized through local technological diffusion, a mechanism that closely complements our spatial diagnostic results. The lack of significant global spatial spillovers in IGIE indicates that the current industrial green transition relies primarily on intra-regional factor optimization rather than geographic diffusion from neighboring provinces. Digital infrastructure effectively dismantles local data silos and reduces technology search costs, thereby invigorating the local technology market. This accelerates the trading, assimilation, and application of green innovations within the province, making localized technology sharing the primary engine for industrial green transformation.

5.2. Unpacking Regional Efficiency Variations and Broad Implications

Based on the descriptive analysis of the environment-adjusted scores, our study identifies distinct regional variations in efficiency levels and developmental trajectories: “eastern leadership, central catch-up, western improvement, and northeastern volatility.” Since these variations reflect the actual efficiency outcomes rather than heterogeneous causal mechanisms, they provide an intuitive macroscopic context for understanding China’s regional industrial realities.
To contextualize these descriptive trends, it is worthwhile to theoretically discuss the possible reasons for this. The persistent leadership of the Eastern region in green efficiency scores is largely attributable to its mature market ecosystem and stringent environmental regulations. These underlying conditions ensure that regional industrial enterprises inherently possess higher resource allocation efficiency and a stronger capability to assimilate advanced technologies. The steady catch-up of the Central region—manifested by its narrowing efficiency gap with the national average—underscores a successful model of industrial undertaking; central provinces have managed to absorb industrial transfers without severely compromising environmental performance. Conversely, the Western region’s efficiency scores have improved but remain constrained by its relatively weak initial economic foundation and geographical barriers. Most notably, the Northeast’s erratic efficiency fluctuations intuitively reflect the region’s deep structural rigidity and industrial inertia. Its profound path dependence on traditional heavy industries makes its industrial green performance highly susceptible to short-term policy stimuli rather than sustainable, structural innovation.
While this study utilizes provincial panel data from China to uncover these efficiency dynamics and the baseline catalytic role of digital infrastructure, its implications transcend specific national borders. On a global scale, manufacturing industries face a concrete dual task: they must curb environmental pollution and energy consumption while simultaneously integrating digital networks into their traditional production processes. For many emerging economies and developing nations currently grappling with the conflict between sustained industrialization and environmental degradation, China’s trajectory offers a valuable empirical blueprint. The evidence suggests that proactive, targeted deployment of digital infrastructure serves as a fundamental macro-level catalyst. This provides a replicable pathway for other developing countries aiming to leapfrog traditional high-emission growth models and achieve high-quality sustainable development.

5.3. Policy Suggestions

(1) Target digital infrastructure investments to catalyze local technology diffusion. Our baseline regression results robustly demonstrate that digital infrastructure acts as a fundamental catalyst, significantly enhancing overall Industrial Green Innovation Efficiency (IGIE). To maximize this proven promotional effect, investments must be precise. Our evaluation index indicates that mobile base station density and telecommunication business volume constitute the core drivers of digital empowerment. Therefore, policymakers in developing nations should pivot from generic internet rollouts to deploying dedicated 5G and industrial internet hardware directly within traditional manufacturing hubs. Furthermore, since our mechanism analysis confirms that digital networks drive this efficiency leap via local technology diffusion rather than cross-provincial spillovers, local governments should prioritize building intra-provincial digital technology-sharing platforms.
(2) Formulate tiered industrial transformation strategies based on regional efficiency trajectories. Our descriptive efficiency measurements reveal severe regional variations. For large developing nations with uneven economic geographies, a “one-size-fits-all” digital policy is highly inefficient. Advanced regions (such as China’s East) should leverage their mature digital networks to focus on maximizing desirable outputs, specifically incentivizing high-quality original green patents. Transitional and catch-up regions (such as China’s Central and West) must integrate strict digital monitoring of undesirable outputs (e.g., SO2 emissions) when absorbing industrial transfers, actively using data sensors to prevent becoming destinations for outdated and high-emission capacities. Meanwhile, regions facing profound structural rigidity and industrial inertia (like China’s Northeast) should direct digital investments specifically toward upgrading heavy-industry equipment rather than blindly expanding digital hardware scale.
(3) Deepen the integration of technology and finance to alleviate corporate financing constraints. Our mechanism tests provide robust evidence that promoting digital inclusive finance inherently enhances green efficiency by alleviating corporate financing constraints. Therefore, governments globally should not merely fund hardware construction; they must coordinate with financial institutions to build big-data credit-sharing platforms. By leveraging digital infrastructure to assess the dynamic environmental performance of industrial enterprises, policymakers can channel precision credit toward genuine green retrofitting projects, thereby overcoming the traditional collateral bottlenecks and preventing “greenwashing” behaviors.

5.4. Limitations and Future Work

First, the selection of core variables faces certain constraints when balancing statistical reliability and input–output consistency. Regarding undesirable outputs, direct carbon emissions were not adopted despite the macro-policy background of the “Dual Carbon” goals. This is because provincial carbon inventories encompass non-industrial sectors (e.g., transportation and agriculture). DEA mathematically necessitates strict boundary homogeneity; industrial SO2 emissions perfectly overlap with our input boundary (“above designated size” industrial enterprises) and exhibit a stable linear correlation with overall industrial pollution. Using SO2 ensures a rigorously closed-loop evaluation, avoiding structural biases caused by broader carbon metrics. Nevertheless, we acknowledge the inherent limitations of relying solely on SO2. Since the emission patterns of other critical pollutants—such as industrial wastewater, solid waste, nitrogen oxides, and particulate matter—do not perfectly synchronize with SO2 trajectories, this singular proxy may introduce a specific estimation bias. Specifically, it might marginally overestimate the green innovation efficiency of provinces dominated by industries with high wastewater or solid waste intensities but low atmospheric emissions. Regarding desirable outputs, due to the unavailability of continuous and standardized provincial green patent data, this study employs valid invention patents and new product sales. Although not exclusively “green” via IPC classifications, valid patents effectively filter out low-quality strategic innovations, serving as reliable proxies for substantial technological breakthroughs under environmental constraints. Addressing these biases by constructing a comprehensive, multi-pollutant environmental cost index and integrating precise green patent data represents a critical avenue for future research once granular, multidimensional databases become fully accessible. Furthermore, the economic output is measured in nominal terms. While the numerator–denominator cancellation effect between nominal inputs and nominal outputs effectively mitigates severe temporal incomparability, omitting granular price deflators may still retain minor asymmetric price distortions.
Second, the research scale and empirical scope require further expansion. On the domestic front, while this study relies on provincial-level panel data and identifies aggregate national impacts, future research should leverage micro-datasets at the prefecture-city or enterprise levels to examine specific organizational behaviors and explicitly test the empirical regional heterogeneity of this causal effect. On the international front, the geographical scope is currently confined to China. While China serves as a highly representative case for large-scale digital deployment and rapid industrial transition, future research should construct cross-national panel datasets, comparing diverse emerging economies with developed nations. This extension is essential to verify the global generalizability of our findings and to explore how different national regulatory frameworks modulate the impact of digital infrastructure during the global “twin transition”.
Third, the dependent variable (IGIE) is not directly observed but generated through a three-stage SBM-DEA procedure. As noted by Simar and Wilson (2007) [59], using DEA-estimated scores in subsequent regressions introduces first-stage measurement uncertainty that may transmit into the second-stage estimates. While our wild cluster bootstrap corrects for inference under a finite number of clusters, it treats IGIE as fixed and does not re-estimate the production frontier during resampling. Fully integrating a bootstrap of the entire three-stage DEA with a two-way fixed-effects panel model remains computationally intractable, and the direction and magnitude of the resulting bias in our coefficient estimates are difficult to ascertain. To partially address this concern, we excluded frontier observations (Column (5) of Table 13) and confirmed that the core results remain qualitatively stable. Nonetheless, readers should be aware that the generated-regressor problem is not fully eliminated; we therefore interpret our findings with appropriate caution, and future methodological research may develop integrated bootstrap algorithms to more rigorously account for this error transmission.

6. Conclusions

This study systematically investigates the impact of digital infrastructure on Industrial Green Innovation Efficiency (IGIE) in China under the structural transition toward high-quality development. Utilizing a three-stage global SBM-DEA model on panel data from 30 Chinese provinces spanning 2012 to 2022, we accurately measured the environment-adjusted IGIE by mitigating external environmental interferences and statistical noise.
The findings yield three core conclusions. First, China’s overall IGIE exhibits a fluctuating upward trajectory; however, the absolute efficiency level remains relatively low, indicating a critical need for continued optimization. Second, significant regional variations characterize the national landscape, manifesting distinctly as Eastern leadership, Central catch-up, Western improvement, and Northeastern volatility. Third, baseline regressions and instrumental variable (IV-2SLS) endogeneity tests robustly confirm that digital infrastructure serves as a significant fundamental catalyst for enhancing IGIE. Mechanism analyses further reveal that this promotional effect is primarily driven by digital inclusive finance and localized technological diffusion.
Ultimately, these findings theoretically enrich the understanding of how digital elements drive sustainable industrial transitions. By clarifying the localized mechanisms and regional trajectories of digital empowerment, this study provides robust empirical evidence and a practical blueprint for policymakers in China and other emerging economies to optimally leverage digital infrastructure during the global “twin transition”.

Author Contributions

Conceptualization, X.D.; methodology, Z.Z.; software, Z.Z.; formal analysis, Z.Z.; data curation, Z.Z.; writing—original draft preparation, Z.Z.; writing—review and editing, X.D.; supervision, X.D. All authors have read and agreed to the published version of the manuscript.

Funding

This research was funded by the Shanghai Philosophy and Social Science Planning Project (Grant No.2025BGL013).

Institutional Review Board Statement

Not applicable.

Informed Consent Statement

Not applicable.

Data Availability Statement

The data presented in this study are available on request from the corresponding author.

Acknowledgments

The authors would like to express their gratitude to the editors and anonymous reviewers for their insightful comments and constructive suggestions, which significantly improved the quality of this paper. During the preparation of this manuscript, the authors used Gemini (3.5-flash) for the purposes of English language translation, text polishing, and structural formatting. The authors have reviewed and edited the output and take full responsibility for the content of this publication.

Conflicts of Interest

The authors declare no conflicts of interest.

References

  1. Tilson, D.; Lyytinen, K.; Sørensen, C. Digital infrastructures: The missing IS research agenda. Inf. Syst. Res. 2010, 21, 748–759. [Google Scholar] [CrossRef] [Scilit]
  2. Che, S.; Wen, L.; Wang, J. Global insights on the impact of digital infrastructure on carbon emissions: A multidimensional analysis. J. Environ. Manag. 2024, 368, 122144. [Google Scholar] [CrossRef] [Scilit] [PubMed]
  3. Liu, Y.; Dong, J.; Wei, J. Digital innovation management: Theoretical framework and future research. Manag. World 2020, 36, 198–217. [Google Scholar]
  4. Wan, X.; Luo, Y. Measurement of digital economy development level and its effect on total factor productivity. Reform 2022, 101–118. Available online: https://refo.cbpt.cnki.net/portal/journal/portal/client/paper/c4988ab2041bef8c6ebec426b0278660 (accessed on 3 July 2026).
  5. Li, S.; Yu, H.; Wu, W.; Ge, Y. Study on the mechanism of digital infrastructure’s impact on industrial upgrading. Sci. Technol. Prog. Policy 2023, 40, 99–107. [Google Scholar] [CrossRef]
  6. Hong, J.; Tang, Z.; Liu, B. Measurement and empirical research on the stock scale of new infrastructure. Manag. Rev. 2024, 36, 72–83. [Google Scholar]
  7. Zhao, Y.; Zheng, Q.; Chen, S.; Huang, J. Research on the construction of digital infrastructure evaluation index system. Stat. Decis. 2025, 41, 30–35. [Google Scholar] [CrossRef]
  8. Vuković, S.; Božović, M.L.; Đurić, S.; Đurković, D.; Kašćelan, L. Digital infrastructure as the catalyst for sustainable economic development in the Western Balkans. Netw. Spat. Econ. 2025, 1–26. [Google Scholar] [CrossRef] [Scilit]
  9. Pei, E.; Zhang, Z. The impact of digital infrastructure construction on high-quality economic development—A quasi-natural experiment based on the “Broadband China” strategy. East China Econ. Manag. 2024, 38, 64–74. [Google Scholar]
  10. Ke, M.; Lin, Y.; Dai, X. How does digital infrastructure improve export technical complexity?: Also on the comparison with the role of traditional infrastructure. World Econ. Stud. 2023, 32–45. [Google Scholar] [CrossRef]
  11. Dai, X.; Ma, H. How does new digital infrastructure affect the GVC participation of China’s manufacturing industry? J. Guizhou Univ. Financ. Econ. 2024, 31–40. Available online: https://gcxb.gufe.edu.cn/CN/Y2024/V42/I01/31 (accessed on 3 July 2026).
  12. Shen, Y.; Zhang, H. Research on the impact of digital infrastructure construction on the high-quality development of low-altitude economy. J. Beijing Univ. Aeronaut. Astronaut. (Soc. Sci. Ed.) 2024, 37, 96–108. [Google Scholar]
  13. Zou, Z.; Li, X.; Yin, S.; Li, K. Dynamic evolution of green innovation efficiency in China: Spatial heterogeneity and convergence analysis. Technol. Anal. Strateg. Manag. 2025, 37, 2938–2953. [Google Scholar] [CrossRef] [Scilit]
  14. Meng, W.; Fan, D.; Li, D. The impact of open government data on urban green innovation efficiency—A quasi-natural experiment based on the launch of open government data platforms. Technol. Econ. 2024, 43, 1–17. [Google Scholar]
  15. Ding, Z.; Qian, D.; Wang, X. Study on the impact of trade friction on urban green innovation efficiency: From the perspective of profit quality analysis. Sci. Res. Manag. 2025, 46, 160–169. [Google Scholar]
  16. Ma, L.; Huang, L. The impact of market-oriented allocation of factors on the green innovation efficiency of high-tech industries. Econ. Surv. 2024, 41, 108–122. [Google Scholar]
  17. Fan, D.; Jia, M. Research on the impact of R&D resource misallocation on the efficiency of industrial green technology innovation—Based on the threshold effect of digital economy. Sci. Res. Manag. 2024, 45, 95–104. [Google Scholar]
  18. Yan, L.; Rong, W.; Yu, L.; Yang, L.; Guo, X. Spatiotemporal Differentiation and Dynamic Evolution of Green Innovation Efficiency in China’s Tourism Industry. J. Nanjing Norm. Univ. (Nat. Sci. Ed.) 2026, 49, 45–55. [Google Scholar]
  19. Xiao, B.; Li, H. Financial efficiency, green innovation and green total factor productivity. Financ. Res. Lett. 2025, 76, 107005. [Google Scholar] [CrossRef] [Scilit]
  20. Wang, X.; Wang, M. Research on green innovation efficiency of manufacturing industry and its influencing factors—An analysis based on super-efficiency SBM-Tobit model. Manag. Adm. 2025, 234–240. [Google Scholar] [CrossRef]
  21. Yu, M. Measurement of industrial green innovation efficiency in the Yangtze River Economic Belt—Based on Super-SBM model and ML index. China Mark. 2025, 17–20. [Google Scholar] [CrossRef]
  22. Cao, Z.; Zhang, X.; Fan, Y.; Zhang, R. Measurement of green innovation efficiency of industrial enterprises and analysis of spatial spillover effects. Stat. Decis. 2023, 39, 116–120. [Google Scholar]
  23. Chen, L.; Xie, X.; Yao, Y.; Huang, W.; Luo, G. A hybrid data envelopment analysis–random forest methodology for evaluating green innovation efficiency in an asymmetric environment. Symmetry 2024, 16, 960. [Google Scholar] [CrossRef] [Scilit]
  24. Zhu, Y.; Gao, H.; Xu, Y. The impact of the coordinated development of two-way FDI on the efficiency of industrial green technology innovation—Based on the moderating effect of government quality. Ecol. Econ. 2022, 38, 40–49. [Google Scholar]
  25. Sun, Q.; Wang, T. Research on the impact of manufacturing industry agglomeration and technological innovation on industrial green development efficiency in Central and Eastern China. Logist. Sci-Tech 2024, 47, 69–74. [Google Scholar]
  26. Yan, H.; Xiao, J.; Feng, B. Evaluation of industrial green technology innovation efficiency in the Yangtze River Economic Belt and analysis of its influencing factors. Stat. Decis. 2022, 38, 96–101. [Google Scholar]
  27. Shi, X.; Yu, Z.; Chen, Y. The impact of green technology innovation on China’s industrial green energy efficiency. Technol. Innov. Manag. 2024, 45, 635–647. [Google Scholar]
  28. Zhang, M.; Ma, X. Research on the mechanism and synergistic effect of green digital infrastructure empowering the construction of a modern industrial system—Dual perspectives of supply side and demand side. Sci. Technol. Prog. Policy 2026, 43, 87–99. [Google Scholar] [CrossRef]
  29. Gu, R.; Hu, Y.; Yang, Y.; Wang, P.; Yuan, B.; Cui, J. The impact and spatial effect of digital infrastructure on green total factor energy efficiency. Geogr. Geo-Inf. Sci. 2026, 42, 84–93. [Google Scholar]
  30. Zhang, Y.; Xu, C.; Shen, J.; You, S.; He, L. Impact and Mechanism of Digital Economy on the Spatial Correlation Network Structure of China’s Manufacturing Green Transition Efficiency. Environ. Sci. 2026, 1–26. [Google Scholar] [CrossRef]
  31. Chen, T.; Chen, G. The spatial effect of digital elements empowering industrial structure upgrading—A spatial econometric analysis based on the distance characteristics of digital new infrastructure. Front. Eng. Manag. 2026, 45, 59–65. [Google Scholar]
  32. Ling, S.; Gao, H.; Yuan, D. Catalytic role of the digital economy in fostering corporate green technology innovation: A mechanism for sustainability transformation in China. Econ. Anal. Policy 2024, 84, 278–292. [Google Scholar] [CrossRef] [Scilit]
  33. Li, S.; Xie, N. The impact of digital finance on firms’ digital Transformation: Mechanism analysis based on enterprise financing. Int. Rev. Econ. Financ. 2025, 101, 103254. [Google Scholar] [CrossRef] [Scilit]
  34. Ma, Y.; Mahmood, R.; Nassir, A.M.; Zhang, L. Digital Finance and Green Technology Innovation: A Dual-Layer Analysis of Financing and Governance Mechanisms in China. Sustainability 2025, 17, 8982. [Google Scholar] [CrossRef] [Scilit]
  35. Sheng, Q.; Li, W. Research on the impact of digital infrastructure construction on the diffusion of green technology innovation. Inq. Econ. Issues 2024, 138–151. Available online: https://kns.cnki.net/kcms2/article/abstract?v=Tadyhzi4uofMmv8wfLRBg0jXfLJqgG28DYXXvThp91zzmq82659e8VFB8HwlfnrbV92WzaJxe-JytRqDnZKOIracAZGtANykf7JMumcWi_HtpbKYHT5JjPIMCr7652Pymlz_NpSeZR0ZJMcH9pll4O3XU4UaybcTLtiwmYRyrimME8QJ3AxRBA==&uniplatform=NZKPT&language=CHS (accessed on 3 July 2026).
  36. Sun, B.; Xie, X.; Zhang, Z. How does the technology market affect green total factor productivity? A study from the perspective of OECD green growth strategy. Contemp. Econ. Manag. 2020, 42, 18–27. [Google Scholar]
  37. Yang, Z.; An, W. The “digital-real integration” of technology transactions: Digital technology trading networks and manufacturing total factor productivity. Foreign Econ. Manag. 2025, 47, 99–116. [Google Scholar]
  38. Fried, H.O.; Lovell, C.A.K.; Schmidt, S.S.; Yaisawarng, S. Accounting for environmental effects and statistical noise in data envelopment analysis. J. Product. Anal. 2002, 17, 157–174. [Google Scholar] [CrossRef] [Scilit]
  39. Jiang, T. Mediation effect and moderation effect in causal inference empirical research. China Ind. Econ. 2022, 100–120. [Google Scholar] [CrossRef]
  40. Xue, Y.; Shi, H.; Zhang, Y. Spatial-temporal evolution of industrial green innovation efficiency in the Yellow River Basin and its influencing factors. J. Shanxi Norm. Univ. (Nat. Sci. Ed.) 2025, 39, 52–60. [Google Scholar]
  41. Zhang, L.; Zhang, Y.; Liang, Y. Measurement and evaluation of green technology innovation efficiency of Chinese industrial enterprises—Analysis based on super-efficiency network SBM-Malmquist model. Technol. Econ. 2022, 41, 13–22. [Google Scholar]
  42. Lu, J. Technical progress bias and green innovation efficiency—From the perspective of spatial-temporal effect. Technoecon. Manag. Res. 2025, 137–144. Available online: https://jxjg.cbpt.cnki.net/portal/journal/portal/client/paper/a28044f79f9446af9a61ca1a60693a09 (accessed on 3 July 2026).
  43. Li, H.; Fan, D.; Zhang, S.; Ma, L. Classified measurement and promotion model of regional green technology innovation efficiency in China—Based on SBM-SupSBM model with undesirable outputs. Oper. Res. Manag. Sci. 2022, 31, 184–189. [Google Scholar]
  44. Zhu, J. Research on the impact of digital economy on the efficiency of regional green technology innovation. China Bus. Mark. 2025, 34, 36–40. [Google Scholar]
  45. Ma, X. Digital trade and industrial green technology innovation efficiency—Taking strategic emerging industries as an example. Technoecon. Manag. Res. 2025, 152–158. Available online: https://jxjg.cbpt.cnki.net/portal/journal/portal/client/paper/95ae7567a6bcdf052e3d067c6ac132a0 (accessed on 3 July 2026).
  46. Gao, L. Research on industrial green technology innovation efficiency in the Yangtze River Economic Belt based on SBM-DEA model. Mod. Bus. 2022, 28–30. [Google Scholar] [CrossRef]
  47. Hu, Y.; Zhao, L.; Hao, B. Research on the impact of carbon emission trading on the green innovation efficiency of industrial enterprises—Evidence from Chinese listed companies. Sci. Technol. Prog. Policy 2025, 42, 127–137. [Google Scholar] [CrossRef]
  48. Yu, H.; Dong, H.; Bai, M. Research on the efficiency of industrial green technology innovation in Anhui Province based on super-efficiency SBM model. J. Xinjiang Norm. Univ. (Nat. Sci. Ed.) 2025, 44, 64–71. [Google Scholar]
  49. Zheng, W.; Zhang, Y. Can green fiscal policy improve urban green innovation efficiency?—Dual perspectives of innovative technology agglomeration and innovative talent agglomeration. Sci. Technol. Prog. Policy 2026, 43, 64–76. [Google Scholar] [CrossRef]
  50. Zhao, J. Can digital infrastructure promote digital agricultural science and technology innovation? Mod. Econ. Res. 2025, 103–116. [Google Scholar] [CrossRef]
  51. Sun, M.; Chen, N. The impact mechanism and spatial spillover of digital infrastructure construction on the quality of green technology innovation. China Econ. Trade Her. 2025, 55–57. [Google Scholar]
  52. Guo, F.; Wang, J.; Wang, F.; Kong, T.; Zhang, X.; Cheng, Z. Measuring China’s digital financial inclusion: Index compilation and spatial characteristics. China Econ. Q. 2020, 19, 1401–1418. [Google Scholar]
  53. Sun, H.; Gui, H.; Yang, D. Measurement and evaluation of high-quality economic development of China’s provinces. Zhejiang Soc. Sci. 2020, 4–14. [Google Scholar] [CrossRef]
  54. Liu, R. Digital inclusive finance, ESG performance and corporate green productivity. Technoecon. Manag. Res. 2025, 109–115. Available online: https://jxjg.cbpt.cnki.net/portal/journal/portal/client/paper/78eeefbffde73d6f05187f8600261a95 (accessed on 3 July 2026).
  55. Shen, X. Artificial intelligence technology innovation and agricultural green and low-carbon development—Based on the perspective of new quality productive forces and ecological product value realization. Technoecon. Manag. Res. 2025, 134–141. Available online: https://jxjg.cbpt.cnki.net/portal/journal/portal/client/paper/bb6f26639e6bcacc98d0d7b995f7117f (accessed on 3 July 2026).
  56. Cameron, A.C.; Gelbach, J.B.; Miller, D.L. Bootstrap-based improvements for inference with clustered errors. Rev. Econ. Stat. 2008, 90, 414–427. [Google Scholar] [CrossRef] [Scilit]
  57. Roodman, D.; Nielsen, M.Ø.; MacKinnon, J.G.; Webb, M.D. Fast and wild: Bootstrap inference in Stata using boottest. Stata J. 2019, 19, 4–60. [Google Scholar] [CrossRef] [Scilit]
  58. Yu, Z.; Li, M.; Zhuang, E.J. Bartik instrumental variable method in causal identification: Applications and diagnostics. J. Quant. Tech. Econ. 2025, 42, 200–220. [Google Scholar]
  59. Simar, L.; Wilson, P.W. Estimation and inference in two-stage, semi-parametric models of production processes. J. Econom. 2007, 136, 31–64. [Google Scholar] [CrossRef] [Scilit]
Figure 1. Conceptual Framework of Digital Infrastructure’s Impact on IGIE.
Sustainability 18 08501 g001
Figure 2. Line Chart of Industrial Green Innovation Efficiency in Four Major Regions and the Whole Country.
Sustainability 18 08501 g002
Table 1. Indicator System of Industrial Green Innovation Efficiency.
Primary IndicatorSecondary IndicatorVariable Description, Unit & Data SourcesReferences
Innovation InputsR&D personnelFull-time equivalent of R&D personnel in industrial enterprises above designated size (person-years).
Source: China Statistical Yearbook on Science and Technology & Provincial Statistical Yearbooks.
Xue [40], Zhang et al. [41]
R&D expenditureTotal R&D expenditure of industrial enterprises above designated size (10,000 CNY).
Source: China Statistical Yearbook on Science and Technology & Provincial Statistical Yearbooks.
Lu [42], Li et al. [43]
Desirable OutputsTechnological outputNumber of valid invention patents of industrial enterprises above designated size (patents).
Source: China Statistical Yearbook on Science and Technology & Provincial Statistical Yearbooks.
Zhu [44], Ma [45]
Economic outputSales revenue of new products of industrial enterprises above designated size (10,000 CNY).
Source: China Statistical Yearbook on Science and Technology & Provincial Statistical Yearbooks.
Gao [46]
Undesirable OutputEnvironmental costIndustrial SO2 emissions (tons).
Source: China Environmental Statistical Yearbook & Provincial Statistical Yearbooks.
Hu [47], Yu et al. [48], Zheng et al. [49]
Table 2. Environmental Variables of Industrial Green Innovation Efficiency.
Variable CategoryVariable NameVariable FormVariable Definition/Data Sources
External Environmental
Variables
Economic foundation ( g d p )Logarithm of per capita GDPRegional economic development level. Source: China Statistical Yearbook & Provincial Statistical Yearbooks.
Opening degree ( f d i )FDI proportion (%)Foreign capital penetration. Source: China Statistical Yearbook & CSMAR database.
Government S&T support ( g o v )Government S&T expenditure/GDPLocal government S&T financial support. Source: Provincial Statistical Yearbooks.
Industrial structure ( i n d )Proportion of secondary industry in GDP (%)Regional industrial structure characteristics. Source: Provincial Statistical Yearbooks & CSMAR database.
Table 3. Indicator System of Digital Infrastructure Level.
Primary IndicatorSecondary IndicatorIndicator DefinitionData SourcesWeight
Digital Infrastructure SupplyOptical cable line densityTotal length of optical cables/Total administrative land area (km/km2)China Statistical Yearbook & China Communication Industry Statistical Yearbook0.060
Per capita broadband access portsNumber of internet broadband access ports/Total population (ports per 10,000 persons)China Statistical Yearbook & China Communication Industry Statistical Yearbook0.175
Share of ICT practitionersEmployees in information transmission, software and IT services/Total population (%)China Statistical Yearbook on the Tertiary Industry0.158
Mobile base station densityNumber of mobile communication base stations/Total administrative land area (stations per km2)China Statistical Yearbook & China Communication Industry Statistical Yearbook0.236
Computers per 100 residentsTotal computer quantity/Year-end permanent population × 100 (units per 100 persons)China Statistical Yearbook0.062
Digital Infrastructure UtilizationPer capita telecommunication business volumeTotal telecommunication business volume/Total population (CNY per person)China Statistical Yearbook0.211
Mobile phone penetration rateNumber of mobile subscribers/Total population (%)China Statistical Yearbook0.040
Internet broadband penetration rateNumber of broadband internet users/Total population (%)China Statistical Yearbook0.058
Table 4. Definitions and Measurements of Control Variables.
Variable NameSymbolDefinition & Data Sources
Economic Development Level g d p Natural logarithm of per capita GDP (CNY). Data source as described above.
Higher Education Level e d u Ratio of students enrolled in higher education institutions to the total regional population (%).
Source: China Statistical Yearbook & China Education Statistical Yearbook & CSMAR database.
Foreign Direct Investment f d i Ratio of actual utilized FDI to regional GDP (%). Data source as described above.
Entrepreneurial Vitality f i r m s Number of newly registered enterprises per 100 residents.
Source: China Statistical Yearbook & Provincial Administration for Industry and Commerce registration data & CNRDS database.
Government S&T Support g o v Proportion of local fiscal expenditure allocated to science and technology relative to regional GDP (%). Data source as described above.
Table 5. Results of SFA Regression in the Second Stage.
VariablesSlack Variable of R&D Personnel InputSlack Variable of R&D Capital Input
Constant−393,657.57 ***−13,303,319 ***
( 84.92 ) ( 35.01 )
Economic foundation ( g d p )30,397.68 ***1,160,798.5 ***
( 460.55 ) ( 313.04 )
Opening degree ( f d i )2212.00 ***44,746.645 ***
( 618.54 ) ( 7.29 )
Government S&T support intensity ( g o v )−8174.72 ***−1,228,069.1 ***
( 125.89 ) ( 8.69 )
Industrial Structure ( i n d )1319.98 ***18,207.276 ***
( 124.28 ) ( 1122.71 )
σ 2 3,614,590,000 ***3,039,763,700,000 ***
( 1.00 ) ( 1.00 )
γ 0.9676 ***0.9664 ***
( 0.008 ) ( 0.010 )
Log-likelihood−3903.2997−5014.1147
LR test86.27 ***87.04 ***
Note: *** p < 0.01 , ** p < 0.05 , * p < 0.1 . Standard errors are reported in parentheses. Due to the unscaled macroscopic absolute units of the dependent variables, the Maximum Likelihood Estimation (MLE) algorithm yields algorithmically constrained small standard errors near the flat peak of the likelihood function; however, the highly significant LR tests confirm the robustness and validity of the error decomposition for Stage-III adjustments.
Table 6. Industrial Green Innovation Efficiency of China’s Provinces in the Third Stage.
Region20122013201420152016201720182019202020212022
Jilin0.5460.3450.2790.3190.5631.0000.5490.3720.4690.7410.565
Liaoning0.2920.3120.3410.4030.3850.4360.4550.4530.4670.4900.529
Heilongjiang0.1460.1600.1700.1750.1950.2560.2860.2480.3140.4180.473
Shanghai0.3440.3580.4180.4090.4730.5670.5840.6750.7100.7350.759
Jiangsu0.3690.3730.4390.4570.5480.5710.6010.5750.7400.7551.000
Zhejiang0.2920.3460.3850.4160.5290.4890.5150.5620.6281.0001.000
Beijing0.3540.3770.3800.4270.5180.5850.6901.0000.8881.0001.000
Tianjin0.4811.0000.4300.4880.5280.7750.7620.6120.6570.7981.000
Shandong0.2090.2220.2690.2990.3590.4080.4100.4370.4670.5951.000
Guangdong0.4110.4450.5080.5670.7021.0000.7741.0001.0001.0001.000
Hebei0.1760.1810.1890.2370.3090.3260.3730.3670.3960.4800.434
Hainan0.0490.0800.1230.1500.2621.0000.6500.2900.3341.0001.000
Fujian0.2270.2440.2640.3040.3600.3810.3870.4020.4010.3660.369
Anhui0.2690.3210.3860.4190.4630.5080.5350.4880.5890.6530.715
Shanxi0.1850.1770.1820.2250.2690.3430.3790.3980.4260.5400.583
Jiangxi0.1450.1900.2350.2680.3280.3660.3240.3150.3620.4761.000
Henan0.1240.1310.1400.1870.2570.2710.2970.2850.3080.3250.356
Hubei0.2330.2450.2740.3220.3740.3870.4280.4590.4790.6070.674
Hunan0.2820.3070.3530.3870.4060.4190.4060.4120.3910.4850.522
Yunnan0.1150.1420.1750.2030.2360.2630.2720.3200.3450.3490.416
Inner Mongolia1.0000.4120.3840.3530.3890.3970.4730.4920.4791.0001.000
Sichuan0.2920.3310.3960.3850.4080.4370.4140.4370.4390.4610.456
Ningxia0.0740.1050.1490.1520.1920.2330.2500.2290.2660.3950.898
Guangxi0.1300.1560.2010.3050.4310.3930.4190.3820.4250.5400.458
Xinjiang0.0670.1000.1520.1700.1880.2410.3250.3960.4840.5390.653
Gansu0.0790.0930.1070.1100.1130.1370.1450.2020.2270.2980.356
Guizhou0.0800.1110.1510.1610.2190.2420.2510.2670.2640.3230.363
Chongqing0.2960.3200.3330.3040.3510.3970.4220.4200.4360.4380.440
Shaanxi0.2860.3020.3060.2870.3540.4410.5140.5110.4890.5390.521
Qinghai0.0631.0000.0400.0530.0830.0970.1570.2020.2980.3681.000
Northeast0.3280.2720.2630.2990.3810.5640.4300.3570.4170.5500.522
Eastern0.2910.3630.3410.3750.4590.6100.5750.5920.6220.7730.856
Central0.2060.2290.2620.3010.3500.3820.3950.3930.4260.5150.642
Western0.2260.2790.2180.2260.2690.2980.3310.3510.3780.4770.596
National0.2540.2960.2720.2980.3600.4460.4350.4400.4730.5910.685
Notes: The sudden fluctuations of efficiency values reaching the frontier (1.000) in certain provinces and specific years are objective reflections of the relative industrial green innovation efficiency after stripping away the influence of regional environmental factors and random errors in the third stage of the SBM-DEA model. All results are strictly retained to three decimal places to ensure reporting consistency and data integrity.
Table 7. Comparison of Stage-I and Stage-III Mean IGIE.
RegionStage-IStage-III
Northeast China0.3470.399
Jilin0.5330.523
Liaoning0.2770.415
Heilongjiang0.2320.258
Eastern China0.4870.532
Shanghai0.4570.548
Jiangsu0.5600.584
Zhejiang0.5340.560
Beijing0.6340.656
Tianjin0.3430.685
Shandong0.3900.425
Guangdong0.7450.764
Hebei0.2410.315
Hainan0.7670.449
Fujian0.1960.337
Central China0.3070.373
Anhui0.4390.486
Shanxi0.2420.337
Jiangxi0.3210.365
Henan0.1830.244
Hubei0.3320.407
Hunan0.3270.397
Western China0.2980.332
Yunnan0.2320.258
Inner Mongolia0.1930.580
Sichuan0.2840.405
Ningxia0.2950.268
Guangxi0.3560.349
Xinjiang0.3240.302
Gansu0.2590.170
Guizhou0.2530.221
Chongqing0.2760.378
Shaanxi0.2180.414
Qinghai0.5880.305
Whole Nation0.3680.413
Note: Stage-I represents the original industrial green innovation efficiency without environmental and random noise adjustment; Stage-III indicates the efficiency after eliminating external environmental factors and statistical errors.
Table 8. Descriptive Statistics of Key Variables.
VariableNMeanStd. Dev.MinMax
IGIE3300.4130.2290.0401.000
DIG3300.1740.1310.0140.756
gdp33010.9460.4379.88912.156
edu3300.1560.0780.0580.505
fdi3301.8331.7380.00212.099
firms3301.4930.8910.3215.665
gov3300.4730.2710.1511.405
DIF330262.39492.24261.470460.691
TECH3300.0190.0310.00020.191
Table 9. Pearson Correlation Matrix.
VariableIGIEDIGgdpedufdifirmsgovDIFTECH
IGIE1.000
DIG0.564 *1.000
gdp0.701 *0.782 *1.000
edu0.541 *0.767 *0.766 *1.000
fdi0.146 *0.104 *0.297 *0.254 *1.000
firms0.357 *0.390 *0.441 *0.284 *−0.163 *1.000
gov0.379 *0.633 *0.538 *0.631 *0.326 *0.197 *1.000
DIF0.630 *0.734 *0.667 *0.514 *−0.138 *0.521 *0.346 *1.000
TECH0.387 *0.602 *0.526 *0.827 *0.151 *0.195 *0.574 *0.362 *1.000
Notes: * p < 0.1 .
Table 10. Variance Inflation Factors (VIF).
VariableVIF1/VIF
edu6.630.151
DIG4.790.209
gdp4.550.220
TECH3.590.278
DIF3.070.325
gov2.090.478
fdi1.600.624
firms1.500.668
Mean VIF3.48
Table 11. Global Moran’s I test results (2012–2022).
YearIGIEDIG
I Z p -Value I Z p -Value
20120.0130.7540.4510.0952.0450.041
2013−0.041−0.1030.9180.0811.8150.070
20140.0431.0550.2910.0851.8720.061
20150.0671.4020.1610.0972.0310.042
20160.0651.3780.1680.1032.1110.035
2017−0.0020.4610.6450.0951.9890.047
20180.0941.7860.0740.0831.7880.074
20190.0701.5370.1240.0901.9090.056
20200.0931.8310.0670.0861.8570.063
20210.0631.3430.1790.1052.2120.027
2022−0.046−0.1530.8790.1042.2140.027
Table 12. Results of Baseline Regression.
VariableIGIE
(1) (2) (3)
DIG0.766 ***0.714 ***0.686 ***
(0.176)(0.175)(0.142)
gdp 0.141
(0.121)
edu 0.4640.437
(0.499)(0.534)
fdi 0.005
(0.008)
firms −0.008−0.008
(0.019)(0.018)
gov −0.003
(0.083)
Constant0.208 ***0.163 ***−1.343
(0.010)(0.052)(1.237)
Province fixed effectsYesYesYes
Year fixed effectsYesYesYes
Observations330330330
R 2 0.5490.5500.558
Note: *** p < 0.01 , ** p < 0.05 , * p < 0.1 . Driscoll–Kraay standard errors are reported in parentheses.
Table 13. Results of Robustness Tests.
(1) Replace(2) Exclude(3) Panel(4) Wild(5) Exclude
VariableIndep. VarSamplesTobitBootstrapFrontier
DIG 1.395 *0.504 **0.686 *0.563 ***
(0.669)(0.242)[0.044, 1.711](0.106)
D I G p c a 0.061 ***
(0.018)
Control VariablesYesYesYesYesYes
Province fixed effectsYesYesNo (RE)YesYes
Year fixed effectsYesYesYesYesYes
Observations330286330330306
R 2 0.5560.5530.5300.775
Note: *** p < 0.01 , ** p < 0.05 , * p < 0.1 . Columns (1), (2), and (5) report Driscoll–Kraay standard errors in parentheses to maintain consistency with the baseline model. Column (3) reports standard errors from the random-effects Tobit model. Column (4) presents the baseline coefficient with the 90% confidence interval derived from the Wild Cluster Bootstrap (9999 replications, Webb weights) reported in square brackets.
Table 14. Endogeneity Test: Two-Stage Least Squares (2SLS) Estimation Results.
VariablesFirst Stage (DIG)Second Stage (IGIE)
DIG 1.593 *
( 0.804 )
bartik_iv0.163 ***
( 0.038 )
gdp0.067 ** 0.076
( 0.029 ) ( 0.124 )
edu 0.103 0.064
( 0.127 ) ( 0.591 )
fdi 0.002 0.009
( 0.002 ) ( 0.009 )
firms 0.001 0.010
( 0.006 ) ( 0.039 )
gov 0.002 0.020
( 0.026 ) ( 0.114 )
c.gdp_2012#c.time_trend 0.007 ** 0.003
( 0.003 ) ( 0.017 )
Province Fixed EffectsYesYes
Year Fixed EffectsYesYes
Observations330330
Number of Clusters3030
Kleibergen–Paap rk Wald F 18.091
Stock–Yogo 10% Critical Value 16.38
Anderson–Rubin Wald test (F)5.85 ** ( p = 0.022 )
Notes: *** p < 0.01 , ** p < 0.05 , * p < 0.1 . Robust standard errors clustered at the province level in parentheses.
Table 15. Mechanism Analysis: Digital Inclusive Finance and Local Technological Diffusion.
VariablesMechanism 1Mechanism 2
DIF (1)TECH (2)
DIG 111.124 *** 0.109 **
( 13.008 ) ( 0.037 )
gdp 25.178 ***−0.012 **
( 2.677 ) ( 0.005 )
edu−0.245 0.002
( 15.118 ) ( 0.015 )
fdi−0.140−0.002 **
( 0.166 ) ( 0.001 )
firms 3.219 *** 0.001
( 0.637 ) ( 0.001 )
gov 9.352 *** 0.011 *
( 2.245 ) ( 0.005 )
Province Fixed EffectsYesYes
Year Fixed EffectsYesYes
Observations330330
R 2 0.997 0.590
Notes: *** p < 0.01 , ** p < 0.05 , * p < 0.1 . Driscoll–Kraay standard errors in parentheses.
Disclaimer/Publisher’s Note: The statements, opinions and data contained in all publications are solely those of the individual author(s) and contributor(s) and not of MDPI and/or the editor(s). MDPI and/or the editor(s) disclaim responsibility for any injury to people or property resulting from any ideas, methods, instructions or products referred to in the content.