Digital Infrastructure and Industrial Green Innovation in China: An Empirical Study on Efficiency Measurement and Impact Assessment


Abstract
1. Introduction
2. Theoretical Analysis
2.1. Connotations of Digital Infrastructure and IGIE
2.2. Theoretical Analysis and Research Hypotheses
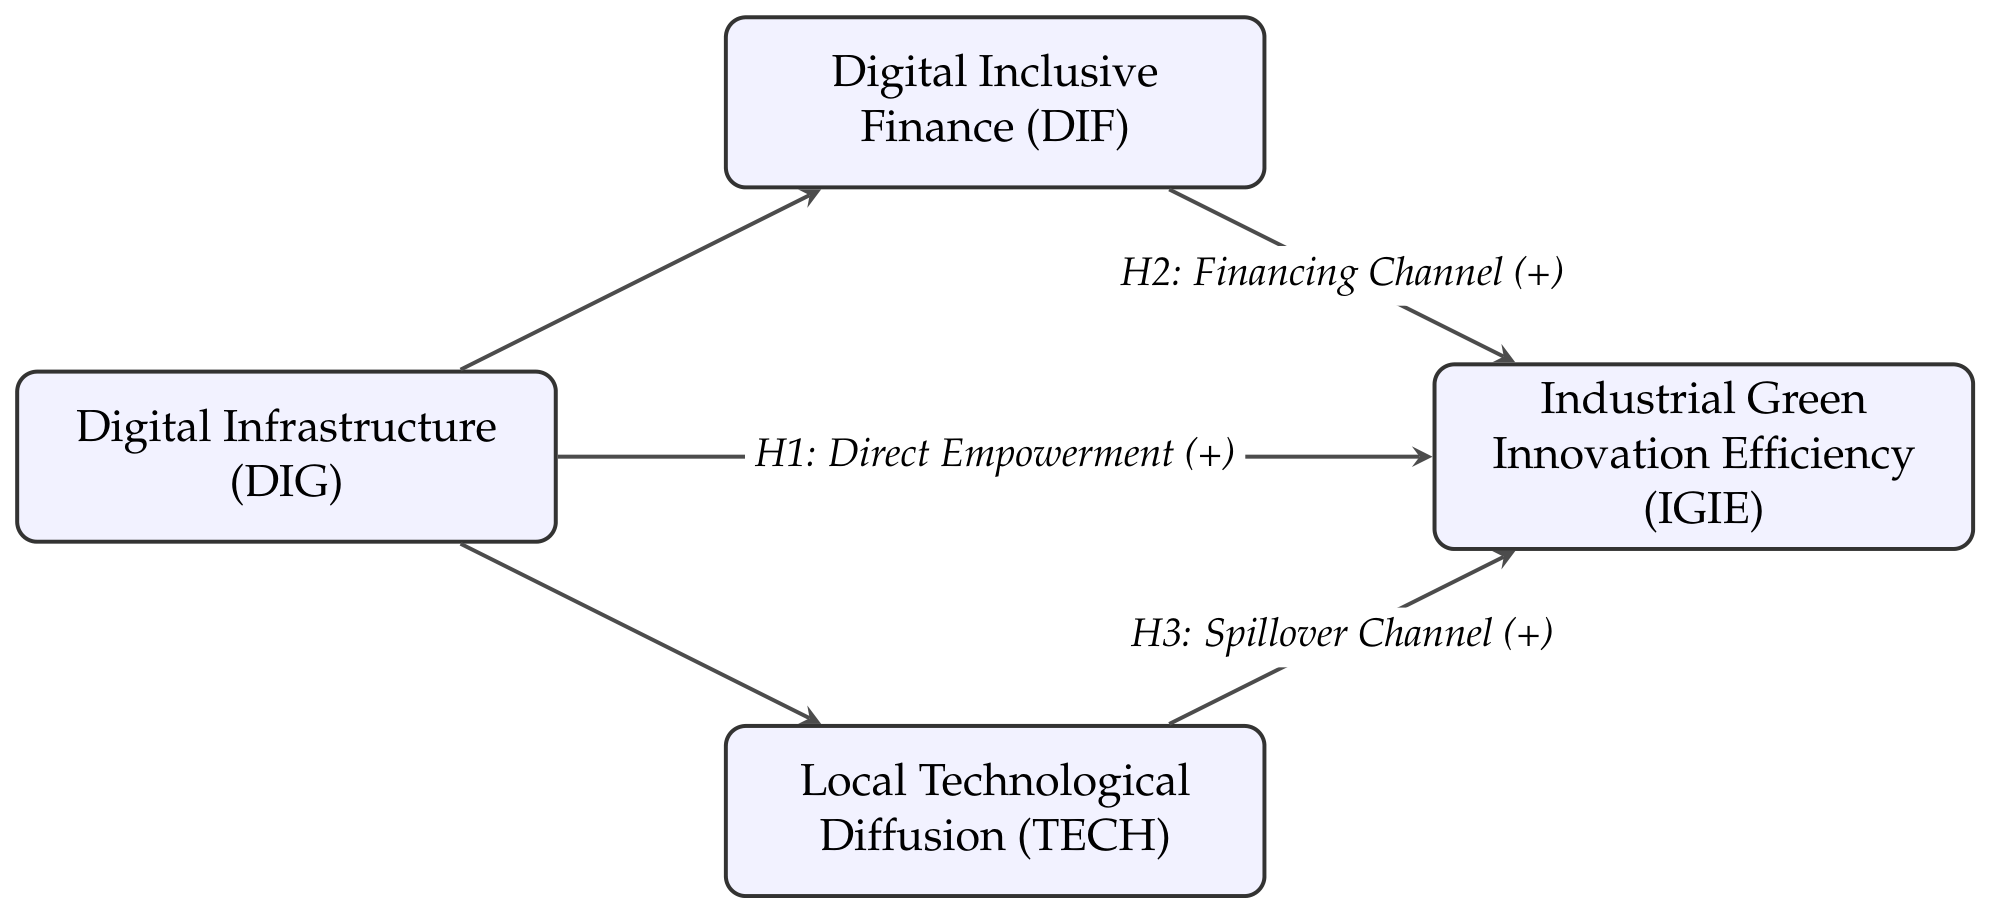
2.2.1. Direct Empowerment of Digital Infrastructure on IGIE
2.2.2. Mechanism 1: Alleviating Financing Constraints Through Digital Inclusive Finance
2.2.3. Mechanism 2: Mitigating Information Asymmetry and Promoting Local Technological Diffusion
3. Materials and Methods
3.1. Study Area and Data Sources
3.2. Research Methods
3.2.1. Three-Stage SBM-DEA Model
- 1.
- Step 1 (Stage 1—Initial SBM): Input the original input matrix X, the desirable output matrix Y, and the undesirable output matrix B. Solve Equation (1) to obtain initial efficiency scores and isolate input slack variables .
- 2.
- Step 2 (Stage 2—SFA Regression): Estimate the SFA regression (Equation (2)) with as the dependent variable and environmental factors Z as independent variables. This decomposes the slack into three components: environmental effects , statistical noise , and managerial inefficiency .
- 3.
- Step 3 (Stage 2—Input Purification): Apply the adjustment mechanism. Execute Equation (3) to compute the environment-adjusted inputs .
- 4.
- Step 4 (Stage 3—Adjusted SBM Evaluation): Replace the original inputs X with the adjusted inputs . Re-solve the global SBM model (Equation (1)) under the identical global frontier and VRS settings to yield the final, environment-adjusted Industrial Green Innovation Efficiency (IGIE) scores.
3.2.2. Baseline Regression Model
3.2.3. Mechanism Analysis Model
3.3. Establishment of IGIE Evaluation Indicators
- Technological Output: Measured by the number of valid invention patents. Unlike gross patent applications or utility models, valid invention patents undergo rigorous substantive examination. Utilizing this variable mitigates the upward bias caused by “strategic but low-quality” patenting behaviors, providing a genuine proxy for high-level green technological capability [44,45]. Regarding cross-provincial and inter-temporal comparability, several methodological rationales are clarified: first, the unified substantive examination standards of the China National Intellectual Property Administration (CNIPA) preclude regional discrepancies in patent approvals; furthermore, employing “valid invention patents” inherently filters for sustained commercial value via renewal fees, while the DEA distance-function mathematically accommodates the dimensional differences between patent counts and monetary revenue.
- Economic Output: Represented by the sales revenue of new products. Technological innovation is only fully realized when it passes the market test. This indicator captures the economic premium and market viability generated by the application of green processes and novel products [46]. Specifically, new product sales revenue is adopted as the economic indicator because it precisely captures the commercialization capability of recent innovation outcomes. By explicitly isolating the financial returns of new R&D endeavors from the revenue generated by mature, non-innovative production lines, this metric directly reflects the exact market value and economic transformation efficiency of recent technological advancements. Furthermore, it serves as a rigorously targeted indicator that measures direct market acceptance across the entire industrial spectrum, ensuring that incremental green innovations and technological upgrades within traditional manufacturing sectors are comprehensively evaluated. Although new product sales revenue is measured in nominal terms without provincial PPI deflation, the corresponding capital input (R&D expenditure) is also nominal. Consequently, macroeconomic inflation effects synchronously offset each other within the SBM-DEA relative efficiency ratio.
- Environmental cost: Industrial SO2 emission is selected as the core proxy for environmental pressure. Given the structural reliance on coal in China’s industrial sector during the observation period, SO2 represents a primary, highly regulated pollutant. Its emission trajectory strongly correlates with both the intensity of heavy industrial activity and the efficacy of regional environmental governance. Therefore, it serves as a highly representative and statistically robust indicator for measuring the true environmental cost of industrial growth [47,48,49].
- Economic Foundation (Logarithm of per capita GDP): Regional economic development inherently dictates the baseline of innovation resource endowment. Developed regions typically possess mature R&D infrastructure, high-quality talent pools, and abundant financial capital, which systematically facilitate the efficient absorption of green technologies and mitigate input slacks. A logarithmic transformation is applied to this indicator to eliminate potential heteroscedasticity and narrow dimensional disparities across provinces.
- Degree of Openness (FDI as a proportion of GDP): Foreign direct investment serves as a critical conduit for cross-border knowledge spillovers. A higher penetration of foreign capital introduces advanced international green manufacturing processes and sophisticated management paradigms into the local market. This spillover effect optimizes local green innovation conditions and significantly reduces passive resource redundancies.
- Government Technological Support (Ratio of government S&T expenditure to GDP): This variable captures the intensity of local institutional backing for innovation. Robust fiscal support in science and technology lowers the external costs and risks associated with corporate R&D activities, encouraging efficient resource utilization. Conversely, insufficient public support may lead to a fragile regional innovation ecosystem, resulting in higher input slacks due to inadequate technology supply.
- Industrial Structure (Proportion of secondary industry to GDP): The scale of the secondary sector reflects a region’s path dependence on traditional manufacturing. A high proportion of heavy industry often implies a rigid structural reliance on energy-intensive and high-emission operations. This path dependence can exacerbate environmental costs and hinder the agile, efficient allocation of green R&D inputs, thereby directly impacting the magnitude of input slacks in the SFA regression.
3.4. Core Explanatory Variable and Other Variables
3.4.1. Digital Infrastructure Measurement (DIG)
3.4.2. Mechanism Variables
- Digital Inclusive Finance (DIF): Proxied by the China Digital Financial Inclusion Index compiled by the Digital Finance Research Center of Peking University (Guo et al., 2020) [52]. This indicator comprehensively captures the breadth of coverage, depth of usage, and degree of digitalization of regional financial services, serving as a robust measure of financial inclusivity and credit accessibility. Source: Peking University Digital Financial Inclusion Index (PKU-DFIIC), Digital Finance Research Center of Peking University & Ant Group Research Institute.
- Technological Diffusion (TECH): Proxied by the ratio of regional technology market turnover to regional GDP. Drawing on the evaluation framework of high-quality regional economic development by Sun et al. (2020) [53], this metric quantifies the activity level and liquidity of the regional technology market. It serves not only as an effective proxy for the mitigation of information asymmetry but also as a core driver reflecting the extent to which cutting-edge green technologies are disseminated, shared, and absorbed across diverse sectors within the local region to foster high-quality economic development. Source: China Science and Technology Statistical Yearbook & Provincial Statistical Yearbooks.
3.4.3. Control Variables
- Economic Development Level (): Quantified by the natural logarithm of per capita GDP. Regions with advanced economic development typically possess more robust industrial foundations and superior resource allocation capacities, which serve as critical prerequisites for green innovation. The logarithmic transformation is applied to alleviate potential heteroscedasticity.
- Higher Education Level (): Measured by the ratio of students enrolled in higher education institutions to the total regional population. This metric proxies the educational attainment and skill structure of the regional labor force. A higher density of human capital corresponds to enhanced knowledge absorptive capacity and technological assimilation capabilities.
- Foreign Direct Investment (): Evaluated as the ratio of actual utilized FDI to regional GDP. This variable captures the extent of regional integration into global production networks. FDI inflows may trigger technology transfer effects by introducing advanced green manufacturing processes, whilst concurrently exerting competitive pressures that compel domestic enterprises to optimize technical efficiency.
- Entrepreneurial Vitality (): Proxied by the number of newly registered enterprises per 100 residents. This indicator reflects the density of micro-level innovation entities and the dynamism of the regional innovation ecosystem. A higher startup rate typically accelerates knowledge diffusion and technological iterations.
- Government Science and Technology Support (): Assessed by the proportion of local fiscal expenditure allocated to science and technology relative to regional GDP. This measure accounts for institutional financial interventions in technological innovation, which fundamentally alleviate corporate R&D risk exposure and guide the trajectory of regional green transitions.
4. Results
4.1. SFA Regression Results
- Economic Foundation (): The coefficients of are significantly positive, suggesting that regions with higher levels of economic development also experience greater R&D input redundancy. Regions with a better economic foundation typically possess stronger resource-carrying capacities and R&D investment capabilities, making them more prone to large-scale R&D characteristics. Consequently, the growth rate of R&D resource inputs exceeds the formation speed of innovation outputs, leading to increased slacks on the input side. Moreover, in economically developed regions, industrial enterprises pursuing technological leadership often increase R&D capital investments in exchange for potential breakthrough outputs. Such strategic investments can also lead to structural redundancy.
- Opening degree (): The coefficients of on both input slacks are significantly positive, indicating that higher openness leads to greater input redundancy. In regions with a higher degree of openness, the redundancy of R&D factor inputs is greater. A high degree of openness may induce the expansion of industrial scale and the rapid agglomeration of innovation resources. Especially in regions with a high proportion of foreign trade and foreign-invested enterprises, R&D activities often exhibit capital-driven expansion characteristics—that is, the growth rate of R&D resource inputs outpaces the improvement in output conversion efficiency, thereby causing structural slacks on the input side.
- Government S&T Support (): The coefficients of are significantly negative, confirming that robust fiscal support systematically lowers R&D redundancies. Higher government technology expenditure provides a stable resource foundation and stronger resource constraints, allowing enterprises to maintain clearer directional focus and higher efficiency in utilizing innovation elements.
- Industrial Structure (): The variable exerts a significant positive effect on both types of input slacks, indicating that regions with a higher proportion of the secondary industry face greater redundancy in R&D personnel and expenditure inputs. The secondary industry is dominated by manufacturing and construction, with production activities characterized as capital- and resource-intensive. In regions with a high secondary industry proportion, the industrial structure is relatively concentrated, and the pressure for technological renewal is intense. In R&D activities, enterprises are more likely to choose to continuously expand their R&D investment scale to maintain their competitive positions, though this may not immediately result in effective innovation outputs. This characteristic leads to a certain degree of resource redundancy on the R&D input side.
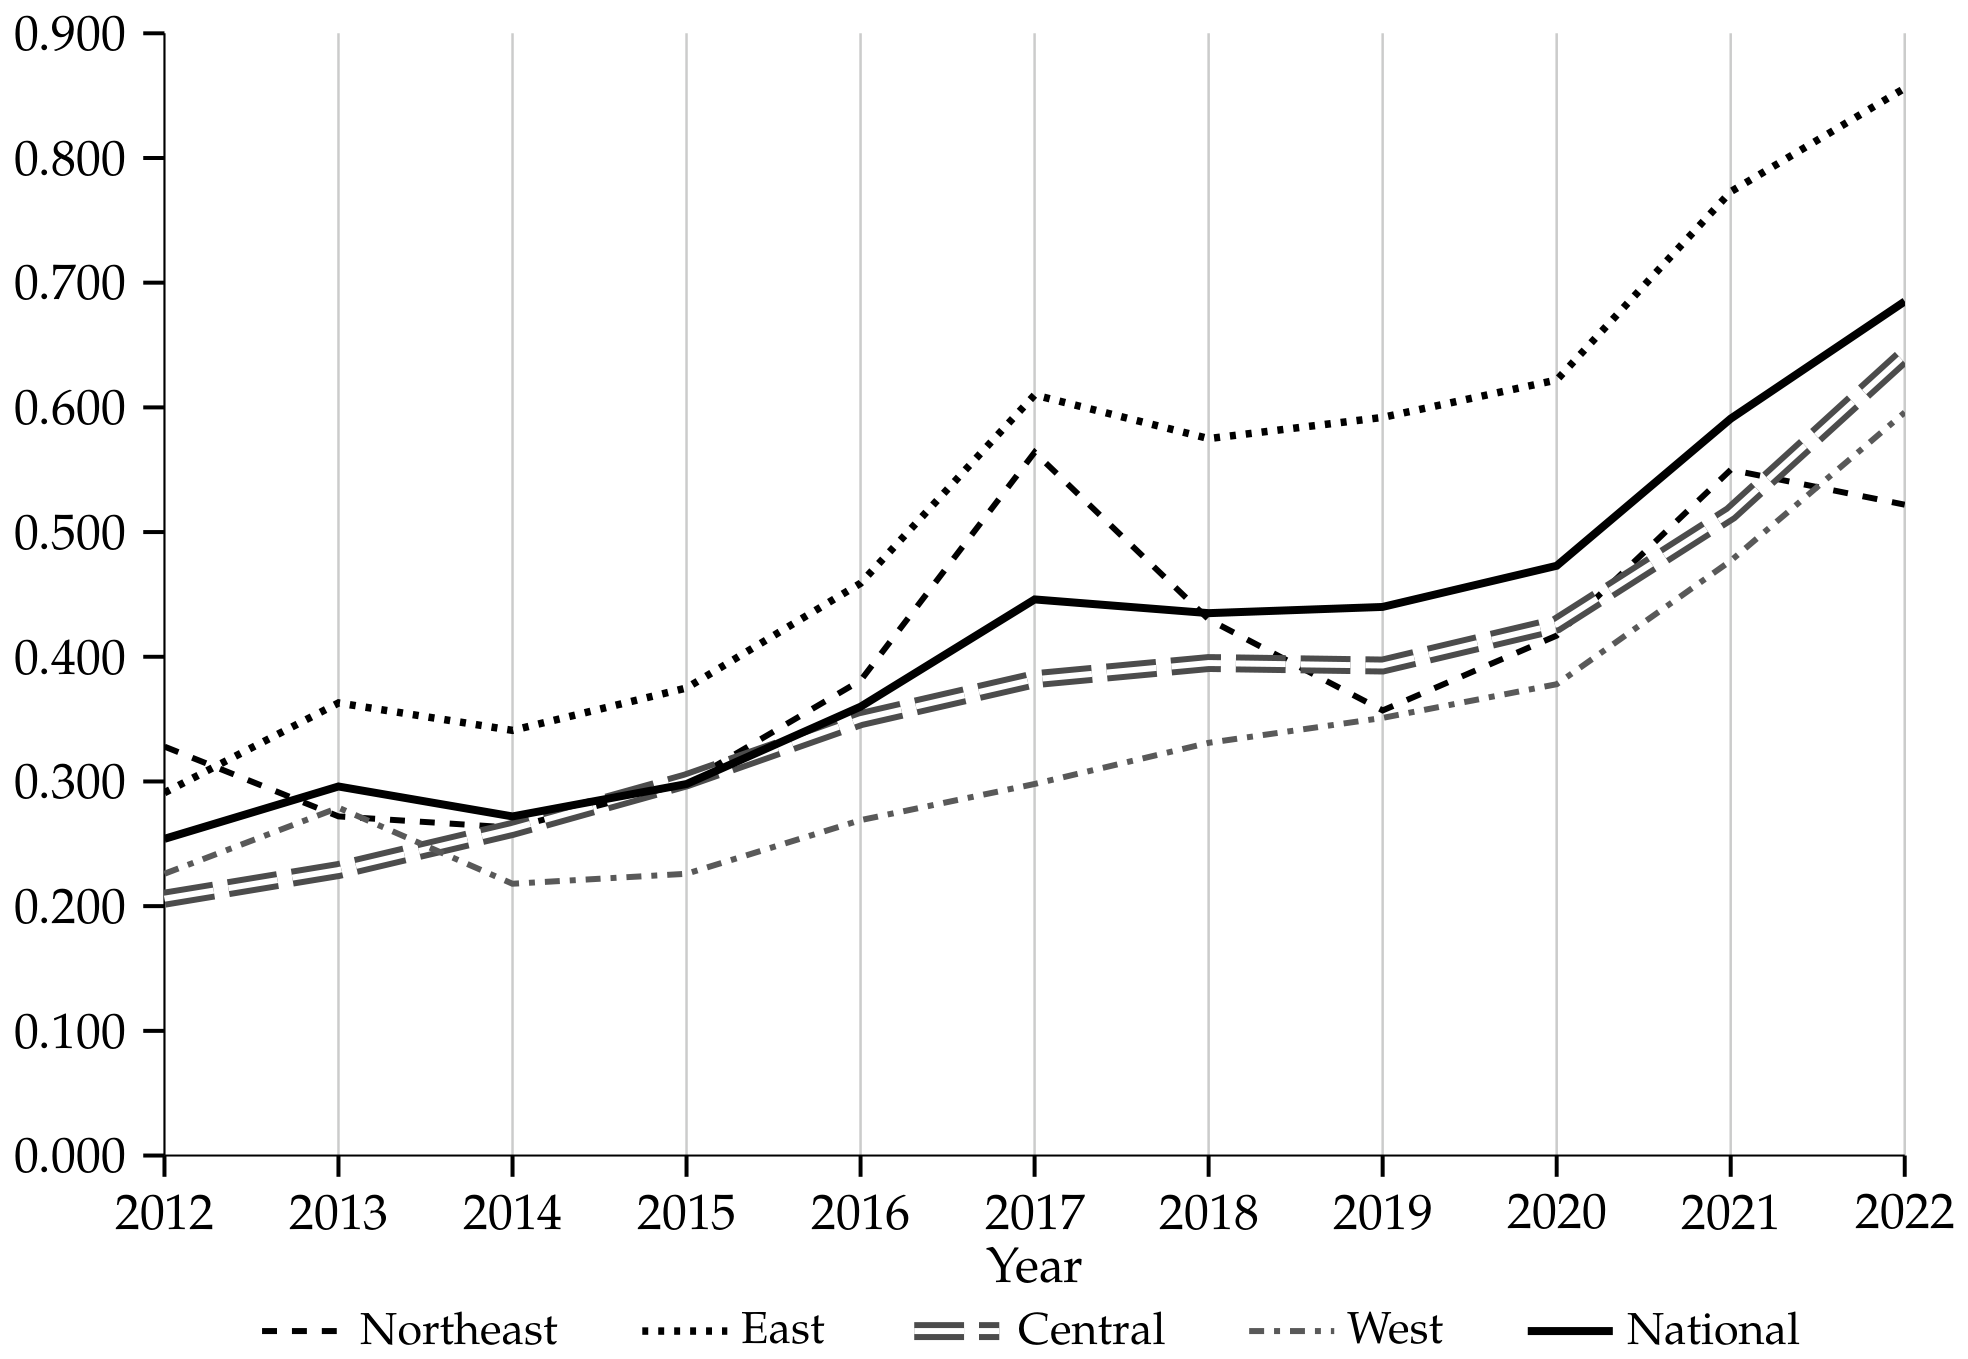
4.2. The Adjusted Industrial Green Innovation Efficiency
4.3. Comparison of Stage-I and Stage-III Mean Efficiencies
- Robust Frontier: Provinces such as Guangdong (0.745 → 0.764), Jiangsu (0.560 → 0.584), and Zhejiang (0.534 → 0.560) maintained high efficiency levels with minor upward adjustments. Their consistent leadership demonstrates that their high performance stems from effective technological management and efficient resource allocation, rather than merely relying on favorable macroeconomic environments.
- Environmentally Suppressed: Provinces including Inner Mongolia (0.193 → 0.580), Tianjin (0.343 → 0.685), Shaanxi (0.218 → 0.414), and Fujian (0.196 → 0.337) experienced substantial efficiency surges in Stage III. This finding underscores the necessity of the three-stage model: their initial low scores were not caused by internal management failures but were constrained by harsh objective environments (e.g., heavy industrialization). Removing these negative external noises reveals their highly underestimated relative potential.
- Environmentally Boosted: In contrast, provinces like Hainan (0.767 → 0.449), Qinghai (0.588 → 0.305), and Gansu (0.259 → 0.170) suffered significant efficiency drops in Stage III. Their superficially high scores in Stage I were largely statistical illusions driven by small input scales or specific ecological policy dividends. Stripping away these favorable environmental advantages exposes their deep-rooted structural weakness in relative technological innovation capabilities.
4.4. Descriptive Statistics and Correlation Analysis
4.5. Spatial Autocorrelation Diagnosis
4.6. Baseline Regression Analysis
4.7. Robustness and Endogeneity Tests
4.7.1. Alternative Measure of the Independent Variable
4.7.2. Excluding Special Samples
4.7.3. Alternative Estimation Method: Panel Tobit Model
4.7.4. Robustness to Finite Clusters: Wild Cluster Bootstrap
4.7.5. Frontier-Sensitivity Analysis and Outlier Diagnostics
4.7.6. Endogeneity and Identification Strategy
4.8. Mechanism Analysis
5. Discussion
5.1. The Driving Role of Digital Infrastructure and Mechanism Insights
5.2. Unpacking Regional Efficiency Variations and Broad Implications
5.3. Policy Suggestions
5.4. Limitations and Future Work
6. Conclusions
Author Contributions
Funding
Institutional Review Board Statement
Informed Consent Statement
Data Availability Statement
Acknowledgments
Conflicts of Interest
References
- Tilson, D.; Lyytinen, K.; Sørensen, C. Digital infrastructures: The missing IS research agenda. Inf. Syst. Res. 2010, 21, 748–759. [Google Scholar] [CrossRef] [Scilit]
- Che, S.; Wen, L.; Wang, J. Global insights on the impact of digital infrastructure on carbon emissions: A multidimensional analysis. J. Environ. Manag. 2024, 368, 122144. [Google Scholar] [CrossRef] [Scilit] [PubMed]
- Liu, Y.; Dong, J.; Wei, J. Digital innovation management: Theoretical framework and future research. Manag. World 2020, 36, 198–217. [Google Scholar]
- Wan, X.; Luo, Y. Measurement of digital economy development level and its effect on total factor productivity. Reform 2022, 101–118. Available online: https://refo.cbpt.cnki.net/portal/journal/portal/client/paper/c4988ab2041bef8c6ebec426b0278660 (accessed on 3 July 2026).
- Li, S.; Yu, H.; Wu, W.; Ge, Y. Study on the mechanism of digital infrastructure’s impact on industrial upgrading. Sci. Technol. Prog. Policy 2023, 40, 99–107. [Google Scholar] [CrossRef]
- Hong, J.; Tang, Z.; Liu, B. Measurement and empirical research on the stock scale of new infrastructure. Manag. Rev. 2024, 36, 72–83. [Google Scholar]
- Zhao, Y.; Zheng, Q.; Chen, S.; Huang, J. Research on the construction of digital infrastructure evaluation index system. Stat. Decis. 2025, 41, 30–35. [Google Scholar] [CrossRef]
- Vuković, S.; Božović, M.L.; Đurić, S.; Đurković, D.; Kašćelan, L. Digital infrastructure as the catalyst for sustainable economic development in the Western Balkans. Netw. Spat. Econ. 2025, 1–26. [Google Scholar] [CrossRef] [Scilit]
- Pei, E.; Zhang, Z. The impact of digital infrastructure construction on high-quality economic development—A quasi-natural experiment based on the “Broadband China” strategy. East China Econ. Manag. 2024, 38, 64–74. [Google Scholar]
- Ke, M.; Lin, Y.; Dai, X. How does digital infrastructure improve export technical complexity?: Also on the comparison with the role of traditional infrastructure. World Econ. Stud. 2023, 32–45. [Google Scholar] [CrossRef]
- Dai, X.; Ma, H. How does new digital infrastructure affect the GVC participation of China’s manufacturing industry? J. Guizhou Univ. Financ. Econ. 2024, 31–40. Available online: https://gcxb.gufe.edu.cn/CN/Y2024/V42/I01/31 (accessed on 3 July 2026).
- Shen, Y.; Zhang, H. Research on the impact of digital infrastructure construction on the high-quality development of low-altitude economy. J. Beijing Univ. Aeronaut. Astronaut. (Soc. Sci. Ed.) 2024, 37, 96–108. [Google Scholar]
- Zou, Z.; Li, X.; Yin, S.; Li, K. Dynamic evolution of green innovation efficiency in China: Spatial heterogeneity and convergence analysis. Technol. Anal. Strateg. Manag. 2025, 37, 2938–2953. [Google Scholar] [CrossRef] [Scilit]
- Meng, W.; Fan, D.; Li, D. The impact of open government data on urban green innovation efficiency—A quasi-natural experiment based on the launch of open government data platforms. Technol. Econ. 2024, 43, 1–17. [Google Scholar]
- Ding, Z.; Qian, D.; Wang, X. Study on the impact of trade friction on urban green innovation efficiency: From the perspective of profit quality analysis. Sci. Res. Manag. 2025, 46, 160–169. [Google Scholar]
- Ma, L.; Huang, L. The impact of market-oriented allocation of factors on the green innovation efficiency of high-tech industries. Econ. Surv. 2024, 41, 108–122. [Google Scholar]
- Fan, D.; Jia, M. Research on the impact of R&D resource misallocation on the efficiency of industrial green technology innovation—Based on the threshold effect of digital economy. Sci. Res. Manag. 2024, 45, 95–104. [Google Scholar]
- Yan, L.; Rong, W.; Yu, L.; Yang, L.; Guo, X. Spatiotemporal Differentiation and Dynamic Evolution of Green Innovation Efficiency in China’s Tourism Industry. J. Nanjing Norm. Univ. (Nat. Sci. Ed.) 2026, 49, 45–55. [Google Scholar]
- Xiao, B.; Li, H. Financial efficiency, green innovation and green total factor productivity. Financ. Res. Lett. 2025, 76, 107005. [Google Scholar] [CrossRef] [Scilit]
- Wang, X.; Wang, M. Research on green innovation efficiency of manufacturing industry and its influencing factors—An analysis based on super-efficiency SBM-Tobit model. Manag. Adm. 2025, 234–240. [Google Scholar] [CrossRef]
- Yu, M. Measurement of industrial green innovation efficiency in the Yangtze River Economic Belt—Based on Super-SBM model and ML index. China Mark. 2025, 17–20. [Google Scholar] [CrossRef]
- Cao, Z.; Zhang, X.; Fan, Y.; Zhang, R. Measurement of green innovation efficiency of industrial enterprises and analysis of spatial spillover effects. Stat. Decis. 2023, 39, 116–120. [Google Scholar]
- Chen, L.; Xie, X.; Yao, Y.; Huang, W.; Luo, G. A hybrid data envelopment analysis–random forest methodology for evaluating green innovation efficiency in an asymmetric environment. Symmetry 2024, 16, 960. [Google Scholar] [CrossRef] [Scilit]
- Zhu, Y.; Gao, H.; Xu, Y. The impact of the coordinated development of two-way FDI on the efficiency of industrial green technology innovation—Based on the moderating effect of government quality. Ecol. Econ. 2022, 38, 40–49. [Google Scholar]
- Sun, Q.; Wang, T. Research on the impact of manufacturing industry agglomeration and technological innovation on industrial green development efficiency in Central and Eastern China. Logist. Sci-Tech 2024, 47, 69–74. [Google Scholar]
- Yan, H.; Xiao, J.; Feng, B. Evaluation of industrial green technology innovation efficiency in the Yangtze River Economic Belt and analysis of its influencing factors. Stat. Decis. 2022, 38, 96–101. [Google Scholar]
- Shi, X.; Yu, Z.; Chen, Y. The impact of green technology innovation on China’s industrial green energy efficiency. Technol. Innov. Manag. 2024, 45, 635–647. [Google Scholar]
- Zhang, M.; Ma, X. Research on the mechanism and synergistic effect of green digital infrastructure empowering the construction of a modern industrial system—Dual perspectives of supply side and demand side. Sci. Technol. Prog. Policy 2026, 43, 87–99. [Google Scholar] [CrossRef]
- Gu, R.; Hu, Y.; Yang, Y.; Wang, P.; Yuan, B.; Cui, J. The impact and spatial effect of digital infrastructure on green total factor energy efficiency. Geogr. Geo-Inf. Sci. 2026, 42, 84–93. [Google Scholar]
- Zhang, Y.; Xu, C.; Shen, J.; You, S.; He, L. Impact and Mechanism of Digital Economy on the Spatial Correlation Network Structure of China’s Manufacturing Green Transition Efficiency. Environ. Sci. 2026, 1–26. [Google Scholar] [CrossRef]
- Chen, T.; Chen, G. The spatial effect of digital elements empowering industrial structure upgrading—A spatial econometric analysis based on the distance characteristics of digital new infrastructure. Front. Eng. Manag. 2026, 45, 59–65. [Google Scholar]
- Ling, S.; Gao, H.; Yuan, D. Catalytic role of the digital economy in fostering corporate green technology innovation: A mechanism for sustainability transformation in China. Econ. Anal. Policy 2024, 84, 278–292. [Google Scholar] [CrossRef] [Scilit]
- Li, S.; Xie, N. The impact of digital finance on firms’ digital Transformation: Mechanism analysis based on enterprise financing. Int. Rev. Econ. Financ. 2025, 101, 103254. [Google Scholar] [CrossRef] [Scilit]
- Ma, Y.; Mahmood, R.; Nassir, A.M.; Zhang, L. Digital Finance and Green Technology Innovation: A Dual-Layer Analysis of Financing and Governance Mechanisms in China. Sustainability 2025, 17, 8982. [Google Scholar] [CrossRef] [Scilit]
- Sheng, Q.; Li, W. Research on the impact of digital infrastructure construction on the diffusion of green technology innovation. Inq. Econ. Issues 2024, 138–151. Available online: https://kns.cnki.net/kcms2/article/abstract?v=Tadyhzi4uofMmv8wfLRBg0jXfLJqgG28DYXXvThp91zzmq82659e8VFB8HwlfnrbV92WzaJxe-JytRqDnZKOIracAZGtANykf7JMumcWi_HtpbKYHT5JjPIMCr7652Pymlz_NpSeZR0ZJMcH9pll4O3XU4UaybcTLtiwmYRyrimME8QJ3AxRBA==&uniplatform=NZKPT&language=CHS (accessed on 3 July 2026).
- Sun, B.; Xie, X.; Zhang, Z. How does the technology market affect green total factor productivity? A study from the perspective of OECD green growth strategy. Contemp. Econ. Manag. 2020, 42, 18–27. [Google Scholar]
- Yang, Z.; An, W. The “digital-real integration” of technology transactions: Digital technology trading networks and manufacturing total factor productivity. Foreign Econ. Manag. 2025, 47, 99–116. [Google Scholar]
- Fried, H.O.; Lovell, C.A.K.; Schmidt, S.S.; Yaisawarng, S. Accounting for environmental effects and statistical noise in data envelopment analysis. J. Product. Anal. 2002, 17, 157–174. [Google Scholar] [CrossRef] [Scilit]
- Jiang, T. Mediation effect and moderation effect in causal inference empirical research. China Ind. Econ. 2022, 100–120. [Google Scholar] [CrossRef]
- Xue, Y.; Shi, H.; Zhang, Y. Spatial-temporal evolution of industrial green innovation efficiency in the Yellow River Basin and its influencing factors. J. Shanxi Norm. Univ. (Nat. Sci. Ed.) 2025, 39, 52–60. [Google Scholar]
- Zhang, L.; Zhang, Y.; Liang, Y. Measurement and evaluation of green technology innovation efficiency of Chinese industrial enterprises—Analysis based on super-efficiency network SBM-Malmquist model. Technol. Econ. 2022, 41, 13–22. [Google Scholar]
- Lu, J. Technical progress bias and green innovation efficiency—From the perspective of spatial-temporal effect. Technoecon. Manag. Res. 2025, 137–144. Available online: https://jxjg.cbpt.cnki.net/portal/journal/portal/client/paper/a28044f79f9446af9a61ca1a60693a09 (accessed on 3 July 2026).
- Li, H.; Fan, D.; Zhang, S.; Ma, L. Classified measurement and promotion model of regional green technology innovation efficiency in China—Based on SBM-SupSBM model with undesirable outputs. Oper. Res. Manag. Sci. 2022, 31, 184–189. [Google Scholar]
- Zhu, J. Research on the impact of digital economy on the efficiency of regional green technology innovation. China Bus. Mark. 2025, 34, 36–40. [Google Scholar]
- Ma, X. Digital trade and industrial green technology innovation efficiency—Taking strategic emerging industries as an example. Technoecon. Manag. Res. 2025, 152–158. Available online: https://jxjg.cbpt.cnki.net/portal/journal/portal/client/paper/95ae7567a6bcdf052e3d067c6ac132a0 (accessed on 3 July 2026).
- Gao, L. Research on industrial green technology innovation efficiency in the Yangtze River Economic Belt based on SBM-DEA model. Mod. Bus. 2022, 28–30. [Google Scholar] [CrossRef]
- Hu, Y.; Zhao, L.; Hao, B. Research on the impact of carbon emission trading on the green innovation efficiency of industrial enterprises—Evidence from Chinese listed companies. Sci. Technol. Prog. Policy 2025, 42, 127–137. [Google Scholar] [CrossRef]
- Yu, H.; Dong, H.; Bai, M. Research on the efficiency of industrial green technology innovation in Anhui Province based on super-efficiency SBM model. J. Xinjiang Norm. Univ. (Nat. Sci. Ed.) 2025, 44, 64–71. [Google Scholar]
- Zheng, W.; Zhang, Y. Can green fiscal policy improve urban green innovation efficiency?—Dual perspectives of innovative technology agglomeration and innovative talent agglomeration. Sci. Technol. Prog. Policy 2026, 43, 64–76. [Google Scholar] [CrossRef]
- Zhao, J. Can digital infrastructure promote digital agricultural science and technology innovation? Mod. Econ. Res. 2025, 103–116. [Google Scholar] [CrossRef]
- Sun, M.; Chen, N. The impact mechanism and spatial spillover of digital infrastructure construction on the quality of green technology innovation. China Econ. Trade Her. 2025, 55–57. [Google Scholar]
- Guo, F.; Wang, J.; Wang, F.; Kong, T.; Zhang, X.; Cheng, Z. Measuring China’s digital financial inclusion: Index compilation and spatial characteristics. China Econ. Q. 2020, 19, 1401–1418. [Google Scholar]
- Sun, H.; Gui, H.; Yang, D. Measurement and evaluation of high-quality economic development of China’s provinces. Zhejiang Soc. Sci. 2020, 4–14. [Google Scholar] [CrossRef]
- Liu, R. Digital inclusive finance, ESG performance and corporate green productivity. Technoecon. Manag. Res. 2025, 109–115. Available online: https://jxjg.cbpt.cnki.net/portal/journal/portal/client/paper/78eeefbffde73d6f05187f8600261a95 (accessed on 3 July 2026).
- Shen, X. Artificial intelligence technology innovation and agricultural green and low-carbon development—Based on the perspective of new quality productive forces and ecological product value realization. Technoecon. Manag. Res. 2025, 134–141. Available online: https://jxjg.cbpt.cnki.net/portal/journal/portal/client/paper/bb6f26639e6bcacc98d0d7b995f7117f (accessed on 3 July 2026).
- Cameron, A.C.; Gelbach, J.B.; Miller, D.L. Bootstrap-based improvements for inference with clustered errors. Rev. Econ. Stat. 2008, 90, 414–427. [Google Scholar] [CrossRef] [Scilit]
- Roodman, D.; Nielsen, M.Ø.; MacKinnon, J.G.; Webb, M.D. Fast and wild: Bootstrap inference in Stata using boottest. Stata J. 2019, 19, 4–60. [Google Scholar] [CrossRef] [Scilit]
- Yu, Z.; Li, M.; Zhuang, E.J. Bartik instrumental variable method in causal identification: Applications and diagnostics. J. Quant. Tech. Econ. 2025, 42, 200–220. [Google Scholar]
- Simar, L.; Wilson, P.W. Estimation and inference in two-stage, semi-parametric models of production processes. J. Econom. 2007, 136, 31–64. [Google Scholar] [CrossRef] [Scilit]



| Primary Indicator | Secondary Indicator | Variable Description, Unit & Data Sources | References |
|---|---|---|---|
| Innovation Inputs | R&D personnel | Full-time equivalent of R&D personnel in industrial enterprises above designated size (person-years). Source: China Statistical Yearbook on Science and Technology & Provincial Statistical Yearbooks. | Xue [40], Zhang et al. [41] |
| R&D expenditure | Total R&D expenditure of industrial enterprises above designated size (10,000 CNY). Source: China Statistical Yearbook on Science and Technology & Provincial Statistical Yearbooks. | Lu [42], Li et al. [43] | |
| Desirable Outputs | Technological output | Number of valid invention patents of industrial enterprises above designated size (patents). Source: China Statistical Yearbook on Science and Technology & Provincial Statistical Yearbooks. | Zhu [44], Ma [45] |
| Economic output | Sales revenue of new products of industrial enterprises above designated size (10,000 CNY). Source: China Statistical Yearbook on Science and Technology & Provincial Statistical Yearbooks. | Gao [46] | |
| Undesirable Output | Environmental cost | Industrial SO2 emissions (tons). Source: China Environmental Statistical Yearbook & Provincial Statistical Yearbooks. | Hu [47], Yu et al. [48], Zheng et al. [49] |
| Variable Category | Variable Name | Variable Form | Variable Definition/Data Sources |
|---|---|---|---|
| External Environmental Variables | Economic foundation () | Logarithm of per capita GDP | Regional economic development level. Source: China Statistical Yearbook & Provincial Statistical Yearbooks. |
| Opening degree () | FDI proportion (%) | Foreign capital penetration. Source: China Statistical Yearbook & CSMAR database. | |
| Government S&T support () | Government S&T expenditure/GDP | Local government S&T financial support. Source: Provincial Statistical Yearbooks. | |
| Industrial structure () | Proportion of secondary industry in GDP (%) | Regional industrial structure characteristics. Source: Provincial Statistical Yearbooks & CSMAR database. |
| Primary Indicator | Secondary Indicator | Indicator Definition | Data Sources | Weight |
|---|---|---|---|---|
| Digital Infrastructure Supply | Optical cable line density | Total length of optical cables/Total administrative land area (km/km2) | China Statistical Yearbook & China Communication Industry Statistical Yearbook | 0.060 |
| Per capita broadband access ports | Number of internet broadband access ports/Total population (ports per 10,000 persons) | China Statistical Yearbook & China Communication Industry Statistical Yearbook | 0.175 | |
| Share of ICT practitioners | Employees in information transmission, software and IT services/Total population (%) | China Statistical Yearbook on the Tertiary Industry | 0.158 | |
| Mobile base station density | Number of mobile communication base stations/Total administrative land area (stations per km2) | China Statistical Yearbook & China Communication Industry Statistical Yearbook | 0.236 | |
| Computers per 100 residents | Total computer quantity/Year-end permanent population (units per 100 persons) | China Statistical Yearbook | 0.062 | |
| Digital Infrastructure Utilization | Per capita telecommunication business volume | Total telecommunication business volume/Total population (CNY per person) | China Statistical Yearbook | 0.211 |
| Mobile phone penetration rate | Number of mobile subscribers/Total population (%) | China Statistical Yearbook | 0.040 | |
| Internet broadband penetration rate | Number of broadband internet users/Total population (%) | China Statistical Yearbook | 0.058 |
| Variable Name | Symbol | Definition & Data Sources |
|---|---|---|
| Economic Development Level | Natural logarithm of per capita GDP (CNY). Data source as described above. | |
| Higher Education Level | Ratio of students enrolled in higher education institutions to the total regional population (%). Source: China Statistical Yearbook & China Education Statistical Yearbook & CSMAR database. | |
| Foreign Direct Investment | Ratio of actual utilized FDI to regional GDP (%). Data source as described above. | |
| Entrepreneurial Vitality | Number of newly registered enterprises per 100 residents. Source: China Statistical Yearbook & Provincial Administration for Industry and Commerce registration data & CNRDS database. | |
| Government S&T Support | Proportion of local fiscal expenditure allocated to science and technology relative to regional GDP (%). Data source as described above. |
| Variables | Slack Variable of R&D Personnel Input | Slack Variable of R&D Capital Input |
|---|---|---|
| Constant | −393,657.57 *** | −13,303,319 *** |
| Economic foundation () | 30,397.68 *** | 1,160,798.5 *** |
| Opening degree () | 2212.00 *** | 44,746.645 *** |
| Government S&T support intensity () | −8174.72 *** | −1,228,069.1 *** |
| Industrial Structure () | 1319.98 *** | 18,207.276 *** |
| 3,614,590,000 *** | 3,039,763,700,000 *** | |
| 0.9676 *** | 0.9664 *** | |
| Log-likelihood | −3903.2997 | −5014.1147 |
| LR test | 86.27 *** | 87.04 *** |
| Region | 2012 | 2013 | 2014 | 2015 | 2016 | 2017 | 2018 | 2019 | 2020 | 2021 | 2022 |
|---|---|---|---|---|---|---|---|---|---|---|---|
| Jilin | 0.546 | 0.345 | 0.279 | 0.319 | 0.563 | 1.000 | 0.549 | 0.372 | 0.469 | 0.741 | 0.565 |
| Liaoning | 0.292 | 0.312 | 0.341 | 0.403 | 0.385 | 0.436 | 0.455 | 0.453 | 0.467 | 0.490 | 0.529 |
| Heilongjiang | 0.146 | 0.160 | 0.170 | 0.175 | 0.195 | 0.256 | 0.286 | 0.248 | 0.314 | 0.418 | 0.473 |
| Shanghai | 0.344 | 0.358 | 0.418 | 0.409 | 0.473 | 0.567 | 0.584 | 0.675 | 0.710 | 0.735 | 0.759 |
| Jiangsu | 0.369 | 0.373 | 0.439 | 0.457 | 0.548 | 0.571 | 0.601 | 0.575 | 0.740 | 0.755 | 1.000 |
| Zhejiang | 0.292 | 0.346 | 0.385 | 0.416 | 0.529 | 0.489 | 0.515 | 0.562 | 0.628 | 1.000 | 1.000 |
| Beijing | 0.354 | 0.377 | 0.380 | 0.427 | 0.518 | 0.585 | 0.690 | 1.000 | 0.888 | 1.000 | 1.000 |
| Tianjin | 0.481 | 1.000 | 0.430 | 0.488 | 0.528 | 0.775 | 0.762 | 0.612 | 0.657 | 0.798 | 1.000 |
| Shandong | 0.209 | 0.222 | 0.269 | 0.299 | 0.359 | 0.408 | 0.410 | 0.437 | 0.467 | 0.595 | 1.000 |
| Guangdong | 0.411 | 0.445 | 0.508 | 0.567 | 0.702 | 1.000 | 0.774 | 1.000 | 1.000 | 1.000 | 1.000 |
| Hebei | 0.176 | 0.181 | 0.189 | 0.237 | 0.309 | 0.326 | 0.373 | 0.367 | 0.396 | 0.480 | 0.434 |
| Hainan | 0.049 | 0.080 | 0.123 | 0.150 | 0.262 | 1.000 | 0.650 | 0.290 | 0.334 | 1.000 | 1.000 |
| Fujian | 0.227 | 0.244 | 0.264 | 0.304 | 0.360 | 0.381 | 0.387 | 0.402 | 0.401 | 0.366 | 0.369 |
| Anhui | 0.269 | 0.321 | 0.386 | 0.419 | 0.463 | 0.508 | 0.535 | 0.488 | 0.589 | 0.653 | 0.715 |
| Shanxi | 0.185 | 0.177 | 0.182 | 0.225 | 0.269 | 0.343 | 0.379 | 0.398 | 0.426 | 0.540 | 0.583 |
| Jiangxi | 0.145 | 0.190 | 0.235 | 0.268 | 0.328 | 0.366 | 0.324 | 0.315 | 0.362 | 0.476 | 1.000 |
| Henan | 0.124 | 0.131 | 0.140 | 0.187 | 0.257 | 0.271 | 0.297 | 0.285 | 0.308 | 0.325 | 0.356 |
| Hubei | 0.233 | 0.245 | 0.274 | 0.322 | 0.374 | 0.387 | 0.428 | 0.459 | 0.479 | 0.607 | 0.674 |
| Hunan | 0.282 | 0.307 | 0.353 | 0.387 | 0.406 | 0.419 | 0.406 | 0.412 | 0.391 | 0.485 | 0.522 |
| Yunnan | 0.115 | 0.142 | 0.175 | 0.203 | 0.236 | 0.263 | 0.272 | 0.320 | 0.345 | 0.349 | 0.416 |
| Inner Mongolia | 1.000 | 0.412 | 0.384 | 0.353 | 0.389 | 0.397 | 0.473 | 0.492 | 0.479 | 1.000 | 1.000 |
| Sichuan | 0.292 | 0.331 | 0.396 | 0.385 | 0.408 | 0.437 | 0.414 | 0.437 | 0.439 | 0.461 | 0.456 |
| Ningxia | 0.074 | 0.105 | 0.149 | 0.152 | 0.192 | 0.233 | 0.250 | 0.229 | 0.266 | 0.395 | 0.898 |
| Guangxi | 0.130 | 0.156 | 0.201 | 0.305 | 0.431 | 0.393 | 0.419 | 0.382 | 0.425 | 0.540 | 0.458 |
| Xinjiang | 0.067 | 0.100 | 0.152 | 0.170 | 0.188 | 0.241 | 0.325 | 0.396 | 0.484 | 0.539 | 0.653 |
| Gansu | 0.079 | 0.093 | 0.107 | 0.110 | 0.113 | 0.137 | 0.145 | 0.202 | 0.227 | 0.298 | 0.356 |
| Guizhou | 0.080 | 0.111 | 0.151 | 0.161 | 0.219 | 0.242 | 0.251 | 0.267 | 0.264 | 0.323 | 0.363 |
| Chongqing | 0.296 | 0.320 | 0.333 | 0.304 | 0.351 | 0.397 | 0.422 | 0.420 | 0.436 | 0.438 | 0.440 |
| Shaanxi | 0.286 | 0.302 | 0.306 | 0.287 | 0.354 | 0.441 | 0.514 | 0.511 | 0.489 | 0.539 | 0.521 |
| Qinghai | 0.063 | 1.000 | 0.040 | 0.053 | 0.083 | 0.097 | 0.157 | 0.202 | 0.298 | 0.368 | 1.000 |
| Northeast | 0.328 | 0.272 | 0.263 | 0.299 | 0.381 | 0.564 | 0.430 | 0.357 | 0.417 | 0.550 | 0.522 |
| Eastern | 0.291 | 0.363 | 0.341 | 0.375 | 0.459 | 0.610 | 0.575 | 0.592 | 0.622 | 0.773 | 0.856 |
| Central | 0.206 | 0.229 | 0.262 | 0.301 | 0.350 | 0.382 | 0.395 | 0.393 | 0.426 | 0.515 | 0.642 |
| Western | 0.226 | 0.279 | 0.218 | 0.226 | 0.269 | 0.298 | 0.331 | 0.351 | 0.378 | 0.477 | 0.596 |
| National | 0.254 | 0.296 | 0.272 | 0.298 | 0.360 | 0.446 | 0.435 | 0.440 | 0.473 | 0.591 | 0.685 |
| Region | Stage-I | Stage-III |
|---|---|---|
| Northeast China | 0.347 | 0.399 |
| Jilin | 0.533 | 0.523 |
| Liaoning | 0.277 | 0.415 |
| Heilongjiang | 0.232 | 0.258 |
| Eastern China | 0.487 | 0.532 |
| Shanghai | 0.457 | 0.548 |
| Jiangsu | 0.560 | 0.584 |
| Zhejiang | 0.534 | 0.560 |
| Beijing | 0.634 | 0.656 |
| Tianjin | 0.343 | 0.685 |
| Shandong | 0.390 | 0.425 |
| Guangdong | 0.745 | 0.764 |
| Hebei | 0.241 | 0.315 |
| Hainan | 0.767 | 0.449 |
| Fujian | 0.196 | 0.337 |
| Central China | 0.307 | 0.373 |
| Anhui | 0.439 | 0.486 |
| Shanxi | 0.242 | 0.337 |
| Jiangxi | 0.321 | 0.365 |
| Henan | 0.183 | 0.244 |
| Hubei | 0.332 | 0.407 |
| Hunan | 0.327 | 0.397 |
| Western China | 0.298 | 0.332 |
| Yunnan | 0.232 | 0.258 |
| Inner Mongolia | 0.193 | 0.580 |
| Sichuan | 0.284 | 0.405 |
| Ningxia | 0.295 | 0.268 |
| Guangxi | 0.356 | 0.349 |
| Xinjiang | 0.324 | 0.302 |
| Gansu | 0.259 | 0.170 |
| Guizhou | 0.253 | 0.221 |
| Chongqing | 0.276 | 0.378 |
| Shaanxi | 0.218 | 0.414 |
| Qinghai | 0.588 | 0.305 |
| Whole Nation | 0.368 | 0.413 |
| Variable | N | Mean | Std. Dev. | Min | Max |
|---|---|---|---|---|---|
| IGIE | 330 | 0.413 | 0.229 | 0.040 | 1.000 |
| DIG | 330 | 0.174 | 0.131 | 0.014 | 0.756 |
| gdp | 330 | 10.946 | 0.437 | 9.889 | 12.156 |
| edu | 330 | 0.156 | 0.078 | 0.058 | 0.505 |
| fdi | 330 | 1.833 | 1.738 | 0.002 | 12.099 |
| firms | 330 | 1.493 | 0.891 | 0.321 | 5.665 |
| gov | 330 | 0.473 | 0.271 | 0.151 | 1.405 |
| DIF | 330 | 262.394 | 92.242 | 61.470 | 460.691 |
| TECH | 330 | 0.019 | 0.031 | 0.0002 | 0.191 |
| Variable | IGIE | DIG | gdp | edu | fdi | firms | gov | DIF | TECH |
|---|---|---|---|---|---|---|---|---|---|
| IGIE | 1.000 | ||||||||
| DIG | 0.564 * | 1.000 | |||||||
| gdp | 0.701 * | 0.782 * | 1.000 | ||||||
| edu | 0.541 * | 0.767 * | 0.766 * | 1.000 | |||||
| fdi | 0.146 * | 0.104 * | 0.297 * | 0.254 * | 1.000 | ||||
| firms | 0.357 * | 0.390 * | 0.441 * | 0.284 * | −0.163 * | 1.000 | |||
| gov | 0.379 * | 0.633 * | 0.538 * | 0.631 * | 0.326 * | 0.197 * | 1.000 | ||
| DIF | 0.630 * | 0.734 * | 0.667 * | 0.514 * | −0.138 * | 0.521 * | 0.346 * | 1.000 | |
| TECH | 0.387 * | 0.602 * | 0.526 * | 0.827 * | 0.151 * | 0.195 * | 0.574 * | 0.362 * | 1.000 |
| Variable | VIF | 1/VIF |
|---|---|---|
| edu | 6.63 | 0.151 |
| DIG | 4.79 | 0.209 |
| gdp | 4.55 | 0.220 |
| TECH | 3.59 | 0.278 |
| DIF | 3.07 | 0.325 |
| gov | 2.09 | 0.478 |
| fdi | 1.60 | 0.624 |
| firms | 1.50 | 0.668 |
| Mean VIF | 3.48 | |
| Year | IGIE | DIG | ||||
|---|---|---|---|---|---|---|
| -Value | -Value | |||||
| 2012 | 0.013 | 0.754 | 0.451 | 0.095 | 2.045 | 0.041 |
| 2013 | −0.041 | −0.103 | 0.918 | 0.081 | 1.815 | 0.070 |
| 2014 | 0.043 | 1.055 | 0.291 | 0.085 | 1.872 | 0.061 |
| 2015 | 0.067 | 1.402 | 0.161 | 0.097 | 2.031 | 0.042 |
| 2016 | 0.065 | 1.378 | 0.168 | 0.103 | 2.111 | 0.035 |
| 2017 | −0.002 | 0.461 | 0.645 | 0.095 | 1.989 | 0.047 |
| 2018 | 0.094 | 1.786 | 0.074 | 0.083 | 1.788 | 0.074 |
| 2019 | 0.070 | 1.537 | 0.124 | 0.090 | 1.909 | 0.056 |
| 2020 | 0.093 | 1.831 | 0.067 | 0.086 | 1.857 | 0.063 |
| 2021 | 0.063 | 1.343 | 0.179 | 0.105 | 2.212 | 0.027 |
| 2022 | −0.046 | −0.153 | 0.879 | 0.104 | 2.214 | 0.027 |
| Variable | IGIE | ||
|---|---|---|---|
| (1) | (2) | (3) | |
| DIG | 0.766 *** | 0.714 *** | 0.686 *** |
| (0.176) | (0.175) | (0.142) | |
| gdp | 0.141 | ||
| (0.121) | |||
| edu | 0.464 | 0.437 | |
| (0.499) | (0.534) | ||
| fdi | 0.005 | ||
| (0.008) | |||
| firms | −0.008 | −0.008 | |
| (0.019) | (0.018) | ||
| gov | −0.003 | ||
| (0.083) | |||
| Constant | 0.208 *** | 0.163 *** | −1.343 |
| (0.010) | (0.052) | (1.237) | |
| Province fixed effects | Yes | Yes | Yes |
| Year fixed effects | Yes | Yes | Yes |
| Observations | 330 | 330 | 330 |
| 0.549 | 0.550 | 0.558 | |
| (1) Replace | (2) Exclude | (3) Panel | (4) Wild | (5) Exclude | |
|---|---|---|---|---|---|
| Variable | Indep. Var | Samples | Tobit | Bootstrap | Frontier |
| DIG | 1.395 * | 0.504 ** | 0.686 * | 0.563 *** | |
| (0.669) | (0.242) | [0.044, 1.711] | (0.106) | ||
| 0.061 *** | |||||
| (0.018) | |||||
| Control Variables | Yes | Yes | Yes | Yes | Yes |
| Province fixed effects | Yes | Yes | No (RE) | Yes | Yes |
| Year fixed effects | Yes | Yes | Yes | Yes | Yes |
| Observations | 330 | 286 | 330 | 330 | 306 |
| 0.556 | 0.553 | – | 0.530 | 0.775 |
| Variables | First Stage (DIG) | Second Stage (IGIE) |
|---|---|---|
| DIG | * | |
| bartik_iv | 0.163 *** | |
| gdp | 0.067 ** | |
| edu | ||
| fdi | ||
| firms | ||
| gov | ||
| c.gdp_2012#c.time_trend | ** | |
| Province Fixed Effects | Yes | Yes |
| Year Fixed Effects | Yes | Yes |
| Observations | 330 | 330 |
| Number of Clusters | 30 | 30 |
| Kleibergen–Paap rk Wald F | ||
| Stock–Yogo 10% Critical Value | ||
| Anderson–Rubin Wald test (F) | 5.85 ** | |
| Variables | Mechanism 1 | Mechanism 2 |
|---|---|---|
| DIF (1) | TECH (2) | |
| DIG | *** | ** |
| gdp | *** | −0.012 ** |
| edu | −0.245 | |
| fdi | −0.140 | −0.002 ** |
| firms | *** | |
| gov | *** | * |
| Province Fixed Effects | Yes | Yes |
| Year Fixed Effects | Yes | Yes |
| Observations | 330 | 330 |
Disclaimer/Publisher’s Note: The statements, opinions and data contained in all publications are solely those of the individual author(s) and contributor(s) and not of MDPI and/or the editor(s). MDPI and/or the editor(s) disclaim responsibility for any injury to people or property resulting from any ideas, methods, instructions or products referred to in the content. |
© 2026 by the authors. Licensee MDPI, Basel, Switzerland. This article is an open access article distributed under the terms and conditions of the Creative Commons Attribution (CC BY) license.
Share and Cite
Du, X.; Zhou, Z. Digital Infrastructure and Industrial Green Innovation in China: An Empirical Study on Efficiency Measurement and Impact Assessment. Sustainability 2026, 18, 8501. https://doi.org/10.3390/su18168501
Du X, Zhou Z. Digital Infrastructure and Industrial Green Innovation in China: An Empirical Study on Efficiency Measurement and Impact Assessment. Sustainability. 2026; 18(16):8501. https://doi.org/10.3390/su18168501
Chicago/Turabian StyleDu, Xuemei, and Zhuwentian Zhou. 2026. "Digital Infrastructure and Industrial Green Innovation in China: An Empirical Study on Efficiency Measurement and Impact Assessment" Sustainability 18, no. 16: 8501. https://doi.org/10.3390/su18168501
APA StyleDu, X., & Zhou, Z. (2026). Digital Infrastructure and Industrial Green Innovation in China: An Empirical Study on Efficiency Measurement and Impact Assessment. Sustainability, 18(16), 8501. https://doi.org/10.3390/su18168501