Article

Sustainable Carbon Dioxide Valorization Through Catalytic and Non-Catalytic Routes: A DFT Study

by
Joaquín Alejandro Hernández Fernández
1,2,3,*,
Juan Lopez-Martinez
4 and
Jose Alfonso Prieto Palomo
1,*
1
Chemistry Program, Department of Natural and Exact Sciences, San Pablo Campus, Universidad de Cartagena, Cartagena 130015, Colombia
2
Department of Natural and Exact Science, Universidad de la Costa, Barranquilla 080002, Colombia
3
Grupo de Investigación GIA, Fundacion Universitaria Tecnologico Comfenalco, Cr 44 D N 30A, 91, Cartagena 30015, Colombia
4
Institute of Materials Technology (ITM), Universitat Politecnica de Valencia (UPV), Plaza Ferrandiz and Carbonell s/n, 03801 Alcoy, Spain
*
Authors to whom correspondence should be addressed.
Sustainability 2026, 18(16), 8483; https://doi.org/10.3390/su18168483
Submission received: 15 June 2026 / Revised: 3 July 2026 / Accepted: 24 July 2026 / Published: 19 August 2026

Abstract

This study presents a comprehensive thermodynamic evaluation of several CO2 conversion pathways, both non-catalytic and catalyst-assisted, using density functional theory (DFT) calculations in Gaussian 16 (B3LYP/6-311++G(d,p)). In the non-catalyzed section, three key routes are examined: hydrogenation (CO2 + H2 → CO + H2O), dry methane reforming, and the reverse water–gas shift (RWGS). For the hydrogenation reaction, the Gibbs free energy change (ΔG) decreases from +0.018 to +0.005 Hartree as the temperature increases from 298.15 K to 1173.15 K, indicating a slight improvement in feasibility but still a high activation barrier of 0.326 Hartree, underscoring the need for catalysis. Dry methane reforming is both exothermic and spontaneous, with ΔG ≈ = −0.049 Hartree at 298.15 K and −0.030 Hartree at 593.15 K; however, operating under harsh conditions may accelerate degradation of reactor materials. In the catalyst-assisted section, copper surfaces and Cu3M clusters (M = Sc, V, Ni, Cu, Co and Fe) are evaluated alongside two bimetallic catalysts, Fe2 and Ni2, under electrochemical CO2 reduction (eCO2RR) conditions. Scandium- and vanadium-doped clusters exhibit significant CO2 adsorption, as evidenced by shifted vibrational frequencies between 800 and 1800 cm−1 that signal C=O bond weakening. Under the evaluated thermobarometric conditions, Ni2-containing systems displayed lower Gibbs energy values within their own optimized intermediate set and higher entropy values than the corresponding Fe2-containing set, suggesting greater configurational flexibility and favorable stabilization trends. However, because Fe2 and Ni2 systems are chemically different, absolute total energies were not used as a standalone criterion for intrinsic catalytic superiority. Overall, while some non-catalytic routes become thermodynamically more favorable only at high temperature, the explicit inclusion of catalytic models, particularly doped Cu3M clusters and Ni-containing systems, indicates enhanced CO2 activation through stronger catalyst–adsorbate interactions, vibrational weakening of C=O bonds, and favorable electronic descriptors. These results suggest that catalytic systems may enable CO2 conversion under milder conditions, although full kinetic confirmation requires comparative transition state calculations for each elementary catalytic step.

1. Introduction

In recent years, carbon dioxide (CO2) conversion has emerged as a central strategy for mitigating greenhouse gas emissions while enabling the production of sustainable fuels and value-added chemicals [1,2,3]. Because CO2 is thermodynamically stable and contains strong C=O bonds, with a bond dissociation energy close to 750 kJ mol−1, its direct transformation into reduced carbon products is energetically demanding [4,5]. This intrinsic stability makes CO2 activation one of the main challenges in carbon capture and utilization technologies. Therefore, efficient catalytic systems and controlled reaction conditions are required to promote CO2 conversion toward products such as carbon monoxide (CO), methane (CH4), methanol (CH3OH), formic acid, ethylene (C2H4), synthesis gas, and other petrochemical intermediates [6].
CO2 valorization can be classified according to the activation mode involved in the conversion process. Thermocatalytic routes, such as reverse water–gas shift (RWGS), CO2 methanation, methanol synthesis, and dry methane reforming, are mainly governed by temperature, pressure, adsorption strength, and the ability of the catalytic surface to activate C=O, H–H, C–H, and O–H bonds [7,8,9,10,11]. These processes are particularly relevant for large-scale CO2 utilization because they can produce CO, syngas, methane, methanol, and other platform molecules for the chemical and petrochemical industries. In contrast, electrocatalytic CO2 reduction is controlled by the applied potential, proton–electron transfer steps, stabilization of key adsorbed intermediates, and competition with the hydrogen evolution reaction [12,13,14]. Photocatalytic CO2 reduction additionally depends on light absorption, charge separation, band-edge alignment, and interfacial charge transfer. Recent studies have highlighted the role of co-catalysts, metal complexes, semiconductor heterostructures, and surface defects in improving charge separation, CO2 activation, and product selectivity in photocatalytic CO2 reduction [15,16,17].
Among transition metal catalysts, copper-based systems have attracted particular attention because Cu surfaces are among the few catalytic platforms capable of promoting CO2 reduction beyond CO toward hydrocarbons and oxygenates. Copper can stabilize CO2-derived intermediates such as *COOH, *CO, *CHO, and other hydrogenated species with moderate binding strength, allowing further reduction steps that are less favorable on metals that bind CO either too weakly or too strongly. However, the selective formation of C1 and C2+ products remains challenging because it requires fine control of intermediate adsorption, proton–electron transfer, and, in some cases, C–C bond formation. Strategies such as alloying Cu with other metals, modifying Cu with oxide supports, or combining Cu-based catalysts with zeolites have been proposed to tune the electronic structure of the active sites and favor the formation of selected intermediates. In the case of Cu–zeolite or Cu–oxide/zeolite systems, these approaches are generally associated with thermocatalytic or bifunctional catalytic routes for CO2 hydrogenation and hydrocarbon formation.
Computational chemistry has become an essential tool for understanding the molecular mechanisms involved in CO2 activation and conversion. Density functional theory (DFT) calculations allow the evaluation of reaction thermodynamics, frontier molecular orbitals, vibrational signatures, transition states, and catalyst–adsorbate interactions before experimental synthesis or catalytic testing [8,9]. These calculations are particularly useful for comparing different CO2 conversion pathways under a consistent theoretical framework and for identifying the electronic factors that control catalyst activity and selectivity. In catalytic models, the catalyst is explicitly included in the quantum chemical system through optimized metal–adsorbate or metal–intermediate structures. Thus, the catalytic effect is evaluated from changes in geometry, vibrational frequencies, electronic structure, relative thermodynamic stability, and activation barriers when transition states are available.
Several individual CO2 conversion reactions, including RWGS, CO2 hydrogenation, methanol synthesis, dry methane reforming, methanation, and electrochemical CO2 reduction, have already been investigated experimentally and computationally. Therefore, the novelty of the present work does not rely on claiming that these reactions have not been thermodynamically evaluated before. Instead, this study provides a unified DFT-based thermodynamic and electronic comparison of selected non-catalytic and catalyst-assisted CO2 conversion routes using a consistent computational methodology. This approach allows direct evaluation of temperature effects, reaction spontaneity, kinetic limitations, catalyst-induced CO2 activation, and electronic descriptors of Cu3M, Fe2, and Ni2 catalytic models.
In this work, theoretical calculations were performed using Gaussian 16, Revision A.03 [10], within the framework of Kohn–Sham DFT [11]. Molecular structures were optimized using the B3LYP/6-311++G(d,p) level of theory [12,13], and frequency calculations were conducted to verify the nature of the stationary points and to obtain thermodynamic corrections. Non-catalytic CO2 conversion routes, including CO2 hydrogenation, dry methane reforming, direct CO2 capture and conversion, and syngas-related pathways, were evaluated through entropy (S), enthalpy (H), and Gibbs free energy (G) descriptors. In parallel, catalyst-assisted systems were analyzed using Cu3M clusters (M = Sc, V, Ni, Cu, Co, and Fe) and bimetallic Fe2 and Ni2 models associated with electrochemical CO2 reduction conditions. For these catalytic systems, the discussion focuses on thermodynamic trends, optimized structures, vibrational evidence of CO2 activation, and frontier orbital descriptors.
From a sustainability perspective, identifying thermodynamically viable and electronically favorable CO2 conversion routes is essential for the development of future carbon utilization technologies. The transformation of CO2 into CO, syngas, methane, methanol, and other value-added products can contribute to circular carbon management, greenhouse gas mitigation, and the transition toward low-carbon industrial processes. Accordingly, DFT-based screening provides valuable guidance for selecting promising reaction pathways and catalytic motifs before more demanding experimental or microkinetic studies are undertaken.

2. Materials and Methods

2.1. Computational Details

The electronic structure and reaction pathways of all stationary points were investigated using Gaussian 16 (Revision A. 03) within the framework of Kohn–Sham density functional theory (DFT). Geometries were fully optimized at the B3LYP/6-311++G(d,p) level, and harmonic vibrational analyses confirmed each minimum as having zero imaginary frequencies and each transition state exactly one. Intrinsic reaction coordinate (IRC) calculations then validated the connectivity between reactants, transition states, and products.
To obtain quantitatively reliable frontier orbital energies, we supplemented our B3LYP/6-311++G(d,p) calculations with single-point HOMO/LUMO evaluations using the long-range-corrected LC-BLYP functional and the cc-pVTZ basis set. LC-BLYP partitions the electron–electron interaction into short-range (DFT) and long-range (Hartree–Fock) components via an error function-based range parameter (μ), ensuring full 100% exact exchange in the asymptotic limit. This construction systematically reduces the delocalization error characteristic of global hybrids. It restores the physical decay of the exchange potential, thereby yielding orbital eigenvalues that more closely approximate vertical ionization potentials (-εHOMO) and electron affinities (-εLUMO) under Koopmans’ theorem. In practice, after geometry optimization and frequency analysis at B3LYP/6-311++G(d,p), we performed single-point LC-BLYP/cc-pVTZ calculations on each optimized structure. The cc-pVTZ basis set was chosen to balance basis set convergence (particularly for diffuse Rydberg-type LUMO orbitals) with computational tractability. Orbital energies were extracted directly from the Kohn–Sham eigenvalue spectrum: εHOMO and εLUMO. We verified that these values differ by less than 0.05 eV when recomputed with Grimme’s D3(BJ) dispersion correction, confirming that dispersion has a negligible effect on gas-phase frontier orbital gaps for the metal–ligand systems studied.
Thermodynamic parameters were extracted from the same frequency outputs using the rigid-rotor/harmonic-oscillator (RRHO) approximation. The electronic energy change (ΔE) equals the difference in the “Sum of electronic and zero-point energies” between the products and the reactants. The enthalpy change (ΔH) incorporates thermal translational, rotational, vibrational, and PV (RT) corrections, as reported in the “Sum of electronic and thermal enthalpies.” Entropic contributions (ΔS) were derived directly from the computed molecular partition functions, and Gibbs free energy changes (ΔG) were determined both from the “Sum of electronic and thermal free energies” and via ΔG = ΔH − TΔS, ensuring internal consistency. Thus, ΔE reflects purely electronic and ZPE effects, ΔH includes temperature-dependent enthalpic terms, and ΔG completes the thermodynamic description by accounting for entropy.
Six well-established, non-catalytic CO2 + H2 hydrogenation pathways, primarily yielding methanol and methane, which serve as precursors to dimethyl ether (DME) and light hydrocarbons, were evaluated over a broad temperature range (Table 1). Key parameters (S, H, and G) were tabulated to assess thermodynamic feasibility. A semi-empirical method and DFT/6-311++G(d,p) were both benchmarked against available experimental data; the latter demonstrated superior accuracy and consistency and was therefore adopted as the primary reference for all subsequent calculations and analyses.
The catalyst-assisted models included Cu3M clusters (M = Sc, V, Ni, Cu, Co, and Fe) and bimetallic Fe2 and Ni2 systems associated with CO2 activation and electrochemical CO2 reduction conditions.

2.2. Explicit Modeling of Catalytic Effects

For the catalyst-assisted systems, the catalytic effect was explicitly accounted for by including the metallic cluster or bimetallic species in the quantum chemical model. Therefore, the influence of the catalyst was not introduced in Gaussian as an empirical correction, but through optimized catalyst–adsorbate and catalyst–intermediate structures. In this approach, the catalyst modifies the electronic structure, molecular geometry, vibrational response, and thermodynamic stability of the adsorbed CO2-derived species.
Accordingly, catalytic performance was discussed using the relative stability of optimized intermediates, Gibbs free energy trends, HOMO–LUMO descriptors, vibrational frequency shifts associated with C=O bond weakening, and the comparison between non-catalytic and catalyst-assisted energy profiles. The present work focuses primarily on thermodynamic and electronic descriptors of CO2 activation. Therefore, full microkinetic modeling, complete adsorption energy mapping for all intermediates, solvent/electrolyte effects, and applied potential corrections were not included. These aspects are identified as necessary extensions for future work.

3. Results and Discussion

3.1. Non-Catalytic Processes

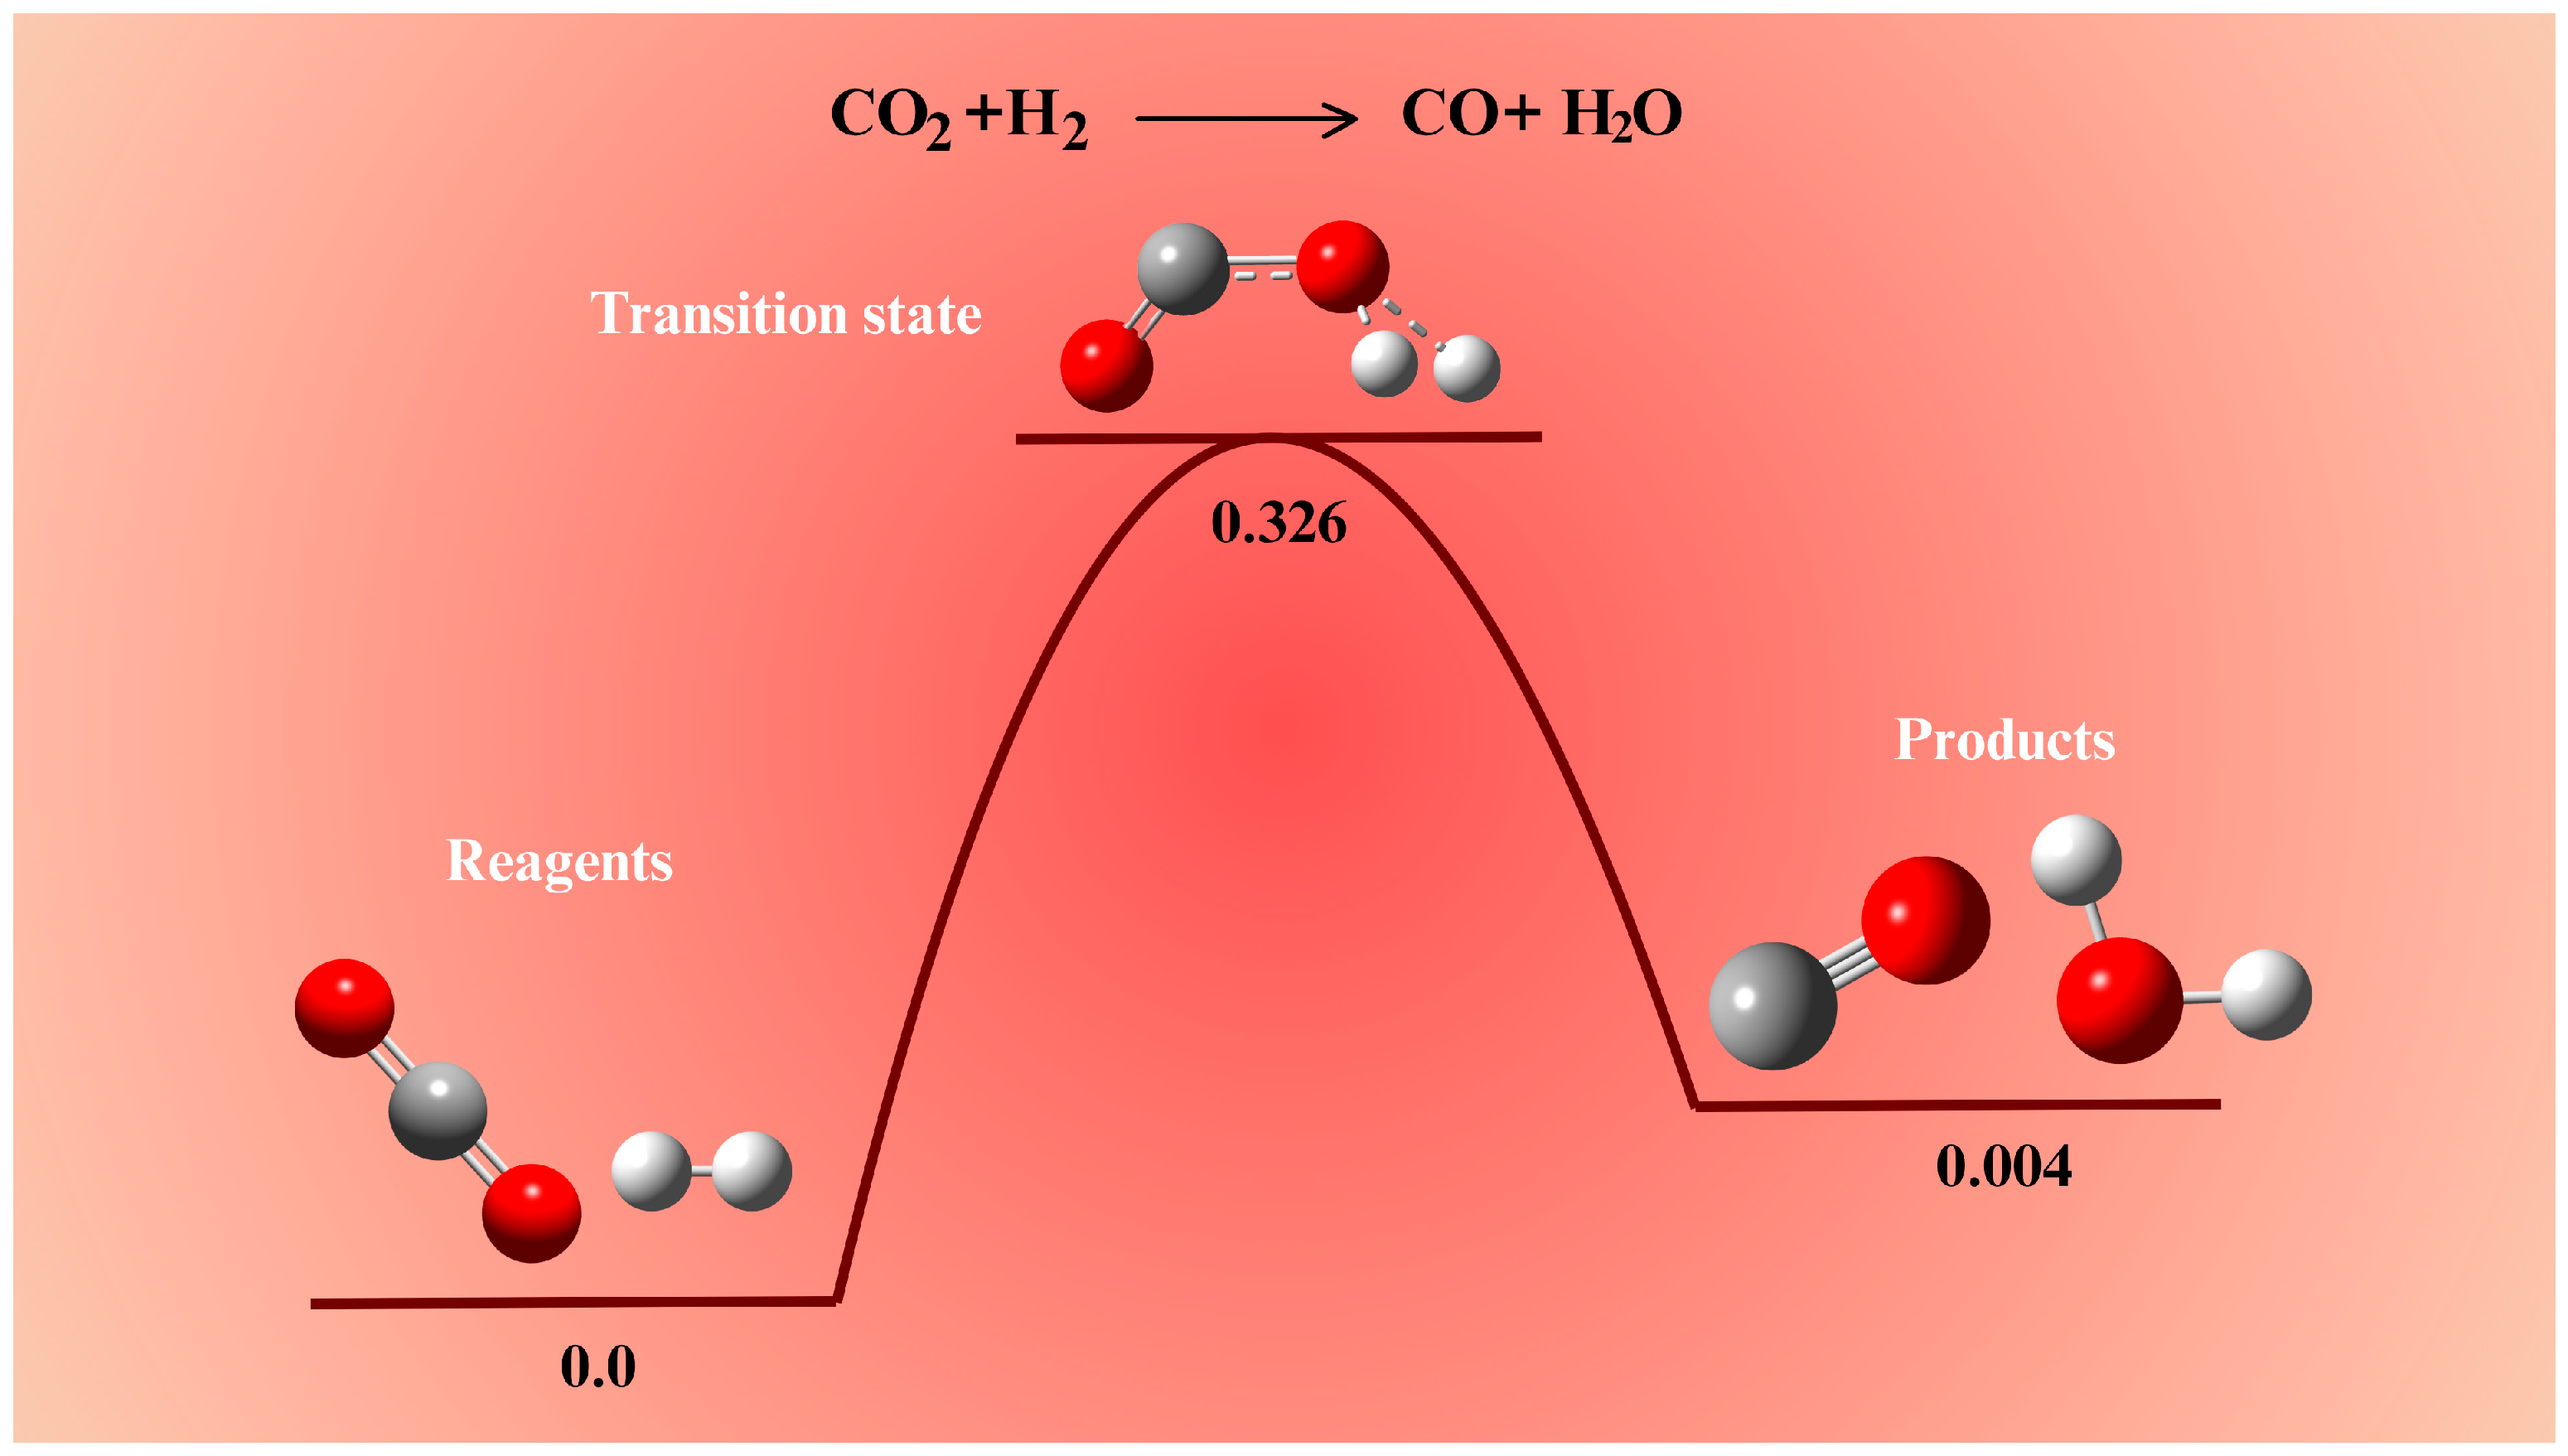
Figure 1 shows the energy profile for the non-catalyzed reaction CO2 + H2 → CO + H2O, calculated at 1173.15 K (B3LYP/6-311++G(d,p)). The curve displays a high activation barrier (E = 0.326 Hartree), reflecting the considerable energy required to cleave the C=O and H–H bonds of the reactants. After crossing the transition state, the products (CO and H2O) lie slightly above the reactants by ~0.004 Hartree (~10 kJ mol−1). This nearly thermoneutral, mildly endergonic character indicates that, even at an elevated temperature, the reaction remains unfavorable without assistance. The substantial kinetic barrier and the modest positive free energy difference together rationalize the need for an efficient catalyst to lower E and shift the equilibrium towards products.
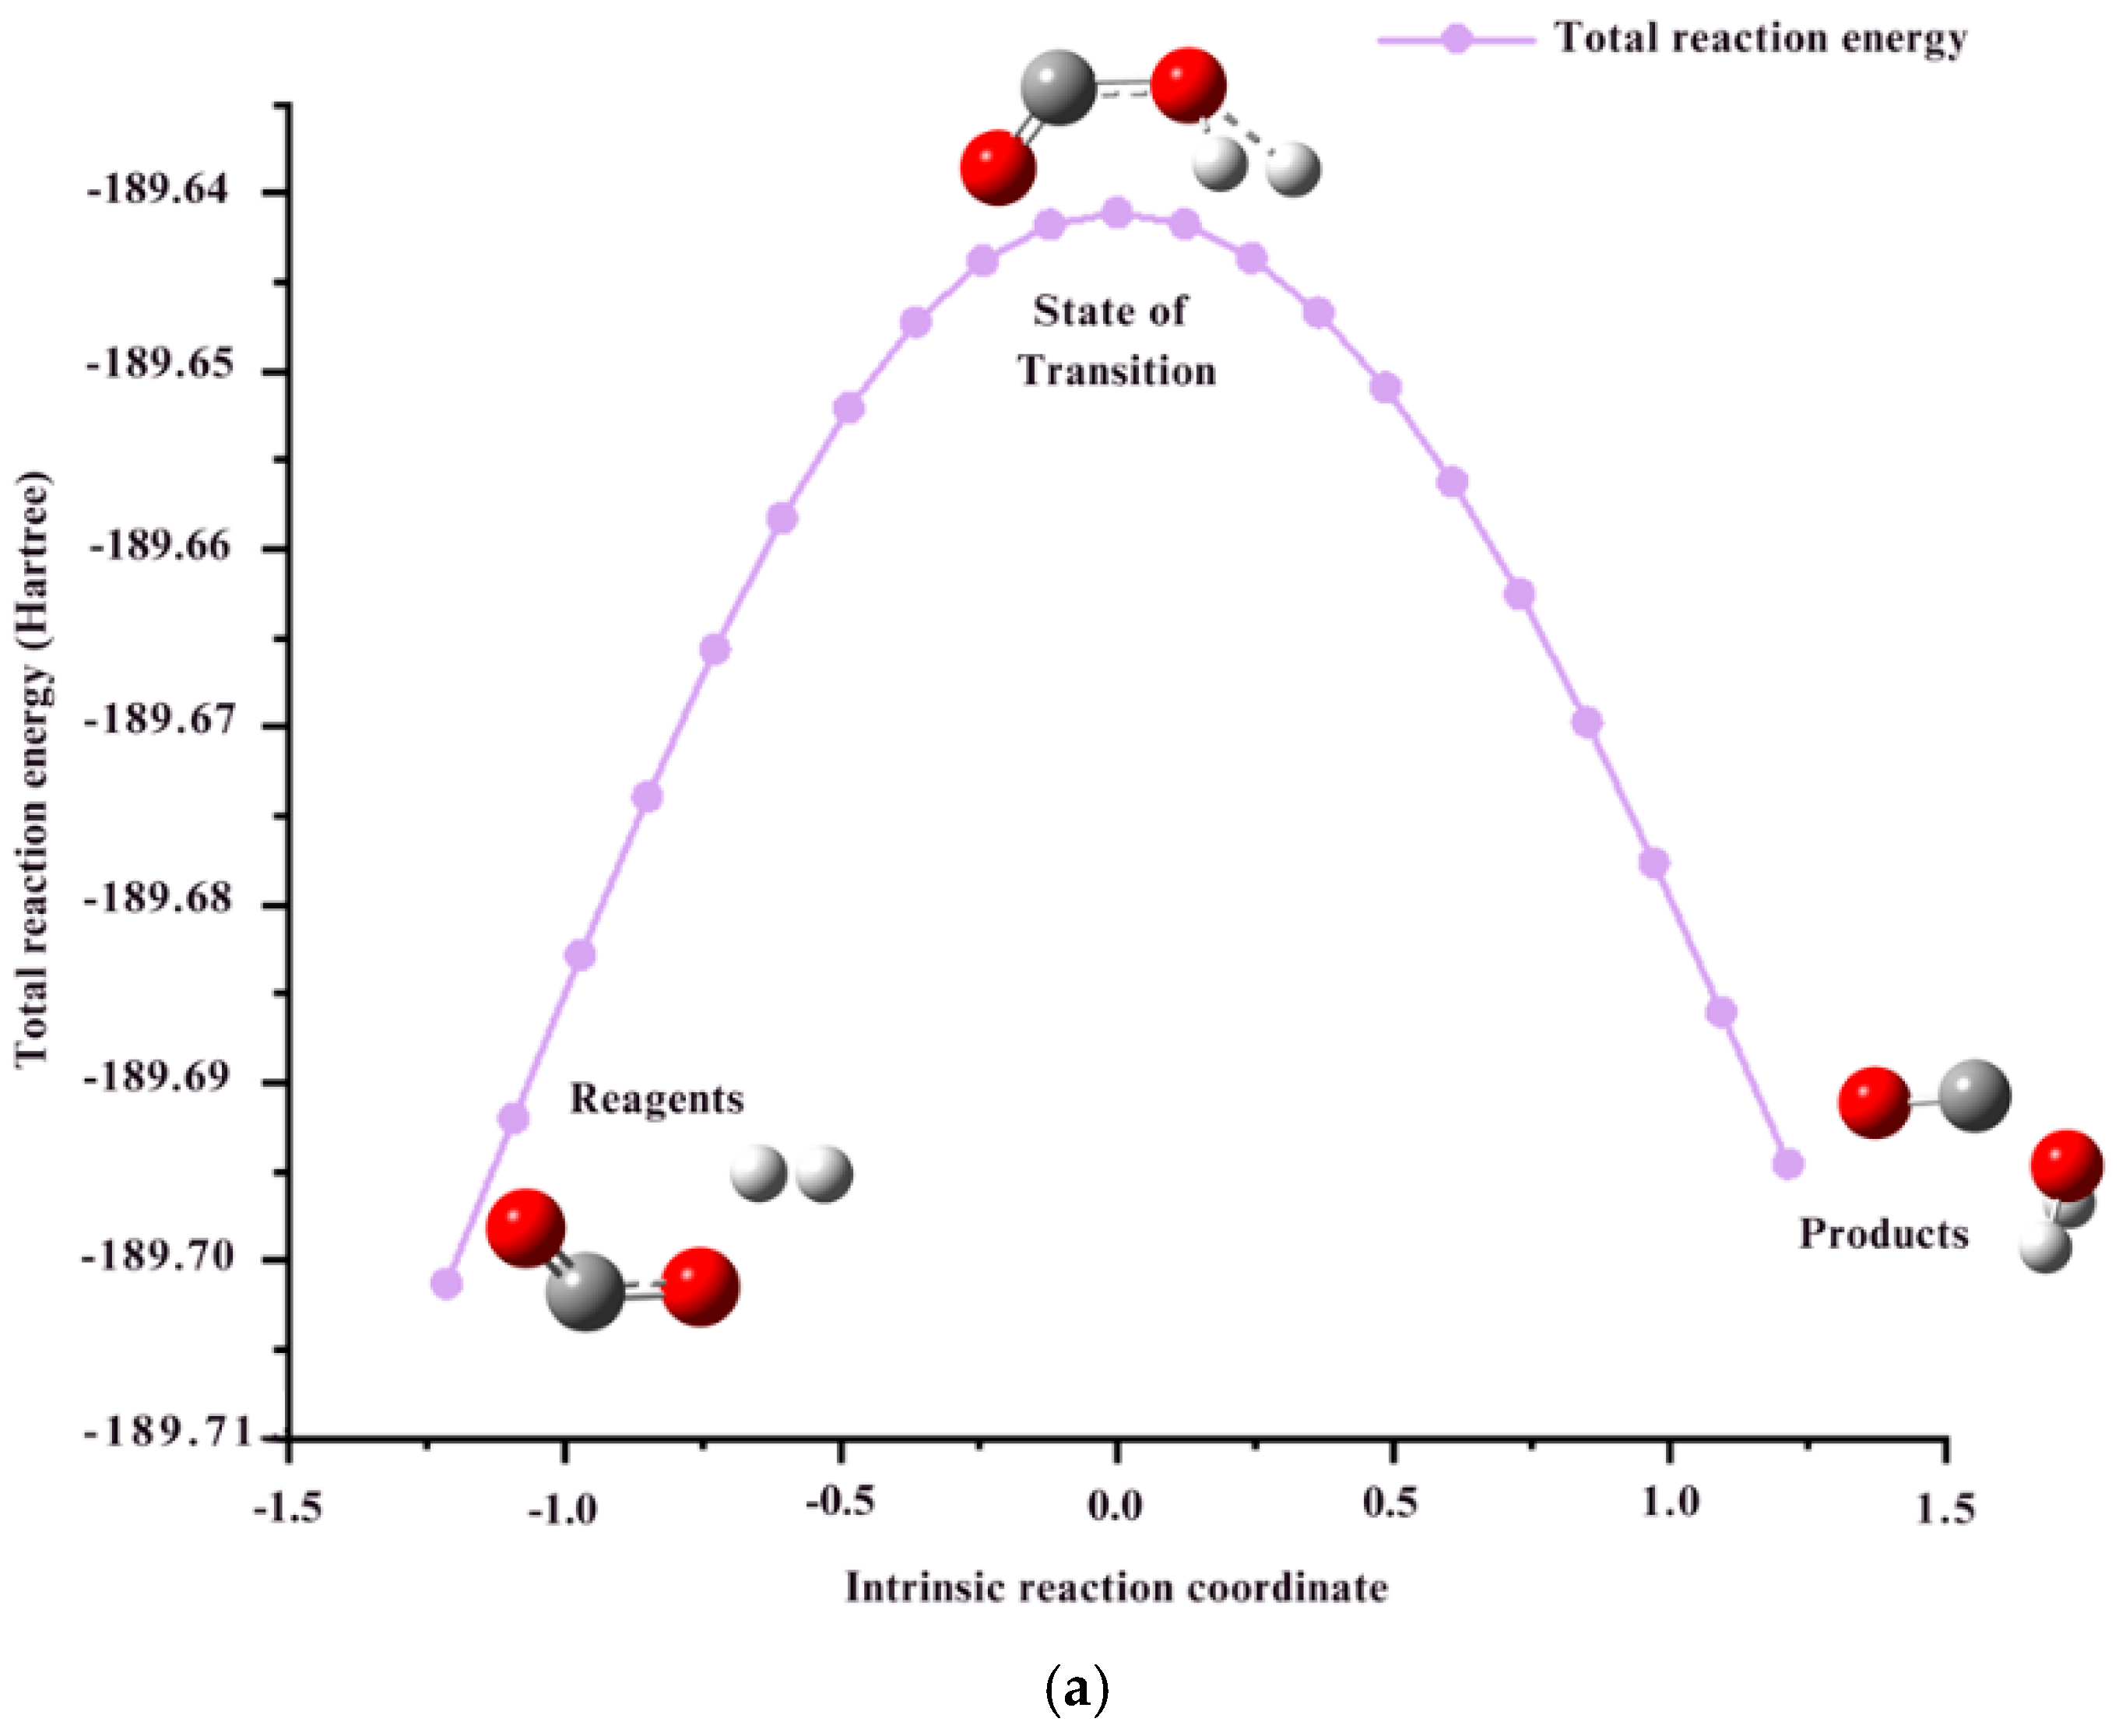
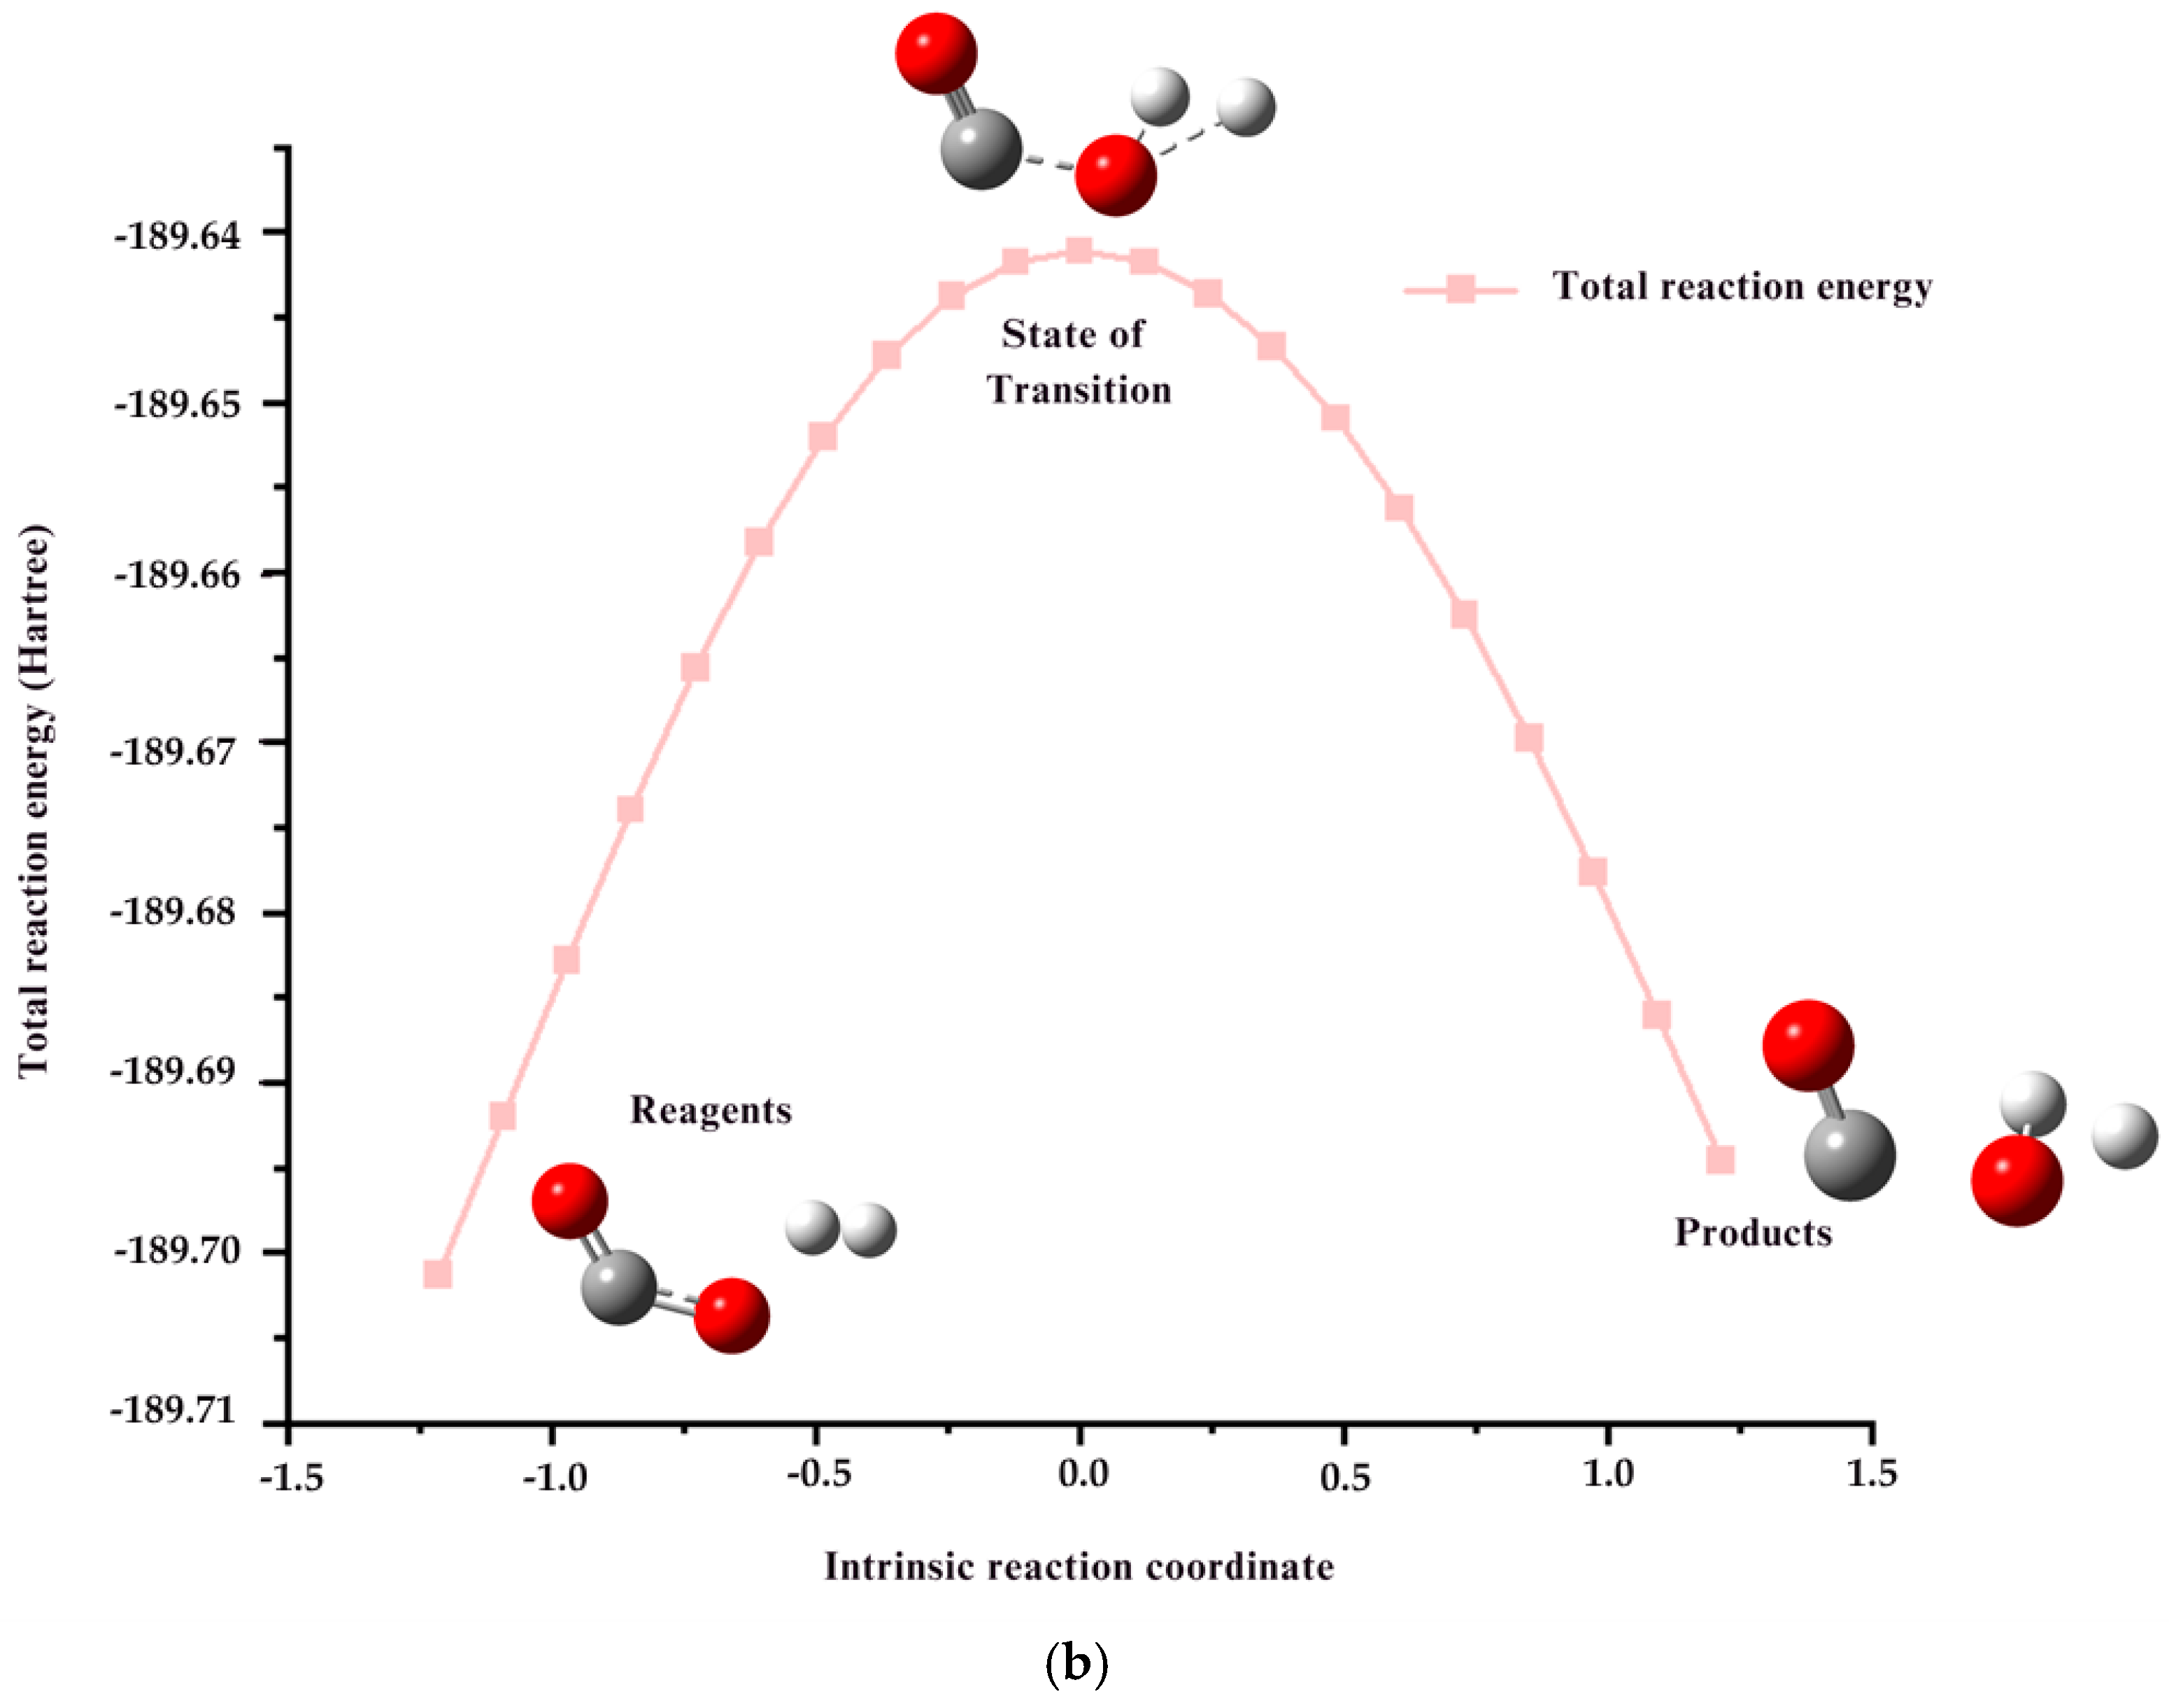
Figure 2 shows the intrinsic reaction coordinate (IRC). It shows two proposals for possible transition states in the reaction CO2 + H2 • CO + H2O. Both curves show the evolution of the system’s total energy along the reaction coordinate, with an initial minimum corresponding to the reactants, a maximum at the transition state, and a final minimum corresponding to the products. The smooth, continuous shapes of the curves confirm that both transition states are valid, as they naturally connect reactants to products. Comparing the two proposals, it is observed that in proposal a (Figure 2a), the energy barrier in the transition state is slightly lower than in proposal b (Figure 2b), indicating that the first configuration is more favorable from an energetic and kinetic point of view. At 298.15 K, ΔG = 0.018 and ΔH = 0.024 were obtained, indicating that the process is not spontaneous due to the low entropic contribution under these conditions, which limits its progress. At 473.15 K, the values decrease slightly (ΔG = 0.007), but the energy barrier is still high enough to hinder the reaction. Finally, at 1173.15 K, ΔG reaches 0.004, indicating that the response becomes more thermodynamically favorable due to increased entropy, which favors the equilibrium towards the products. However, the substantial activation barriers of the highly stable C=O bonds in CO2 and the H-H bonds in H2 imply that the reaction still requires extreme temperatures to overcome them. Therefore, although increasing the temperature improves thermodynamic conditions, the reaction is inefficient without a catalyst, which reduces the activation energy and facilitates bond breaking and formation, thereby optimizing the process.
Table 2 shows the impact of temperature on the energy changes for Route 1.
For the synthesis of methanol from carbon monoxide (CO) and hydrogen (H2), the thermodynamic data show a strong temperature dependence for its thermodynamic feasibility (see Table 2). At 298.15 K, the value of ΔG = −0.012 indicates that the process is slightly spontaneous, although kinetic barriers still limit its progress. At 473.15 K, ΔG becomes positive (0.004), indicating that the reaction is no longer spontaneous and requires an external energy input to proceed, due to the high stability of the C≡O bonds in CO and the H-H bonds in H2. At intermediate temperatures such as 573.15 K, the situation persists with ΔG = 0.01, confirming that the reaction remains non-spontaneous. Finally, at 1173.15 K, the Gibbs free energy reaches a negative value (−0.06), indicating that the process becomes spontaneous thanks to the increase in entropy, which favors the formation of the products. Consequently, the reaction ceases to be spontaneous at moderate temperatures because the generated molecular disorder is insufficient to counteract the increase in the entropic term as temperature rises. At 1173.15 K, the ΔG value becomes negative again (−0.06), indicating that the reaction is spontaneous. This occurs because, at very high temperatures, the entropic term TΔS becomes large enough to overcome the enthalpy contribution (ΔH). In Table 2, it is observed that for reaction 3 of Route 1, where CH3OH and H2O are formed, it is observed that it faces thermodynamic limitations both at 298.15 K and 573.15 K, since the ΔG values are positive (0.007 and 0.03, respectively), indicating that the reaction is not spontaneous under these conditions. The reverse water–gas reaction (RWGS) pathway 2 for producing CO and H2O is an endothermic process favored only at high temperatures (see Table 2). At 298.15 K, the ΔG = 0.018 and ΔH = 0.024 values indicate that the reaction is not spontaneous. At 973.15 K and 1173.15 K, the ΔG values decrease to 0.01 and 0.005, respectively, indicating greater feasibility, although the reaction still requires extreme conditions to proceed efficiently. For dry methane reforming processes, H2 and CO are formed. This process offers thermodynamic advantages because it is spontaneous over a wide temperature range, as shown in Table 2. The reaction is exothermic and spontaneous at all temperatures studied. At 533.15 K and ΔG = −0.05, the reaction proceeds favorably. At 298.15 K, although ΔH = −0.45 is more negative, the reaction is kinetically limited. At 593.15 K, ΔG remains negative but is less pronounced (−0.03). For pathway 3, called the direct air capture reaction, H2 and CO are formed at three temperatures: 298.15 K, 673.15 K, and 100.15 K. Table 2 shows that at 298.15 K, the values of ΔG = 0.067668 and ΔH = 0.477851 indicate that the reaction is not spontaneous and requires external energy to proceed. As the temperature increases to 673.15 K, there is a slight improvement, with ΔG = 0.051298 and ΔH = 0.10919, although the reaction is still not entirely spontaneous.
In contrast, at 100.15 K, the results are less favorable, with ΔG = 0.190443 and ΔH = 0.084623. For Route 4 or direct CO2 capture and conversion, CH4 and H2O are formed, and the process is exothermic and spontaneous at 298.15 K, 473.15 K, and 573.15 K. This means that as the temperature increases, the ΔG gradually decreases, suggesting that the reaction becomes increasingly favorable. For example, at 298.15 K, we observe that ΔG is −0.031 and ΔH is −0.430; the reaction is not only thermodynamically favorable but also releases significant energy. At 473.15 K, ΔG decreases slightly, reaching −0.027, while ΔH decreases to −0.056. This suggests that although the reaction is still favorable, the entropy contribution is significant and significantly limits its spontaneity. Therefore, it is essential to use a suitable catalyst to optimize the system’s efficiency and facilitate the reaction’s progress (Table 2). For Route 5 or syngas production, the reaction that uses CO2 and CH4 as reactants and produces CO and H2 is analyzed. This reaction was evaluated at three different temperatures: 973.15 K, 298.15 K, and 873.15 K. At the highest temperature, 973.15 K, the ΔG is slightly positive, with a value of 0.01. This, together with a positive ΔH of 0.11, indicates that the reaction is unfavorable. This is due to the energy required to break the C=O and C-H bonds in the reactants. When the temperature is lowered to 298.15 K, the situation becomes even less favorable, reaffirming that the reaction does not occur spontaneously at low temperatures.
Furthermore, the entropy contributions decrease compared to higher temperatures, with values of 51.057 for CO2 and 49.410 for CH4 (see Table 2). Additionally, the reaction of CO and H2O to form CO2 + H2 is analyzed at three temperatures: 473.15 K, 298.15 K, and 523.15 K. At 473.15 K, the reaction is thermodynamically favorable. Here, the value of ΔG is −0.024153, and ΔH is −0.021561, indicating that the reaction can occur spontaneously, albeit with a relatively small energy change (Table 2).
The dominant kinetic limitation in the non-catalytic CO2 + H2 → CO + H2O route is associated with the transition state connecting the reactants with the products. The calculated barrier of 0.326 Hartree, equivalent to approximately 856 kJ mol−1 or 8.87 eV, confirms that the direct transformation is kinetically prohibitive without catalytic assistance, even though increasing temperature partially improves the thermodynamic feasibility of the process.

3.2. Catalytic Processes

The catalytic section analyzes Cu3M clusters (M = Sc, V, Ni, Cu, Co, and Fe) as molecular models for CO2 activation and for Fe2/Ni2 bimetallic systems under electrochemical CO2 reduction conditions. The discussion focuses on optimized geometries, vibrational signatures, frontier orbital descriptors, and thermodynamic trends.

3.2.1. CO2 Interaction with Cu3M Clusters

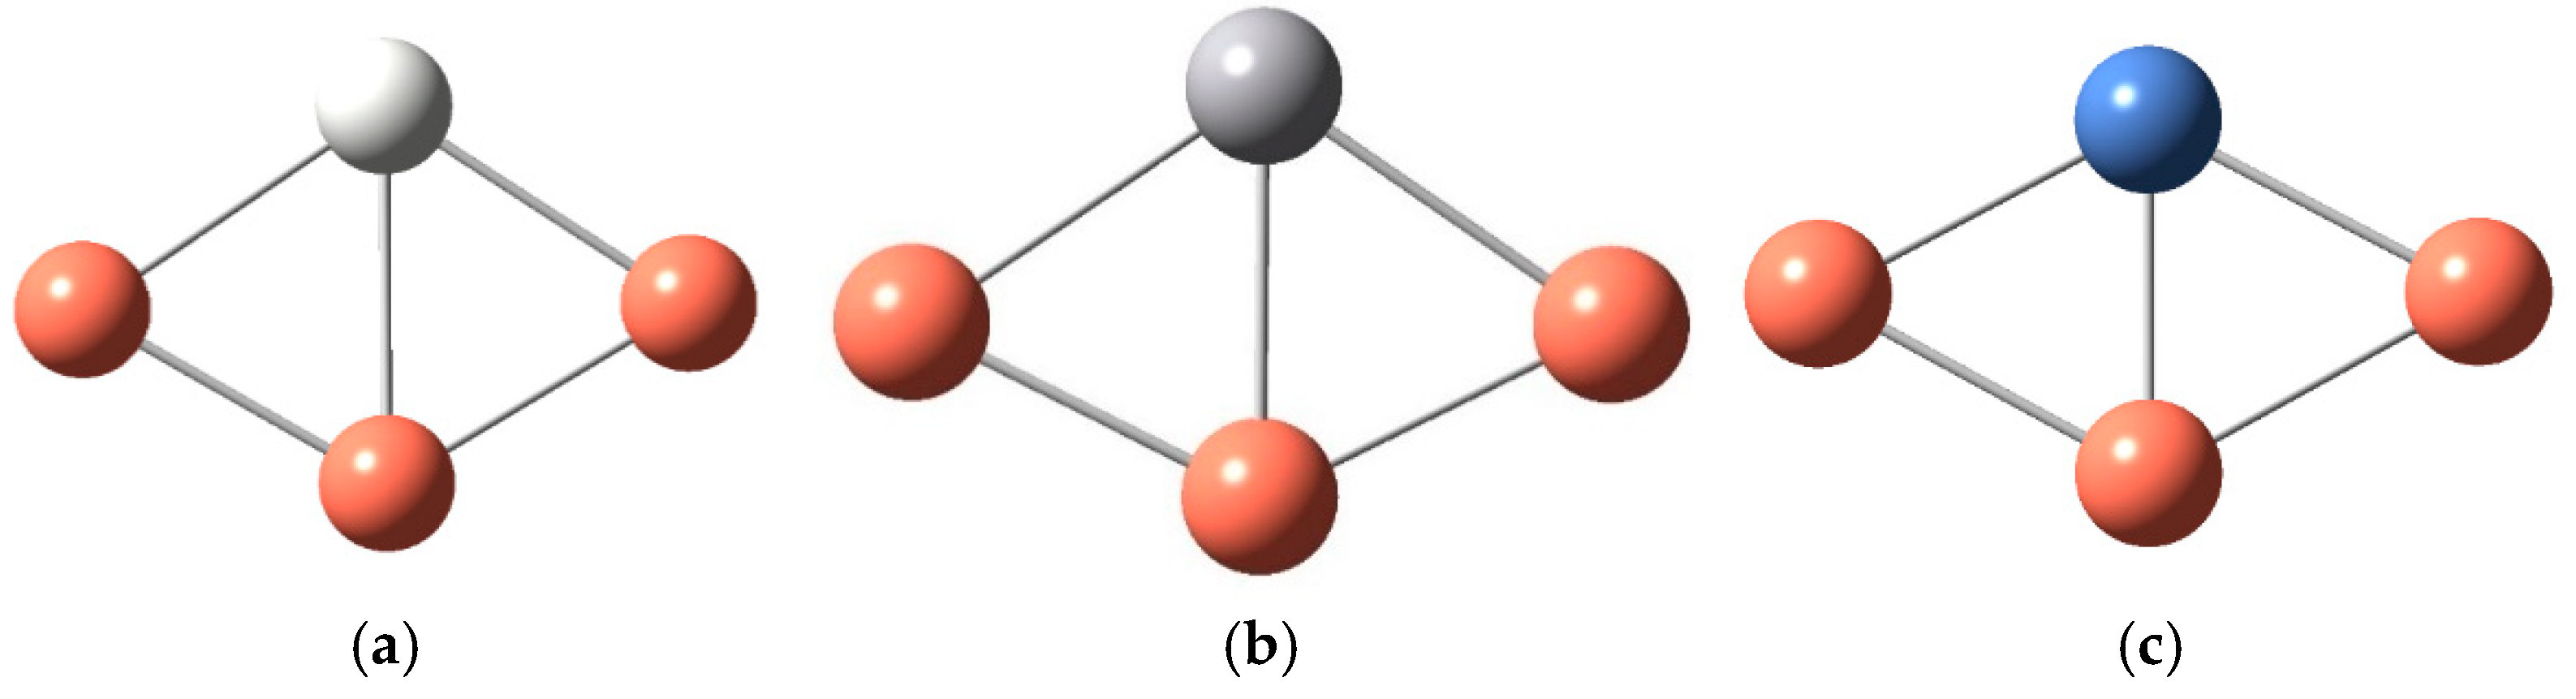
Copper surfaces act as catalysts in the electrochemical conversion of CO2, producing methane and other small-molecule hydrocarbons. The Cu3M clusters (M = Sc, V, Ni, Cu, Co, and Fe) with the lowest-energy structures are shown in Figure 3. Since Cu4 clusters deposited on Al2O3 effectively convert CO2 to methanol via hydrogenation, the doped Cu3M clusters are also expected to be stable and valuable materials for similar applications.
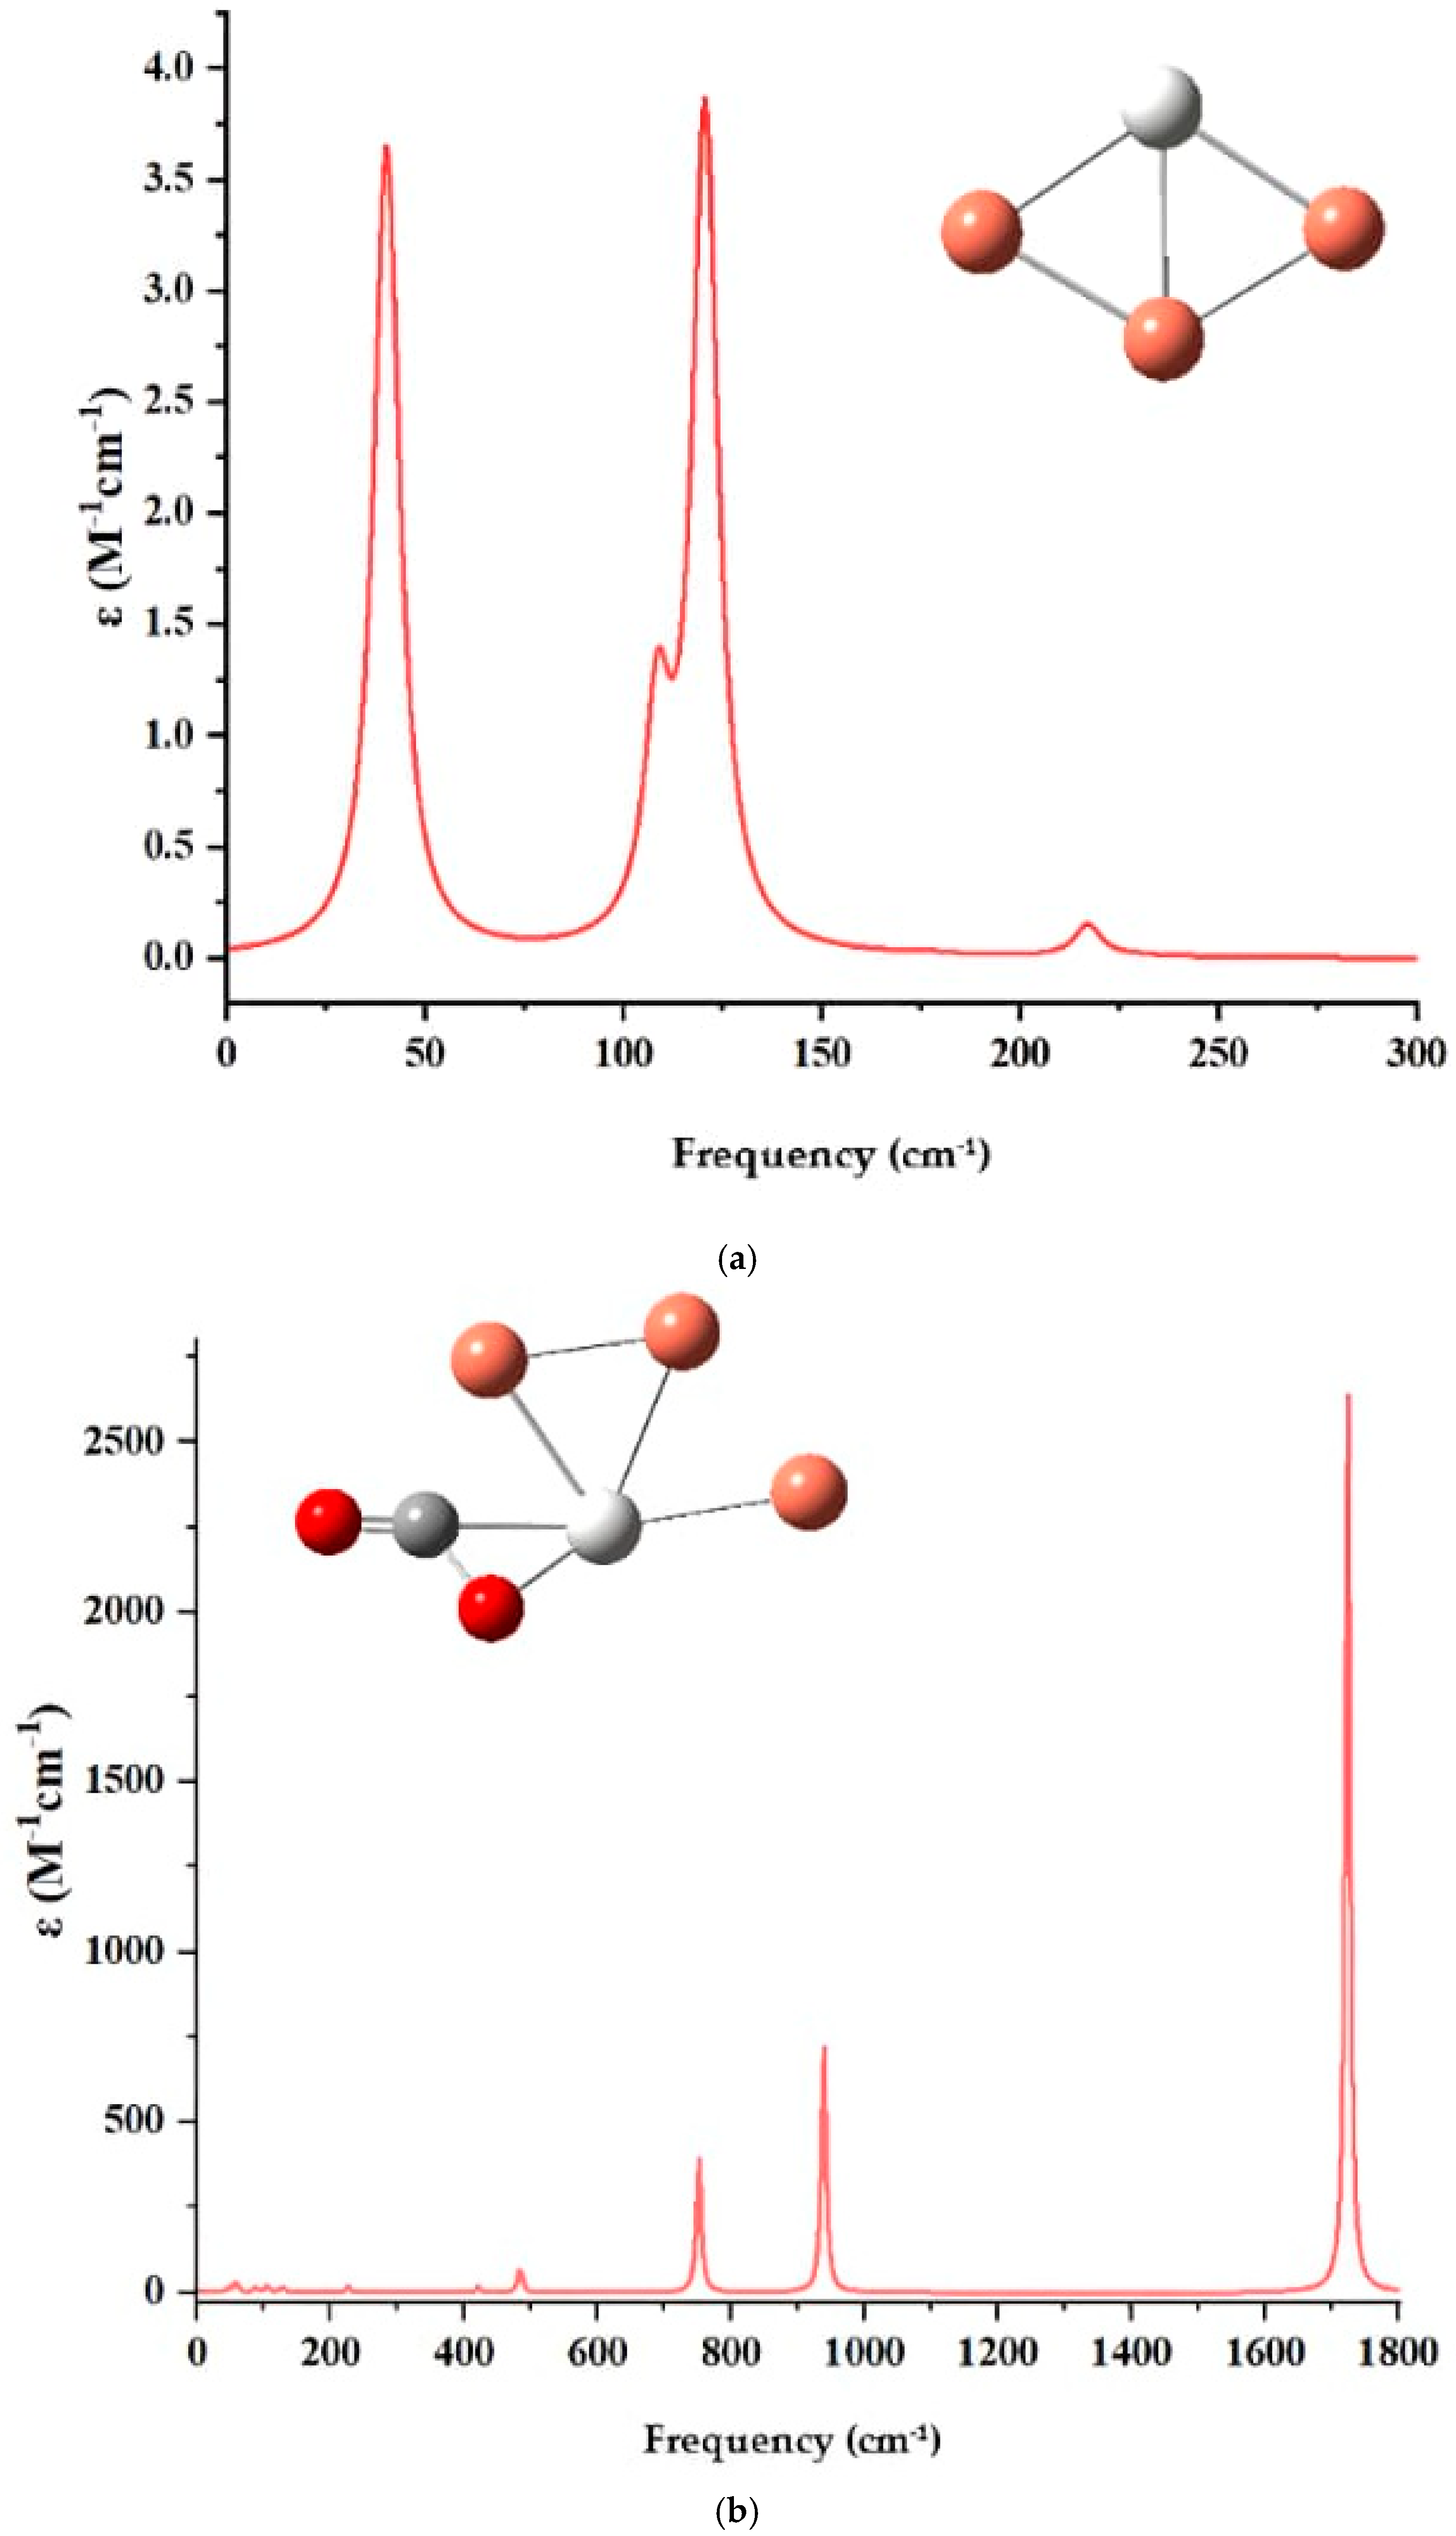
The structure shown in the corner of Figure 4a reveals a tetrahedral cluster where one scandium atom is bonded to three copper atoms. This geometry suggests that the scandium acts as a dopant or active center, altering the vibrational properties of the copper base. Low frequencies indicate that the scandium–copper bonds are relatively flexible, a feature common in systems in which a light transition metal atom (such as scandium) interacts with a heavier metal base (such as copper). The spectrum reveals vibrational modes associated with the interaction between the scandium atom and the copper atoms, with two prominent peaks at 60 cm−1 and 120 cm−1 corresponding to translational and bending modes, respectively. The relatively low frequency reflects the flexibility of the scandium–copper bond, typical of clusters doped with metal atoms. The structure in Figure 4b clearly shows that CO2 is adsorbed onto the catalytic system, with its carbon atom (dark gray) and oxygen atoms (red) interacting with the scandium atom (active site) and the copper base. The strong peak between 1600 and 1800 cm−1 and the bands in the 800–1000 cm−1 range confirm that CO2 is adsorbed onto the scandium active site and has undergone chemical activation. The interaction weakens the C=O bonds, shifting the characteristic vibrational frequencies of CO2 to lower values than in free CO2.
Although a complete quantitative comparison of adsorption energies for all Cu3M clusters was not included, the optimized structures, vibrational frequency shifts, and frontier orbital analysis provide qualitative evidence of CO2 activation. The interaction of CO2 with the doped copper clusters induces changes in the vibrational region associated with C=O stretching, suggesting weakening of the C=O bond upon coordination to the metallic site. This behavior is consistent with partial electron donation/back-donation between metal-centered orbitals and the antibonding π* orbitals of CO2. Therefore, the catalytic role of the dopant can be rationalized as an electronic modulation of the Cu cluster, in which the heterometal modifies orbital accessibility and the active site’s ability to polarize CO2.

3.2.2. Calculations of the Energy Gap Between Orbitals (HOMO-LUMO)

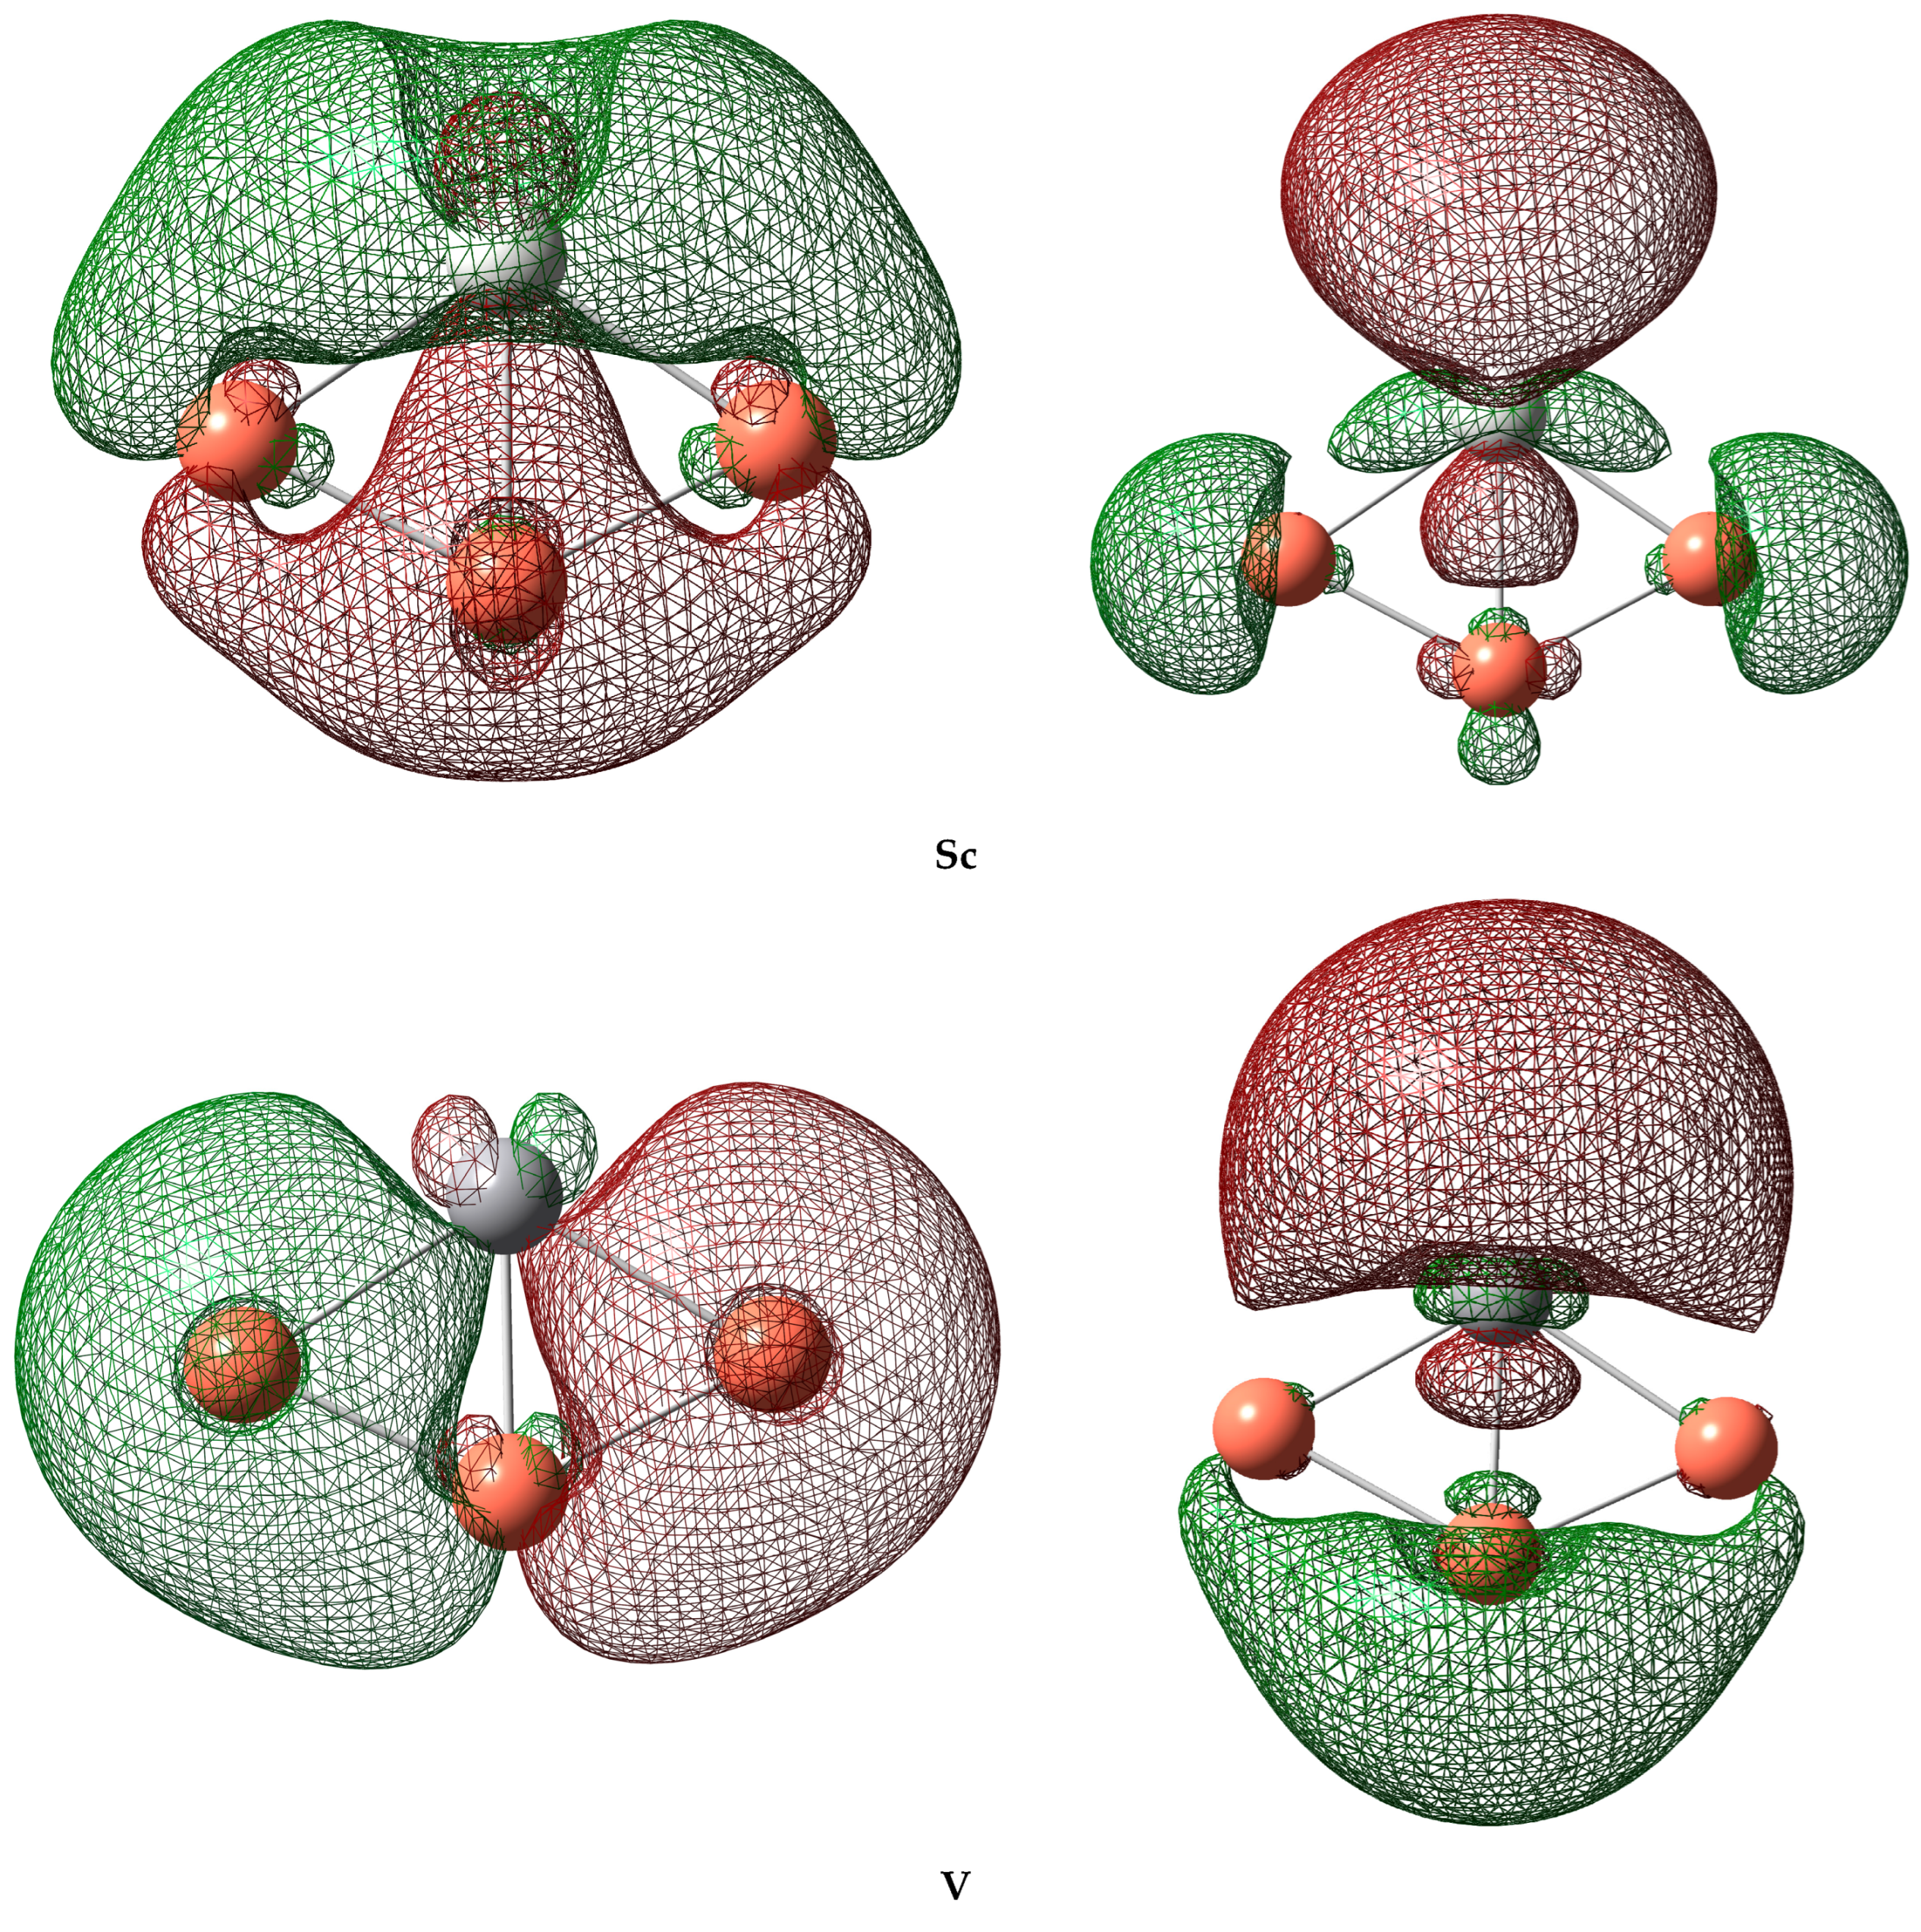
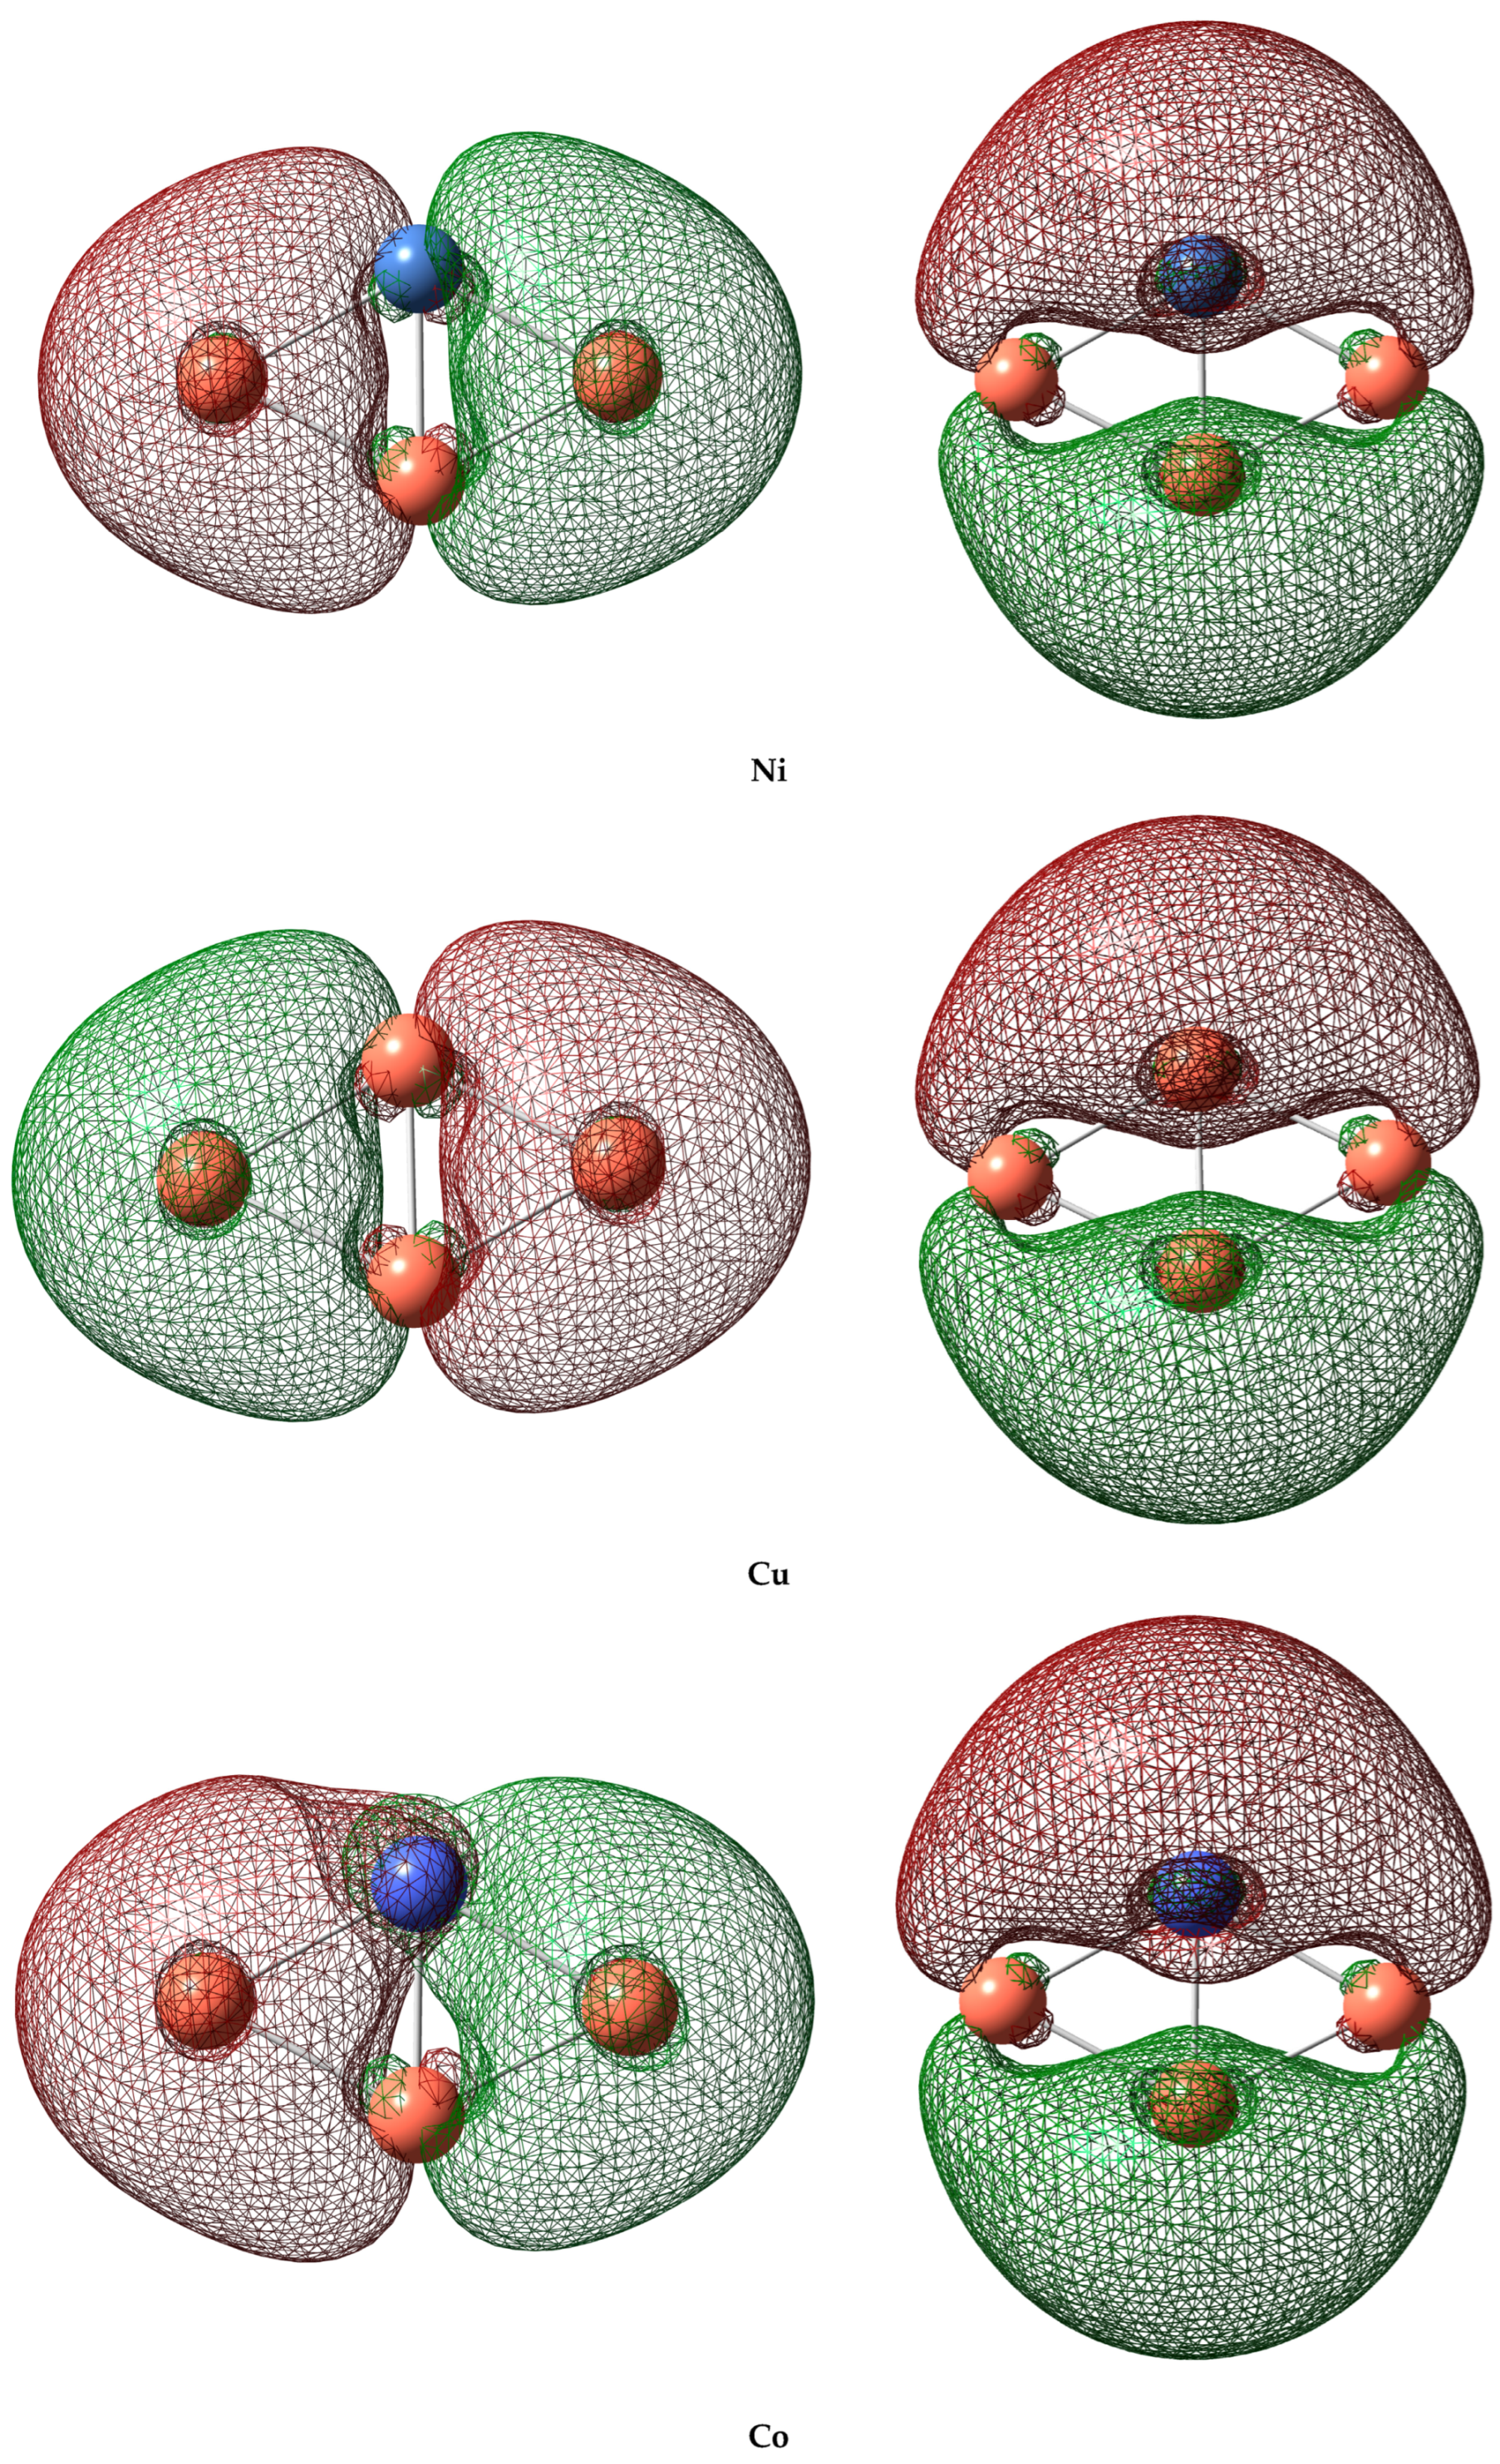
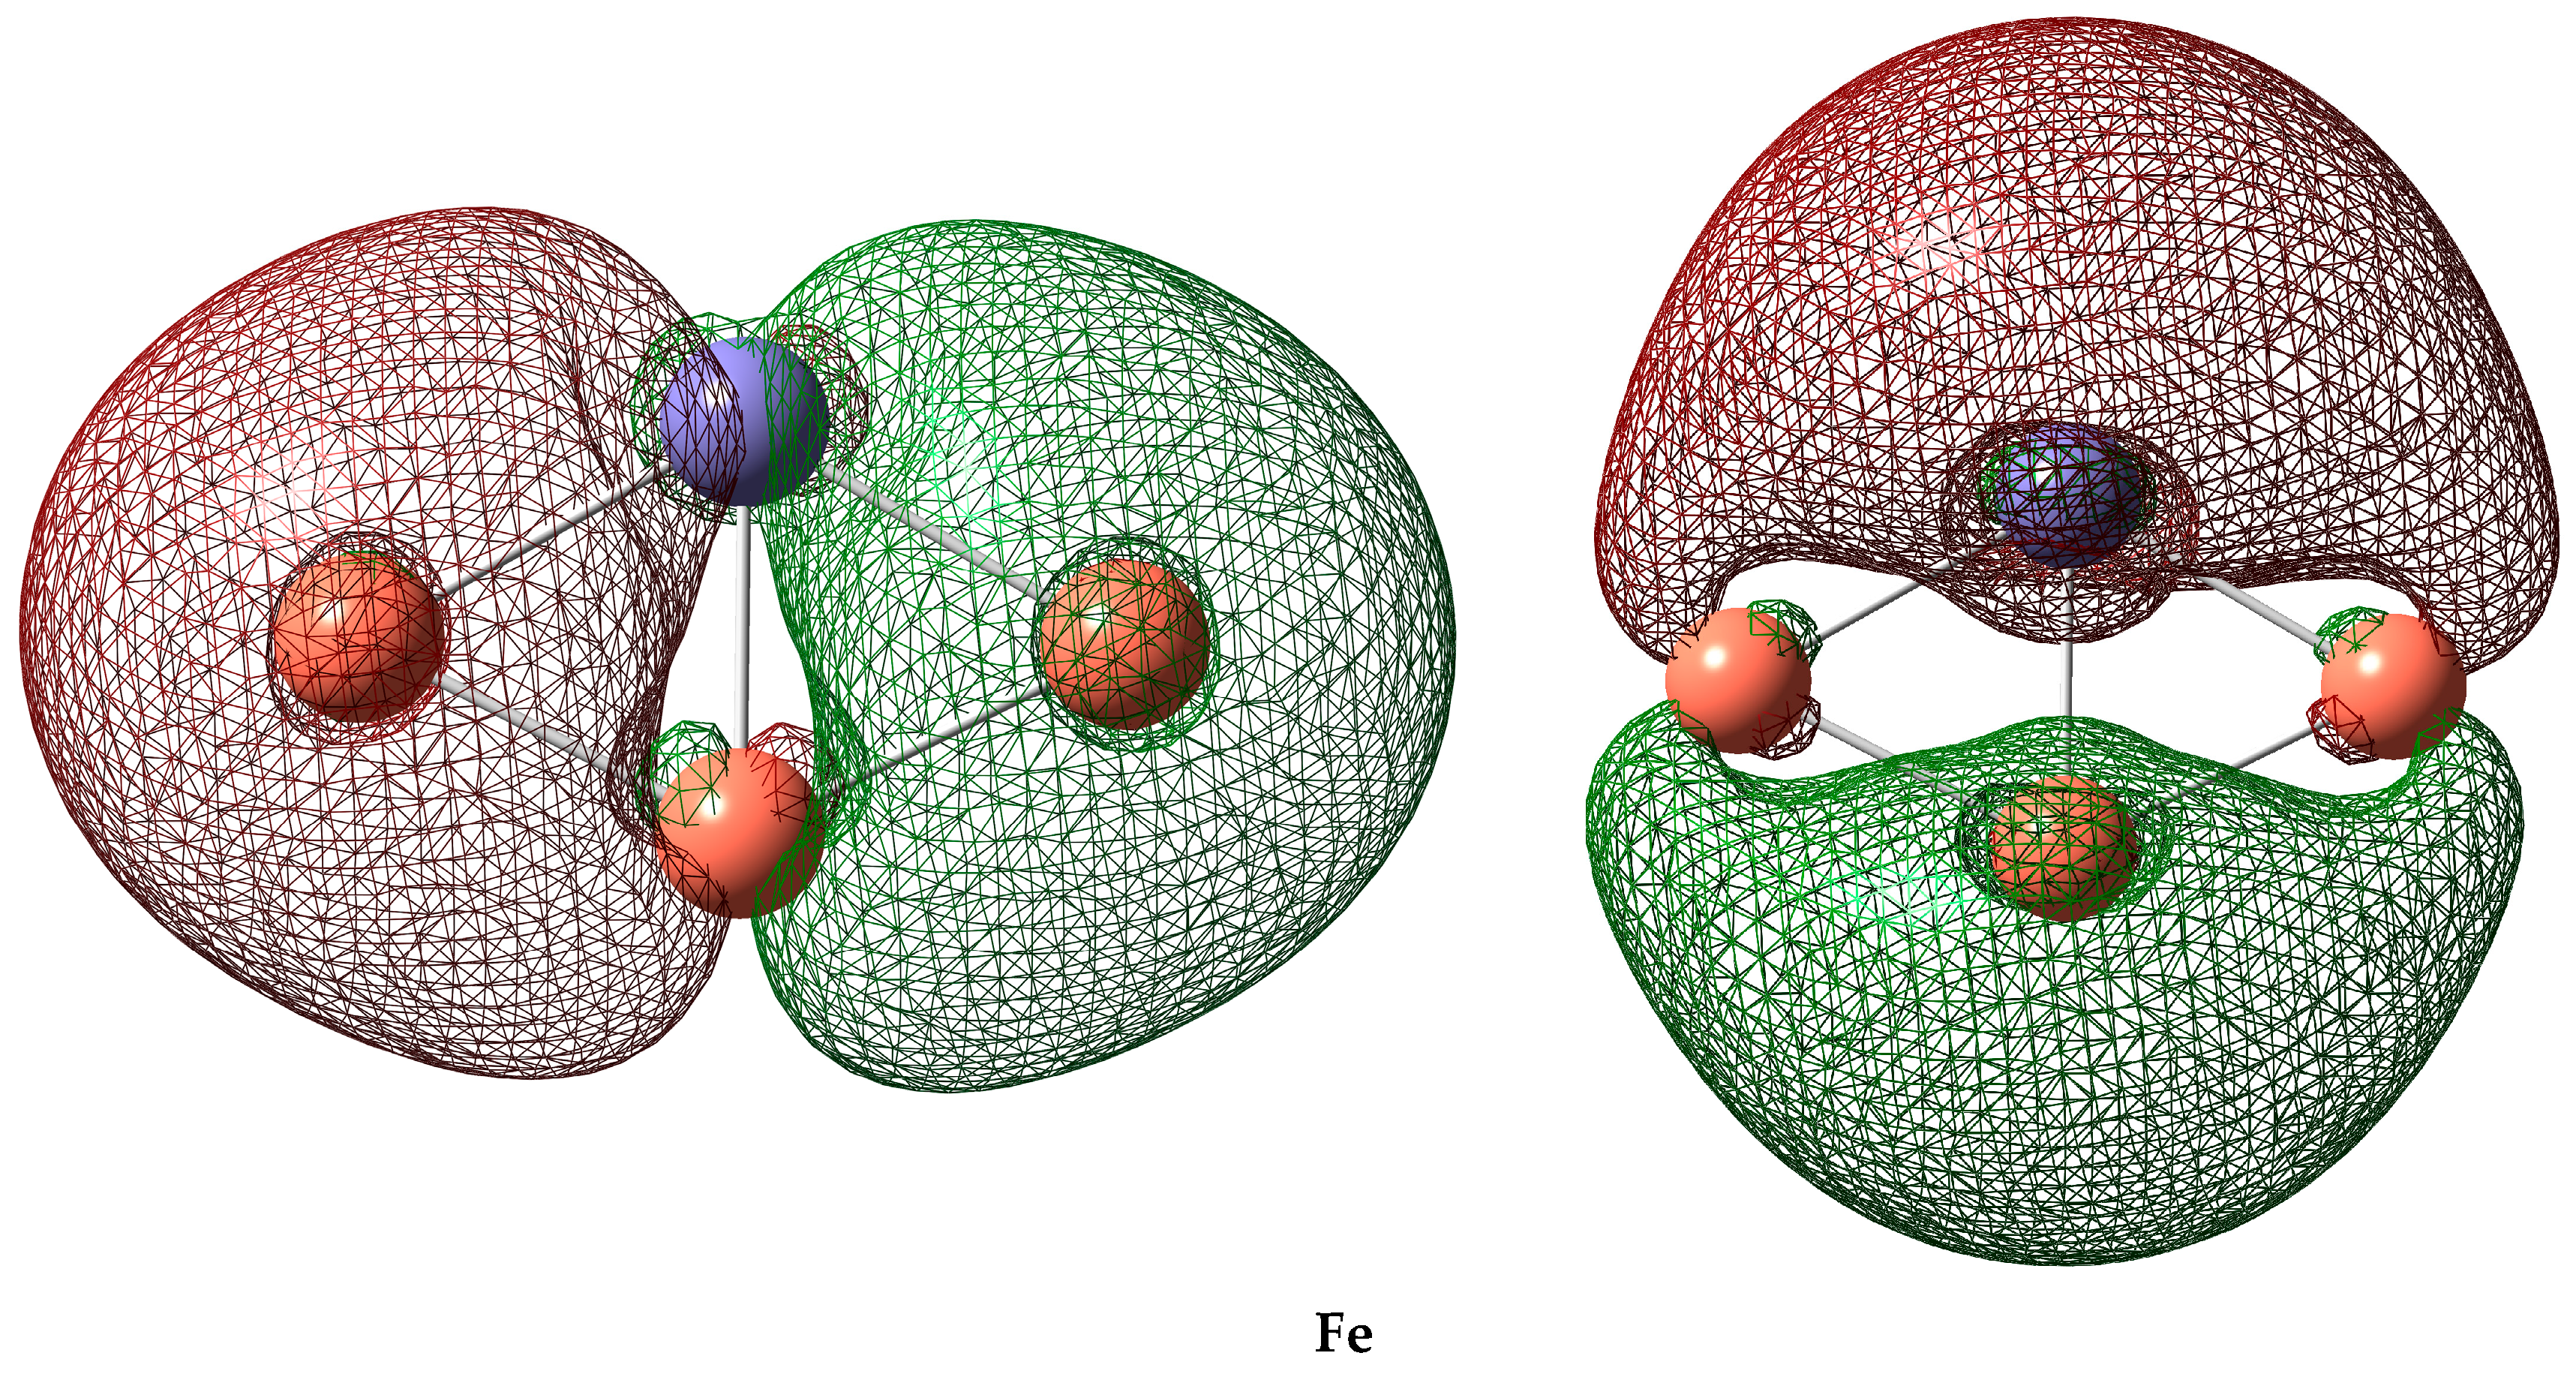
The quantitative values of the HOMO, LUMO, and their energy gap (ΔEgap = ELUMO − EHOMO) for the six catalysts are given in Table 3, and the orbital graphical representations are shown in Figure 5. Analyzing these data, we observe that Sc presents the smallest gap (0.214 eV), followed by Ni (0.218 eV), Fe (0.224 eV), V (0.227 eV), and Co (0.230 eV), suggesting that Sc and Ni offer easier electronic donor acceptance and, therefore, a higher probability of activating CO2. The case of Cu shows a slightly negative ΔEgap (−0.036 eV), reflecting an unusual extension of the LUMO below the HOMO, pointing to an atypical electronic configuration, so its reactivity may be dominated by other factors, such as the formation of mixed metal–ligand states. Overall, systems with smaller gaps (Sc and Ni) should exhibit higher catalytic activity in CO2 activation. In contrast, Co and V, with wider gaps, would exhibit a lower electronic facility for charge transfer. This correlation between ΔEgap and reactivity is illustrated in Figure 5, where the high-electron-density regions of the HOMO and the extent of the LUMO confirm that reduced-gap metals facilitate both electron donation and electron uptake during the catalytic cycle.
The apparent negative HOMO–LUMO gap observed in the Cu-containing model suggests that its frontier orbital ordering may be influenced by mixed metal–ligand states or by the cluster’s electronic complexity. Therefore, the activity trend was not assigned solely from the HOMO–LUMO gap. Instead, the HOMO–LUMO analysis was interpreted qualitatively together with the optimized structures and vibrational shifts associated with CO2 activation. In this sense, the smaller gaps observed for Sc- and Ni-containing systems suggest greater electronic flexibility, which may facilitate charge redistribution during CO2 coordination.

3.2.3. Electrochemical Carbon Dioxide Reduction (eCO2RR)

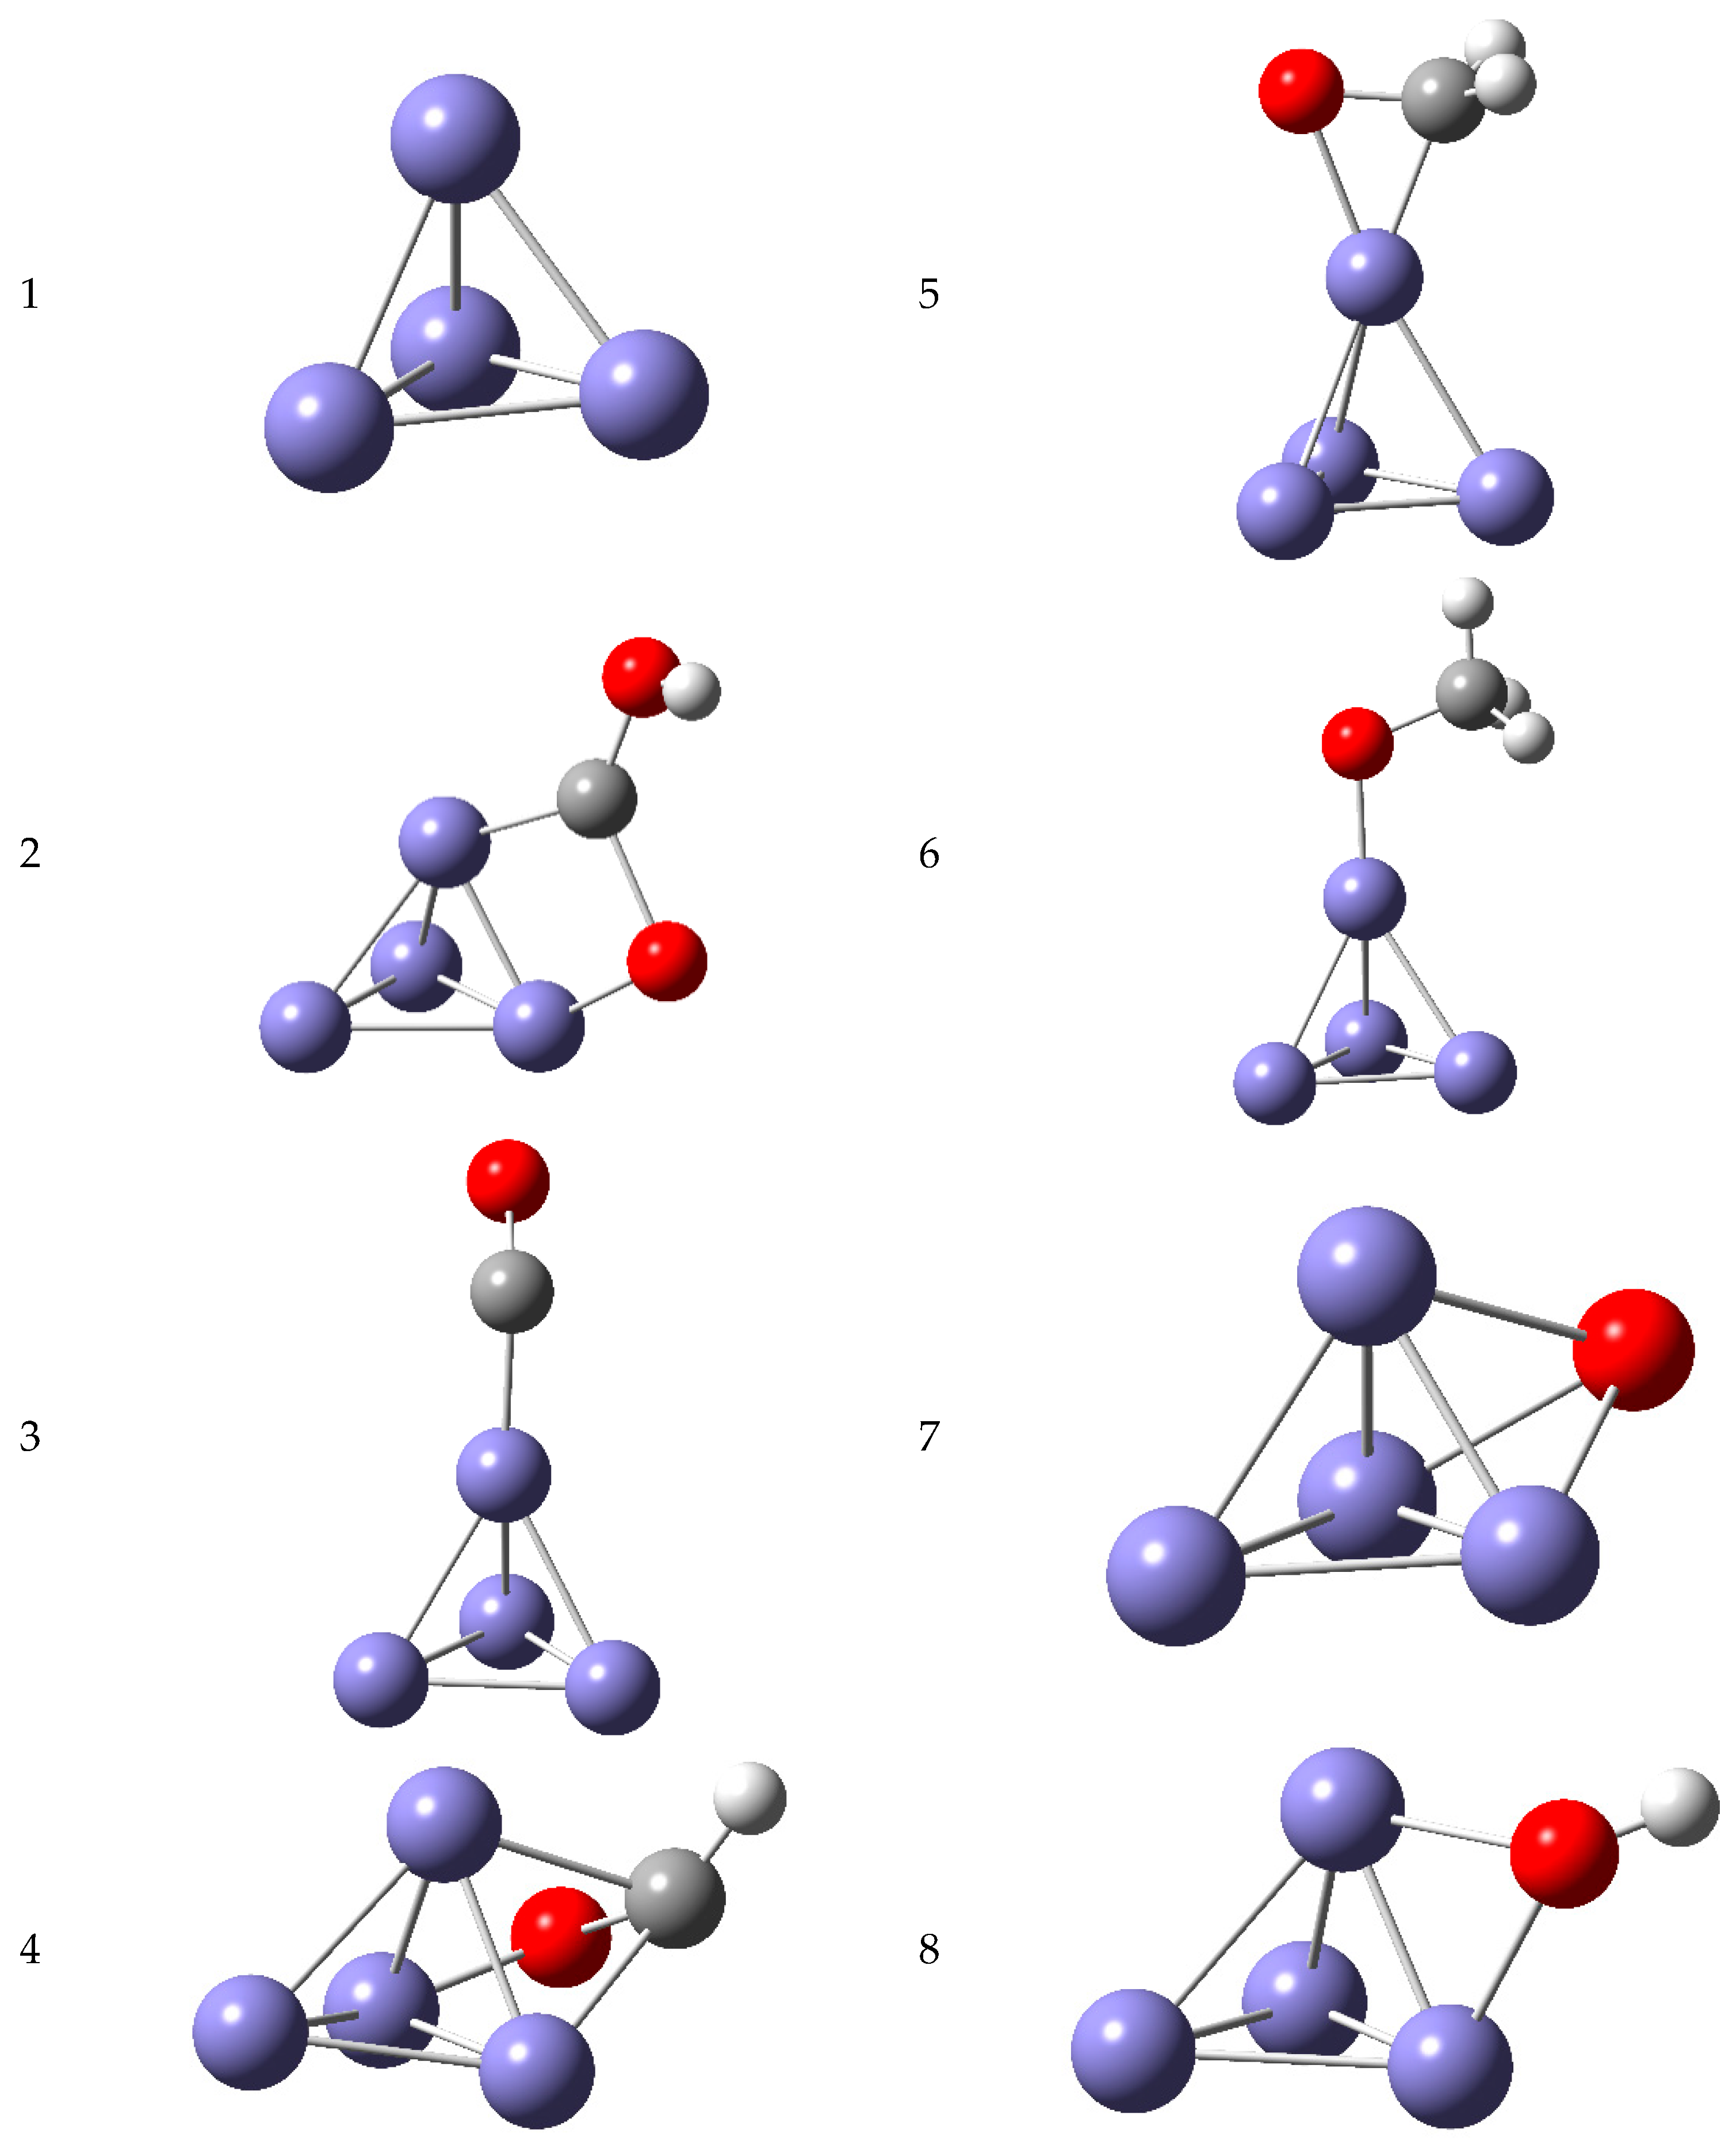
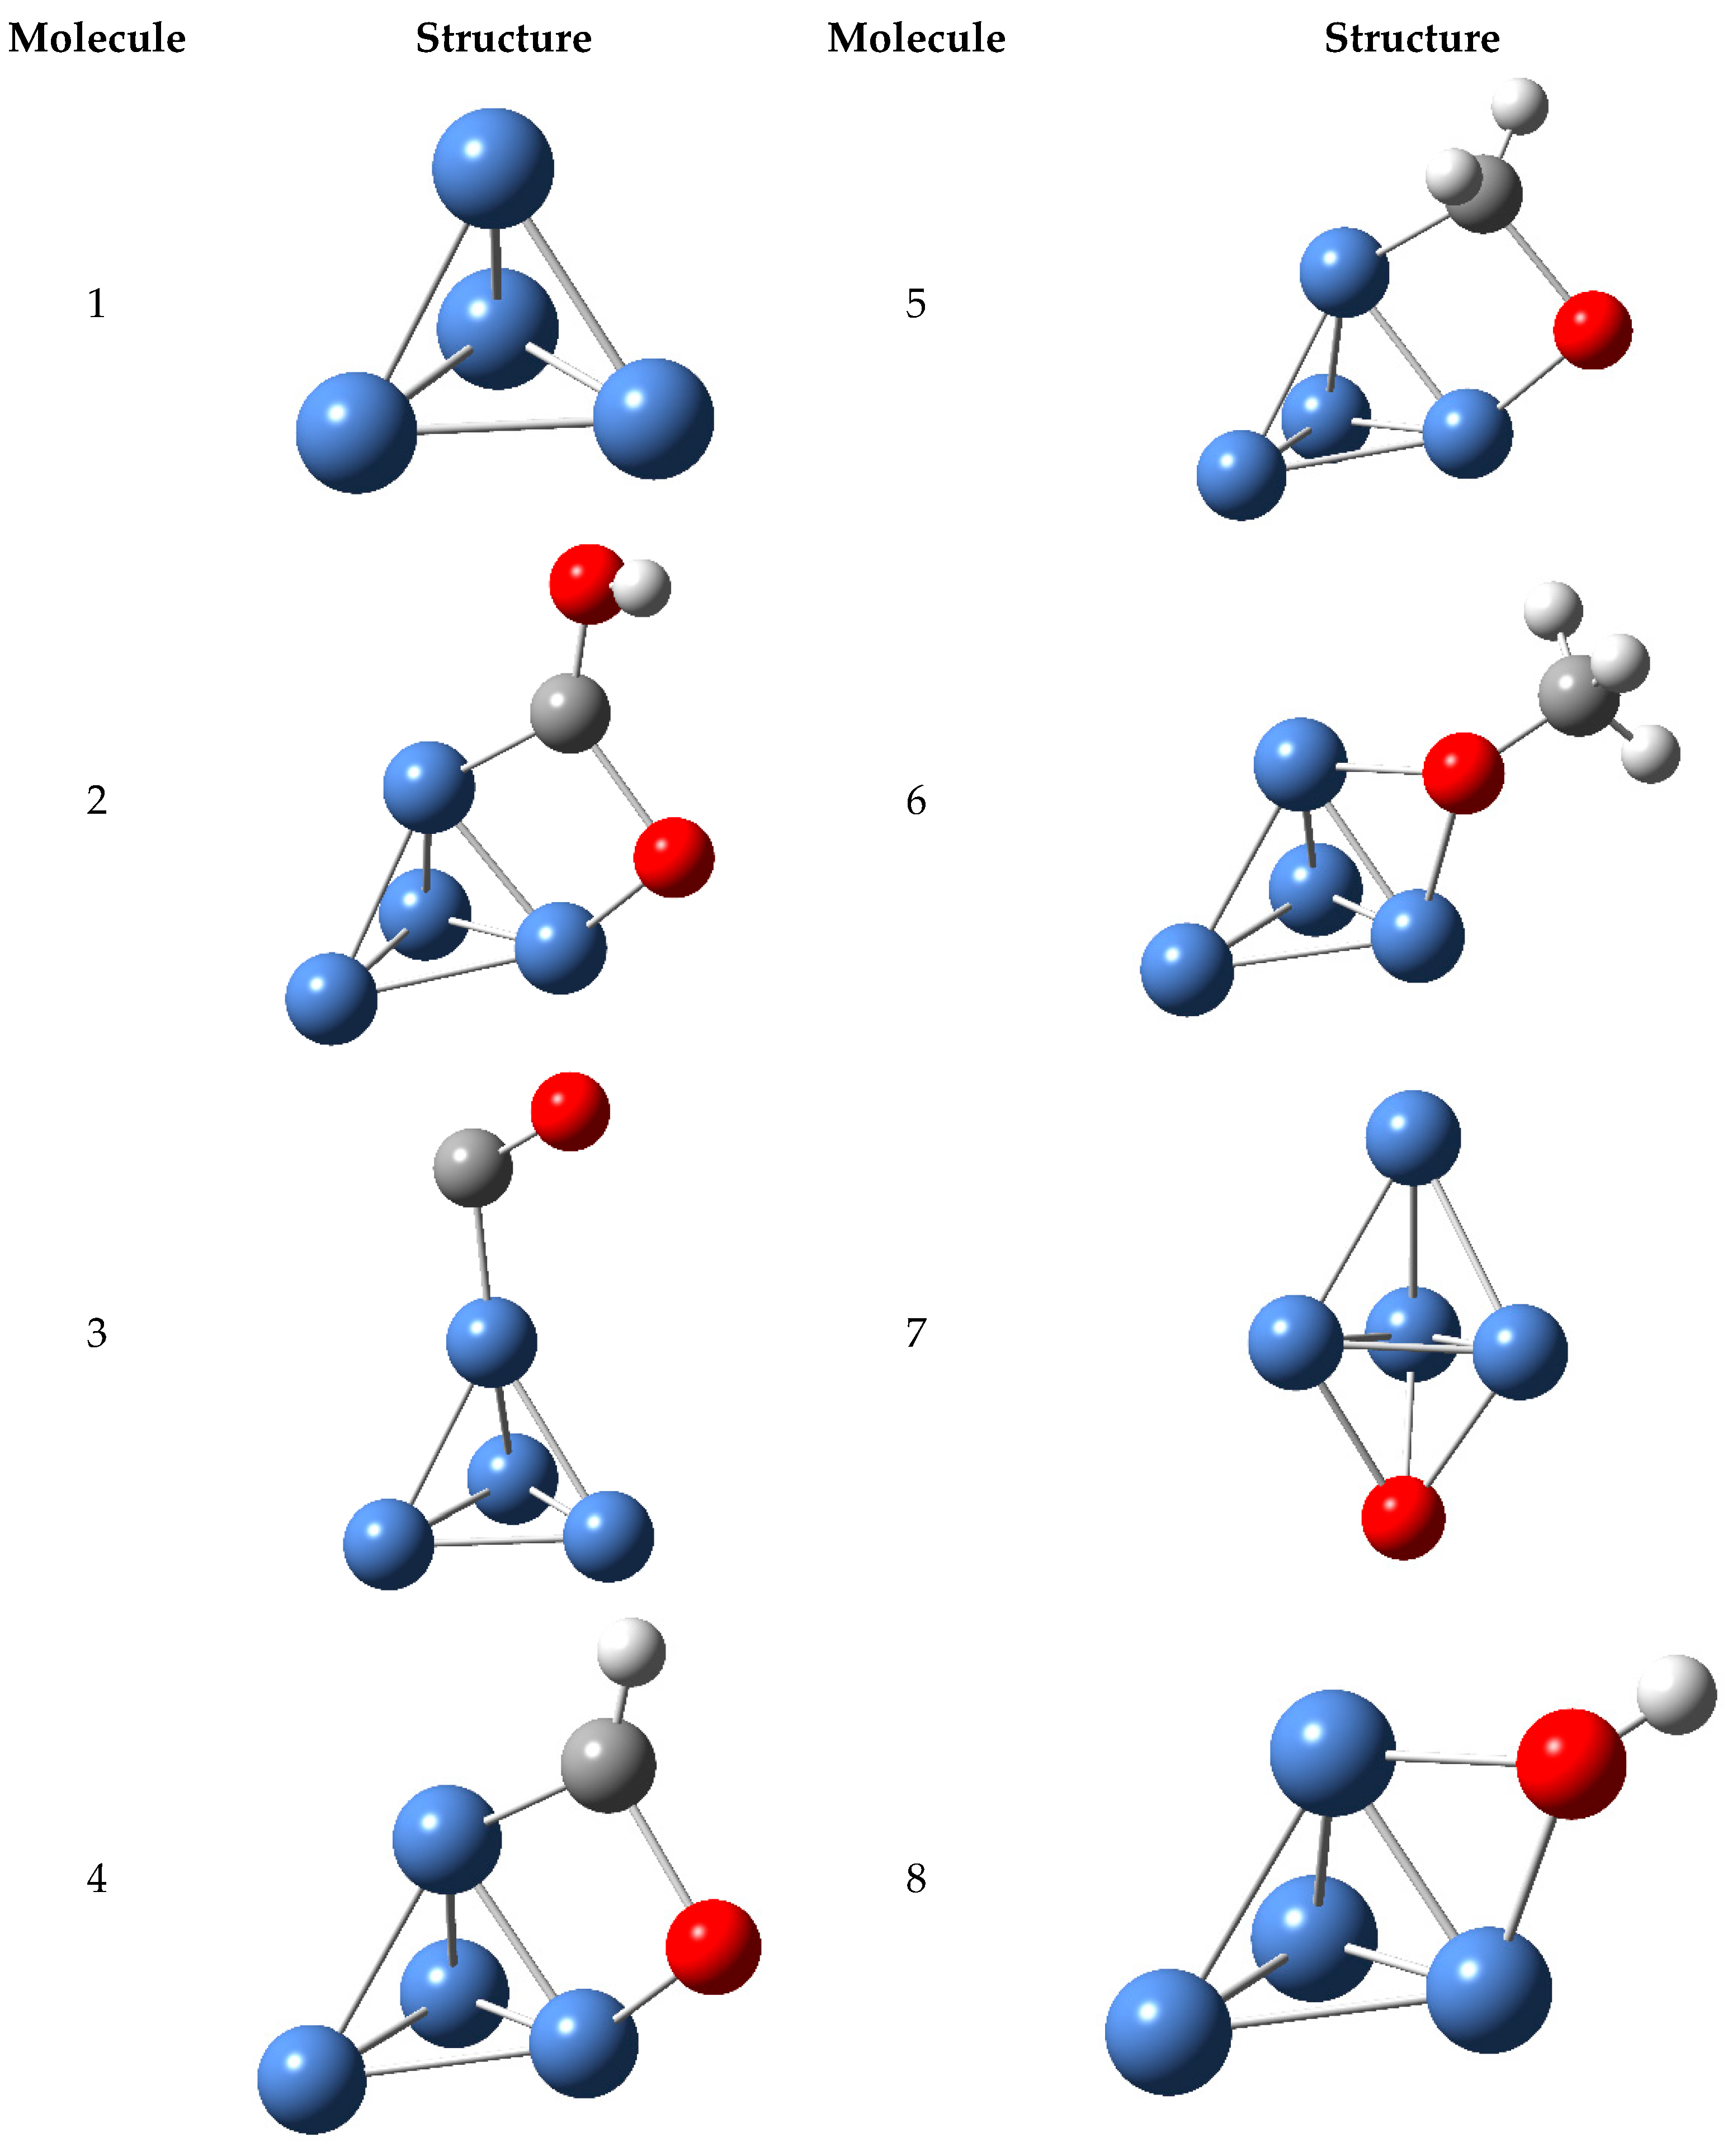
The electrochemical CO2 reduction models were evaluated through DFT calculations to analyze the thermodynamic behavior of Fe2- and Ni2-assisted systems. Eight optimized molecular arrangements were considered for each bimetallic model, representing possible catalyst–intermediate structures involved in CO2 activation and transformation toward reduced C1 products such as CO, formate/formic acid, methanol, or methane. The calculations were performed at the B3LYP/6-311++G(d,p) level, and the resulting electronic energies, enthalpies, Gibbs free energies, and entropies were compared under different temperature and pressure conditions.
This study focused on a thorough comparison between two types of bimetallic catalysts, Fe2 and Ni2. Both have been widely cited in the scientific literature as potential agents for the activation and transformation of carbon dioxide, owing to their accessibility, distinctive electronic properties, and diverse surface interactions with highly reactive chemical species. Extensive experiments were conducted, and eight distinct molecular complexes were refined for each catalyst system studied (Figure 6 and Figure 7). These components could play a crucial, strategic role as intermediaries or intermediate phases in the process of transforming carbon dioxide into high-value substances, such as carbon monoxide (CO), formic acid, methanol, and even reduced-lightness hydrocarbons, thereby enabling more complex, technologically sophisticated processes.
Fe2 and Ni2 were selected as simplified bimetallic models because Fe and Ni are earth-abundant transition metals with accessible redox states, partially filled d-orbitals, and known relevance in CO2 activation, hydrogenation, and electroreduction chemistry. Their comparison allows evaluation of two low-cost catalytic motifs with different electron-donation/back-donation capacities toward CO2-derived intermediates.
Analyses of all these arrangements were performed under six thermobarometric conditions (two at 298.15 K and two at 473.15 K) and at three pressure levels (1, 5, and 10 atmospheres). In this way, consistent energy patterns were identified (Table 4, Table 5, Table 6 and Table 7).
Because Fe2- and Ni2-containing systems are chemically distinct, their absolute total energies in Hartree units should not be interpreted as a direct, standalone measure of intrinsic catalytic superiority. In the present work, these values are used to analyze thermodynamic trends within each catalytic family and to compare the stabilization pattern of the optimized intermediates under different temperature and pressure conditions. Within the evaluated set, the Ni2-containing systems exhibited lower Gibbs energy and higher entropy under comparable thermobarometric conditions, suggesting favorable stabilization and greater configurational flexibility for the modeled Ni2-assisted intermediates.
The entropy analysis also shows that temperature has a stronger influence than pressure on the thermodynamic response of the evaluated systems. Increasing the temperature from 298.15 to 473.15 K produces more noticeable changes in the Gibbs free energy via the TΔS contribution. In contrast, increasing the pressure from 1 to 10 atm causes only a moderate reduction in entropy, consistent with the lower configurational freedom expected under compression. Therefore, the Fe2/Ni2 comparison should be interpreted as a thermodynamic and electronic screening of the modeled intermediates rather than as a definitive ranking of catalytic activity. A rigorous intrinsic activity comparison would require fully referenced adsorption free energies, elementary reaction free energies, transition state barriers, solvent/electrolyte effects, and potential-dependent electrochemical corrections.

3.2.4. Factors Governing Product Selectivity

The relative stabilization of key intermediates governs the selectivity in CO2 conversion. The preferential formation of *COOH favors the pathway toward CO, while the stabilization of *OCHO favors the formation of formate. Weak adsorption of *CO promotes its desorption as CO, whereas moderate adsorption enables subsequent reductions to methanol, methane, or more hydrogenated C1 species. Conversely, excessively strong adsorption of *CO can block active sites and decrease catalytic activity. In Cu-based systems, selectivity toward more reduced products is related to the ability to stabilize CO and facilitate subsequent proton–electron transfers. At the same time, the incorporation of secondary metals in Cu3M can modulate electron density, back-donation to π*(CO2) antibonding orbitals, C=O bond polarization, and competition with the hydrogen evolution reaction.
Nevertheless, a quantitative prediction of product selectivity would require complete adsorption energy calculations, elementary reaction barriers, and applied potential corrections.

3.3. Multivariate Thermodynamic Analysis of CO2 Conversion Routes

Principal component analysis (PCA) was performed on temperature, ΔE, ΔH, and ΔG values obtained for all evaluated CO2 conversion routes (Table 8, Table 9 and Table 10). The first two principal components explained 84.65% of the total variance. PC1 was mainly associated with thermodynamic descriptors (ΔE, ΔH, and ΔG), whereas PC2 was strongly correlated with temperature, indicating that energetic factors and operating temperature primarily control route feasibility. The first two principal components accounted for 84.65% of the total variance, indicating that the PCA model adequately summarizes the thermodynamic behavior of the evaluated CO2 conversion routes.
The thermodynamic ranking revealed that Route 2 exhibited the most favorable energetic profile, characterized by the lowest average Gibbs free energy and enthalpy values. Route 4 also showed favorable thermodynamic behavior, whereas Routes 5 and 1 presented lower overall feasibility due to their less favorable free energy profiles. Route 5 exhibited the only positive average enthalpy value, indicating a less favorable thermodynamic profile than Routes 2 and 4.

3.4. Comparison with Previous Studies and Sustainability Implications

Table 11 demonstrates that the thermodynamic trends predicted in the present work are consistent with observations reported in previous computational and experimental investigations. In particular, the favorable behavior of dry methane reforming at elevated temperatures, the thermodynamic limitations of methanol synthesis, and the favorable stabilization trends observed for Ni-containing models are consistent with widely accepted findings in the literature. These results support the reliability of the proposed computational methodology and reinforce its applicability for the preliminary assessment of sustainable CO2 utilization technologies.

3.5. Sustainability Implications

The thermodynamic evaluation performed in this work provides relevant information for the development of sustainable CO2 utilization technologies. The results indicate that although some non-catalytic routes are feasible only at extreme temperatures, catalytic systems significantly improve reaction viability and may help reduce energy consumption. In particular, Cu-based and Ni-containing catalysts showed promising performance for CO2 activation and transformation under milder operating conditions. The conversion of CO2 into synthesis gas, carbon monoxide, methane, and methanol represents an opportunity to integrate carbon capture and utilization strategies within future circular carbon economies. These products can serve as chemical feedstocks and energy carriers, potentially reducing dependence on fossil resources. Furthermore, computational screening approaches such as DFT enable the identification of promising catalytic systems before experimental development, thereby reducing material consumption, energy requirements, and research costs. Consequently, theoretical methodologies can help accelerate the development of sustainable technologies for carbon management and greenhouse gas mitigation.

4. Conclusions

DFT calculations were used to compare representative non-catalytic and catalyst-assisted CO2 conversion routes. The non-catalytic CO2 + H2 → CO + H2O pathway showed a high activation barrier of 0.326 Hartree, confirming that thermal improvement alone is insufficient to make this reaction kinetically efficient. Dry methane reforming and selected conversion routes showed more favorable thermodynamic profiles, although practical operation still requires catalytic control.
For the catalytic models, Cu3M clusters modified CO2 interactions through changes in frontier orbital distributions, vibrational shifts, and C=O bond weakening. These descriptors suggest that heterometal incorporation can tune CO2 activation by modifying metal–adsorbate interactions and the electronic response of the copper cluster.
For the Fe2 and Ni2 eCO2RR models, the comparison revealed different thermodynamic stabilization patterns under the evaluated temperature and pressure conditions. Because absolute total energies alone are insufficient to establish intrinsic catalytic superiority between chemically different systems, the present analysis is interpreted as a thermodynamic and electronic screening rather than as a complete activity ranking.
Overall, this work provides a thermodynamic and electronic framework for screening CO2 conversion pathways. Future work should include explicit solvent/electrolyte effects, applied potential, larger surface models, adsorption free energies, and complete transition state searches for the elementary catalytic steps.


Author Contributions

Conceptualization, J.A.H.F. and J.A.P.P.; Methodology, J.A.H.F. and J.A.P.P.; Software, J.A.H.F. and J.A.P.P.; Validation, J.A.H.F. and J.A.P.P.; Formal analysis, J.A.H.F., J.L.-M. and J.A.P.P.; Investigation, J.A.H.F. and J.L.-M.; Resources, J.A.H.F. and J.L.-M.; Data curation, J.A.H.F., J.L.-M. and J.A.P.P.; Writing—original draft, J.A.H.F., J.L.-M. and J.A.P.P.; Writing—review & editing, J.A.H.F. and J.A.P.P.; Visualization, J.A.H.F. and J.L.-M.; Supervision, J.A.H.F.; Project administration, J.A.H.F. and J.A.P.P.; Funding acquisition, J.A.H.F. All authors have read and agreed to the published version of the manuscript.

Funding

This research was funded by MCIN/AEI/10.13039/501100011033 through grant PID2023-152869OB-C22.

Institutional Review Board Statement

Not applicable.

Informed Consent Statement

Not applicable.

Data Availability Statement

The original contributions presented in this study are included in the article. Further inquiries can be directed to the corresponding authors.

Conflicts of Interest

The authors declare no conflicts of interest.

References

  1. Jin, S.; Hao, Z.; Zhang, K.; Yan, Z.; Chen, J. Advances and Challenges for the Electrochemical Reduction of CO2 to CO: From Fundamentals to Industrialization. Angew. Chem. 2021, 133, 20795–20816. [Google Scholar] [CrossRef] [Scilit]
  2. Hoekman, S.K.; Broch, A.; Robbins, C.; Purcell, R. CO2 recycling by reaction with renewably-generated hydrogen. Int. J. Greenh. Gas Control 2010, 4, 44–50. [Google Scholar] [CrossRef] [Scilit]
  3. Ahlers, S.J.; Bentrup, U.; Linke, D.; Kondratenko, E.V. An Innovative Approach for Highly Selective Direct Conversion of CO2 into Propanol using C2H4 and H2. ChemSusChem 2014, 7, 2631–2639. [Google Scholar] [CrossRef] [Scilit] [PubMed]
  4. Yang, F.; Meerman, J.; Faaij, A. Carbon capture and biomass in industry: A techno-economic analysis and comparison of negative emission options. Renew. Sustain. Energy Rev. 2021, 144, 111028. [Google Scholar] [CrossRef] [Scilit]
  5. Choi, C.; Kwon, S.; Cheng, T.; Xu, M.; Tieu, P.; Lee, C.; Cai, J.; Lee, H.M.; Pan, X.; Duan, X.; et al. Highly active and stable stepped Cu surface for enhanced electrochemical CO2 reduction to C2H4. Nat. Catal. 2020, 3, 804–812. [Google Scholar] [CrossRef] [Scilit]
  6. Jia, C.; Gao, J.; Dai, Y.; Zhang, J.; Yang, Y. Thermodynamic analysis and experimental validation of complex systems in the CO2 hydrogenation process. J. Energy Chem. 2016, 25, 1027–1037. [Google Scholar] [CrossRef] [Scilit]
  7. Phey, M.L.P.; Abdullah, T.A.T.; Ali, U.F.M.; Mohamud, M.Y.; Ikram, M.; Nabgan, W. Reverse water gas shift reaction over a Cu/ZnO catalyst supported on regenerated spent bleaching earth (RSBE) in a slurry reactor: The effect of the Cu/Zn ratio on the catalytic activity. RSC Adv. 2023, 13, 3039–3055. [Google Scholar] [CrossRef] [Scilit] [PubMed]
  8. Jiang, B.; Sun, Q.; Lougou, B.G.; Zhang, H.; Li, X.; Qu, Z.; Shuai, Y.; Wang, C.-H. Highly-selective CO2 conversion through single oxide CuO enhanced NiFe2O4 thermal catalytic activity. Sustain. Mater. Technol. 2022, 32, e00441. [Google Scholar] [CrossRef] [Scilit]
  9. Qin, Y.; Su, Y. A DFT Study on Heterogeneous Pt/CeO2 (110) Single Atom Catalysts for CO Oxidation. ChemCatChem 2021, 13, 3857–3863. [Google Scholar] [CrossRef] [Scilit]
  10. Frisch, M.J.; Trucks, G.W.; Schlegel, H.B.; Scuseria, G.E.; Robb, M.A.; Cheeseman, J.R.; Scalmani, G.; Barone, V.; Petersson, G.A.; Nakatsuji, H.; et al. Gaussian16, Revision A. 03; Gaussian, Inc.: Wallingford, CT, USA, 2016.
  11. Norskov, J.K.; Abild-Pedersen, F.; Studt, F.; Bligaard, T. Density functional theory in surface chemistry and catalysis. Proc. Natl. Acad. Sci. USA 2011, 108, 937–943. [Google Scholar] [CrossRef] [Scilit] [PubMed]
  12. Burke, K. Perspective on density functional theory. J. Chem. Phys. 2012, 136, 150901. [Google Scholar] [CrossRef] [Scilit] [PubMed]
  13. Tirado-Rives, J.; Jorgensen, W.L. Performance of B3LYP Density Functional Methods for a Large Set of Organic Molecules. J. Chem. Theory Comput. 2008, 4, 297–306. [Google Scholar] [CrossRef] [Scilit] [PubMed]
  14. Gholizadeh, R.; Pavlin, M.; Huš, M.; Likozar, B. Multiscale Modeling of CO2 Electrochemical Reduction on Copper Electrocatalysts: A Review of Advancements, Challenges, and Future Directions. ChemSusChem 2025, 18, e202400898. [Google Scholar] [CrossRef] [Scilit] [PubMed]
  15. Zuo, C.; Su, Q.; Yan, X. Research Progress of Co-Catalysts in Photocatalytic CO2 Reduction: A review of developments, opportunities, and directions. Processes 2023, 11, 867. [Google Scholar] [CrossRef] [Scilit]
  16. Zuo, C.; Su, Q.; Jiang, Z. Advances in the application of Bi-Based Compounds in photocatalytic reduction of CO2. Molecules 2023, 28, 3982. [Google Scholar] [CrossRef] [Scilit] [PubMed]
  17. Tai, X.; Yan, X.; Wang, L. Synthesis, Structural Characterization, Hirschfeld Surface Analysis, Density Functional Theory, and Photocatalytic CO2 Reduction Activity of a New Ca(II) Complex with a Bis-Schiff Base Ligand. Molecules 2024, 29, 1047. [Google Scholar] [CrossRef] [Scilit] [PubMed]
Figure 1. Energy diagram calculated for the reaction CO2 + H2→ CO + H2O, using the B3LYP/6-311++G(d,p) method at a temperature of 1173.15 K.
Sustainability 18 08483 g001
Figure 2. IRC for possible transition states (a,b).
Sustainability 18 08483 g002aSustainability 18 08483 g002b
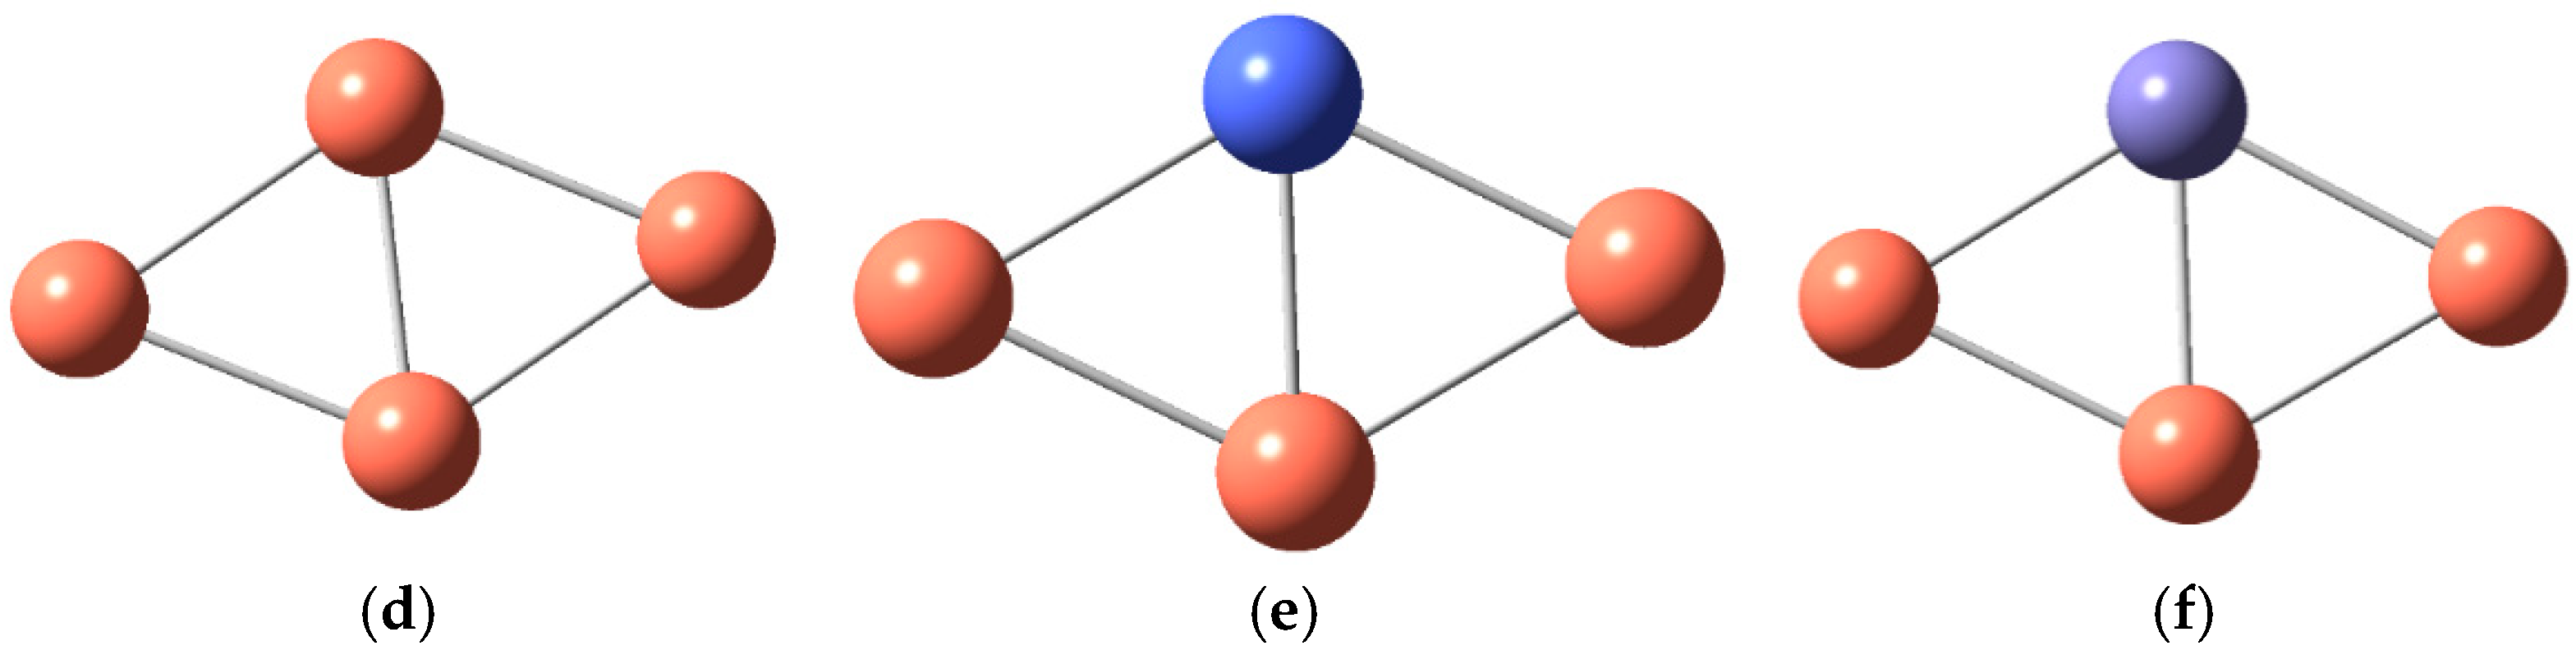
Figure 3. Cu3M clusters, where M refers to (a) Sc, (b) V, (c) Ni, (d) Cu, (e) Co, and (f) Fe.
Sustainability 18 08483 g003aSustainability 18 08483 g003b
Figure 4. CO2 adsorption and vibrational activation in the Cu3Sc catalytic model. (a) Tetrahedral cluster where a scandium atom is bonded to three copper atoms. (b) Carbon atom (dark gray) and oxygen atoms (red) interacting with the scandium atom (active center) and the copper base.
Sustainability 18 08483 g004
Figure 5. HOMO and LUMO diagrams of the studied metallic systems (Sc, V, Ni, Cu, Co, and Fe).
Sustainability 18 08483 g005aSustainability 18 08483 g005bSustainability 18 08483 g005c
Figure 6. Optimized structures of the electrochemical carbon dioxide reduction process route with the Fe2 catalyst.
Sustainability 18 08483 g006
Figure 7. Optimized structures of the electrochemical carbon dioxide reduction process route with the Ni2 catalyst.
Sustainability 18 08483 g007
Table 1. Temperature ranges used by non-catalytic conversion routes. Route 1: CO2 hydrogenation for methanol production; Route 2: dry methane reforming; Route 3: direct air capture; Route 5: syngas production.
Route11111111
ReactionsReaction 1Reaction 1.1Reaction 1.2Reaction 1.3Reaction 2Reaction 2.1Reaction 2.2Reaction 2.3
Temperature (K)473.15298.15573.151173.15473.15298.15573.151173.15
Route11112222
ReactionsReaction 3Reaction 3.1Reaction 3.2Reaction 3.3Reaction 1Reaction 1.1Reaction 1.2Reaction 2
Temperature (K)473.15298.15573.151173.15973.15298.151173.15533.15
Route22333555
ReactionsReaction 2.1Reaction 2.2Reaction 1Reaction 1.1Reaction 1.2Reaction 1Reaction 1.1Reaction 1.2
Temperature (K)298.15593.15973.15298.151273.15473.15298.15573.15
Route555555
ReactionsReaction 1Reaction 1.1Reaction 1.2Reaction 2Reaction 2.1Reaction 2.2
Temperature (K)473.15298.15573.15673.15298.15573.15
Table 2. Impact of temperature changes on non-catalytic conversion routes. Route 1: CO2 hydrogenation for methanol production; Route 2: dry methane reforming; Route 4: direct CO2 capture and conversion; Route 5: syngas production.
RouteReactionTemperature (K)∆Esystem∆Hr∆Gr
11298.150.0190.0240.018
473.150.0190.0230.015
1173.150.020.020.004
12298.15−0.057−0.037−0.012
473.15−0.057−0.0390.004
573.15−0.06−0.040.01
1173.15−0.06−0.04−0.06
13298.15−0.038−0.0180.028
473.15−0.038−0.0130.007
573.15−0.04−0.020.03
21298.150.0190.0240.018
973.150.020.030.01
1173.150.020.0260.005
22298.15−0.1−0.45−0.049
533.15−0.1−0.09−0.05
593.15−0.1−0.09−0.03
41298.15−0.082−0.043−0.031
473.15−0.082−0.056−0.027
573.15−0.080−0.070−0.030
42298.15−0.034−0.0230.016
573.15−0.082−0.056−0.027
673.15−0.03−0.020.04
51298.150.11960.4770.067
873.150.120−0.056−0.027
973.150.1200.1100.010
52298.15−0.018−0.023−0.018
473.15−0.018−0.021−0.024
523.15−0.020−0.020−0.010
Table 3. Energies of the boundary orbitals (HOMO and LUMO) and the energy gap (ΔEgap = ELUMO − EHOMO) for the catalysts Sc, V, Ni, Cu, Co, and Fe, expressed in eV and obtained at the LC-BLYP/cc-pVTZ level.
CatalystHOMO (eV)LUMO (eV)ΔEgap
Sc−0.22815−0.014120.21403
V−0.25135−0.023910.22744
Ni−0.24479−0.027240.21755
Cu−0.24507−0.2808−0.03573
Co−0.25275−0.022740.23001
Fe−0.24963−0.025380.22425
Table 4. Energy parameters of the electrochemical reduction of CO2 catalyzed by Fe2 at 298.15 K, evaluated at 1, 5, and 10 atm. The energies are expressed as values relative to the optimized reactants: ΔErel, ΔHrel, and ΔGrel in Hartree; the entropies, ΔS, are in cal mol−1 K−1.
MoleculeTemperaturePressureE. SystemE. GibbsE. EnthalpyEntropy
1298.15 K1 atm−5054.411−5054.4479−5054.4180.604
2−682.6721−682.70707−682.671275.511
3−606.6426−606.6793−606.641779.18
4−607.4476−607.48198−607.446774.293
5−607.8224−607.85643−607.821573.5
6−608.7599−608.79432−608.75974.322
7−568.6022−568.63636−568.601273.96
8−569.4851−569.51956−569.484174.592
15 atm−5054.411−5054.4464−5054.4177.406
2−682.6721−682.70555−682.671272.313
3−606.6426−606.67778−606.641775.982
4−607.4222−607.45498−607.421271.008
5−607.8224−607.85491−607.821570.302
6−608.7599−608.7928−608.75971.124
7−568.6022−568.63484−568.601270.762
8−569.479−569.47802−569.51271.537
110 atm−5054.411−5054.4457−5054.4176.029
2−682.6721−682.7049−682.671270.935
3−606.6426−606.67713−606.641774.605
4−607.4222−607.45433−607.421269.63
5−607.8224−607.85425−607.821568.925
6−608.7599−608.79214−608.75969.747
7−568.6022−568.63418−568.601269.384
8−569.4851−569.51739−569.484170.016
Table 5. Energy parameters of the electrochemical reduction of CO2 catalyzed by Fe2 at 473.15 K, evaluated at 1, 5, and 10 atm. The energies are expressed as values relative to the optimized reactants: ΔErel, ΔHrel, and ΔGrel in Hartree; the entropies, ΔS, are in cal mol−1 K−1.
MoleculeTemperaturePressureE. SystemE. GibbsE. EnthalpyEntropy
1473.15 K1 atm−5054.407234−5054.4713−5054.405786.965
2−682.669857−682.72882−682.6683680.188
3−606.63975−606.70223−606.6382584.844
4−607.44523−607.50338−607.4437379.109
5−607.819885−607.87767−607.8183978.628
6−608.757813−608.81569−608.7563278.742
7−568.599173−568.65785−568.5976879.807
8−569.48254−569.54112−569.4810479.673
15 atm−5054.407234−5054.4689−5054.405783.767
2−682.669857−682.72641−682.6683676.99
3−606.63975−606.69981−606.6382581.646
4−607.419863−607.47549−607.4183775.759
5−607.819885−607.87526−607.8183975.43
6−608.757813−608.81328−608.7563275.544
7−568.599173−568.65544−568.5976876.609
8−569.48254−569.53871−569.4810476.475
110 atm−5054.407234−5054.4679−5054.405782.389
2−682.669857−682.72537−682.6683675.612
3−606.63975−606.69878−606.6382580.268
4−607.44523−607.49993−607.4437374.534
5−607.819885−607.87422−607.8183974.052
6−608.757813−608.81224−608.7563274.166
7−568.599173−568.6544−568.5976875.231
8−569.48254−569.53767−569.4810475.098
Table 6. Energy parameters of the electrochemical reduction of CO2 catalyzed by Ni2 at 298.15 K, evaluated at 1, 5, and 10 atm. The energies are expressed as values relative to the optimized reactants: ΔErel, ΔHrel, and ΔGrel in Hartree; the entropies, ΔS, are in cal mol−1 K−1.
MoleculeTemperaturePressureE. SystemE. GibbsE. EnthalpyEntropy
1298.15 K1 atm−6033.0924−6033.1319−6033.091585.134
2−866.2232−866.27933−866.22226120.114
3−790.44366−790.47874−790.4427175.828
4−790.99316−791.04906−790.99221119.648
5−791.57253−791.6216−791.57159105.256
6−792.32837−792.38713−792.32743125.654
7−752.34021−752.38232−752.3392790.623
8−753.02589−753.06128−753.0249576.465
15 atm−6033.093−6033.1286−6033.092176.847
2−866.2232−866.27781−866.22226116.916
3−790.44366−790.47722−790.4427172.629
4−790.99316−791.04754−790.99221116.45
5−791.57171−791.62593−791.57077116.099
6−792.29286−792.32564−792.2919270.975
7−752.34021−752.3808−752.3392787.425
8−753.02589−753.05976−753.0249573.267
110 atm−6033.093−6033.128−6033.092175.47
2−866.2232−866.27715−866.22226115.539
3−790.44366−790.47657−790.4427171.252
4−790.99316−791.04689−790.99221115.073
5−791.57171−791.62523−791.57077114.621
6−792.29286−792.32498−792.2919269.598
7−752.34021−752.38015−752.3392786.047
8−753.02055−753.0539−753.0196172.161
Table 7. Energy parameters of the electrochemical reduction of CO2 catalyzed by Ni2 at 473.15 K, evaluated at 1, 5, and 10 atm. The energies are expressed as values relative to the optimized reactants: ΔErel, ΔHrel, and ΔGrel in Hartree; the entropies, ΔS, are in cal mol−1 K−1.
MoleculeTemperaturePressureE. SystemE. GibbsE. EnthalpyEntropy
1473.15 K1 atm−6033.0898−6033.153−6033.088386.395
2−866.21449−866.3151−866.21299135.424
3−790.44094−790.5007−790.4394481.243
4−790.98453−791.0847−790.98303134.816
5−791.56273−791.663−791.56123134.947
6−792.31977−792.4245−792.31827140.832
7−752.33414−752.4092−752.33265101.556
8−753.01218−753.0727−753.0106882.205
15 atm−6033.0898−6033.151−6033.088383.197
2−866.21449−866.3127−866.21299132.226
3−790.44094−790.4983−790.4394478.045
4−790.98453−791.0823−790.98303131.618
5−791.56273−791.6606−791.56123131.812
6−792.31977−792.422−792.31827137.598
7−752.33414−752.4068−752.3326598.358
8−752.98544−753.0438−752.9839479.354
110 atm−6033.0898−6033.15−6033.088381.82
2−866.21449−866.3117−866.21299130.849
3−790.44094−790.4972−790.4394476.667
4−790.98453−791.0812−790.98303130.24
5−791.56273−791.6595−791.56123130.376
6−792.31977−792.4209−792.31827136.136
7−752.33414−752.4058−752.3326596.98
8−753.01248−753.0696−753.0109977.795
Table 8. PCA loading matrix obtained from the thermodynamic descriptors of the evaluated CO2 conversion routes.
VariablePC1PC2
Temperature (K)0.1030.903
ΔE0.5720.244
ΔH0.598−0.069
ΔG0.552−0.346
Table 9. Explained variance of the PCA model based on temperature and thermodynamic descriptors (ΔE, ΔH, and ΔG) for the evaluated CO2 conversion routes.
Principal ComponentVariance Explained (%)
PC156.46
PC228.19
Total84.65
Table 10. Average thermodynamic descriptors and sustainability ranking of the evaluated CO2 conversion routes.
RouteAverage ΔGAverage ΔHThermodynamic Ranking
Route 2−0.0160−0.09171
Route 4−0.0098−0.04472
Route 5−0.00030.07783
Route 10.0044−0.01404
Table 11. Comparison of the thermodynamic trends obtained in this work with representative findings reported in previous computational and experimental studies on CO2 conversion.
CO2 Conversion RouteMain ProductsFindings of This WorkLiterature ConsensusAgreement
Reverse Water Gas Shift (RWGS)CO + H2OΔG decreases from 0.018 to 0.005 Hartree as temperature increases, indicating greater feasibility at higher temperatures.RWGS is an endothermic process generally favored at elevated temperatures (>700 °C)Excellent
CO HydrogenationCH3OHThermodynamic feasibility strongly depends on temperature; it is spontaneous only under selected conditions.Methanol synthesis is limited by thermodynamic equilibrium and requires efficient catalysts.Excellent
Dry Methane ReformingCO + H2Negative ΔG values observed across the evaluated temperature range.DRM is widely recognized as thermodynamically favorable at moderate and high temperatures.Excellent
Direct CO2 Capture and ConversionCH4 + H2ONegative ΔG values indicate favorable thermodynamic behavior.Catalytic CO2 methanation is generally reported as a feasible route for CO2 utilization.Good
Syngas ProductionCO + H2Feasibility depends strongly on temperature and reaction pathway.Syngas production from CO2 usually requires high temperatures and catalyst optimization.Good
Electrochemical CO2 Reduction (eCO2RR)Reduced C1 intermediates/productsNi2-assisted models show favorable stabilization trends and higher entropy values within the evaluated intermediate set.Ni-containing catalytic systems have been widely investigated for CO2 activation, although intrinsic activity comparisons require relative free-energy descriptors.Good
Disclaimer/Publisher’s Note: The statements, opinions and data contained in all publications are solely those of the individual author(s) and contributor(s) and not of MDPI and/or the editor(s). MDPI and/or the editor(s) disclaim responsibility for any injury to people or property resulting from any ideas, methods, instructions or products referred to in the content.