1. Introduction
Arid and semi-arid ecosystems host a wide range of plant species uniquely adapted to survive under extreme climatic conditions, nutrient-poor soils, and water scarcity. Among these,
C. polygonoides L., a perennial shrub belonging to the Polygonaceae family, is widely recognized for its ecological importance and ethnobotanical value. The species contributes to sand dune stabilization and soil erosion control, provides forage for livestock, and serves as a source of traditional medicine that can be used to treat ailments such as digestive disorders and skin infections [
1,
2]. In addition, the species exhibits a remarkable physiological tolerance to drought, salinity, and high-temperature fluctuations. These traits highlight its importance for studying xerophytic plant adaptation in arid ecosystems [
1].
The distribution range of
C. polygonoides extends across the arid and semi-arid regions of North Africa, the Middle East, and South and Central Asia, with significant populations occurring in the deserts of Egypt, Saudi Arabia, and Pakistan [
3]. In Egypt, the species occurs in scattered populations in wadis and desert plains, where it contributes to ecosystem stability and biodiversity conservation [
4]. However, in recent decades, natural populations have declined due to habitat degradation, overgrazing, fuelwood collection, and the impacts of climate change, which collectively threaten its long-term survival [
3,
4]. These pressures have intensified noticeably in inland wadis, where anthropogenic disturbances and environmental stressors are strongly concentrated.
In Egypt, desert shrubs such as
C. polygonoides are increasingly pressured by habitat degradation, fuel-wood collection, and grazing in inland wadis, leading to fragmented and locally declining populations. The species is explicitly treated as an endangered medicinal plant by Egyptian pharmacognosy work that developed ex situ micropropagation and elicitation protocols to support conservation and sustainable metabolite production Owis 2016 [
5]. Recent population-genetic work on Egyptian
C. polygonoides has confirmed its conservation relevance by documenting within-country genetic structure and diversity patterns that are critical for safeguarding remnant gene pools [
6]. Ecologically,
C. polygonoides functions as a keystone desert shrub in Egypt’s coastal and inland arid systems, facilitating understory diversity and modulating microhabitats under extreme aridity—effects that have been demonstrated along Egypt’s Mediterranean belt [
7]. Together, these ecological and genetic findings reinforce its high conservation priority and the need for spatially explicit assessment tools.
The present study focuses on two ecologically distinct wadis in Egypt—Wadi El-Galala, located in the Northern Eastern Desert, and Wadi El-Assiuty, situated in the Eastern Desert near Assiut Governorate. Wadi El-Galala is characterized by rugged topography, shallow soils, and variable rainfall patterns, while Wadi El-Assiuty exhibits gentler slopes, deeper alluvial soils, and a more stable microclimate influenced by its geographical location. The contrasting geomorphological and climatic characteristics of these wadis provide an ideal natural setting to examine how environmental gradients regulate the distribution and performance of
C. polygonoides [
8].
Despite its significance, the spatial distribution and ecological requirements of
C. polygonoides remain insufficiently studied in Egypt, especially within inland wadis subject to rapid environmental transformation. Vegetation patterns in arid wadis are controlled by a combination of topographic variables, edaphic factors, and climatic parameters [
9]. The complex interactions among these variables necessitate integrative analytical tools capable of capturing multi-dimensional environmental controls on plant distribution. Remote sensing and Geographic Information Systems (GISs) provide an effective spatial framework for vegetation monitoring and habitat suitability modeling in arid landscapes. By integrating environmental layers with field observations, GIS-based models can identify suitable habitats, assess species–environment relationships, and support conservation planning for rare and endangered desert plants [
10]. In Egypt, such approaches have been applied to model the distribution of endangered plant species such as
Zygophyllum album,
Tamarix nilotica, and
Medemia argun [
4]; however, few studies have focused specifically on
C. polygonoides.
Hyperspectral reflectance measurements capture subtle variations in leaf pigments, water content, and structural properties, which can be linked to environmental gradients and habitat quality [
11,
12,
13]. However, the combined use of GIS-based habitat suitability modeling and hyperspectral leaf reflectance remains underutilized in ecological studies of
C. polygonoides, particularly in Egyptian arid wadis where the species is exposed to increasing environmental and anthropogenic pressures.
Accordingly, this study addresses the following research questions:
- (i)
Which topographic, edaphic, and climatic conditions are associated with the occurrence and habitat suitability of C. polygonoides in Wadi El-Galala and Wadi El-Assiuty?
- (ii)
How can GIS-based multi-criteria evaluation be used to identify preliminary habitat suitability patterns for C. polygonoides under the current environmental conditions?
- (iii)
Do hyperspectral leaf reflectance patterns provide complementary information on plant condition across contrasting habitat settings?
By addressing these questions, the study provides an exploratory spatial and spectral assessment that may support future field verification and site-specific conservation planning for C. polygonoides in the investigated wadis.
2. Materials and Methods
The study followed an integrated workflow combining field surveys, soil analysis, GIS-based habitat suitability modeling, and hyperspectral leaf reflectance measurements. Field surveys were conducted across fourteen plots distributed between Wadi El-Galala and Wadi El-Assiuty to record plant density, vegetation cover, GPS coordinates, and site characteristics. Soil samples were collected from the active root zone and analyzed for key edaphic properties, including electrical conductivity (EC), soil pH, and total soluble salts (TSSs). Topographic, climatic, and edaphic datasets were processed in a GIS environment and integrated using a multi-criteria evaluation framework with weighted overlay analysis to generate habitat suitability maps for C. polygonoides. Hyperspectral reflectance measurements were then used to provide complementary information on leaf optical properties across the two wadis.
2.1. Study Area
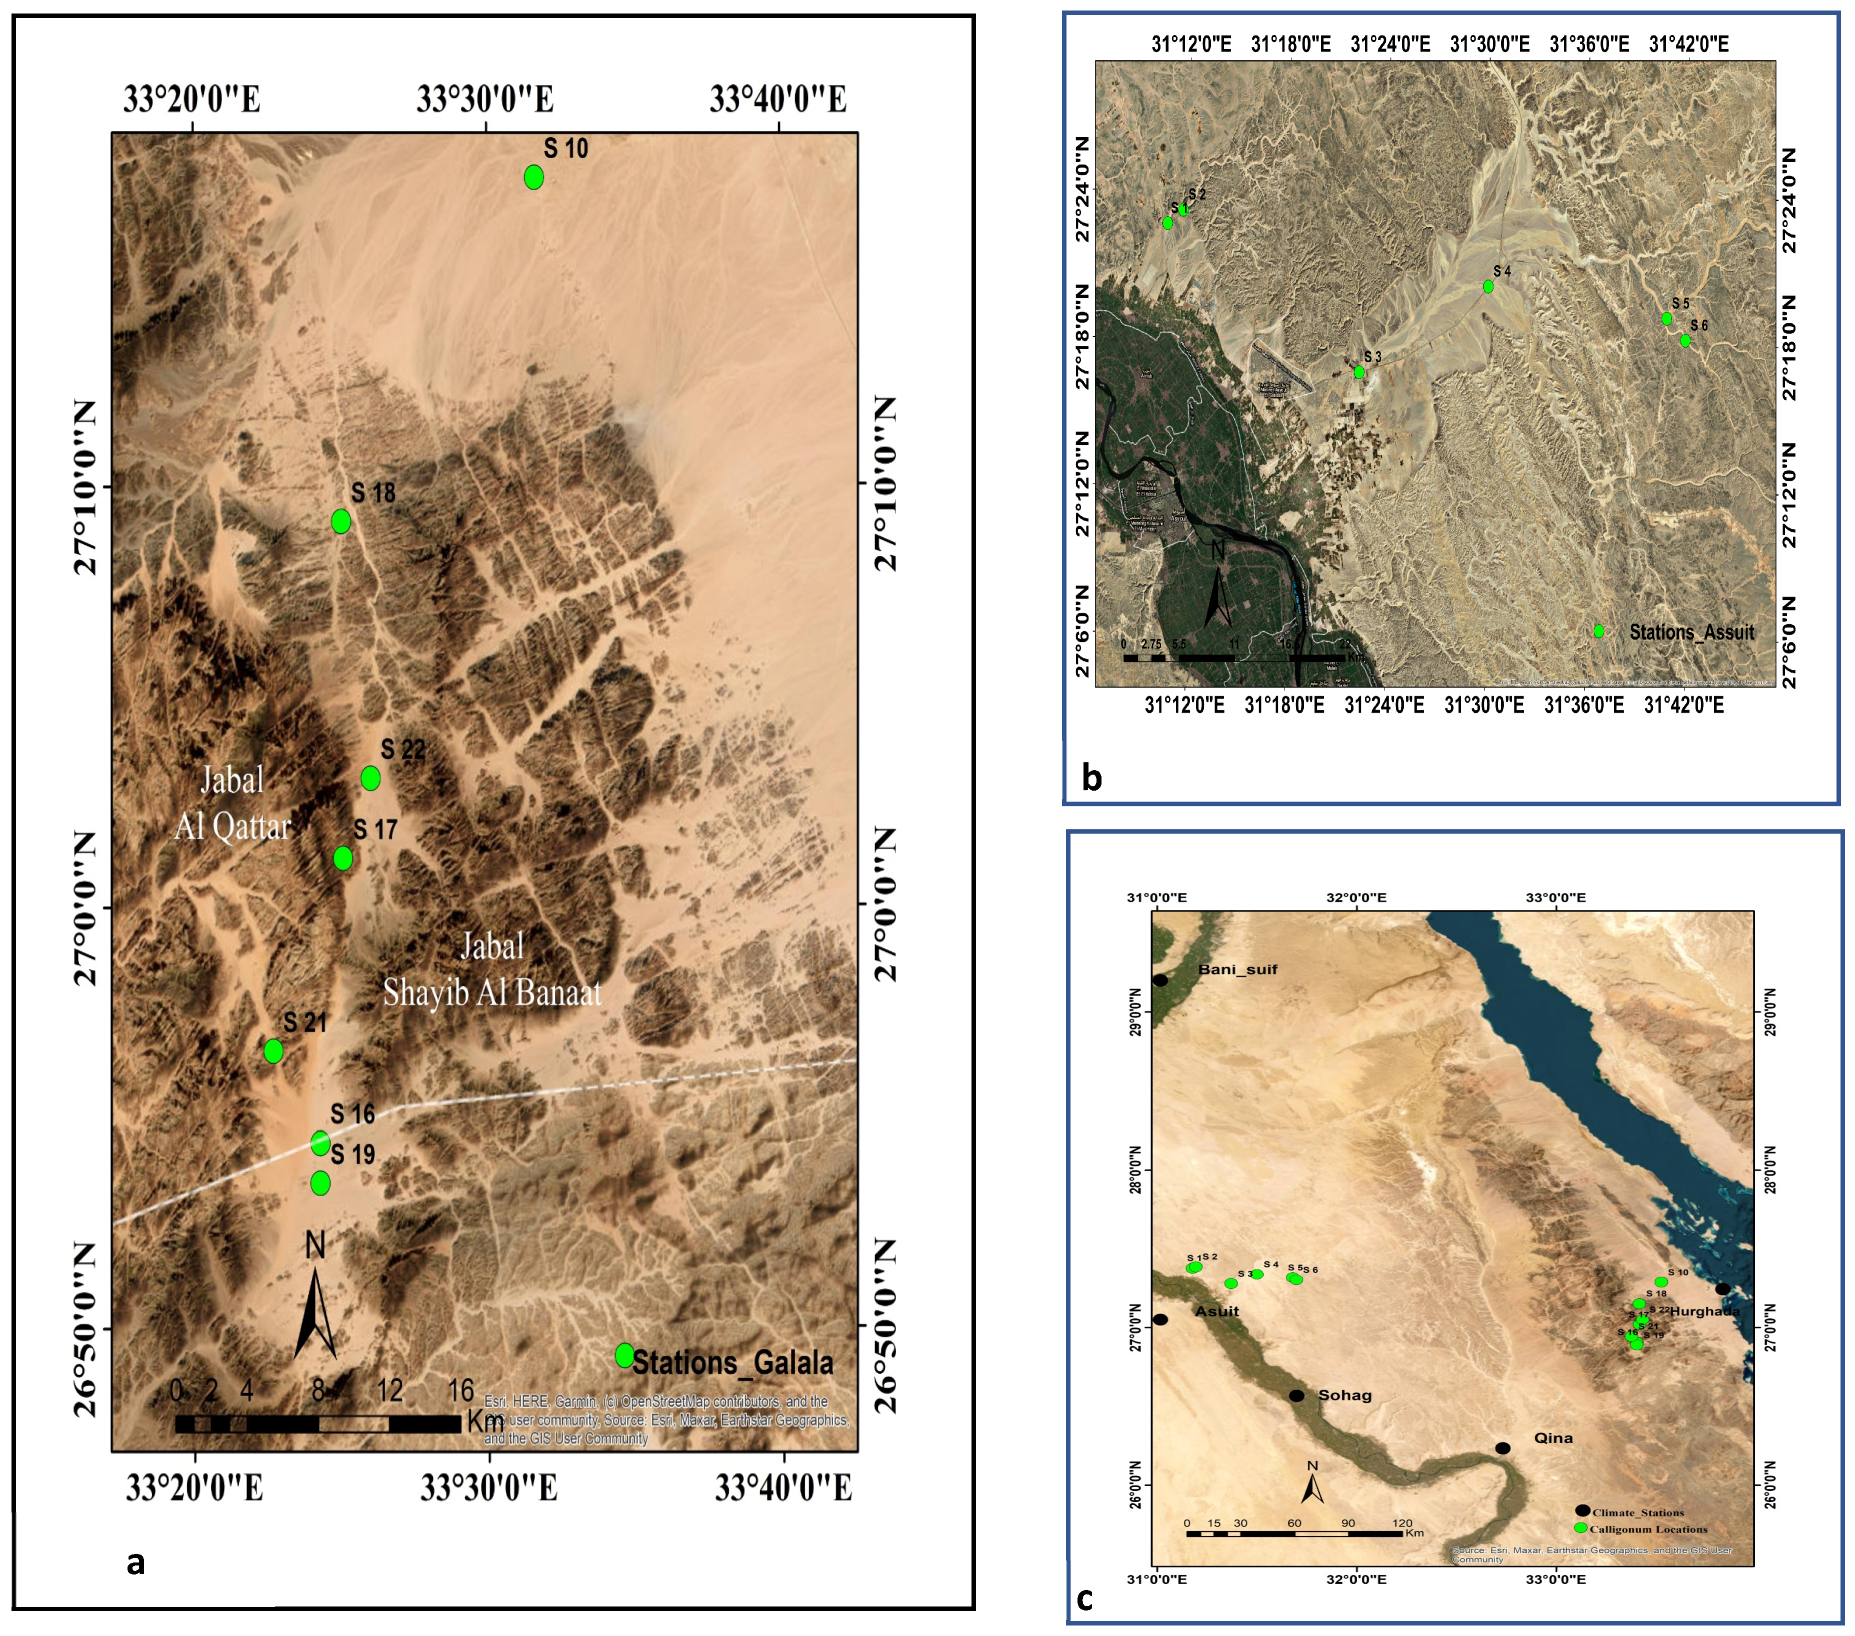
This study was conducted in two arid regions in Egypt: Wadi El-Galala in the Northern Eastern Desert and Wadi El-Assiuty in the Western Desert (
Figure 1c). These regions represent distinct geomorphological and ecological conditions suitable for examining the distribution of
C. polygonoides L., a perennial medicinal shrub native to arid zones. Satellite imagery used for map generation was obtained from the USGS Earth Explorer platform (
https://earthexplorer.usgs.gov) using Sentinel-2 MSI data. Elevation data were derived from the ASTER Global Digital Elevation Model (GDEM). A summary of all topographic, edaphic, and climatic variables used in the MCE framework is presented in
Table 1 to clarify their source, resolution, type, and ecological relevance.
2.1.1. Wadi El-Galala
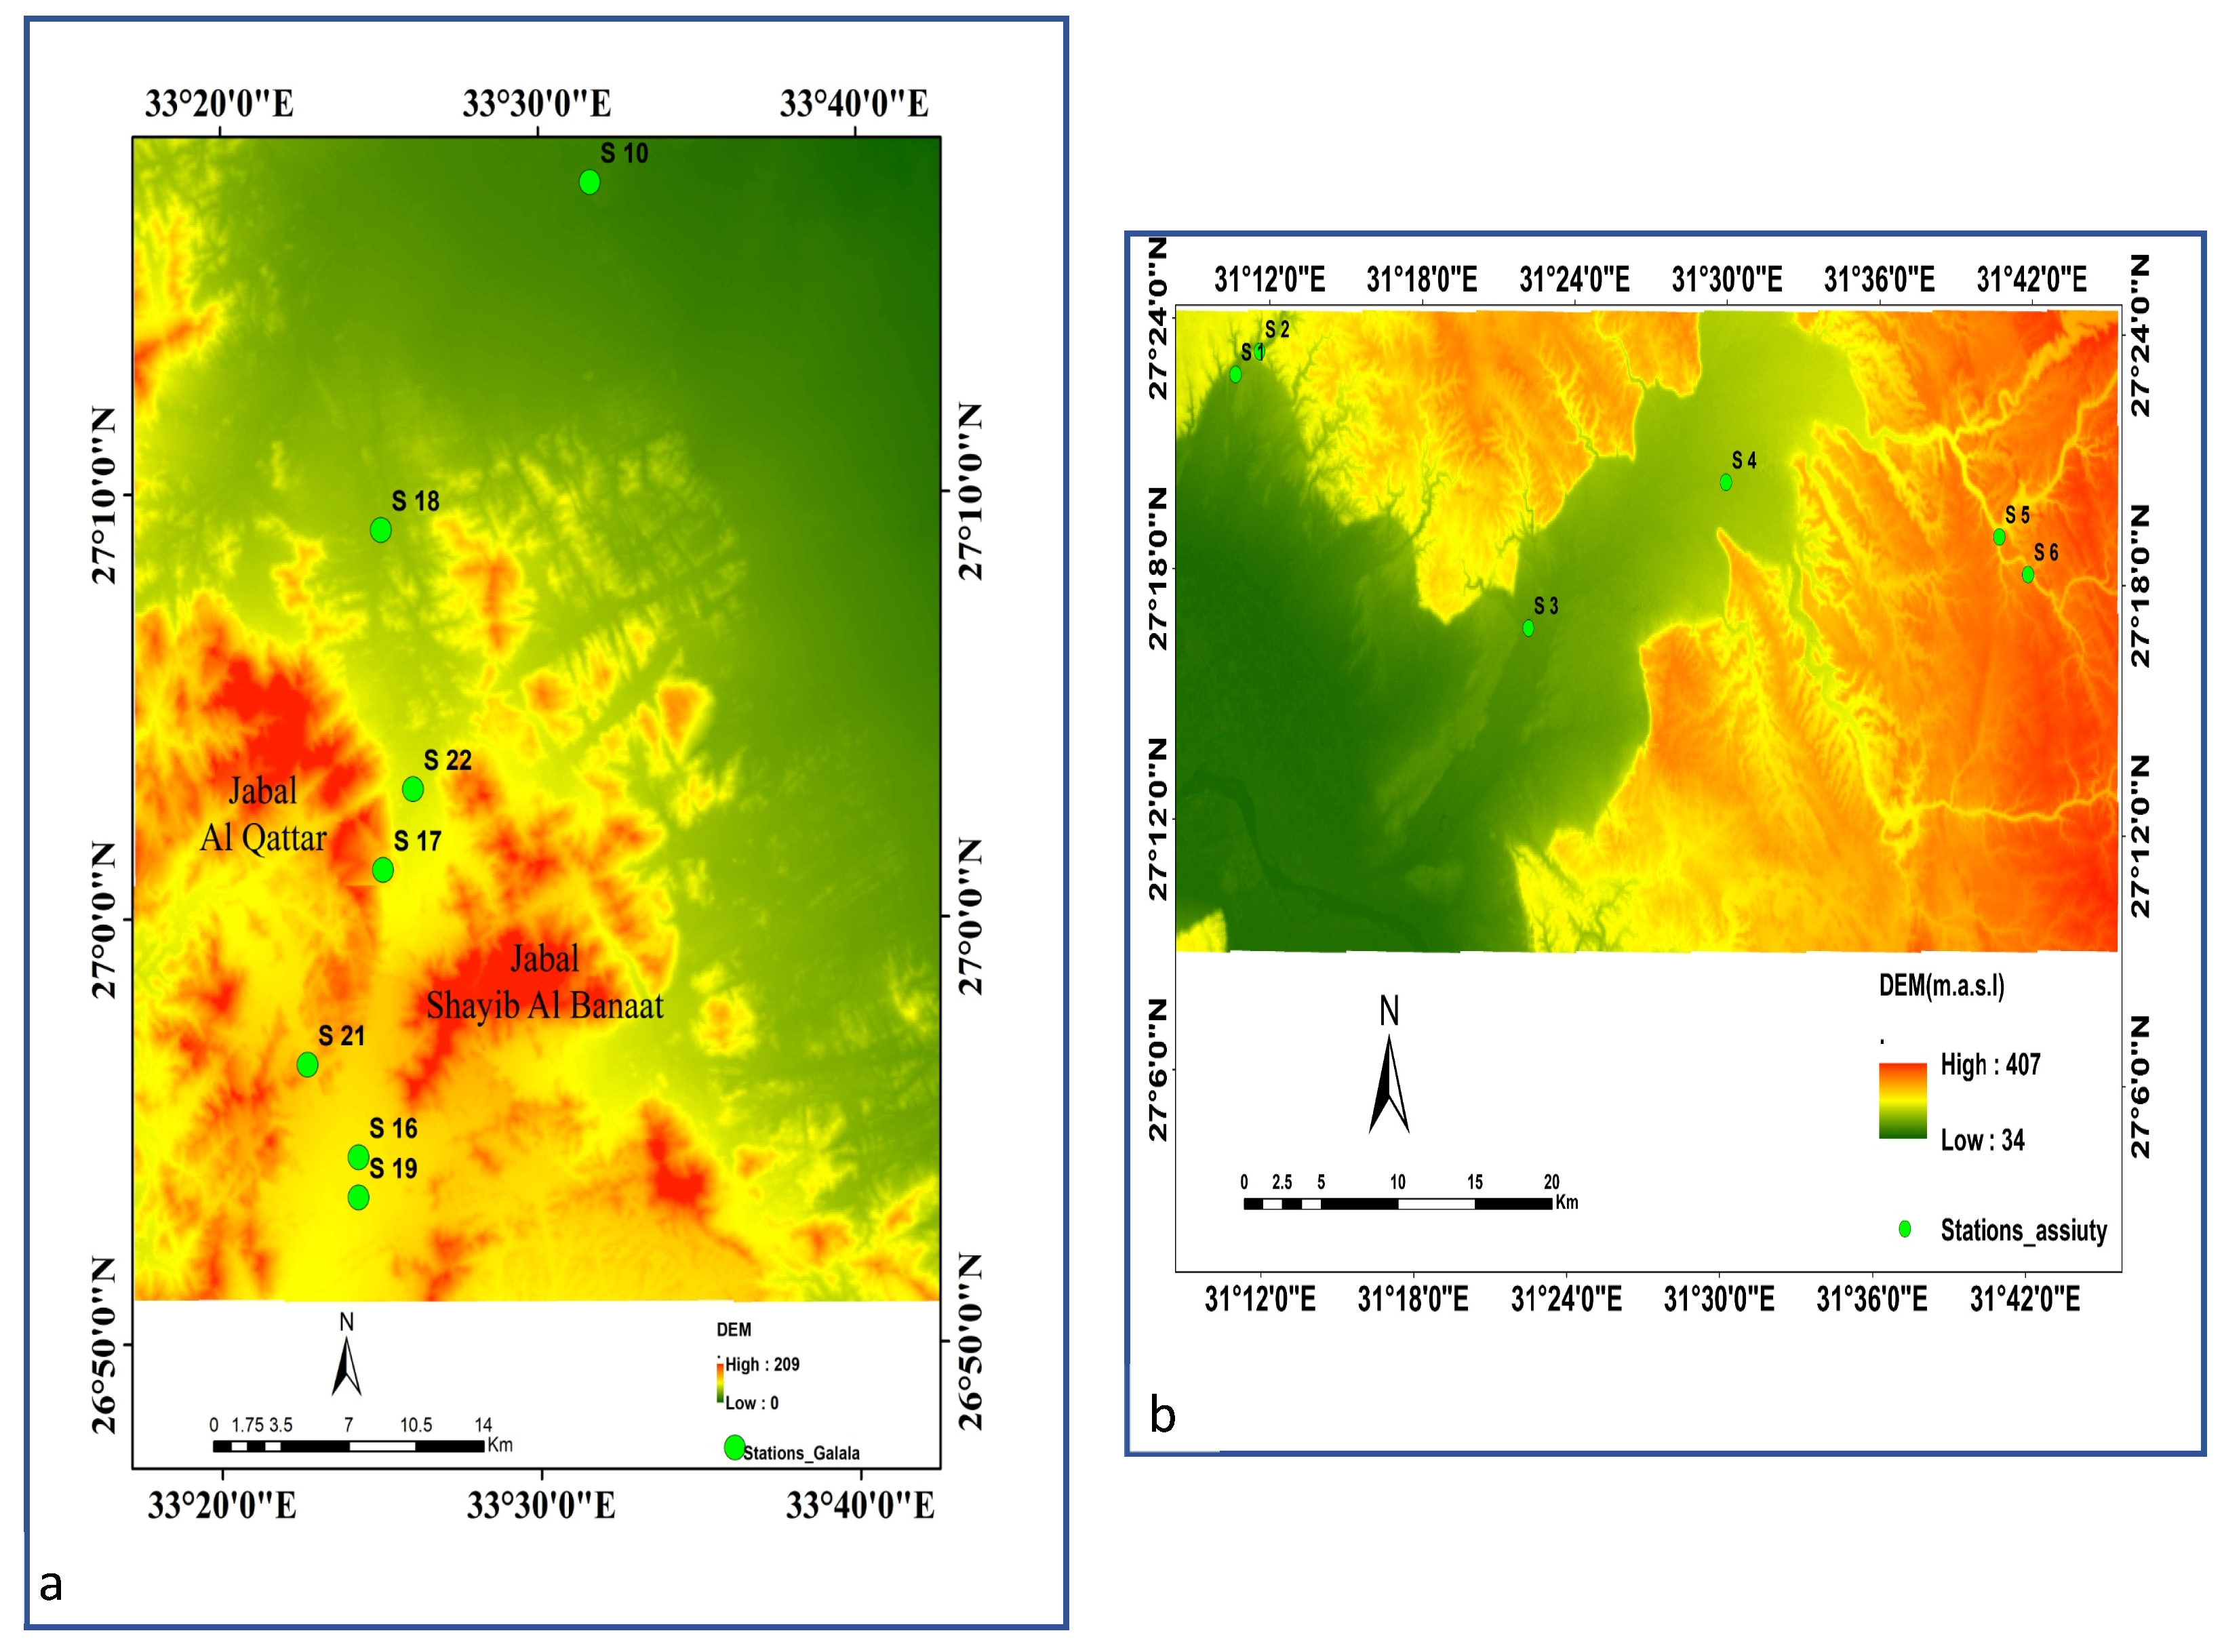
Latitude: 26°55′ N to 27°15′ N, Longitude: 33°20′ E to 33°40′ E is situated along the western escarpment of the Gulf of Suez. The area is characterized by rugged topography, mountainous terrain, and ephemeral wadis. Eight study plots (S10, S16, S17, S18, S19, S21, S22, S25) were established in this region (
Figure 1a).
2.1.2. Wadi El-Assiuty
Latitude: 27°00′ N to 27°20′ N, Longitude: 31°10′ E to 31°40′ E is located to the east of the Nile Valley near Assiut Governorate. It represents a flat to gently undulating desert area intersected by dry drainage channels. Six plots (S1, S2, S3, S4, S5, S6) were selected within this region (
Figure 1b). Both sites were chosen based on the presence of natural populations of
C. polygonoides and accessibility. Each site was georeferenced using a handheld GPS device.
2.2. Plant Sampling and Field Data Collection
Vegetation surveys were conducted during the spring season, which coincides with the peak growth period in arid environments. Fourteen plots were established in total (8 plots in Wadi El-Galala and 6 plots in Wadi El-Assiuty) to represent the main habitats where C. polygonoides occurs.
In each site, a 10 × 10 m quadrat was laid out following standard ecological sampling procedures in desert environments [
14,
15]. Within each quadrat, data were collected with a focus on
C. polygonoides:
Density: recorded as the number of C. polygonoides individuals per quadrat.
Cover percentage: visually estimated for C. polygonoides.
Associated species: the presence of other plant species in the same quadrat was noted for community context, though the target species was C. polygonoides.
GPS coordinates: recorded at the quadrat center using a handheld Garmin GPS receiver (Garmin Ltd., Olathe, KS, USA).
Site documentation: photographs were taken to describe habitat conditions.
A total of 36 individual shrubs of C. polygonoides were measured across all plots, providing the full dataset for density and cover estimation.
Soil samples were also collected from the center of each quadrat at a depth of 0–20 cm, placed in sterile polyethylene bags, and transported to the laboratory for physical and chemical analysis. The sampling depth represents the active root zone of desert shrubs and is commonly used in ecological studies of arid land vegetation [
16,
17].
2.3. Environmental Data and GIS Processing
The environmental variables used in the modeling process were grouped into three categories: topographic, edaphic (soil-related), and climatic variables.
2.3.1. Topographic Variable
Elevation was extracted from the ASTER Global Digital Elevation Model (GDEM), Version 3, with a spatial resolution of 30 m. Data were downloaded from the United States Geological Survey (USGS) Earth Explorer portal (
https://earthexplorer.usgs.gov/). The DEM was processed and analyzed in ArcGIS 10.8. Elevation values were reclassified into suitability classes based on their ecological influence on
C. polygonoides occurrence.
Wadi El-Galala
The DEM of Wadi El-Galala reveals a rugged topography with altitudinal variation ranging from approximately 120 m to over 600 m above sea level. The landscape consists of mountainous ridges, dissected wadis, and gravel plains. Higher elevations are concentrated in the southern and southeastern sectors, while the central and northern parts are characterized by relief that is more moderate.
This heterogeneity in elevation generates diverse microhabitats, influencing soil development, water infiltration, and moisture retention. C. polygonoides was most frequently observed in mid-altitude zones (250–400 m), which appear to offer optimal conditions due to better soil structure, improved water balance, and reduced surface salinity accumulation.
Wadi El-Assiuty
In contrast, the DEM of Wadi El-Assiuty (
Figure 2) shows a comparatively lower and more gently undulating terrain. The terrain is largely composed of flat sandy plains with minor undulations and isolated rocky outcrops.
Although elevation variation is limited, even subtle topographic changes affect drainage patterns and salt accumulation. C. polygonoides was recorded mainly at slightly elevated positions (~180–210 m), likely as a result of there being better drainage conditions and reduced surface salt crust formation in this area compared to lower-lying flats.
2.3.2. Edaphic Variables
Composite soil samples were collected from the surface layer (0–20 cm), representing the active root zone of the studied shrubs. Samples were air-dried, sieved through a 2 mm mesh, and analyzed for EC, pH, and total soluble salts following standard procedures:
Electrical Conductivity (EC): EC was measured in a 1:5 soil–water suspension using a conductivity meter and expressed in dS m
−1 [
18]. EC is widely used as an indicator of soil salinity, which is a major constraint for plant establishment in arid and semi-arid environments [
19].
Soil pH: Soil pH was determined in the 1:2.5 soil–water extract using a calibrated digital pH meter [
17,
20]. Soil pH strongly affects nutrient solubility and availability and has a direct impact on the performance of desert shrubs.
Electrical conductivity (EC) was measured using the EUTECH conductivity meter (Singapore-Con 2700, serial number 2370351, Eutech Instruments, Singapore), and the HANNA pH meter (Romania/HANNA/HI2211, Hanna Instruments, Cluj-Napoca, Romania). To measure the pH, serial number H0078410 was utilized.
The instrument has an accuracy of ±1% full scale, and calibration was performed before each batch of measurements using standard KCl solutions (0.01, 0.1, and 1 dS m−1).
Three replicates were analyzed for each soil sample to minimize measurement variability.
Total Soluble Salts (TSSs): TSS was estimated by evaporating the filtrate of the soil extract at 105 °C to a constant weight. This measure reflects the concentration of soluble ions in the soil solution, which plays a decisive role in vegetation patterns in arid lands FAO [
16,
21].
Each TSS measurement was performed in triplicate and reported as the mean value to reduce analytical error. Soil texture was determined using the hydrometer method (Bouyoucos method), following standard USDA procedures to classify samples into sand, silt, and clay fractions. Texture measurements were conducted in duplicate for quality control.
These three variables were selected because salinity, pH, and soluble salts represent the most critical edaphic drivers governing the distribution and ecological limits of desert vegetation in Egypt.
Although soil texture was determined during laboratory analysis to characterize the physical properties of the sampling sites, it was not included in the GIS-based habitat suitability model because the model was designed to incorporate the principal environmental variables considered to have the greatest influence on the distribution of C. polygonoides in the study area. Future studies may further investigate the contribution of soil texture using expanded spatial datasets.
2.4. Climatic Variables
Climatic data, including average temperature, annual rainfall, relative humidity, and evaporation, were obtained from eight meteorological stations located near the study areas: Suez, Beni Suef, Minya, Assiut, Sohag, Qena, Hurghada, and Al-Quseir. The station names, geographic coordinates, and data source are provided in
Supplementary Table S1.
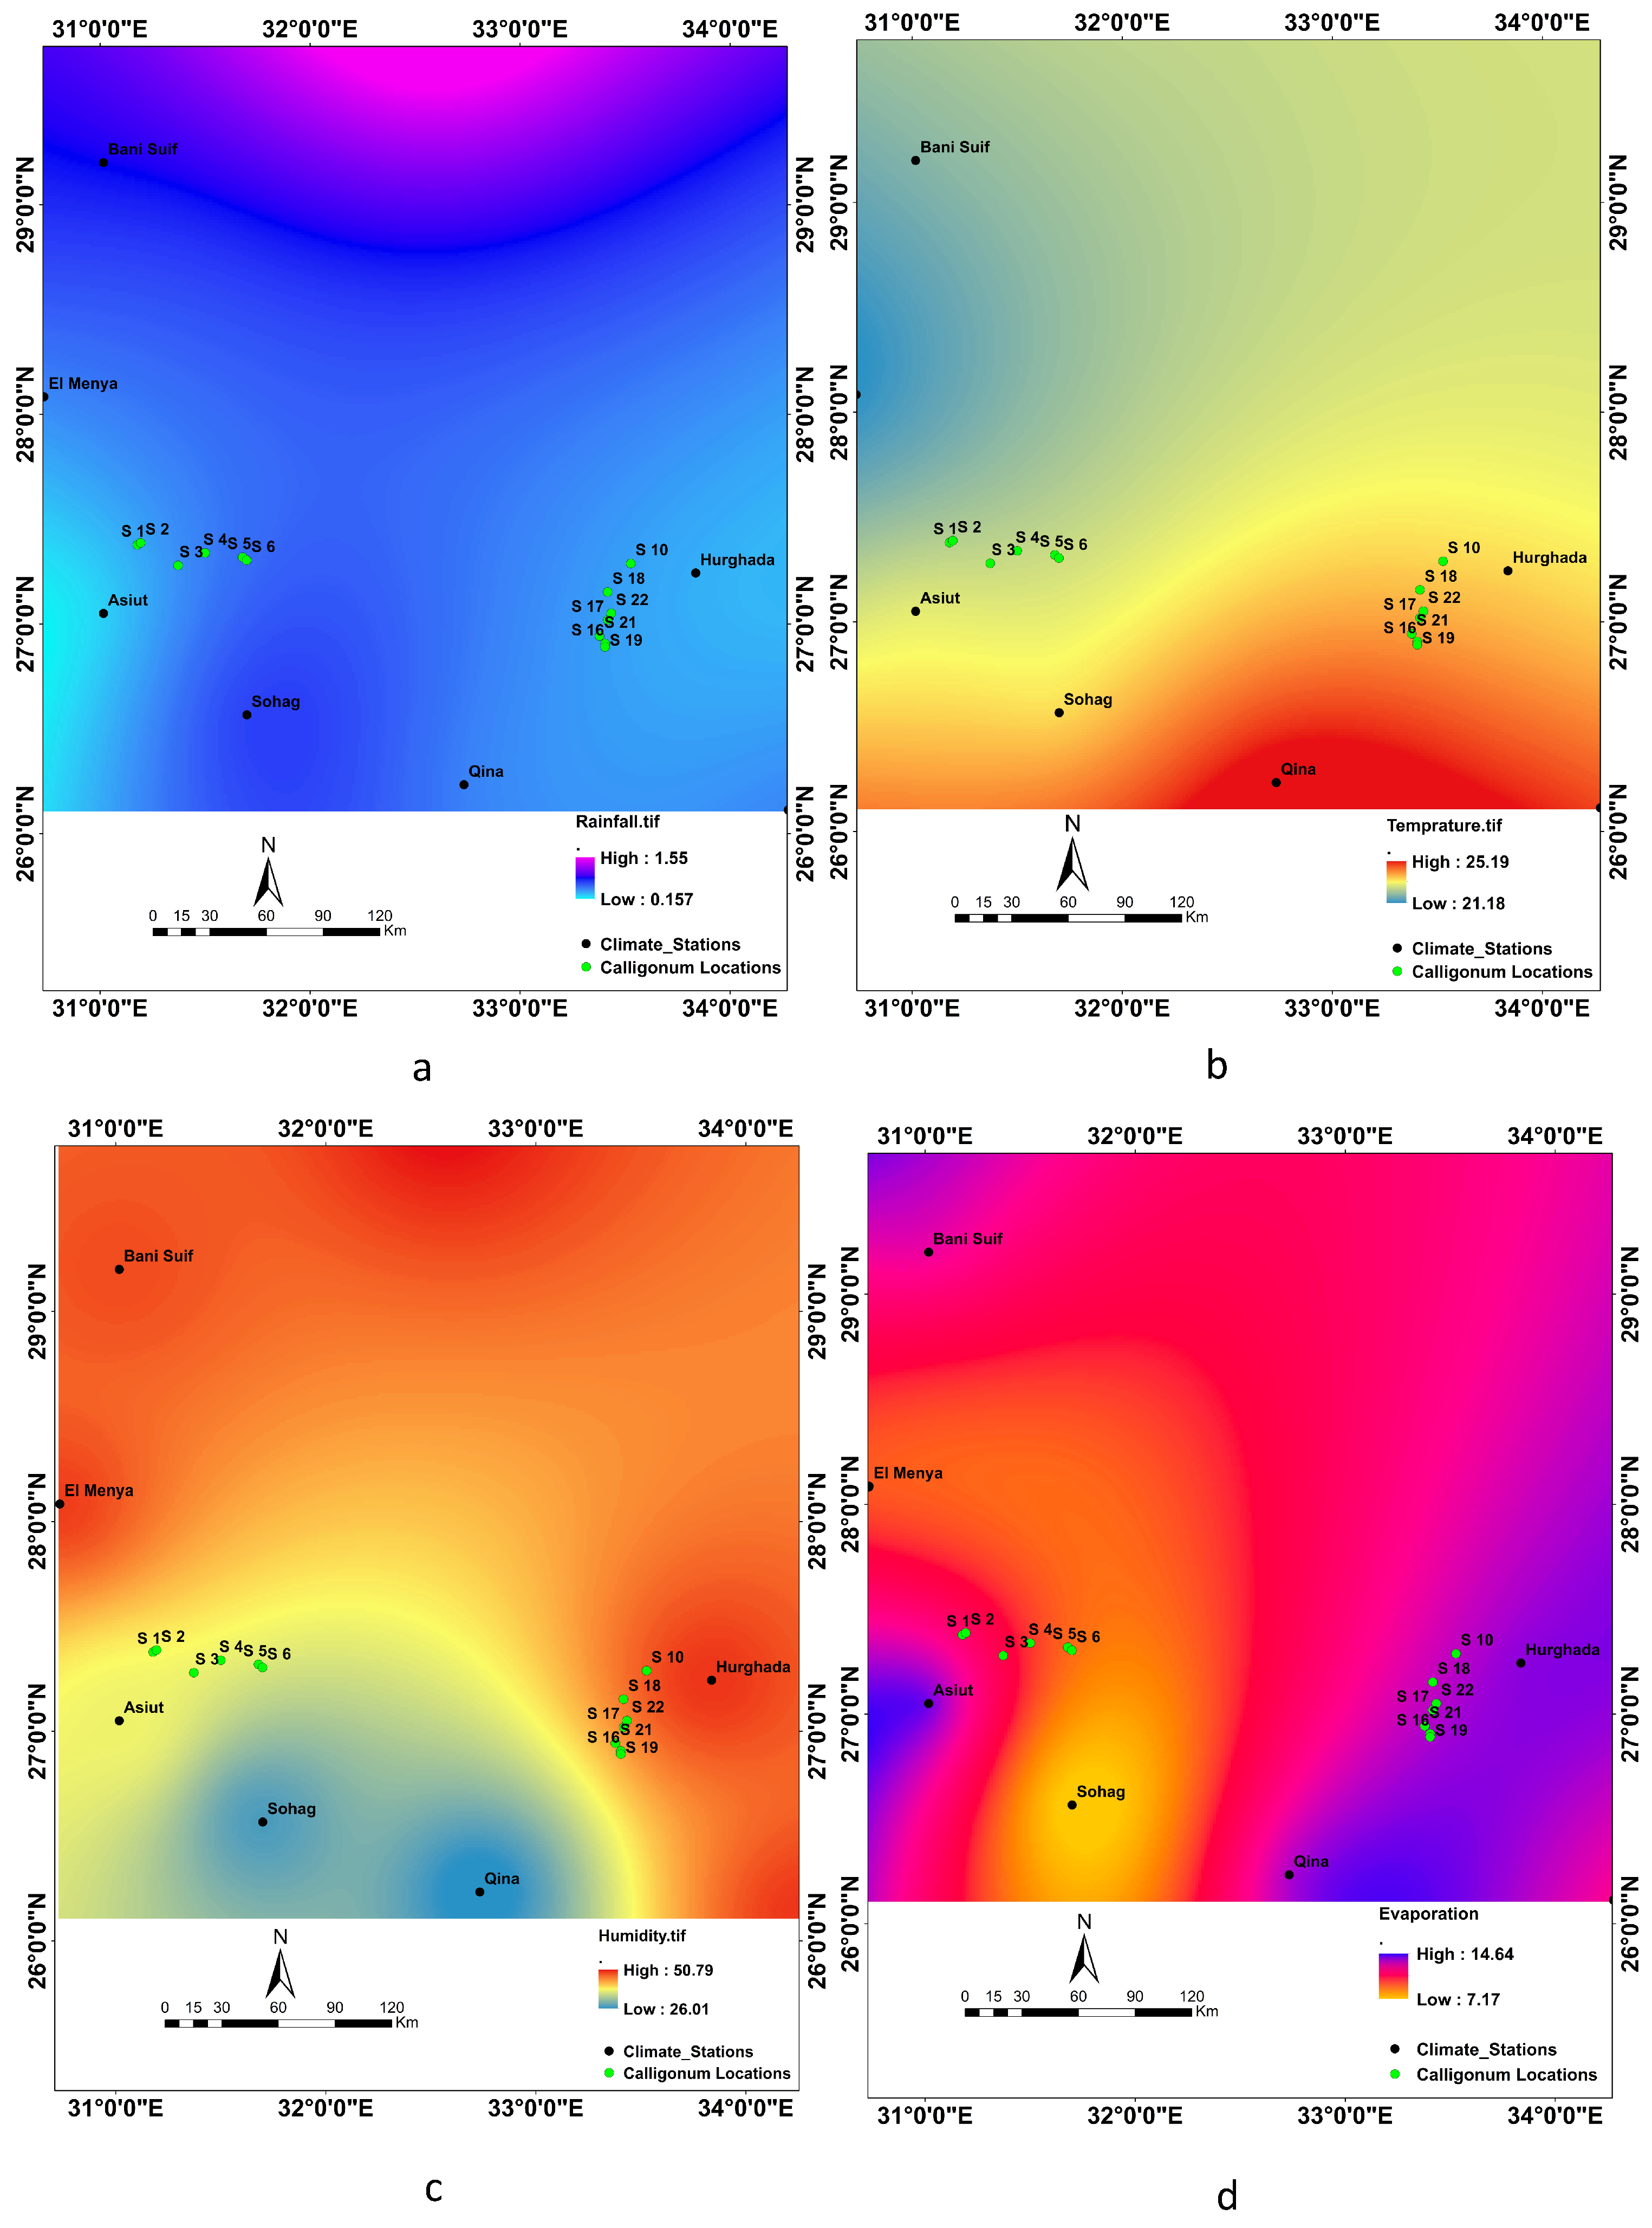
The climatic data were interpolated using the Inverse Distance Weighting (IDW) method in ArcGIS 10.8 to generate continuous raster layers (
Figure 2) [
22,
23].
The interpolated climatic layers were resampled to 30 m resolution and clipped to the study area to ensure spatial compatibility with the DEM and soil layers used in the GIS-based habitat suitability model. Rainfall and temperature were retained as climatic predictor variables in the final weighted overlay model because they represent the main water-availability and thermal constraints affecting desert vegetation distribution. Relative humidity and evaporation were used only for background climatic and aridity characterization and were not included as predictor layers in the final model to avoid redundancy with rainfall and temperature.
2.5. Spatial Interpolation
All environmental layers were prepared as continuous raster datasets before their use in the multi-criteria evaluation. For the point-based variables, including soil electrical conductivity (EC), soil pH, total soluble salts (TSSs), and the climatic records, spatial interpolation was performed using the Inverse Distance Weighting (IDW) method in ArcGIS 10.8 (ESRI, Redlands, CA, USA). A power of 2 was applied to control the effect of distance, and each layer was resampled to 30 m to match the resolution of the topographic data.
The topographic variable (DEM) was obtained directly from the ASTER Global DEM (30 m resolution) and reclassified into elevation classes suitable for habitat analysis. This ensured that all datasets, whether interpolated or directly derived, were represented at the same spatial resolution and extent.
The resulting raster maps for EC, pH, TSS, climatic parameters, and the reclassified DEM were then standardized into suitability classes and integrated within the weighted overlay analysis to generate the habitat suitability maps for C. polygonoides.
2.6. Habitat Suitability Modeling
A GIS-based multi-criteria evaluation (MCE) technique was employed to identify potential suitable habitats for C. polygonoides within the two target regions, Wadi El-Galala and Wadi El-Assiuty. A knowledge-driven MCE approach was used to assign weights to the environmental variables according to their relative ecological relevance to C. polygonoides distribution in arid wadi ecosystems. The weighting scheme was based on published literature on desert vegetation ecology, field observations, and expert ecological judgment. Greater weights were assigned to elevation, EC, and TSS because topography and soil salinity are important factors affecting runoff redistribution, soil moisture availability, drainage conditions, rooting environment, and shrub establishment in arid landscapes. Lower weights were assigned to rainfall, temperature, and soil pH because these variables were considered broader environmental constraints or showed comparatively narrower spatial variation within the study areas. All weights were normalized to sum to one before applying the weighted overlay procedure. The final normalized weights used in the model were: elevation (0.30), EC (0.25), TSS (0.20), rainfall (0.10), temperature (0.10), and soil pH (0.05).
The study considered a range of environmental and ecological variables, including elevation, soil electrical conductivity (EC), soil pH, total soluble salts (TSSs), vegetation cover, plant density, temperature, rainfall, relative humidity, and evaporation. However, the final weighted overlay model incorporated only six predictor variables: elevation, EC, TSS, rainfall, temperature, and soil pH. Vegetation cover and plant density were retained as ecological descriptors, while relative humidity and evaporation were used for background environmental characterization; these variables were not included as predictor layers in the final model.
To clarify the role of each measured or modeled variable, the variables were classified as predictor variables, descriptive variables, or variables used for spatial agreement assessment (
Table 2).
All input predictor layers were prepared in raster format, resampled to a uniform spatial resolution, and projected to a common coordinate system. Each predictor variable was reclassified into three suitability classes: high (1), moderate (2), and low (3), based on field measurements, ecological knowledge of the species, and values reported in previous studies. The reclassified and weighted predictor layers were integrated using the Weighted Overlay Analysis tool in ArcGIS to produce the final habitat suitability maps, which categorized the landscape into three levels of suitability: high, moderate, and low.
Occurrence records were not used as predictor variables in model construction. They were used only to assess spatial agreement between observed C. polygonoides locations and the predicted suitability classes. Therefore, the suitability model was generated independently from the occurrence points used for spatial agreement assessment.
Because absence records and independent validation datasets were not available, the suitability outputs were not evaluated using formal accuracy assessment metrics. Instead, the observed occurrence records were overlaid on the final habitat suitability maps to assess spatial agreement between field observations and predicted suitability classes. This procedure was used as a field-based consistency check rather than a statistical validation of model accuracy.
2.7. Spectroscopic Measurements
To provide complementary information to the spatial analysis, spectral reflectance measurements were obtained from fresh leaf samples of C. polygonoides collected from each sampling site in Wadi El-Galala and Wadi El-Assiuty. A portable ASD FieldSpec® spectroradiometer (Analytical Spectral Devices (ASD), Longmont, CO, USA), covering a wavelength range of 350–2500 nm, was used for laboratory-based hyperspectral analysis of the leaf optical properties.
Prior to spectral acquisition, all measurements were corrected for instrument noise through dark current correction, followed by white reference calibration using a Spectralon® panel (Labsphere, Inc., North Sutton, NH, USA) to ensure accurate reflectance scaling.
Raw spectra were then pre-processed by removing noisy regions at the sensor limits (350–399 nm and 2400–2500 nm) and applying a Savitzky–Golay smoothing filter to minimize high-frequency noise while preserving diagnostic spectral features.
All measurements were conducted under controlled lighting conditions in the laboratory within 24 h of collection. For each sample, three replicate scans were performed, and the average reflectance spectrum was calculated to represent the spectral profile at each site.
Spectral measurements were obtained from 15 individual shrubs, resulting in 45 hyperspectral scans (three replicates per sample).
The resulting spectral profiles were used to describe leaf optical properties across the two wadis and to provide complementary information on plant condition under different habitat settings. They were not used as predictor variables in the GIS-based habitat suitability model or as formal validation of the model outputs.
The complete datasets generated during field investigations, laboratory analyses, hyperspectral measurements, and GIS processing are provided as
Supplementary Material accompanying this manuscript to enhance transparency and facilitate the reproducibility of the study.
3. Results
3.1. Vegetation Cover and Density
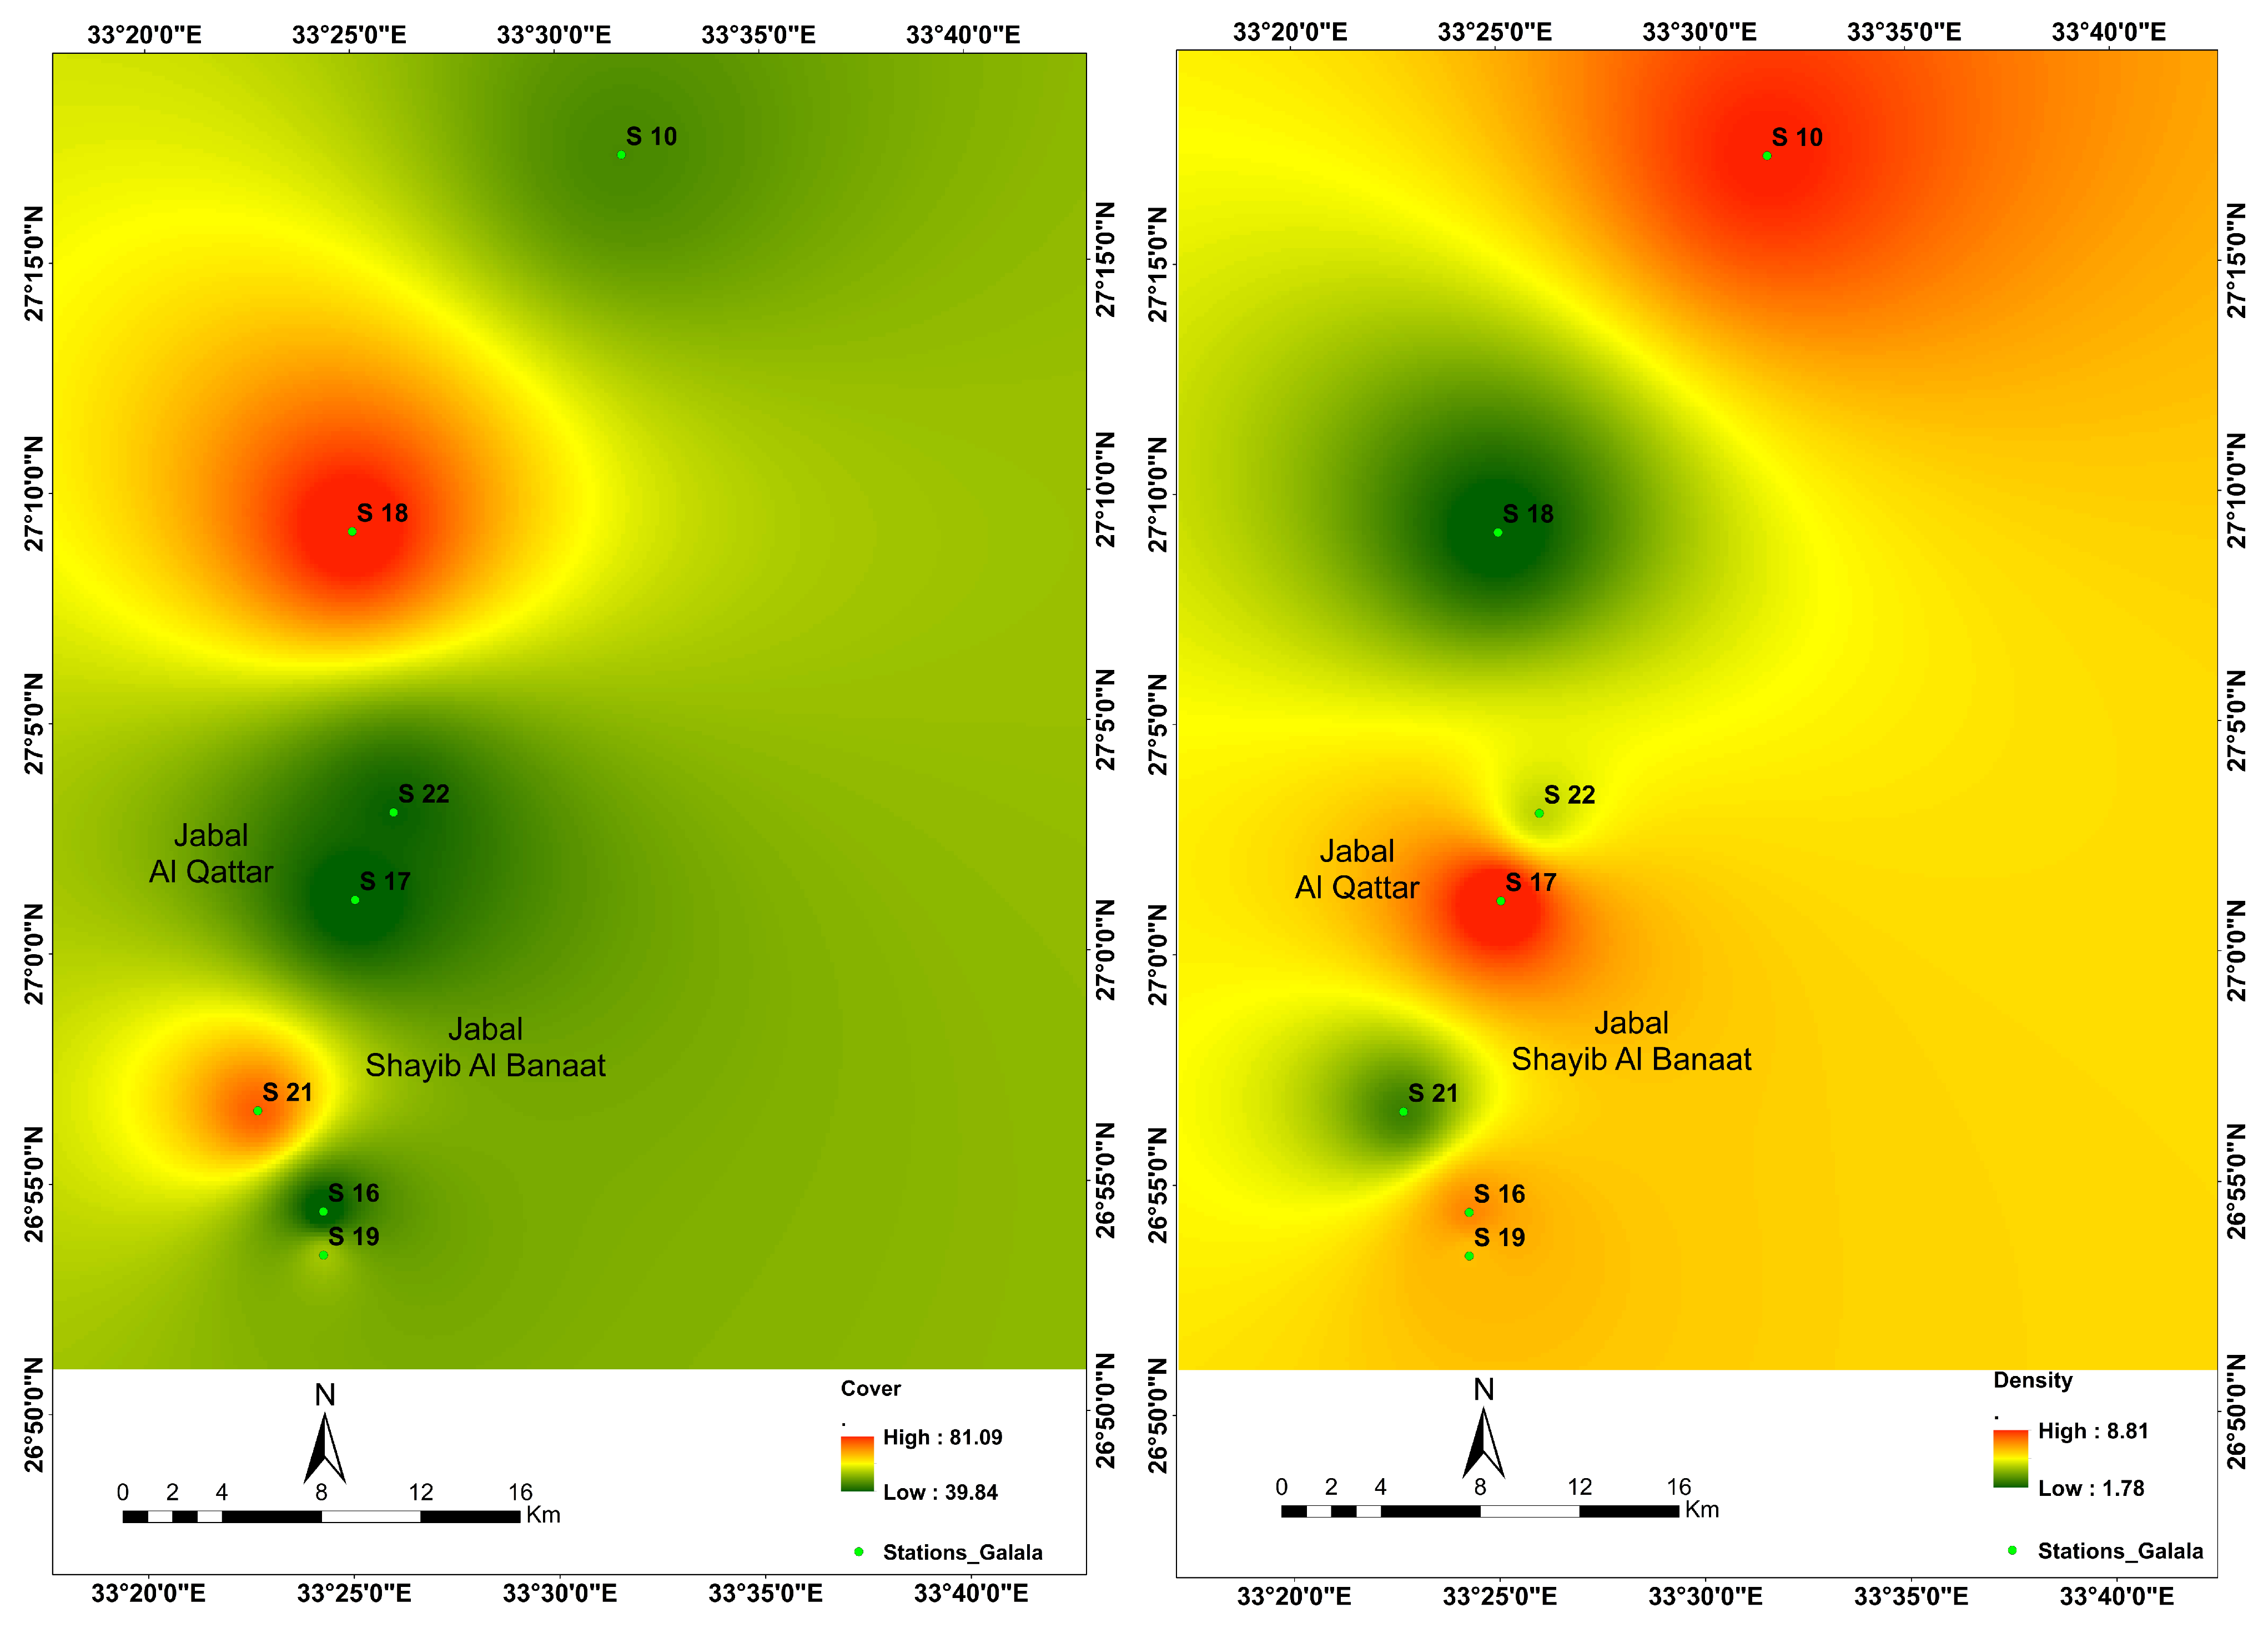
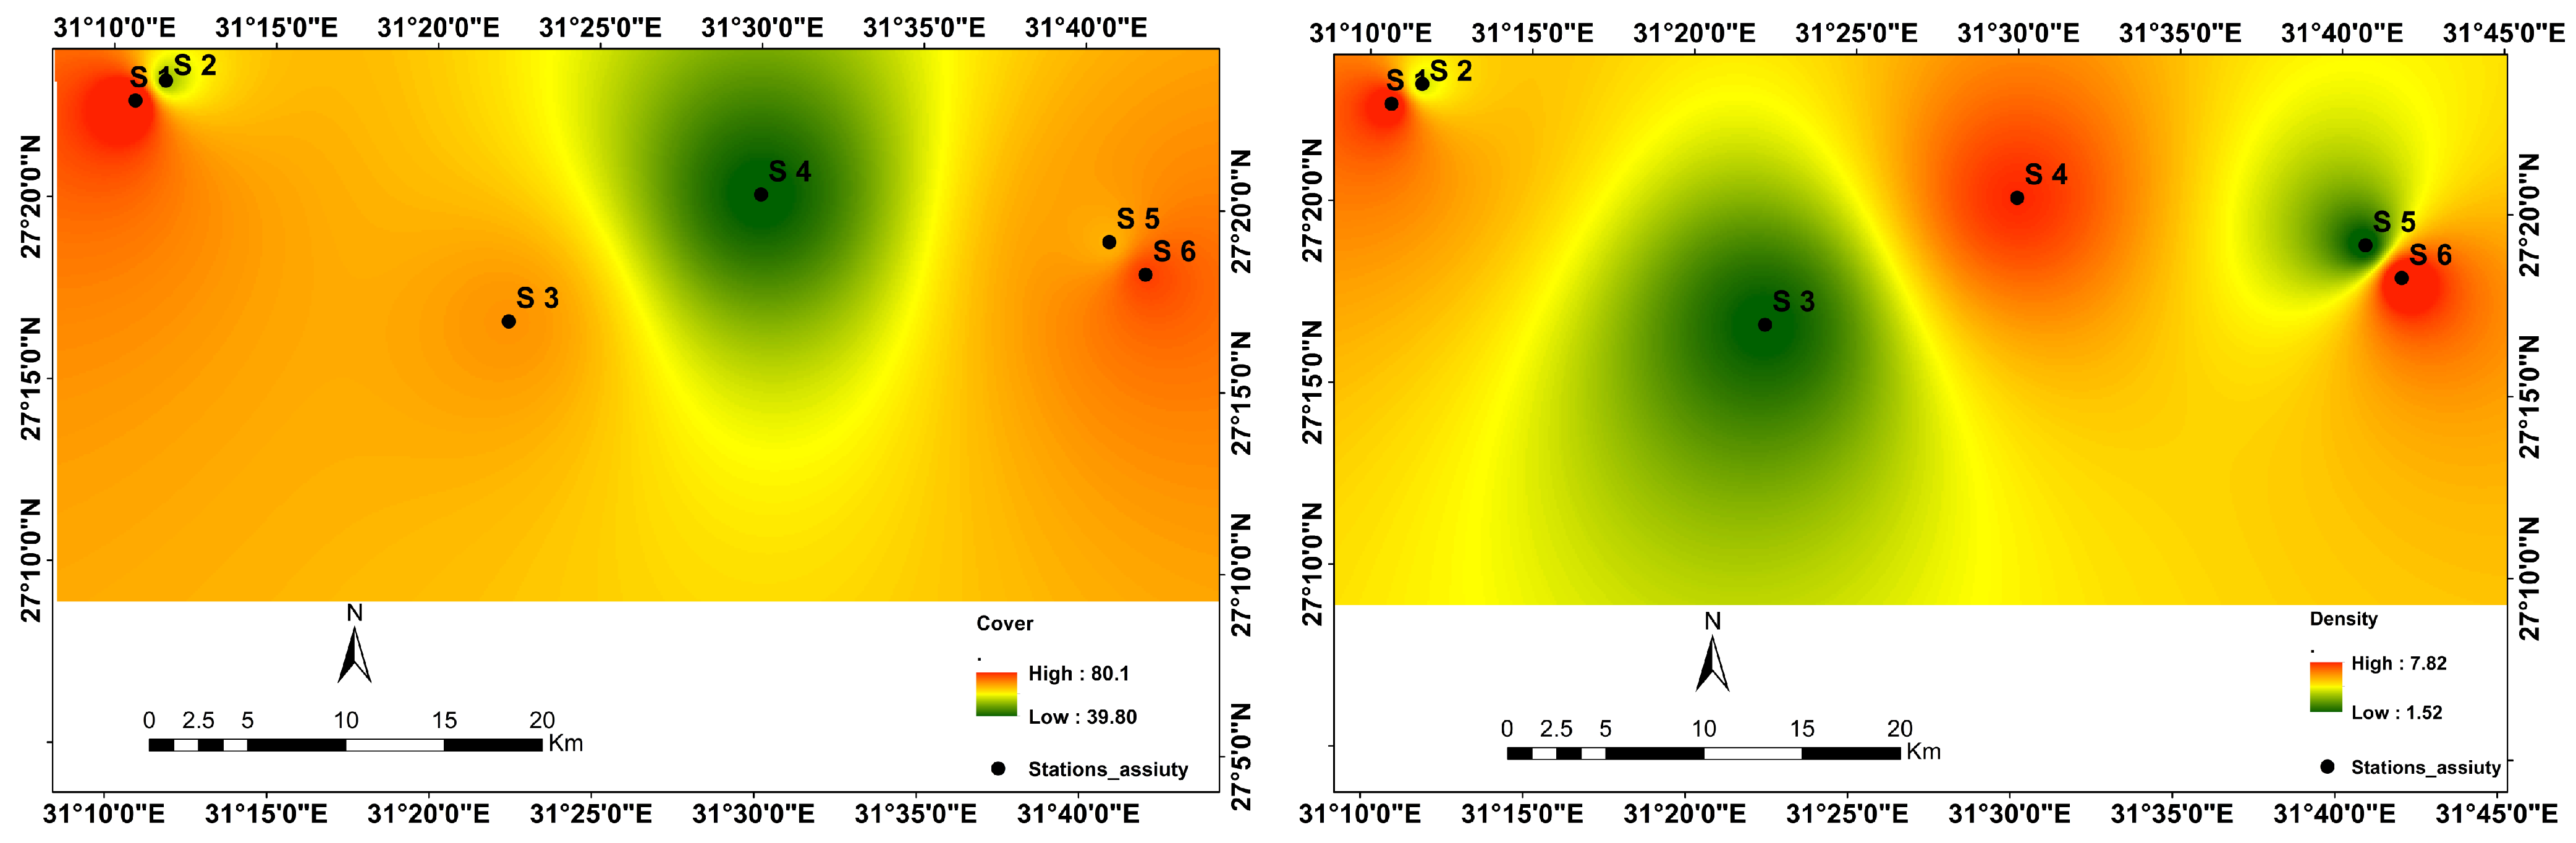
The spatial distribution of
C. polygonoides cover and density showed descriptive differences between the two studied wadis (
Figure 3 and
Figure 4). In Wadi El-Galala,
C. polygonoides showed relatively higher density values in the mid-southern sector of the valley, particularly around sampling points S16, S19, and S21. These areas recorded more than six individuals per 100 m
2, suggesting more favorable local habitat conditions for the species. In contrast, the northern sites, such as S10, showed sparse vegetation, with fewer than two individuals per 100 m
2.
Vegetation cover in Wadi El-Galala showed a similar descriptive pattern, with peak canopy coverage (>40%) observed along the central transect, where moderate elevation and relatively lower soil salinity were recorded (
Figure 3). These comparisons are presented descriptively because the limited number of field plots may not support robust statistical significance testing between sectors or wadis.
On average, vegetation cover in Wadi El-Galala reached 32.6 ± 10.4%, which is more than double the mean cover recorded in Wadi El-Assiuty (14.8 ± 5.2%). Similarly, plant density showed a descriptive contrast between the two wadis, with mean values of 5.1 ± 1.9 individuals/100 m2 in Wadi El-Galala compared to 3.0 ± 1.1 individuals/100 m2 in Wadi El-Assiuty.
These descriptive differences suggest that Wadi El-Galala may support denser and more continuous stands of C. polygonoides under the sampled conditions.
In contrast, Wadi El-Assiuty displayed more homogenous but overall lower values of cover and density (
Figure 4). Sampling sites S1 to S3 recorded moderate density (3–5 individuals per 100 m
2), while sites S4 to S6 showed minimal presence of the species. Vegetation cover across this wadi remained under 20% in most locations, reflecting less favorable growing conditions, possibly due to higher salinity or limited soil depth.
Overall, the vegetation cover and density patterns were broadly consistent with the environmental gradients observed across the two wadis and with the subsequent habitat suitability outputs.
3.2. Topographic Characteristics (Digital Elevation Model—DEM)
The Digital Elevation Model (DEM) showed clear topographic contrasts between the two studied wadis (
Figure 5). Wadi El-Galala exhibited greater topographic heterogeneity, with elevations ranging from 178 to 666 m a.s.l. Higher elevations dominated the southeastern and central sectors, while lower altitudes occurred toward the northern and western margins (
Figure 5a). These topographic variations may influence slope, runoff behavior, drainage patterns, and microhabitat formation. In contrast, Wadi El-Assiuty exhibited a lower and more homogeneous topography, with elevations ranging from 87 to 331 m a.s.l. The landscape is predominantly characterized by flat to gently undulating terrain, with minor elevation changes concentrated in the southern sector (
Figure 5b). Such limited topographic variability may reduce spatial heterogeneity in soil moisture and drainage conditions. The distribution patterns of
C. polygonoides were generally associated with these topographic gradients. In Wadi El-Galala, most individuals were concentrated within mid-elevation zones, approximately 250–400 m a.s.l., which corresponded with areas of relatively higher vegetation cover and density. In Wadi El-Assiuty, the lower and more homogeneous elevation range was associated with more uniform and generally lower vegetation cover and density values.
3.3. Soil Physicochemical Properties
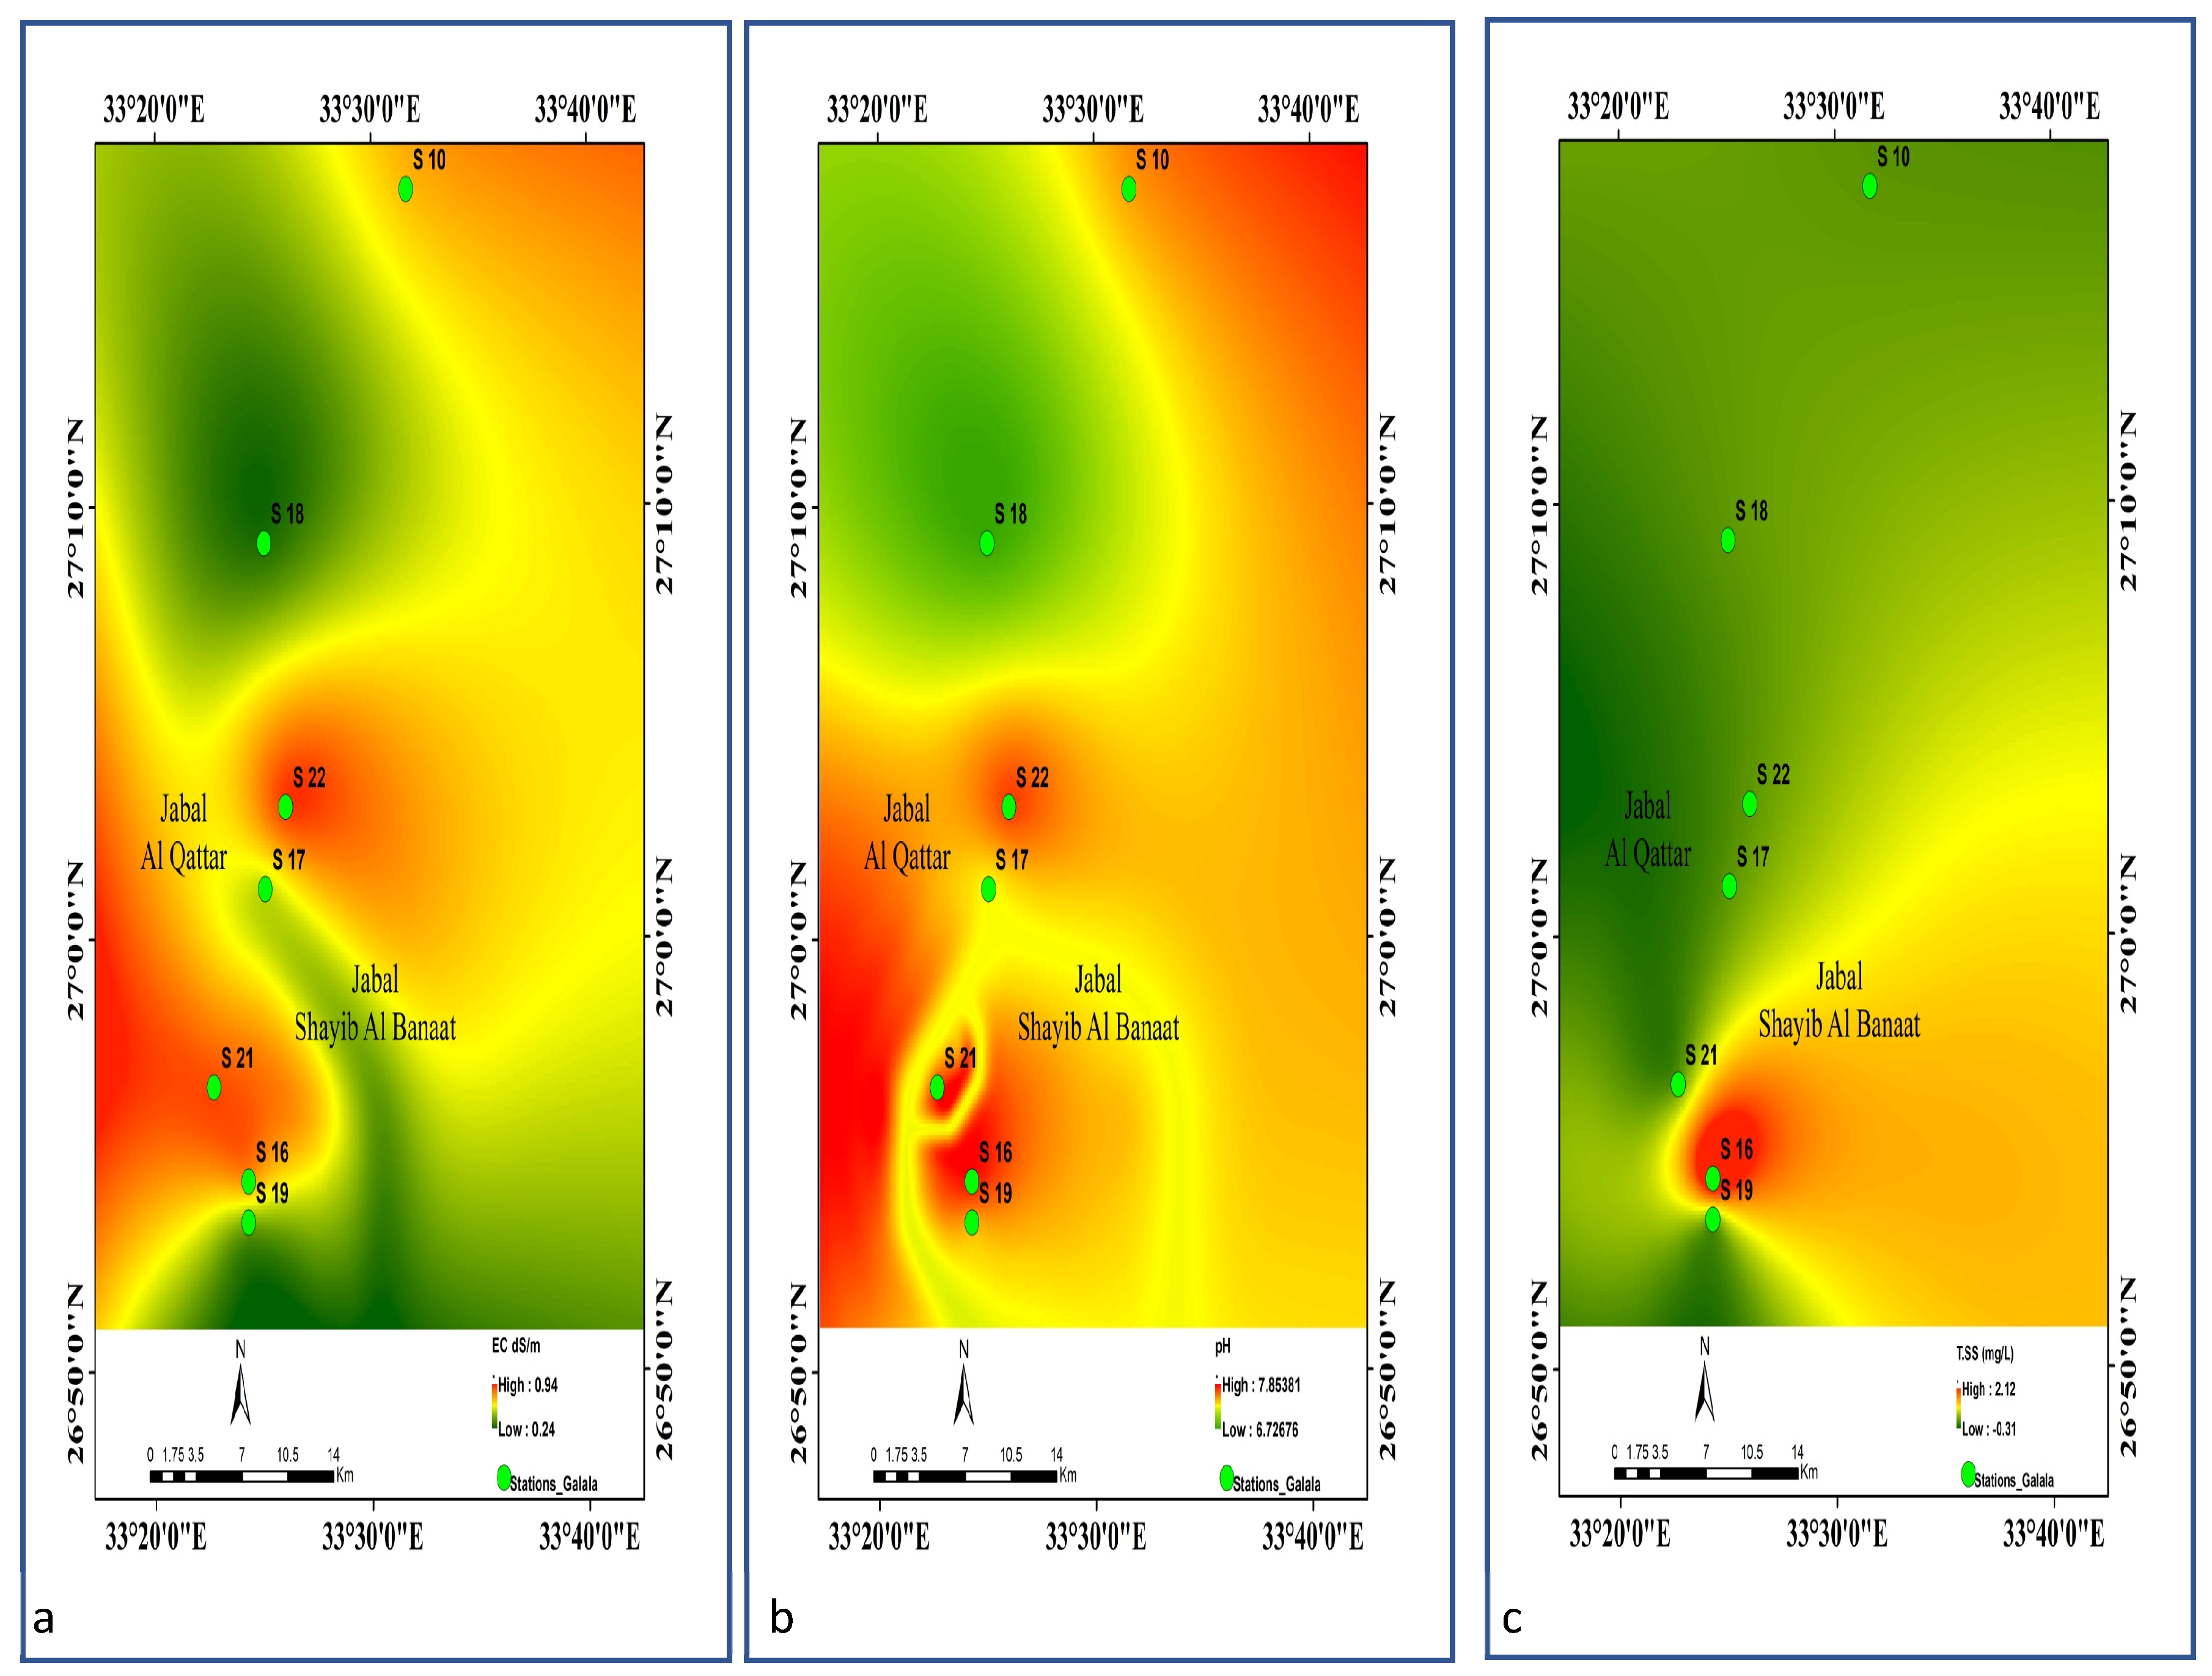
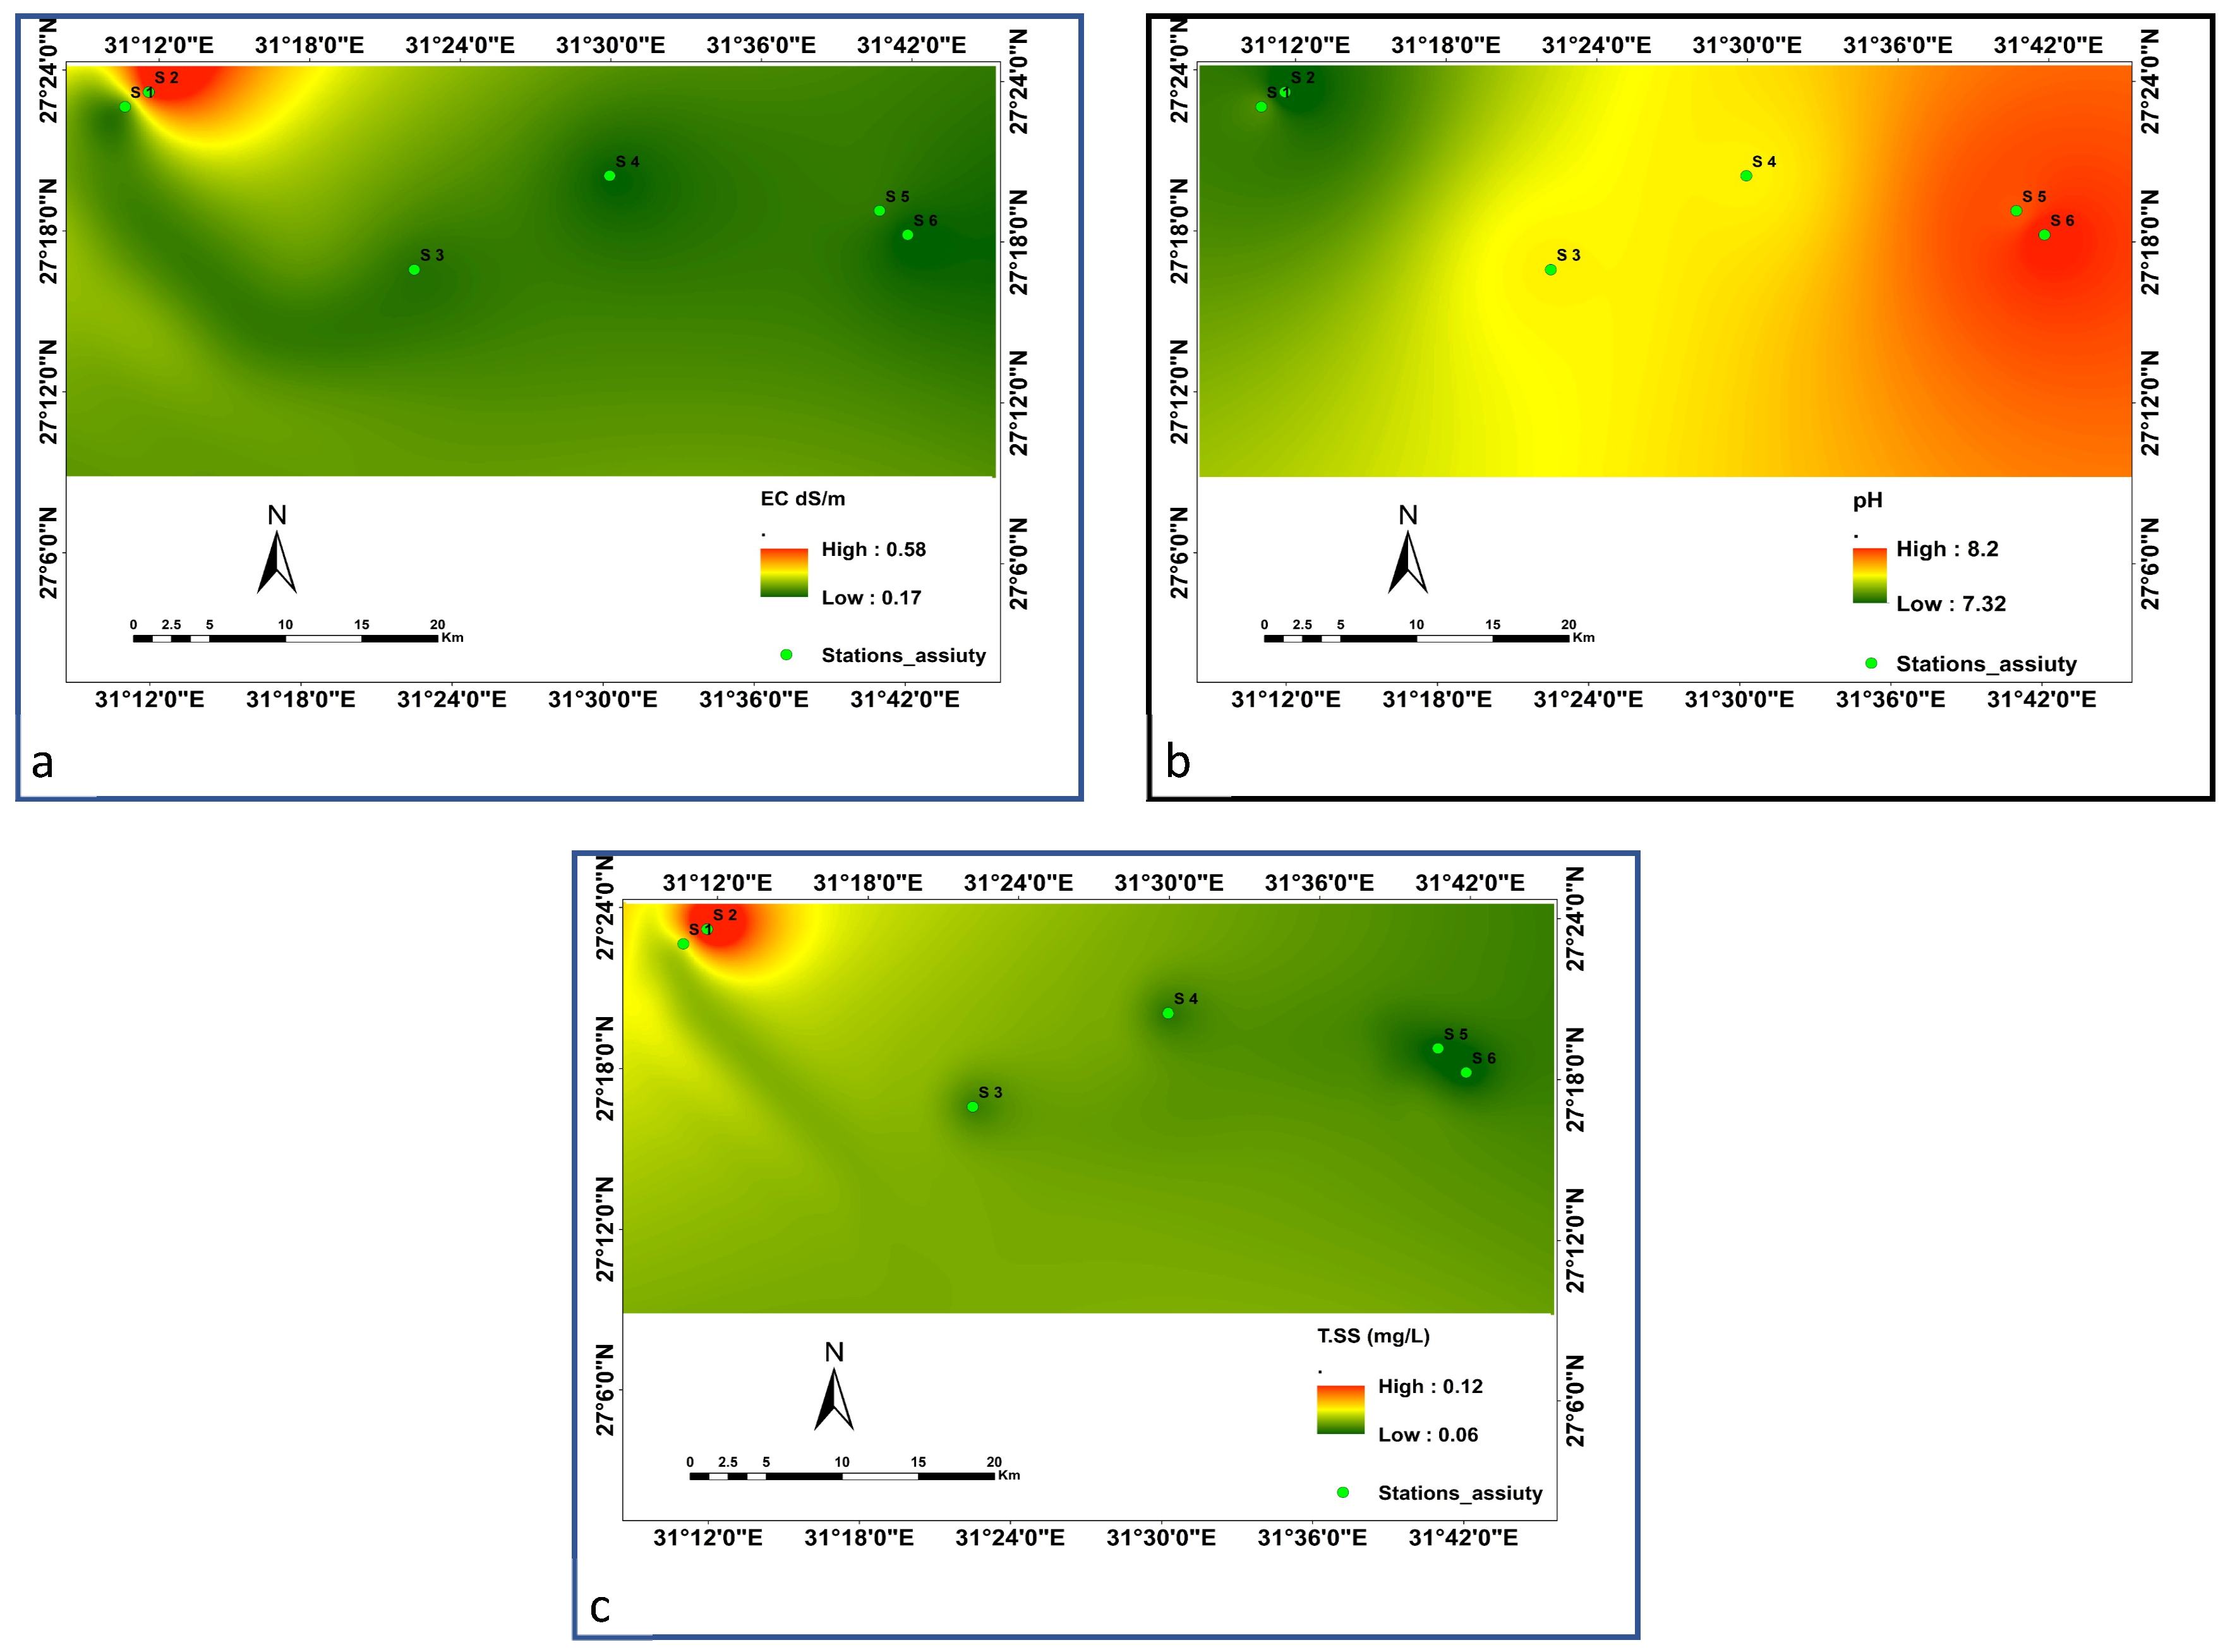
The soil physicochemical properties showed spatial differences between the two studied wadis (
Figure 6 and
Figure 7). In Wadi El-Galala, EC values ranged from 0.45 to 6.20 dS/m, while TSS ranged from 95 to 450 mg/L, indicating marked spatial variability in salt accumulation (
Figure 6a,c). Higher EC and TSS values were mainly observed in the southern depressions and low-lying areas, where lower vegetation cover and density values were recorded. Soil pH ranged from 7.3 to 8.2, indicating slightly alkaline soil conditions (
Figure 6b).
In Wadi El-Assiuty, EC values ranged from 0.31 to 2.80 dS/m and TSS from 70 to 290 mg/L, showing generally lower and more spatially uniform salinity levels (
Figure 7a,c). Soil pH showed a narrower range of 7.4 to 8.1, suggesting relatively stable slightly alkaline soil conditions (
Figure 7b).
Taken together, the soil patterns in both wadis suggest that salinity is an important factor associated with the distribution of C. polygonoides. Areas with elevated EC and TSS, particularly in the southern depressions of Wadi El-Galala, were associated with lower density and cover values, suggesting that salt accumulation may restrict plant establishment under local habitat conditions. In contrast, the more moderate and spatially uniform salinity levels in Wadi El-Assiuty were associated with relatively stable, although overall lower, vegetation presence.
3.4. Climatic Parameters
The climatic parameters showed spatial variation across the two studied wadis (
Figure 2). Annual rainfall ranged from 40 to 110 mm/year, with relatively higher values observed in Wadi El-Galala, particularly in its southeastern sector, compared with Wadi El-Assiuty. Mean annual temperature ranged from 23 to 29 °C, with Wadi El-Galala showing slightly higher temperature values than Wadi El-Assiuty.
Relative humidity ranged from 35% to 55%, with comparatively higher values in Wadi El-Assiuty, while evaporation exceeded 1800 mm/year across both wadis. These patterns reflect the arid environmental conditions of the study area. Relative humidity and evaporation were used for background climatic and aridity characterization, whereas rainfall and temperature were retained as climatic predictor variables in the habitat suitability model.
3.5. Habitat Suitability Maps
3.5.1. Wadi El-Assiuty
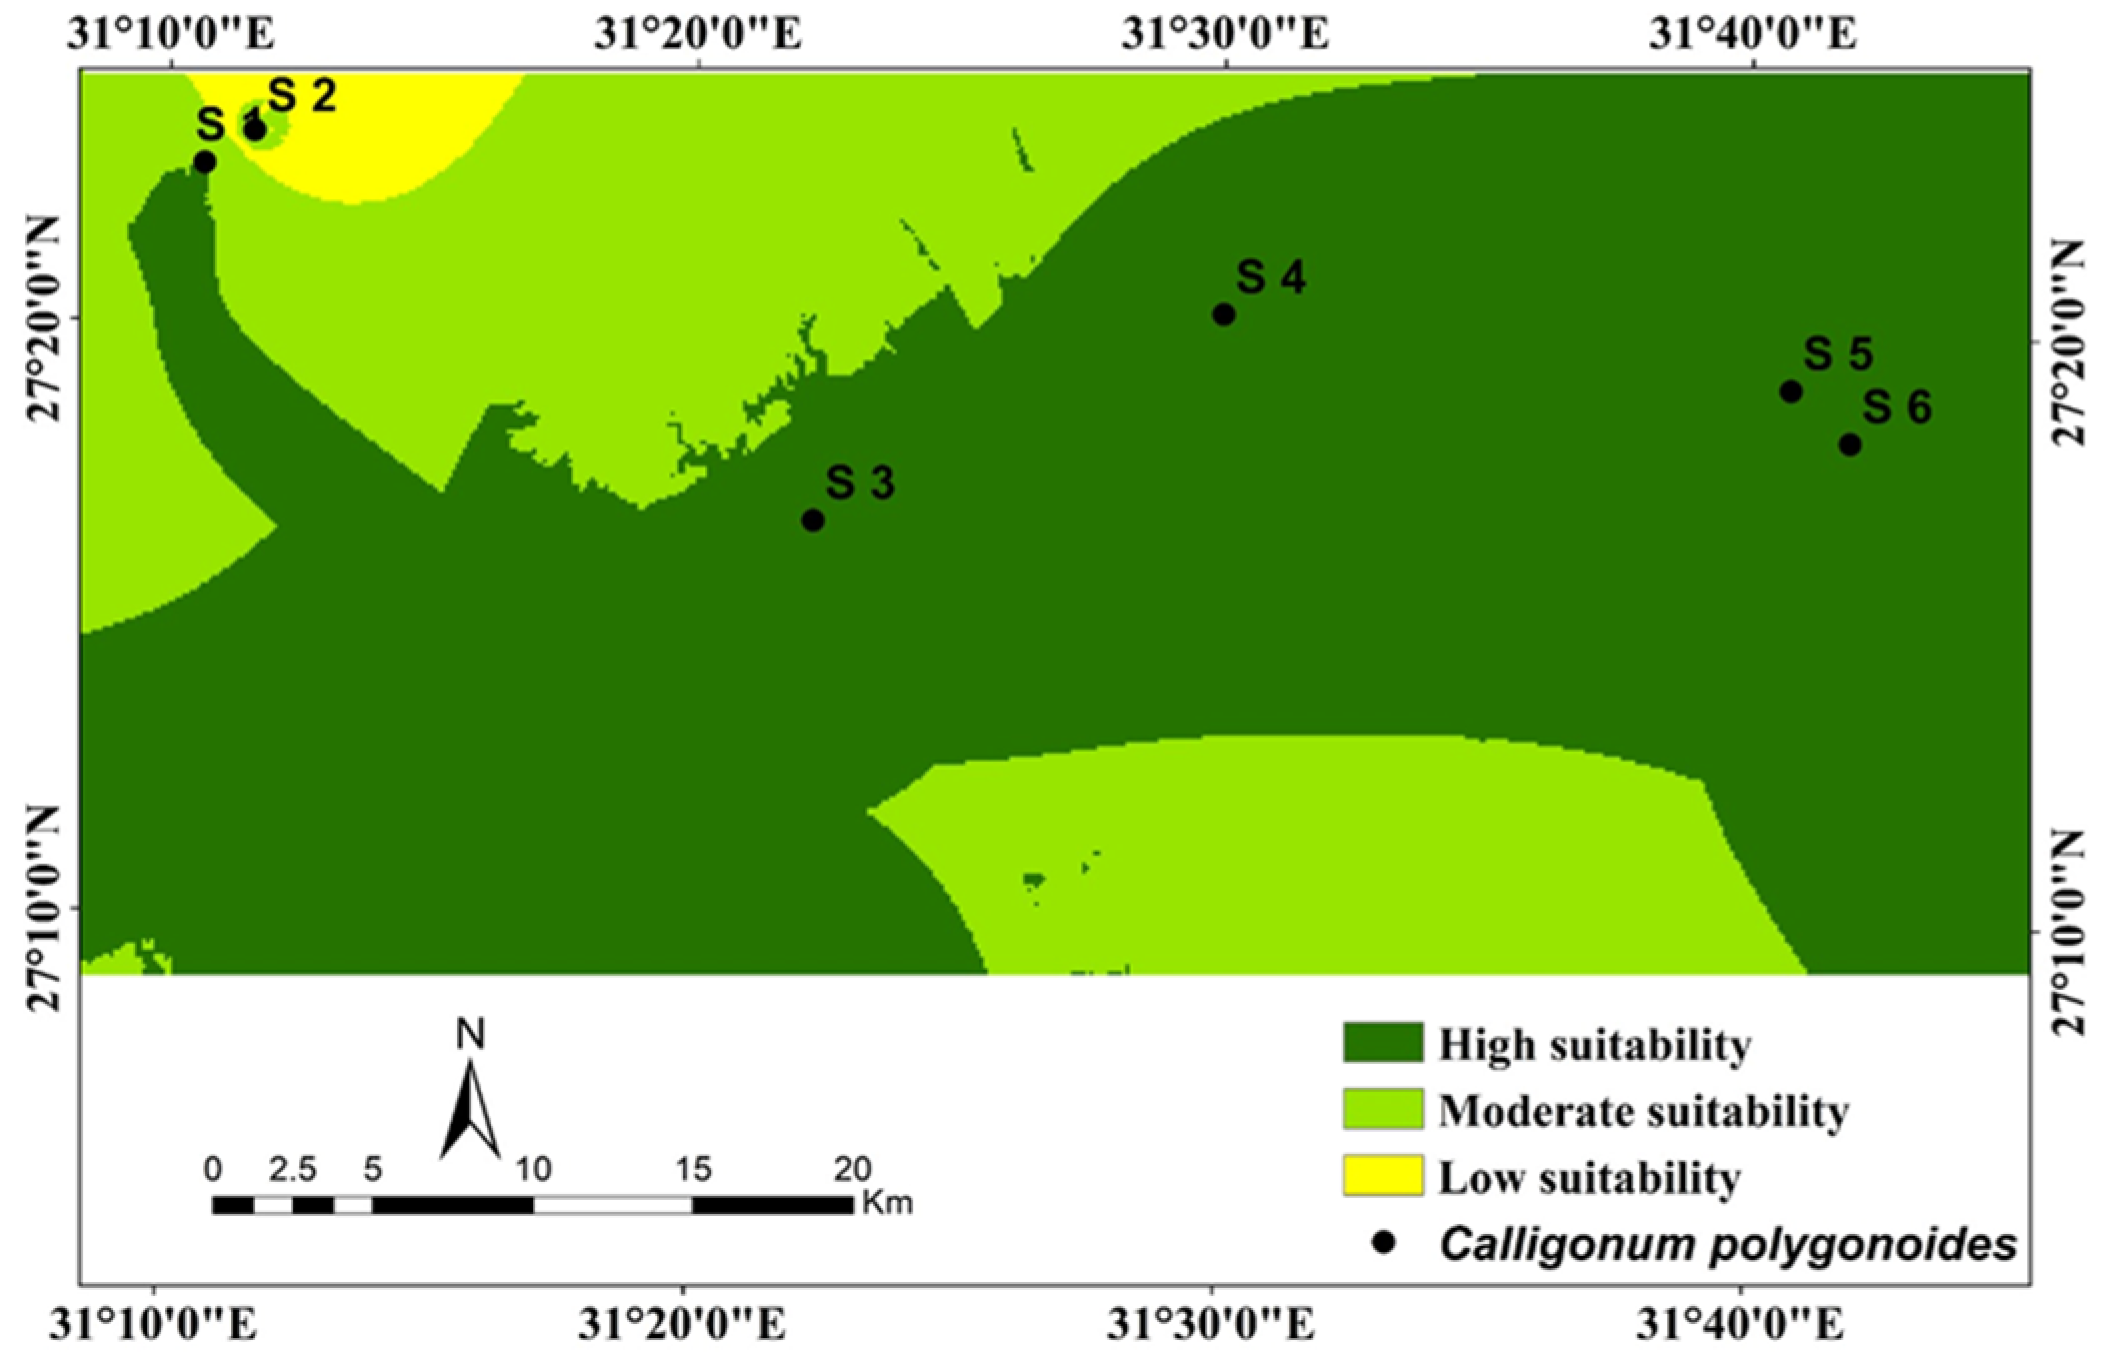
The suitability map (
Figure 8) shows high suitability (class 1, green) dominating most of the main wadi floor and adjacent alluvial fans. These areas combine gentle relief with deeper, less saline substrates. Moderate suitability (class 2, yellow) forms narrow transition belts on the northern and southern margins where slope and/or surface salinity increase slightly. Low suitability (class 3, red) is confined to a very small patch at the extreme northwestern edge, consistent with shallow, coarse or saline soils.
Spatial agreement assessment. Most occurrence points of C. polygonoides were located within high-suitability areas, with a few occurring near the boundary of moderate-suitability areas and no records observed within low-suitability areas. This pattern indicates spatial agreement between observed occurrence records and predicted suitability classes in Wadi El-Assiuty.
3.5.2. Wadi El-Galala
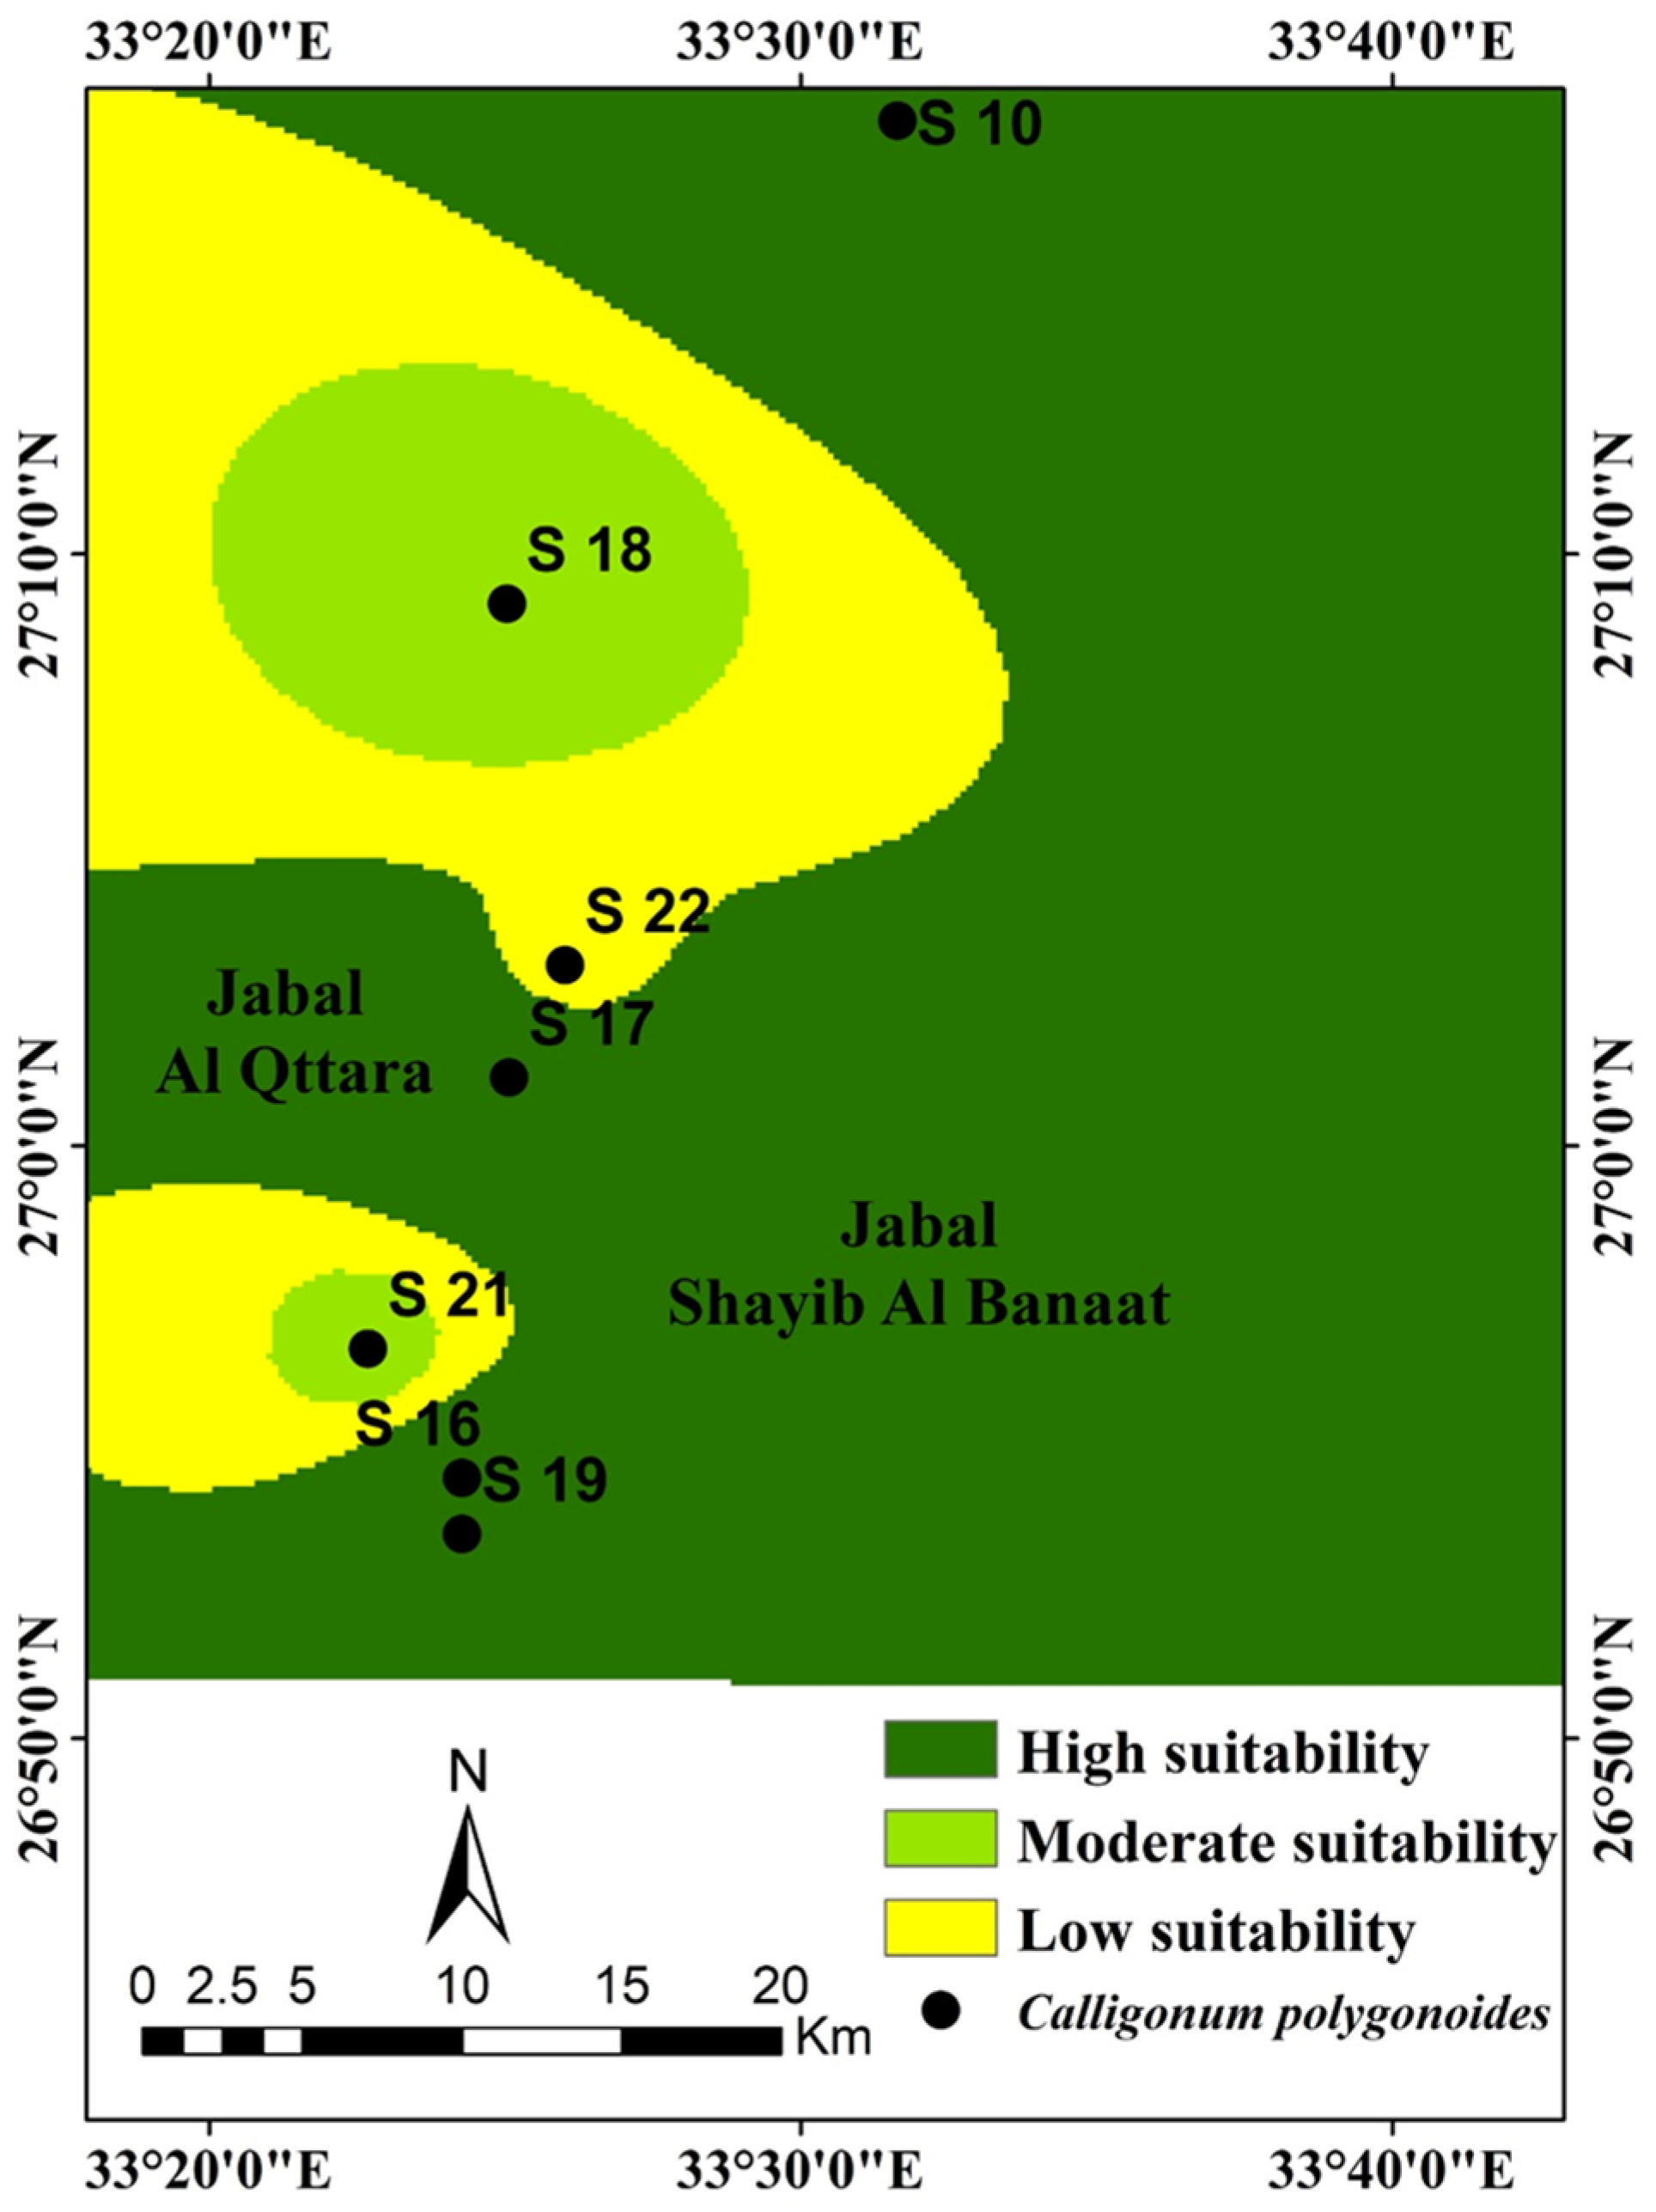
In Wadi El-Galala (
Figure 9), high suitability (class 1, green) extends widely across the coastal plain and intermontane flats. Moderate suitability (class 2, yellow) appears as arcs around unsuitable pockets, especially along the western and southwestern piedmont of Jabal Shayib Al-Banat. Low suitability (class 3, red) occurs in two distinct lobes (south-west and west central). These zones coincide with rougher terrain and localize higher salinity/total dissolved solids inferred from the soil maps, as well as steeper slopes/shallower regolith from the DEM.
Spatial Agreement between Occurrence Records and Suitability Classes. Occurrence points were concentrated within high-suitability areas and occasionally occurred near moderate-suitability areas, while no occurrence records were observed within low-suitability areas. This indicates that there was spatial agreement in Wadi El-Galala as well.
3.5.3. Spatial Agreement Assessment
Spatial agreement assessment was conducted by comparing the predicted habitat suitability classes with the recorded field occurrence points of Calligonum polygonoides. A total of 36 occurrence records were used for spatial agreement assessment. Of these, 33 occurrences (91.7%) were located within highly suitable habitats (Class 1), while the remaining records occurred at the boundary between highly and moderately suitable habitats (Class 2). No occurrence points were observed within low-suitability areas (Class 3), indicating spatial agreement between the predicted suitability patterns and the observed field distribution of the species.
Because only presence records were available and no absence data were collected, formal classification metrics such as sensitivity, specificity, receiver operating characteristic (ROC) curves, area under the curve (AUC), or confusion-matrix statistics could not be calculated. Therefore, this assessment should be interpreted as spatial correspondence between observed occurrences and predicted suitability classes rather than as a conventional classification accuracy measure.
3.6. Spectral Signatures of C. polygonoides
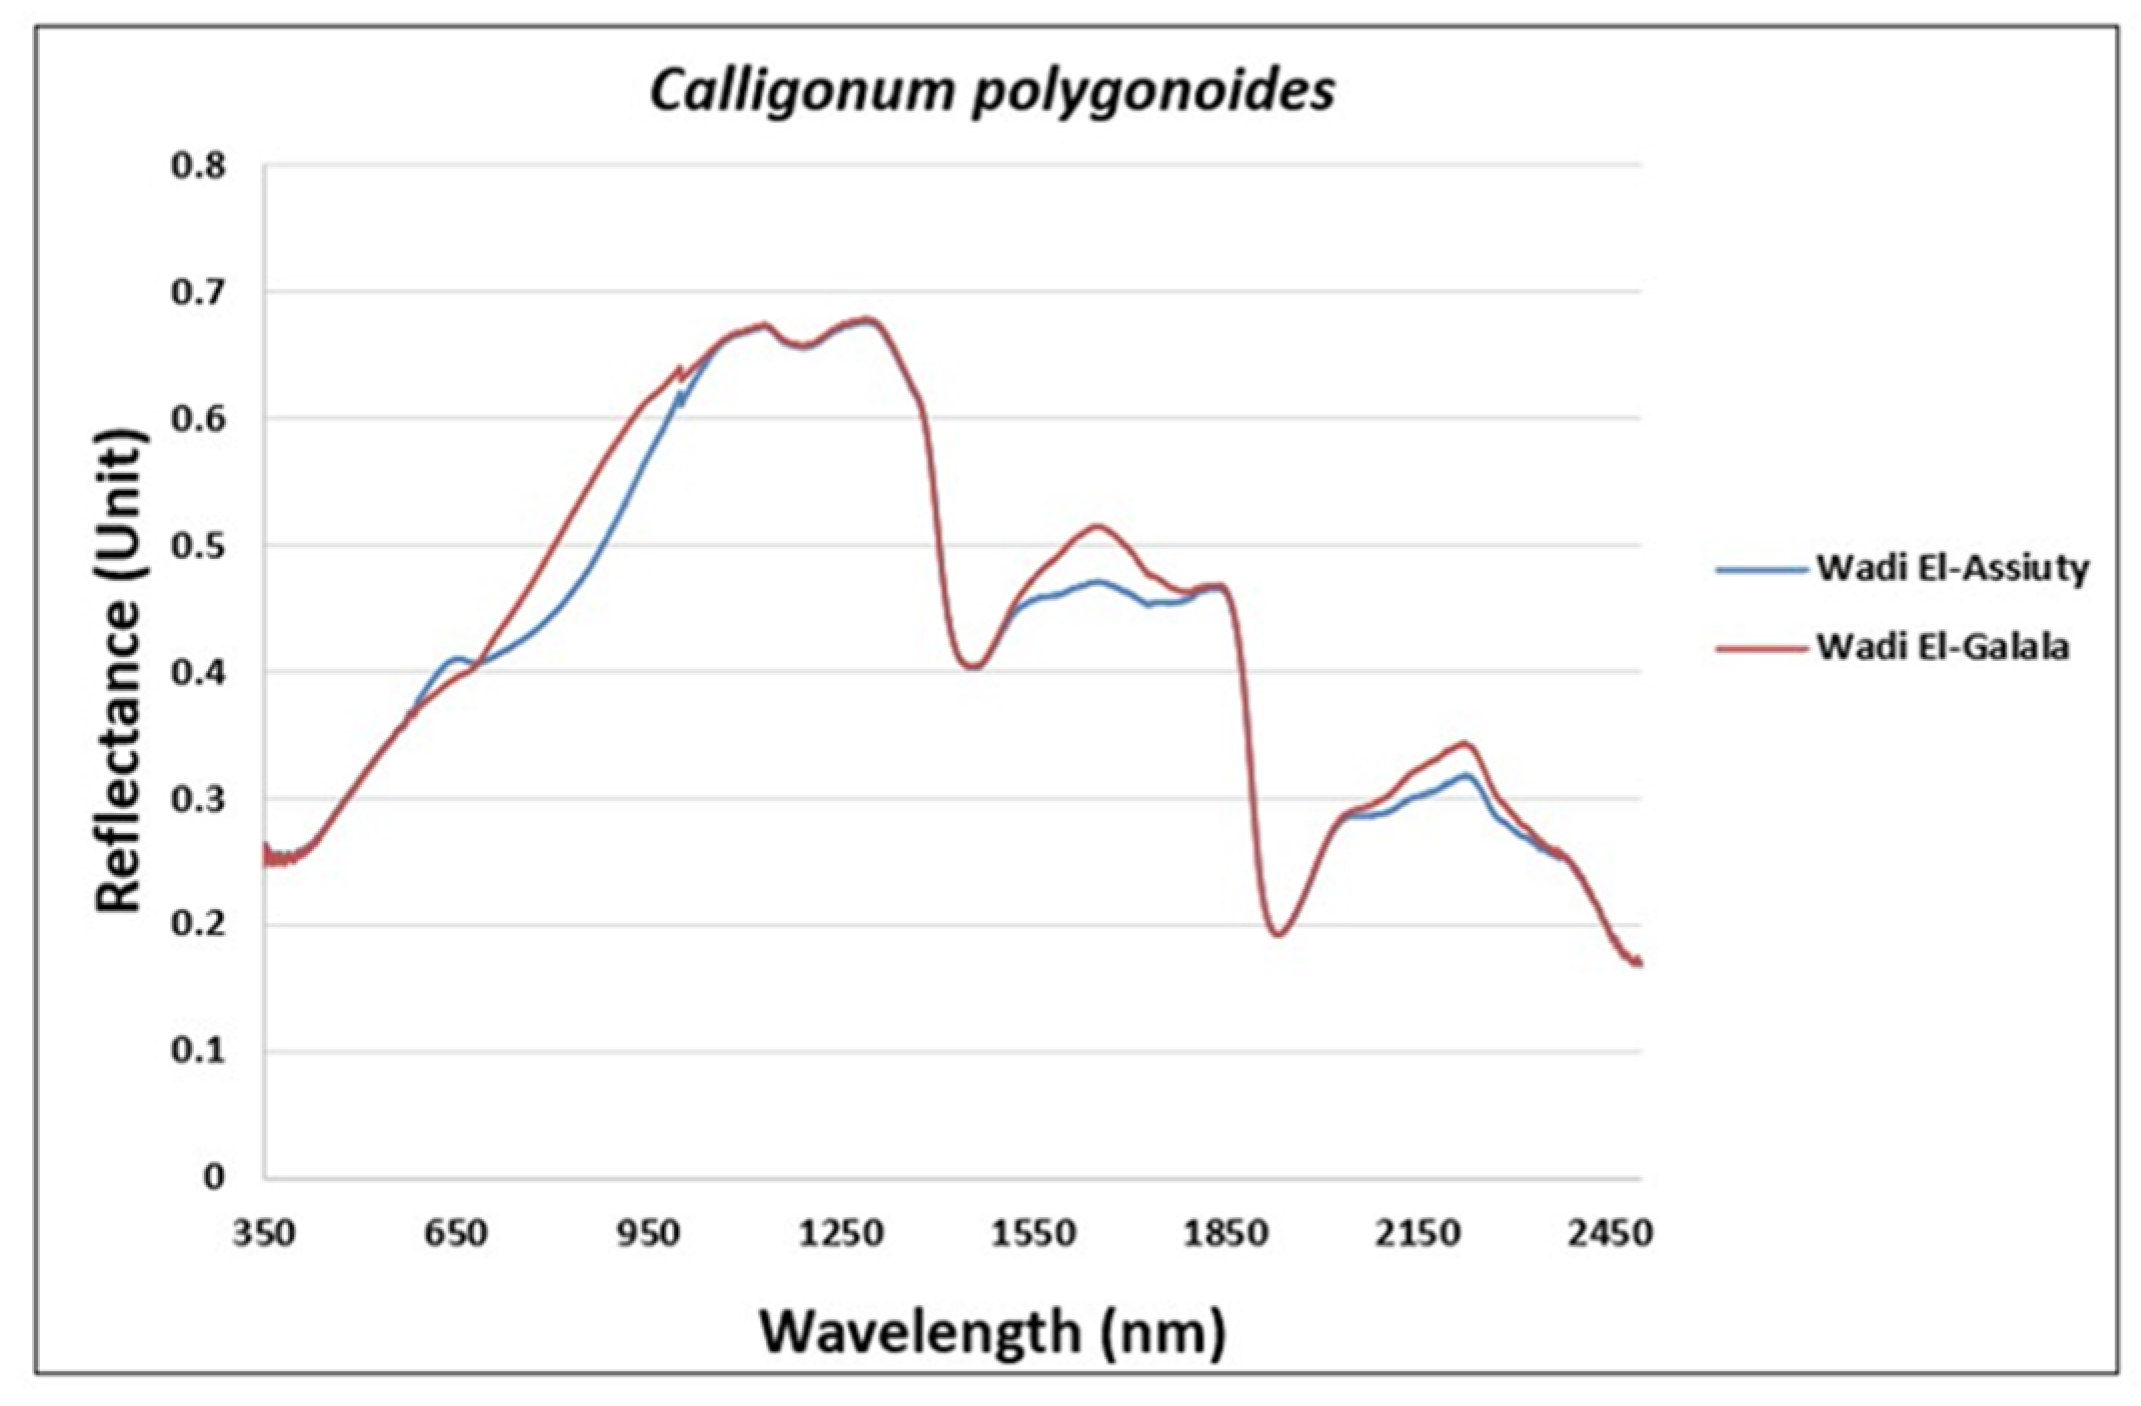
The mean reflectance curves of
C. polygonoides from Wadi El-Galala and Wadi El-Assiuty showed the general spectral pattern expected for desert shrubs, including low reflectance in the visible region, a red-edge transition, higher reflectance in the near-infrared region, and water-absorption features in the shortwave-infrared region (
Figure 10). Descriptive differences were observed between the two wadis. Leaves from Wadi ElGalala showed relatively higher NIR reflectance and more pronounced SWIR water-absorption features compared with Wadi El-Assiuty. These patterns may reflect differences in leaf structure and water status under contrasting habitat conditions.
In Wadi El-Assiuty, the relatively higher SWIR reflectance may indicate comparatively lower leaf water content or drier local conditions. However, these interpretations should be considered exploratory because no statistical comparison of spectral indices or uncertainty envelopes around the mean curves was applied in the present study. Therefore, the spectral curves are interpreted as complementary descriptive observations rather than quantitative evidence of significant physiological differences between wadis.
Overall, the spectral observations were broadly consistent with the environmental contrasts and habitat suitability patterns identified in the GIS-based analysis. Nevertheless, they should not be interpreted as independent validation of the GIS model. Future studies should include larger spectral datasets, spectral indices, and uncertainty estimates such as standard deviation or confidence intervals to better quantify spectral variability.
4. Discussion
The vegetation cover and density maps show that the highest values occur along active channels, low terraces, and confluence zones, declining upslope. This pattern reflects hydro-geomorphic processes in arid wadis where runoff periodically recharges shallow soil moisture and redistributes fine sediments and nutrients [
4]. This agrees with our field-derived density and cover patterns, which showed maximum
C. polygonoides abundance along actively recharged channel belts in Wadi El-Galala and along the main distributary in Wadi El-Assiuty.
For
C. polygonoides, previous work highlights its role as a keystone sand-binder with dense branching and deep roots, thriving best in low-salinity, mobile to semi-stable sandy environments [
7]. These habitats provide the physical and chemical conditions necessary for regeneration and persistence.
Across both wadis, the climate surfaces depict a typical hot-arid regime with high potential evaporation relative to modest rainfall. This imbalance may influence water-availability pulses along wadi floors and fans, which may affect recruitment opportunities for desert shrubs. In arid North Africa and West Asia, low, irregular rainfall coupled with large evaporative demand concentrates water subsidies in channels and micro-depressions; vegetation patterns in such systems are therefore strongly event-driven and topographically filtered. Recent synthesis work and case studies in similar drylands reaffirm that precipitation pulses, runoff concentration, and high ET potential are important factors associated with shrub occupancy and vigor in arid systems [
24,
25]. These mechanisms correspond well with our suitability outputs, showing high-suitability belts in mid-elevation, moisture-accumulating zones of Wadi El-Galala and elongated high-suitability corridors along the primary channel in Wadi El-Assiuty.
Between the two sites, topographic context modulates these climatic forcings differently: Wadi El-Galala’s greater local relief focuses runoff and creates short-lived moisture refugia after storms, whereas Wadi El-Assiuty’s gentler gradients favor broader but shallower wetting fronts. These patterns are broadly consistent with the observed field occurrence of
C. polygonoides along channel margins and low terraces, and with the broader literature on ecohydrological control of riparian/desert vegetation under aridity [
24].
The soil maps (EC, pH, TSS;
Figure 5 and
Figure 6) indicate that moderate salinity and slightly alkaline pH are associated with the denser stands of
C. polygonoides. This is consistent with previous studies showing that, although
C. polygonoides is sand-adapted and salt-tolerant, excessive salinity can suppress shrub performance via osmotic stress, ion toxicity, and reduced germination, while extreme alkalinity can limit phosphorus and micronutrient availability [
24,
26].
Soil pH near neutral to slightly alkaline typically supports higher nutrient availability and microbial activity; when it deviates, nutrient acquisition and root–microbe interactions degrade, affecting seedling establishment [
19].
Total soluble salts generally followed EC patterns, with lower TSS areas often coinciding with relatively higher vegetation cover and density, while salt-accumulating depressions showed sparse vegetation [
5]. In the present study, plots with elevated EC and TSS values were associated with lower-density and lower-cover zones, particularly within the southern depressions of Wadi El-Galala. Overall, the distribution of
C. polygonoides appears to be associated with the combined influence of topographic, edaphic, and climatic conditions rather than the effect of a single environmental factor. Topography may influence runoff pathways and soil moisture redistribution, while soil salinity and pH may affect rooting conditions. Consequently, areas characterized by moderate salinity, suitable soil reaction, and favorable topographic settings were generally associated with higher vegetation cover and plant density. These interacting environmental patterns help explain the habitat suitability patterns identified by the GIS-based multi-criteria model.
The suitability model outputs integrate climatic, edaphic, and topographic layers. In Wadi El-Galala, high-suitability patches cluster along channel belts and terraces where lower EC/TSS and optimal pH coincide with flow accumulation zones. In Wadi El-Assiuty, high-suitability areas form elongated bands along the main and secondary channels, with interfluves showing moderate suitability unless salinity is low.
The weighted overlay approach used here follows established GIS-MCDA methods widely applied in ecological and land-use planning [
27]. Prioritizing salinity and elevation as key factors aligns with both expert ecological knowledge and empirical evidence from similar arid environments [
4]. The spatial correspondence between observed occurrence records and high-suitability zones supports the ecological plausibility of the weighting scheme, although it should not be interpreted as formal model validation.
The leaf reflectance spectra for C. polygonoides from both wadis exhibit the typical desert-shrub signature: strong chlorophyll absorption in the red region, high near-infrared (NIR) reflectance plateau (750–900 nm), and distinct water absorption bands near 1450 nm and 1940 nm in the shortwave infrared (SWIR) region.
Reflectance from Wadi El-Galala showed a slightly higher NIR plateau, while shrubs in Wadi El-Assiuty showed relatively elevated SWIR reflectance. These descriptive patterns may reflect differences in leaf structure and water status between the two wadis [
28].
The spectral signatures showed relatively higher NIR reflectance and more pronounced SWIR water-absorption features in Wadi El-Galala compared with Wadi El-Assiuty. These characteristics may indicate differences in leaf optical properties related to water status and internal leaf structure. Higher NIR reflectance is commonly associated with leaf structural properties, while SWIR water-absorption features are sensitive to leaf water content [
29,
30]. Therefore, the spectral responses provide complementary descriptive information that may support ecological interpretation of the GIS-based habitat suitability patterns [
31,
32].
The observed spectral differences between wadis may reflect variation in plant condition associated with salinity and water-availability gradients. In arid environments, reduced water content and increased osmotic stress are commonly expressed spectrally by changes in the NIR–SWIR region: NIR reflectance is influenced by internal leaf structure, while SWIR is strongly affected by leaf water absorption features. The broad consistency between the spatial distribution of suitable habitats and the observed spectral characteristics suggests that field spectroscopy may provide complementary ecological information under varying environmental conditions. However, no quantitative statistical integration between spectral variables and environmental predictors was performed in the present study. Future studies should further investigate these relationships using larger datasets and quantitative statistical approaches to strengthen the integration between spectral and spatial analyses [
33,
34,
35].
From a conservation perspective, the habitat suitability maps provide preliminary spatial guidance for identifying areas that may deserve further field verification and site-specific management attention. In Wadi El-Galala, priority should be given to mid-elevation channel belts and terrace zones where C. polygonoides occurrences coincided with relatively favorable soil conditions and higher predicted suitability. In Wadi El-Assiuty, conservation attention should focus on slightly elevated areas and drainage-related microhabitats along the main and secondary channels, where field occurrence records showed spatial agreement with moderate-to-high-suitability classes.
These zones should be considered as preliminary priority areas for monitoring, protection from local disturbance, and future restoration planning. Management actions may include controlling overgrazing and fuelwood collection, maintaining natural runoff pathways, and supporting assisted regeneration only after further field verification [
36]. However, these recommendations should be interpreted cautiously because of the exploratory nature of the model, the limited number of occurrence records, and the absence of independent validation data.
Therefore, the suitability maps should be used as a decision-support tool for guiding future field surveys and site-specific conservation planning rather than as definitive conservation zoning outputs [
4,
37]. The spectral observations may also support future monitoring by helping detect changes in plant condition before visible decline becomes evident. Nevertheless, longer-term spectral monitoring and repeated field measurements are needed before hyperspectral indicators can be used operationally for conservation assessment of
C. polygonoides [
38,
39].
5. Limitations of the Current Study
This study has certain limitations that should be considered when interpreting the results. First, the sample size was relatively limited. The field survey included 14 plots and 36 recorded shrubs, while hyperspectral measurements were conducted on 15 shrubs with 45 scans. This limitation partly reflects the ecological reality of
C. polygonoides, which occurs in naturally sparse and fragmented populations within arid wadis. As an endangered medicinal shrub, extensive sampling may increase disturbance to already vulnerable populations. Therefore, the sampling design followed a conservation-oriented approach, balancing field data collection with ecological sensitivity [
40].
Consequently, the findings should be interpreted as an exploratory assessment of habitat suitability and leaf spectral responses rather than as a generalized predictive model for all populations of C. polygonoides. Future studies should expand the number of sampling plots, occurrence records, and spectral measurements across broader environmental gradients to improve model robustness and generalizability.
Second, environmental data layers were interpolated using the Inverse Distance Weighting (IDW) method in ArcGIS. Soil properties were interpolated from field samples collected across 14 plots, while climatic layers were generated from eight meteorological stations. IDW was selected because it is commonly used in ecological and environmental studies with limited datasets and does not require strong assumptions about spatial autocorrelation [
22,
23]. Although all raster layers were resampled to 30 m to match the resolution of the ASTER DEM and to ensure spatial compatibility among model inputs, this resolution should not be interpreted as the original measurement precision of the interpolated soil or climatic datasets. The IDW-derived maps provide approximate spatial patterns rather than fine-scale measurements at 30 m resolution. Therefore, the resulting habitat suitability maps should be interpreted as exploratory spatial outputs that require further refinement using denser soil sampling, additional meteorological data, and independent field validation.
Third, no formal sensitivity analysis was conducted to evaluate the influence of alternative weighting scenarios on the final suitability maps. The weighting scheme was based on ecological interpretation, the literature support, field observations, and expert judgment. Future studies should test alternative weighting scenarios and apply sensitivity analysis to assess the relative influence of individual variables on habitat suitability outputs.
Fourth, the study did not include absence data or an independent validation dataset. Therefore, the comparison between observed occurrence records and predicted suitability classes was treated as a spatial agreement assessment rather than a formal model accuracy evaluation. Future work should incorporate independent occurrence data, absence or pseudo-absence records, and statistical validation metrics to improve predictive assessment.
Finally, although statistical and multivariate analyses such as ANOVA, PCA, or regression-based approaches could help quantify inter-wadi differences and relationships among environmental variables, plant occurrence, and spectral responses, the limited sample size may compromise statistical robustness. Therefore, the present study focused on descriptive, spatial, and exploratory spectral comparisons, while recommending more comprehensive statistical testing in future studies with expanded sampling.
In addition, uncertainty envelopes such as standard deviation or confidence intervals were not added around the spectral curves because of the limited number of sampled shrubs. Future studies should include larger spectral datasets and present spectral curves with uncertainty estimates to better quantify within- and between-site variability.
6. Conclusions
This study provides an exploratory spatial and spectral assessment of C. polygonoides in two ecologically distinct arid wadis in Egypt: Wadi El-Galala and Wadi El-Assiuty. By combining field observations, GIS-based habitat suitability modeling, and hyperspectral leaf reflectance measurements, the study identified preliminary habitat patterns associated with topographic, edaphic, and climatic variation under current environmental conditions. The results suggest that areas characterized by suitable elevation ranges, relatively low salinity, slightly alkaline soil conditions, and moderate climatic conditions may be associated with relatively more favorable habitat conditions for C. polygonoides within the investigated wadis.
The hyperspectral measurements provided complementary information on leaf optical properties and indicated differences in reflectance patterns between populations from the two wadis. These spectral differences may reflect variation in plant condition under contrasting habitat settings; however, they should be interpreted cautiously because of the limited number of sampled shrubs and the exploratory nature of the spectral dataset. Accordingly, the spectral results should be considered supportive physiological observations rather than direct validation of the GIS-based suitability model.
From a conservation perspective, the habitat suitability maps can help identify areas that may deserve further field verification and site-specific conservation attention. These areas may be considered as preliminary priority zones for future monitoring, protection from local disturbances, and potential restoration planning. However, broader conservation recommendations require additional sampling, independent validation, and longer-term monitoring across wider environmental gradients.
Overall, this study highlights the potential value of integrating GIS-based habitat suitability modeling with hyperspectral leaf reflectance measurements for ecological assessment of desert shrubs. Nevertheless, the findings should be viewed as preliminary and site-specific. Future research should expand the number of sampling plots and occurrence records, incorporate independent validation data, and evaluate model sensitivity to variable weighting in order to improve the reliability and broader applicability of habitat suitability assessments for C. polygonoides and other arid-land shrubs.