Article

Impact of Supportive Policy for Resource-Exhausted Cities on Urban Ecological Resilience: Evidence from China

1
School of Finance and Trade, Liaoning University, Shenyang 110036, China
2
Natural Resource Asset Capital Research Center, Hebei GEO University, Shijiazhuang 052161, China
3
School of Economics, Liaoning University, Shenyang 110036, China
*
Author to whom correspondence should be addressed.
Sustainability 2026, 18(16), 8463; https://doi.org/10.3390/su18168463
Submission received: 28 June 2026 / Revised: 9 August 2026 / Accepted: 14 August 2026 / Published: 18 August 2026
(This article belongs to the Topic Advances in Urban Resilience for Sustainable Futures)

Abstract

Enhancing urban ecological resilience is key to addressing resource exhaustion and urban decline in resource-exhausted cities, as it facilitates the re-coordination of the human-land relationship territorial system. Using panel data from 281 prefecture-level cities in China from 2005 to 2023, we apply the multi-period Difference-in-Differences (DID) model to estimate the impact of supportive policies on urban ecological resilience. The results show that supportive policies significantly improve ecological resilience, with pronounced effects on resistance and adaptability, while the effect on recoverability remains limited. Mechanism analysis indicates that the policy works through promoting green innovation, reducing energy consumption, and strengthening environmental governance. Heterogeneity analysis shows that the effects vary across geographic locations and resource types. Supportive policies generate significant spatial spillover effects on enhancing urban ecological resilience and exhibit an evolutionary sequence of radiation, siphoning, equilibrium, and decline as geographic distance increases. These findings inform policy design for ecological restoration and regional coordination in resource-dependent regions.

1. Introduction

Resource-based cities, which emerge from the exploitation of natural resources, have long contributed to China’s national economic development [1]. As resources are gradually depleted, however, many of these cities fall into development traps of resource exhaustion and urban decline, marked by industrial structural imbalances, economic stagnation, rising unemployment, and severe environmental degradation. This predicament reflects the dislocation of the human–land relationship within the regional system of resource-exhausted cities, rendering the traditional single-resource-dependent development pathway increasingly untenable [2,3]. To address this pressing challenge, the Central Committee of the Communist Party of China and the State Council have prioritized the transformation of resource-exhausted cities to restore the resilience of regional human-land systems. Policy guidelines have been successively promulgated to facilitate the sustainable transition of resource-based cities. In 2007, the Opinions of the State Council on Promoting the Sustainable Development of Resource-Based Cities called for establishing and improving long-term mechanisms for sustainable development. Subsequently, three consecutive batches of pilot transformation programs were launched from 2008 onward, covering 69 resource-exhausted cities. The National Plan for the Sustainable Development of Resource-Based Cities (2013–2020) gave further weight to ecological civilization by requiring green and sustainable development to anchor urban transition strategies. Collectively, these policy initiatives have provided top-level institutional guidance for resource-based cities, signaling sustained governmental commitment to their revitalization. Against this backdrop, how resource-exhausted cities can shed their dependence on extraction, mend the human–land relationship, and reshape their development model toward resilience has become a central concern across multiple disciplines.
As a core pillar of sustainable development, resilience offers a critical lens for addressing systemic uncertainties, risks, and crises. At the strategic level, China’s 14th Five-Year Plan explicitly emphasized the need to build resilient cities. This was further reinforced by the report of the 20th National Congress of the Communist Party of China, which called for developing livable, resilient, and smart cities. Most recently, the 15th Five-Year Plan has once again underscored the importance of resilient urban construction, with the stated goal of strengthening cities’ safety, adaptability, and recovery capacity in the face of both natural and human-induced hazards. Driven by these policy shifts, resilient city development is set to deepen progressively. For resource-exhausted cities, identifying new economic development pathways and enhancing urban resilience are essential strategies for achieving structural transformation and long-term sustainability [4]. Urban resilience refers to the capacity of an urban system to resist, adapt to, and recover from internal and external natural and social shocks while maintaining sustainable development [5]. Drawing on the concept of evolutionary resilience and the adaptive cycle model of systems, this paper defines ecological resilience as an urban ecosystem’s capacity to resist (system maintenance), adapt (system change), and transform (system reorganization) in response to external disturbances. By analyzing these three processes in the urban ecosystems of resource-exhausted cities under transformational pressure, the study investigates the ecosystem’s combined ability to withstand degradation, adapt to stress, and restore function when exposed to disturbances such as pollution emissions and resource depletion [6]. Unlike environmental sustainability, which narrowly targets environmental quality, ecological resilience foregrounds the system’s dynamic response and adaptive capacity under uncertain disturbances, emphasizing the processes of maintenance, adjustment, and reorganization under shock. For resource-exhausted cities, strengthening this form of resilience not only helps address immediate environmental challenges but also underpins the move toward equilibrium in the human–environment system, steering cities onto the path of sustainable and resilient development.
Transforming resource-based cities fundamentally requires economic and industrial restructuring [7]. As resources gradually deplete, the challenges facing resource-based cities are intensifying; identifying new sources of economic growth and achieving economic diversification have become key priorities in their transformation [8]. In this context, regional economic resilience provides an analytical framework for understanding how regional economies respond to shocks, recover, and restructure, offering new perspectives for evaluating transition performance [9]. Current academic research on the transformation of resource-based cities primarily focuses on economic resilience amid resource depletion and the pressures of economic transformation. At the theoretical level, existing studies have conducted qualitative analyses of the dynamic evolution of resource-based cities from the perspective of regional economic resilience [10,11]. At the empirical level, Guan et al. [12] focused on several typical old industrial cities. They conducted a comparative analysis of the economic transformation processes within the framework of evolutionary resilience theory. Li et al. [13] examined the economic transformation of old industrial cities in Liaoning Province within the framework of regional economic resilience. Existing research primarily analyzes the transformation of resource-based cities through the lens of economic resilience, while neglecting ecological resilience, which underpins sustainable development. Although a few scholars have begun to investigate the effects on urban ecological resilience, these efforts remain relatively scattered. For example, Wang et al. [14] examined the impact of sustainable development planning on urban ecological resilience in resource-based cities and found that its implementation significantly enhanced it. Zhao et al. [15] report that policies promoting the sustainable transformation of resource-based cities substantially improve urban ecological resilience, and that these effects shift with geographic distance in a pattern characterized by radiation, siphon, and subsequent decline. However, these efforts remain relatively fragmented. The crisis of resource exhaustion in resource-based cities stems from long-term, high-intensity exploitation that has caused severe ecological problems such as land subsidence, pollution, and environmental degradation [16]. These issues are not only indicators of an economic downturn; they also hinder efforts to enhance economic resilience by continually driving up governance costs, diminishing the appeal of human capital, and crowding out future development opportunities [17]. Ecological resilience provides an indispensable resource base and ecosystem services for economic activities, and constitutes a prerequisite for economic resilience [18]. Enhancing ecological resilience is therefore a key pathway for resource-based cities to address mineral depletion and urban decline. It can help achieve mutually reinforcing outcomes between high-quality economic development and regional sustainability, while also promoting coordination of the human-land system.
Current research on urban ecological resilience has largely focused on analyzing these conceptual frameworks, evaluation indicator systems, spatiotemporal evolution characteristics, and influencing factors. Holling first introduced the concept of resilience to describe a system’s capacity to return to its pre-disturbance state, emphasizing a single equilibrium [19]. He later proposed “ecological resilience,” arguing that a disturbance exceeding a certain threshold can shift a system into a new steady state, thereby emphasizing multiple equilibria [20]. Extending this line of thought, Walker and Holling developed the notion of “evolutionary resilience,” which highlights the adaptive capacity that emerges from the internal adjustment and evolution of a system’s components after a disturbance, again centered on multiple equilibria [21]. Scholars have progressively developed multidimensional evaluation frameworks for urban ecological resilience and conducted corresponding measurements and analyses. At present, the relevant research mainly uses methods such as the entropy method [22], the Analytic Hierarchy Process (AHP) [23], and geospatial analysis [24], where researchers have measured and evaluated urban ecological resilience across dimensions such as resistance–adaptability–resilience [25], socio-economic–natural [26], drivers–pressures–state–impacts–responses [27,28], and scale–density–form [29]. The spatiotemporal evolution characteristics [30], the influence of economic [31], social [32], and natural environmental factors [33] are investigated.
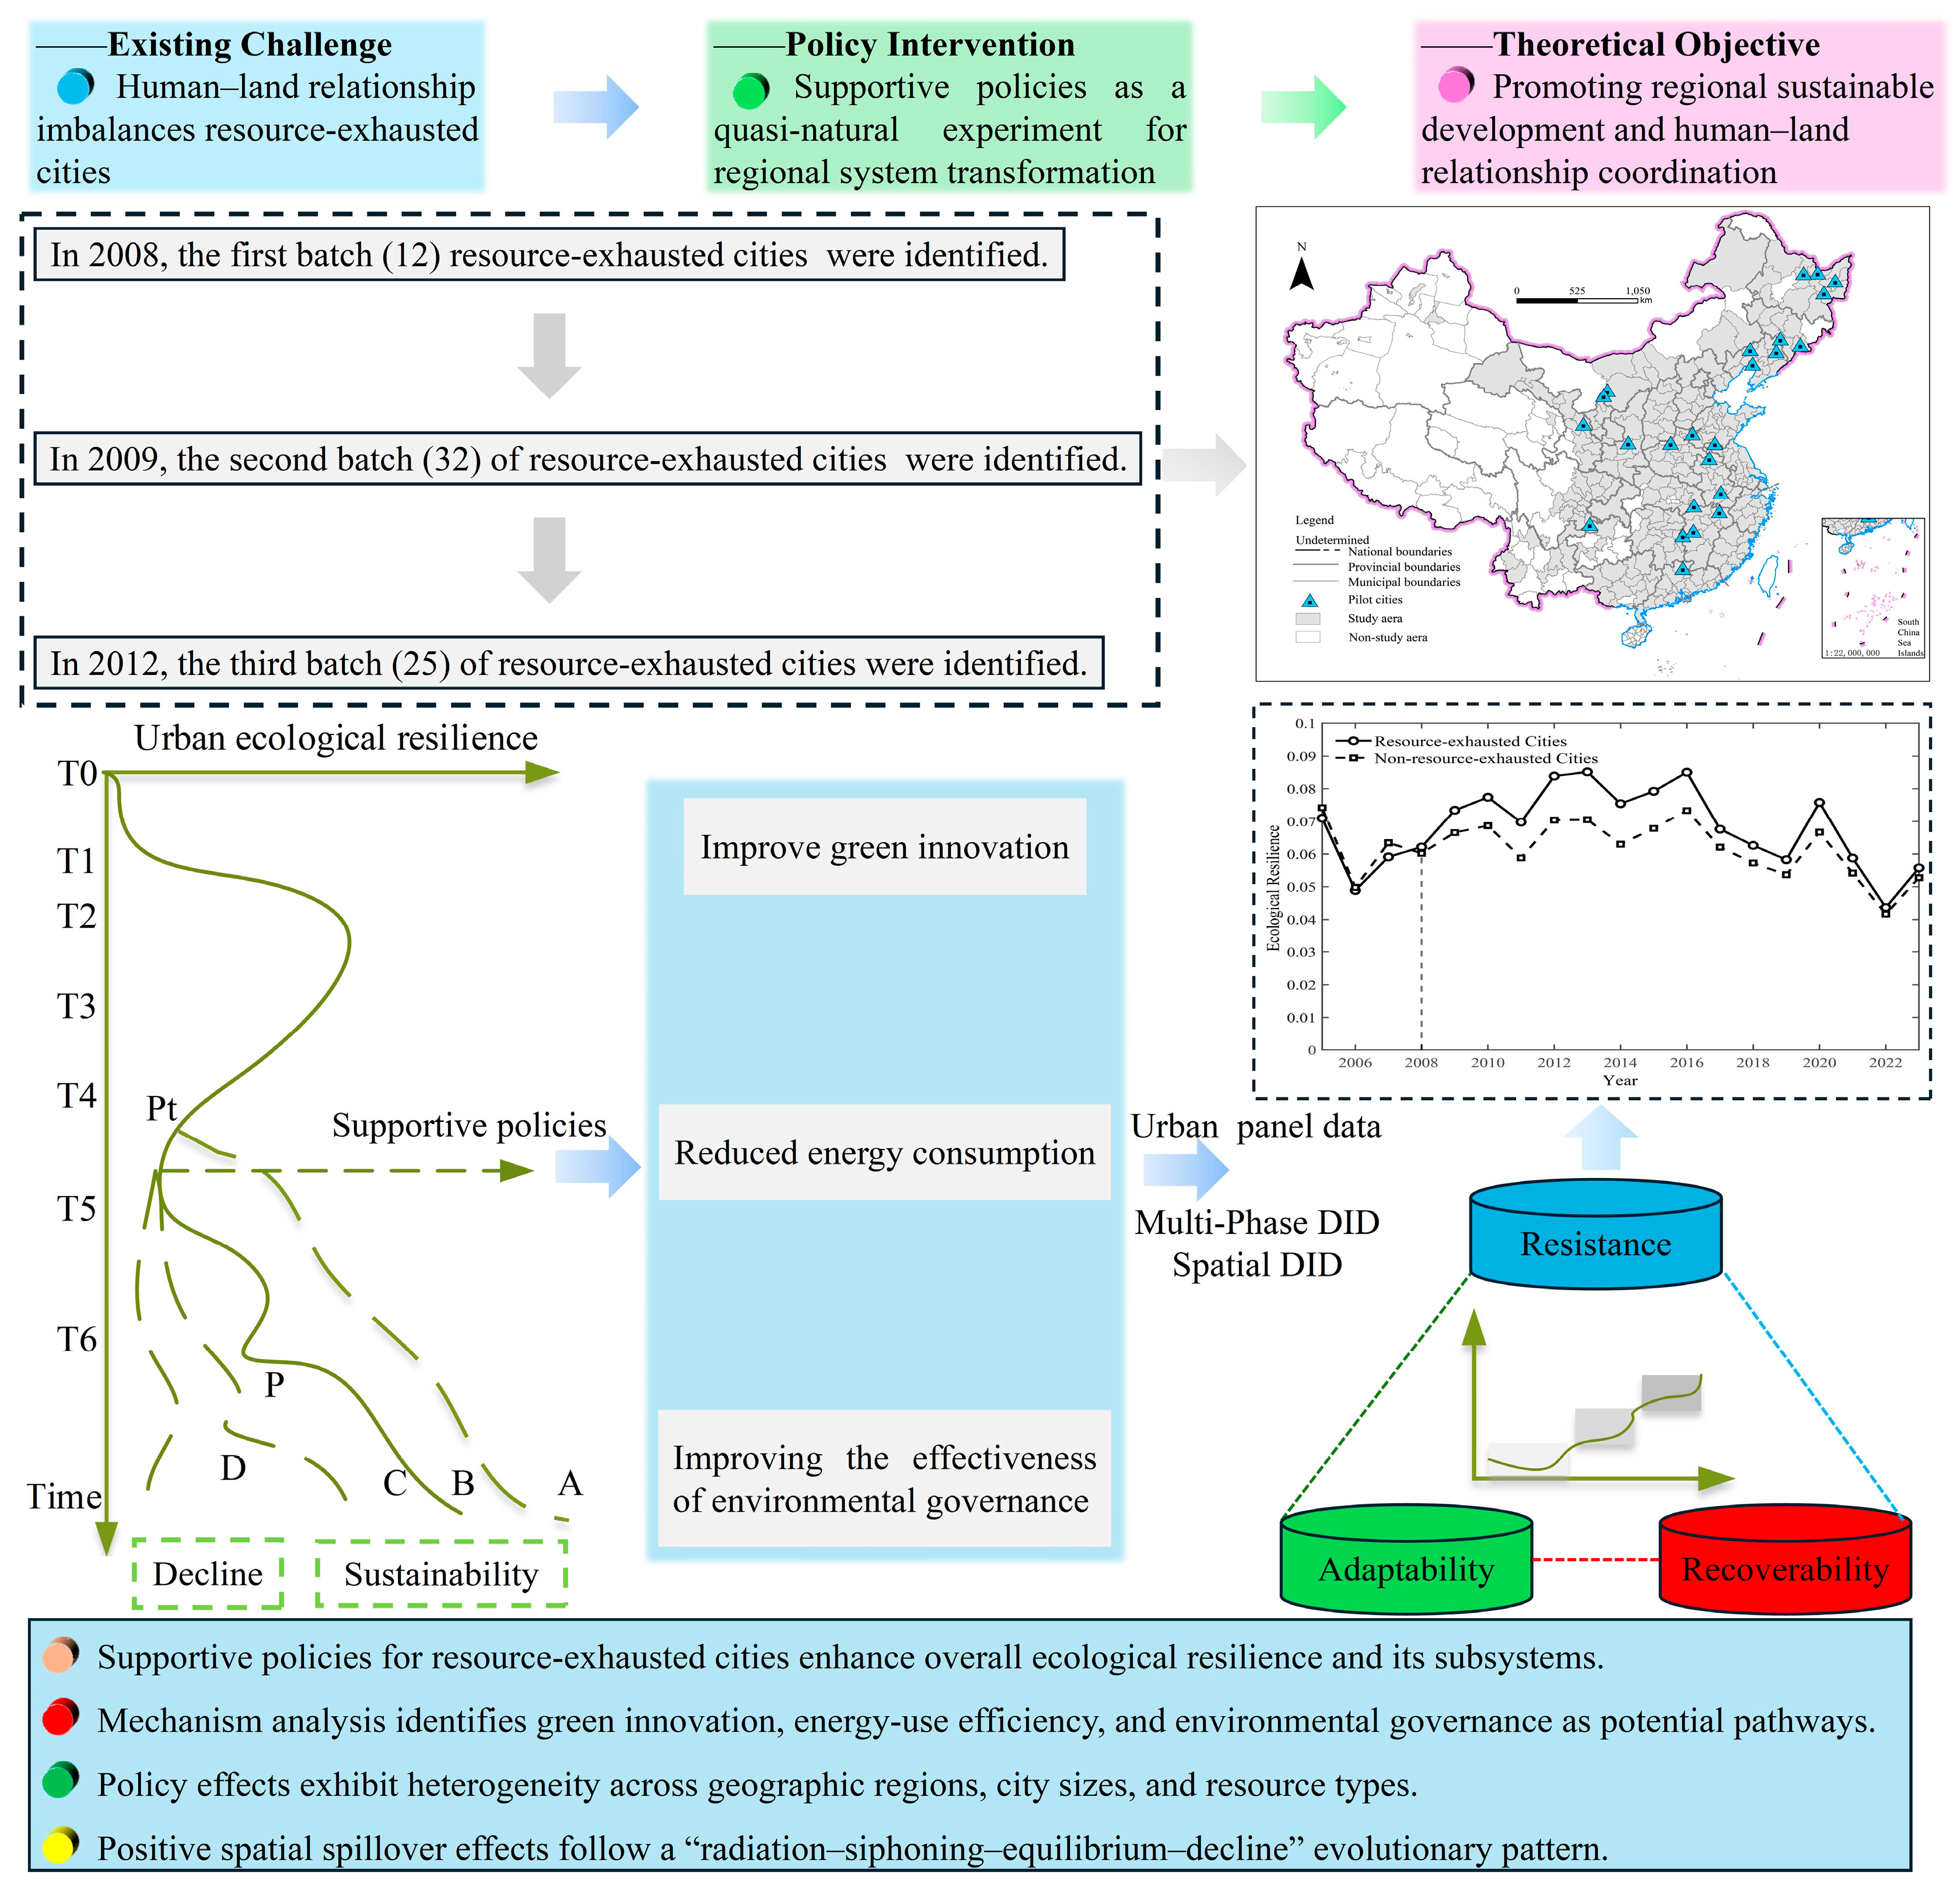
The review of the existing literature reveals that research on the ecological resilience of resource-exhausted cities remains relatively scarce. Most research on resource-based city transformation has centered on economic resilience, with ecological resilience rarely examined through the human-land relationship. Where scholars have begun evaluating policy effects on ecological resilience, the analyses typically address broad sustainability policies rather than treating supportive policies for resource-exhausted cities as quasi-natural experiments. Based on the panel data from 281 prefecture-level cities in China from 2005 to 2023, this study employs a combination of multi-period DID and spatial DID methods to examine the impact of supportive policies for resource-exhausted cities on urban ecological resilience, these mechanisms of action, and spatial spillover effects. The specific research framework is shown in Figure 1. Potential contributions include: First, this study uses the human–land relationship perspective to examine how supportive policies shape urban ecological resilience in resource-exhausted cities, offering insights for sustainability policy and high-quality urban development. Second, the mechanism analysis identifies three pathways through which supportive policies strengthen urban ecological resilience: promoting green innovation, reducing energy consumption, and improving environmental governance. Third, the spatial effects model is applied to examine the spatial spillover effects and boundaries of supportive policies, supplying empirical evidence for policy implementation and regional coordination.

2. Research Hypotheses

2.1. Direct Effect

Resource-exhausted cities are trapped in resource dependence, with a monolithic industrial structure and breached ecological thresholds that reflect a human-land imbalance. Supportive policies for resource-exhausted cities form a systematic policy package that includes central fiscal transfers, industrial assistance, ecological restoration, and innovation support. These policies seek to phase out outdated development models and foster new growth drivers, thereby helping such cities escape the trap of resource depletion and urban decline and repair the imbalanced human-environment system [34]. Specifically, supportive policies phase out outdated production capacity and provide aid to declining industries, reducing the threat that highly polluting, energy-intensive industries pose to ecosystems and enhancing ecosystem resilience to disturbances. At the same time, they restore ecosystem structure and function through ecological compensation mechanisms and the cultivation of successor and alternative industries. This reshapes the endogenous dynamics of urban systems, reduces the path dependence of development on the ecological environment, and thereby strengthens the adaptability and recoverability of urban ecosystems. Overall, supportive policies can effectively alleviate the pressure of human activities on the natural environment, restore the imbalance in human-land relations, and enhance the resistance, adaptability, and recoverability of urban ecosystems.
Based on this, we propose Hypothesis 1: Supportive policies for resource-exhausted cities can effectively enhance urban ecological resilience.

2.2. Indirect Effect

Supportive policies for resource-exhausted cities affect urban ecological resilience both directly and indirectly. The indirect effects operate through three primary channels: promoting green innovation, reducing energy consumption, and strengthening environmental governance.
From the perspective of green innovation, supportive policies can enhance urban ecological resilience. Resource-exhausted cities are generally characterized by path dependence and lock-in effects, and are easily constrained by their original technological trajectories and institutional frameworks. On the one hand, the implementation of supportive policies facilitates breaking the lock-in effect in resource-exhausted cities, thereby transcending existing technological pathways and institutional frameworks. For technology upgrades focused on smart, green, and service-oriented development, such policies can both tap into and enhance the enormous potential of existing production capacity, while also promoting the development of new technologies, industries, models, and business formats, thereby accelerating urban green innovation. On the other hand, strengthening urban green innovation capabilities can drive the transformation and upgrading of industrial structures toward greener and lower-carbon models, thereby fundamentally alleviating environmental pollution pressures [35]. Furthermore, advancing green innovation can optimize resource allocation, strengthen urban environmental regulatory systems, enhance urban ecosystems’ resilience to external disturbances, and comprehensively elevate overall urban ecological resilience.
From the perspective of energy consumption reduction, supportive policies enhance urban ecological resilience primarily by reducing energy consumption intensity. On the one hand, resource-exhausted cities are focusing on building a sustainable development model characterized by low-carbon, clean, and efficient practices throughout the transition process. By implementing the “Three Reductions, One Cut, and One Supplement” policy, these cities have phased out outdated and excess production capacity in sectors such as steel and coal in accordance with the law, promoting the optimization of the energy structure and the control of total energy consumption, and curbing the trend of ecological and environmental degradation from the source. On the other hand, lower energy intensity and reduced pollutant emissions can mitigate environmental stress, cultivate green low-carbon production and consumption modes, upgrade regional ecological quality, stabilize urban ecosystems, and boost urban ecological resilience [36].
From the perspective of environmental governance, supportive policies can enhance urban ecological resilience by increasing government attention. On the one hand, implementing supportive policies can increase attention to and support for ecological and environmental services. These policies prioritize ecological conservation and restoration, coordinate environmental protection and ecological restoration efforts in urban old industrial zones and resource-exhausted cities, strengthen comprehensive pollution control, and continuously improve environmental quality [37]. At the same time, the government is strengthening environmental regulations, accelerating the relocation of polluting enterprises, and tightening pollution controls during plant suspensions and relocations. On the other hand, the government’s growing attention to environmental issues has enhanced the effectiveness of urban environmental governance. This is manifested in the use of market-based and law-based instruments, such as environmental taxes and pollution discharge permits, to effectively guide firms toward optimizing resource allocation and upgrading conventional technologies through green transformation. These measures reduce environmental burdens at the source, enhance ecosystem carrying capacity, and ultimately improve urban ecological resilience.
Based on this, we propose Hypothesis 2: Supportive policies for resource-exhausted cities enhance urban ecological resilience through three pathways: promoting green innovation, reducing energy consumption, and improving environmental governance effectiveness.

2.3. Spatial Effects

Regions universally exhibit spatial correlation, and the intensity of interaction between neighboring areas decays with distance. As a typical place-based policy, the supportive policy for resource-exhausted cities may generate spatial spillover effects on the ecological resilience of adjacent areas through a dynamic interplay of radiation and siphon effects. The policy concentrates resources in pilot cities via central government special transfer payments, the cultivation of substitute and alternative industries, and ecological restoration investment. This concentration draws production factors such as capital and talent from surrounding regions into the core area, producing siphon effects that partly constrains neighboring areas’ ecological governance investment capacity and development space. At the same time, knowledge spillovers such as institutional innovations, governance experience, and green technologies arising from pilot-area transformation diffuse to surrounding regions through intergovernmental exchanges, industrial chain collaboration, and personnel mobility. These radiation effects further strengthen the ecological governance capacity of neighboring areas [15]. The net impact of the policy on neighboring cities’ ecological resilience hinges on the relative strength of these two forces. Neither radiation nor siphon effects are spatially unbounded. The transmission of policy experience across regions relies on micro-level carriers whose influence decays with geographic distance. Industrial synergies, moreover, are constrained by transportation costs and local administrative barriers and thus tend to concentrate in neighboring areas. It is these constraints that set the spatial limits of policy spillovers.
Based on this, we propose Hypothesis 3: Supportive policies for resource-exhausted cities produce significant spatial spillover effects on neighboring regions, with heterogeneous evolutionary patterns across distance and clear spatial attenuation boundaries.

3. Research Methods and Data Sources

3.1. Research Methods

To advance the transformative development of resource-exhausted cities, the State Council designated 69 such cities (encompassing prefecture-level and county-level administrative regions) in three batches in 2008, 2009, and 2011, respectively. Given the availability of data, only prefecture-level resource-exhausted cities were selected as subjects of this study, and 24 such cities were investigated in depth (see Appendix B for the full list). Due to the staggered rollout of the pilot program across resource-exhausted cities, the traditional DID model may suffer bias arising from heterogeneous policy shock timing. Therefore, this study employs a multi-period DID method to estimate the impact of supportive policies for resource-exhausted cities on urban ecological resilience. The specific model is set as follows:
R e s i l i e n c e i t = a 0 + a 1 R e s o u r c e i t + γ X i t + μ i + ν t + ε i t
where Resilienceit is urban ecological resilience, Resourceit is the interaction term between “whether it is included in the list of resource-exhausted cities” and “the implementation time of the supportive policy for resource-exhausted cities”. And α1 is the coefficient of the interaction term, which is the coefficient of the interaction term. Additionally, α1 > 0 represents supportive policies can increase urban ecological resilience, α1 < 0 represents supportive policies can reduce urban ecological resilience. Xit is the control variable. μi, vt are city and year fixed effects, respectively.

3.2. Indicator Construction

Urban ecological resilience is generally defined as the comprehensive capacity of urban ecosystems to maintain system stability, absorb shocks, adapt to change, and recover from external, uncertain disturbances, encompassing three key characteristics: resistance, adaptability, and recoverability [38]. Therefore, this study employs the entropy method to measure urban ecological resilience from the dimensions of resistance, adaptability, and recoverability. First, resistance refers to an ecosystem’s ability to withstand external shocks and disturbances. The human-land relationship system reflects the natural geographic environment’s capacity to withstand human-induced disturbances. Therefore, population density and per capita built-up area were selected to characterize the urban population and urbanization. In resource-exhausted cities, the core driver of disturbance is environmental pressure from industrial and mining activities. Therefore, industrial wastewater discharge per unit of GDP, industrial smoke and dust emissions per unit of GDP, and industrial SO2 emissions per square kilometer were selected to characterize the pressure exerted by human industrial production activities on the natural environment. Second, adaptability is the ecosystem’s ability to maintain stability after disturbance. The human-land relationship system reflects the ability of the natural geographical environment to accommodate human activities. Therefore, the harmless treatment rate of municipal solid waste and the sewage treatment rate were selected to characterize the capacity of urban systems to adapt to and manage the pollution generated by population concentration. For resource-exhausted cities, the comprehensive utilization rate of general industrial solid waste reflects the capacity to process and recycle “solid waste stockpiles” from mining operations. It is used to characterize the ecological absorption capacity. Finally, recoverability denotes an ecosystem’s ability to restore its balance after disturbance. In the human-land relationship system, recoverability denotes the system’s ability to self-repair and restore balance after disturbance, relying on natural endowments and man-made infrastructure. Therefore, green coverage in built-up areas, per capita park green space, per capita water resources, and per capita land area were selected to characterize urban greening efforts [30]. The specific indicators are shown in Table 1.

3.3. Variable Measurement and Data Sources

The urban ecological resilience measurement indicators and control variable data are drawn from the relevant years of the China City Statistical Yearbook, individual city statistical yearbooks, and local government bulletins. A small number of missing values appear in the degree of openness, urbanization rate, and human capital level, each with a missing proportion below 5%; these are filled using interpolation and extrapolation. Given the low proportion of missing values, the imputation has a limited impact on the overall sample distribution. To avoid heteroscedasticity, all data are increased by 1 and then log-transformed. Since the three batches of supportive policies for resource-exhausted cities were implemented in 2008, 2009, and 2011, respectively, the study uses a sample of 281 prefecture-level cities in China from 2005 to 2023. This time span captures the developmental changes in urban ecological resilience before and after the policies, allowing for an evaluation of their effects. Descriptive statistics of the variables are reported in Table 2.
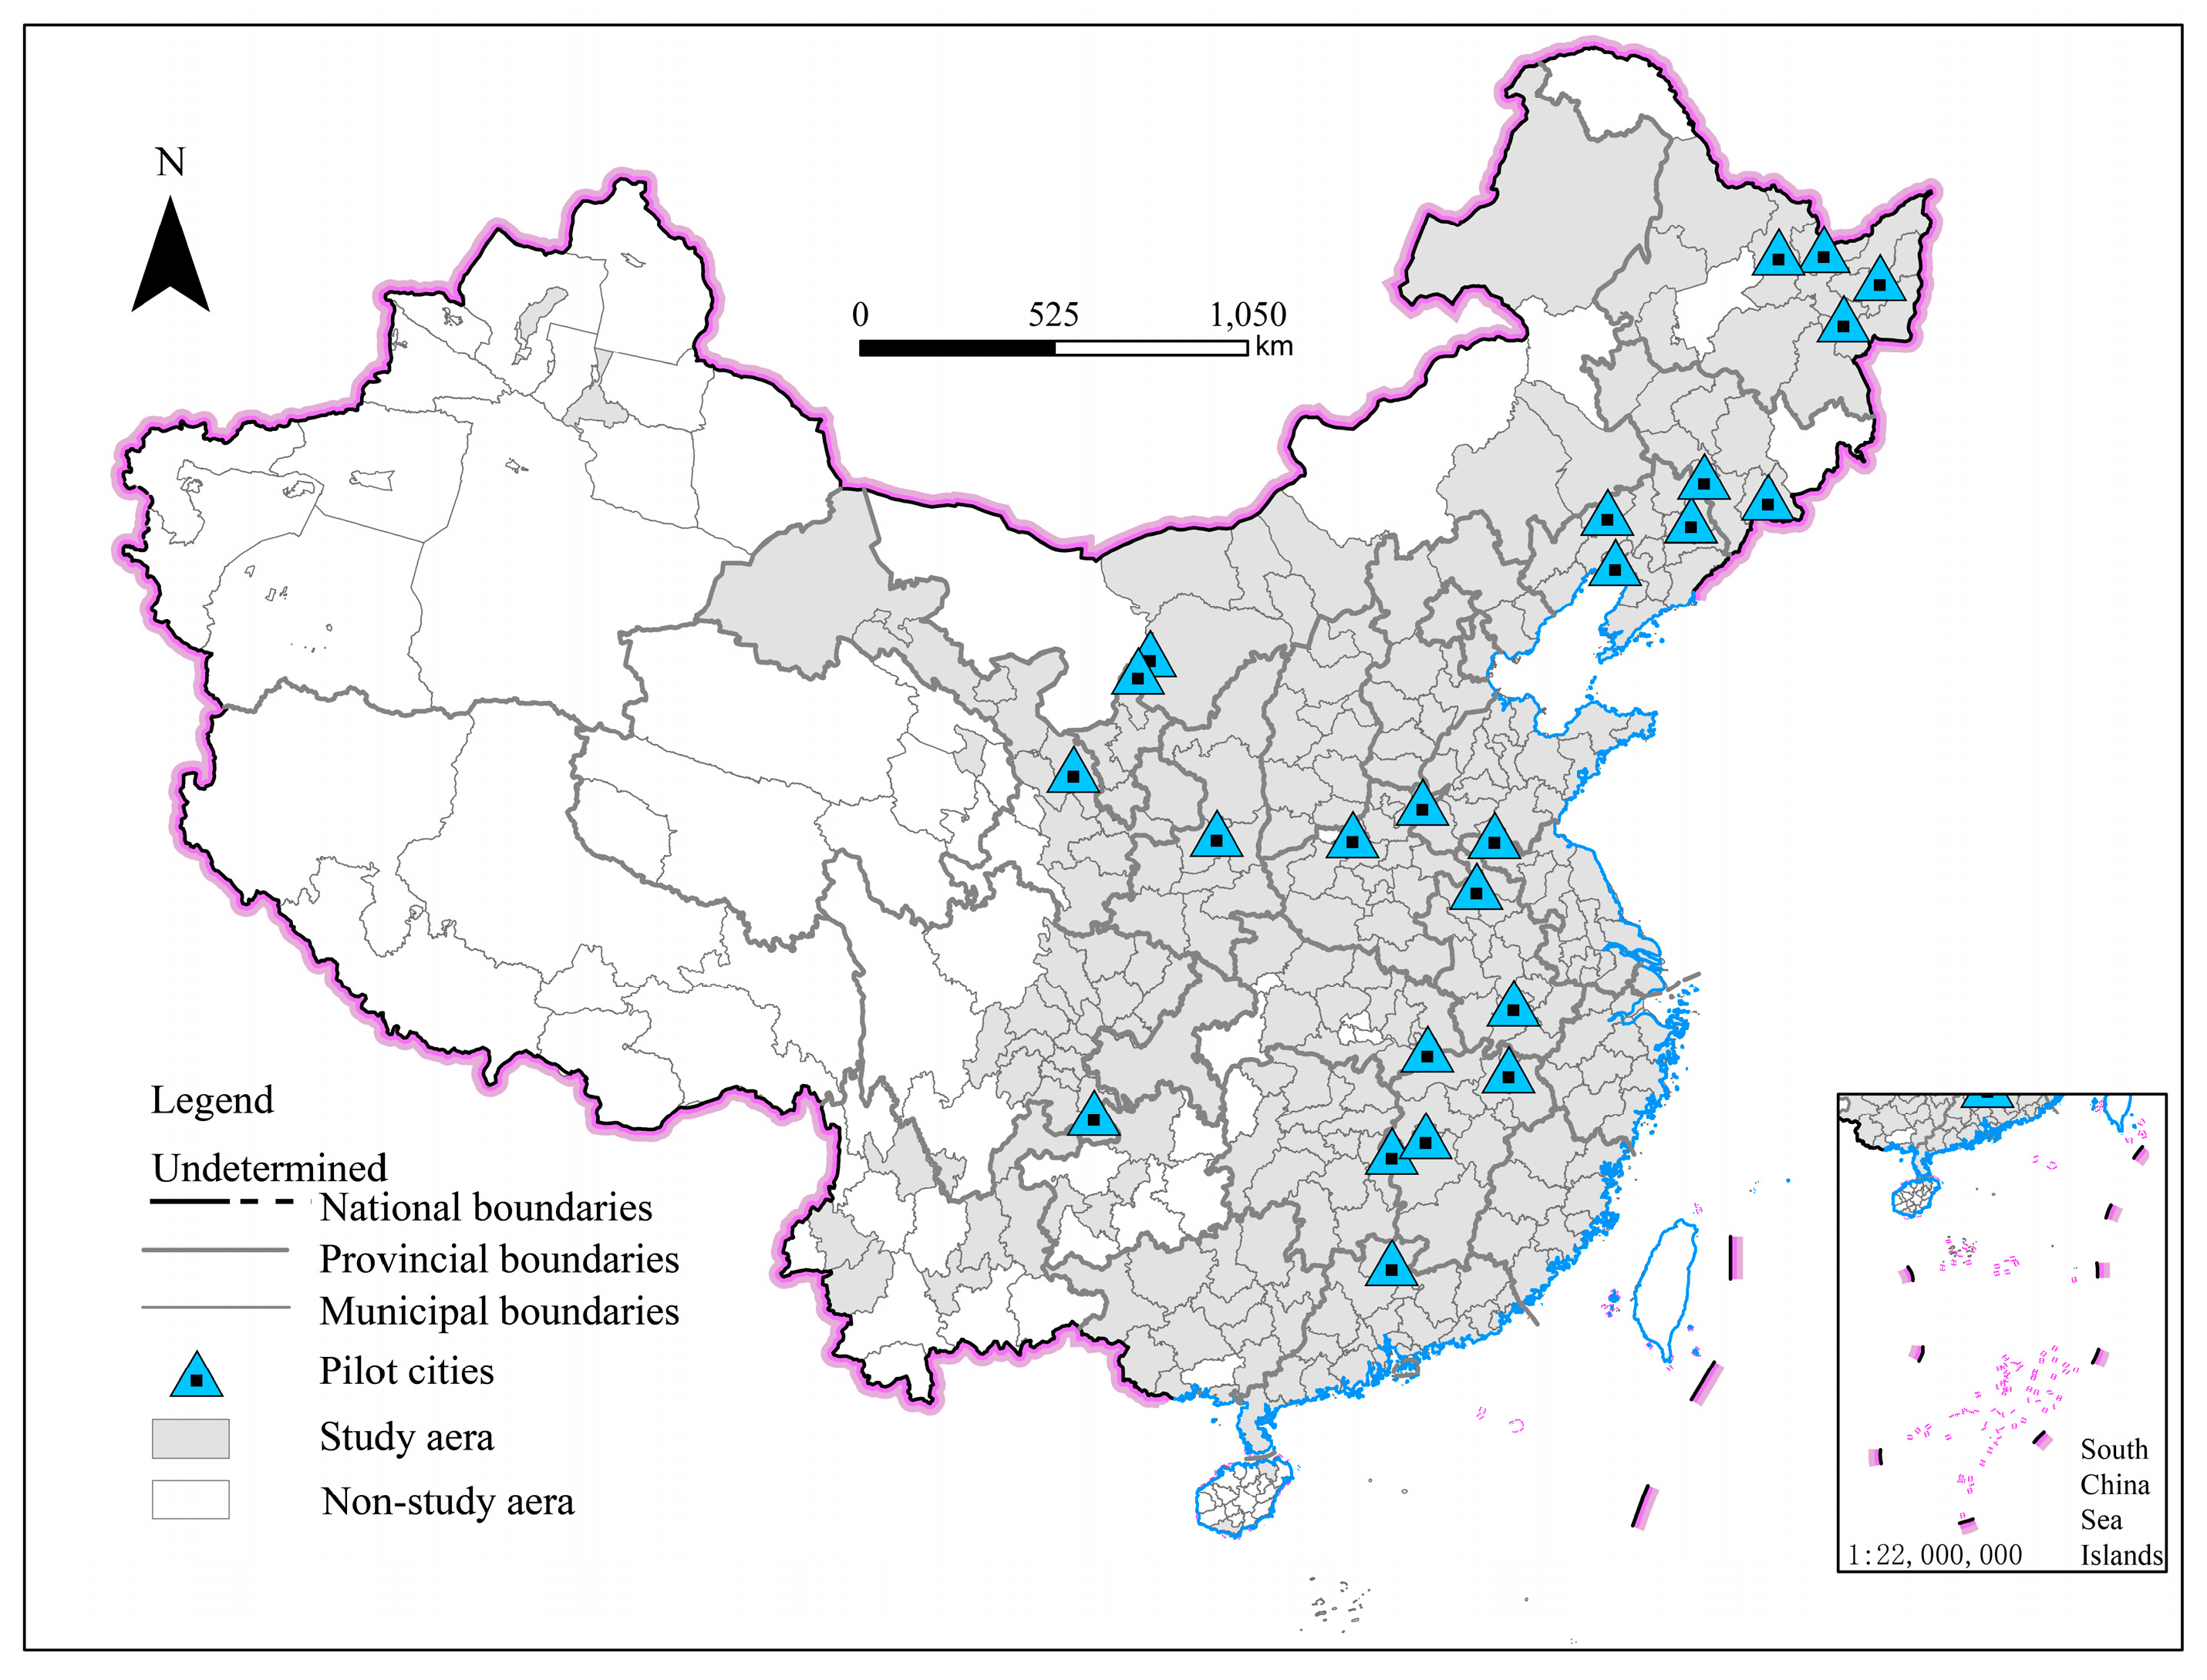
The 24 resource-exhausted cities selected in this study span diverse geographical locations and dominant resource types, reflecting the basic conditions of China’s resource-exhausted cities in a relatively comprehensive manner. The spatial distribution of the specific study areas is shown in Figure 2.

3.4. Evolution Trend Analysis of Urban Ecological Resilience

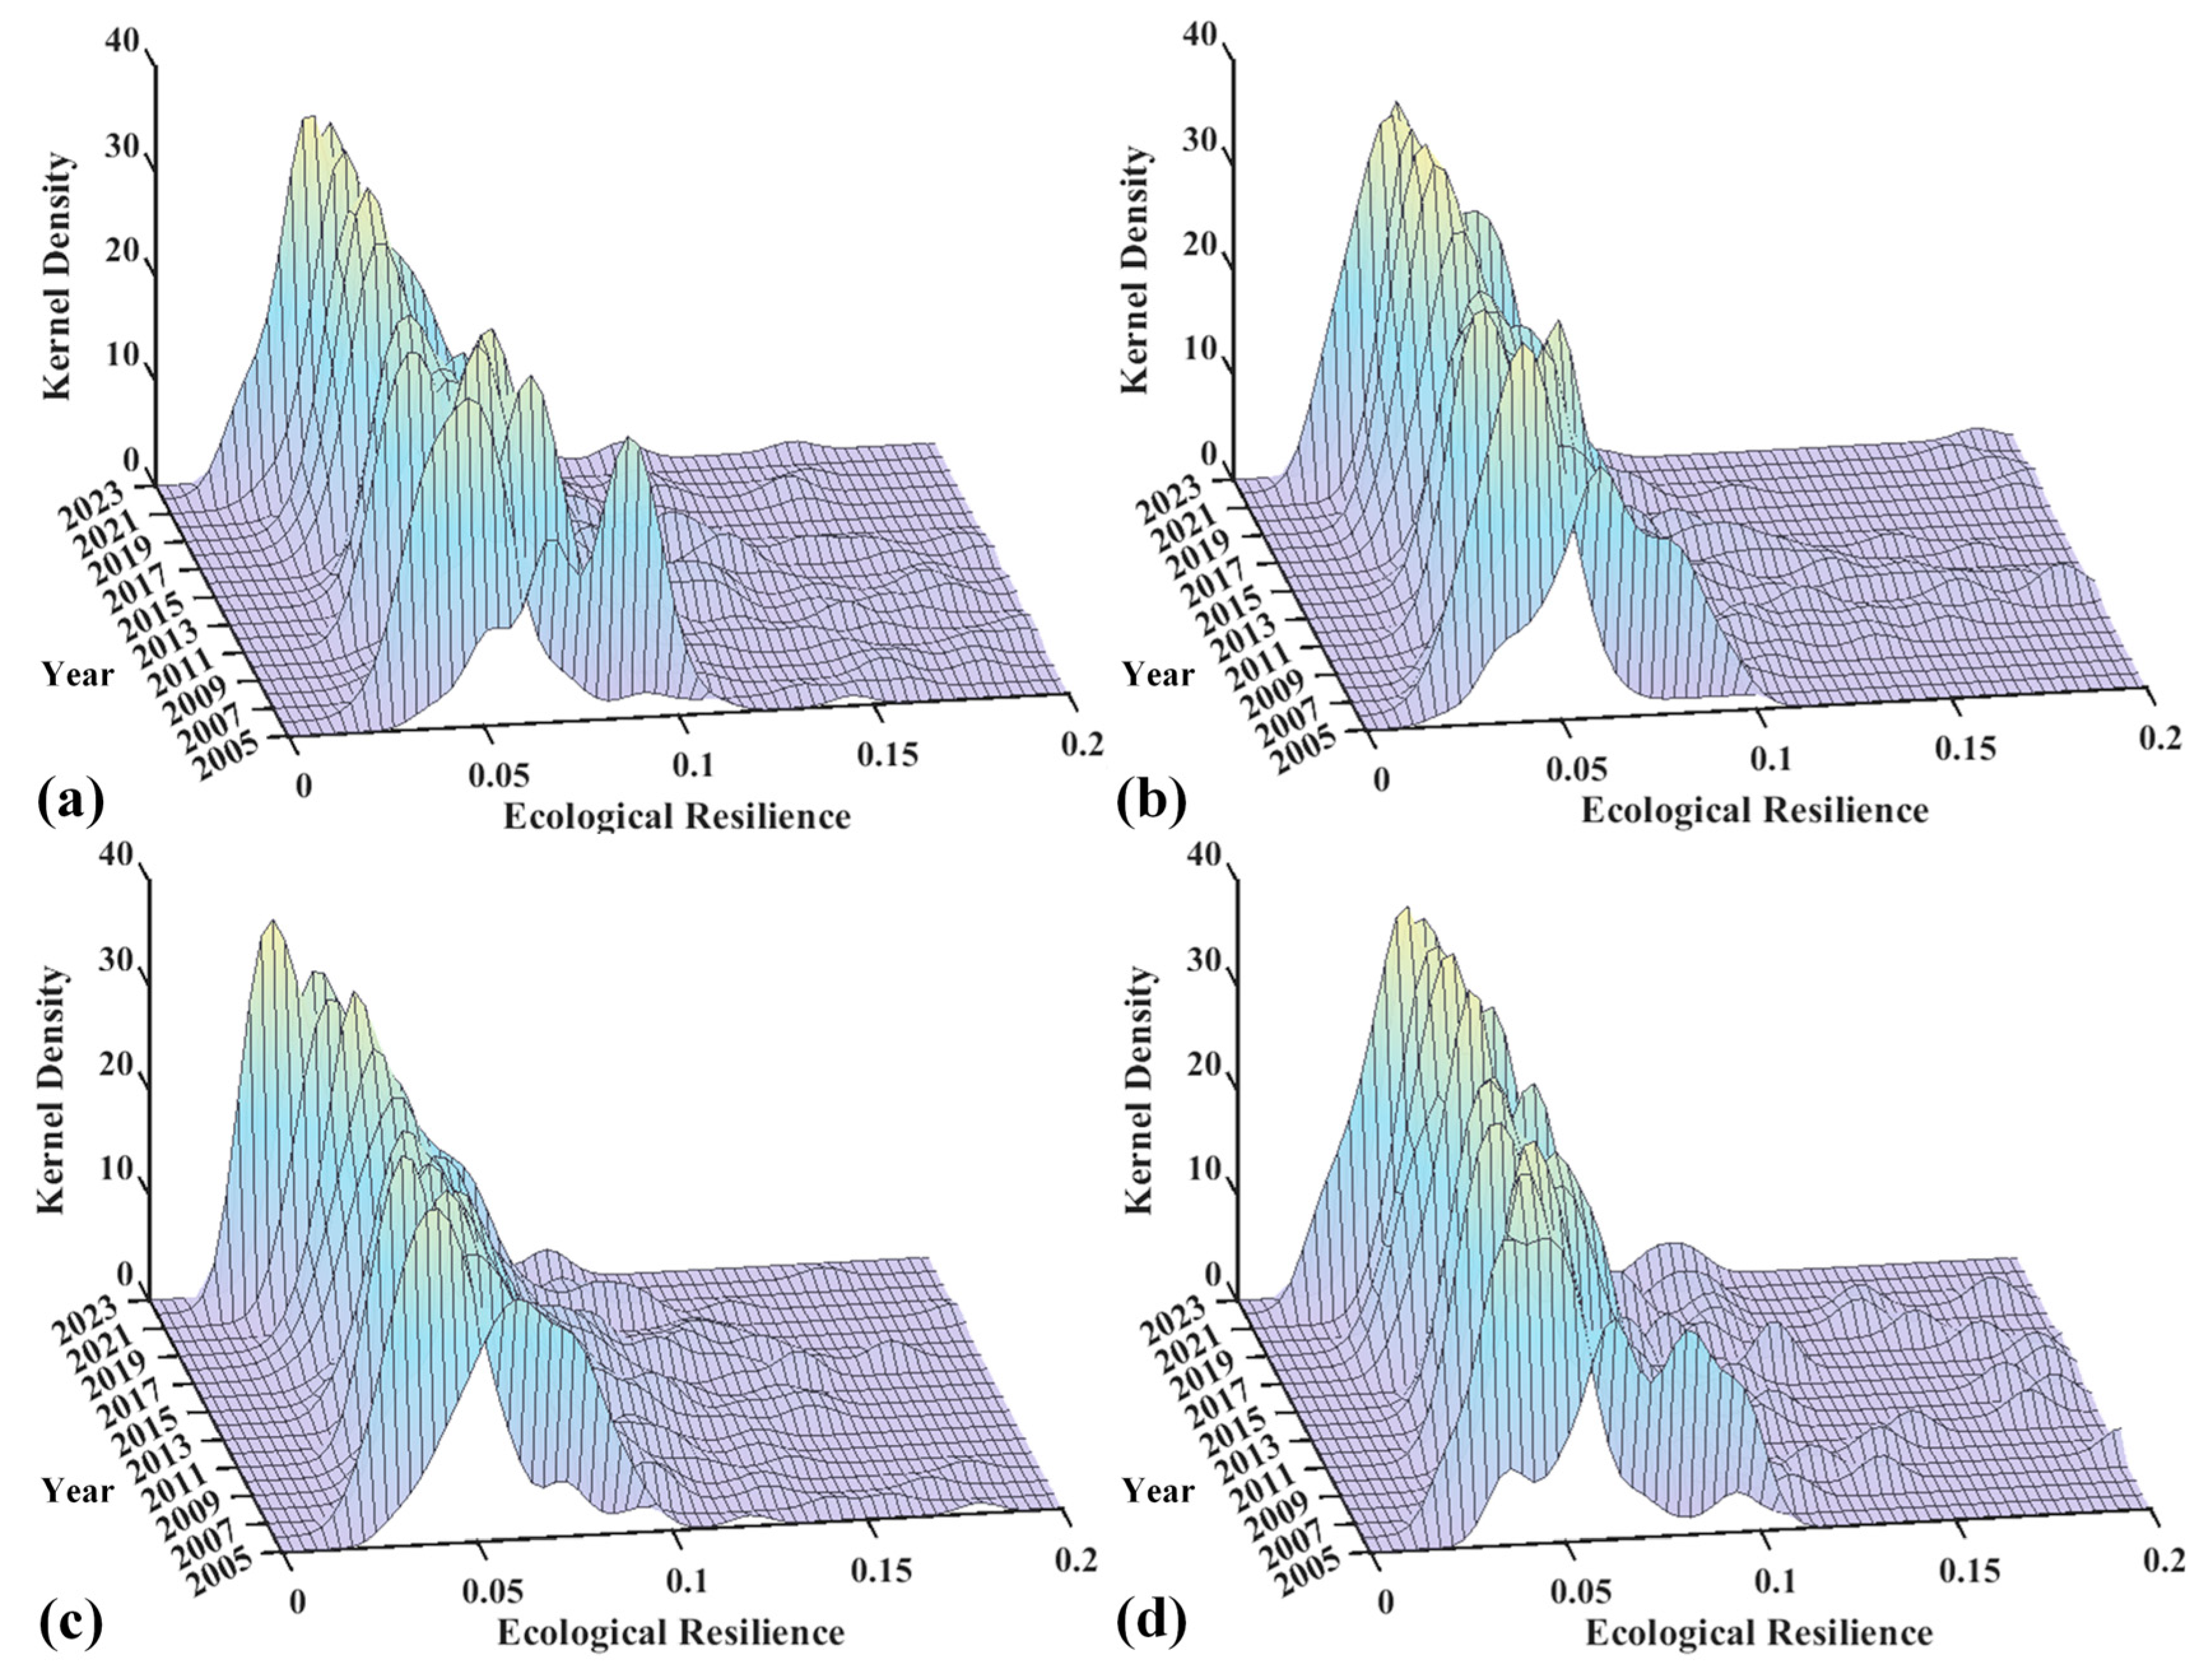
Figure 3 illustrates the spatial evolution of ecological resilience levels across the four major regions from 2005 to 2023. Over the observation period, the main peaks of the kernel density curves for each region remained concentrated in the low-value range, with no noticeable shift to the right, indicating that the overall level of ecological resilience in the four major regions increased at a relatively slow pace. In the distribution patterns, significant differences were observed among regions. The Central and Western regions consistently exhibited a high and narrow single-peak structure, reflecting strong internal spatial homogeneity. In contrast, the Eastern and Northeastern regions gradually shifted from a single-peak to a double-peak or multi-peak intertwined structure during the later stages of the evolution, indicating that these regions have experienced pronounced spatial polarization or multi-level differentiation. For the temporal evolution, the kernel density curves across all regions exhibit gradual, relatively smooth changes without abrupt morphological shifts. However, peak height in the Central and Western regions declined in the later stages, suggesting that absolute internal disparities are widening dynamically. For the distribution extent, all four major regions exhibit a distinct right-tailed pattern, with slight fluctuations in the tail segments. It is worth noting that a small number of leading provinces and cities within each region have been the first to achieve a high level of ecological resilience. In other words, regional ecological resilience exhibits a non-equilibrium diffusion pattern, characterized by clustering of low values and divergence of high values.

4. Empirical Results

4.1. Parallel Trend Test

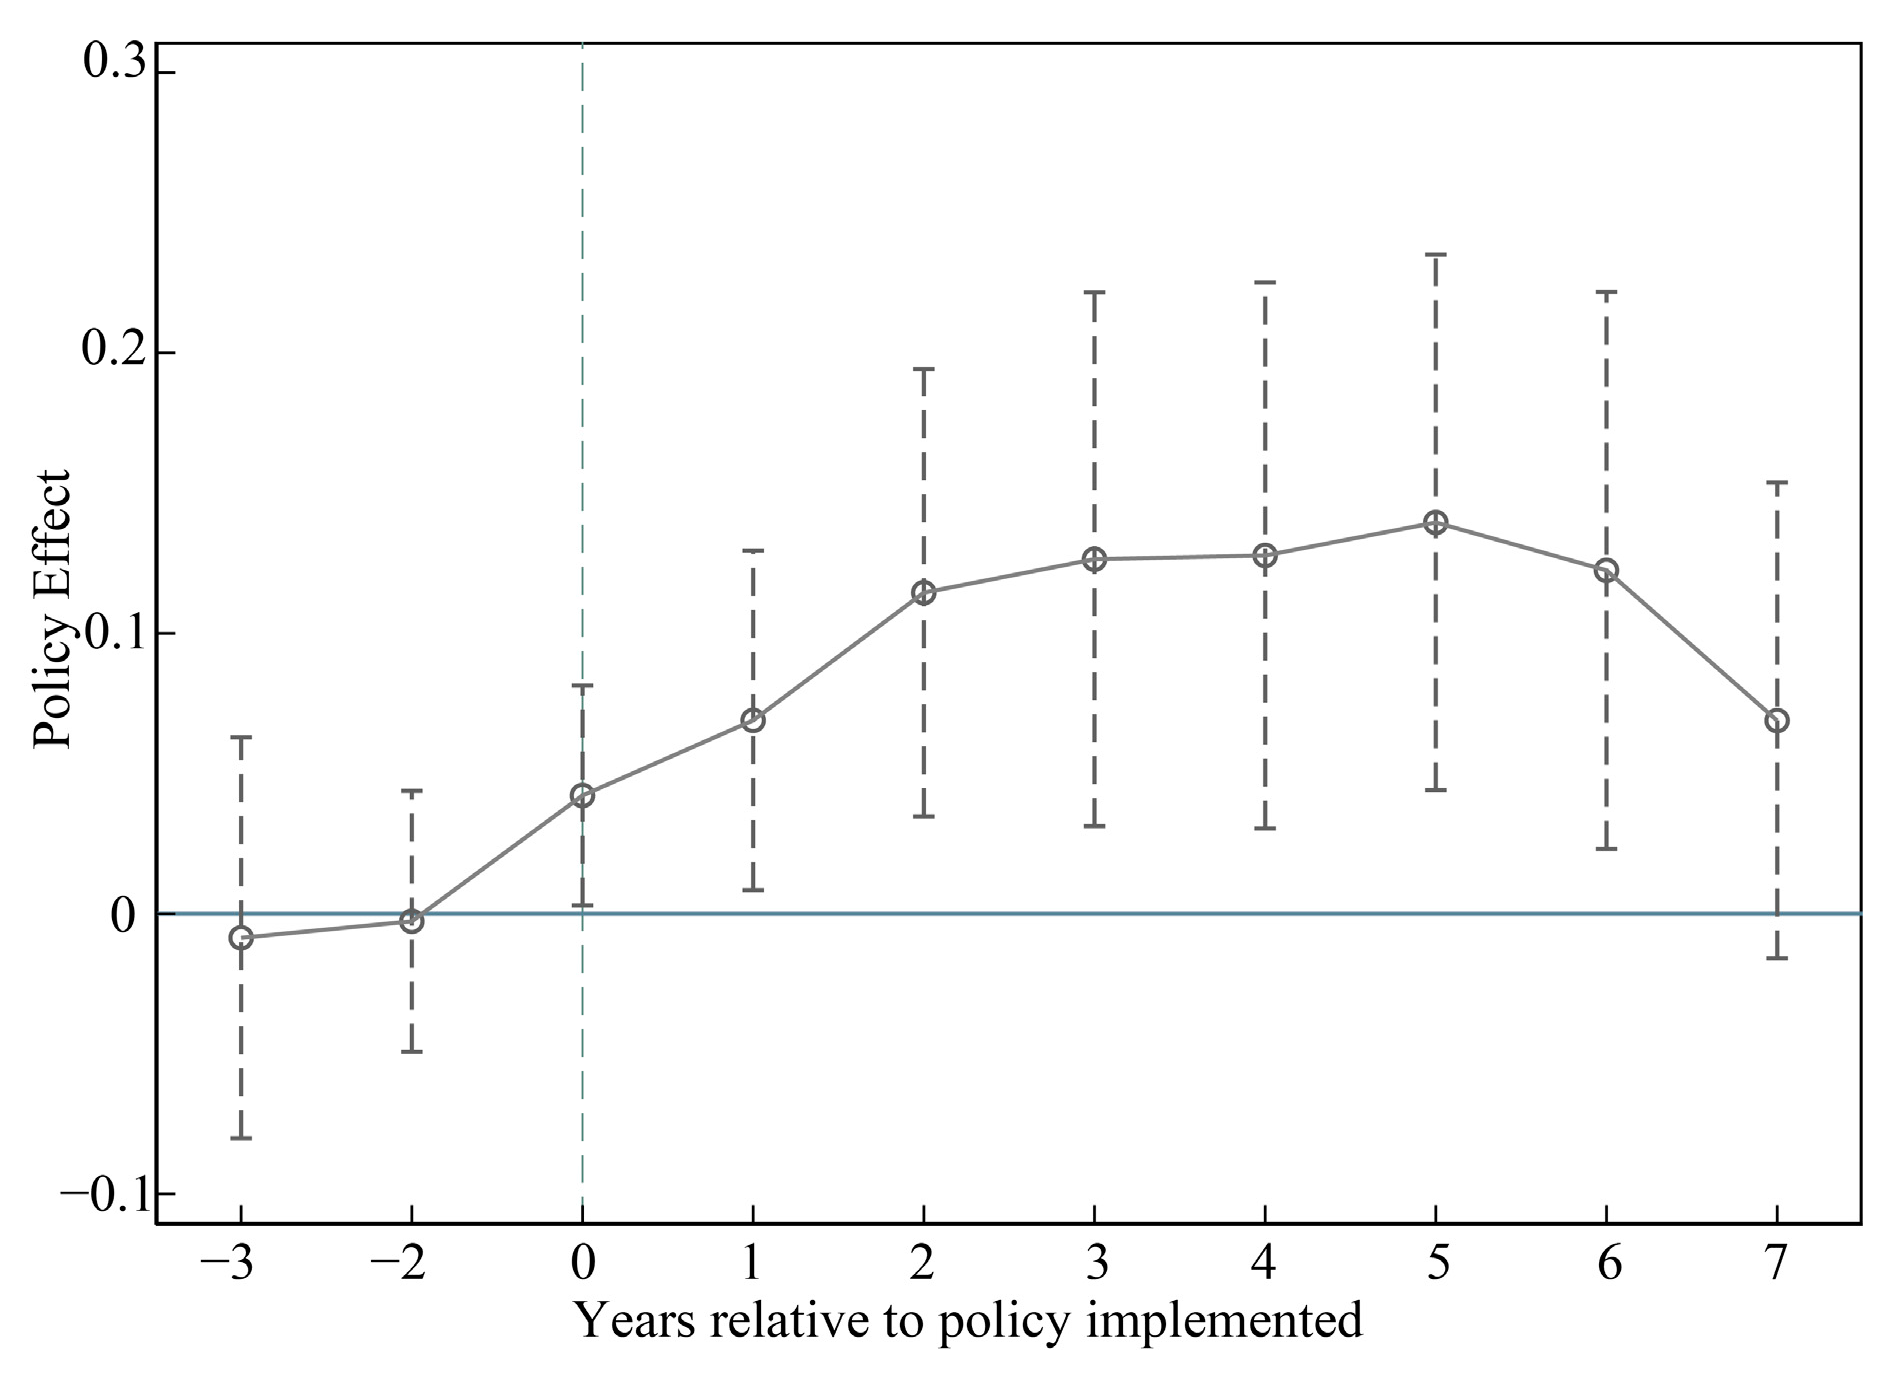
Before using the DID method to identify the effects of supportive policies, it is necessary to demonstrate the validity of the parallel-trends assumption. That is, in the absence of external supportive policies, there is no significant difference in the trends of ecological resilience between non-resource-exhausted and resource-exhausted cities. Therefore, we specified a regression model with the interaction term between the pre- and post-policy dummy and the treatment dummy as the explanatory variable. The period spanning three years before and seven years after the policy’s implementation was selected as the observation period to evaluate its long-term impact. Furthermore, the year before the policy’s implementation was used as the base period for the parallel trends test. The results are shown in Figure 4. Before implementing the supportive policy, all estimated coefficients were insignificant, indicating the validity of the parallel trends.

4.2. Baseline Regression Analysis

The results regarding the impact of supportive policies on urban ecological resilience are presented in Table 3. Additionally, the results obtained after sequentially incorporating control variables and time-specific fixed effects are presented in columns (1)–(4). The results above show that supportive policies consistently have a significant positive impact on urban ecological resilience, regardless of whether control variables are accounted for. Column (4) shows that supportive policies raised urban ecological resilience by approximately 9.6%, which has tangible significance for environmental improvement. Therefore, as a systemic intervention, supportive policies can effectively alleviate the imbalance in the human-land relationship in resource-exhausted cities and enhance urban ecological resilience, thereby verifying the validity of Hypothesis 1. The results of the dimensional analysis indicate that these policies have a significant positive impact on resistance and adaptability, while the effect on recoverability is not significant in columns (5)–(7). Improvements in resistance and adaptability depend on governance measures and infrastructure development that can be directly changed. However, recoverability is linked to the long-term self-repair capacity of ecosystems, and its improvement often lags behind the policy cycle. Furthermore, after adjusting the sample to include only resource-based cities in column (8), the effect of supportive policies on enhancing ecological resilience weakened somewhat. Then, compared to resource-based cities, the ecological conditions and environmental foundations of non-resource-based cities differ more significantly from those of resource-exhausted cities. Therefore, relative to non-resource-based cities, the estimated treatment effect is larger, indicating that the policy effect remains meaningful in a more rigorous comparison sample and further supporting the effectiveness of supportive policies in raising the ecological resilience of resource-exhausted cities.

4.3. Robustness Tests

4.3.1. Addressing Clustered Standard Error Concerns

Given that the treatment group contains only 24 cities, conventional cluster-robust standard errors may be overly optimistic in small samples. We thus recalculate the p-values of the core coefficients using the wild cluster bootstrap [42] with 1000 replications. As reported in column (1) of Table 4, p-value is 0.062, and both the sign and magnitude of the coefficient remain consistent with the baseline results, which indicates that the baseline conclusions are not sensitive to the way clustered standard errors are specified.

4.3.2. Alternative Weighting Method

The entropy method depends on the degree of data variability; therefore, we reweigh the indicators using an equal-weighting scheme and recompute the urban ecological resilience index. As reported in column (2) of Table 4, the coefficient on supportive policies is 0.089 and statistically significant at the 10% level, broadly matching the baseline estimates in both sign and magnitude. The coefficient shrinks slightly, but the core conclusion holds, suggesting that the main findings do not rest on the particular weighting scheme of the entropy method and are robust.

4.3.3. PSM-DID Test

Given the potential for sample selection bias in the implementation of the supportive policy pilot, the robustness check was performed using the PSM-DID approach. The treatment and control groups were matched using 1:1 nearest-neighbor matching with a caliper of 0.05. As reported in Table 5, all covariates have standardized absolute deviations below 10% after matching, and all p-values exceed 0.1, indicating that the matching procedure removed systematic differences between the two groups. The common support condition is satisfied, with 97.58% of observations falling within the common support region after matching. The regression results for the matched sample show that (Table 4, column (3)), after accounting for sample selection bias, the policy continues to enhance urban ecological resilience. These findings align with the baseline estimates, further confirming the robustness of the policy effect.

4.3.4. Placebo Test

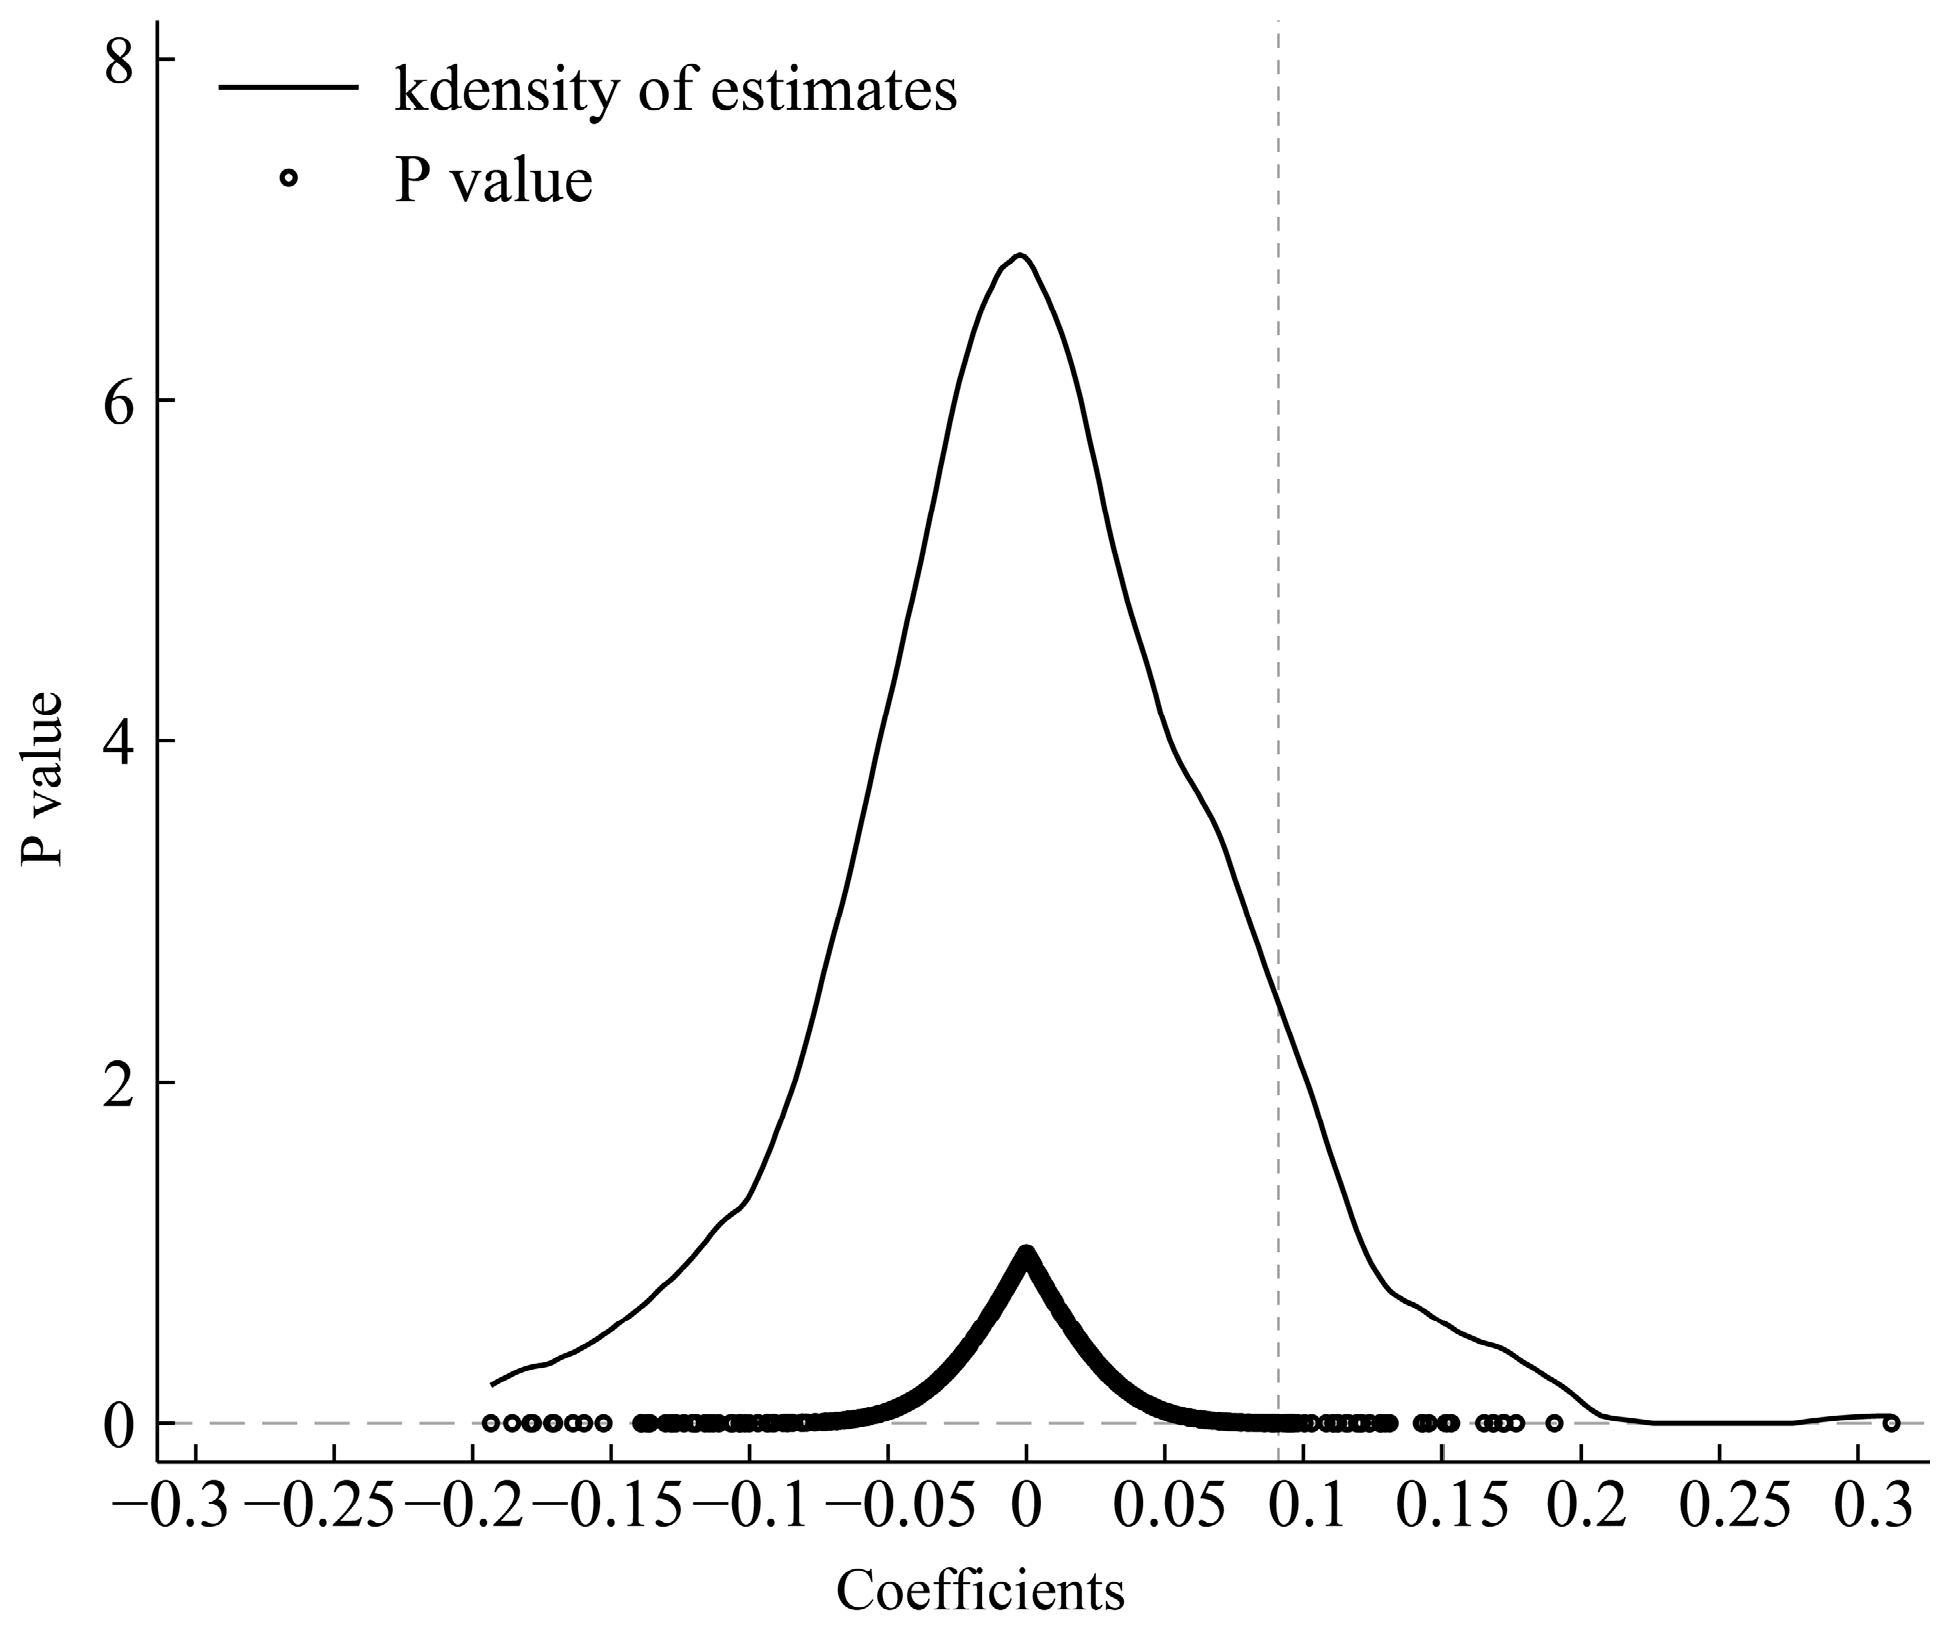
To ensure the accuracy of the estimates, 24 cities were randomly selected from the sample to serve as a dummy treatment group. Based on 500 regression analyses, kernel density distributions of the estimated coefficients and p-values were plotted in this study, as shown in Figure 5. The estimated coefficients follow a normal distribution centered at 0, and the vast majority of the corresponding p-values are greater than 0. Therefore, the estimated coefficients are not significant in most cases within the sample. Additionally, the true estimated coefficients from the baseline regression are located on the right side of the distribution, clearly identified as outliers. Therefore, the positive effect of supportive policies on urban ecological resilience is not confounded by the omission of other important variables, and the results are robust.

4.3.5. Confounding Policy Control Test

Two years after the announcement of the three pilot city batches for the transformation of resource-exhausted cities, the Sustainable Development Plan for Resource-Based Cities (hereinafter, the “Plan”) was officially issued. The Plan covers 262 resource-based cities, which overlap significantly with the cities on the list of pilot projects for transforming resource-exhausted cities. Therefore, the implementation of the Plan may affect the accurate assessment of the effects of supportive policies for resource-exhausted cities. To address this, following the approach in [43], two methods were employed. As shown in column (4) of Table 4, the first method is the exclusion of confounding factors, which involves readjusting the period to 2005–2012 to eliminate potential policy interference in this study. As shown in column (5) of Table 4, the second approach is the policy continuity method, which treats the cities included in the Plan as the fourth batch of resource-exhausted pilot cities. Based on the two methods described above, the coefficient on the supportive policy interaction term remains significantly positive, consistent with the results of the baseline regression. Therefore, regardless of whether the Plan affects it, the supportive policy can effectively enhance the ecological resilience of resource-depleted cities.

4.3.6. Dual Machine Learning-Based Causal Inference Test

Dual Machine Learning is used to estimate treatment effects [44]. It employs orthogonalization techniques to reduce estimation bias, yielding unbiased and normally distributed regression results. The regression results obtained using the Random Forest and Lassocv algorithms are shown in columns (6) and (7) of Table 4, respectively. The impact of supportive policies on urban ecological resilience remains significantly positive, indicating that the conclusions drawn from the baseline regression are robust.

4.3.7. Average Treatment Effect Heterogeneity Test

Since the multi-period DID model may involve negative weights for some treatment effects, the estimated average treatment effect may be biased. Therefore, following the approach of Callaway et al. [45] and Arkhangelsky et al. [46], the effect of these supportive policies is re-estimated using the CSDID and SDID methods in this study, as shown in columns (8) and (9) of Table 4. The coefficients for supportive policies in resource-exhausted cities remain significantly positive, further validating the robustness of the baseline regression results.
Given that the multi-period DID estimator can be biased under heterogeneous treatment effects [47], the Bacon decomposition is applied as a robustness check [48]. As shown in Table 6, the decomposition shows that the net effect accounts for 98.37% of the policy’s total impact on urban ecological resilience, indicating that comparisons with the untreated group almost entirely drive the treatment effect. Heterogeneous treatment effects therefore introduce no meaningful bias, and the results remain robust.

4.4. Mechanism Analysis

Since supportive policies may affect urban ecological resilience through multiple channels, we construct the following mediation effect model and employ the bootstrap method for mechanism testing [49,50]. The specific model is as follows:
M i t   =   β 0 + β 1 R e s o u r c e i t + β 2 C o n t r o l s i t + μ i + ν t + ε i t
R e s i l i e n c e i t = β 0 + β 1 R e s o u r c e i t + β 2 M i t + β 3 C o n t r o l s i t + μ i + ν t + ε i t
where Mit represents the mechanism variables (green technology innovation level, energy consumption level, and environmental governance effectiveness). Significant coefficients on these variables indicate that supportive policies for resource-exhausted cities affect urban ecological resilience through the channels captured by Mit.

4.4.1. Green Innovation

Urban green innovation is measured by the number of green invention patent applications filed in a city, based on the WIPO Green Patent Inventory [51]. The coefficient of supportive policies in column (1) of Table 7 is significantly positive, showing that supportive policies raise the level of urban green innovation. In resource-exhausted cities, such policies strengthen the internal vitality of green innovation across regions through instruments like special subsidies and investment grants. In column (2), the regression coefficients of both supportive policies and green innovation on urban ecological resilience are significantly positive, suggesting that higher levels of urban green innovation can optimize resource allocation, improve resource utilization efficiency, reduce environmental pressure, and thus enhance urban ecological resilience. Bootstrap results based on 500 replications indicate that green innovation mediates the effect of supportive policies on ecological resilience at the 1% level, with an indirect effect of 0.0110.

4.4.2. Energy Consumption

Energy consumption per unit of GDP captures the energy consumption level [52]. In column (3) of Table 7, the estimated coefficient of supportive policies on urban energy consumption is significantly negative, showing that supportive policies markedly reduce urban energy consumption. In terms of energy saving and consumption reduction, these policies strengthen urban ecological resilience mainly by lowering energy consumption intensity. Guided by the principle of sustainable development, supportive policies for resource-exhausted cities curb ecological degradation at its source by steering the energy structure toward optimization and improving energy efficiency. Column (4) shows that energy consumption intensity has a significantly negative coefficient, while the supportive policies coefficient is positive. This suggests that reduced energy intensity drives the transition to green, low-carbon models, thereby supporting ecosystem stability and regional ecological resilience. Bootstrap tests with 500 replications confirm that the mediating effect of energy consumption level in the relationship between supportive policy and ecological resilience is significant at the 5% level, with an indirect effect size of 0.0010.

4.4.3. Environmental Governance

Government environmental attention indicator is constructed from keyword analysis of annual government work reports using text analysis to capture environmental governance effectiveness [53] (see Appendix C for the full keyword list). In column (5) of Table 7, the coefficient of supportive policies on urban environmental governance effectiveness is significantly positive, showing that supportive policies raise environmental governance effectiveness. In column (6), the estimated coefficients of both supportive policies and environmental governance effectiveness are significantly positive. Supportive policies for resource-exhausted cities promote urban ecological resilience by strengthening government environmental attention and regulatory intensity, improving the environmental supervision system, intensifying ecological conservation, and enhancing environmental governance effectiveness. Bootstrap tests with 500 replications confirm that the mediating effect of environmental governance in the relationship between supportive policy and ecological resilience is significant at the 5% level, with an indirect effect size of 0.0038.
Ultimately, by promoting urban green innovation, reducing energy consumption, and improving environmental governance effectiveness, these supportive policies can enhance urban ecological resilience, thereby validating Hypothesis 2.

4.5. Heterogeneity Analysis

In this study, resource-exhausted cities were categorized into four geographic regions: eastern, central, western, and northeastern. As shown in columns (1)–(4) of Table 8, supportive policies can significantly enhance the ecological resilience of resource-exhausted cities in the eastern and northeastern regions, while exerting no significant effect on that of the central and western cities. Cities in the eastern region possess greater advantages in terms of economic foundations, geographic location, and ecological governance, and are better equipped to withstand the growing pains of resource depletion. As a traditional industrial base, the northeastern region boasts well-developed industrial infrastructure. Supportive policies can facilitate the green retrofitting of existing infrastructure and enable its replication and promotion across the region, thereby creating economies of scale to enhance ecological resilience. In the eastern and northeastern regions, the development of successor industries and emerging environmental protection industries can leverage favorable policies and the existing industrial base, thereby promoting an overall improvement in urban ecological resilience [54]. In contrast, resource-exhausted cities in the central and western regions have relatively weak economic development and ecological foundations. Additionally, some cities have limited capacity for ecosystem restoration and a monolithic industrial structure. Consequently, the manifestation of ecological benefits is slow, and the role of supportive policies in enhancing overall ecological resilience is also limited.
Furthermore, to study the impact of supportive policies on ecological resilience, resource-based cities were classified into four categories: coal-based, metal-based, forestry-based, and other types. As shown in columns (5)–(8) of Table 8, supportive policies have a significant positive impact on the ecological resilience of coal-based and forestry-based cities, while showing no significant impact on the ecological resilience of the other two types of cities. Although coal-based cities have long relied on coal extraction and use, supportive policies can help restore ecological resilience by promoting mine reclamation, supporting successor and alternative industries, and increasing investment in environmental governance [55]. Forestry-based cities rely on renewable forest resources and can develop green industries such as forest-based economies and ecotourism. These transformation pathways can reduce the reliance on natural resources and lower the risk of environmental pollution and ecological damage, thereby enhancing ecological resilience [56].

4.6. Spatial Spillover Effect Analysis

The model specification test results are presented in Table 9. The LM test results indicate that significant spatial dependence exists in both the error term and the lag term. The Hausman test results suggest that a fixed effects model should be adopted. The LR test results show that a model incorporating both spatial fixed effects and time fixed effects should be used. Finally, the Wald test applied to the SDM indicates that the spatial Durbin model does not simplify to a spatial lag model or a spatial error model. Therefore, this paper ultimately selects a spatial Durbin model with two-way fixed effects for estimation, and further decomposes the total effect of the policy into a direct effect and an indirect effect, where the former reflects the policy’s impact on the local region and the latter reflects its spatial spillover effect on neighboring regions. The specific model is as follows:
R e s i l i e n c e i t = α 0 + ρ ω i t R e s i l i e n c e i t + α R e s o u r c e i t + γ X i t + δ ω i t X i t + ρ t + q t + ε i t
where ωit represents an N*N spatial weight matrix constructed from the adjacency and geographic distance matrices, and the definitions of the other variables are the same as in the baseline model. ρ represents the spatial autocorrelation coefficient of urban ecological resilience, and α represents the coefficient of the impact of supportive policies on local ecological resilience.
Table 10 reports the analysis results of spatial spillover effects under the adjacency matrix and the geographic distance matrix. Under the adjacency matrix, the coefficient of the spatial lag term of the explanatory variable is significantly positive, indicating that supportive policies significantly enhance urban ecological resilience. According to LeSage and Pace (2014), the main regression results of the SDM serve only as a preliminary judgment of spatial effects, and the parameter estimates of explanatory variables cannot fully reflect their impact on the dependent variable [57]. Therefore, the total effect should be further decomposed using the partial differential method for spatial regression. Given that this paper focuses on the spatial spillover effects of support policies, the analysis will concentrate on the regression results of indirect effects. Under the adjacency matrix, the indirect effect is significantly positive, suggesting that an increase in the intensity of local supportive policies can drive a significant improvement in the ecological resilience of neighboring cities. Furthermore, robustness checks under the geographic distance matrix are conducted, and under this matrix, the indirect effect remains significantly positive. The indirect effects are significantly positive under both weighting matrices, indicating that the implementation of support policies not only affects the level of urban ecological resilience in the local region but also influences that in neighboring areas, thereby verifying Hypothesis 3.
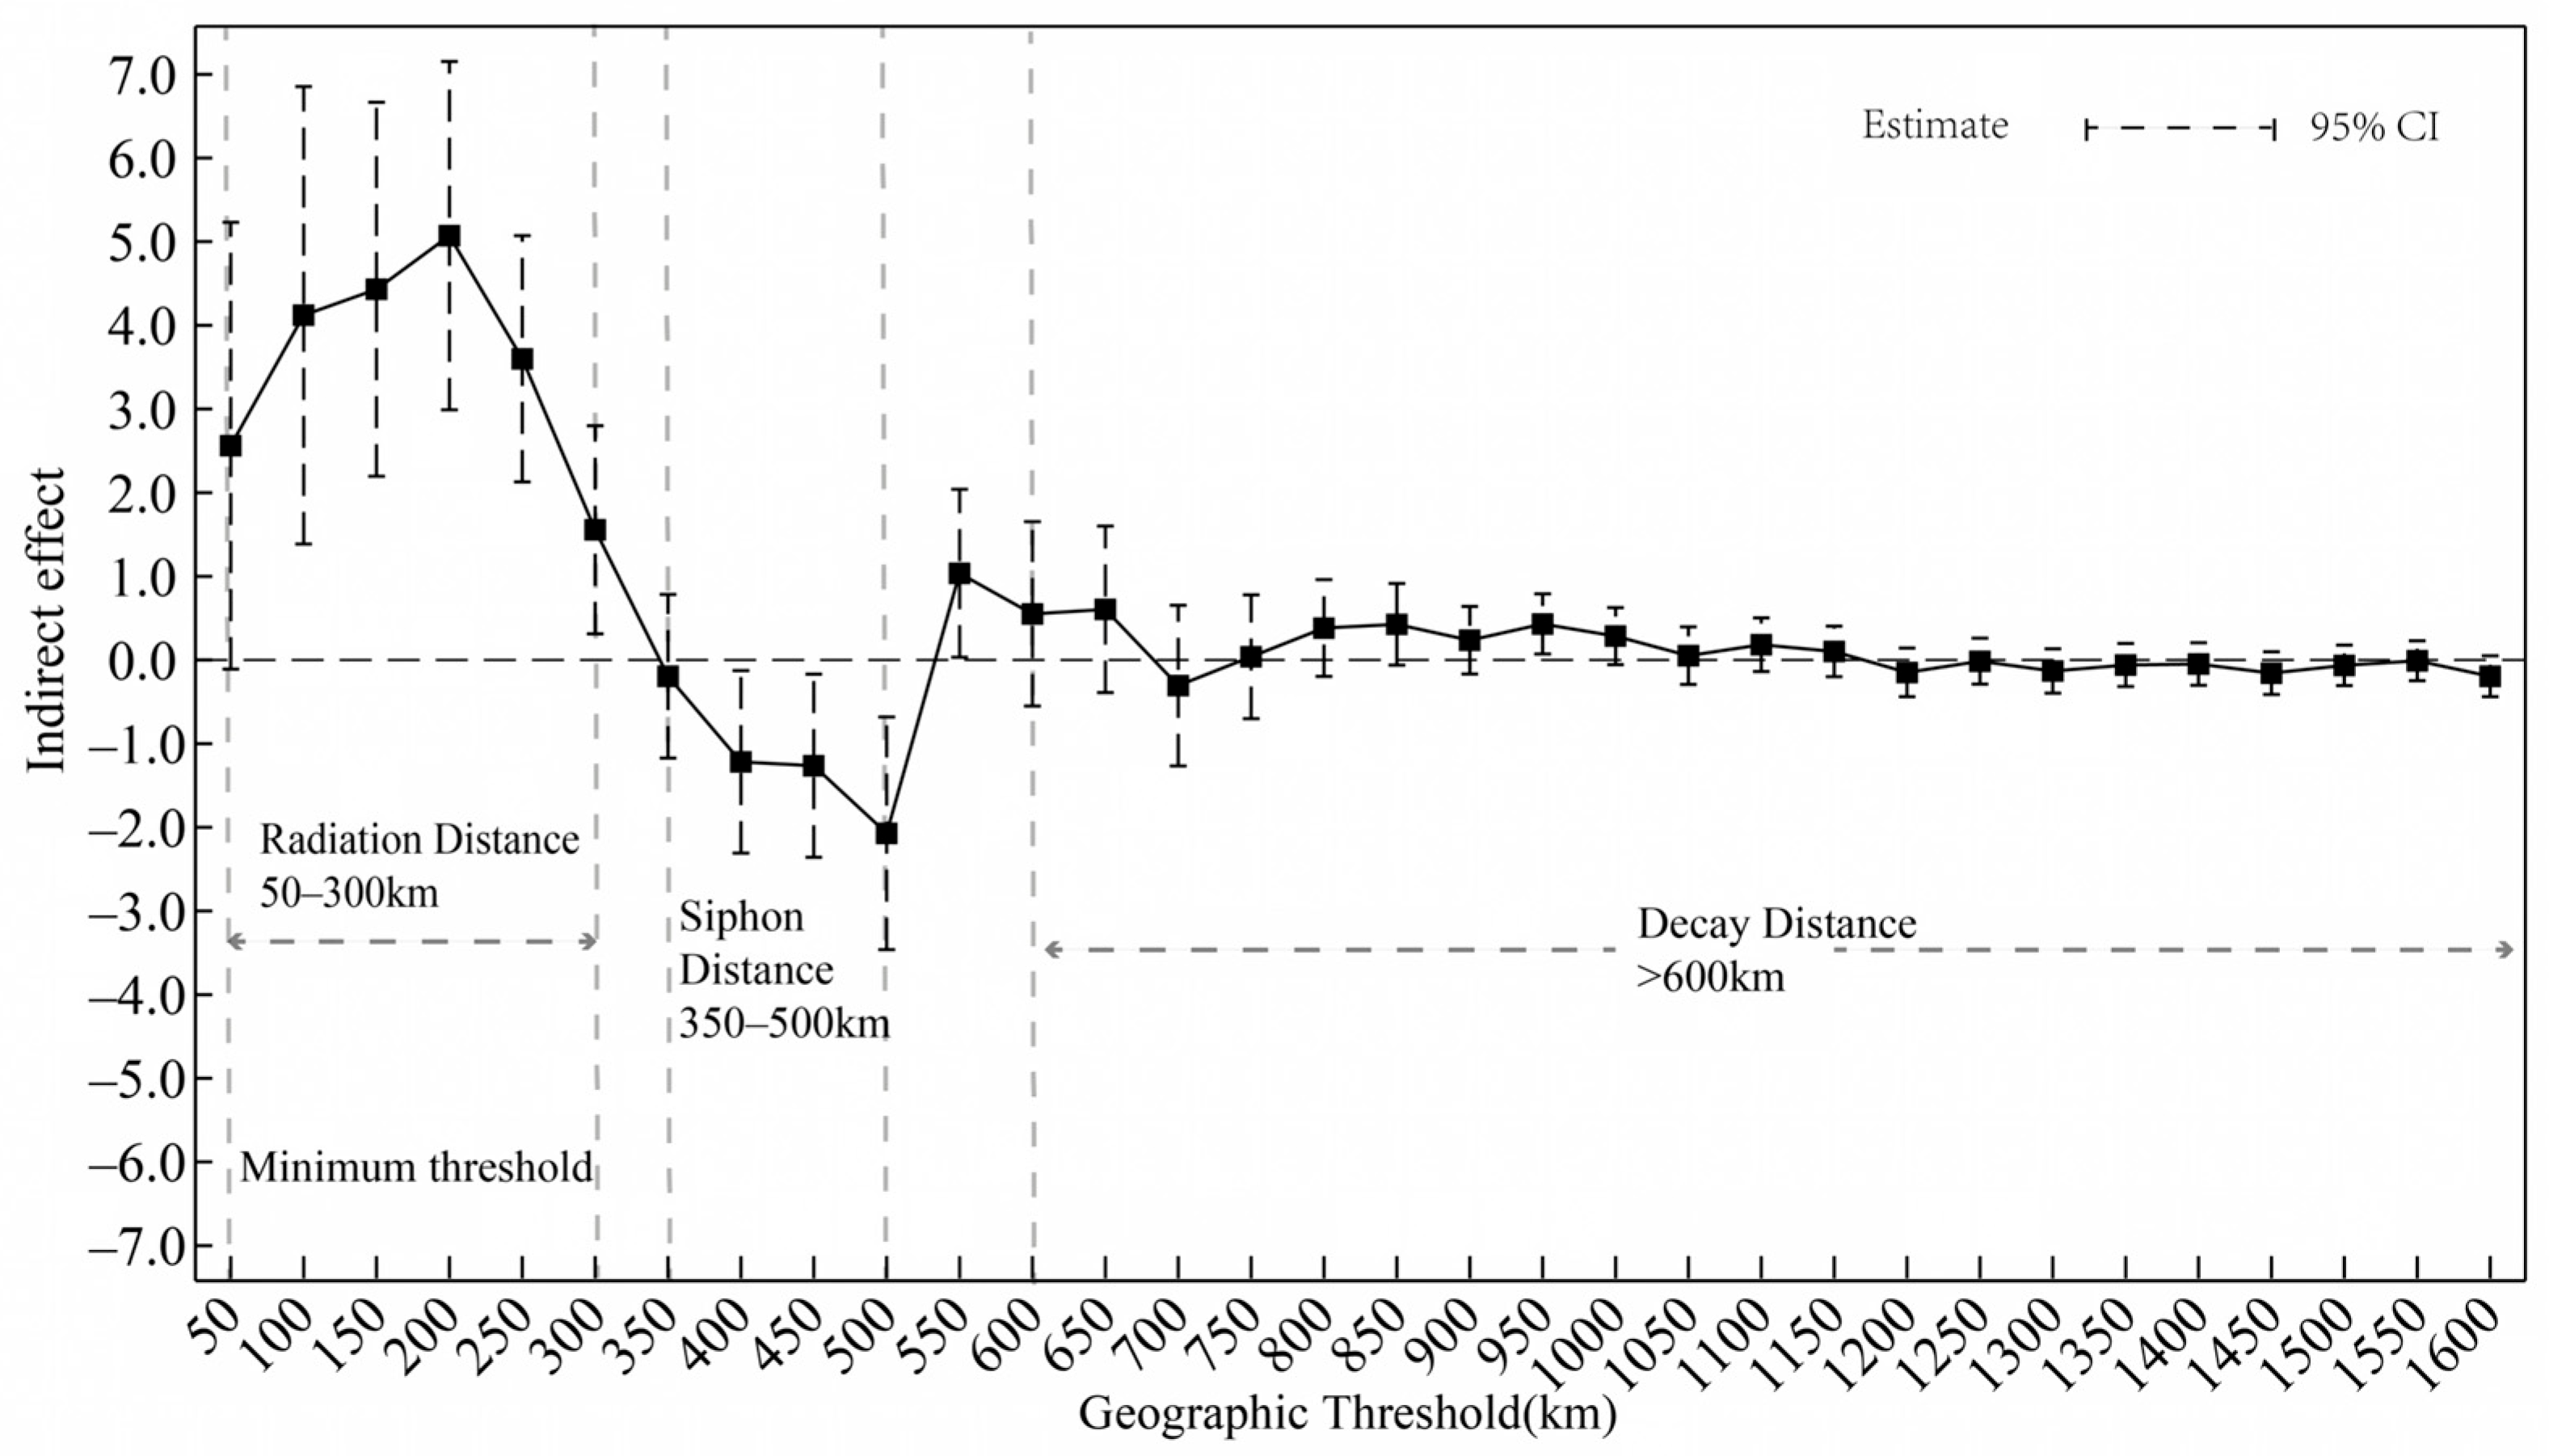
To further examine the spatial spillover boundary of the supportive policies, the initial radiation radius threshold was set to 50 km based on the inverse distance matrix [34] and was extended incrementally by 50 km up to 1600 km to trace the evolution of the policy’s spatial spillover boundary. As shown in Figure 6, the spatial spillover effect of the supportive policy on the ecological resilience of neighboring cities exhibits marked geographic heterogeneity with increasing geographic distance. Specifically, within 0–50 km, the policy’s spatial spillover effect fails the significance test, which may be attributed to the homogeneity in industrial structure, development stage, and resource endowment among cities that are too close to one another, thereby dampening spatial interaction. Beyond 50 km, the changes in the spatial spillover effect can be divided into the following three intervals: (1) 50–300 km is the radiation distance. Within this range, the spatial spillover effect is significantly positive, indicating that the supportive policy can generate positive impacts on neighboring cities. Further analysis reveals that, within the radiation distance, the intensity of the positive spatial spillover first increases with distance, reaches a peak at approximately 200 km, and then gradually weakens, implying to some extent that the optimal radiation radius of the supportive policy for promoting ecological resilience is about 200 km. (2) 350–500 km is the siphon distance. Within this range, the spatial spillover effect is significantly negative, possibly because this interval lies beyond the core radiation scope, and policy resources concentrate in the core area, thereby generating a siphon effect on cross-regional cities and reducing the ecological resilience of peripheral cities. (3) Beyond 600 km is the decay distance. Beyond this distance, the spatial spillover effects of the supportive policies converge to a statistically insignificant level, consistent with the theoretical prediction of spatial attenuation. In addition, the policy effect exhibits a brief positive rebound around a radiation radius of 550 km, which may result from the mutual offsetting of trickle-down and siphon effects at this distance. These findings suggest that the spatial spillover effects of the supportive policies are not unbounded but rather exhibit clear geographical limits, thereby validating Hypothesis 3.

5. Conclusions and Policy Implications

5.1. Conclusions

Using panel data on 281 prefecture-level cities in China from 2005 to 2023, the staggered implementation of supportive policies for resource-exhausted cities is treated as a quasi-natural experiment in this study. We used a multi-period DID model to estimate the policy’s impact on urban ecological resilience and its underlying mechanisms. Subsequently, we utilized the spatial DID model to examine the potential cross-regional effects and spillover boundaries of these policies. The conclusions are as follows: First, supportive policies for resource-exhausted cities effectively enhance urban ecological resilience, and their validity is demonstrated through a series of robustness checks. The dimension-by-dimension analysis reveals that these policies can achieve significant improvements in resistance and adaptability, while the impact on recoverability is limited. Second, the mechanism analysis indicates that supportive policies for resource-exhausted cities enhance urban ecological resilience by promoting green innovation, reducing energy consumption, and strengthening environmental governance effectiveness. Third, heterogeneity analysis indicates that the effectiveness of supportive policies for resource-exhausted cities in enhancing ecological resilience varies with urban location and resource type. These policies have a significant positive impact on the ecological resilience of cities in the eastern and northeastern regions. In contrast, the effect on cities in the central and western regions is not pronounced. Similarly, supportive policies have a significant positive impact on the ecological resilience of coal-based and forestry-based cities. In contrast, the effect on metal-based and other types of cities is not significant. Fourth, the analysis of spatial spillover effects shows that supportive policies designed to strengthen urban ecological resilience exhibit spatial spillover patterns. As geographic distance increases, this pattern undergoes an evolutionary process of radiation, siphon, equilibrium, and decline. Specifically, the radiation distance range with an optimal radius of 200 km is 50–300 km; the siphoning distance is 350–500 km; the equilibrium distance is approximately 550 km; and the decline distance is beyond 600 km.

5.2. Policy Implications

In light of the above conclusions, some recommendations are proposed.
First, the positive role of supportive policies in strengthening urban ecological resilience should be fully leveraged, and long-term mechanisms for building ecological resilience and facilitating a green development transition should be established and improved. Specifically, efforts to protect and restore the ecological environment must be intensified, alongside the transformation and upgrading of resource-based industries to reduce environmental damage. Additionally, guided by scientific and technological innovation and green technologies, the development of resource-based industries should be steered toward the green and low-carbon, thereby improving resource utilization efficiency and reducing emissions. Simultaneously, ecological civilization development should be strengthened to foster widespread public commitment to environmental protection, ensuring that ecological principles are widely embraced. Furthermore, a reliable ecological compensation mechanism should be established to encourage enterprises to increase the investment in environmental protection. By comprehensively integrating measures such as technological innovation, energy conservation, and environmental governance, the ecological resilience of resource-based cities can be enhanced, thereby fostering a mutually reinforcing relationship between economic development and ecological protection.
Second, to enhance urban ecological resilience, some corresponding strategies should be proposed based on the resource endowments, development characteristics, and locational advantages of each city. In other words, differentiated supportive policies can be formulated by identifying the ecological risks and challenges faced by cities in different regions. The innovation-driven development in the eastern region must be strengthened. The systemic transformation and industrial succession must be vigorously promoted in the northeast. In the central and western regions, the upgrading of industrial structures and the transition of growth drivers from old to new should be prioritized to ensure that supportive policies are precisely tailored to the actual requirements of cities in different regions. Additionally, the reasonable plan must be developed based on the uniqueness and diversity of the urban resources. In order to foster distinctive ecological industrial clusters and develop a distinctive ecological economy, the unique resource endowments in non-coal resource cities need to be fully leveraged. Therefore, efforts to restore and manage the ecological environment in coal-based resource cities should be intensified, public awareness of ecological issues should be raised, and the development of green and innovative industries should be supported. Furthermore, a multi-departmental coordination mechanism should be established to strengthen the monitoring and evaluation of policy effectiveness. This will ensure that all departments can work in concert when formulating and implementing supportive policies, thereby continuously and effectively enhancing urban ecological resilience.
Third, the spillover effects of supportive policies should be fully leveraged to strengthen coordination and synergy among policies. The dividends and positive externalities of these policies need to be utilized to promote the coordinated ecological and environmental development of resource-exhausted cities and the surrounding areas. On the one hand, the implementation of supportive policies needs to be further strengthened to enhance the positive spillover effects and promote the simultaneous improvement of ecological resilience in surrounding areas. Based on the policy guidance and financial support, resource-depleted cities should be encouraged to achieve breakthroughs in ecological restoration, pollution control, and the development of green industries, thereby providing replicable experiences and models for neighboring cities. On the other hand, the interregional cooperation and exchange need to be strengthened to promote resource sharing and complementary advantages, and to jointly build a regional ecological security framework. For cities located within 200 km, the cooperation between resource- exhausted cities and neighboring cities can be deepened through the establishment of collaborative platforms and the launch of joint initiatives in various fields, such as ecological conservation, environmental governance, and green development. For cities located more than 600 km away, it is necessary to overcome administrative boundaries and establish or improve cross-regional cooperation channels that can effectively counteract the siphon effect of core urban areas.

5.3. Limitations and Future Research

First, the entropy method is limited by its reliance on data variability alone, disregarding the substantive importance of indicators. Since per capita water resources and per capita land area differ substantially across cities, the entropy method assigns a relatively high weight to the recoverability dimension. As a result, the ecological resilience index partly captures disparities in natural endowments between cities and does not fully reflect the state of the ecological environment under policy intervention. The dimension equal-weighting method used as a robustness check yielded consistent conclusions, but the measurement of ecological resilience still requires further development and refinement.
Second, adjacency matrices and geographical distance matrices can only partially represent inter-city correlations. They do not adequately capture the more complex spatial interaction effects that policy support can exert on ecological resilience through economic linkages, factor flows, industrial chains, and technology spillovers. The spatial spillover distance threshold identified in the study (peak at 200 km, no significant effect beyond 600 km) may depend in part on the form of the weight matrix and the specification of the distance decay function, and its accuracy requires further validation. Future research could construct multi-layer spatial networks and conduct comparative analyses across different urban agglomerations or countries to assess the broader applicability and boundary conditions of the findings.
Third, the conclusions rest on empirical evidence from resource-exhausted cities in China, where the policy centers on central fiscal special transfer payments characteristically marked by strong state intervention. This setting differs markedly from the market-led resource-based regional transformation pathways observed in Western economies. Therefore, whether the findings generalize to other institutional contexts and economies requires further verification through comparative case studies and cross-national empirical analyses.
Fourth, the mechanism analysis mainly focuses on the positive transmission paths, pays insufficient attention to potential negative policy effects, and fails to effectively separate the individual contributions of each policy tool. Although three main transmission paths have been identified, policy intervention may be accompanied by fiscal pressure, industrial crowding-out effects, and implementation deviations, and the marginal contributions of different policy tools remain unclear. Moreover, although this paper has alleviated the endogeneity problem of policies through methods such as PSM-DID, placebo tests, Bacon decomposition, and CSDID, it has not used the instrumental variable method to test further the robustness of causal identification, which constitutes a limitation. Future research can combine policy decomposition with microdata to further clarify the specific channels through which various policy tools function and explore appropriate instrumental variables to enhance the reliability of causal inference.

Author Contributions

Conceptualization, L.W. and G.L.; methodology, G.L.; software, L.W.; validation, L.W. and Z.L.; formal analysis, L.W.; investigation, L.W. resources, G.L.; data curation, L.W. and Z.L.; writing—original draft preparation, L.W.; writing—review and editing, L.W.; visualization, Z.L.; supervision, G.L.; project administration, G.L.; funding acquisition, G.L. All authors have read and agreed to the published version of the manuscript.

Funding

This research was funded by Hebei Social Science Fund (No. HB25YJ021) and the Open Research Fund Program of Natural Resource Asset Capital Research Center, Hebei GEO University (No. 2026-Y-07).

Institutional Review Board Statement

Not applicable.

Informed Consent Statement

Not applicable.

Data Availability Statement

The data presented in this study are available from the corresponding author upon reasonable request. These data were derived from the following resources available in the public domain: the China City Statistical Yearbook (https://navi.cnki.net/knavi/yearbooks/YZGCA/detail, accessed on 30 May 2026), the China Urban Construction Statistical Yearbook (https://www.mohurd.gov.cn/gongkai/fdzdgknr/sjfb/tjxx/jstjnj/index.html, accessed on 20 June 2026), and various municipal statistical yearbooks (https://data.cnki.net/, accessed on 20 June 2026).

Conflicts of Interest

The authors declare no conflicts of interest.

Appendix A

AbbreviationFull Name
DIDDifference-in-Differences
PSMPropensity Score Matching
CSDIDCallaway-Sant’ Anna Difference-in-Differences
SDIDSynthetic Difference-in-Differences
SDMSpatial Durbin Model
DMLDouble Machine Learning
CIConfidence Interval
WIPOWorld Intellectual Property Organization

Appendix B

The 24 resource-exhausted cities selected for this study cover different geographic loca-tions and dominant resource types, providing a relatively comprehensive reflection of the basic conditions of resource-exhausted cities in China. The 24 resource-depleted cities are: Wuhai City, Fushun City, Fuxin City, Panjin City, Liaoyuan City, Baishan City, Hegang City, Shuangyashan City, Yichun City, Qitaihe City, Huaibei City, Tongling City, Jingdezhen City, Pingxiang City, Xinyu City, Zaozhuang City, Jiaozuo City, Puyang City, Huangshi City, Shaoguan City, Luzhou City, Tongchuan City, Baiyin City, Shizuishan City.

Appendix C

The environmental keywords extracted from the government work reports cover more than 40 terms. Specifically, air environment–related keywords include smog, haze, SO2, CO2, PM10, PM2.5, air pollution, dust emissions, exhaust gas, waste gas, blue-sky protection, and VOCs. Water environment–related keywords include water ecology, chemical oxygen demand, scattered pollution, pollutant discharge, water environment quality, water safety, water quality, clean water, black-odorous water, and sewage. Keywords related to ecological sustainability and green transition include environmental protection, green development, renewable energy, low-carbon transition, environmental quality, afforestation, ecological restoration, and ecological damage. General environmental governance–related keywords include pollution control, energy consumption, emission reduction, pollutant discharge, industrial residue, environmental violations from coal combustion, environmental offenses, environmental cases, environmental penalties, and environmental governance.

References

  1. Huang, T.-N.; Xu, J.-L.; Xie, L.-L. Research on measurement of industrial structural transformation and upgrading level in resource-exhausted cities and its influencing factors: Based on panel data of 24 prefecture-level cities of China. J. Nat. Resour. 2021, 36, 2065–2080. [Google Scholar] [CrossRef] [Scilit]
  2. Liu, Y. Modern human-earth relationship and human-earth system science. Geogr. Sci. 2020, 40, 1221–1234. [Google Scholar]
  3. Wu, G.; Gao, Y.; Feng, Y. Assessing the environmental effects of the supporting policies for mineral resource-exhausted cities in China. Resour. Policy 2023, 85, 103939. [Google Scholar] [CrossRef] [Scilit]
  4. Tan, J.; Zhang, P.; Lo, K.; Li, J.; Liu, S. Conceptualizing and measuring economic resilience of resource-based cities: Case study of Northeast China. Chin. Geogr. Sci. 2017, 27, 471–481. [Google Scholar] [CrossRef] [Scilit]
  5. Meerow, S.; Newell, J.P.; Stults, M. Defining urban resilience: A review. Landsc. Urban Plan. 2016, 147, 38–49. [Google Scholar] [CrossRef] [Scilit]
  6. Hu, H.; Yan, K.; Shi, Y.; Lv, T.; Zhang, X.; Wang, X. Decrypting resilience: The spatiotemporal evolution and driving factors of ecological resilience in the Yangtze River Delta Urban Agglomeration. Environ. Impact Assess. Rev. 2024, 106, 107540. [Google Scholar] [CrossRef] [Scilit]
  7. Zhang, M.-S.; Zhang, P.-Y.; Li, H. Characteristics and evaluation methods of economic transformation performance of resource-based cities: An empirical study of Northeast China. J. Nat. Resour. 2021, 36, 2051–2064. [Google Scholar] [CrossRef] [Scilit]
  8. Tan, J.; Zhang, P.; Lo, K.; Li, J.; Liu, S. The urban transition performance of resource-based cities in Northeast China. Sustainability 2016, 8, 1022. [Google Scholar] [CrossRef] [Scilit]
  9. Martin, R.; Sunley, P. On the notion of regional economic resilience: Conceptualization and explanation. J. Econ. Geogr. 2015, 15, 1–42. [Google Scholar] [CrossRef] [Scilit]
  10. Bradbury, J. Living with boom and bust cycles: New towns on the resource frontier in Canada, 1945–1986. Resour. Commun. 1988, 13, 3–20. [Google Scholar]
  11. Hu, X.; Yang, C. Institutional change and divergent economic resilience: Path development of two resource-depleted cities in China. Urban Stud. 2019, 56, 3466–3485. [Google Scholar] [CrossRef] [Scilit]
  12. Guan, H.M.; Zhang, P.Y.; Liu, W.X.; Li, J. A comparative analysis of the economic transition process of China’s old industrial cities based on evolutionary resilience theory. Acta Geogr. Sin. 2018, 73, 771–783. [Google Scholar]
  13. Li, L.G.; Zhang, P.Y.; Wang, C.X.; Cheng, Y. Economic transformation process of old industrial bases from the perspective of regional economic resilience: A case study of Liaoning Province. Geogr. Sci. 2021, 41, 1742–1750. [Google Scholar]
  14. Wang, L.; Li, G. The impact of sustainable development planning on urban ecological resilience in resource-based cities: Evidence from China. Environ. Sci. Pollut. Res. 2024, 31, 12245–12256. [Google Scholar] [CrossRef] [Scilit] [PubMed]
  15. Zhao, X.Y.; Yang, Z.F.; Zhang, J.F. The Impact and Spatial Spillover of Sustainable Transition Policy on Ecological Resilience in Resource–based Cities. Inq. Into Econ. Issues 2025, 9, 169–190. [Google Scholar]
  16. Zhang, S.L.; Feng, Z.X.; Wang, S.J. Research on Urban Planning for the Transformation of Traditional Resource-Based Cities—Taking Taibai Mountain City as an Example. Econ. Geogr. 2011, 31, 1834–1839. [Google Scholar]
  17. Chen, Z.; Xiao, J.; Ma, L. Has the transformation of resource-based cities effectively promoted the development of the tourism industry? Empirical evidence from China. Sustainability 2026, 18, 5588. [Google Scholar] [CrossRef] [Scilit]
  18. Xu, J.; Ge, X.C.; Wang, X.; Jia, Q. Research on Mechanisms and Pathways for High-Quality Transformation and Development in Resource-Based Cities: A Dual-Drive Perspective from Demand and Supply Sides. Soc. Sci. Guangxi 2020, 12, 53–61. [Google Scholar]
  19. Wu, K.; Zhang, W.-Z.; Zhang, P.-Y.; Xue, B.; An, S.-W.; Shao, S.; Long, Y.; Liu, Y.-J.; Tao, A.-J.; Hong, H. High-quality development of resource-based cities in China: Dilemmas and breakthroughs. J. Nat. Resour. 2023, 38, 1–21. [Google Scholar] [CrossRef] [Scilit]
  20. Wang, X.X.; Zhao, X.Y. Spatial and temporal coupling research of economic resilience and ecological resilience in The Northern Slope Economic Belt of Tianshan Mountains. Acta Ecol. Sin. 2024, 44, 9670–9683. [Google Scholar]
  21. Holling, C.S. Resilience and stability of ecological systems. Annu. Rev. Ecol. Syst. 1973, 4, 1–23. [Google Scholar] [CrossRef] [Scilit]
  22. Holling, C.S. Engineering resilience versus ecological resilience. Eng. Within Ecol. Constraints 1996, 31, 32. [Google Scholar]
  23. Walker, B.; Holling, C.S.; Carpenter, S.R.; Kinzig, A. Resilience, adaptability and transformability in social-ecological systems. Ecol. Soc. 2004, 9, 5. [Google Scholar] [CrossRef] [Scilit]
  24. Shi, T.; Qiao, Y.; Zhou, Q. Spatiotemporal evolution and spatial relevance of urban resilience: Evidence from cities of China. Growth Change 2021, 52, 2364–2390. [Google Scholar] [CrossRef] [Scilit]
  25. Zhang, M.D.; Feng, X.Q. Comprehensive Evaluation of China’s Urban Resilience. Urban Probl. 2018, 10, 27–36. [Google Scholar]
  26. Yang, C.; Chen, W.X.; Ran, D.; Lin, L. Analysis on Spatio-temporal evolution characteristic of ecosystem resilience at the county level in China. Res. Soil Water Conserv. 2020, 27, 279–285. [Google Scholar]
  27. Li, G.; Wang, L. Study of regional variations and convergence in ecological resilience of Chinese cities. Ecol. Indic. 2023, 154, 110667. [Google Scholar] [CrossRef] [Scilit]
  28. Wang, T.; Zou, Z.H.; Zhou, G.H.; Zheng, J. A framework for measuring urban ecological resilience under high-quality development. J. Nat. Sci. Hunan Norm. Univ. 2022, 45, 33–40. [Google Scholar]
  29. Zhao, R.; Fang, C.; Liu, H.; Liu, X. Evaluating urban ecosystem resilience using the DPSIR framework and the ENA model: A case study of 35 cities in China. Sustain. Cities Soc. 2021, 72, 102997. [Google Scholar] [CrossRef] [Scilit]
  30. Li, X.-M.; Liu, K.-Q.; Tian, S.-Z.; Guan, Y.-Y.; Liu, H. Evaluation of urban human settlements resilience based on DPSIR model: A case of the Yangtze River delta urban systems. Hum. Geogr. 2022, 37, 54–62. [Google Scholar]
  31. Wang, S.J.; Cui, Z.T.; Lin, J.J.; Xie, J.Y.; Su, K. Coupling relationship between urbanization and ecological resilience in the Pearl River Delta. Acta Geogr. Sin. 2021, 76, 973–991. [Google Scholar]
  32. Lu, Z.; Zhang, S.; Yu, X.; Fu, Y. Spatio-temporal evolution and influencing factors of ecological resilience in the Yellow River Basin. Front. Environ. Sci. 2026, 14, 1778474. [Google Scholar] [CrossRef] [Scilit]
  33. Peng, R.; Hu, Y.; Zhang, W.; Shi, T.; Huang, J. How digital technological innovation influences the coordination between urban renewal and ecological resilience: Evidence from China’s Yangtze River Economic Belt. Sustainability 2026, 18, 6322. [Google Scholar] [CrossRef] [Scilit]
  34. Wang, S.; Li, Z.; Long, Y.; Yang, L.; Ding, X.; Sun, X.; Chen, T. Impacts of urbanization on the spatiotemporal evolution of ecological resilience in the Plateau Lake Area in Central Yunnan, China. Ecol. Indic. 2024, 160, 111836. [Google Scholar] [CrossRef] [Scilit]
  35. Ernstson, H.; van der Leeuw, S.E.; Redman, C.L.; Meffert, D.J.; Davis, G.E.; Alfsen, C.; Elmqvist, T. Urban transitions: On urban resilience and human-dominated ecosystems. Ambio 2010, 39, 531–545. [Google Scholar] [CrossRef] [Scilit] [PubMed]
  36. Sun, T.Y.; Lu, Y.; Cheng, L.H. Implementation Effect of Resource Exhausted Cities’ Supporting Policies, Long-term Mechanism and Industrial Upgrading. China Ind. Econ. 2020, 7, 98–116. [Google Scholar]
  37. Song, Z.; Wang, L. Can low-carbon transformation enhance ecological resilience?—Evidence from China’s low-carbon city pilot policy. Front. Environ. Sci. 2025, 13, 1646478. [Google Scholar] [CrossRef] [Scilit]
  38. Ma, J.; Zhang, B.; Liu, L.; Fu, N. Sustainable development research of resource-exhausted cities based on system dynamics: A case study of Sdzz. Environ. Dev. Sustain. 2025, 28, 27315–27351. [Google Scholar] [CrossRef] [Scilit]
  39. Department of Urban Social and Economic Survey, National Bureau of Statistics of China. China City Statistical Yearbook. 2006–2024. Available online: https://navi.cnki.net/knavi/yearbooks/YZGCA/detail (accessed on 30 May 2026).
  40. Various Municipal Statistical Bureaus. Municipal Statistical Yearbooks. 2006–2024. Available online: https://data.cnki.net/ (accessed on 20 June 2026).
  41. Ministry of Housing and Urban-Rural Development of the People’s Republic of China. China Urban Construction Statistical Yearbook. 2006–2024. Available online: https://www.mohurd.gov.cn/gongkai/fdzdgknr/sjfb/tjxx/jstjnj/index.html (accessed on 20 June 2026).
  42. Roodman, D.; Nielsen, M.Ø.; MacKinnon, J.G.; Webb, M.D. Fast and wild: Bootstrap inference in Stata using boottest. Stata J. 2019, 19, 4–60. [Google Scholar] [CrossRef] [Scilit]
  43. Zhang, Y.; Chen, T.F.; Chen, H.B.; Pan, J.H. Effectiveness of supportive policies in promoting high-quality development of resource-exhausted cities. China Popul. Resour. Environ. 2022, 32, 46–56. [Google Scholar]
  44. Chernozhukov, V.; Chetverikov, D.; Demirer, M.; Duflo, E.; Hansen, C.; Newey, W.; Robins, J. Double/debiased machine learning for treatment and structural parameters. Econom. J. 2018, 21, 1–68. [Google Scholar] [CrossRef] [Scilit]
  45. Callaway, B.; SantAnna, P.H.C. Difference-in-Differences with multiple time periods. J. Econom. 2021, 225, 200–230. [Google Scholar] [CrossRef] [Scilit]
  46. Arkhangelsky, D.; Athey, S.; Hirshberg, D.A.; Imbens, G.W.; Wager, S. Synthetic difference-in-differences. Am. Econ. Rev. 2021, 111, 4088–4118. [Google Scholar] [CrossRef] [Scilit]
  47. de Chaisemartin, C.; D’Haultfoeuille, X. Two-way fixed effects estimators with heterogeneous treatment effects. Am. Econ. Rev. 2020, 110, 2964–2996. [Google Scholar] [CrossRef] [Scilit]
  48. Goodman-Bacon, A. Difference-in-differences with variation in treatment timing. J. Econom. 2021, 225, 254–277. [Google Scholar] [CrossRef] [Scilit]
  49. Wen, Z.L.; Ye, B.J. Analyses of mediating effects: The development of methods and models. Adv. Psychol. Sci. 2014, 22, 731–745. [Google Scholar] [CrossRef] [Scilit]
  50. Baron, R.M.; Kenny, D.A. The moderator–mediator variable distinction in social psychological research. J. Personal. Soc. Psychol. 1986, 51, 1173–1182. [Google Scholar] [CrossRef] [Scilit] [PubMed]
  51. Zhao, X.M.; Chen, L.Y.; Liu, C.J. Can informal environmental regulation induce green innovation?:Verification from the perspective of ENGOs. China Popul. Resour. Environ. 2021, 31, 87–95. [Google Scholar]
  52. Yang, G.Q.; Wang, H.S.; Fan, H.S.; Yue, Z.Y. Carbon Reduction Effect of Digital Economy: Theoretical Analysis and Empirical Evidence. China Ind. Econ. 2023, 5, 80–98. [Google Scholar]
  53. Wang, S.; Ma, J.H.; Li, Z.H. The Impact of Government Environmental Concerns on the Land Resource Allocation Efficiency in Chinese Cities. Econ. Geogr. 2022, 42, 186–193. [Google Scholar]
  54. Song, Y.; Zhu, D.L.; Xu, Y.; Zhang, J.Q. Impact of Policy Support for Resource-exhausted Cities on Industrial Land Use Efficiency in China. China Land Sci. 2023, 37, 90–100. [Google Scholar]
  55. Zhao, J.L.; Liu, S.N.; Wang, J.Y. A Study on Synergistic Evolutionary Relationship between Green Development and Industrial Structure Optimization: A Case Study of Resource-based Cities in the Yellow River Basin. Macroeconomics 2025, 4, 49–64+111. [Google Scholar]
  56. Liu, T.; Shen, Y.M. The economic growth effect of the service industry on the transformation of resource-depleted cities: Based on panel data from 23 prefecture-level cities in China. J. Nat. Resour. 2023, 38, 140–156. [Google Scholar] [CrossRef] [Scilit]
  57. LeSage, J.P.; Pace, R.K. The biggest myth in spatial econometrics. Econometrics 2014, 2, 217–249. [Google Scholar] [CrossRef] [Scilit]
Figure 1. The research framework on the impact of supportive policies on urban ecological resilience from the perspective of the human-land relationship regional system.
Sustainability 18 08463 g001
Figure 2. Overview map of the study.
Sustainability 18 08463 g002
Figure 3. Dynamic evolution of urban ecological resilience in the four major regions. (a) Eastern China, (b) Central China, (c) Western China and (d) Northeastern China. The color scale represents kernel density values. Warmer colors (yellow) indicate higher density, meaning more cities are concentrated at those resilience levels; cooler colors (purple and blue) indicate lower density, meaning fewer cities fall within those ranges.
Sustainability 18 08463 g003
Figure 4. Parallel trends test with 95% confidence intervals. The horizontal line at zero indicates no treatment effect, and the vertical dashed line denotes the policy implementation year.
Sustainability 18 08463 g004
Figure 5. Distribution of placebo coefficients. The dots represent placebo estimates from 500 random assignments, and the curve shows the kernel density of the placebo coefficients. The vertical line indicates the true baseline estimate.
Sustainability 18 08463 g005
Figure 6. Boundary of the spatial spillover effect. Note: Radiation distance refers to the range within which the policy generates positive spillovers to neighboring cities; siphon distance refers to the range within which policy resources are concentrated in core areas, drawing resources away from peripheral regions.
Sustainability 18 08463 g006
Table 1. Urban ecological resilience evaluation index system.
SystemsDimensionIndicatorsUnitDirectionsWeightData Source
Ecological
Resilience
ResistancePopulation densitypersons·km20.1142China City Statistical Yearbook [39]
City Yearbooks of Each City [40]
Industrial wastewater discharge per unit GDPt·Yuan−10.0084
Industrial soot emissions per unit GDPt·Yuan−10.0206
Industrial SO2 emissions per unit areat·km−20.1033
Built-up area per capitakm2·person−10.0520China Urban Construction Statistical Yearbook [41]
AdaptabilityNon-hazardous domestic waste treatment rate%+0.0495
Domestic sewage treatment rate%+0.0589
Comprehensive utilization rate of general industrial solid waste%+0.0203China City Statistical Yearbook
RecoverabilityGreening coverage rate in built-up areas%+0.0327China Urban Construction Statistical Yearbook
Park green space per capitakm2·person−1+0.2869
Water resources per capitam3·person−1+0.0876China City Statistical Yearbook
Land area per capitakm2·person−1+0.1653
Note: “+” indicates a positive indicator, whereas “−” indicates a negative indicator. The weights are computed annually and then averaged to ensure cross-year comparability of the ecological resilience index.
Table 2. Descriptive Statistics and Data Sources.
VariableObsMeanStd. Dev.MinMaxMeasurementData Source
Ecological
resilience
53390.06220.04470.01540.7509Entropy methodSee Table 1
Economic development level533946,308.890030,544.01009432120,098GDP per capitaChina City Statistical Yearbook
Opening-up level53390.171100.22140.00470.8444Total import and export investment as a percentage of GDPChina City Statistical Yearbook
Government support53390.18250.08480.07920.3933Ratio of local general public budget expenditure to GDPChina City Statistical Yearbook
Urbanization rate533954.132015.134630.158785.4147Ratio of urban population to permanent resident populationChina City Statistical Yearbook
Human capital level53391.62951.60030.19716.2304Ratio of students enrolled in higher education institutions to total populationChina City Statistical Yearbook
Table 3. Benchmark model regression results.
Variable(1)(2)(3)(4)(5)(6)(7)(8)
ResilienceResilienceResilienceResilienceResistanceAdaptabilityRecoverabilityResilience
Resource0.0881 ***
(3.2465)
0.1048 ***
(3.8588)
0.0903 ***
(3.6705)
0.0918 ***
(3.7670)
0.0355 ***
(6.5031)
0.0668 **
(2.3990)
0.0025
(0.0608)
0.0587 **
(2.5175)
ControlsNOYESNOYESYESYESYESYES
CITYNONOYESYESYESYESYESYES
YEARNONOYESYESYESYESYESYES
N53395339533953395339533953392147
R20.00160.03870.31760.33730.85440.52940.45660.4069
Notes: *** and ** indicate significance at the 1% and 5% levels, respectively. And t statistics are in parentheses, with standard errors clustered at the city level.
Table 4. Robustness tests 1.
Variable(1)
Wild Boostrap
(2)
Equal Weighting
(3)
PSM-DID
(4)–(5)
Controlling
Other Policy Effects
(6)
Random Forest
(7)
Lasso
cv
(8)
CSDID
(9)
SDID
Resource0.0918 *
--
0.0890 *
(1.9600)
0.0570 ***
(1.990)
0.0975 ***
(3.3616)
0.0500 *
(4.3219)
0.0732 *
(2.1500)
0.098 ***
(4.1100)
0.0695 *
(1.6600)
0.0823 *
(1.7800)
ControlsYESYESYESYESYESYESYESYESYES
CITYYESYESYESYESYESYESYES
YEARYESYESYESYESYESYESYES
Se methodClusterBootstrap
N533953391751224853395339533953395339
R2--0.16640.35680.37300.3379
Notes: *** and * indicate significance at the 1% and 10% levels, respectively. And t statistics are in parentheses, with standard errors clustered at the city level.
Table 5. Balance test after nearest-neighbor matching.
VariableUnmatched (U)
Matched (M)
TreatedControl%biasp-Value
Economic development level
Opening-up level
U0.18890.177412.30.0240
M0.18930.18267.20.4050
Government support
Urbanization rate
U−3.0761−2.5707−34.70.0000
M−3.0726−2.9492−8.50.1680
Human capital level
Economic development level
U0.18890.177412.30.0240
M0.18930.18267.20.4050
Opening-up level
Government support
U4.07223.946745.80.0000
M4.06974.0815−4.30.5440
Urbanization rateU0.01150.0193−39.90.0000
M0.01150.0129−7.10.1000
Table 6. Bacon decomposition.
VariableEcological Resilience
Resource0.0903 *** (3.67)
βTotal Weight
Early_v_Late−0.02030.0006
Late_v_Early−0.11920.0028
Early_v_Late0.08400.0015
Late_v_Early0.00900.0065
Early_v_Late0.05400.0012
Late_v_Early0.09080.0038
Never_v_timing0.09150.9837
Notes: *** indicates significance at the 1% levels, t statistics are in parentheses.
Table 7. Mechanism of action analysis.
Variable(1)
Green
Innovation
(2)
Ecological
Resilience
(3)
Energy
Consumption
(4)
Ecological
Resilience
(5)
Environmetal
Governance
(6)
Ecological
Resilience
Resource0.2459 ***
(3.6689)
0.0335 ***
(6.0546)
−0.1825 ***
(−4.2874)
0.0339 ***
(6.0698)
3.6311 ***
(3.0257)
0.0403 ***
(6.2654)
Green
innovation
0.0052 ***
(4.3217)
Energy
consumption
−0.0083 ***
(−4.5600)
Environmetal
governance
0.0038 **
(2.3690)
Indirect
Effect
0.0110 ***
(5.0900)
0.0010 **
(2.0400)
0.0038 ***
(4.1100)
95%CI [0.0068,0.0152] [0.0003,0.0019] [0.0020,0.0056]
ControlsYES YES YES
CITYYES YES YES
YEARYES YES YES
N533953395339533953395339
R20.82080.85970.55190.85490.27540.8557
Notes: *** and ** indicate significance at the 1% and 5% levels, respectively. And t statistics are in parentheses, with standard errors clustered at the city level.
Table 8. Analysis of Heterogeneity.
Variable(1)
Eastern
(2)
Central
(3)
Western
(4)
Northeastern
(5)
Coal
(6)
Metal
(7)
Forestry
(8)
Other Types
Resource0.1378 *0.01590.00900.1951 ***0.0814 **0.07900.3394 ***−0.0427
(1.7144)(0.3458)(0.2004)(5.3176)(2.3145)(1.4466)(4.7855)(−0.9254)
ControlsYESYESYESYESYESYESYESYES
CITYYESYESYESYESYESYESYESYES
YEARYESYESYESYESYESYESYESYES
N1634152015586279125512663610
R20.37250.32070.4236 0.47720.41180.46460.60130.3198
Notes: ***, **, and * indicate significance at the 1%, 5%, and 10% levels, respectively. And t statistics are in parentheses, with standard errors clustered at the city level.
Table 9. Test results for spatial econometric model.
Test IndicatorsStatistical Valuesp Value
LM-error1866.13100.0000
Robust LM-error19.11100.0000
LM-lag1911.06200.0000
Robust LM-lag64.04200.0000
Hausman test3.61000.0580
LR-both/ind546.67000.0000
LR-both/time5114.35000.0000
Wald-SDM/SEM129.42000.0000
Wald-SDM/SAR105.27000.0000
Table 10. Results of spatial spillover effects.
ResilienceAdjacency MatrixGeographic Distance Matrix
MainLR_DirectLR_IndirectMainLR_DirectLR_Indirect
Resource0.0637 ***
(2.9606)
0.0823 ***
(3.3798)
0.2338 ***
(2.6500)
0.0904 ***
(3.8633)
0.1003 ***
(4.0208)
2.6065 **
(2.0609)
ρ0.4395 ***
(29.4301)
0.7100 ***
(12.4538)
sigma2_e0.0324 ***
(50.7164)
0.0385 ***
(51.5097)
ControlsYESYESYESYESYESYES
CITYYESYESYESYESYESYES
YEARYESYESYESYESYESYES
N53395339
R20.00150.0086
Notes: *** and ** indicate significance at the 1% and 5% levels, respectively. And t statistics are in parentheses, with standard errors clustered at the city level.
Disclaimer/Publisher’s Note: The statements, opinions and data contained in all publications are solely those of the individual author(s) and contributor(s) and not of MDPI and/or the editor(s). MDPI and/or the editor(s) disclaim responsibility for any injury to people or property resulting from any ideas, methods, instructions or products referred to in the content.