Article

Sustainable Planning, Design and Governance of Urban Pedestrian and Cycling Green Routes Based on Citizens’ Perceptions Using the Scenic Beauty Estimation (SBE) Method

by
Ewa Trzaskowska
1,
Joanna Renda
1,
Małgorzata Nowak-Kępczyk
2 and
Jan Kamiński
1,*
1
Department of Landscape Planning and Design, The John Paul II Catholic University of Lublin, 20-950 Lublin, Poland
2
Department of Mathematical Modeling, The John Paul II Catholic University of Lublin, 20-950 Lublin, Poland
*
Author to whom correspondence should be addressed.
Sustainability 2026, 18(16), 8436; https://doi.org/10.3390/su18168436
Submission received: 7 July 2026 / Revised: 1 August 2026 / Accepted: 13 August 2026 / Published: 18 August 2026
(This article belongs to the Special Issue Sustainable Strategies for Integrated Governance and Planning)

Abstract

The design of urban pedestrian–cycling routes is of great importance for the sustainable development of cities. Properly designed routes encourage the use of sustainable modes of transport. They also bring numerous environmental and social benefits. The study examines how greenery and spatial characteristics influence citizens’ aesthetic perception of pedestrian and cycling corridors. The Scenic Beauty Estimation (SBE) method was used to assess visual landscape quality based on users’ subjective evaluations. A total of 301 participants evaluated 20 photographs taken in Lublin, Poland, depicting different types of urban routes, including sidewalks, cycling paths, and park pathways, using a five-point rating scale. Statistical analyses (ANOVA, post hoc tests, and composite and differential variable analyses) were conducted to identify patterns in preferences. The results indicate that greenery is the dominant factor shaping landscape preferences across all age and gender groups. Age plays a stronger role than gender in differentiating evaluations: younger participants prefer more natural and greener environments, whereas older participants favor more ordered and less green spaces. Gender effects are limited and primarily relate to preferences for natural landscapes. An additional finding concerns the role of benches, which were most preferred by younger and middle-aged women, suggesting a broader social and functional interpretation of this element. Overall, the results highlight the importance of greenery in shaping the perceived attractiveness of urban routes. They also indicate the key spatial features that encourage people to use these routes, which affects the use of sustainable modes of transport as well as residents’ health. They also demonstrate the usefulness of the SBE method in planning, design and managing user-friendly and sustainable urban routes.

1. Introduction

Rapid urbanization and the resulting increase in urban population density have intensified interest in the quality of life in cities. While contemporary cities serve as centres of economic activity, innovation, and culture, they also expose residents to a range of adverse environmental stressors, including air pollution, environmental noise, and psychological strain [1,2]. Another growing concern is the insufficient level of physical activity among urban populations, which has significant implications for public health [3].
Against this background, urban spaces that promote health, physical activity, and well-being have become increasingly important. Their development aligns with the concept of the city for people, which emphasizes the importance of accessible, attractive, and inclusive public spaces [4,5,6], as well as with the principles of sustainable urban development [7].
A substantial body of research demonstrates that people consistently prefer environments dominated by natural elements over highly built-up urban settings. Among these elements, vegetation—and trees in particular—has been identified as one of the most influential factors contributing to environmental quality and the aesthetic appreciation of urban landscapes [8,9,10,11]. In urban areas, not only are parks and other green spaces important, but also elements of linear green infrastructure, such as pedestrian routes and cycling paths, which facilitate active mobility while providing everyday contact with nature. However, the use of these spaces depends not only on their technical functionality but also on their visual quality and the extent to which they meet users’ preferences and expectations [12,13,14,15,16,17].
The aim of the present study was to identify the aesthetic and functional attributes influencing the perception of urban pedestrian routes and shared pedestrian–cycling paths, as well as users’ preferences regarding these environments. The findings are intended to support future urban design and spatial planning decisions. To achieve this objective, the study employed the Scenic Beauty Estimation (SBE) method [18], a well-established approach for assessing aesthetic preferences in natural and semi-natural landscapes, including forests, river corridors, parks, and various types of urban environments [18,19,20,21]. The novelty of the present research lies in extending the application of the SBE method to linear transport infrastructure, specifically sidewalks, which constitute one of the most frequently experienced components of everyday urban space. Previous studies have primarily focused on entire pedestrian environments, such as greenways, walkways, streets, and parks, emphasizing their overall aesthetic quality and the role of vegetation, whereas sidewalks themselves have rarely been examined as independent design elements. Furthermore, unlike most previous SBE studies, the present research considers not only aesthetic qualities but also the functional characteristics of the analysed spaces. Consistent with earlier investigations [19,21], the SBE approach also enables comparisons of landscape preferences among different demographic groups.
The study addressed the following research questions:
  • Which landscape attributes are perceived as the most desirable by users?
  • What is the role of greenery in the perception of walking and cycling routes?
  • Do age and gender influence the evaluation of urban pedestrian and bike routes?
  • Can distinct preference patterns be identified among different demographic groups?

2. Materials and Methods

2.1. Literature Review

Urban green spaces play a fundamental role in promoting human health and well-being. A substantial body of evidence demonstrates that exposure to natural environments contributes to improvements in both physical and mental health while encouraging higher levels of physical activity [22,23,24,25,26]. In addition, urban greenery enhances environmental quality by reducing air pollution, regulating ambient temperature, and improving the urban microclimate [23,27,28]. Green spaces also support the restoration of cognitive functioning, alleviate psychological stress, and improve mood [8,24,26,27,28]. Furthermore, they facilitate social interaction and provide opportunities for recreation [29]. Urban greenery is also widely recognized as an important determinant of physical activity. The presence of vegetation, combined with high-quality infrastructure and a perceived sense of safety, increases the likelihood that people will choose walking and cycling for everyday mobility [22,23,30].
The relationship between people and urban environments can also be interpreted through the theory of affordances [31], which proposes that environments provide users with opportunities for action that are directly perceived. Consequently, urban spaces designed in accordance with users’ preferences may encourage physical activity, recreation, and social interaction [32].
With regard to pedestrian and cycling infrastructure, there is growing recognition that its design should integrate both functional and perceptual dimensions. In addition to meeting appropriate technical standards, these spaces should incorporate greenery, provide aesthetic value, and maintain landscape coherence [4,33]. Equally important is understanding users’ individual preferences regarding the characteristics of these environments [34,35]. This perspective is consistent with the concept of meaningful routes, which suggests that urban transport corridors should combine functional efficiency with positive user experiences and emotional value [36].

2.2. Methodology

2.2.1. Scenic Beauty Estimation (SBE) Method

The study employed the Scenic Beauty Estimation (SBE) method, originally developed by Terry C. Daniel and Ron S. Boster [18]. SBE is a quantitative approach to assessing landscape preferences that enables comparisons of aesthetic evaluations across different user groups and facilitates the identification of relationships between subjective perceptions and objectively measurable environmental characteristics [19,20]. In the present study, the SBE method was adapted to assess pedestrian and cycling routes in urban environments. The resulting ratings were used to examine how specific design characteristics of these transport corridors influence their perceived visual quality and functional attractiveness.
The assessment procedure involved presenting participants with a series of photographs depicting the selected urban spaces. Each photograph was evaluated using a five-point Likert scale. Prior to the survey, respondents received standardized instructions explaining both the purpose of the study and the evaluation procedure. They were asked to rate each scene according to their overall impression, taking into account not only its visual appearance but also those characteristics that could influence comfort, usability, and the overall attractiveness of the space. Each participant’s ratings were subsequently transformed into within-participant z-scores, calculated using that participant’s individual mean and standard deviation across all photographs. This procedure controls for individual differences in the use of the rating scale, such as a general tendency to assign consistently high or low scores. Consequently, the standardized value expresses how a given photograph was evaluated relative to the other photographs assessed by the same participant, rather than merely reflecting that participant’s overall scoring tendency.

2.2.2. Visual Materials

The visual dataset comprised 20 portrait-oriented photographs representing a broad spectrum of pedestrian and cycling environments, ranging from tree-lined park pathways to conventional concrete sidewalks. To ensure consistency, all photographs were taken during the peak growing season under comparable weather and lighting conditions, and with an identical photographic composition—observer-height view and central perspective. This approach minimized potential variation associated with seasonal changes or meteorological conditions, allowing participants to focus on the spatial characteristics of the environments presented. All photographs were taken in the city of Lublin, Poland. However, they were selected in such a way as to present the characteristics of the space as universally as possible, without references to recognizable elements that could identify the location.

2.2.3. Participants

The study included 301 participants, comprising 193 women, 106 men, and three respondents who chose not to report their gender. For statistical analyses, 298 participants were classified into six demographic groups:
  • Men under 35 years of age (M < 35; n = 22);
  • Women under 35 years of age (W < 35; n = 53);
  • Men aged 35–59 years (M35–59; n = 75);
  • Women aged 35–59 years (W35–59; n = 106);
  • Men aged 60 years and over (M60+; n = 9);
  • Women aged 60 years and over (W60+; n = 34).
Because of the relatively small sample size of the M60+ subgroup, findings relating to this group should be interpreted with caution. Participants completed the questionnaire either in paper form or electronically using Google Forms. The survey was voluntary, anonymous and was administered exclusively to adults. The survey did not collect any data that could identify the participant.

2.2.4. Composite Variables

The initial set of composite variables was developed based on a semantic visual analysis of the photographs and the identification of key spatial characteristics, such as the presence and density of vegetation, type of surface, infrastructural elements, and the degree of naturalness. Members of the research team independently classified the photographs according to predefined criteria. In cases of disagreement, discrepancies were resolved through discussion until full consensus was achieved. Prior to discussion, inter-rater agreement indicated a high level of consistency, supporting the construct validity of the adopted classification. Composite scores were calculated as the mean of standardized SBE values (z-scores) assigned to each photograph. Following a preliminary statistical analysis of the images (including variance, ranking consistency, and ANOVA results for images with the highest and lowest discriminative power), minor adjustments were introduced by excluding photographs with low discriminative capacity or visual ambiguity. The final set of composite variables is presented in Table 1.

2.2.5. Data Standardization

A within-subject standardization procedure was applied in accordance with the SBE method, allowing for the assessment of individual preference profiles independently of overall rating tendencies. Each participant’s distribution of ratings was rescaled (mean = 0, SD = 1), enabling comparisons of preference patterns across individuals while remaining neutral to differences in rating scales and eliminating the influence of individual tendencies toward higher or lower ratings. Formally, each rating assigned by participant i to photograph j was transformed as follows (1):
z i j = x i j x ´ i S D i
where x ´ i and S D i denote the mean and standard deviation of all ratings provided by participant i, respectively.

2.2.6. Statistical Analyses

To examine the structure of aesthetic preferences and identify differences in the perception of pedestrian and shared pedestrian–cycling routes, the analyses were conducted in several stages.
  • Multidimensional scaling. To explore the overall structure of photograph evaluations, two-dimensional multidimensional scaling (MDS) was performed separately for each of the six age–gender groups. For each group, a photograph-by-photograph dissimilarity matrix was constructed as D = 1 − r where r was the Pearson correlation between participants’ within-subject standardized ratings of each pair of photographs. The interpretation focused on the relative positions and clustering of photographs, while model fit was assessed using the stress statistic.
  • Association between greenery and photograph ratings. To quantify the extent to which greenery accounted for landscape attractiveness, Pearson correlations were calculated between the assigned greenery level of each photograph and its mean standardized rating within each age–gender group. The squared correlation coefficient, r2, was reported descriptively as the proportion of variance in mean photograph ratings associated with greenery level.
  • Similarity of preference structures between groups. Pairwise Mantel tests were used to compare the photograph-by-photograph dissimilarity matrices of the six age–gender groups. The analysis was based on all 20 within-participant standardized SBE ratings. Matrix similarity was quantified using Spearman correlations between the upper triangular elements of each pair of matrices. Statistical significance was evaluated using two-sided tests with 9999 simultaneous row-and-column permutations of one matrix and a plus-one correction for permutation p-values. The resulting p-values for the 15 pairwise group comparisons were adjusted using the Benjamini–Hochberg false discovery rate procedure.
  • Analysis of ranking variance and agreement. The consistency of photograph evaluations across age–gender groups was further examined using the variability of mean ratings and ranking positions. Low variability indicated photographs that were evaluated similarly across groups and therefore had limited discriminative value for identifying demographic differences.
  • Composite variable analyses. Photographs were grouped into composite categories based on shared visual and spatial characteristics. Composite scores were calculated as the mean of within-participant standardized ratings for the photographs included in each category. The final composition of the variables was refined separately for each composite by considering both the visual representativeness of the photographs and their discriminative capacity across groups.
  • Differential composite variables. To examine more specific structural preferences beyond the general effect of greenery, contrasts were calculated between theoretically related composite categories, such as managed parks versus lawns, green versus non-green pedestrian–cycling paths, and separated versus combined pedestrian and cycling routes.
  • Analysis of variance. Two-way ANOVA with gender and age group as between-subject factors (2 × 3) was used to examine composite and differential variables. For statistically significant effects, appropriate post hoc comparisons were performed. Multiple comparisons were controlled using the Benjamini–Hochberg false discovery rate procedure, and partial eta squared (ηp2) was reported as the effect-size measure.
  • Software and significance level. All analyses were performed using Python 3.12.3. The statistical significance level was set at α = 0.05.
The following section presents the results in the same analytical sequence, beginning with the global structure of preferences and subsequently examining more specific demographic differences in composite and differential variables.

3. Results

3.1. Preference Structure Analysis (MDS)

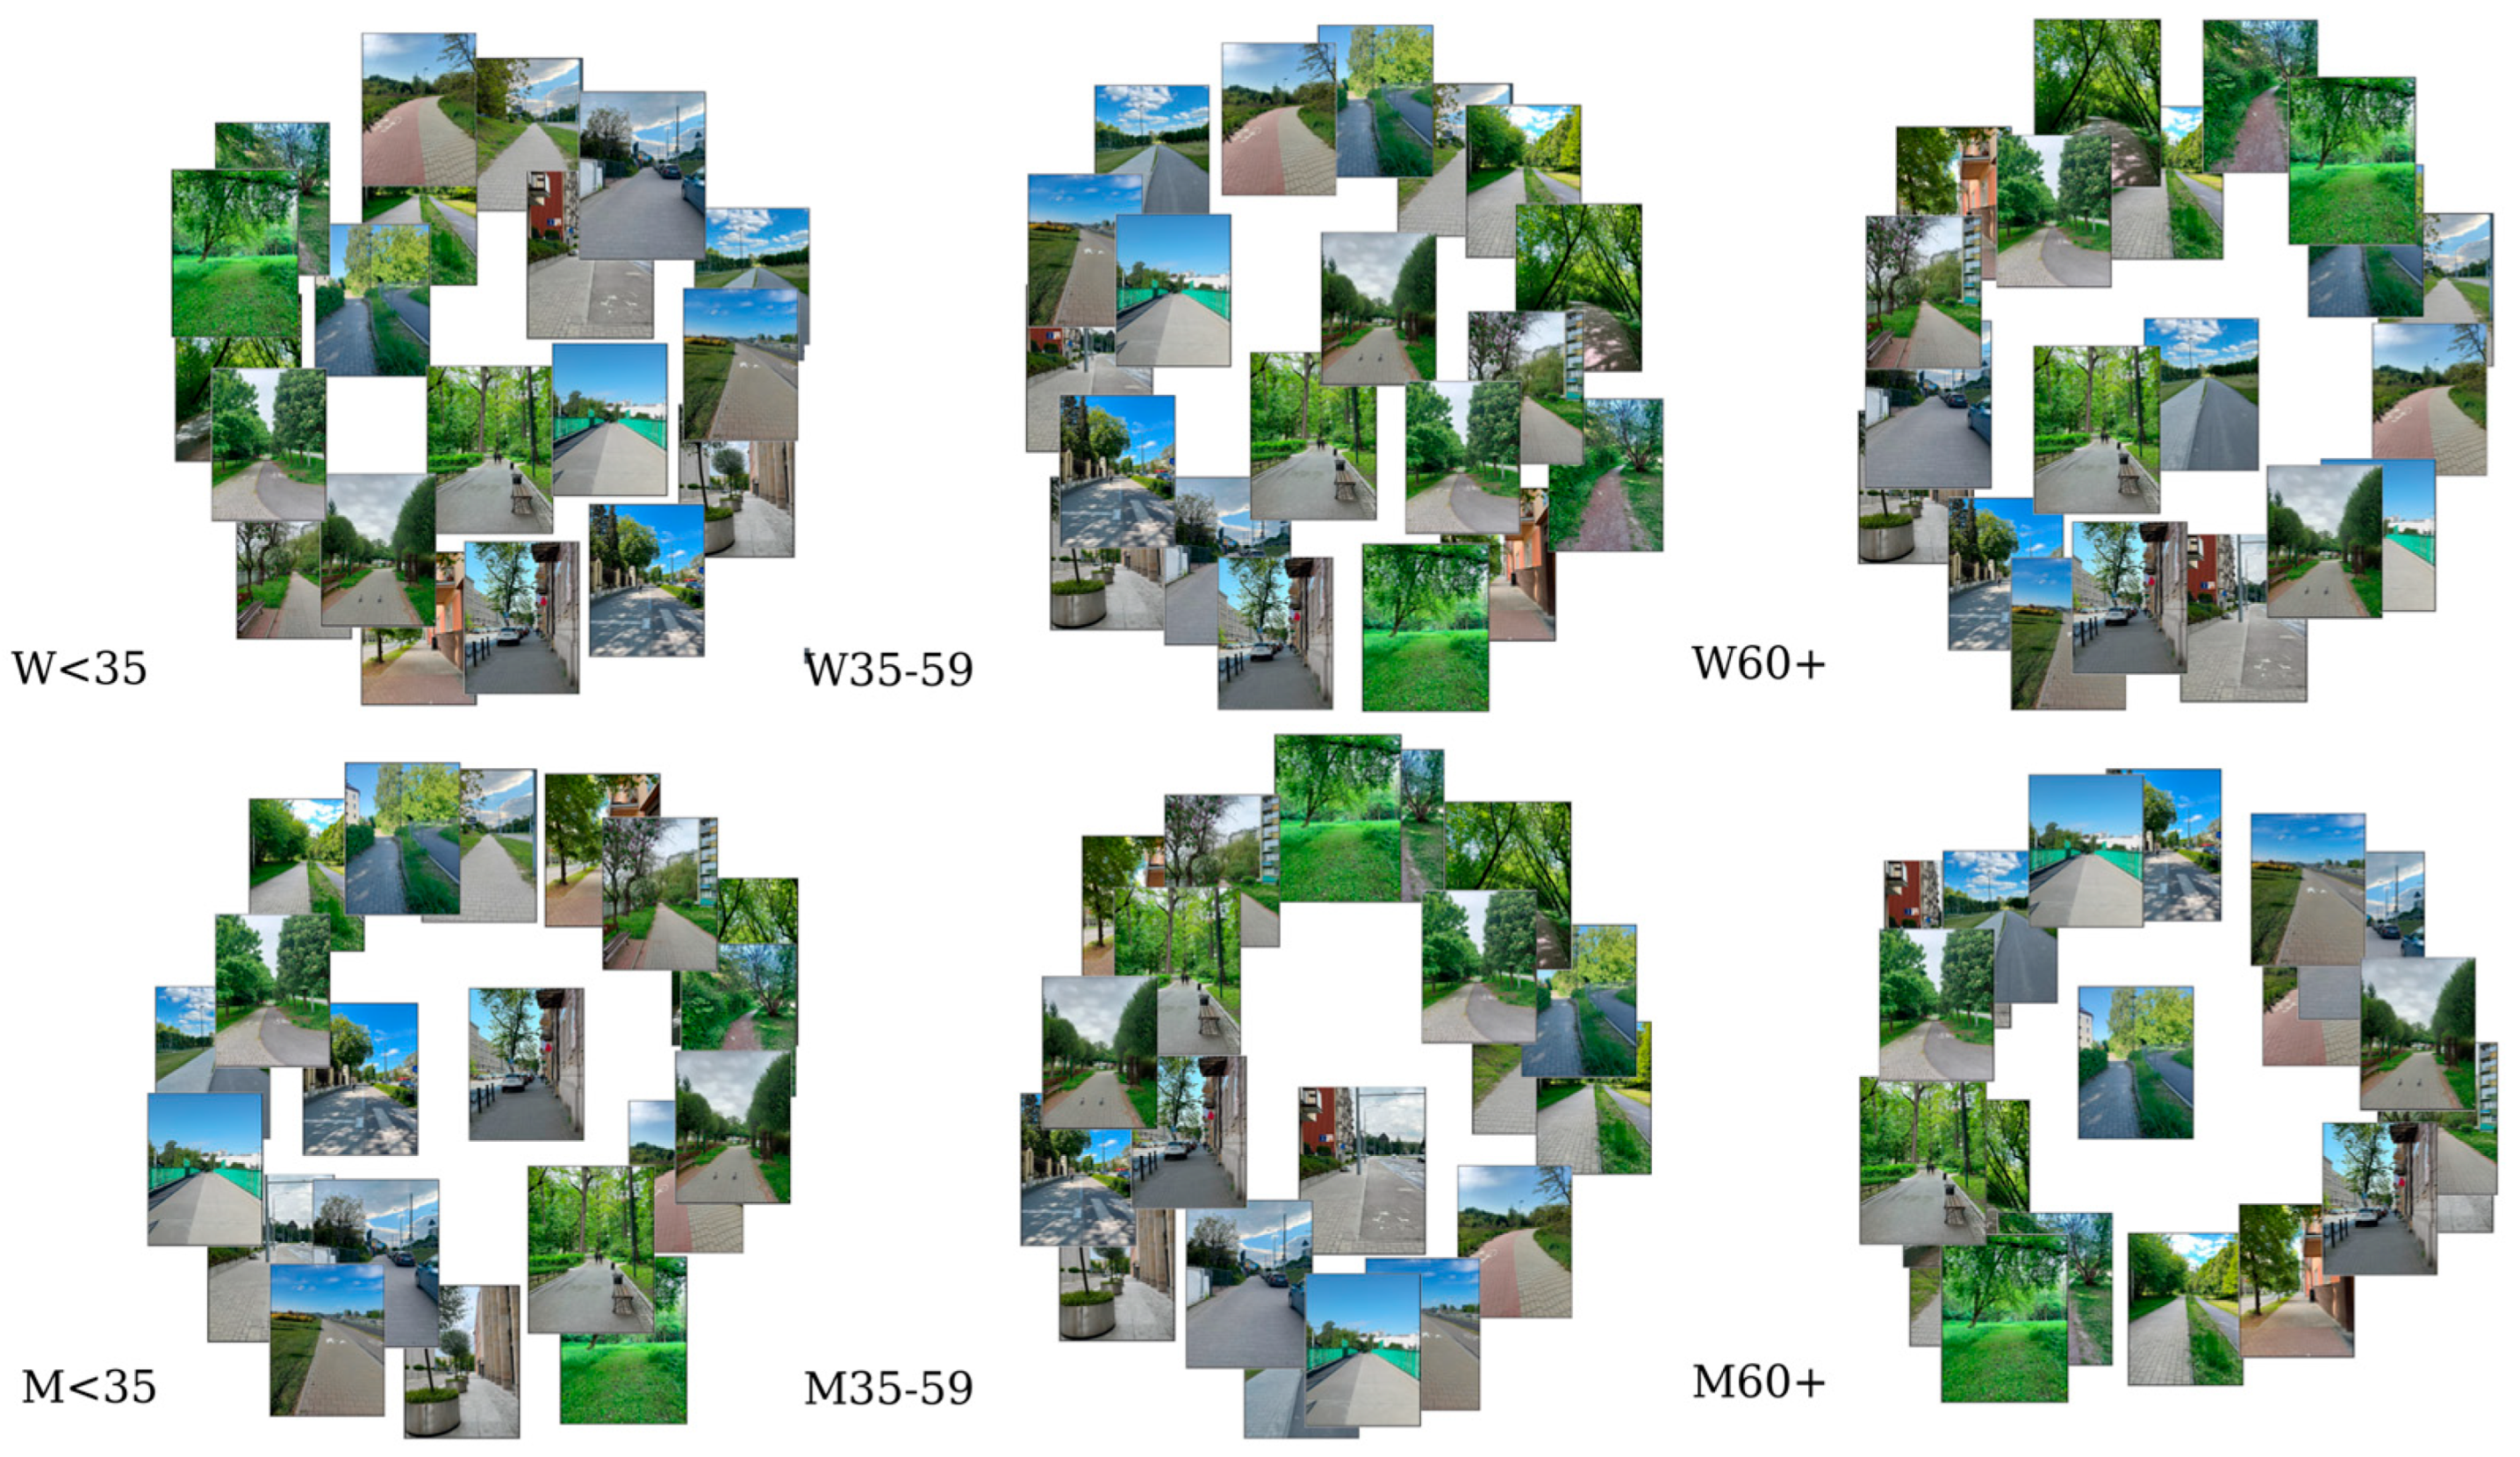
Based on multidimensional scaling (MDS) analyses conducted separately for six age–gender groups, two-dimensional preference maps were obtained (Figure 1). The two-dimensional solutions provided an acceptable level of fit, as assessed using Kruskal’s stress values (detailed values are presented in Supplementary Materials, Table S1). In line with standard MDS interpretation, the analysis focused on the relative positions of points on the maps rather than the orientation of the coordinate system.

3.1.1. Dominant Preference Dimension: Presence of Greenery

The MDS maps revealed two primary clusters of photographs: those characterized by a clear presence of greenery (e.g., parks, trees, lawns, and ravines) and those lacking natural elements (e.g., sidewalks, streets, and paved pathways). This division was consistently observed across all groups, with only minor variations in the spatial configuration of points. These results indicate that the presence of greenery constitutes the dominant dimension underlying landscape preference, regardless of respondents’ age and gender.

3.1.2. Greenery Level and Mean Photo Ratings

Pearson correlation coefficients between the level of greenery and mean photo ratings across the six groups were very high (r = 0.82–0.90), indicating that greenery explains approximately 68–80% of the variance in evaluations (Table 2). Higher levels of greenery were consistently associated with higher ratings across all age and gender groups.

3.1.3. Similarity of Preference Structures Across Groups: Mantel Test

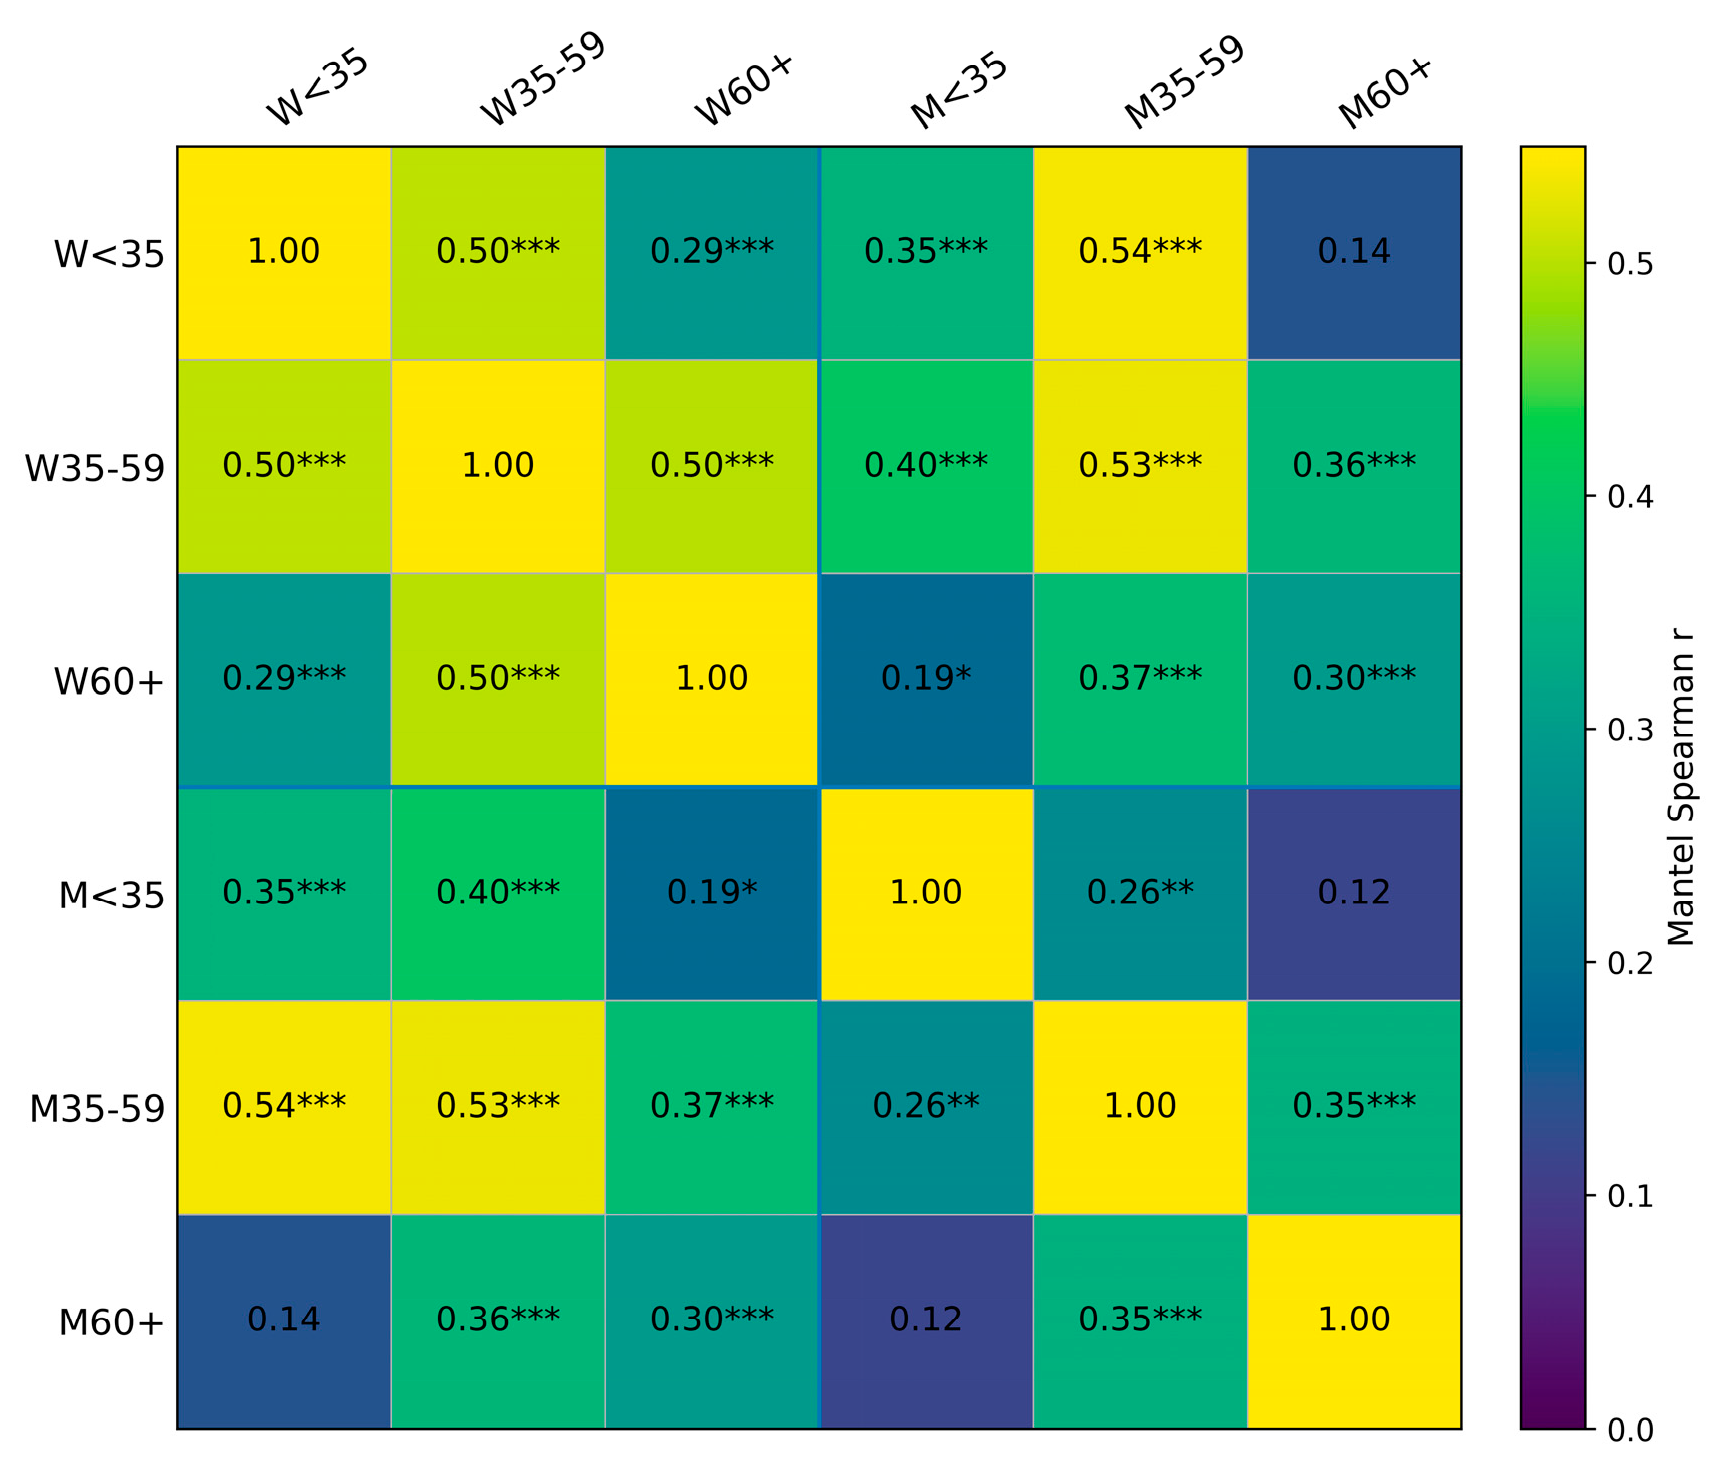
The Mantel analysis indicated a broadly shared structure of photograph evaluations across demographic groups. Thirteen of the fifteen pairwise matrix comparisons remained significant after FDR correction. The two non-significant comparisons involved the small M60+ subgroup, and should therefore be interpreted cautiously. These results suggest that demographic groups largely shared the same global organization of landscape preferences, while more specific differences required analyses of targeted composite and differential variables.
Because the global preference structure was broadly similar across groups and strongly dominated by the presence of greenery, subsequent analyses focused on semantically defined composite variables and theoretically interpretable contrasts intended to capture subtler differences in spatial organization and function (see Figure 2).

3.1.4. Greenery as the Overarching Dimension of Preference

Three independent analytical approaches—MDS maps with good model fit (Kruskal’s stress), strong correlations between greenery level and ratings, and Mantel test results—converge on a consistent conclusion: greenery constitutes the overarching and universal dimension of landscape preference. Demographic differences (primarily age, and to a lesser extent gender) modulate the strength of this preference and the detailed ordering of individual images, but do not reverse the overall pattern: landscapes with a clear presence of greenery are consistently rated higher than “grey” or built environments.

3.2. Evaluation of Individual Photographs

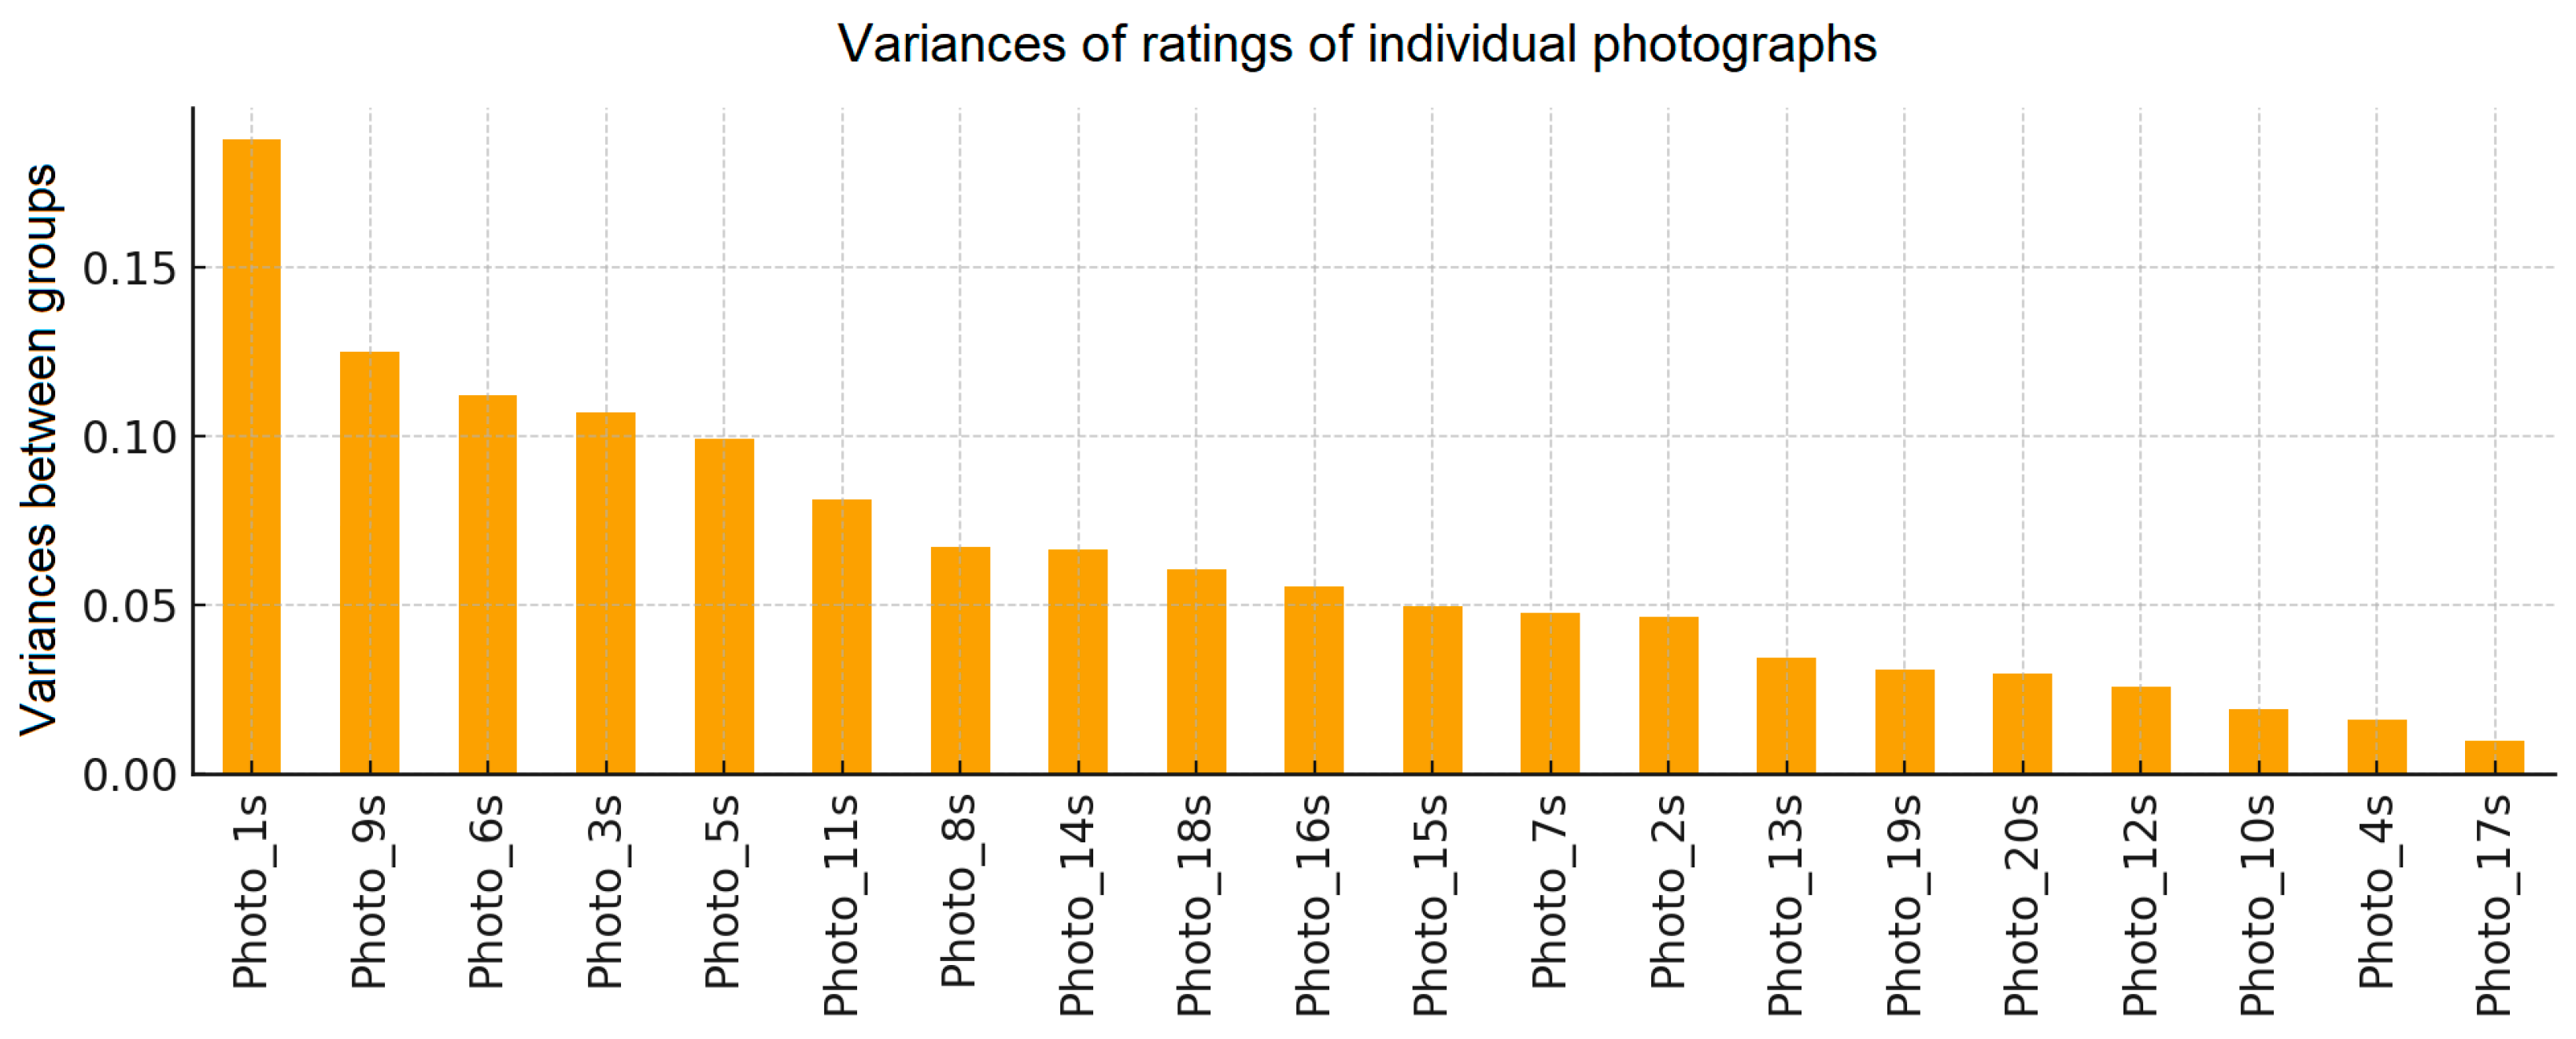
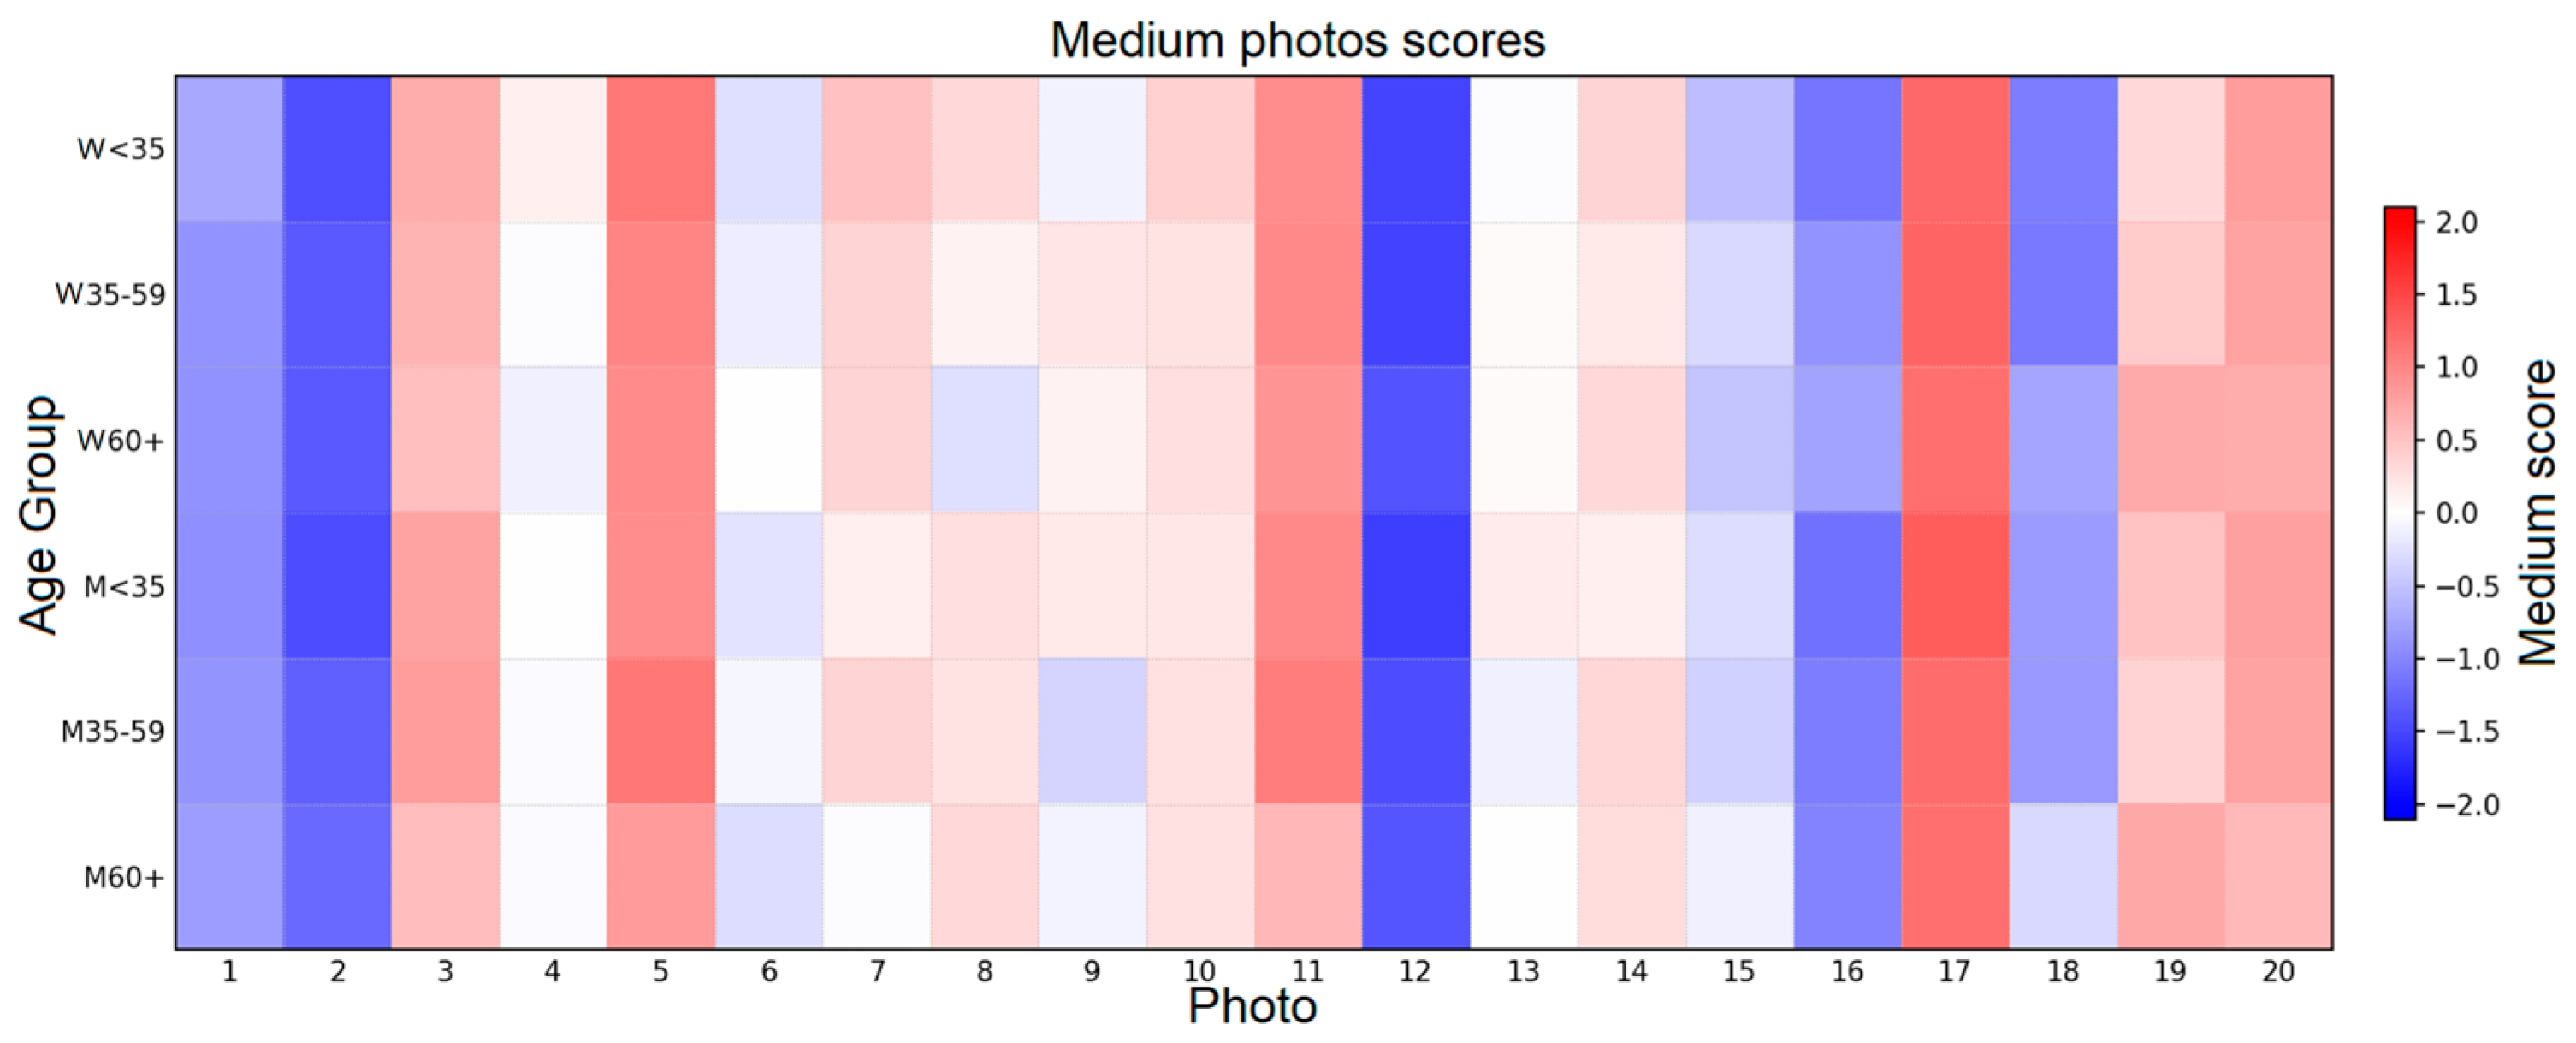
The interpretation of individual photograph ratings builds on the results of the previous section. Both the MDS analysis and the strong correlations between greenery and ratings (Table 2) indicate that greenery is the primary predictor of landscape attractiveness. As a result, many photographs show limited differentiation in ratings—not because they are visually indistinct, but because their level of greenery largely determines their evaluation, leaving relatively little room for the effects of age or gender. Photographs with similar levels of greenery form a stable core of rankings (see Figure 3), reflected in the high agreement of mean ratings across groups. Differences emerge only in a subset of more visually complex scenes (e.g., 7, 8, 9, 15, 18, 19), where additional elements such as infrastructure or composition may influence perception. A complementary perspective is provided by the heatmap (Figure 3), which reveals photographs with exceptionally consistent rating patterns—particularly images 12 and 17, forming uniform, non-differentiated color bands. These images are either strongly liked or disliked but evaluated almost identically across all groups. This is further supported by very low variance in ranking positions (Figure 4) and the distribution of ratings (Supplementary Materials, Figure S1). Due to their low discriminative value, photographs 4, 12, 17, and 20 were treated as non-diagnostic in the photograph-level screening and were excluded from selected composite-level analyses where they did not contribute to the intended contrast. They remained included in analyses of the overall preference structure, including the MDS, Mantel, and greenery–preference correlation analyses.

3.3. Results for Composite Variables

The analyses presented in the previous sections indicate that greenery constitutes the dominant dimension of landscape preference. Consequently, individual photographs often show limited discriminative power when they represent similar levels of greenery, as reflected in the high agreement of ratings and low variance in rankings (Figure 4). To capture more subtle preferences—related not only to the quantity of greenery but also to the structure and function of space—composite variables were introduced. Photographs were grouped based on shared visual characteristics, including type of vegetation, presence of infrastructure, pathway configuration, spatial order, and degree of urbanization. These composites serve as synthetic representations of space types, enabling the identification of differences not observable at the level of individual images. The initial set of composites was defined through semantic classification and subsequently refined based on the analysis of photo ratings. Images with low discriminative power (12, 17, 20) and visually ambiguous cases were excluded. The final set of composite variables is presented in Table 1.

3.4. Means and ANOVA for Composite Variables

The means and standard deviations for composite variables are presented in Table 3, including only those that showed significant effects after FDR correction. The two-way ANOVA (gender × age) revealed selective differences between groups, primarily related to circulation structures and functionally distinct types of greenery (Table 4). Age emerged as the prevailing differentiating factor in the evaluation of landscapes. Significant effects were observed for composites describing parks (Parks), lawns (Lawns), connectors without greenery (CNoGreen), and cycling infrastructure (SBSepar, SBNoGreen). Younger participants tended to assign higher ratings to greener and more natural environments, whereas older participants showed relatively higher evaluations of more structured and less green spaces. Gender effects were more limited and concerned mainly circulation-related structures (SBNoGreen, SBSepar, SBCombined, CNoGreen). Women tended to assign higher ratings to green and park-like environments, whereas men gave relatively higher evaluations to more infrastructure-oriented spaces. No significant Gender × Age interactions were found, indicating that both factors operate independently rather than jointly. Although several effects remained statistically significant after FDR correction, their magnitudes were small to moderate (ηp2 = 0.02–0.07). The observed demographic differences should therefore be interpreted as modest shifts within a broadly shared preference structure rather than as evidence of fundamentally distinct patterns of landscape evaluation.
These results are consistent with the Mantel test analysis, which identified the M60+ group as the most distinct. This group shows a preference for more ordered, “urban” landscapes, which may reflect generational differences related to early environmental experience and aesthetic norms shaped by past urbanization patterns.

3.5. Differential Composite Variables

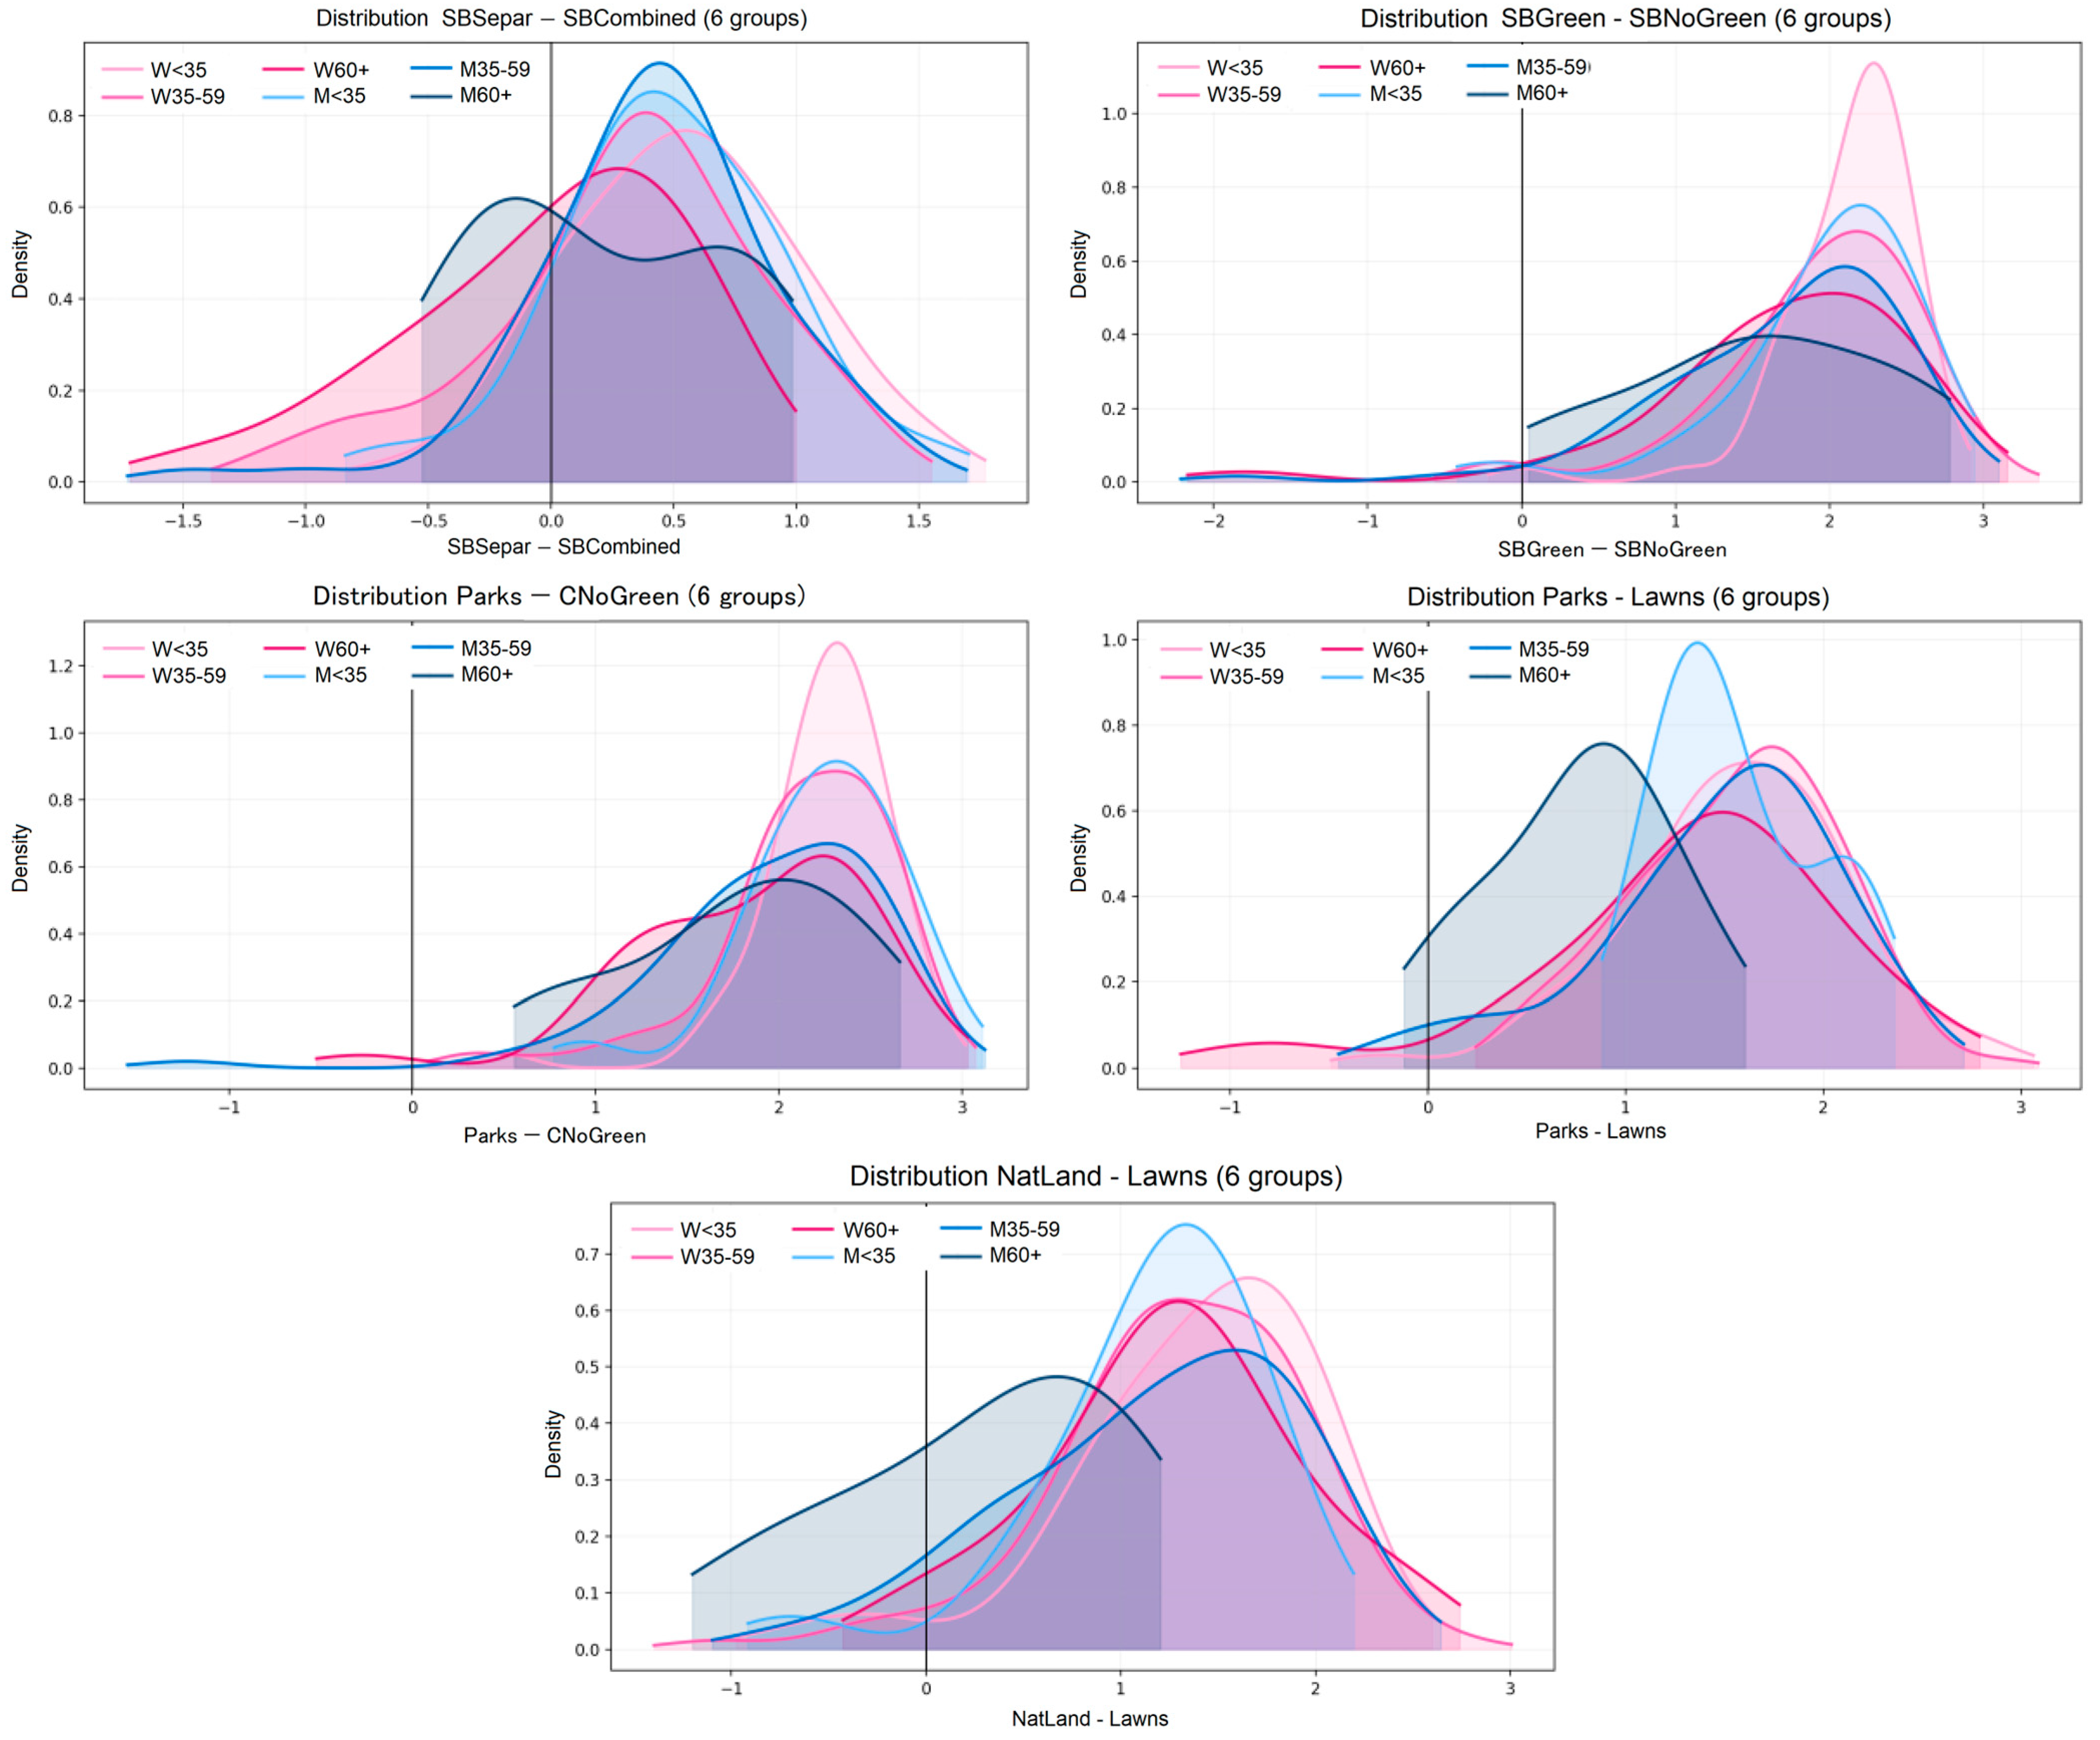
Composite variables revealed group differences but remained strongly influenced by the global greenery effect. To isolate more specific structural preferences, differential variables were constructed as contrasts between pairs of composites (e.g., park vs. lawn, green vs. non-green paths) (Table 5). This approach makes it possible to identify which types of landscapes are preferred over others, beyond the general tendency “green > non-green.” The distributions of these variables across the six age–gender groups (Figure 5) show clearer differentiation than in the case of individual photographs or base composite variables. All contrasts take positive values, indicating a consistent overall preference for greener and more park-like environments over their less green or more “hardened” counterparts. Age-related differences are particularly pronounced. Younger participants show stronger preferences for green, separated, and park-like environments, whereas older participants—especially men—display weaker preferences for these features and relatively higher evaluations of more structured and less green spaces (Table 6). The strongest effects (Table 7) were observed for the contrasts:
  • SBSepar—SBCombined (ηp2 = 0.073),
  • Parks—CNoGreen (ηp2 = 0.059),
  • Parks—Lawns (ηp2 = 0.045),
  • SBGreen—SBNoGreen (ηp2 = 0.039).
These results indicate that preferences are not only driven by the presence of greenery but also by the spatial organization of infrastructure, particularly the separation of pedestrian and cycling routes and the integration of greenery within them. Gender effects were selective. The only consistent effect was observed for the NatLand—Lawns contrast, where women rated natural landscapes higher than men (ηp2 = 0.023). A more nuanced pattern emerged for the Parks—NatLand contrast: while men tended to favor managed park environments over more natural landscapes, women—particularly in the youngest and oldest groups—showed a weaker preference for parks relative to more natural settings. This pattern was not observed in the middle-aged groups, suggesting a non-linear, age-dependent variation in preferences for natural versus designed green spaces. No significant Gender × Age interactions were found, indicating that both factors operate independently. In contrast to common expectations, benches were not particularly preferred by older respondents. The highest evaluations were observed among younger and middle-aged women. This pattern suggests that benches may function not only as elements of rest but also as components of social infrastructure, supporting short stops and informal interactions. However, this interpretation should be treated cautiously, as the social function of benches was not directly measured.
Overall, differential variables proved more effective than individual photographs and composite variables in capturing subtle, structure-based preferences. They reveal that demographic differences primarily concern the organization and function of space rather than the general preference for greenery.

4. Discussion

Users’ evaluations of urban spaces depend not only on their functional and technical characteristics but also on their aesthetic and emotional perception [20]. Previous studies have shown that environmental aesthetics is one of the key factors influencing physical activity, the attractiveness of walking, and route choice [14,15,16]. The aesthetic quality of a place is largely determined by its physical characteristics [21].
In the present study, participants’ preferences for the analysed pedestrian environments were primarily shaped by the presence of greenery. Vegetation was the principal factor differentiating visual evaluations, regardless of respondents’ age or gender. The highest ratings were consistently assigned to routes located within orderly environments lined with large, mature trees. Smaller vegetation elements, including individual trees, potted trees, and lawns, were also rated significantly more positively than routes surrounded by environments devoid of greenery. In contrast, heavily paved spaces lacking vegetation consistently received the lowest evaluations. This pattern is clearly illustrated in Table S4 presented in the Supplementary Materials, which shows the distribution of ratings for all photographs according to respondents’ age and gender.
These findings are consistent with previous research demonstrating that natural landscapes containing vegetation are generally preferred over built-up environments [8,11,16,34,37,38]. Vegetation has been consistently identified as a factor that positively influences landscape evaluation [8,9,10,39]. Among different forms of vegetation, trees are considered particularly important in shaping visual preferences [10,17,40,41,42,43], which is also supported by the findings of the present study.
In addition to environmental characteristics, landscape evaluations are also influenced by sociodemographic factors [10,44]. Among these, age and gender are often considered the most influential variables [10,12,45,46,47,48,49]. However, the practical importance of age- and gender-related differences should not be overstated. The most robust finding of the present study is the broadly shared preference for greenery, whereas demographic factors account for comparatively smaller variations in the evaluation of specific spatial configurations. Although age emerged as the more consistent differentiating factor in the composite and differential-variable analyses, detailed pairwise comparisons did not reveal a uniform pattern structured solely by either age or gender. Instead, many of the observed differences reflected contrasts involving particular respondent groups, especially men aged 60+, suggesting a more complex and potentially non-linear pattern of landscape preferences.
Among the evaluated routes, the highest scores were assigned to those located in orderly environments lined with trees. Areas incorporating accessible spontaneous vegetation, designed pedestrian routes integrated with naturally developing vegetation, were also rated highly. Similarly, unmanaged natural areas without formal walking infrastructure received favourable evaluations; however, in this case, preferences varied by gender. Women across all age groups, as well as men younger than 35 years, rated these environments very positively, whereas older men (35–59 years and 60+) gave them only moderate ratings. These findings are consistent with studies on Informal Green Spaces conducted by research teams led by C. Rupprecht. On the one hand, users tend to prefer wild-looking landscapes when they retain visible signs of management [50]. On the other hand, wildness itself is perceived as attractive because of its authenticity [51].
The greatest variation in ratings was observed for spaces representing contemporary city centres. Urban architecture, extensive paved surfaces, and trees planted in aesthetically designed metal containers elicited mixed responses. This type of environment received moderate evaluations from women aged 35–59 years and 60+, as well as from men younger than 35 years. In contrast, it was evaluated negatively by younger women and by men aged 35–59 years and 60+. The substantial variability in these ratings may reflect differences in underlying personal preferences. For some respondents, modern city centres may evoke positive associations with urbanity and contemporary design, whereas others may perceive them as artificial environments lacking meaningful contact with nature, consistent with the findings reported by Rupprecht et al. [51]. A deeper understanding of these contrasting perceptions represents a promising direction for future research.
With respect to age, younger participants in the present study showed a stronger preference for environments that support active mobility, such as pedestrian routes integrated with bicycle paths. In contrast, older participants placed greater value on comfort, predictability, and spatial order. Gender-related differences were also observed. Women placed greater emphasis on the aesthetic qualities of greenery and showed stronger preferences for pedestrian routes surrounded by well-maintained vegetation. It may be associated with a greater need for perceived safety, as suggested by Navarrete-Hernandez, Vetro, and Concha [52]. Men, in contrast, more frequently focused on the functional characteristics of the routes and the technical aspects of the environment, consistent with previous findings [10,14,48]. These differences, however, are likely to reflect different emphases in the evaluation process rather than fundamentally different preference structures, as the overall pattern of preferences in both groups was consistently driven by the presence of greenery.
A separate issue may be the role of benches. Preferences for the presence of benches did not increase with respondents’ age. It may suggest that benches serve not only as places for rest but also as an important component of urban infrastructure that enables short breaks during everyday activities, particularly for older adults. Their significance therefore appears to extend beyond purely functional purposes, reflecting a broader social and spatial role [53,54,55]. As the presence of benches was not a primary focus of the present survey, a more detailed investigation of this issue would require dedicated research.
Analyses based on composite and difference variables demonstrated that landscape preferences were determined not only by the amount of greenery but also by its spatial organisation and functional context. Younger participants expressed stronger preferences for more natural and open environments, whereas older respondents—particularly men aged 60+ favoured more orderly, infrastructure-oriented landscapes. The influence of gender remained relatively limited and was mainly associated with preferences for natural landscapes. These findings are consistent with the proposition that the more urbanised an individual’s living environment is, the stronger the preference for natural landscapes becomes [12]. The observed patterns also appear to be influenced by cultural factors. Older participants in our study preferred paved and well-organised routes, which may reflect not only their current functional needs but also differences in life experiences and generational backgrounds [12,49,56,57]. Such environments are commonly associated with safety, stability, and ease of use.
It is also worth noting that, across all respondent groups, the lowest ratings were consistently assigned to spaces dominated by extensive paved surfaces and surrounding buildings. In particular, the lowest evaluations were given to paved areas with parked cars. This finding indicates not only a generally negative perception of environments lacking vegetation but also that parked vehicles are perceived as elements that diminish the aesthetic quality of urban space, as reported by Grabar [58] and Oba and Iseki [59]. It is also consistent with the findings of Sun et al. [60], who demonstrated that the visual presence of cars and trucks reduces perceived safety in urban environments. This issue represents another promising direction for future research.
The design of urban spaces should take into account the needs and preferences of their users. Research on this topic has been conducted across various types of urban environments and increasingly includes pedestrian routes, which constitute an important component of cities and everyday urban life [15,16,17,34,35,43,61]. The findings of the present study indicate that the planning and design of pedestrian routes should not be limited solely to technical considerations. This conclusion is supported by previous studies [14,35], which demonstrate that user preferences regarding walking infrastructure should be assessed from the perspective of users rather than designers. These studies also show that the perceived quality of a space depends on the composition and interaction of its elements rather than on individual design parameters.
When designing pedestrian environments, it is therefore important to consider the needs of different age groups and both genders by creating routes that offer a diversity of aesthetic and functional characteristics. Such environments can encourage walking, promote physical activity, and facilitate social interaction. Importantly, these studies also show that users’ preferences are shaped not only by visual aesthetics but also by the anticipated experience of using a space, a relationship that was likewise observed in the present research. Our findings therefore suggest that the Scenic Beauty Estimation (SBE) method, although originally developed to assess the aesthetic quality of landscapes, also provides valuable insights into the functional characteristics and infrastructure of urban environments. Consequently, SBE may serve as a useful tool for urban planners, landscape architects, and decision-makers responsible for managing public spaces. Furthermore, owing to its simplicity and intuitive application, the SBE method has considerable potential for use in participatory planning and public consultation processes involving diverse user groups.

Limitations and Directions for Future Research

The present study has several limitations that should be acknowledged. First, the Scenic Beauty Estimation (SBE) method, which relies on the evaluation of photographic material, is inherently subjective. Consequently, the careful and deliberate selection of photographs is essential to ensure that they accurately represent the characteristics of the analysed environments and provide a reliable basis for assessing respondents’ preferences. When appropriately designed, this approach can generate results that are directly applicable to the planning and design of public spaces [21,34,61]. In addition, the local context of the photographs, all of which were taken in the city of Lublin, may have influenced participants’ evaluations. Although the photographs were carefully selected to represent a broad range of urban environments, this context may limit the generalisability of the findings. Second, the respondent groups were uneven in size, particularly the group of men aged 60+, which calls for cautious interpretation of the results.
Future research may be extended in several directions. First, integrating the SBE method with spatial data derived from Geographic Information Systems (GIS) would make it possible to relate subjective landscape evaluations to objective characteristics of the urban environment, such as the distribution of green spaces, accessibility, and spatial configuration. Second, in situ studies could verify whether preferences expressed during the evaluation of photographs correspond to people’s actual experiences of urban spaces. Another promising direction would be to incorporate users’ mobility experiences, for example, travelling on foot, by bicycle, or by public transport, as different modes of movement may influence how urban landscapes are perceived and evaluated. Finally, future studies could focus on specific environmental features, such as benches, pavement types, tree age, or the characteristics of the surrounding urban context. In addition, variable environmental conditions, such as season, weather, and lighting, may also be taken into account in further assessments.
An important issue may also be to extend the research to include questions related to unequal access to green routes for different social groups [62]. This is also connected to the broader issue of environmental justice [63] and the unequal distribution of green spaces in cities.
Considering these perspectives would provide a more comprehensive interpretation of the present findings and allow for more nuanced conclusions. It would also enhance the practical applicability of the results by supporting the design of urban spaces that are better adapted to the needs, preferences, and everyday experiences of diverse user groups.
Overall, the present study provides evidence that aesthetic preferences should be considered an integral component of pedestrian and cycling infrastructure design. The identified preference patterns offer practical guidance for urban planners and landscape architects by indicating which spatial characteristics are most positively perceived by different user groups and should therefore be incorporated into the planning and revitalisation of urban routes.

5. Conclusions

The aim of this study was to examine how greenery and spatial characteristics influence the aesthetic perception of pedestrian and shared pedestrian–cycling routes using the Scenic Beauty Estimation (SBE) method. The results consistently demonstrate that greenery constitutes the primary and universal dimension of landscape preference. Across all age–gender groups, environments with a clear presence of vegetation were rated higher than built, “hardened” spaces. Moreover the highest aesthetic ratings were assigned to a well-maintained park environment characterised by mature trees, smooth pedestrian surfaces, and benches. Environments containing spontaneous vegetation, both with and without formal pedestrian infrastructure, also received high evaluations. Demographic factors—particularly age—modulate the strength and structure of these preferences, but do not alter the overall pattern. The application of composite and differential variables made it possible to identify more subtle, structure-based preferences that remain hidden at the level of individual photographs. Urban environments characterised by limited vegetation and the presence of parked cars were consistently evaluated negatively across all respondent groups.
Although the Scenic Beauty Estimation (SBE) method was originally developed to assess landscape aesthetics, the present study demonstrates that it also provides valuable insights into users’ preferences regarding the functionality and infrastructure of urban spaces. Consequently, it can serve as a useful tool for urban planners, landscape architects, and decision-makers responsible for public space management. Owing to its simplicity and intuitive application, the SBE method has considerable potential for use in participatory planning, public consultation, and urban design processes involving diverse user groups. The presence of greenery along pedestrian and cycling routes positively influences users’ perceptions of urban environments. Consequently, such spaces are more likely to encourage walking and cycling, thereby supporting physical activity and contributing to improved public health.
The findings have practical implications for sustainable urban design. Greenery should be treated as a fundamental component of pedestrian and cycling infrastructure, as it significantly enhances perceived attractiveness and may support active mobility. At the same time, spatial solutions should be diversified to reflect the needs of different user groups, particularly in terms of spatial organization, accessibility, and everyday usability. The planning and design of new pedestrian and cycling routes should incorporate adequate space for vegetation from the earliest design stages, including the preservation of existing natural vegetation where possible and the planting of large, mature tree species. Additionally the aesthetic quality of existing pedestrian and cycling infrastructure can be substantially enhanced through the introduction of additional vegetation, particularly mature trees, which may increase the attractiveness of these spaces and encourage their more frequent use.


Supplementary Materials

The following supporting information can be downloaded at: https://www.mdpi.com/article/10.3390/su18168436/s1, Figure S1: Examples of photographs with extreme rating distributions (highly liked or highly disliked). Images (2), (12), and (16)–highly disliked; (5), (11), and (17)–highly liked; Table S1: Photographs with the largest ranking differences between groups (top vs. bottom preferences); Table S2: Photographs showing the smallest differences in ranking positions across age–gender groups; Table S3: Significant post hoc comparisons (Tukey HSD) for age and gender effects (only significant after FDR); Table S4: Ratings for all photographs divided between age and gender groups.

Author Contributions

Conceptualization, E.T., J.R., M.N.-K. and J.K.; methodology, E.T., J.R., M.N.-K. and J.K.; software, J.R., M.N.-K. and J.K.; validation, E.T., J.R., M.N.-K. and J.K.; formal analysis, E.T., J.R., M.N.-K. and J.K.; investigation, E.T., J.R. and J.K.; resources, E.T. and J.R.; data curation, E.T., J.R., M.N.-K. and J.K.; writing—original draft preparation, E.T., J.R., M.N.-K. and J.K.; writing—review and editing, E.T., J.R., M.N.-K. and J.K.; visualization, M.N.-K. and J.K.; supervision, E.T., J.R., M.N.-K. and J.K.; project administration, E.T. and J.K.; funding acquisition, E.T. and J.K. All authors have read and agreed to the published version of the manuscript.

Funding

The research was funded as part of the grant “Greenery systems for cities meeting the challenges of the 21st century”—Green Networks, subsidized from the state budget of the Republic of Poland, under the Ministry of Science and Higher Education program “Science for Society II”, agreement no. NdS-II/SN/0175/2023/01.

Institutional Review Board Statement

This study is waived for ethical review as the survey using the SBE (Scenic Beauty Estimation) method does not require approval from the Research Ethics Committee per the Institutional Committee’s determination by Institution Committee.

Informed Consent Statement

Informed consent for participation was obtained from all subjects involved in the study.

Data Availability Statement

Dataset is available at the Institutional Repository of The John Paul II Catholic University of Lublin. Link: https://hdl.handle.net/20.500.12153/9653 (accessed on 10 October 2025).

Conflicts of Interest

The authors declare no conflicts of interest.

Abbreviations

The following abbreviations are used in this manuscript:
SBEScenic Beauty Estimation
ANOVAAnalysis of Variance
SDstandard deviation
FDRFalse Discovery Rate
MDSMultidimensional Scaling

References

  1. Hartig, T.; Mitchell, R.; de Vries, S.; Frumkin, H. Nature and health. Annu. Rev. Public Health 2014, 35, 207–228. [Google Scholar] [CrossRef] [Scilit] [PubMed]
  2. World Health Organization (WHO). Urban Green Spaces and Health. A Review of Evidence. Available online: https://iris.who.int/server/api/core/bitstreams/74006ead-650d-4fca-815a-f1ff53c1eea1/content (accessed on 10 October 2025).
  3. Westenhöfer, J.; Nouri, E.; Reschke, M.L.; Seebach, F.; Buchcik, J. Walkability and urban built environments-a systematic review of health impact assessments (HIA). BMC Public Health 2023, 23, 518. [Google Scholar] [CrossRef] [Scilit] [PubMed]
  4. Gehl, J. Cities for People; Island Press: Washington, DC, USA; Covelo, CA, USA; London, UK, 2013. [Google Scholar]
  5. Jacobs, J. The Death and Life of Great American Cities; Random House: New York, NY, USA, 1961. [Google Scholar]
  6. Lynch, K. Good City Form; MIT Press: Cambridge, MA, USA, 1984. [Google Scholar]
  7. World Health Organization (WHO). Healthy Cities Effective Approach to a Rapidly Changing World. Available online: https://iris.who.int/server/api/core/bitstreams/2e4092fb-4753-4e44-85f1-3ce83b74ad05/content (accessed on 10 October 2025).
  8. Kaplan, R.; Kaplan, S. The Experience of Nature: A Psychological Perspective; Cambridge University Press: Cambridge, UK, 1989. [Google Scholar]
  9. Kaplan, R.; Kaplan, S.; Ryan, R.L. With People in Mind: Design and Management of Everyday Nature; Island Press: Washington, DC, USA, 1998. [Google Scholar]
  10. Błaszczyk, M.; Suchocka, M.; Maksymiuk, G. Kultura czy natura? Mechanizmy percepcji i preferencji wobec krajobrazu i form roślinnych. Pr. Kom. Kraj. Kult. 2017, 36, 21–32. [Google Scholar]
  11. Franěk, M. Landscape preference: The role of attractiveness and spatial openness of the environment. Behav. Sci. 2023, 13, 666. [Google Scholar] [CrossRef] [Scilit] [PubMed]
  12. Xu, M.; Luo, T.; Wang, Z. Urbanization diverges residents’ landscape preferences but towards a more natural landscape: Case to complement landsenses ecology from the lens of landscape perception. Int. J. Sustain. Dev. World Ecol. 2020, 27, 250–260. [Google Scholar] [CrossRef] [Scilit]
  13. Yang, G.; Yu, Z.; Zhang, J.; Søderkvist Kristensen, L. From preference to landscape sustainability: A bibliometric review of landscape preference research from 1968 to 2019. Ecosyst. Health Sustain. 2021, 7, 1948355. [Google Scholar] [CrossRef] [Scilit]
  14. Gao, C.; Yu, J.; Zhao, X.; Wang, H.; Liu, Z.; Gu, Y. The effect of built environment on older people leisure-time walking and physical activity in different sex groups in the City of Ningbo, China. Sustainability 2022, 14, 6562. [Google Scholar] [CrossRef] [Scilit]
  15. Paydar, M.; Fard, A.K.; Khaghani, M. Pedestrian walkways for health in Shiraz, Iran, the contribution of attitudes, and perceived environmental atributes. Sustainability 2020, 12, 7263. [Google Scholar] [CrossRef] [Scilit]
  16. Shafray, E.; Kim, S. A study of walkable spaces with natural elements for urban regeneration: A focus on cases in Seoul, South Korea. Sustainability 2017, 9, 587. [Google Scholar] [CrossRef] [Scilit]
  17. Tabatabaie, S.; Litt, J.S.; Muller, B.H.F. Sidewalks, trees and shade matter: A visual landscape assessment approach to understanding people’s preferences for walking. Urban For. Urban Green. 2023, 84, 127931. [Google Scholar] [CrossRef] [Scilit]
  18. Daniel, T.C.; Boster, R.S. Measuring Landscape Esthetics: The Scenic Beauty Estimation Method; (Research Paper RM-167); U.S. Department of Agriculture, Forest Service, Rocky Mountain Forest and Range Experiment Station: Fort Collins, CO, USA, 1976. [Google Scholar]
  19. Wang, L.; Sun, C.; Wang, M. Optimization strategies for waterfront plant landscapes in traditional villages: A scenic beauty estimation—Entropy weighting method analysis. Sustainability 2024, 16, 7140. [Google Scholar] [CrossRef] [Scilit]
  20. Wang, L.; Zhuang, J.A.; Wang, M. Integrating AHP-SBE for Evaluating Visitor Satisfaction in Traditional Village Tourism Landscapes. Sustainability 2025, 17, 3119. [Google Scholar] [CrossRef] [Scilit]
  21. Peng, X.; Mohamed Afla, M.R. A Multi-Dimensional Assessment of Pocket Park Landscapes: Insights from Scenic Beauty Estimation and Analytic Hierarchy Process in Dadukou District, Chongqing. Sustainability 2025, 17, 2020. [Google Scholar] [CrossRef] [Scilit]
  22. Lee, A.C.; Maheswaran, R. The health benefits of urban green spaces: A review of the evidence. J. Public Health 2011, 33, 212–222. [Google Scholar] [CrossRef] [Scilit] [PubMed]
  23. Lee, A.C.K.; Jordan, H.C.; Horsley, J. Value of urban green spaces in promoting healthy living and wellbeing: Prospects for planning. Risk Manag. Healthc. Policy 2015, 8, 131–137. [Google Scholar] [CrossRef] [Scilit] [PubMed]
  24. Veen, E.J.; Ekkel, E.D.; Hansma, M.R.; de Vrieze, A.G. Designing urban green space (UGS) to enhance health: A methodology. Int. J. Environ. Res. Public Health 2020, 17, 5205. [Google Scholar] [CrossRef] [Scilit] [PubMed]
  25. Grigoletto, A.; Mauro, M.; Maietta Latessa, P.; Iannuzzi, V.; Gori, D.; Campa, F.; Toselli, S. Impact of different types of physical activity in green urban space on adult health and behaviors: A systematic review. Eur. J. Investig. Health Psychol. Educ. 2021, 11, 263–275. [Google Scholar] [CrossRef] [Scilit] [PubMed]
  26. Hu, G.; Luo, Q.; Zhang, P.; Zeng, H.; Ma, X. Effects of urban green exercise on mental health: A systematic review and meta-analysis. Front. Public Health 2025, 13, 1677223. [Google Scholar] [CrossRef] [Scilit] [PubMed]
  27. Dallimer, M.; Tang, Z.; Bibby, P.R.; Brindley, P.; Gaston, K.J.; Davies, Z.G. Temporal changes in greenspace in a highly urbanized region. Biol. Lett. 2011, 7, 763–766. [Google Scholar] [CrossRef] [Scilit] [PubMed]
  28. Lopez-Haro, J.; Gómez-Chávez, L.F.J.; Pelayo-Zavalza, A.R.; Gómez-Varela, J.F. Association between Active Use of Urban Green Spaces and Well-Being in Adults Aged 18–65 Years: A Systematic Review. J. Health Pollut. 2024, 12, 016002. [Google Scholar] [CrossRef] [Scilit] [PubMed]
  29. Peters, K.; Elands, B.; Buijs, A. Social interactions in urban parks: Stimulating social cohesion? Urban For. Urban Green. 2010, 9, 93–100. [Google Scholar] [CrossRef] [Scilit]
  30. Abdala, S.A.; Belabbes, S.; Oliveira, F.C.; Griba, N.; Mouwafaq, S. Physical activity in urban green spaces: A systematic review of participatory approaches. Health Promot. Int. 2025, 40, daaf133. [Google Scholar] [CrossRef] [Scilit] [PubMed]
  31. Gibson, J.J. The Ecological Approach to Visual Perception; Houghton Mifflin: Boston, MA, USA, 1979. [Google Scholar]
  32. Przesmycka, E. Promowanie aktywnego transportu pieszego jako wyzwanie dla urbanistyki współczesnych miast. Teka Kom. Archit. Urban. Stud. Kraj. 2023, 19, 130–137. [Google Scholar] [CrossRef] [Scilit]
  33. Czekiel-Świtalska, E. Publiczne przestrzenie piesze, ich zagospodarowanie i funkcja. Przestrz. Forma 2010, 14, 149–170. [Google Scholar]
  34. Li, X.; Wang, Y.; Wang, Z.; Ding, Q. Evaluation of the visual perception of urban single/double-layer riverfront greenway landscapes based on deep learning. Sustainability 2024, 16, 10391. [Google Scholar] [CrossRef] [Scilit]
  35. Fumagalli, N.; Maccarini, M.; Rovelli, R.; Berto, R.; Senes, G. An exploratory study of users’ preference for different planting combinations along rural greenways. Sustainability 2020, 12, 2120. [Google Scholar] [CrossRef] [Scilit]
  36. Lynch, K. The Image of the City; MIT Press: Cambridge, MA, USA, 1960. [Google Scholar]
  37. Schneider-Skalska, G. Kształtowanie zdrowego środowiska mieszkaniowego. Wybrane zagadnienia. Kwart. Archit. Urban. 2004, 49, 36–47. [Google Scholar]
  38. Schneider-Skalska, G.; Sumlet, W. Piękno środowiska mieszkaniowego-preferencje, zależności, narzędzia. Zesz. Nauk. Politech. Poznańskiej. Archit. Urban. Archit. Wnętrz 2022, 9, 37–49. [Google Scholar] [CrossRef]
  39. Raskovic, S.; Decker, R. The Influence of Trees on the Perception of Urban Squares. Urban For. Urban Green. 2015, 14, 237–245. [Google Scholar] [CrossRef] [Scilit]
  40. Sommer, R.; Summit, J. An exploratory study of preferred tree form. Environ. Behav. 1995, 27, 540–557. [Google Scholar] [CrossRef] [Scilit]
  41. Zheng, B.; Zhang, Y.Q.; Chen, J.Q. Preference to home landscape: Wildness or neatness? Landsc. Urban Plan. 2011, 99, 1–8. [Google Scholar] [CrossRef] [Scilit]
  42. Lin, A.; Lou, J. Pedestrians’ and Cyclists’ Preferences for Street Greenscape Designs. Promet—Traffic Transp. 2022, 34, 367–380. [Google Scholar] [CrossRef] [Scilit]
  43. Huang, X.; Han, C.; Ma, M. Visual preferences for outdoor space along commercial pedestrian streets under the influence of plant characteristics. PLoS ONE 2022, 17, e0264482. [Google Scholar] [CrossRef] [Scilit] [PubMed]
  44. Skiba, M. Ocena atrakcyjności krajobrazu. Przestrz. Forma 2016, 26, 293–304. [Google Scholar] [CrossRef] [Scilit]
  45. Farahani, M.; Maller, C. Perceptions and preferences of urban greenspaces: A literature review and framework for policy and practice. Landsc. Online 2018, 61, 1–22. [Google Scholar] [CrossRef] [Scilit]
  46. Zakharova, K.; Lehtilä, K.; Rodela, R. The Role of Ecological Factors, Gender, and Age in Shaping Visual Preferences for Urban Wetlands. J. Environ. Stud. Sci. 2025, 16, 152–167. [Google Scholar] [CrossRef] [Scilit]
  47. Lyons, E. Demographic correlates of landscape preference. Environ. Behav. 1983, 15, 487511. [Google Scholar] [CrossRef] [Scilit]
  48. Wang, R.; Zhao, J. Demographic groups’ differences in visual preference for vegetated landscapes in urban green space. Sustain. Cities Soc. 2017, 28, 350–357. [Google Scholar] [CrossRef] [Scilit]
  49. Chen, Z.; Xu, B.; Devereux, B. Assessing public aesthetic preferences towards some urban landscape patterns: The case study of two different geographic groups. Environ. Monit. Assess. 2016, 188, 4. [Google Scholar] [CrossRef] [Scilit] [PubMed]
  50. Rupprecht, C.; Byrne, J.A. Informal urban greenspace: A typology and trilingual systematic review of its role for urban residents and trends in the literature. Urban For. Urban Green. 2014, 13, 597–611. [Google Scholar] [CrossRef] [Scilit]
  51. Rupprecht, C.; Byrne, J.A.; Ueda, H.; Lo, A.Y. ‘It’s real, not fake like a park’: Residents’ perception and use of informal urban green-space in Brisbane, Australia and Sapporo, Japan. Landsc. Urban Plan. 2015, 143, 205–218. [Google Scholar] [CrossRef] [Scilit]
  52. Navarrete-Hernandez, P.; Vetro, A.; Concha, P. Building safer public spaces: Exploring gender difference in the perception of safety in public space through urban design interventions. Landsc. Urban Plan. 2021, 214, 104180. [Google Scholar] [CrossRef] [Scilit]
  53. Ottoni, C.A.; Sims-Gould, J.; Winters, M.; Heijnen, M.; McKay, H.A. “Benches become like porches”: Built and social environment influences on older adults’ experiences of mobility and well-being. Soc. Sci. Med. 2016, 169, 33–41. [Google Scholar] [CrossRef] [Scilit] [PubMed]
  54. Moulaert, T.; Wanka, A. Benches as materialisations of (active) ageing in public space: First steps towards a praxeology of space. Urban Plan. 2019, 4, 106–122. [Google Scholar] [CrossRef] [Scilit]
  55. Vijayalaxmi, J.; Sahu, H. Assessment of User’s Preferred Activities and Its Correlation with Landscape Elements in Urban Green Spaces. In Sustainable Resilient Built Environments; Nandineni, R.D., Ang, S., Mohd Nawawi, N.B., Eds.; Springer: Berlin/Heidelberg, Germany, 2024; pp. 29–41. [Google Scholar] [CrossRef] [Scilit]
  56. Liu, Q.Y.; Fu, W.C.; van den Bosch, C.C.K.; Xiao, Y.H.; Zhu, Z.P.; You, D.; Zhu, N.; Huang, Q.; Lan, S. Do local landscape elements enhance individuals’ place attachment to new environments? A cross-regional comparative study in China. Sustainability 2018, 10, 3100. [Google Scholar] [CrossRef] [Scilit]
  57. Adevia, A.A.; Grahna, P. Preferences for landscapes: A matter of cultural determinants or innate reflexes that point to our evolutionary background? Landsc. Res. 2012, 37, 27–49. [Google Scholar] [CrossRef] [Scilit]
  58. Grabar, H. Paved Paradise: How Parking Explains the World; Penguin Press: New York, NY, USA, 2023. [Google Scholar]
  59. Oba, T.; Iseki, H. Transportation Impacts on Cityscape Preservation: Spatial Distribution and Attributes of Surface Parking Lots in the Historic Central Districts. J. Urban Plan. Dev. 2020, 146, 04020014. [Google Scholar] [CrossRef] [Scilit]
  60. Sun, H.; Xu, H.; He, H.; Wei, Q.; Yan, Y.; Chen, Z.; Li, X.; Zheng, J.; Li, T. A Spatial Analysis of Urban Streets under Deep Learning Based on Street View Imagery: Quantifying Perceptual and Elemental Perceptual Relationships. Sustainability 2023, 15, 14798. [Google Scholar] [CrossRef] [Scilit]
  61. Łaszkiewicz, E.; Sikorski, P.; Archiciński, P.; Sikorska, D.; Dobrosz, K.; Kronenberg, J. Would you walk here? Urban wildscapes as visual settings for utility and recreational walks. Cities 2025, 158, 105704. [Google Scholar] [CrossRef] [Scilit]
  62. Sikorska, D.; Łaszkiewicz, E.; Krauze, K.; Sikorski, P. The role of informal green spaces in reducing inequalities in urban green space availability to children and seniors. Environ. Sci. Policy 2020, 108, 144–154. [Google Scholar] [CrossRef] [Scilit]
  63. Schlosberg, D. Defining Environmental Justice: Theories, Movements, and Nature; Oxford University Press: Oxford, UK, 2007. [Google Scholar] [CrossRef] [Scilit]
Figure 1. MDS map for six respondent groups: younger women (W < 35), middle-aged women (W35–59), and older women (W60+); the second row shows the corresponding groups of men. Photo clustering reveals preferences for greenery within individual groups. The diagonal line across the center of the map separates “green” from “non-green” photographs (with the exception of M < 35 and W35–59, where the pattern is less distinct).
Sustainability 18 08436 g001
Figure 2. Similarity of photograph-rating structures between the six age–gender groups, assessed using pairwise Mantel tests. Cells present Mantel Spearman correlation coefficients calculated from photograph-by-photograph dissimilarity matrices based on all 20 within–participant standardized SBE ratings. Higher coefficients indicate greater similarity between the structures of photograph evaluations. Thirteen of the fifteen pairwise comparisons remained statistically significant after Benjamini–Hochberg FDR correction. The two non-significant comparisons were W < 35 versus M60+ (rs = 0.143, q = 0.060) and M < 35 versus M60+ (rs = 0.118, q = 0.113). * q ≤ 0.05, ** q ≤ 0.01, *** q ≤ 0.001.
Sustainability 18 08436 g002
Figure 3. Heatmap of the mean ratings of photographs across six respondent groups (women and men in three age categories). “Blue” bands indicate generally disliked images, while “red” bands indicate generally liked images.
Sustainability 18 08436 g003
Figure 4. Variances of photograph ranking positions (lower values indicate greater agreement between groups).
Sustainability 18 08436 g004
Figure 5. Distributions of differential variables across six age–gender groups.
Sustainability 18 08436 g005
Table 1. Final set of composite variables and their corresponding photographs.
NameDescriptionAbbreviationPhotos
Natural landscapesravines, unmanaged areas, natural vegetationNatLand5, 7, 11
Managed green spacesparks, tree-lined avenues, maintained greeneryParks17, 3, 20
Lawnslawn-covered areas suitable for aesthetic evaluationLawns1, 15
Individual vegetationindividual trees and shrubsIndVeget2, 9, 16, 6, 8, 13
Connectors without greenerypaths or connectors lacking vegetationCNoGreen2, 12, 18
Connectors with benchespaths or connectors equipped with benchesCBench19, 17, 14
Separated sidewalk and bike lanepedestrian sidewalk and bicycle lane separatedSBSepar3, 8
Combined sidewalk and bike lanepedestrian and bicycle paths combined in a single laneSBCombined7, 14
Sidewalk and bike lane with greenerypedestrian and bicycle paths accompanied by greenerySBGreen5, 3, 20
Sidewalk and bike lane without greenerypedestrian and bicycle paths without vegetationSBNoGreen2, 18
Barriers and fencesfences, railings, and protective barriersBarriers12, 13, 19
Paved surfaces/cobblestonescobblestone or other hardened surfacesPaved10
Table 2. Pearson correlations between greenery level and mean photo ratings across the six groups.
Grouprr2p
M < 350.8480.719<0.001
W < 350.8940.799<0.001
M35–590.8890.791<0.001
W35–590.8950.801<0.001
M60+0.8230.677<0.001
W60+0.8800.774<0.001
Table 3. Means and standard deviations (composites with significant effects after FDR correction).
Composite VariableW < 35W35–59W60+M < 35M35–59M60+
Barriers−0.89 (0.26)−0.71 (0.30)−0.69 (0.36)−0.85 (0.23)−0.82 (0.36)−0.91 (0.38)
Parks0.92 (0.27)0.88 (0.28)0.72 (0.35)0.97 (0.23)0.85 (0.34)0.81 (0.31)
SBNoGreen−1.25 (0.34)−1.16 (0.51)−0.99 (0.54)−1.13 (0.53)−0.92 (0.53)−0.78 (0.75)
SBSepar0.51 (0.43)0.28 (0.46)0.06 (0.45)0.52 (0.45)0.48 (0.46)0.39 (0.20)
Lawns−0.64 (0.42)−0.68 (0.41)−0.60 (0.48)−0.61 (0.34)−0.61 (0.45)0.04 (0.31)
CNoGreen−1.34 (0.29)−1.26 (0.38)−1.13 (0.42)−1.28 (0.43)−1.09 (0.45)−0.96 (0.51)
SBCombined−0.03 (0.21)−0.03 (0.28)0.07 (0.29)0.04 (0.23)0.06 (0.31)0.16 (0.43)
Table 4. Two-way ANOVA (2 × 3) for composite variables (effects significant after FDR correction; partial η2 > 0.02).
Composite VariableEffectFdf1df2p_FDReta_p2n
ParksAge5.7822920.02300.0381298
SBNoGreenGender11.312920.01660.0373298
SBNoGreenAge4.622920.03600.0305298
SBCombinedGender6.4412920.04700.0216298
SBSeparGender10.112920.01660.0334298
SBSeparAge9.422920.00220.0605298
CNoGreenGender8.8112920.02160.0293298
CNoGreenAge5.0222920.03100.0333298
LawnsAge4.2922920.04180.0285298
BarriersAge4.9422920.03100.0327298
Table 5. Defined differential composite variables.
Descriptive NameDifferential Composite Variable
Ravines and natural landscapes vs. lawnsNatLand − Lawns
Managed parks vs. connectors without greeneryParks − CNoGreen
Managed parks vs. natural landscapesParks − NatLand
Green pedestrian–cycling paths vs. non-greenSBGreen − SBNoGreen
Separated vs. shared pedestrian–cycling pathsSBSepar − SBCombined
Table 6. Means and standard deviations of differential variables across the six age–gender groups.
VariableW < 35W35–59W60+M < 35M35–59M60+
NatLand_Lawns0.80 (0.47)0.60 (0.50)0.38 (0.62)0.80 (0.30)0.71 (0.56)0.66 (0.50)
Parks_CNoGreen2.26 (0.37)2.14 (0.49)1.85 (0.63)2.25 (0.43)1.94 (0.63)1.77 (0.63)
Parks_NatLand0.06 (0.53)0.14 (0.55)−0.07 (0.68)0.28 (0.64)0.18 (0.68)0.42 (0.67)
SBGreen_SBNoGreen2.12 (0.44)1.94 (0.65)1.68 (0.87)1.97 (0.63)1.69 (0.79)1.55 (0.83)
SBSepar_SBCombined0.54 (0.47)0.31 (0.55)−0.02 (0.57)0.48 (0.46)0.42 (0.49)0.22 (0.51)
CBench_CNoBench1.22 (0.43)1.26 (0.43)1.14 (0.37)1.19 (0.48)1.18 (0.46)1.07 (0.46)
Table 7. Two-way ANOVA (2 × 3) for differential variables (effects significant after FDR (Benjamini–Hochberg) correction; partial η2 > 0.02).
VariableEffectFdf1df2pFDRη2
p
SBSepar_SBCombinedAge11.53322920.0010.073
SBGreen_SBNoGreenAge5.85322920.0190.039
SBGreen_SBNoGreenGender6.64912920.0340.022
Parks_LawnsAge6.94822920.0080.045
Parks_CNoGreenAge9.11522920.0010.059
NatLand_LawnsGender6.91312920.0320.023
Disclaimer/Publisher’s Note: The statements, opinions and data contained in all publications are solely those of the individual author(s) and contributor(s) and not of MDPI and/or the editor(s). MDPI and/or the editor(s) disclaim responsibility for any injury to people or property resulting from any ideas, methods, instructions or products referred to in the content.