Article

The Impact of Small Loan Company Development on Carbon Emission Intensity in the Yangtze River Delta Urban Agglomeration

1
College of Geography and Environment, Shandong Normal University, Jinan 250358, China
2
School of Public Administration, Nanjing University of Finance & Economics, Nanjing 210023, China
*
Author to whom correspondence should be addressed.
Sustainability 2026, 18(16), 8307; https://doi.org/10.3390/su18168307
Submission received: 10 July 2026 / Revised: 3 August 2026 / Accepted: 8 August 2026 / Published: 13 August 2026
(This article belongs to the Special Issue Advances in Low-Carbon Economy Towards Sustainability)

Abstract

Financial development can influence carbon emissions through capital allocation, technological support, and policy transmission. To investigate the inherent association between grassroots inclusive financial institutions and territorial green transformation, this study establishes a city-level panel dataset of the Yangtze River Delta urban agglomeration covering the period from 2010 to 2022. Within the analytical framework of the Spatial Durbin Model, this research decomposes the baseline effect, functional transmission pathways, and cross-sectional heterogeneity of the impact of the development of small loan company (SLC) providers on urban carbon intensity. The results show that SLC expansion significantly increases local carbon emission intensity and produces spatial spillover effects across neighboring cities. Mechanism analysis indicates that SLCs increase emissions mainly by supporting the expansion of small- and micro-sized enterprises in energy-intensive manufacturing sectors, while their role in promoting green technological innovation remains limited. Further analysis shows that local government willingness to pursue green transition weakens the carbon-increasing effect of SLCs, whereas digital inclusive finance strengthens it. The effect also varies by location and regulatory environment, with stronger effects in medium-distance cities and under lower regulatory intensity. These findings reveal how grassroots inclusive financial institutions affect regional carbon outcomes and offer policy implications for aligning inclusive finance with green transition goals. This paper innovatively transcends the conventional low-carbon research paradigm focusing on macro-finance and large formal financial institutions, and instead takes SLCs, a typical micro-level inclusive finance entity, to explore their unique paths affecting regional carbon emissions, and clarifies their action boundaries from multiple dimensions including government governance and digital finance empowerment, which enriches interdisciplinary research literature integrating inclusive finance and low-carbon economy. But this study has limitations: its sample is limited to the Yangtze River Delta urban agglomeration, so the universality of the conclusion needs further verification. This research provides theoretical support and policy reference for regulating the sustainable development of the small loan industry, promoting the integration of inclusive finance and green low-carbon transformation, and advancing high-quality regional low-carbon development.

1. Introduction

Amid accelerating climate change, carbon emission intensity has become an important indicator for assessing regional progress toward green transformation and sustainable development. China, as the world’s largest annual carbon dioxide emitter, plays a central role in global climate governance. Its emission reduction commitments and evolving low-carbon governance framework have therefore attracted sustained attention. As critical spatial nexuses of population concentration, industrial activity, and energy consumption, urban agglomerations play an essential role in national carbon mitigation strategies. Therefore, understanding the spatiotemporal dynamics of carbon emission intensity, as well as the socioeconomic, technological, and institutional drivers behind them, provides an important analytical basis for assessing policy coherence, implementation effectiveness, and pathway feasibility in relation to national decarbonization goals. The Yangtze River Delta urban agglomeration stands as both a critical national manufacturing base and a principal energy consumption hub, while also functioning as a trailblazing pilot zone for green and low-carbon transition pathways [1] for green transformation and low-carbon development. As such, a rigorous examination of the determinants of carbon emission intensity in the Yangtze River Delta urban agglomeration, together with their spatial interdependence, including spillover and convergence effects, has substantial theoretical significance and practical relevance for advancing high-quality regional development and ecological civilization construction.
Regional carbon emission intensity is influenced by multiple factors, including the level of economic development, industrial structure, technological progress, energy structure, and financial development. Among these factors, financial development has received increasing attention for its role in linking capital allocation with regional low-carbon transition [2]. Existing studies have mainly examined formal credit channels and green financial instruments, such as commercial bank credit, green loans [3], and green bonds [4], and have shown that these mechanisms can affect carbon emission intensity by directing capital toward low-carbon activities, improving resource allocation, and pricing environmental risk. However, the environmental effects of SLCs, a key type of inclusive financial institution in China, remain underexplored. As specialized credit providers for small- and micro-sized enterprises (SMEs), SLCs have long been embedded in county-level economies and grassroots industries. Their credit allocation may influence the production decisions, technology choices, and energy consumption patterns of a large number of small businesses [5]. In theory, SLCs may contribute to carbon reduction by easing financing constraints and supporting green technological innovation [6]. However, many SMEs are concentrated in lower-end segments of industrial chains, where energy efficiency is often relatively low. In addition, SLCs may lack mature green credit screening mechanisms and environmental risk assessment systems. For this reason, their credit expansion may increase carbon emission intensity by supporting the expansion of energy-intensive and high-emission production activities.
Theoretically, existing research on the nexus between finance and carbon emissions has long centered on traditional formal financial institutions such as commercial banks [7] and securities firms [8]. Such literature fails to establish a multi-layered financial transmission framework and cannot disentangle the differentiated carbon abatement pathways of heterogeneous financial capital. Practically, numerous micro and small enterprises and county-level business entities rely on SLCs for financing [9], and the production activities of these entities generate substantial regional carbon emissions [10]. Meanwhile, the credit operations of SLCs not only affect the carbon emission intensity of host cities but may also exert spatial spillover effects via industrial linkages, factor mobility, and demonstration mechanisms. This mismatch between theoretical research frameworks and real-world conditions underscores an urgent need to empirically examine the actual impact of SLCs on carbon emission intensity.
Existing international literature still exhibits notable limitations across three dimensions: research subjects, spatial scales, and mechanism identification. Regarding research subjects, international studies predominantly focus on broadly defined microfinance institutions in developing countries, whose organizational forms and regulatory frameworks differ markedly from SLCs in the Chinese context; such institutional heterogeneity renders existing conclusions not directly applicable [11,12]. In terms of spatial scales, international spatial analyses involving microfinance and carbon emissions mostly rely on macro-level panel data at the national or continental scale, making it difficult to capture the refined spatial interaction patterns within urban agglomerations shaped by industrial division of labor and factor mobility [13,14,15]. Regarding mechanism identification, international research largely depends on macro-level mediating variables such as the share of renewable energy and agricultural value added, failing to drill down to the scale expansion and efficiency improvement of small and micro enterprise manufacturing [16,17]. Grounded in SLCs as a micro-level financial entity in China, this paper combines spatial econometric analysis with mechanism research to contribute empirical evidence from the Yangtze River Delta urban agglomeration to the theoretical framework of environmental effects of microfinance institutions.
Based on a systematic review of existing research shortcomings and distinguishing features, the core innovations of this paper are summarized in three aspects. First, innovation in research perspective: this paper incorporates microfinance institutions into the research framework of carbon emission intensity in urban agglomerations, enriching the research dimensions of carbon emission mechanisms of financial entities. Second, innovation in theoretical framework: existing studies mostly endorse the positive carbon reduction effect of financial development, yet lack discussion on grassroots financial logic; this paper complements the theoretical transmission framework between financial institutions and carbon emissions by incorporating realistic constraints such as the low energy efficiency and high energy consumption characteristics of small and micro enterprises. Finally, innovation in empirical research: this paper introduces a spatial econometric analysis paradigm to empirically identify the effect of SLC development on carbon emission intensity in urban agglomerations and clarify the intrinsic mechanisms through which microfinance institutions drive regional low-carbon transformation.
This study explores the effect of SLC development on urban carbon emission intensity and the mechanisms through which this effect occurs, using panel data from 27 prefecture-level cities in the Yangtze River Delta urban agglomeration from 2010 to 2022. It adopts a spatial econometric model to assess both local effects and spatial spillovers across cities. Based on the resource endowments and practical characteristics of the Yangtze River Delta urban agglomeration, this study systematically analyzes how SLCs affect carbon emission intensity covering impact patterns, transmission channels and spatial interactions. It not only fills the gaps of current theoretical systems, but also provides key empirical support and practical reference for green, differentiated and collaborative carbon reduction governance through inclusive finance in urban agglomerations, and is also of great theoretical and practical significance for promoting the interdisciplinary integration of financial geography and environmental economics.
The remainder of this paper proceeds with the following chapter arrangement. Section 2 conducts a literature review by synthesizing relevant studies and proposes research hypotheses through logical deduction. Section 3 introduces sample data sources, variable selection criteria and the construction process of econometric models. Section 4 presents empirical examination. Section 5 discusses the mechanisms and conducts an in-depth analysis of the inherent logic based on empirical findings. Section 6 concludes the paper and puts forward targeted recommendations.

2. Literature Review and Research Hypotheses

2.1. Determinants of Carbon Emissions

Finance has a particularly important role. By allocating capital, pricing risk, and influencing investment decisions, financial systems can affect the scale, structure, and technological efficiency of economic activity, with important implications for carbon emissions [18]. Existing studies have identified several channels through which finance affects emissions, including capital-driven expansion in production scale [19], industrial restructuring through credit screening and investment selection [20,21], and efficiency gains associated with green technological innovation [22,23]. The effect of financial development on carbon emissions is therefore neither uniform nor linear. It varies with the stage of financial development, the structure of the financial system, and the orientation of public policy. Financial development may also affect carbon emissions beyond local administrative boundaries. Financial capital, credit relationships, and investment networks can connect firms and regions, thereby strengthening the spatial dependence of carbon emissions. For example, financial geographic density has been found to be positively associated with local carbon emission intensity, while higher financial geographic density in neighboring regions is associated with lower local carbon emission intensity [24]. Evidence further shows that financial development can reduce carbon emissions through both local and spillover effects, although the direction of the spillover effect varies by development context: it reduces emissions in surrounding areas in developed countries but increases them in surrounding areas in developing countries [25].
Existing studies have explored the environmental effects of financial development mainly through macro-level indicators, including credit scale [26], financial structure [27], and carbon finance [28]. More recent research has shifted attention to financial institutions themselves, although the focus has largely remained on large conventional institutions, such as banks, securities firms, and insurance companies [29]. Their lending policies, investment decisions, and risk preferences influence the allocation of social capital and the efficiency of resource use [30,31,32], making them an important link between financial supply and carbon emissions in the real economy. For example, bank lending to governments and firms, together with corporate deposits, has been found to have a statistically significant positive relationship on regional carbon emissions in a panel fixed-effects model [33]. In the insurance sector, the environmental effects vary across institutional contexts: in the European Union, a more developed insurance sector is associated with both GDP growth and lower carbon emissions, whereas in Central and Eastern Europe, insurance expansion supports economic growth but has no statistically significant effect on emissions [34]. This heterogeneity is attributed to differences in sectoral development, environmental regulatory stringency and enforcement, and the market uptake of green insurance products. However, large conventional financial institutions often have high service thresholds. Strict credit requirements, collateral demands, and standardized risk assessment procedures can exclude many financially marginalized groups, including smallholder farmers, informal micro-entrepreneurs, and low-income households, from formal financial services [35,36,37]. Such exclusion has implications for carbon mitigation, as it leaves the carbon footprint of these groups’ economic activities largely outside formal financial governance and limits their access to finance for green transition needs, such as energy-efficient equipment upgrades and clean cooking solutions. Microfinance and inclusive finance are often discussed in this context, since they are designed to serve people and businesses that lack access to traditional banking services. For example, the United Nations Educational, Scientific and Cultural Organization defines microfinance as financial services for low-income individuals or groups who are typically excluded from traditional banking due to poverty, lack of collateral, or limited credit history, while the Consultative Group to Assist the Poor (CGAP) defines financial inclusion as access to affordable, responsible financial services for people and businesses. Against this background, SLCs have become environmentally relevant actors. By providing inclusive, smaller-scale, and more locally adapted credit, they may ease financing constraints for underserved groups and support low-carbon investments at the grassroots level [38].
Research on the environmental effects of SLCs remains limited. Related evidence has mainly come from studies on microfinance institutions (MFIs), which provide inclusive credit to underserved households and small businesses. This literature suggests that inclusive finance can support emission reduction when it is linked to green lending, environmental risk management, or clean energy adoption. Green lending and environmental risk management within MFIs have been found to reduce greenhouse gas emissions [10]. Microfinance has also been shown to support rural access to solar energy, especially through loan programs for solar lanterns and solar home systems, with potential effects on household energy use and carbon footprints [39]. Evidence from an unbalanced panel of 274 MFIs in Southeast Asia from 2000 to 2014 further shows that microfinance activity, measured by the number of borrowers, outstanding loans, and average loan size relative to gross national income Per Capita, is negatively associated with agricultural greenhouse gas emissions [13]. Yet, the environmental effects of microfinance and related inclusive financial institutions vary across socioeconomic and institutional contexts. Since MFIs are geographically embedded institutions, their lending activities are closely connected to local industrial structures [40]. For instance, evidence from 2064 microfinance institutions in 94 countries from 2007 to 2018 shows that institutions located in countries with greater socioeconomic freedom and higher levels of human development are more likely to provide financing and investment support for environmentally friendly projects [41].
However, existing literature has largely focused on the direct environmental effects of the greening operations of microfinance institutions, while lacking a systematic analysis of the mechanisms through which they affect carbon emissions. Although the roles of geographical embeddedness and institutional environments have been explored, the spatial dimension has not been incorporated into the analytical framework, rendering it impossible to identify the local effects and spatial spillover effects of microfinance credit allocation. In view of this, it is necessary to integrate the theory of spatial embeddedness from financial geography with spatial econometric methods to re-examine the spatial boundary conditions of the environmental effects of SLCs.

2.2. Effects of MFIs

From the perspective of financial geography, the operational performance and multi-dimensional externalities of microfinance institutions are profoundly shaped by geographical space. Financial geography emphasizes that financial activities do not unfold in a homogeneous abstract space [42], but are deeply embedded in specific local institutional environments, resource endowments, and social relation networks; consequently, their social, economic, and environmental effects exhibit significant spatial heterogeneity [43]. Variations in financial accessibility, institutional thickness, regulatory intensity, and ecological vulnerability across different geographical regions collectively constitute the spatial context for microfinance institution activities, thereby influencing their credit allocation patterns and sustainable development performance [44].
In terms of social impact, the welfare effects of MFIs are often assessed through changes in clients’ well-being, including health, education, housing security, and life satisfaction [45]. Hossain’s research confirms that microfinance institutions providing basic financial services to low-income rural populations can effectively help them withstand the impact of poverty [46]. Economically, MFIs can affect household livelihoods, corporate performance, and poverty reduction by widening access to small-scale financial services. Microfinance has been found to improve the performance and survival prospects of micro-, small-, and medium-sized enterprises by easing working capital constraints [47].
With respect to environmental impact, existing studies suggest that MFIs may either reduce or increase carbon emissions, depending on how credit is allocated and how environmental considerations are incorporated into lending practices. One strand of research emphasizes the emission-reducing potential of green microfinance. At the theoretical level, microfinance has been linked to grassroots environmental action when environmental goals are incorporated into local development and lending practices [48]. Empirical studies provide further support for this view. Evidence from Southeast Asia shows that microfinance activity is negatively associated with agricultural greenhouse gas emissions. Microenterprises supported by green microcredit have been found to show stronger environmental orientation and greater potential for local ecological sustainability than conventional microenterprises [49]. MFIs may also contribute to environmental sustainability by supporting investment in renewable energy and energy-saving technologies [50].
A second strand of research draws attention to the environmental risks associated with microfinance. These risks arise from the objectives of MFIs, the characteristics of their borrowers, and the regulatory environments in which lending takes place. In many cases, both MFIs and borrowers prioritize income generation and repayment capacity, while the ecological costs of financed activities receive less attention. As a result, microcredit may contribute to resource overuse and environmental pollution when it supports activities with high environmental burdens. Cross-country evidence suggests that this risk is particularly relevant in developing economies. MFIs located in Asian countries with higher carbon emissions have been found to be less likely to integrate social, economic, and environmental policies into their operations [41]. In rural areas, microcredit may also finance the purchase of pesticides, fertilizers, livestock, and land, which can increase chemical pollution, waste generation, and pressure on local ecosystems [51]. The absence of environmental regulation can further amplify these risks. Without incentives for environmental assessment or external regulatory pressure, MFIs may prefer clients with higher short-term returns even when their activities carry substantial environmental costs [52].

2.3. Research Hypotheses

2.3.1. The Development of SLCs and Urban Carbon Emission Intensity

SLCs mainly serve SMEs, self-employed businesses, and farmers, which are often underserved by conventional financial institutions [53]. By improving access to credit, SLCs can ease financing constraints in production, operations, and innovation, thereby supporting business expansion and efficiency improvement [54]. However, many of these borrowers operate in labor-intensive or resource-intensive sectors and may have limited capacity or incentives to adopt green technologies [55]. In addition, due to their own lending preferences and relatively weak regulatory oversight, SLC funds may flow more readily to energy-intensive and high-emission production activities than to low-carbon activities, such as green technology research and development or upgrades to environmental protection facilities [56]. In this case, SLC credit may have a stronger effect on production expansion than on efficiency improvement, which may raise urban energy consumption and carbon emission intensity [57]. The effect of SLCs may also extend beyond local boundaries through interregional competition in environmental regulation, credit network linkages, and cross-regional flows of labor, capital, and other production factors. Given the preceding analysis, the following hypothesis is advanced:
H1. 
The expansion of SLCs has the potential to raise urban carbon emission intensity and exhibits pronounced spatial spillover effects.

2.3.2. Transmission Mechanisms Between SLC Development and Urban Carbon Emission Intensity

SLCs can alleviate financing constraints for small and micro enterprises in general manufacturing, promote firm entry and production capacity expansion [58], and thereby elevate urban carbon emission intensity [59]. These enterprises predominantly engage in labor- and resource-intensive production, with energy consumption per unit of output significantly exceeding the industry average. Prolonged operations tend to solidify extensive energy use patterns, generating path dependence in high-carbon energy consumption [60]. Meanwhile, through the transmission of industrial linkage effects, capacity expansion by these enterprises stimulates the development of upstream high-carbon raw material extraction industries [12] and triggers the agglomeration of regional freight logistics [61] and supporting processing industries [62], further amplifying the aggregate carbon-augmenting impact of credit expansion.
H2. 
The development of SLCs can increase urban carbon emission intensity by facilitating the expansion of small and micro enterprises in general manufacturing.
The technology-innovation channel works in the opposite direction. SLCs may ease financing constraints for SMEs engaged in research and development, technological innovation [63], equipment upgrades, and process improvement. In principle, this can improve production efficiency and energy use efficiency, thereby reducing carbon emission intensity [64]. However, the emission-reducing potential of this channel may be limited in the case of SLCs. Given their operational characteristics [65], business models, borrower profiles, and regulatory environment, SLCs tend to provide short-term credit for liquidity needs rather than long-term finance for green R&D [66]. This creates a mismatch between SLC credit and green innovation projects, which often require longer investment horizons, higher risk tolerance, and larger capital commitments [67]. As a result, SLCs may support small-scale, short-term technical improvements, but they are less likely to finance long-cycle and capital-intensive green innovation. Their ability to reduce carbon emission intensity through technological upgrading is therefore likely to be constrained. Given the preceding analysis, the following hypothesis is advanced:
H3. 
The transmission pathway through which SLCs leverage technological innovation to generate carbon reduction effects may encounter obstacles.

2.3.3. Moderating Mechanisms Between SLC Development and Urban Carbon Emission Intensity

The environmental effect of SLCs depends not only on their lending behavior, but also on the institutional environment and technological context in which they operate. From the perspective of the institutional environment, local government commitment to green transition reflects the extent to which local authorities promote low-carbon socioeconomic development through policy incentives and institutional constraints [68,69]. When this commitment is strong, stricter standards, clearer policy guidance, and more effective regulation may constrain SLC credit allocation [70,71], reduce lending to carbon-intensive sectors, and weaken the carbon-increasing effect of SLC development [72,73].
From the perspective of technological development, digital inclusive finance is reshaping microcredit services through broader coverage, deeper use, and higher levels of digitization [74]. Broader coverage and deeper use can lower barriers to microcredit services, but they may also extend credit to more lower-end segments of industrial chains and carbon-intensive small enterprises with relatively low energy efficiency, thereby increasing carbon emission intensity [75]. Although higher levels of digitization can improve the enabling role of digital technologies, this role is currently reflected more in credit approval and disbursement efficiency than in stronger capacity to identify green technologies or environmental risks. Digital inclusive finance may therefore accelerate credit flows into carbon-intensive sectors and strengthen the carbon-increasing effect of SLC development [76]. Therefore, this study proposes the following hypothesis:
H4. 
Local government commitment to green transition weakens the positive relationship between SLC development and urban carbon emission intensity, whereas digital inclusive finance strengthens this relationship.

2.3.4. Regional Heterogeneity in the Effects of SLC Development on Urban Carbon Emission Intensity

Regional differences in factor endowments, location, technological capacity, and industrial development paths may lead to different environmental responses to the same change in financial conditions [77,78]. Therefore, the effect of SLC development on urban carbon emission intensity may vary across regions. On the one hand, the financial influence of central cities tends to weaken with distance [79], which may create gradients among surrounding cities in the timing of industrial transfer, the choice of industrial structure, and the capacity to absorb technology spillovers. These differences may lead to varying carbon-increasing effects of SLCs [80]. In nearby cities, the carbon-increasing effect may be weaker or even insignificant due to earlier industrial transfer reception, stronger green technology spillover effects, and industrial structure upgrading [81]. In medium distance cities, which serve as preferred destinations for high energy consuming industrial transfers with relatively lax environmental constraints and attenuated technology spillovers, SLC capital may more readily flow toward capacity expansion, resulting in the strongest carbon-increasing effect. In distant cities, the carbon-increasing effect may be relatively weaker due to the inherently smaller scale of SLC credit allocation.
On the other hand, regulatory intensity toward SLCs also differs across regions. In regions with stricter regulation, higher entry barriers, more standardized information disclosure, and more frequent on-site inspections, SLCs may adopt more cautious lending practices and embed environmental risk assessment more deeply into lending decisions. As a result, their carbon-increasing effect may be institutionally suppressed and weaker [82]. Conversely, in regions with laxer regulation, SLCs may be more prone to neglect environmental risk assessment driven by profit-seeking motives and over-allocate credit to high-energy-consuming small and medium enterprises, leading to a more pronounced carbon-increasing effect. Hence, this study proposes the following hypothesis:
H5. 
The effect of SLC development on urban carbon emission intensity may exhibit significant regional imbalances.

3. Data and Methods

3.1. Model Construction

To assess the effect of SLC development on carbon emission intensity while accounting for spatial dependence across cities, this study specifies a spatial econometric model using Stata 18. After a series of specification tests, the spatial Durbin model (SDM) is selected as the preferred model.
C I i t = ρ W i t C I i t + α S L C i t + β W i t S L C i t + c N i = 1 N W i t C o n i t + μ i + γ i + ε i
W i t = 1 / d i j p g d p i ¯ p g d p j ¯ ,     i j 0 , i = j
In Equation (1), CIit represents the carbon emission intensity of city i in year t; SLCit denotes the number of SLCs in city i in year t; Wit is the inverse distance economic geographical nested matrix where dij denotes the shortest distance between city i and city j, and p g d p i ¯ and p g d p j ¯ denote the average annual Per Capita GDP of cities i and j during the sample period, respectively. This matrix simultaneously captures the dual spatial association characteristics of geographic distance decay and regional economic similarity [83]; α is the regression coefficient of the core explanatory variable; β is the spatial regression coefficient of the core explanatory variable; CN represents the coefficients of the control variables; Conit is the vector of control variables for city i in year t; μi denotes city-fixed effects; γi denotes time-fixed effects; and εi is an independently and identically distributed random error term [84].
To identify the mechanisms through which SLC development affects carbon emission intensity, this study tests two potential channels: the expansion of SMEs in general manufacturing and technological innovation. The scale-expansion channel is proxied by the annual number of newly established SMEs in general manufacturing, while technological innovation is measured by the number of newly granted invention patents. A baseline mediation model is specified as follows:
M E D i t = ρ W i t M E D i t + a 1 S L C i t + β 1 W i t S L C i t + c N t = 1 N W i t C O N i t + μ i + γ i + ε i t  
C I i t = ρ W i t C I i t + a 1 S L C i t + β 1 W i t S L C i t + a 2 M E D i t + β 2 W i t M E D i t + c N t = 1 N W i t C O N i t + μ i + γ i + ε i t
In Equations (3) and (4), MED denotes the mediating variable.
To test whether external conditions shape the relationship between SLC development and carbon emission intensity, this study explores the moderating roles of local government commitment to green transition and digital inclusive finance. Local government commitment to green transition is measured by the share of green fiscal expenditure in total public fiscal expenditure. Digital inclusive finance is measured using the Peking University Digital Financial Inclusion Index. The moderation model is specified as follows:
C I i t = ρ W i t C I i t + a 1 S L C i t + β 1 W i t S L C i t + a 2 M O D i t + β 2 W i t M O D i t + a 3 S L C i t M O D i t + β 3 W i t S L C i t M O D i t + c N t = 1 N W i t C O N i t + μ i + γ i + ε i t
In Equation (5), MOD represents the moderating variable.

3.2. Variables

Dependent variable. Carbon emission intensity (CI) refers to the volume of carbon dioxide emissions generated per unit of GDP. Carbon emission intensity can eliminate biases arising from regional differences in economic scale, enabling a more objective measurement of the intrinsic correlation between the development of SLCs and regional low-carbon transition.
Core explanatory variable. SLC development is measured by the annual number of small loan companies (SLCs) in each city. Specifically, this variable refers to the year-end number of SLCs that operate in a given city and have been approved and registered by local financial regulatory authorities. It serves as an indicator of cross-city differences in the development of SLCs.
Control variables. The control variables include Per Capita GDP (PGDP), government fiscal pressure (FD), transportation resource allocation (ROAD), urbanization level (URBAN), foreign trade dependence (FTD), human capital (EDU), and population density (PD). PGDP is adopted to capture the nonlinear impact of economic development stages on carbon emissions, which aligns with the core logic of the Environmental Kuznets Curve hypothesis [85]. FD is measured by the ratio of general public budget expenditure to general public budget revenue at the city level. In line with fiscal decentralization theory, the fiscal revenue and expenditure status of local governments directly determines their capacity to invest in environmental governance and enforce industrial policies [86]. ROAD is quantified by the standard deviation of nighttime light intensity within each prefecture-level administrative area. Based on new economic geography theory, the spatially balanced allocation of transportation infrastructure shapes regional carbon emission patterns by altering the efficiency of factor mobility and the spatial distribution of industries [87]. URBAN is measured by the share of permanent urban residents in the total permanent population. The urbanization process exerts systematic impacts on carbon emissions by reshaping population agglomeration patterns, energy consumption mixes and industrial structure [88]. FTD is measured by the ratio of total imports and exports to regional GDP. Drawing on the Pollution Haven Hypothesis and trade theories, foreign trade affects local carbon emission levels through scale, composition and technique effects [89]. EDU is proxied by the number of college students per 10,000 residents. The accumulation of human capital serves as a critical source of green technological innovation, facilitating the adoption of low-carbon technologies and the improvement of energy efficiency [90]. PD is measured by the ratio of permanent resident population to administrative land area. Population density influences carbon emissions via energy utilization efficiency, the share of public transport and land use intensity [91].
Heterogeneity variables. Geographic location and SLC regulatory intensity are used as grouping variables for the heterogeneity analysis. Geographic location (GL) is measured by the distance from each city to the nearest provincial capital or sub-provincial central city. SLC regulatory intensity (RI) is measured by the ratio of the number of revoked or canceled SLCs in a given year to the total number of existing SLCs in that year.

3.3. Study Area

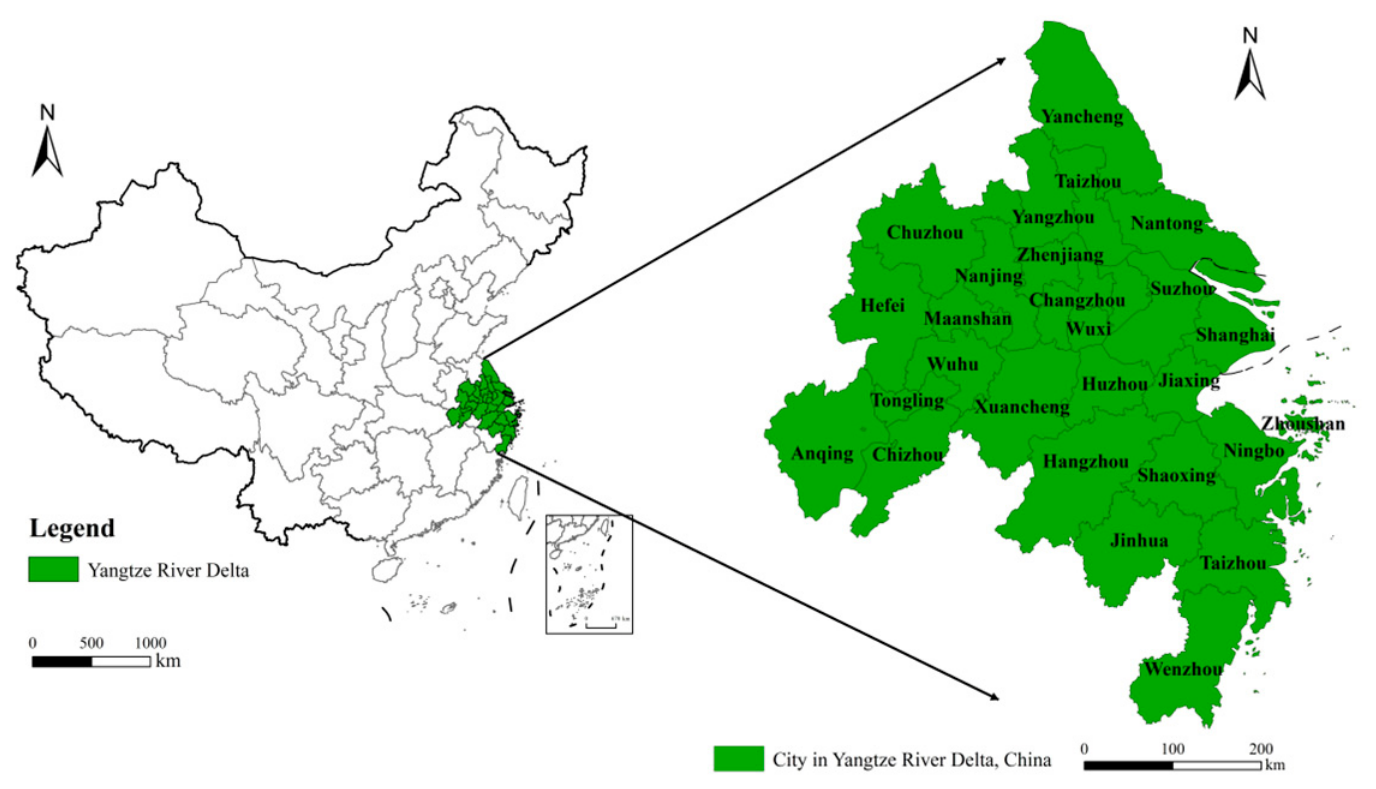
This study selects the panel data of 27 cities in the central area of the Yangtze River Delta Urban Aggregation from 2010 to 2022 as the research sample (Figure 1). According to the enterprise database of Qichacha, Jiangsu Province ranks first nationwide in the number of microcredit companies, while Anhui and Zhejiang Provinces also occupy an upper tier nationwide. Collectively, the Yangtze River Delta has cultivated a large-scale, mature industrial cluster of microcredit institutions with strong representativeness. The micro-manufacturing industry within the Yangtze River Delta outperforms other regions nationwide in overall scale, spatial agglomeration degree and complete supporting industrial chains, accompanied by prominent industrial radiation capacity and inter-industry linkage effects [92]. Since the launch of the integrated development strategy for the Yangtze River Delta, regional coordinated development has achieved breakthrough progress. The unified integrated institutional framework has eliminated institutional barriers to the cross-city flow of production factors. Accordingly, the region’s carbon emission evolution patterns and spatial spillover effects differ substantially from those of other urban agglomerations in China [93]. At the same time, its dense industrial activity and high energy demand create considerable pressure for low-carbon transition and stricter ecological and environmental regulation. Analyzing how SLC development affects carbon emission intensity in this region is therefore important for understanding the relationship between inclusive finance and regional low-carbon development.

3.4. Data Sources and Description

Following the Outline Development Plan for Regional Integration of the Yangtze River Delta issued by the CPC Central Committee and the State Council of the People’s Republic of China, this study constructs a balanced panel dataset for 27 prefecture-level cities in the Yangtze River Delta urban agglomeration from 2010 to 2022. Using collected energy statistics, Provincial carbon emissions are quantified in accordance with the carbon accounting approaches specified in the “2006 IPCC Guidelines for National Greenhouse Gas Inventories”. Integration of DMSP-OLS and NPP-VIIRS nighttime light remote sensing datasets enables further estimation of carbon emissions at the prefectural city scale [94,95]. DMSP-OLS datasets are available at https://www.ngdc.noaa.gov/ (accessed on 19 March 2024), while NPP-VIIRS satellite products can be accessed via https://eogdata.mines.edu/ (accessed on 19 March 2024) [84]. Other datasets are drawn from statistical yearbooks, including the China City Statistical Yearbook, China Energy Statistical Yearbook, China Environmental Statistical Yearbook, and provincial statistical yearbooks. Additional data are obtained from municipal statistical bulletins on national economic and social development, official sources from regulatory authorities such as the National Financial Regulatory Administration and the China Securities Regulatory Commission, and firm-level information from third-party databases such as Qichacha. Missing values are supplemented through interpolation. Table 1 reports the descriptive statistics for all variables.

4. Results

4.1. Baseline Regression

Before estimating the baseline model, this study conducted unit root tests and multi collinearity tests for all variables, as well as a global spatial autocorrelation test for the dependent variable. First, the Levin–Lin–Chu (LLC) and Im–Pesaran–Shin (IPS) unit root tests are simultaneously employed to avoid the risk of spurious regression and ensure that subsequent regression results reflect genuine relationships among variables rather than common time trends. The results are reported in columns (1) to (4) of Table 2. The vast majority of variables remain stationary at the 1% significance level, indicating that the variables are not subject to common time trends overall. Second, variance inflation factors (VIFs) were calculated to detect potential multicollinearity. As reported in column (5) of Table 2, all VIF values are below 10, indicating that multicollinearity is unlikely to be a serious concern.
Second, this study tests the global spatial autocorrelation of carbon emission intensity in the Yangtze River Delta urban agglomeration from 2010 to 2022. The results are reported in Table 3. During the sample period, Moran’s I is significantly negative in each year, with all p-values below 0.01, indicating that carbon emission intensity exhibits a significant high–low alternating spatial distribution pattern, rather than a conventional spatial agglomeration pattern. The formation of this pattern is closely associated with competitive differentiation among regions. For example, the gradient-based industrial division of labor between core and peripheral cities, the “pollution haven” effect triggered by regional disparities in environmental regulation intensity, and the siphon effect through which core cities attract factors from surrounding areas may all contribute to the emergence of this spatial pattern. This provides the primary rationale for employing spatial econometric models rather than ordinary panel models in this study.
A series of diagnostic tests are conducted to select the optimal-fitting spatial regression model, with the results summarized in Table 4. All four categories of Lagrange Multiplier (LM) statistics are significant at the 1% level, verifying notable spatial interdependence across the observed urban samples and thus ruling out the applicability of standard panel models. Subsequently, Likelihood Ratio (LR) and Wald tests are employed to examine whether the Spatial Durbin Model (SDM) can be simplified to the Spatial Error Model (SEM) or Spatial Lag Model (SLM), and all test results strongly reject such simplification possibilities. The Hausman test further excludes the random-effect specification and supports the adoption of a fixed-effect framework. Additionally, separate LR tests for individual and temporal effects yield significant outcomes, leading to the final adoption of a two-way fixed-effects Spatial Durbin Model framework that controls for both city-specific and year-specific unobserved heterogeneity.
To assess the robustness of the estimation results, this study compares the SDM, spatial autoregressive model (SAR), and SEM. The results are reported in Table 5. Under the specification with time-fixed effects, the coefficients of the core explanatory variable have consistent signs across the three models, and their statistical significance remains stable. This suggests that the main findings are robust to alternative spatial model specifications. Given the significant and stable spatial heterogeneity among cities in the Yangtze River Delta urban agglomeration regarding their stages of economic development, industrial structure, and environmental regulation intensity, and considering that model specification requires a dual consideration of statistical tests and empirical identification strategies, introducing individual fixed effects tends to excessively absorb the cross-sectional variation in the sample. This makes it difficult to effectively identify the true effect of the core explanatory variable and may even lead to sign reversal of coefficients. Therefore, this study controls only for time fixed effects in the benchmark regression to eliminate annual macro shocks, without incorporating city individual fixed effects. In summary, this study ultimately selects the Spatial Durbin Model (SDM) with time fixed effects as the benchmark analysis model.
Finally, the baseline regression results in Table 6 show that SLC development is positively associated with local carbon emission intensity, with a coefficient of 0.149 and significance at the 1% level. The direct effect coefficient of SLCs is 0.142, significant at the 1% level; the indirect effect coefficient reaches 1.259, and the total effect coefficient is 1.401. This reveals an important issue in the process of inclusive finance development: while SLCs help alleviate financing constraints for SMEs, they may also generate negative environmental externalities. Currently, the microcredit industry generally lacks effective mechanisms to guide green lending, and the SMEs served tend to be driven by short-term profit motives, directing newly acquired credit resources primarily toward high-energy-consuming and high-emission production activities. As a result, the scale expansion effect brought about by SLC growth outweighs the efficiency improvement effect. Moreover, The spatial autoregressive coefficient is estimated at −0.193 but is not statistically significant, suggesting that within the sample period, cities in the Yangtze River Delta do not exhibit significant endogenous spatial dependence in carbon emission intensity; that is, local carbon emission levels are not materially influenced by the carbon emission intensity of neighboring cities in an endogenous manner. By contrast, the spatial lag coefficient of the small loan company explanatory variable is significantly positive, confirming that the carbon emissions triggered by SLC expansion manifest a pronounced exogenous spatial spillover effect. This implies that the growth of local microcredit not only intensifies local pollution but also diffuses pollution effects to neighboring regions through industrial linkages, factor mobility, and other channels. Collectively, the benchmark regression results and spillover effect analysis confirm that Hypothesis 1 of this study is empirically supported.
Among the control variables, urbanization level and human capital are both negatively associated with carbon emission intensity. The effect of urbanization is particularly pronounced, with a coefficient of −0.717 that is significant at the 1% level. This result suggests that urbanization may reduce carbon emission intensity per unit of output through agglomeration economies, industrial upgrading, and shared infrastructure. The coefficient for human capital is −0.139 and is also significant at the 1% level, indicating that a more educated labor force may facilitate green technology adoption and improvements in production efficiency. The spatial spillover effect of human capital is also significantly negative, suggesting that skilled labor may reduce carbon emission intensity not only locally, but also in neighboring cities through knowledge spillovers, technology diffusion, and intercity economic linkages.
Government fiscal pressure and transportation resource allocation are also negatively associated with carbon emission intensity. Government fiscal pressure may encourage local governments to strengthen environmental regulation and adjust industrial structure. More balanced transportation resource allocation may reduce carbon emission intensity by improving network connectivity, shortening travel distances, increasing logistics efficiency, and lowering transport-related energy consumption. In contrast, Per Capita GDP, population density, and foreign trade dependence are not statistically significant, suggesting that economic development, population concentration, and openness do not have a significant direct association with carbon emission intensity in the Yangtze River Delta urban agglomeration.

4.2. Robustness Checks

To assess the robustness of the baseline regression results, this study conducts three robustness checks: replacing the core explanatory variable, replacing the dependent variable, and changing the spatial weight matrix. First, the core explanatory variable is replaced with the strength of equity network connections among SLCs. Specifically, based on equity linkage data among SLCs, this study constructs an intercity SLC network, assigns weights according to the ownership ratios between investors and investees, and calculates the weighted degree of each city node using social network analysis. This measure is used as an alternative indicator of SLC development in each city. Adopting a network association perspective, this study re-depicts the development level of microfinance, and subsequently examines the validity of the core explanatory variable selection as well as the reliability of the empirical results. Second, the dependent variable is replaced by carbon emissions Per Capita, measured as the ratio of carbon emissions to the resident population. Remove the confounding effects of economic scale disparities on the measurement of carbon emissions. Third, the spatial weight matrix is changed from the inverse-distance economic-geographic nested matrix to the inverse-distance economic-geographic matrix. To attenuate the interference of complex nested indicators in spatial association detection, the spatial weight setting is parsimoniously formulated, which safeguards the reliability of the spatial econometric estimates. The results are reported in Table 7. Across all three robustness checks, the coefficients of the core explanatory variable remain significantly positive, consistent with the baseline regression results. This indicates that the main conclusion, namely that SLC development is positively associated with regional carbon emission intensity and spatial spillover effects, is robust across alternative variable measurements and spatial weight matrices.

4.3. Mechanism Analysis

4.3.1. Mediation Analysis

As shown in Table 8, SLC development significantly increases the number of SMEs in general manufacturing. The number of these enterprises is also positively associated with carbon emission intensity. The bootstrap confidence interval for the indirect effect does not include zero, indicating that the expansion of general manufacturing is a significant transmission channel through which SLC development raises carbon emission intensity. Specifically, SLC development supports the expansion of general manufacturing enterprises, many of which are energy-intensive and technologically less advanced, thereby indirectly increasing regional carbon emission intensity. The mediating effect accounts for 77.78% of the total effect, suggesting that this channel plays a major role in the relationship between SLC development and regional carbon emission intensity, thus supporting Hypothesis 2.
The direct effect of SLC development on technological innovation is positive but not statistically significant, and the bootstrap confidence interval includes zero. This indicates that the mediating effect of technological innovation is not supported. Although SLCs may have some potential to support technological innovation, their role is constrained by institutional limitations, such as an excessive emphasis on collateral, insufficient attention to R&D, limited risk tolerance, and a lack of long-term capital. As a result, they have difficulty providing stable and effective support for corporate green technology R&D, and this mediation pathway does not generate the expected carbon-reducing effect, thus supporting Hypothesis 3.
A comparison of the two mediation pathways reveals the structural challenges facing SLCs in the Yangtze River Delta urban agglomeration. Under traditional path dependence, credit resources flow mainly into general manufacturing operations and production expansion rather than green technology R&D, process upgrading, and low-carbon transition. This creates an imbalance in which the carbon-increasing channel remains active, while the carbon-reducing channel remains constrained. Therefore, governments and financial regulators should guide SLCs toward better credit allocation, establish green lending screening mechanisms, and increase financial support for technology-based SMEs. These measures can help strengthen the technological innovation pathway and support the transition of the small loan sector from carbon-intensive expansion to green development.

4.3.2. Moderation Analysis

Table 9 reports the moderation analysis results. The coefficient of the interaction term between SLC development and local government commitment to green transition is −0.229 and is significant at the 1% level. This indicates that local government commitment to green transition weakens the positive relationship between SLC development and carbon emission intensity. This moderating effect may reflect the role of local governments in guiding SLC credit allocation. When local governments show stronger commitment to green transition, stricter environmental access standards, green credit subsidies, and pollution penalty mechanisms may encourage SLCs to adjust their lending structures. These measures can reduce lending to heavily polluting manufacturing sectors and weaken the carbon-increasing effect of SLC development.
The coefficient of the interaction term between digital inclusive finance and SLC development is 0.079 and is significant at the 1% level. This indicates that digital inclusive finance strengthens the positive relationship between SLC development and carbon emission intensity. Although digital inclusive finance lowers service barriers and expands the reach of SLCs, the sector still lacks a mature green lending screening mechanism. As a result, its technological and inclusive advantages may channel credit more efficiently to energy-intensive and technologically less advanced general manufacturing enterprises, thereby amplifying the carbon-increasing effect of SLC development. This finding suggests that governments and financial regulators should promote closer integration between digital inclusive finance and green finance. A digital green credit assessment framework should be established, and environmental performance should be incorporated into online credit review and risk assessment systems. These measures would help digital technologies identify and guide financing demand in green industries, shifting digital inclusive finance from carbon-intensive expansion toward low-carbon development, thus supporting Hypothesis 4.
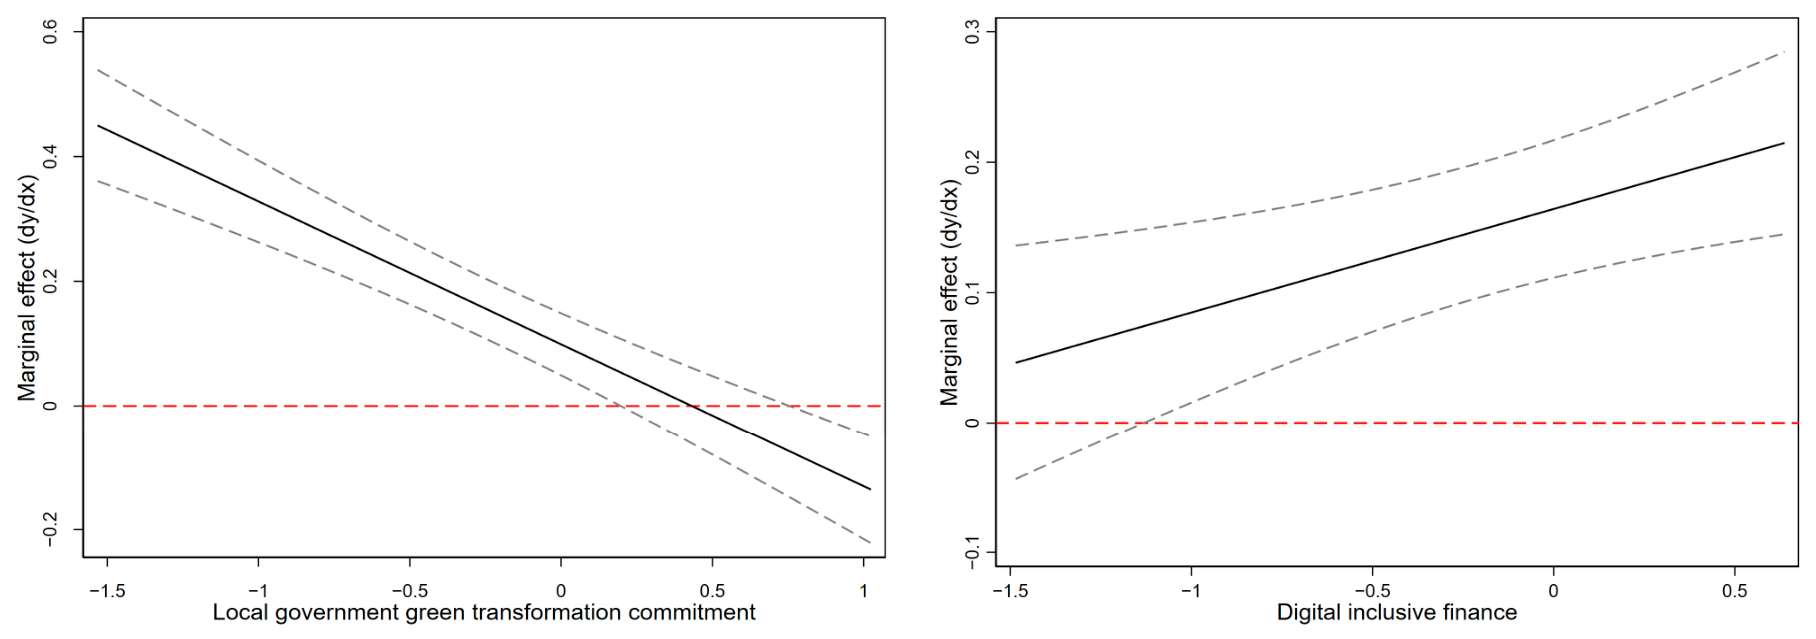
To visually evaluate the economic significance of interaction terms, marginal effect plots are displayed in Figure 2. The graph concerning government green transition willingness indicates that the marginal effect of SLCs on carbon emission intensity steadily declines with rising government willingness, verifying the negative moderating effect: greater governmental green commitment attenuates SLCs’ carbon-augmenting effect. Meanwhile, the plot of digital inclusive finance demonstrates that the marginal effect of SLCs on carbon emission intensity grows alongside its development level, suggesting positive moderation: advanced digital inclusive finance strengthens the emission-raising effect of SLCs.

4.4. Heterogeneity Analysis

4.4.1. Heterogeneity by Geographic Location

As shown in Table 10, the effect of SLC quantity on carbon emission intensity exhibits significant geographic heterogeneity. Rather than displaying a simple linear gradient, the effect assumes an inverted U-shaped pattern, peaking in medium-distance cities, which is consistent with Hypothesis 5. The coefficient of SLC development is 0.126 for distant cities and rises to 0.309 for medium-distance cities, while the effect is not statistically significant for nearby cities. This spatial heterogeneity reflects the combined influence of technology spillovers, industrial gradient transfer, and distance decay on the relationship between SLC credit allocation and regional carbon emission intensity.
Medium-distance cities show the strongest carbon-increasing effect of SLC development. This may be related to their position between core cities and more peripheral areas. Compared with nearby cities, medium-distance cities often have weaker transport accessibility, factor agglomeration, and innovation connectivity. At the same time, they may have relatively developed industrial infrastructure, lower environmental constraints, and lower input costs. These conditions make them more likely to receive energy-intensive and highly polluting manufacturing activities relocated from central cities during industrial upgrading. Against this background, SLC credit may further support the expansion of traditional small-scale manufacturing and reinforce the transfer of lower-end manufacturing capacity, thereby increasing carbon emission intensity. By contrast, nearby cities are more closely connected to the innovation networks and green governance systems of central cities. They are therefore better positioned to absorb green technology spillovers and higher-end industrial transfers, which may weaken the carbon-increasing effect of SLC development. This finding suggests that green finance interventions in the Yangtze River Delta urban agglomeration should pay particular attention to medium-distance cities. Policy measures could include stricter environmental access standards, green rating systems for SLCs, and stronger guidance for credit allocation toward clean production, so as to support coordinated low-carbon development across the region.

4.4.2. Heterogeneity by SLC Regulatory Intensity

Based on the regulatory intensity values of small loan companies across cities, this study divides the 27 sample cities into three equal groups to conduct further heterogeneity tests along the regulatory. As reported in Table 11, the carbon-augmenting effect of SLC development exhibits marked heterogeneity across regulatory regimes, intensifying monotonically as regulatory stringency declines. This inverse association between regulatory intensity and SLC credit allocation corroborates Hypothesis 5. In regions with stricter regulation, higher entry barriers, more standardized operations, and stronger risk management may constrain SLC lending and reduce excessive credit flows to polluting and energy-intensive industries. As a result, the carbon-increasing effect of SLC development is partly weakened. However, stronger regulation alone does not appear to shift SLC development from a carbon-increasing pathway to a carbon-reducing one. The current regulatory framework for SLCs still focuses mainly on compliance review and risk prevention, without fully incorporating environmental performance or carbon emission indicators into the evaluation system. Green-oriented regulatory tools are therefore still limited, which means that stronger regulation alone cannot fundamentally reverse the carbon-increasing tendency of SLC development. Future policy should therefore link improvements in SLC regulation with the broader green and low-carbon transition.

5. Discussion

The main finding is that SLC development is positively associated with carbon emission intensity. This extends the theoretical boundary on the context-dependent environmental effects of inclusive finance [96,97]. Existing literature diverges on the inclusive finance–carbon nexus, largely because it neglects organizational heterogeneity. As non-depository lenders, SLCs face a sharper trade-off between social mission and financial sustainability than traditional institutions. Profit-driven, they tend to channel credit toward high short-term return, collateral-rich sectors that often overlap with energy-intensive industries. These results confirm that the environmental effects of inclusive finance are characterized by significant context-dependency and organizational heterogeneity [15]: the carbon emission effects of inclusive financial institutions may vary across organizational types [98], stages of development [99], and institutional environments [100].
The mediation analysis shows that while microcredit is positively linked to regional technological innovation, the effect is statistically insignificant; thus, it fails to reduce carbon emission intensity through innovation, differing from findings on banks [98] and insurers [101]. From a functional perspective, financial intermediaries foster innovation through risk identification, long-term funding, and information production [102]. Yet microcredit providers face structural constraints: (1) credit rationing driven by high funding costs and short-term maturity structures incompatible with long-cycle innovation [103]; (2) information asymmetry arising from limited screening capacity, leading to collateral-based lending that systematically excludes innovators [104]; (3) clientele lock-in attributable to a target clientele of small firms and low-income groups that demonstrates scant inclination toward high-investment, long-cycle innovation activities [67]. Hence, microcredit affects the environment through direct resource allocation rather than indirect technological progress.
Government green commitment significantly mitigates the carbon-increasing effect of SLCs, which aligns with prior literature [105]. Stronger green willingness imposes legitimacy pressures via green credit guidelines, disclosure requirements, and regulatory constraints, compelling SLCs to internalize environmental costs in lending decisions.
The existing literature largely associates digital inclusive finance with lower carbon intensity via reduced information asymmetry [106,107]. However, this study shows that without a well-developed green credit mechanism, digital inclusive finance intensifies the carbon-augmenting effect of SLCs. Digital technologies lower customer acquisition and risk control costs, expanding credit coverage [108]; yet in the absence of green screening and carbon accounting, these efficiency gains are not directed toward green allocation but instead accelerate credit penetration into high-carbon sectors. When digital inclusive finance infrastructure remains underdeveloped, fintech’s efficiency dividend may be alienated into a carbon-augmenting driver.

6. Conclusions and Recommendations

6.1. Conclusions

The main findings are as follows.
(1)
SLC development is positively associated with local carbon emission intensity and has positive spatial spillover effects. The expansion of SLCs raises carbon emission intensity in both local and neighboring regions, and the results remain robust across a series of robustness checks.
(2)
SLC development increases carbon emission intensity mainly by promoting the expansion of SMEs in general manufacturing. However, due to constraints related to risk preferences, funding costs, and business models, SLCs do not provide effective support for regional technological innovation toward decarbonization.
(3)
Local government commitment to green transition weakens the carbon-increasing effect of SLC development. In the absence of well-developed green credit standards, digital inclusive finance expands the service reach of SLCs but also facilitates more high-carbon lending, thereby strengthening the positive relationship between SLC development and carbon emission intensity.
(4)
The carbon-increasing effect of SLC development varies by geographic location and regulatory intensity. Specifically, the effect is strongest in medium-distance cities, insignificant in nearby cities, and relatively weak in distant cities. Lower SLC regulatory intensity is associated with a stronger carbon-increasing effect.
The above conclusions provide empirical evidence for understanding the environmental externalities arising from the development of SLCs. Nevertheless, constrained by the scope of the sample, the generalizability of these findings requires further verification. Future research can conduct multi-regional comparative studies to systematically investigate the heterogeneous moderating effects of regional characteristics, including industrial structure, energy endowments and environmental governance capacity, on the formation of environmental externalities of financial development, so as to continuously expand and verify the boundary conditions of the conclusions of this paper.

6.2. Policy Implications

Three key insights emerge from the above results. First, to address the excessive flow of SLC credit into energy-intensive sectors and the weak role of technological innovation in carbon reduction, SLCs should establish differentiated green credit access mechanisms. Factors such as firms’ carbon emission intensity and environmental penalty records should be incorporated into credit assessment, and lending to heavily polluting traditional manufacturing industries should be gradually reduced. At the same time, SLCs should design medium- and long-term green credit products for technology-based micro and small enterprises. Such products could lower financing barriers and financing costs, strengthen SLCs’ support for client innovation, and create a clearer pathway through which technological innovation contributes to carbon emission reduction.
Second, the integration of digital inclusive finance and green finance should be strengthened to reverse the reinforcing effect of digital inclusive finance on the carbon-increasing effect of microloans. SLCs should make better use of local digital inclusive finance infrastructure, such as regional credit reporting platforms, and incorporate real-time data on firms’ electricity consumption, emissions, and environmental penalties into credit assessment. Regulators should also refine the evaluation system for digital inclusive finance by adding green-oriented indicators and promoting institutional coordination between digital inclusive finance and green finance. In this way, digital technologies can help guide SLC credit toward greener uses and support the regional low-carbon transition.
Third, the regulatory framework for SLCs should better reflect green transition requirements and regional differences. At present, SLCs are mainly regulated at the local level under a conventional framework that combines classification and rating, preferential support for well-performing institutions, and restrictions on underperforming ones. However, this framework has not yet fully incorporated green-oriented criteria or regional differentiation. A tiered and differentiated regulatory mechanism should therefore be established. SLCs could receive targeted incentives or constraints based on the share of green loans in their lending portfolios. Qualified institutions could receive policy preferences and moderate support in financing scale and business expansion. Institutions with excessive exposure to high-carbon lending or continued financing of energy-intensive industries should face stricter measures, such as more frequent regulatory inspections and special on-site audits.

6.3. Limitations

This study is not without limitations. First, the sample is limited to 27 prefecture-level cities in the Yangtze River Delta urban agglomeration, which may limit the generalizability of the findings. Second, most variables are measured using single indicators or macro-level indicators, which may affect measurement precision. Future research could expand the geographical scope of the sample, refine the measurement of key variables, and further examine how digital transformation in microfinance affects the relationship between inclusive finance and green, low-carbon development.

Author Contributions

Conceptualization, X.W., C.Z. and J.Z.; methodology, X.W., C.Z. and Y.L.; software, X.W. and Y.L.; validation, X.W., J.Z. and Q.Y.; formal analysis, X.W., Y.L. and Q.Y.; investigation, X.W. and J.Z.; resources, X.W., C.Z., Y.L. and Q.Y.; data curation, X.W., C.Z. and Y.L.; writing—original draft preparation, X.W., C.Z. and Y.L.; writing—review and editing, J.Z. and Q.Y.; supervision, J.Z.; project administration, X.W. and J.Z.; funding acquisition, J.Z. All authors have read and agreed to the published version of the manuscript.

Funding

This study was funded by the National Natural Science Foundation of China (grant number 42101163) and the Humanities and Social Sciences Research Project of the Ministry of Education of China (grant number. 25YJAZH252).

Institutional Review Board Statement

Not applicable.

Informed Consent Statement

Not applicable.

Data Availability Statement

Relevant data can be obtained from the corresponding author following reasonable requests.

Conflicts of Interest

The authors declare no conflicts of interest.

Abbreviations

A list of abbreviations utilized within the manuscript is provided as follows.
SLCSmall loan company
CICarbon emission intensity
FDGovernment fiscal pressure
ROADTransportation resource allocation
URBANUrbanization level
FTDForeign trade dependence
EDUHuman capital
PDPopulation density
PGDPPer capita GDP
DIFDigital inclusive finance
GTILocal government commitment to green transition
GLGeographic location
RISLC regulatory intensity
GMThe expansion of SMEs in general manufacturing
TECHTechnological innovation

References

  1. Xiong, L.; Cai, X.L. The impact of digital economy on the improvement of regional innovation ability: Empirical research based on the panel data of Yangtze River Delta. East China Econ. Manag. 2020, 34, 1–8. [Google Scholar]
  2. Tong, T.; Ortiz, J.; Wang, H. The pathway to the natural gas industry: Financial development, coal consumption, and carbon dioxide emissions in PR China. Sci. Prog. 2023, 106, 1. [Google Scholar] [CrossRef] [Scilit] [PubMed]
  3. Sun, G.L.; Wang, Y.; Li, Q.H. The influence of green credits on credit risks of commercial banks. J. Mod. Financ. 2017, 22, 31–40. [Google Scholar]
  4. Zhang, K.; Xiong, Z.Y.; Huang, X.J. Green bonds, carbon emission reduction effect and high-quality economic development. J. Financ. Econ. 2023, 49, 64–78. [Google Scholar]
  5. Qi, C.Y.; Yang, Y.T. Yunnan microfinance industry deeply cultivates inclusive finance to assist thousands of enterprises and households. Yunnan Fazhi. News 2025, 7, 14. [Google Scholar]
  6. Wang, C.A.; Wang, L.; Zhao, S.; Yang, C.; Albitar, K. The impact of Fintech on corporate carbon emissions: Towards green and sustainable development. Bus. Strategy Environ. 2024, 33, 5776–5796. [Google Scholar] [CrossRef] [Scilit]
  7. Wu, S.S. How Bank Credit Influence Carbon Emissions:Based on Growth Model and Evidence from China. J. Zhongnan Univ. Econ. Law 2018, 6, 22–32+43. [Google Scholar]
  8. Xing, L.X.; Wang, Y.J. Research on the path of carbon emissionsecuritization—Perspective of underlying assets and transaction structure. Reform Econ. Syst. 2022, 4, 137–143. [Google Scholar]
  9. Liu, D.; Wen, T. Institutional evolution, development status and dynamic trends of microfinance institutions in China. Fin. Trade Res. 2024, 35, 42–54. [Google Scholar]
  10. Halouani, N. Microfinance as a catalyst for sustainable development: A cross-national comparative study of the environmental and social impacts. Sustainability 2025, 17, 4286. [Google Scholar] [CrossRef] [Scilit]
  11. López-Penabad, M.C.; Maside-Sanfiz, J.M.; Agha, Y.; Iglesias-Casal, A. Microfinance institutions and corporate social responsibility: A scientometric study. Future Bus. J. 2024, 10, 90. [Google Scholar] [CrossRef] [Scilit]
  12. Liu, W.; Wang, W.; Yao, P.; Wang, A. The value chain carbon footprint of small and medium-sized enterprises: A systemic analysis of China’s manufacturing sector and its linkages. J. Ind. Ecol. 2026, 30, 697–710. [Google Scholar] [CrossRef] [Scilit]
  13. Mia, M.A.; Zhang, M.; Zhang, C.; Kim, Y. Are microfinance institutions in South-East Asia pursuing objectives of greening the environment? J. Asia Pac. Econ. 2018, 23, 229–245. [Google Scholar] [CrossRef] [Scilit]
  14. Dowla, A. Climate change and microfinance. Bus. Strategy Dev. 2018, 1, 78–87. [Google Scholar] [CrossRef] [Scilit]
  15. Hussain, S.; Akbar, M.; Gul, R.; Shahzad, S.J.H.; Naifar, N. Relationship between financial inclusion and carbon emissions: International evidence. Heliyon 2023, 9, e16472. [Google Scholar] [CrossRef] [Scilit] [PubMed]
  16. Zhou, F.; Sun, Z.; Lin, Y. Research on the impact mechanism and spillover effects of green finance empowering agricultural carbon emission reduction. Int. Rev. Econ. Financ. 2025, 103, 104594. [Google Scholar] [CrossRef] [Scilit]
  17. Oanh, T.T.K. Sustainable development: Driving force from the relationship between finance inclusion, green finance and green growth. Sustain. Dev. 2024, 32, 2811–2829. [Google Scholar]
  18. Sheng, C.X.; Xue, Z.H. Theoretical logic and breakthrough path of financial empowerment for future industrial development. Rural Financ. Res. 2026, 3, 3–13. [Google Scholar] [CrossRef] [Scilit]
  19. Pang, J.L.; Wang, W.; Yuan, C.C. Research on the energy structure optimization effect of green finance under the dual carbon target. Financ. Econ. Res. 2023, 38, 129–145. [Google Scholar]
  20. Liu, F.; Huang, P.; Tang, D. The carbon emission reduction effect of green finance development and its impact pathways. Financ. Econ. Res. 2022, 37, 144–158. [Google Scholar]
  21. Zheng, L.X.; Gao, C.Q.; Zheng, F.H. An investigation into the impact of green finance development on carbon emissions: A case study of the Yangtze River Delta region. East China Econ. Manag. 2024, 38, 41–51. [Google Scholar]
  22. Zhao, X.; Benkraiem, R.; Abedin, M.Z.; Zhou, S. The charm of green finance: Can green finance reduce corporate carbon emissions? Energy Econ. 2024, 134, 107574. [Google Scholar] [CrossRef] [Scilit]
  23. Zhang, R.H.; Zhou, Y.H. Green finance, carbon emission intensity and ESG performance: Empirical research based on micro data of listed enterprises. J. Soc. Sci. 2024, 3, 126–140. [Google Scholar]
  24. Yan, B.; Wang, F.; Liu, J.; Fan, W.; Chen, T.; Liu, S.; Ning, J.; Wu, C. How financial geo-density mitigates carbon emission intensity: Transmission mechanisms in spatial insights. J. Clean. Prod. 2022, 367, 133108. [Google Scholar] [CrossRef] [Scilit]
  25. Samreen, I.; Majeed, M.T. Spatial econometric model of the spillover effects of financial development on carbon emissions: A global analysis. Pak. J. Commer. Soc. Sci. 2020, 14, 569–602. [Google Scholar]
  26. Cong, X.; Wang, X.; Xie, Q. Nonlinearity, heterogeneity and indirect effects in the CO2 emissions-financial development relation from partial linear additive panel model. Pol. J. Environ. Stud. 2025, 34, 67–82. [Google Scholar]
  27. Yao, X.; Tang, X. Does financial structure affect CO2 emissions? Evidence from G20 countries. Financ. Res. Lett. 2021, 41, 101791. [Google Scholar] [CrossRef] [Scilit]
  28. Zhang, T.; Zhang, Y.; Zhang, Y. Green finance and urban carbon emission dual control: An empirical evidence from China. Front. Environ. Sci. 2025, 12, 1503735. [Google Scholar] [CrossRef] [Scilit]
  29. Bressan, S. Banks’ greenhouse gas emissions and equity value. SN Bus. Econ. 2025, 5, 1–25. [Google Scholar] [CrossRef] [Scilit]
  30. Levine, R. Financial development and economic growth: Views and agenda. J. Econ. Lit. 1997, 35, 688–726. [Google Scholar]
  31. Mi, Y.S.; Tan, Y. Efficiency of credit allocation in China: An empirical study based on panel data of regions and provinces. Theory Pract. Financ. Econ. 2007, 28, 31–37. [Google Scholar]
  32. King, R.G.; Levine, R. Finance and growth: Schumpeter might be right. Q. J. Econ. 1993, 108, 717–737. [Google Scholar] [CrossRef] [Scilit]
  33. Ramlall, I. The financial footprint: How banking activities in the world shape carbon emissions? Meas. Bus. Excell. 2025, 29, 761–776. [Google Scholar] [CrossRef] [Scilit]
  34. Lojanica, N.; Stancic, V.; Gricar, S. Insurance, environment, and growth: A panel study across European countries. J. Risk Financ. Manag. 2025, 18, 703. [Google Scholar] [CrossRef] [Scilit]
  35. Stiglitz, J.E.; Weiss, A. Credit rationing in markets with imperfect information. Am. Econ. Rev. 1981, 71, 393–410. [Google Scholar]
  36. Leyshon, A.; Thrift, N. The restructuring of the UK financial services industry in the 1990s: A reversal of fortune? J. Rural Stud. 1993, 9, 223–241. [Google Scholar] [CrossRef] [Scilit]
  37. Leyshon, A.; Thrift, N. Access to financial services and financial infrastructure withdrawal: Problems and policies. Area 1994, 26, 268–275. [Google Scholar]
  38. Atahau, A.D.R.; Sakti, I.M.; Huruta, A.D.; Kim, M.S. Gender and renewable energy integration: The mediating role of green-microfinance. J. Clean. Prod. 2021, 318, 128536. [Google Scholar] [CrossRef] [Scilit]
  39. Hogarth, J.R. Promoting diffusion of solar lanterns through microfinance and carbon finance: A case study of FINCA-Uganda’s solar loan programme. Energy Sustain. Dev. 2012, 16, 430–438. [Google Scholar] [CrossRef] [Scilit]
  40. Hermes, N.; Lensink, R. The empirics of microfinance: What do we know? Econ. J. 2007, 117, F1–F10. [Google Scholar] [CrossRef] [Scilit]
  41. Ashraf, D.; Rizwan, M.S.; L’Huillier, B. Environmental, social, and governance integration: The case of microfinance institutions. Account. Financ. 2022, 62, 837–891. [Google Scholar]
  42. Cohen, B.J. The new geography of money. In Nation-States and Money; Routledge: London, UK, 1999; pp. 121–138. [Google Scholar]
  43. Pike, A.; Pollard, J. Economic geographies of financialization. Econ. Geogr. 2010, 86, 29–51. [Google Scholar]
  44. Knox-Hayes, J.; Wójcik, D. The Routledge Handbook of Financial Geography; Routledge: New York, NY, USA, 2020. [Google Scholar]
  45. Kumar, M.; Dhaundiyal, P. Micro-finance institutions and women’s entrepreneurship in India. In Microfinance, Financial Innovation, and Sustainable Entrepreneurship in Economics; IGI Global Scientific Publishing: Hershey, PA, USA, 2025; pp. 23–56. [Google Scholar]
  46. Tria, D.; Harun, M.; Alam, M. Microcredit as a strategy for employment creation: A systematic review of literature. Cogent. Econ. Financ. 2022, 10, 2060552. [Google Scholar] [CrossRef] [Scilit]
  47. Banerjee, A.; Breza, E.; Duflo, E.; Kinnan, C. Can Microfinance Unlock a Poverty Trap for Some Entrepreneurs? National Bureau of Economic Research: Cambridge, MA, USA, 2019. [Google Scholar]
  48. Yunus, M. A World of Three Zeros: The New Economics of Zero Poverty, Zero Unemployment, and Zero Net Carbon Emissions; Hachette: London, UK, 2017. [Google Scholar]
  49. Shahidullah, A.K.M.; Haque, C.E. Green microfinance strategy for entrepreneurial transformation: Validating a pattern towards sustainability. Enterp. Dev. Microfinanc. 2015, 26, 325–342. [Google Scholar] [CrossRef] [Scilit]
  50. Elahi, E.; Khalid, Z.; Zhang, Z. Understanding farmers’ intention and willingness to install renewable energy technology: A solution to reduce the environmental emissions of agriculture. Appl. Energy 2022, 309, 118459. [Google Scholar] [CrossRef] [Scilit]
  51. Archer, G.R.; Jones-Christensen, L. Entrepreneurial value creation through green microfinance: Evidence from Asian microfinance lending criteria. Asian. Bus. Manag. 2011, 10, 331–356. [Google Scholar] [CrossRef] [Scilit]
  52. Ahamad, S.; Ahmed, S.U.; Islam, M.A.; Yusof, M.F.B.; Ali, M.H.; Mostafiz, M.I.; Joarder, M.H.R. Environmental, social, and governance practices and microfinance institutions sustainability: A global study. Sustain. Dev. 2026, 34, 80–94. [Google Scholar]
  53. Du, X.S.; Nie, Q.; Zhang, J. Experience and problems in the development of microloan companies in Jiangsu. Rural Financ. Res. 2010, 31–39. [Google Scholar] [CrossRef]
  54. Xing, D.J.; Ye, Y.G. Do rural microloan companies alleviate formal credit constraints for rural SMEs? A survey study based on five cities in northern Jiangsu. Issues Agric. Econ. 2011, 32, 61–69. [Google Scholar]
  55. Kumar, S.; Raut, R.D.; Aktas, E.; Narkhede, B.E.; Gedam, V.V. Barriers to adoption of industry 4.0 and sustainability: A case study with SMEs. Int. J. Comput. Integr. Manuf. 2023, 36, 657–677. [Google Scholar]
  56. Wang, J.; Wang, J.; Wang, Y.W. How does digital finance development affect manufacturing carbon intensity? Chin. Popul. Resour. Environ. 2022, 32, 1–11. [Google Scholar] [CrossRef] [Scilit]
  57. Ayoungman, F.Z.; Islam, M.S.; Chishti, M.Z.; Zhang, F.L. Toward achieving sustainable development goal 13 in developing countries: Microcredit to environmental degradation. Sustain. Dev. 2026. [Google Scholar] [CrossRef] [Scilit]
  58. Manaresi, F.; Pierri, N. The asymmetric effect of credit supply on firm-level productivity growth. J. Money Credit Bank. 2024, 56, 677–704. [Google Scholar] [CrossRef] [Scilit]
  59. Mian, A.; Sufi, A.; Verner, E. How does credit supply expansion affect the real economy? The productive capacity and household demand channels. J. Financ. 2020, 75, 949–994. [Google Scholar] [CrossRef] [Scilit]
  60. Sun, X.M.; Chen, J.L. Research on the impact of intelligent manufacturing on enterprise carbon emissions. J. Ind. Technol. Econ. 2026, 45, 3–13. [Google Scholar]
  61. Liu, S.; He, N.; Cao, X.; Li, G.; Jian, M. Logistics cluster and its future development: A comprehensive research review. Transp. Res. Part E Logist. Transp. Rev. 2022, 168, 102974. [Google Scholar] [CrossRef] [Scilit]
  62. Wang, D.; Hua, X.; Ding, C.J.; Ahmed, A.D.; Liu, Y. Intelligent manufacturing, industrial agglomeration, and green and low-carbon development: A nonlinear path test based on the theory of ecological modernization. Bus. Strategy Environ. 2026. [Google Scholar] [CrossRef] [Scilit]
  63. Zhang, J.; Lu, Z.; Zheng, W.P.; Chen, Z.Y. Financing constraints, financing channels and enterprise R&D investment. J. World Econ. 2012, 35, 66–90. [Google Scholar]
  64. Cheng, Y.; Zhang, Y.; Wang, J.J. Research on spatiotemporal evolution of carbon emission performance and technological innovation-driven in Chinese provinces. Sci. Geogr. Sin. 2023, 43, 313–323. [Google Scholar]
  65. Li, X.P. Risks and Countermeasures of "loan-only and no-deposit" small-loan companies. Contemp. Econ. 2009, 4, 26–27. [Google Scholar]
  66. Xu, Y.Q.; Yang, L.J.; Zhou, J.S. Current operation status and problems of microloan companies. Rural Econ. 2010, 70–74. [Google Scholar] [CrossRef]
  67. Hu, C.H. Credit risk and its control of microloan companies: Investigation and reflection based on the Pingyao model. Theor. Explor. 2008, 1, 85–87. [Google Scholar]
  68. Shao, S.; Hu, Z.; Cao, J.; Yang, L.; Guan, D. Environmental regulation and enterprise innovation: A review. Bus. Strategy. Environ. 2020, 29, 1465–1478. [Google Scholar] [CrossRef] [Scilit]
  69. Yang, J.; Guo, H.; Liu, B.; Shi, R.; Zhang, B.; Ye, W. Environmental regulation and the pollution haven hypothesis: Do environmental regulation measures matter? J. Clean. Prod. 2018, 202, 993–1000. [Google Scholar] [CrossRef] [Scilit]
  70. Allet, M.; Hudon, M. Green microfinance: Characteristics of microfinance institutions involved in environmental management. J. Bus. Ethics 2015, 126, 395–414. [Google Scholar] [CrossRef] [Scilit]
  71. Rahman, M.W.; Luo, J. Regulation of microfinance service provider in China and Bangladesh: An approach to strengthening the regulatory environment. Afr. J. Bus. Manag. 2012, 6, 1019–1033. [Google Scholar] [CrossRef] [Scilit]
  72. Jaffe, A.B.; Palmer, K. Environmental regulation and innovation: A panel data study. Rev. Econ. Stat. 1997, 79, 610–619. [Google Scholar] [CrossRef] [Scilit]
  73. Chen, Y.L. How environmental regulation affects the financing of heavily polluting enterprises: Evidence from the implementation of the new environmental protection law. J. China Econ. 2023, 4, 157–188+357–359. [Google Scholar]
  74. Guo, F. Measuring China’s digital financial inclusion: Index compilation and spatial characteristics. China Econ. Q. 2020, 19, 1401–1418. [Google Scholar]
  75. Miao, L.J.; Chen, J.; Fan, T.Z.; Lü, Y.Q. The impact of digital economy development on carbon emission: A panel data analysis of 278 prefecture-level cities. South China Financ. 2022, 45–57. [Google Scholar]
  76. Sun, H.P.; Hu, S.Y.; Guo, Z.Q. Research on the impact effect of digital inclusive finance on carbon emissions: Empirical test based on RCEP countries. Coal Econ. Res. 2023, 43, 26–36. [Google Scholar]
  77. Williamson, J.G. Regional inequality and the process of national development: A description of the patterns. Econ. Dev. Cult. Chang. 1965, 13, 1–84. [Google Scholar] [CrossRef] [Scilit] [PubMed]
  78. Hansen, N.M. Unbalanced growth and regional development. Econ. Inq. 1965, 4, 3. [Google Scholar] [CrossRef] [Scilit]
  79. Wan, J.; Li, C.; Yang, Z.; Wu, L.; Yue, M. Dynamic spatial spillover effects of financial agglomeration on CO2 emissions: The case of China. Hum. Soc. Sci. Commun. 2025, 12, 178. [Google Scholar] [CrossRef] [Scilit]
  80. Chen, S.; Zeng, S.; Lai, Y.; Bai, Y. Does financial agglomeration contribute to the coordination of pollution and carbon reduction? Test analysis based on the threshold model and spatial Durbin model. Front. Environ. Sci. 2025, 13, 1704922. [Google Scholar] [CrossRef] [Scilit]
  81. Hao, Z.; Zhao, Z.; Pan, Z.; Tang, D.; Zhao, M.; Zhang, H. Spatial effects of financial agglomeration and green technological innovation on carbon emissions. Sustainability 2025, 17, 2746. [Google Scholar] [CrossRef] [Scilit]
  82. Jin, G.; Wang, G.; Li, W.; Sheng, H.; Hu, C.; Zhao, Y. The impact of environmental regulation on carbon emissions and its mechanisms in Chinese cities. Sci. Rep. 2025, 15, 41665. [Google Scholar] [CrossRef] [Scilit] [PubMed]
  83. Shao, S.; Li, X.; Cao, J.H. Economic policy choices for haze pollution control in China: From the perspective of spatial spillover effects. Econ. Res. J. 2016, 51, 73–88. [Google Scholar]
  84. Huang, L.J.L.; Wang, X.Q.; Sheng, Y.W.; Zhao, J.L. Impact of Venture Capital on Urban Carbon Emissions: Evidence from the Yangtze River Delta Urban Agglomeration in China. Sustainability 2025, 17, 546. [Google Scholar] [CrossRef] [Scilit]
  85. Grossman, G.M.; Krueger, A.B. Economic growth and the environment. Q. J. Econ. 1995, 110, 353–377. [Google Scholar] [CrossRef] [Scilit]
  86. Zhang, K.Z.; Wang, J.; Cui, X.Y. Fiscal decentralization and environmental pollution: From the perspective of carbon emissions. China Ind. Econ. 2011, 10, 65–75. [Google Scholar] [CrossRef]
  87. Krugman, P. Increasing returns and economic geography. J. Polit. Econ. 1991, 99, 483–499. [Google Scholar] [CrossRef] [Scilit] [PubMed]
  88. Parikh, J.; Shukla, V. Urbanization, energy use and greenhouse effects in economic development: Results from a cross-national study of developing countries. Glob. Environ. Change 1995, 5, 87–103. [Google Scholar]
  89. Copeland, B.R.; Taylor, M.S. Trade, growth, and the environment. J. Econ. Lit. 2004, 42, 7–71. [Google Scholar] [CrossRef] [Scilit]
  90. Romer, P.M. Endogenous technological change. J. Polit. Econ. 1990, 98, S71–S102. [Google Scholar] [CrossRef] [Scilit] [PubMed]
  91. Glaeser, E.L.; Kahn, M.E. The greenness of cities: Carbon dioxide emissions and urban development. J. Urban Econ. 2010, 67, 404–418. [Google Scholar] [CrossRef] [Scilit]
  92. Zhang, Y.; Cui, Q.Y.; Lu, K.J. Comparative study on economic radiation of small and micro manufacturing in three major economic circles: From the perspective of modified gravity model. Mod. Manag. 2022, 42, 8–14. [Google Scholar]
  93. Shi, C.F.; Yu, Y.; Yao, X. Simulation study on carbon peaking path of Yangtze River Delta urban agglomeration. Acta Geogr. Sin. 2024, 79, 2895–2914. [Google Scholar]
  94. Matloob, A.; Sarif, M.O.; Um, J.S. Exploring correlation between OCO-2 XCO2 and DMSP/OLS nightlight imagery signature in four selected locations in India. Spat. Inf. Res. 2021, 29, 123–135. [Google Scholar] [CrossRef] [Scilit]
  95. Zhang, B.; Wan, K. The effect of energy rights trading pilot policies on urban carbon emissions: Empirical analysis based on PSM-DID. Sustainability 2024, 16, 8357. [Google Scholar] [CrossRef] [Scilit]
  96. Li, J.J. A study on the Impact of Financial Development on the Peak of Agricultural Carbon Emissions—Taking Henan Province as an Example. Master’s Thesis, Henan University, Kaifeng, China, 2019. [Google Scholar]
  97. Xu, S.C.; Wu, C.; Huang, Y.Z.; Bi, S.K.; Zhang, Y. Study on the Impact of Agricultural Insurance on Agricultural Carbon Emissions in Shandong Province. J. Qingdao Agric. Univ. 2025, 37, 28–34. [Google Scholar]
  98. Hordofa, D.F. Examining the dynamics between banking sector performance, environmental sustainability, and environmental technology innovation: Evidence from G20 countries. Cogent Bus. Manag. 2024, 11, 2368709. [Google Scholar] [CrossRef] [Scilit]
  99. Chen, X.; Xue, Y.L. Can inclusive finance development reduce carbon emissions in China?—A time series analysis based on LMDI decomposition method. Res. Financ. Econ. Issues 2021, 5, 59–66. [Google Scholar]
  100. Kim, D.H.; Wu, Y.C.; Lin, S.C. Carbon dioxide emissions, financial development and political institutions. Econ. Change Restruct. 2022, 55, 837–874. [Google Scholar] [CrossRef] [Scilit]
  101. Stechemesser, K.; Endrikat, J.; Grasshoff, N.; Guenther, E. Insurance companies’ responses to climate change: Adaptation, dynamic capabilities and competitive advantage. Geneva Pap. Risk Insur.-Issues Pract. 2015, 40, 557–584. [Google Scholar] [CrossRef] [Scilit]
  102. Xie, W.M.; Fang, H.X. Financial development, financing constraints and enterprise R&D investment. J. Financ. Res. 2011, 5, 171–183. [Google Scholar]
  103. Xing, Z.Z. Research on sustainable development of microloan companies. Shanghai Financ. 2009, 5–11. [Google Scholar]
  104. Yang, F.L.; Huang, Y.H. Corporate governance structure, information asymmetry and SME financing. J. Financ. Res. 2006, 159–166. [Google Scholar]
  105. Yue, L.; Yan, H.; Han, L. The carbon emission reduction effect of two-way foreign investment from the perspective of government environmental attention. Environ. Dev. Sustain. 2024, 1–26. [Google Scholar] [CrossRef] [Scilit]
  106. Lu, Y.; Xia, Z. Digital inclusive finance, green technological innovation, and carbon emissions from a spatial perspective. Sci. Rep. 2024, 14, 8454. [Google Scholar] [CrossRef] [Scilit] [PubMed]
  107. Wang, Y.; Zhao, Z.; Zhang, S.; Su, Y. Research on the impact of digital inclusive finance on regional carbon emissions: Based on the sustainable green innovation of small and medium-sized enterprises. J. Clean. Prod. 2023, 428, 139513. [Google Scholar] [CrossRef] [Scilit]
  108. Wan, J.Y.; Zhou, Q.; Xiao, Y. Digital finance, financing constraints and enterprise innovation. Econ. Rev. 2020, 71–83. [Google Scholar] [CrossRef]
Figure 1. Overview of the study area.
Sustainability 18 08307 g001
Figure 2. Marginal effects of SLCs on carbon emission intensity. Note: The black solid line denotes the marginal effect curve; gray dashed lines represent the 95% confidence intervals; the red dashed line indicates the zero-effect reference line.
Sustainability 18 08307 g002
Table 1. Descriptive statistics for the main variables.
VariableObservationsMeanStandard
Deviation
MinMax
CI3510.8910.3300.3122.184
SLC35138.15725.2632125
PGDP35189,884.18837,240.16517,653.538198,254.125
FP3511.4770.5230.5553.411
ROAD35116.4644.1465.01123.353
URBAN3510.6630.1060.3680.896
FTD3510.5340.5780.0155.249
PD351686.649381.022190.4992371.866
EDU35116.12620.8570.49997.270
SMEs3511552.2591441.11745.0008498
TECH3513277.4225251.122236,798
DIFI351209.82886.83242.340361.066
GTI3510.02890.0130.0060.073
RI3510.1880.17000.600
GL3510.84260.61702.508
Table 2. Results of the unit root and multicollinearity tests.
Variable(1)(2)(3)(4)(5)
LLCp-ValueIPSp-ValueVIF
CI−4.9140.000−1.3980.000
SLC−30.9790.000−7.0420.0812.240
PGDP−15.8180.000−2.7750.0035.720
FP−7.2890.000−3.8160.0001.870
ROAD−6.1010.000−3.0880.0013.760
URBAN−18.5660.000−4.0780.0008.100
FTD−11.9450.000−7.5120.0002.760
EDU−6.2720.000−0.4410.6703.840
PD−34.2810.000−3.8580.0002.220
Table 3. Global Moran’s I for carbon emission intensity.
CIMoran’s Ip-Value
2010−0.2070.000
2011−0.1890.000
2012−0.1980.000
2013−0.2100.000
2014−0.2330.000
2015−0.2390.000
2016−0.2260.000
2017−0.2450.000
2018−0.2120.000
2019−0.2140.000
2020−0.2090.000
2021−0.2160.000
2022−0.2090.000
Table 4. The results of spatial panel model specification tests.
TestStatisticp-Value
LM-error58.009 ***0.000
R-LM-error23.815 ***0.000
LM-lag73.024 ***0.000
R-LM-lag38.830 ***0.000
LR-SDM/SAR58.06 ***0.000
LR-SDM/SEM40.91 ***0.000
Wald-SDM/SAR56.38 ***0.000
Wald-SDM/SEM100.60 ***0.000
Hausman202.75 ***0.000
LR test for individual effects 101.45 ***0.000
LR test for time effects 796.02 ***0.000
Note: *** indicate significance at the 1% levels.
Table 5. Comparison of spatial panel model specifications.
SDMSARSEM
BothTimeTimeTime
SLC0.012
(0.020)
0.149 ***
(0.027)
0.129 ***
(0.023)
0.135 ***
(0.023)
ControlsYESYESYESYES
City-fixed effectYESNONONO
Time-fixed effectYESYESYESYES
R20.4920.3270.3520.610
Observations351351351351
Note: *** indicate significance at the 1% levels; data in parentheses are robust standard errors.
Table 6. Baseline regressions results.
CI(1)(2)(3)(4)(5)(6)(7)
MainWxSpatialVarianceDirectIndirectTotal
SLC0.149 ***
(0.027)
1.351 **
(0.561)
0.142 ***
(0.033)
1.259 *
(0.669)
1.401 **
(0.690)
PGDP0.083
(0.075)
1.679
(1.117)
0.072
(0.083)
1.598
(1.473)
1.670
(1.507)
FP−0.078 *
(0.042)
−0.386
(1.035)
−0.073 *
(0.040)
−0.377
(1.029)
−0.450
(1.041)
EDU0.009
(0.033)
0.702
(0.486)
0.004
(0.035)
0.656
(0.538)
0.660
(0.550)
ROAD−0.146 *
(0.079)
0.252
(0.742)
−0.143 *
(0.076)
0.308
(0.721)
0.165
(0.745)
FTD−0.014
(0.017)
0.553
(0.354)
−0.017
(0.019)
0.520
(0.342)
0.503
(0.348)
PD−0.139 ***
(0.019)
−1.280 **
(0.539)
−0.131 ***
(0.025)
−1.179 *
(0.602)
−1.310 **
(0.616)
URBAN−0.717 ***
(0.166)
−6.066
(3.813)
−0.689 ***
(0.208)
−5.825
(5.049)
−6.514
(5.181)
rho −0.193
(0.264)
sigma2_e 0.024 ***
(0.002)
Time-fixed effectYESYESYESYESYESYESYES
R20.0220.0220.0220.0220.0220.0220.022
Observations351351351351351351351
Note: ***, **, and * indicate significance at the 1%, 5%, and 10% levels, respectively; data in parentheses are robust standard errors.
Table 7. Robustness check results.
CI(1)(2)(3)
SLC 0.149 ***
(0.027)
0.088 ***
(0.024)
SLCNLI0.103 ***
(0.018)
ControlsYESYESYES
Time-fixed effectYESYESYES
R20.1360.1440.677
Observations351351351
Note: *** indicate significance at the 1% levels; data in parentheses are robust standard errors.
Table 8. Mediation analysis results.
(1)(2)(3)(4)
GMCITECHCI
SLC0.931 ***
(0.085)
0.135 ***
(0.024)
0.070
(0.047)
0.135 ***
(0.024)
GM 0.113 ***
(0.014)
TECH −0.131 ***
(0.027)
ControlsYESYESYESYES
Time-fixed effectYESYESYESYES
R20.8010.8010.6690.580
Observations351351351351
Bootstrap Confidence Interval(0.072, 0140) (−0.020, 0.001)
Mediated Ratio0.778 0.355
Note: *** indicate significance at the 1% levels; data in parentheses are robust standard errors.
Table 9. Moderation analysis results.
CI
(1)(2)
SLC0.099 ***
(0.025)
0.164 ***
(0.027)
GTI−0.012
(0.022)
SLC*GTI−0.229 ***
(0.029)
DIF 0.192
(0.179)
SLC × DIF 0.079 ***
(0.029)
ControlsYESYES
Time fixed effectYESYES
rho−0.171
(0.262)
−0.208
(0.265)
sigma2_e0.024 ***
(0.002)
0.020 ***
(0.002)
R20.2720.536
Observations351351
Note: *** indicate significance at the 1% levels; data in parentheses are robust standard errors.
Table 10. Heterogeneity analysis by geographic location.
Short-Distance
Cities
Medium-Distance
Cities
Long-Distance Cities
SLC0.012
(0.032)
0.309 ***
(0.045)
0.126 ***
(0.029)
ControlsYESYESYES
Time-fixed effectYESYESYES
rho−0.301
(0.236)
−0.257
(0.254)
−0.250
(0.237)
sigma2_e0.005 ***
(0.001)
0.007 ***
(0.001)
0.004 ***
(0.000)
R20.6300.1450.183
Observations117117117
Note: *** indicate significance at the 1% levels; data in parentheses are robust standard errors.
Table 11. Heterogeneity analysis by SLC regulatory intensity.
HighMediumLow
SLC0.071 ***
(0.018)
0.113 **
(0.049)
0.246 ***
(0.036)
ControlsYESYESYES
Time-fixed effectYESYESYES
rho−0.055
(0.246)
−0.214
(0.234)
−0.138
(0.253)
sigma2_e0.002 ***
(0.000)
0.004 ***
(0.000)
0.005 ***
(0.001)
R20.0000.7530.799
Observations117117117
Note: *** and ** indicate significance at the 1% and 5% levels; data in parentheses are robust standard errors.
Disclaimer/Publisher’s Note: The statements, opinions and data contained in all publications are solely those of the individual author(s) and contributor(s) and not of MDPI and/or the editor(s). MDPI and/or the editor(s) disclaim responsibility for any injury to people or property resulting from any ideas, methods, instructions or products referred to in the content.