1. Introduction
Owing to their unique optical, magnetic, and electrical properties, rare earth elements are widely used in high-tech fields such as new energy, aerospace, medicine, and defense, and are hailed as the “vitamins of industry” and the “mother of new materials” [
1,
2,
3]. As a new round of technological revolution and industrial transformation progresses, global demand for rare earths continues to rise. It is projected that by 2030, the market will face a supply shortfall of approximately 47,000 tonnes [
4]. However, the distribution of rare earth resources is highly uneven; China, with 37% of global reserves, accounts for over 90% of the world’s rare earth supply. Long-term over-exploitation has not only led to the accelerated depletion of rare earth resources but has also triggered severe ecological and environmental issues.
Due to the highly concentrated distribution of resources, the global rare earth industry has long exhibited characteristics of oligopoly. Following multiple rounds of consolidation, China has formed a market structure dominated by two major state-owned enterprises—Northern Rare Earth and China Rare Earth Group—with Xiamen Tungsten participating as a key player. Whilst this structure enables economies of scale, it also leads to issues such as the concentration of profits among leading firms, a lack of innovation incentives, and constraints on the development of small- and medium-sized enterprises. Under oligopolistic control, rare earth prices fail to accurately reflect supply and demand dynamics. When demand is strong, firms can raise prices to secure excess profits; when demand is weak, they may restrict production to maintain prices. This pricing mechanism distorts market signals, increases operational risks for downstream enterprises, and discourages investment in resource conservation and technological innovation. It should be noted that rare earth elements differ substantially in their applications, market prices, supply risks, recycling potentials, and substitutability. This study focuses specifically on rare earth permanent magnet materials (primarily Nd–Pr-based) as a representative product category, and the findings should be interpreted within this defined scope rather than generalized to the entire rare earth sector without qualification.
Driven by both supply constraints and environmental pressures, the recycling and reuse of rare earths are receiving increasing attention [
5,
6]. Research indicates that rare earth recycling has the potential to meet up to 23% of market demand, serving as a vital supplementary channel for rare earth supply. In the context of rare earth permanent magnet materials—the focus of this study—recyclable secondary resources primarily include end-of-life permanent magnets from discarded motors, generators, and electronic devices, as well as production scrap generated during magnet manufacturing processes. It is worth noting that the broader rare earth recycling landscape also encompasses other secondary sources, such as phosphors from lighting waste, nickel-metal hydride batteries, petroleum refining catalysts, and emerging unconventional resources including phosphogypsum and phosphate-processing residues. While these alternative sources are increasingly discussed as potential secondary supply options, they involve distinct material characteristics, recovery technologies, and market structures, and are, therefore, beyond the scope of this study. For countries lacking primary rare earth resources, recycling is an essential means of ensuring supply chain security. Against this backdrop, the role of independent recyclers is undergoing a profound transformation; they are not only able to sell recycled rare earth materials to rare earth conglomerates but also possess independent remanufacturing capabilities, enabling them to bring recycled rare earth products to market and compete directly in the marketplace. This creates a dual decision-making structure that is distinct from conventional closed-loop supply chain models, wherein recyclers typically serve as passive collectors who sell all recovered materials upstream without facing strategic trade-offs. In our setting, recyclers simultaneously allocate recovered rare earths between external sales and internal remanufacturing, a resource allocation friction that transforms them from mere “suppliers” into both “suppliers” and “competitors”—fundamentally altering the strategic interactions and competitive dynamics within the supply chain.
Given the importance of rare earth resources and the potential of recycling, government policies play a pivotal role in guiding the development of the circular economy. Subsidy policies can directly incentivize recyclers to expand operations, reduce costs, and enhance the economic viability of recycling. Environmental tax policies, by contrast, impose cost constraints on primary mining, encouraging rare earth groups to increase procurement of secondary resources and thereby driving the supply chain toward a green and circular transformation. However, there are marked differences in the mechanisms and outcomes of these two policy instruments. A single policy struggles to balance multiple objectives—such as resource security, environmental protection, and industrial development—and may even produce distorting effects. Therefore, gaining a thorough understanding of the differentiated impacts of subsidy and environmental tax policies on the rare earth supply chain and providing scientific decision-making references for policymakers holds significant theoretical and practical importance. To address the above issues, this study constructs a two-level supply chain game model comprising a rare earth group (the Stackelberg leader) and two recyclers (Cournot followers), with the aim of revealing the complex market relationships arising from the coexistence of vertical coordination and horizontal competition. Unlike previous studies on closed-loop supply chains, which have focused on environmental benefits, this study concentrates on the market-structure effects and strategic interaction mechanisms triggered by the reverse supply of rare earths. Specifically, the model incorporates both the recyclers’ pricing decisions for recovered materials and their production decisions for remanufactured products. By employing reverse induction to solve for the game equilibrium, it reveals the strategic trade-off mechanism faced by recyclers between “selling recovered rare earths to the group” and “independent remanufacturing”. Furthermore, the model simultaneously incorporates two policy instruments—government subsidies and environmental taxes—and utilizes numerical simulation methods to systematically compare their differential impacts on key indicators such as new product output, remanufactured output, scrap recovery volume, primary mining volume, market share, corporate profits, and recycling rates. This is expected to address the shortcomings of existing research, which lacks a systematic analysis of the interplay between recyclers’ dual decision-making mechanisms and the differentiated effects of policy under a rare earth oligopolistic market structure. It will provide a theoretical basis for governments to select and optimize policy combinations between subsidies and environmental taxes, whilst also offering a reference for strategic decision-making by downstream enterprises in the rare earth industry chain within an oligopolistic competitive environment.
2. The Literature Review
2.1. Research on the Oligopolistic Structure of the Rare Earth Market and Supply Chain Risks
Due to their irreplaceable role in high-tech and green energy technologies, rare earths have become the focal point of global competition for critical mineral resources [
7]. Existing research generally agrees that the global rare earth market exhibits characteristics of a typical oligopolistic structure. This stems from the highly uneven distribution of rare earth resources, as outlined in the research by Bagdonas (2026) [
8]—on the occurrence of rare earths in coal resources in the Powder River Basin in the United States—and by Oyebamiji (2026) [
9]—on the distribution and sources of rare earths in Nigerian soil profiles—both of which reveal the geographical limitations of rare earth supply from a resource perspective. Furthermore, China occupies a dominant position in the global rare earth industry chain, and its industrial policies and market behavior profoundly influence the global supply landscape [
10].
In this oligopolistic market, scholars have extensively employed complex network methods to examine the risks and evolution of rare earth supply from the perspective of trade patterns. Han et al. (2025) used a global simulation model to reveal the dynamic differentiation trends in rare earth trade networks [
11]; meanwhile, Peng and Guo (2025) analyzed the propagation mechanisms of supply risks within multi-tiered trade networks from an industrial chain perspective [
12]. Furthermore, as the global energy transition accelerates, the pull effect on rare earth demand driven by investment in renewable energy [
13] and the development of clean technologies [
14] is reshaping both trade patterns and industrial security dynamics. Some scholars have also focused on China’s rising status within the global rare earth value chain [
15] and on how to ensure the security and stability of the domestic industry and supply chains [
16,
17].
The above studies provide a profound depiction of the external environment in which the rare earth industry is characterized by both “oligopoly” and “high risk”, laying a solid empirical foundation for incorporating this unique market structure into supply chain analysis. However, most of these studies remain confined to the macro level of trade patterns and the geographical distribution of resources, and have not yet internalized the oligopolistic market structure of the rare earth sector into micro-level supply chain game models; in particular, there is a lack of formal modeling of the vertical game-theoretic relationships between rare earth conglomerates and downstream recycling enterprises.
2.2. Selection of Recycling Models and Competition in Supply Chains
Supply chain management is a key pathway to achieving the sustainable use of resources [
18,
19,
20,
21], with the selection of recycling models and competition among recycling channels being central research topics. Foundational studies by Savaskan et al. (2004) [
22] and Savaskan and Van Wassenhove (2006) [
23] established classic Stackelberg game frameworks for recycling channel design and highlighted the importance of downstream competition in closed-loop supply chains, providing the theoretical basis for our modeling approach. Regarding recycling models, scholars have conducted in-depth comparisons of manufacturer-led, retailer-led, third-party, and hybrid recycling models. Fan et al. (2021) [
24] conducted optimization studies on various recycling models based on the Stackelberg game; Chen et al. (2021) [
25] and Wang et al. (2022) [
26] explored decision-making regarding hybrid recycling channels in retailer-led and dual-channel scenarios, respectively. Regarding recycling competition, research has focused on the impact of recycling prices, recycling quality, and consumer behavior on competitive equilibrium. Li et al. (2021) [
27] analyzed how consumer sensitivity to recycling prices influences firms’ optimal recycling strategies. Yao et al. (2021) [
28] and Kang et al. (2021) [
29] investigated dual-channel recycling strategies and coordination issues from the perspectives of corporate social responsibility (CSR) investment and evolutionary game theory, respectively.
In recent years, some studies have begun to frame competition within an oligopolistic or duopolistic market framework. Flores-Perez et al. (2026) [
30] introduced producer competition based on the Cournot game within the hydrogen supply chain; Motalleb et al. (2019) [
31] investigated networked Stackelberg competition in demand response markets. In the Chinese literature, Yi et al. (2025) [
32] analyzed retrofitting investment decisions for coal-fired power plants under duopoly competition; Wang et al. (2025) [
33] examined pricing strategies for duopolistic video platforms; Sui and Yang (2026) [
34] focused specifically on duopolistic recyclers, analyzing the complexity of output-performance games under asymmetric quality control. Research directly focused on the rare earth sector is relatively scarce; the studies by Lai et al. [
35,
36] are a few exceptions, as they analyzed the impact of rare earth recycling and remanufacturing on oligopolistic markets from a closed-loop supply chain perspective. However, our study differs from and extends their work in three key respects. First, we incorporate two competing recyclers engaging in Cournot competition, capturing horizontal dynamics absent in their single-recycler framework. Second, we endogenize both recycling price and remanufacturing output, allowing strategic allocation of recovered rare earths between external sales and in-house use—a “dual decision” structure not present in their model. Third, we provide a systematic comparison of subsidies versus environmental taxes, rather than subsidies and carbon trading.
Although existing research on competition in supply chain recycling has addressed oligopolistic or duopolistic markets, most studies treat recyclers merely as single decision-makers regarding recycling, overlooking the dual decisions of “recycling pricing” and “remanufacturing output” that recyclers face in actual operations, as well as the intrinsic interplay between these two types of decisions. Specifically, conventional closed-loop supply chain models typically assume unidirectional material flows in which recyclers collect and resell all recovered materials upstream. In contrast, our framework captures the strategic trade-off recyclers face between selling recovered rare earths to the oligopolistic group versus retaining them for in-house remanufacturing—a distinction that generates non-trivial equilibrium outcomes, including altered pricing dynamics, resource competition effects, and differentiated profit distributions that would not emerge in traditional single-decision settings. This dual-role structure, wherein recyclers act simultaneously as “suppliers” and “competitors”, constitutes the core theoretical contribution of our study. They also neglect the competitive relationships between different recyclers. In recent years, emerging technologies have opened new avenues for optimizing recycling and resource recovery in supply chains. For instance, Raouf et al. (2025) [
37] proposed an artificial intelligence framework for recycling dormant and obsolete inventory in automotive supply chains, demonstrating that AI-driven optimization can modernize up to 84.31% of affected inventory while significantly reducing storage costs and enhancing sustainability. Although their study focuses on the automotive sector rather than rare earth materials specifically, the AI-enabled framework offers valuable insights for improving the efficiency of rare earth recovery and sorting processes. Our study complements this technological perspective by focusing on market structural effects and policy implications within the specific context of the rare earth oligopoly market.
2.3. Research on Policy Instruments in the Recycling Sector
The healthy development of the resource recycling industry is inseparable from the effective guidance and regulation provided by policy instruments. In the fields of rare earth recycling and power battery recycling, governments utilize policy instruments such as subsidies, carbon trading, and deposit refund schemes to incentivize recycling activities, regulate market order, and coordinate the interests of stakeholders. Scholars both domestically and internationally have conducted extensive research into the design, effectiveness, and optimization of these policies, yielding a wealth of findings. Subsidy policies are among the most closely scrutinized tools; scholars have analyzed the impact of subsidies on supply chain pricing [
38], the choice of recycling models [
39], emissions reduction decisions [
40], and supply chain coordination [
41]. Carbon policies (carbon taxes/cap-and-trade schemes) are also a research focus. For instance, Tsao and Ai (2024) [
42], Li et al. (2025) [
43], and Zhang et al. (2024) [
44] analyzed the role of carbon trading and carbon taxes in recycling and emissions reduction decisions in the fields of power batteries, general remanufacturing, and electric vehicle batteries, respectively. Liu et al. (2022) [
45] point out that a combined policy of environmental taxes and recycling subsidies can effectively increase the volume of waste batteries recycled. Beyond single-policy analyses, several studies have examined the interaction between subsidies and taxes as complementary or competing policy instruments. Bansal and Gangopadhyay (2003) [
46] provided a foundational theoretical analysis of tax/subsidy policies in the presence of environmentally aware consumers, demonstrating that uniform subsidy policies improve the average environmental quality while uniform tax policies may worsen it, and that discriminatory subsidy policies can enhance aggregate welfare. In the supply chain context, Yi et al. (2022) [
47] compared green subsidies and emissions taxes in a manufacturer–retailer supply chain, finding that subsidies provide greater incentives for green technology investment, although the optimal policy choice depends on the marginal cost of investment and the marginal damage cost of pollution. These studies provide important theoretical and methodological foundations for our comparative analysis of subsidies and environmental taxes in the rare earth supply chain.
In existing research, most policy analyses assume a market structure of perfect competition or a single monopoly, lacking specific examination of policy effects under a rare earth oligopolistic market structure. Furthermore, comparative studies of the two policy instruments—subsidies and environmental taxes—within the rare earth reverse supply chain are extremely limited, particularly when considering the dual decision-making of recyclers.
Consequently, at the market-structure level, this study constructs an integrated two-tier supply chain model combining “vertical game theory” and “horizontal competition”, taking into account both the vertical monopoly power of upstream rare earth groups acting as Stackelberg leaders and the horizontal output competition between two downstream recyclers acting as Cournot followers. At the level of recycler decision-making, this study examines both the recyclers’ pricing decisions for recovered materials and their production decisions for remanufactured products. By analyzing the allocation ratio of scrap materials, it reveals the intrinsic linkages and strategic trade-offs between these two types of decisions, thereby addressing the shortcoming of existing research that simplifies recyclers into single decision-making entities. At the policy-comparison level, this study examines both government subsidy policies and environmental tax policies, incorporating both instruments into a unified game model for systematic comparison. Through numerical simulation, it reveals the distinct characteristics of the two policies in terms of their direction of action, intensity of impact, and beneficiary groups, thereby providing theoretical support and decision-making references for the optimization of policy combinations and the precise regulation of the industry. These three dimensions—dual decision-making, integrated vertical-horizontal competition, and comparative policy analysis—constitute the core novelty of our model, distinguishing it from existing game-theoretical studies on reverse and closed-loop supply chains.
3. Research Problem and Basic Assumptions
3.1. Research Problem
This study examines a two-tier reverse supply chain comprising a rare earth oligopoly (G) and two rare earth recyclers (R1 and R2). We refer to this oligopoly as the rare earth group, which acts as the leader in a Stackelberg game and is responsible for the entire process from the mining of rare earth ore to the manufacture and sale of rare earth materials. Its core decision lies in setting a uniform purchase price
for recycled rare earths. Meanwhile, to compensate for the environmental externalities caused by primary mining, the government imposes an environmental tax
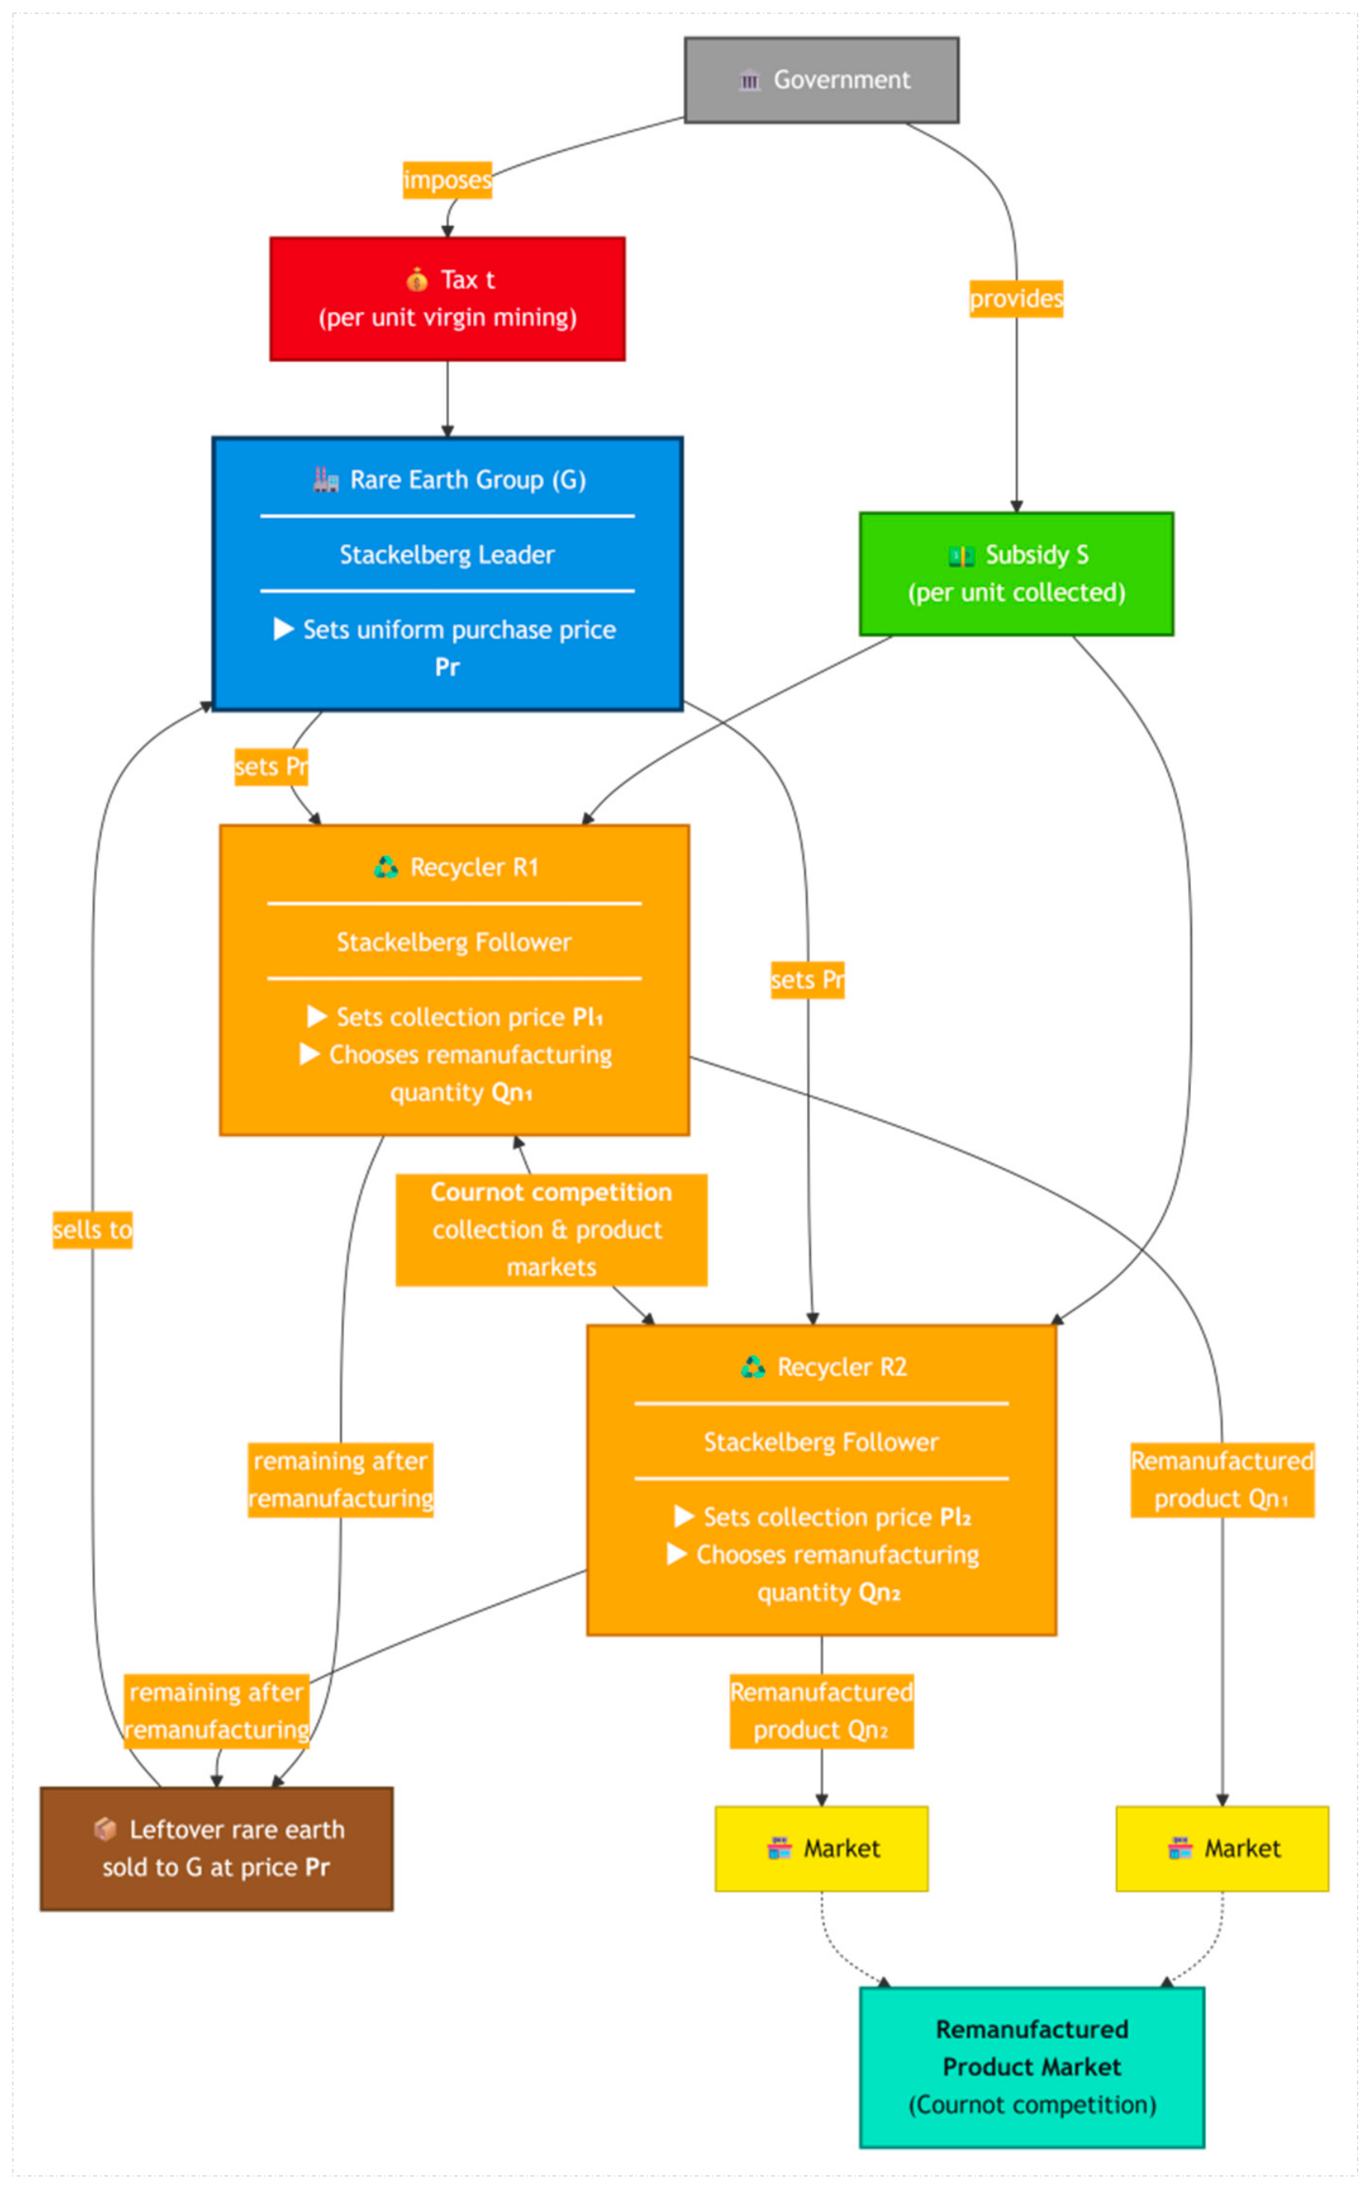
on each unit of primary rare earths mined. The rare earth recyclers (R1 and R2) are followers in the Stackelberg game, recovering and extracting rare earths from end-of-life products or industrial waste. This study takes into account the remanufacturing capacity of the rare earth recyclers. After extracting rare earths from recycled materials, the recyclers may choose to remanufacture rare earth materials and release them onto the market, or opt to resell the extracted rare earths to the rare earth group for processing. Their core decisions lie in setting their recycling price
to compete for recycling resources and determining the quantity of extracted rare earths to be used in their own remanufactured products
. Recyclers sell all surplus rare earths not used for their own remanufacturing to the rare earth group at a price of
. The two recyclers face Cournot competition in both the recycling market and the remanufactured product market. To incentivise recycling, the government provides a subsidy
to recyclers for each unit of material recycled. The game process is illustrated in
Figure 1.
3.2. Basic Assumptions
Assumption 1 (Market Demand and Product Differentiation): Consumers have different willingness to pay for new products produced by the rare earth group and remanufactured products produced by recyclers. Their utility functions are, respectively: (i = 1, 2). We set the market capacity to , and the consumer valuation of the product follows a uniform distribution over the interval . γ ∈ (0, 1) is the utility discount coefficient for remanufactured products. is the price sensitivity coefficient. Consumers will only purchase a product if its utility is greater than 0. The remanufactured products produced by the two recyclers are functionally identical but are regarded as imperfect substitutes for one another. The linear inverse demand functions derived from this are: , (i = 1, 2).
Assumption 2 (Recycling Volume and Recycling Costs): denotes the recycling volume of recycler i, which is proportional to the recycling price , i (i = 1, 2), where is a constant representing the market size. The processing cost per unit of recycled waste is .
Assumption 3 (Rare Earth Content, Extraction and Remanufacturing): Rare earth materials refer to materials containing rare earth elements. To avoid confusion, we collectively refer to rare earth elements, rare earth ores, rare earth oxides, etc., as “rare earths”. Assume that each unit of new or remanufactured product contains units of rare earths, i.e., manufacturing one unit of rare earth material requires the consumption of units of rare earths, . The rare earth extraction rate for recyclers is , and the cost for recyclers to improve the extraction rate through innovation and R&D is , where is the cost coefficient. The unit manufacturing cost of new products for the rare earth group is ; the mining and smelting cost per unit of rare earths is ; the unit remanufacturing cost for recycler i is .
Assumption 4 (Government Policy): The government grants a fixed subsidy ) to recyclers for every unit of waste recycled. At the same time, it imposes a fixed environmental tax () on the rare earth group for every unit of rare earth extracted from ore.
Assumption 5 (Strategic Variables and Game Structure): The sequence of the game is as follows: 1. the government announces the policy (); 2. the rare earth group, acting as the leader, determines the purchase price of rare earths and the output of new products ; 3. the two recyclers, acting as followers, engage in Cournot competition simultaneously and independently after observing , with the decision variables being their respective recycling prices and remanufacturing outputs .
The parameter symbols and their specific meanings used in this paper are shown in
Table 1.
5. Numerical Simulation Analysis
Given the wide variety of rare earth elements and the significant differences in market demand and prices between them, it is difficult to establish a uniform pricing structure for the entire rare earth market. For this reason, this study selects rare earth permanent magnet materials as a representative product. Based on market data for these materials and incorporating relevant technical parameters, the parameter values required for the model in this paper have been derived; the specific results are shown in
Table 2.
In the production process of rare earth permanent magnet materials, the mass fraction of rare earth elements typically ranges from 30% to 40%. Referring to the assumptions made by Lai et al. (2024) [
35,
36], this study assumes that the production of one tonne of rare earth permanent magnet materials requires the consumption of 0.4 tonnes of rare earth oxides, i.e., a conversion rate of 0.4. According to information from the China Nonferrous Metals Network, the mining cost of ionic rare earths in southern China is approximately 600,000 yuan per tonne, whilst that of light rare earths in the north is relatively lower. Taking these factors into account, this paper adopts an average mining cost of 500,000 yuan per tonne for rare earth ores. Consequently, the production cost of rare earth oxides is estimated at 1,000,000 yuan per tonne. As this study uses the rare earth permanent magnet materials market to represent the entire rare earth market, further cost allocation is required. Rare earth permanent magnet materials are primarily composed of praseodymium and neodymium, which together account for approximately 20% of the average mass of rare earth oxides. Based on this, the allocated forward supply cost of rare earth oxides is 200,000 yuan per tonne.
Regarding market data, based on actual market conditions, the price of rare earth permanent magnet materials is approximately 400,000 yuan per tonne. In 2023, global market demand for rare earth permanent magnet materials was close to 350,000 tonnes [
35,
36]. Therefore, setting
, we can calculate that
.
5.1. Baseline Scenario
5.1.1. Baseline Parameter Settings
The baseline scenario is a supply chain equilibrium state derived from model solutions, with parameters set based on the actual characteristics of the industry and values drawn from the literature (see
Table 2). It simulates the equilibrium state of the rare earth reverse supply chain under the current policy environment, market conditions, and technological constraints, and serves as a reference benchmark for subsequent policy analysis.
5.1.2. Equilibrium Results of the Baseline Scenario
The equilibrium results of the baseline scenario are shown in
Table 3. These results depict the system steady state formed by the rational decisions of various supply chain actors and their interactions under conditions of “moderate policy regulation, low market acceptance, and divergent technological levels”. Its core characteristics are as follows: primary products dominate market supply; the recycling segment occupies a subordinate position; resource recycling has begun to take shape but faces efficiency bottlenecks; profit distribution is highly concentrated at the upstream of the supply chain; and policy intervention imposes a significant fiscal burden.
Under the baseline scenario, the output of new products Qm is 372,899 tonnes, whilst the total volume of recovered waste ΣQl amounts to 179,951 tonnes. Of this, the total output of remanufactured products ΣQn is 17,804 tonnes, and the volume of recycled rare earths is 46,864 tonnes. This calculation yields a rare earth recycling rate of 31.4%, indicating that under the current system, approximately one-third of rare earth demand can be met through recycling. This holds positive significance for alleviating the pressure on rare earth resource extraction in China and enhancing resource security.
From a market structure perspective, the market share of remanufactured products stands at only 4.6%, indicating that recycled rare earth products still occupy a subordinate and supplementary position within the current market landscape. The profit ΠG of rare earth groups amounts to 91.174 billion yuan, significantly higher than the total profit ΠR of recyclers (16.262 billion yuan), reflecting that the value within the reverse supply chain remains highly concentrated in the upstream production segment of the industrial chain, whilst economic incentives for the downstream recycling and remanufacturing segments are relatively limited. The government’s net revenue and expenditure stands at −5.682 billion yuan, indicating that under the current policy framework, the government must incentivize the recycling system through fiscal subsidies or tax incentives to maintain its operation; this also constitutes a direct policy cost for promoting the development of the circular economy.
5.2. The Impact of Subsidy Policies on Supply Chains
In today’s complex and ever-changing industrial and economic landscape, subsidy policies—as a key instrument for the government to regulate the market and guide industrial development—play a significant role in the stable operation and profit distribution across all stages of the supply chain. This subsection will explore in depth the multifaceted impact of subsidy policy on rare earth groups and recyclers within the supply chain, primarily covering product output, market share, prices, profits, recycling volumes, and raw material extraction volumes. Given that the actual market environment is fraught with uncertainty and complexity, and to ensure the simulation analysis more closely mirrors real-world conditions, this paper restricts
S to the range 0 ≤
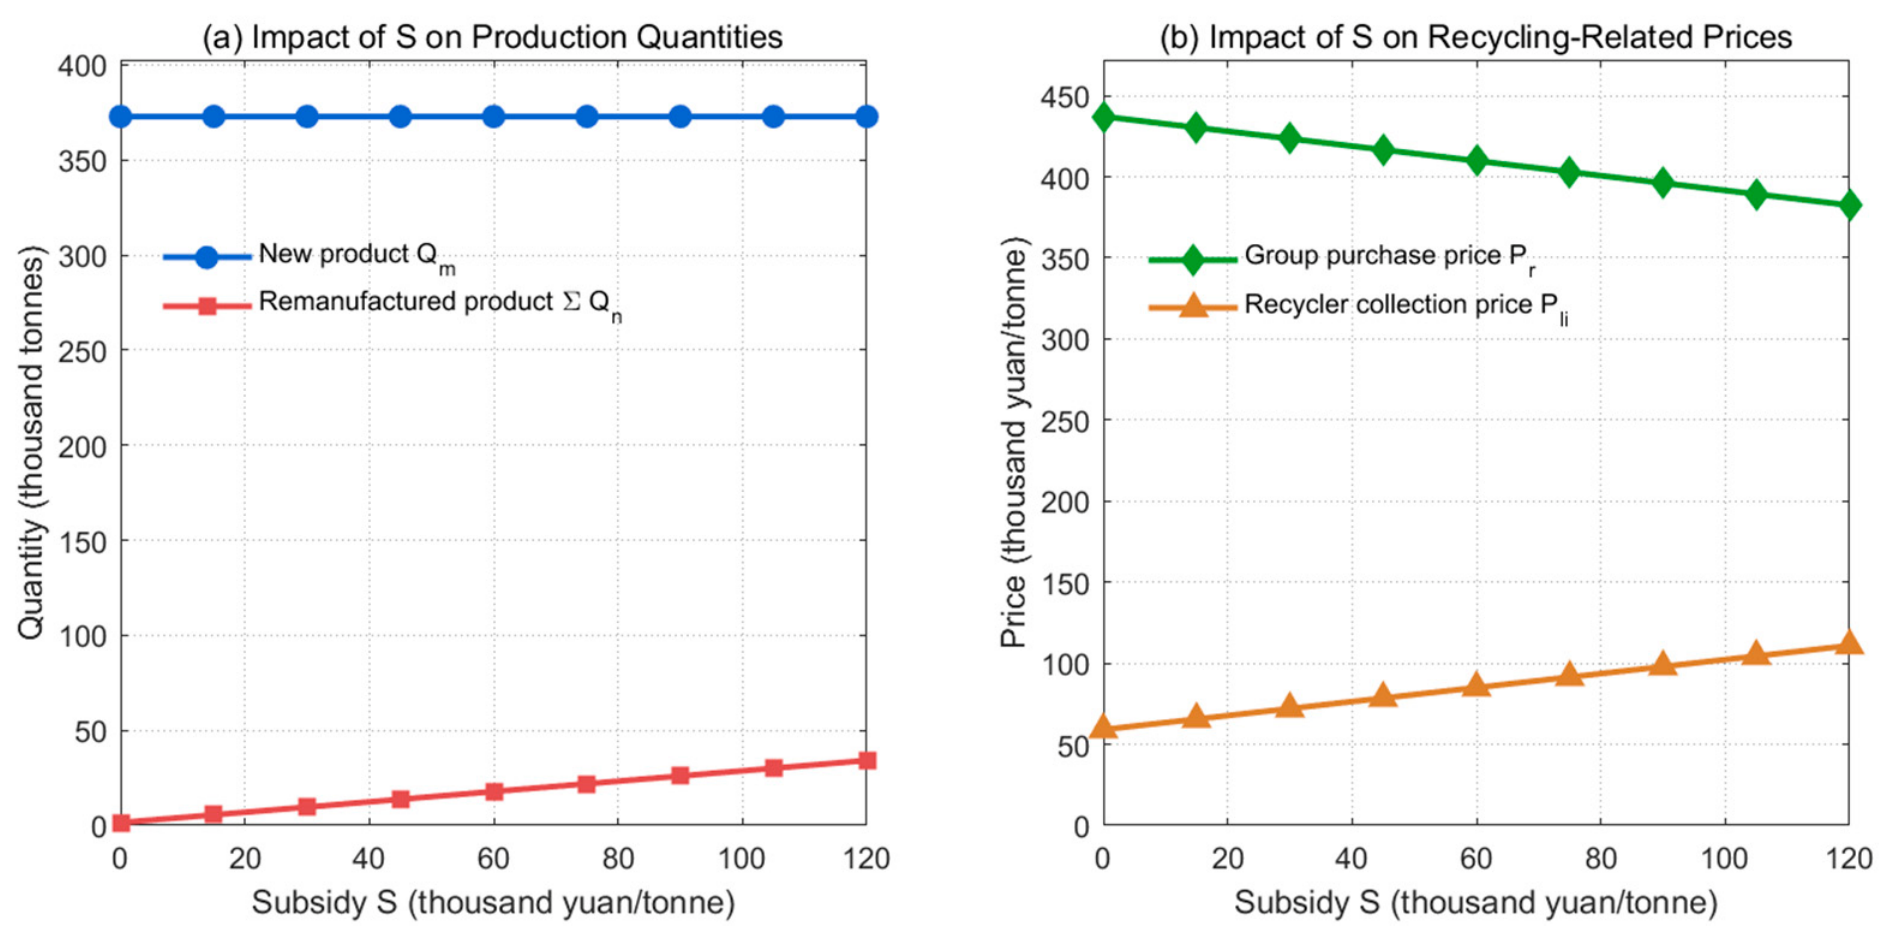
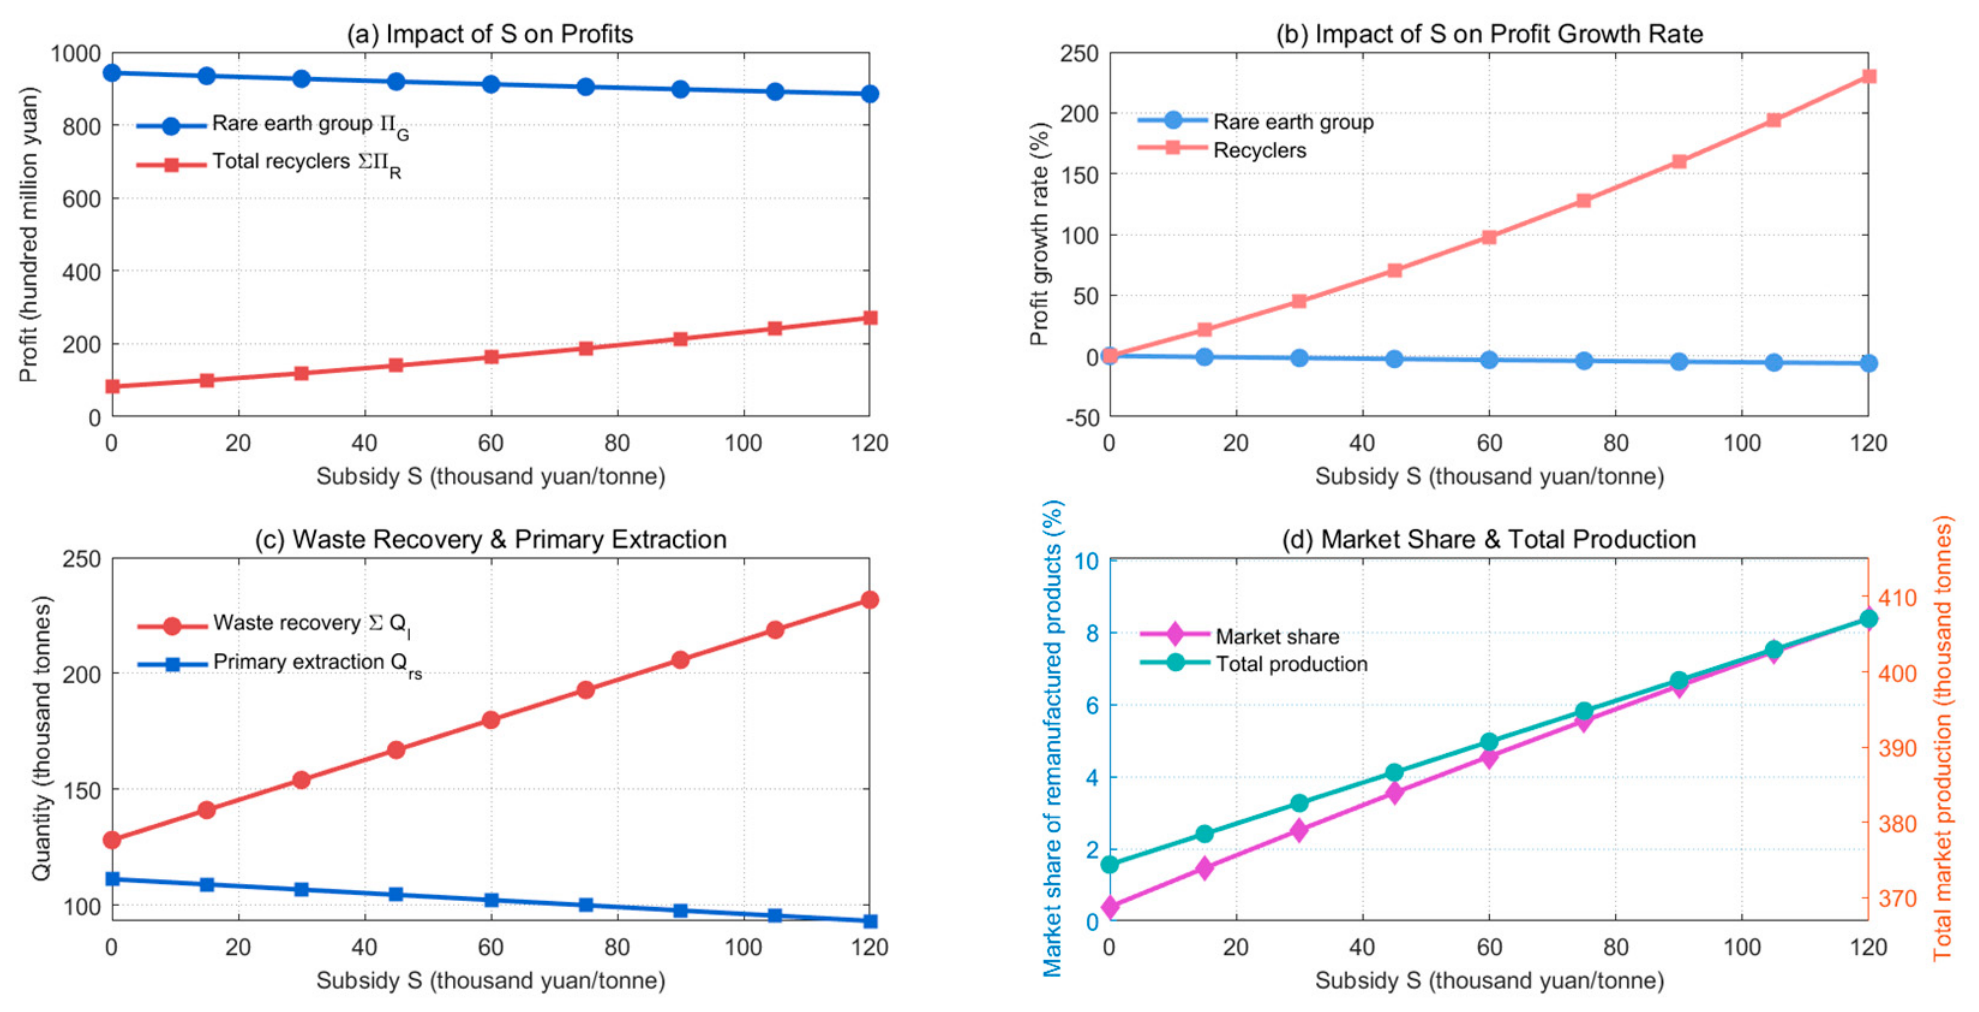
S ≤ 120 (thousand yuan/tonne). The results of the analysis are shown in
Figure 2 and
Figure 3.
Figure 2a shows that as the intensity of the subsidy policy
S increases, the output of new products by the rare earth group
remains largely stable at a relatively high level. This indicates that government subsidies do not significantly incentivise rare earth groups to produce new products; their production decisions are more influenced by factors such as market demand and costs. Conversely, the total output of remanufactured products by recyclers
shows a significant increase with rising subsidy
S, although it remains at a relatively low level. This indicates that government subsidies have effectively stimulated recyclers’ enthusiasm for producing remanufactured products, thereby increasing the market supply of such goods. The marked disparity between the two figures demonstrates that new rare earth products dominate the market.
Figure 2b shows that as subsidies increase, the purchase price
of the rare earth group exhibits a downward trend. This may be because government subsidies have reduced the group’s production costs, giving it stronger bargaining power in the procurement phase and thereby driving down purchase prices. Conversely, the collection price
of recyclers rises as subsidies increase, indicating that government subsidies have boosted recyclers’ enthusiasm for collection, making them willing to pay higher prices for scrap to secure more raw materials for remanufacturing.
Figure 3a shows that as the subsidy
S increases, the rare earth group’s profits—which had been relatively high—decline slightly, while the total profits of the recyclers show a sustained upward trend, although they remain significantly lower than those of the rare earth group. It should be noted that the rare earth group’s absolute profit level is substantially larger than that of the recyclers, as shown in
Figure 3a.
Figure 3b complements this by illustrating the relative sensitivity of each party’s profits to changes in subsidy intensity. While the growth rate comparison should not be interpreted as suggesting that recyclers’ absolute profit gains exceed those of the rare earth group, the figure does reveal that recyclers’ profits respond more elastically to subsidy changes—indicating that recyclers are more dependent on and responsive to subsidy policy stimuli. This differential responsiveness is a meaningful insight for policy design, suggesting that subsidy policies have a stronger marginal incentive effect on the recycling sector. As shown in
Figure 3c, the total volume of recycled scrap rises significantly with increasing subsidies, while the volume of primary extraction decreases. This indicates that government subsidies incentivize the recycling sector to expand the scale of scrap collection, effectively promoting the recycling and reuse of scrap, reducing the demand for mining primary rare earth resources, lowering the supply chain’s dependence on primary resources, achieving a significant improvement in environmental benefits, and effectively enhancing the recycling efficiency of rare earth resources, which is conducive to the sustainable use of resources. The recycling rate rises as subsidies increase, further demonstrating that government subsidies can improve the recycling efficiency of rare earth resources and promote the development of a circular economy. As shown in
Figure 3d, the market share of remanufactured products gradually increases with rising subsidy
S. This implies that government subsidies help enhance the competitiveness of remanufactured products in the market and expand their market coverage. Total market output also rises with increasing subsidy
S, indicating that government subsidy policies can stimulate production activities across the entire market, increase the total supply of products, and meet the demands of more consumers.
5.3. The Impact of Environmental Tax Policies on Supply Chains
Against the backdrop of today’s global emphasis on sustainable development and environmental protection, environmental tax policies—as a key tool for governments to balance economic and environmental considerations—exert far-reaching and complex influences on the operational models, cost structures, and behavioral decisions of market entities across all stages of the supply chain. This subsection will conduct an in-depth analysis of the multidimensional impacts of environmental tax policies on entities within the supply chain, such as rare earth groups and recyclers, covering key indicators including product output, market share, price, profit, recycling volume, and raw material extraction volume. Given the numerous uncertainties and complexities of the actual market environment, to ensure that the simulation analysis more closely reflects real-world conditions, this paper limits the environmental tax
t to the range of 0 ≤
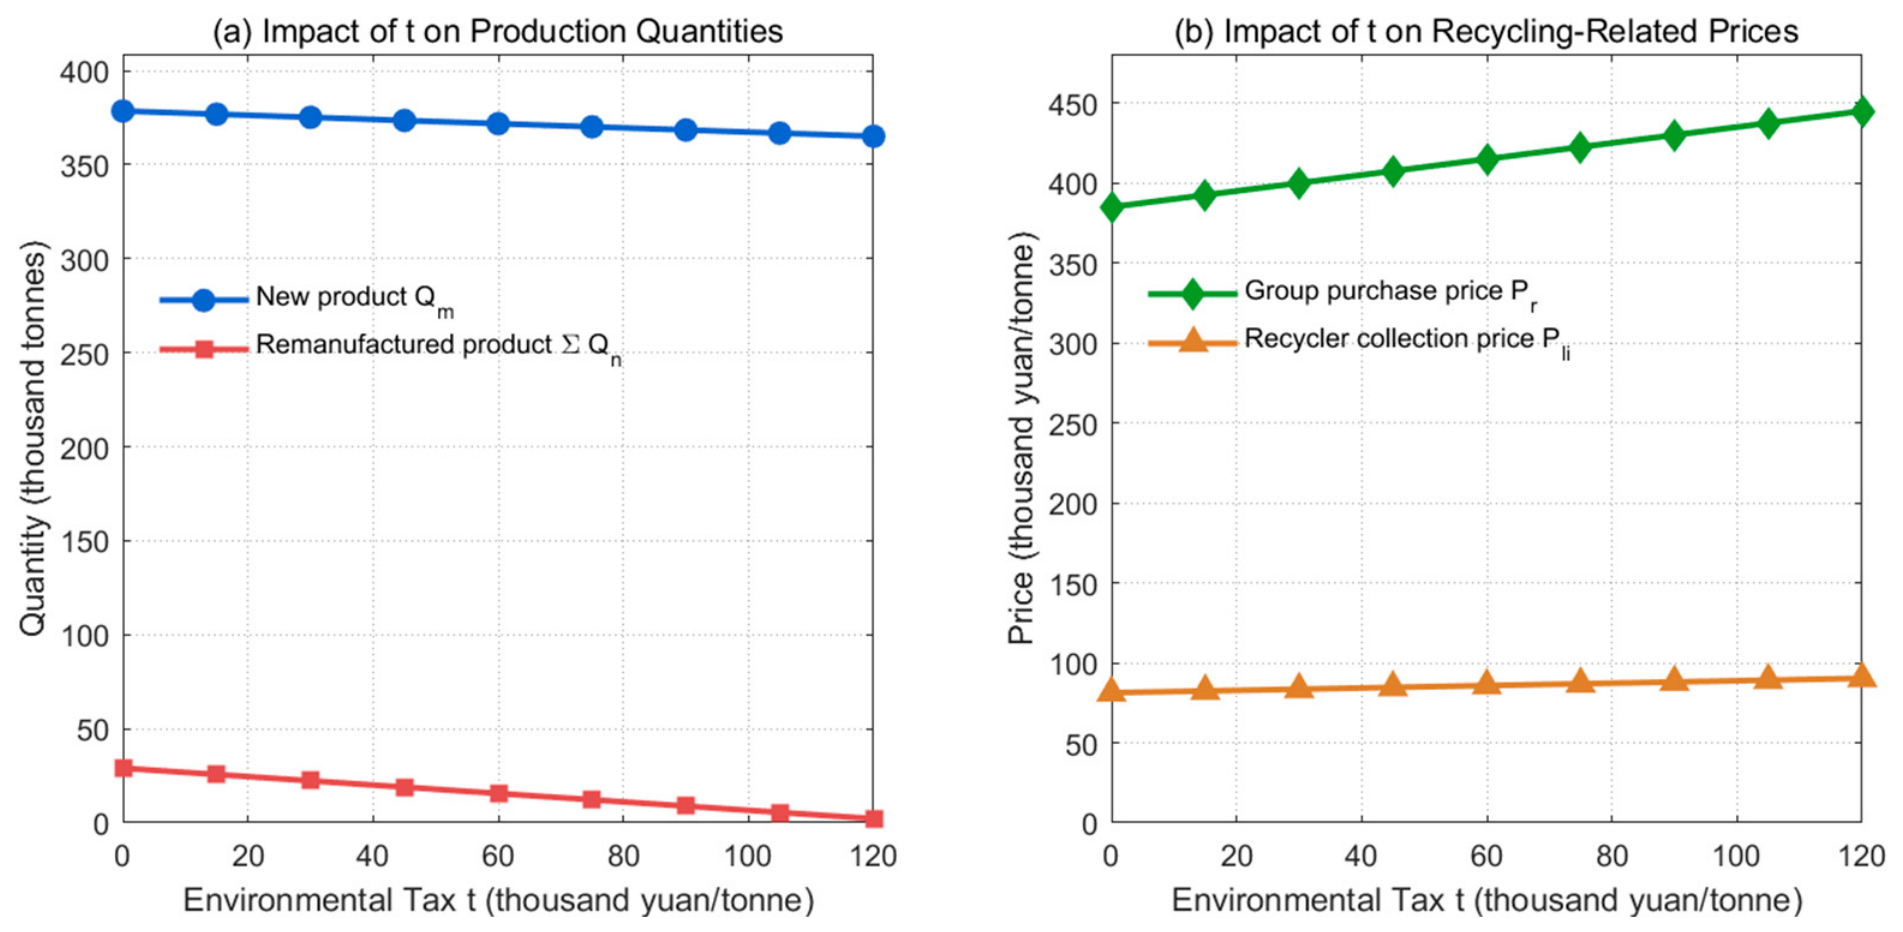
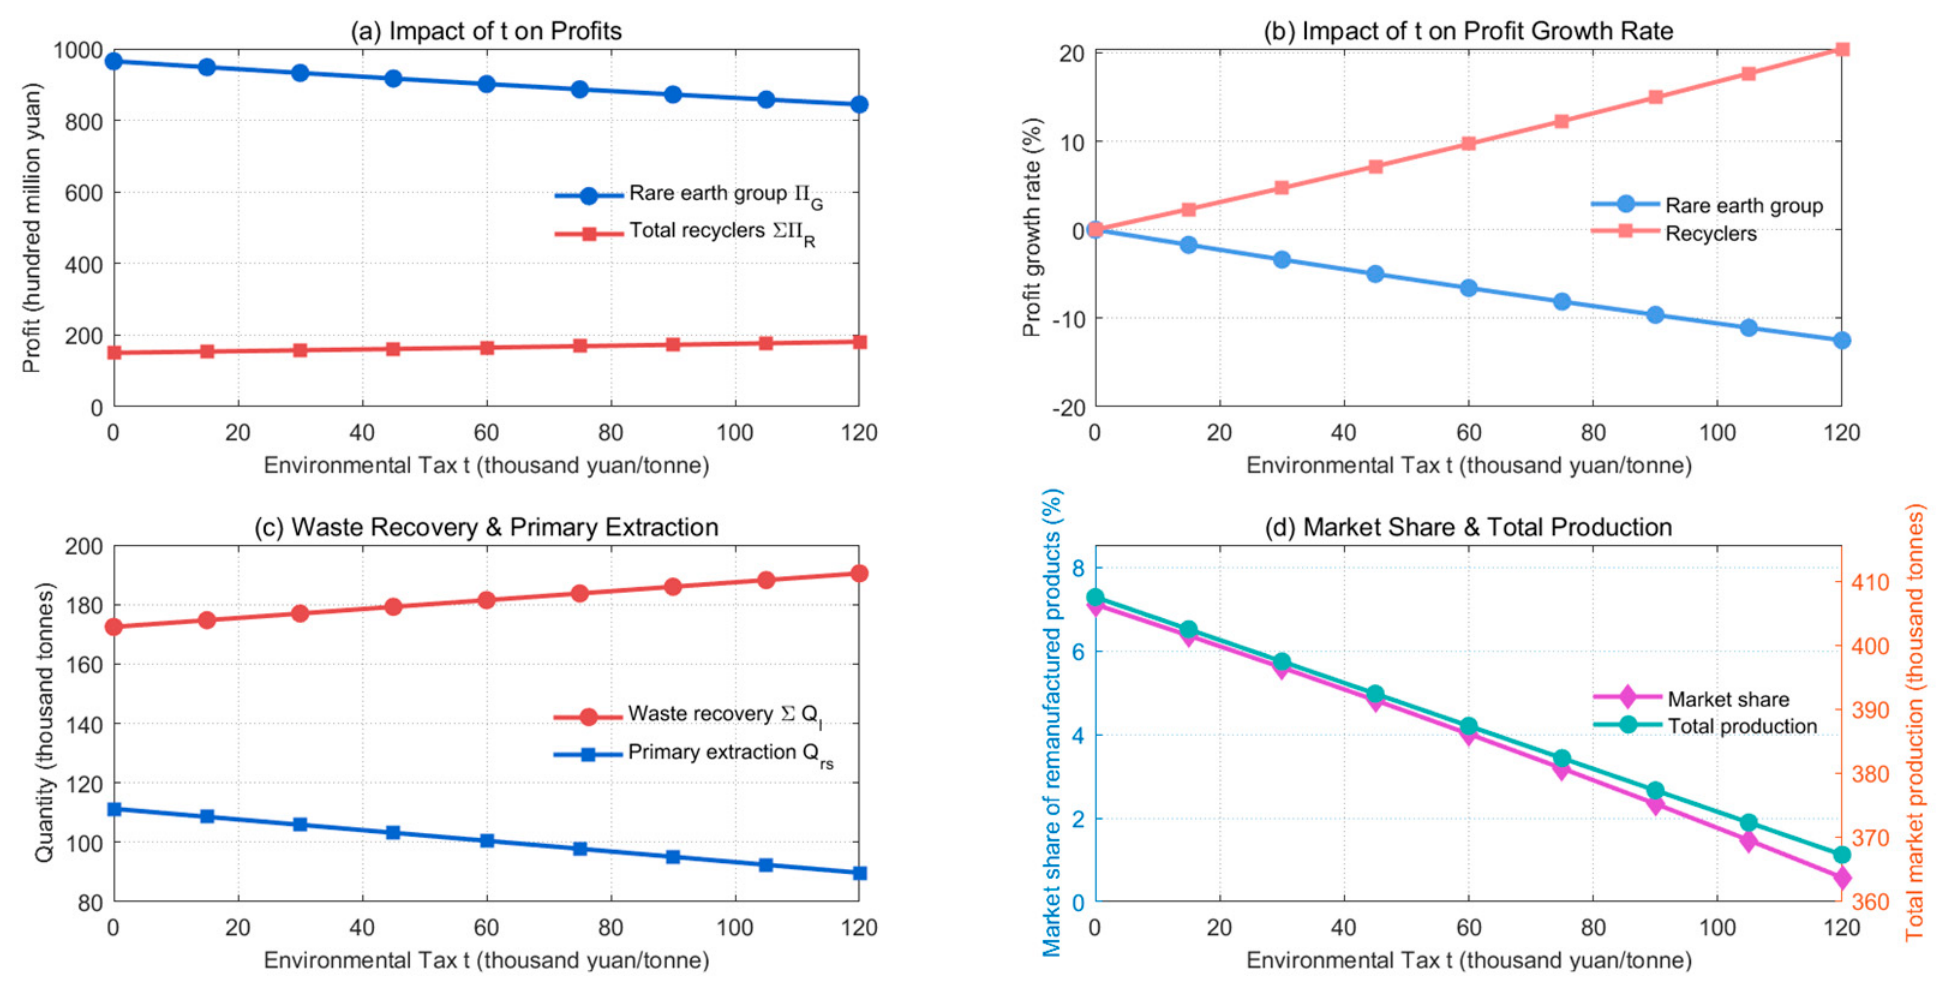
t ≤ 120 (thousand yuan/tonne). The results of the analysis are shown in
Figure 4 and
Figure 5.
Figure 4a shows that the output of new products exhibits a gradual downward trend as the environmental tax increases, while the output of remanufactured products declines significantly. This indicates that while an increase in the environmental tax raises the cost of producing new products, the impact on remanufactured products is more pronounced. This may be because the remanufacturing process itself entails higher environmental costs or lower efficiency. The output of new products remains at a consistently high level, while the total output of remanufactured products remains at a consistently low level; the significant gap between the two indicates that new rare earth products dominate the market.
Figure 4b shows that as the environmental tax increases, the purchase prices of the rare earth group exhibit an upward trend, while the recycling prices of rare earth recyclers remain largely unchanged. This may be because the increase in the environmental tax highlights the scarcity of rare earth resources, thereby driving up the purchase prices of the rare earth group. Meanwhile, the stability of recyclers’ prices may be attributed to the competitive landscape of the recycling market or the relative stability of recycling costs.
Figure 5a shows that as the environmental tax increases, the profits of the rare earth group gradually decline, while the profits of the general recyclers rise slightly, though not significantly.
Figure 5b further reveals the trends in profit growth rates. The profit growth rate of the rare earth group declines significantly as the environmental tax increases, even turning negative, while the profit growth rate of recyclers rises. This indicates that environmental tax policies have differing impacts on the profitability of various market participants, requiring policymakers to comprehensively consider the interests of all parties.
Figure 5c shows that as the intensity of environmental tax policies increases, the volume of waste materials recovered exhibits a significant linear growth trend, while the volume of primary mining shows a downward trend. The recycling rate exhibits a continuous linear relationship with increasing subsidies. This indicates that within the rare earth reverse supply chain, environmental tax policies can simultaneously enhance the recycling rate and environmental benefits by restricting primary mining and expanding waste recovery, thereby effectively guiding the supply chain toward a green circular model.
Figure 5d shows that as the environmental tax increases, the market share of remanufactured products gradually declines, indicating that consumers tend to choose new products when faced with high environmental taxes; total market output decreases as the environmental tax increases, which may be due to the environmental tax raising production costs and leading to a reduction in overall market demand.
5.4. Sensitivity Analysis
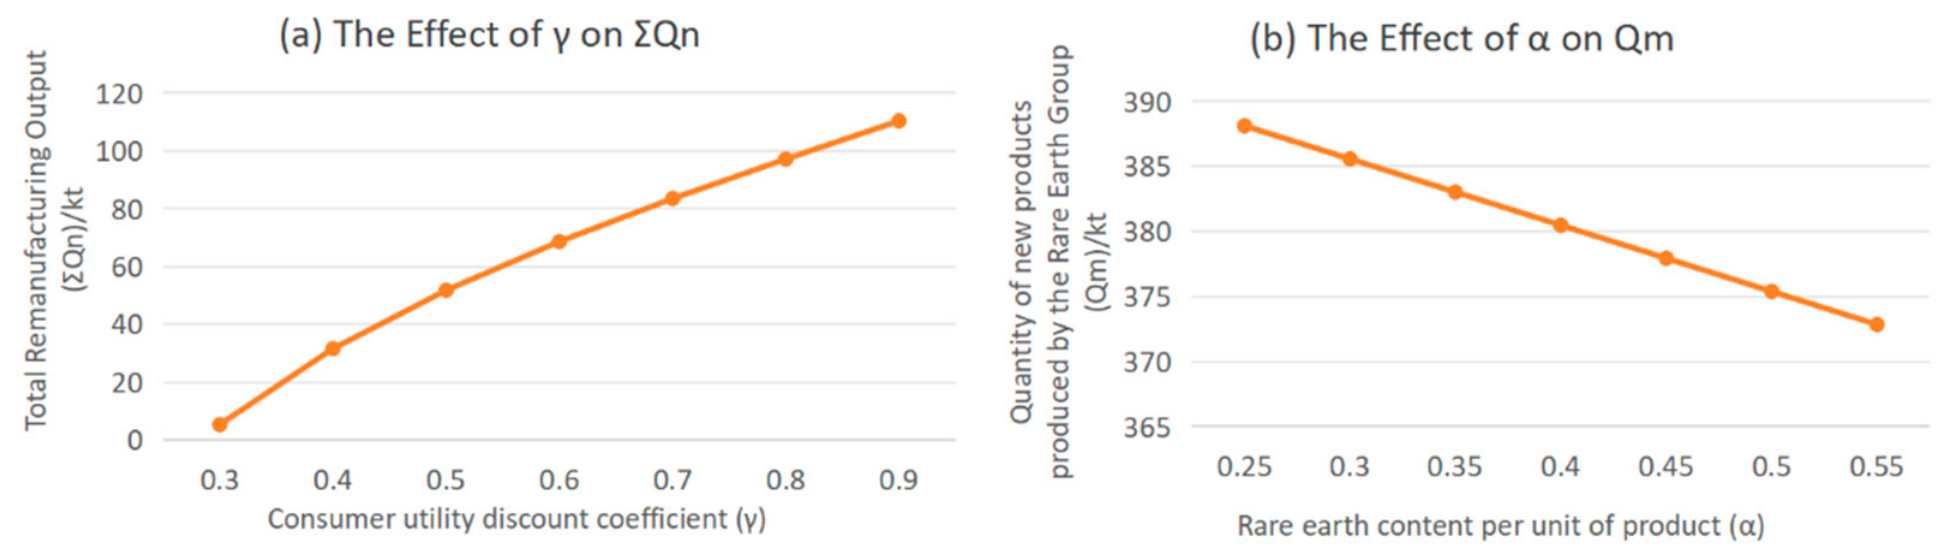
To further demonstrate the robustness of our model, we conduct sensitivity analyses on two key parameters: the consumer utility discount coefficient for remanufactured products (γ) and the rare earth content per unit of product (α). These parameters are selected because they directly capture the core characteristics of the rare earth reverse supply chain—resource utilization efficiency and market acceptance of remanufactured products.
Figure 6a shows the effect of γ on the total remanufacturing output of recyclers (
). As
γ increases from 0.3 to 0.9,
exhibits a substantial upward trend, more than doubling over the range tested. This indicates that consumer acceptance of remanufactured products is a critical driver of remanufacturing market expansion. Higher
γ values imply that consumers perceive remanufactured products as closer substitutes for new products, thereby expanding market demand and incentivizing recyclers to allocate more recovered rare earths toward in-house remanufacturing rather than external sales.
Figure 6b presents the effect of α on the new product output of the rare earth group (
). As α increases from 0.25 to 0.55,
declines steadily from approximately 388 kt to 372 kt. This is because a higher rare earth content per unit implies that more rare earth resources are required to produce the same quantity of products, prompting the group to adopt a more conservative production strategy under constrained resource supply conditions. Although this result suggests that higher α may suppress new product output in the short term, it also reflects improved resource utilization efficiency from a broader sustainability perspective.
In both cases, the relationships exhibit monotonic trends without abnormal fluctuations or reversals, confirming that our main qualitative conclusions regarding the distinct mechanisms and asymmetric effects of subsidy versus environmental tax policies remain robust across reasonable ranges of key parameter variations.
6. Discussion
Against the backdrop of global trends towards the efficient use of resources and environmental protection, the rational development and recycling of rare earth resources are of great significance to the sustainable development of the industry. As a key force in guiding industrial development and regulating market mechanisms, policy plays a crucial role in ensuring the stable operation of the supply chain and facilitating its green transition. From the perspective of supply chain management, this study constructs a two-tier reverse supply chain model to explore in depth the multifaceted impacts of two policy instruments—recycling subsidies and environmental taxes—on key players within the supply chain, such as rare earth groups and recyclers. The aim is to provide a theoretical basis for policy formulation and industrial optimization.
6.1. The Impact of Policies on Production Decisions Within Supply Chains
Recycling subsidy policies often serve as an incentive for production decisions made by enterprises within the supply chain. As evidenced by the results of the correlation analysis, recycling subsidies encourage recyclers to intensify their recycling efforts, thereby increasing the recovery rate of rare earths and, consequently, reducing the demand for primary extraction of virgin rare earths. This is because subsidies lower recyclers’ operating costs and enhance the economic viability of recycling operations, thereby steering resources towards the recycling sector. Environmental tax policies, however, operate differently. As environmental taxes increase, the output of both new products and remanufactured products declines, with the drop in remanufactured product output being particularly pronounced. This indicates that environmental taxes raise firms’ production costs, which in turn drives up the purchase price for recycled rare earths. This higher increases the opportunity cost for recyclers to use recovered rare earths for in-house remanufacturing (since they could earn more by selling the recovered materials to the rare earth group), thereby reducing their optimal remanufacturing output . In other words, environmental taxes exert their inhibitory effect on remanufacturing through a price-driven substitution mechanism—directing recovered rare earths away from remanufacturing and toward external sales—rather than through a direct increase in the environmental costs of the remanufacturing process itself. At the same time, total market output also declines as environmental taxes rise, reflecting the suppression of overall market demand due to rising costs. A comparison of the two policies shows that recycling subsidies use economic incentives to guide enterprises toward expanding recycling-related activities, whereas environmental taxes prompt enterprises to adjust production scale and structure by increasing cost pressures.
6.2. Impact of Policies on Market Structure and Prices
In terms of market structure, recycling subsidy policies help enhance the competitiveness of recycled products in the market. As recycling volumes increase, the supply of recycled products rises, potentially altering the market’s supply–demand balance and expanding the market share of remanufactured products. However, under an environmental tax policy, the market share of remanufactured products gradually declines as the environmental tax increases; consumers are more inclined to choose new products under high environmental tax rates, which may cause the competitive landscape to shift in favor of new products. In terms of pricing, recycling subsidies may indirectly influence the prices of recycled products and related raw materials. Subsidies provide recyclers with greater financial resources to invest in recycling, potentially raising the purchase prices they offer for recycled materials. At the same time, as recycling volumes increase, the market supply of recycled products rises, which may exert a certain moderating effect on market prices. Under the environmental tax policy, however, group purchase prices tend to rise as environmental taxes increase; this is primarily because environmental taxes highlight the scarcity of rare earth resources, thereby driving up their market value. However, the collection prices paid by recyclers remain largely unchanged, likely due to the competitive landscape of the recycling market or the relative stability of recycling costs. This highlights the difference in price transmission mechanisms between the two policies: recycling subsidies primarily affect the pricing structure within the recycling sector, whilst the environmental tax impacts the purchase prices of raw materials.
6.3. Impact of Policies on Corporate Profits and Sustainable Development
With regard to corporate profits, the recycling subsidy policy has a positive impact on recyclers’ profits, as the subsidies increase their revenue streams and enhance their profitability. Under the environmental tax policy, however, the rare earth group’s profits gradually decline as the environmental tax increases; profit growth rates may even turn negative, posing a challenge to the group’s long-term development. Although recyclers’ profits rise slightly, the increase is modest, indicating that the environmental tax policy has a limited stimulatory effect on their profits. This suggests that policies require more refined design to balance the interests of different market participants and avoid placing excessive pressure on certain enterprises. From a sustainable development perspective, the recycling subsidy policy has effectively promoted the circular use of resources and improved resource utilization efficiency, aligning with the core requirements of sustainable development. The environmental tax policy, by increasing environmental costs, encourages enterprises to reduce their negative impact on the environment and drives their transition towards green production. However, the inhibitory effect of environmental taxes on the remanufacturing industry may hinder the development of the resource recycling sector. Policymakers should, therefore, give comprehensive consideration to this issue and provide appropriate support or a transition period for the remanufacturing industry during policy formulation. Beyond the differentiated impacts of the two policy instruments discussed above, our findings also carry important practical implications for stakeholders under different market conditions. For policymakers, the choice between subsidies and environmental taxes should be calibrated to prevailing market conditions. When rare earth prices are high and recycling margins are already favorable, subsidy policies can be scaled back or targeted more narrowly to avoid over-subsidization and fiscal waste; conversely, during periods of low prices when recycling activities are economically unviable, subsidies become essential to maintain the operation of the recycling system. Environmental taxes, meanwhile, are particularly effective during price booms when primary mining tends to surge—they can curb excessive extraction without the fiscal expenditure required by subsidies. For rare earth oligopolies, our results suggest that procurement prices for recycled materials should be strategically adjusted in response to policy changes: under subsidy policies, the group may benefit from lowering to capture more of the subsidy-induced surplus, while under environmental tax policies, they should anticipate higher procurement costs and plan primary mining reductions accordingly. For recyclers, the optimal resource allocation between selling recovered materials and in-house remanufacturing depends critically on policy settings—higher subsidies favor the expansion of both recycling and remanufacturing, while higher environmental taxes indirectly discourage remanufacturing by raising the opportunity cost of material retention. Recyclers should, therefore, adjust their capacity planning and strategic focus in accordance with the prevailing policy mix and market price conditions.
7. Conclusions and Recommendations
7.1. Conclusions
This study examines the rare earth reverse supply chain, incorporating the oligopolistic structure characteristic of the rare earth industry into a game theory model. It focuses on the strategic choices faced by recyclers between “recycling and selling” and “in-house remanufacturing”, as well as their strategic interactions with rare earth oligopolies, and systematically analyzes the impact of two policy instruments—government subsidies and environmental taxes—on the supply chain equilibrium. The main conclusions are as follows:
(1) The dual decision-making process of “recycling versus in-house remanufacturing” by recyclers involves strategic interplay and competition for resources. Recyclers face dual Cournot competition in both the recycling market and the remanufactured product market. Their recycling volume is jointly influenced by recycling prices, government subsidies, and the purchase prices offered by rare earth conglomerates; meanwhile, remanufacturing output is significantly constrained by market demand, consumer acceptance of remanufactured products (the utility discount coefficient), and the purchase prices offered by rare earth conglomerates. When recyclers choose to use a greater proportion of recovered rare earths for their own remanufacturing, although they can achieve higher product value-added, they also reduce the volume of rare earths sold to the rare earth group, thereby influencing the purchasing strategies and market pricing of the oligopolistic firms. This inherent trade-off means that recyclers assume the dual roles of both “supplier” and “competitor” within the reverse supply chain, generating equilibrium outcomes that differ fundamentally from conventional closed-loop supply chain models with unidirectional material flows.
(2) Government subsidies and environmental taxes exert divergent effects on supply chain equilibrium. Subsidy policies significantly incentivize recyclers’ collection activities and remanufacturing production, increasing the total volume of waste collected and the recycling rate, whilst expanding the market share of remanufactured products; recyclers’ profits are far more sensitive to subsidies than those of rare earth groups. However, subsidies also lead to a decline in the purchase prices offered by rare earth groups, reflecting a trend of profit shifting downstream. Environmental tax policies, by increasing the cost of primary mining, have curbed the output of new products and the volume of primary mining, thereby promoting waste recovery and resource recycling. However, they have also indirectly suppressed the remanufacturing industry through a price-driven substitution effect: the increased purchase price for recycled rare earths raises recyclers’ opportunity cost of retaining materials for in-house remanufacturing, leading to a decline in the output and market share of remanufactured products. There are clear differences between these two policy instruments in terms of their direction of action and intensity of impact; policymakers need to weigh up their options based on the stage of industrial development and policy objectives.
(3) Value distribution within the rare earth reverse supply chain is highly concentrated among upstream oligopolistic enterprises, whilst economic incentives in the recycling segment remain insufficient. Under the baseline scenario, the rare earth group’s profits are significantly higher than the combined profits of the two recyclers, and the market share of remanufactured products stands at merely 4.6%. This reflects the subordinate position of the recycling and remanufacturing segments within the supply chain. The government’s net revenue is negative, indicating that current policies require sustained fiscal investment to maintain the operation of the recycling system. This profit distribution structure and pattern of policy dependency not only hinder the market-oriented development of the recycling industry but also constrain further improvements in the efficiency of rare earth resource recycling.
7.2. Recommendations
Based on the above conclusions, the following recommendations are proposed:
(1) Optimize the design of subsidy policies to enhance the precision and efficiency of recycling incentives. Our simulation results show that subsidy policies significantly stimulate recyclers’ collection activities and remanufacturing output (
Figure 2 and
Figure 3), with recyclers’ profits being far more sensitive to subsidies than those of rare earth groups. However, uniform subsidies may lead to inefficient resource allocation, as recyclers with different cost structures and technological capabilities respond differently to the same subsidy rate. Therefore, we recommend that differentiated subsidy standards be established based on factors such as the rare earth content of recycled materials, the technical difficulty of recycling, and the quality of remanufactured products, thereby avoiding a “one-size-fits-all” approach. For independent recyclers with remanufacturing capabilities, a tiered subsidy system linked to remanufacturing output could be established to encourage them to expand the scale of remanufacturing and increase product value-added. At the same time, a dynamic evaluation mechanism for the effectiveness of subsidies should be established to adjust the intensity and structure of subsidies in a timely manner in response to market changes and technological progress, thereby preventing policy distortions and the waste of fiscal resources.
(2) Make judicious use of environmental tax policies to balance environmental protection with the cultivation of the remanufacturing industry. Our model reveals that while environmental taxes effectively curb primary mining and promote waste recovery (
Figure 5c), they also indirectly suppress the remanufacturing sector through a price-driven substitution effect: the increased purchase price
for recycled rare earths raises recyclers’ opportunity cost of retaining materials for in-house remanufacturing, leading to a decline in remanufacturing output and market share (
Figure 4 and
Figure 5). Based on this finding, we recommend that, within the framework of environmental tax policies, tax exemptions or preferential tax rates be granted to enterprises that meet certain standards for the proportion of recycled rare earths used, thereby creating a policy combination of “positive incentives and negative constraints” that mitigates the unintended negative impact on remanufacturing. Concurrently, a mechanism for dynamic tax rate adjustment could be established. As environmental taxes are gradually increased, this would allow the remanufacturing industry a period of adaptation and room for transformation, thereby avoiding excessive short-term cost shocks that could lead to industry contraction.
(3) Employ a comprehensive range of policy instruments to establish an incentive-compatible governance system for the rare earth supply chain. Our comparative analysis demonstrates that subsidies and environmental taxes operate through fundamentally distinct mechanisms and affect different supply chain actors asymmetrically. Subsidies primarily incentivize downstream recycling activities through direct cost reduction, while environmental taxes constrain upstream primary mining through cost internalization (
Figure 2,
Figure 3,
Figure 4 and
Figure 5). The two policies are complementary in their mechanisms of action and can achieve a more balanced outcome when used in combination than either can achieve alone. We therefore recommend that both policies be incorporated into a unified framework for coordinated consideration, achieving a dynamic balance between ensuring the security of rare earth supply, promoting resource recycling, and maintaining fair market competition. Furthermore, the policy framework could be further refined by integrating tools such as the Extended Producer Responsibility (EPR) system and the recycling target accountability system.
(4) Calibrate policy intensity to market conditions and industrial development stages. Our simulation results demonstrate that the effectiveness of both subsidy and environmental tax policies is contingent upon market conditions. When rare earth prices are high and primary mining is over-expanded, environmental taxes should be prioritized to curb excessive extraction and internalize environmental costs, while subsidies can be temporarily reduced to avoid over-subsidization. When prices are low and recycling activities are economically unviable, subsidy policies should be strengthened to maintain the operation of the recycling system and ensure supply chain security. A dynamic policy adjustment mechanism—based on real-time monitoring of rare earth prices, recycling rates, and primary mining volumes—should be established to enable timely calibration of policy intensity in response to market fluctuations.
(5) Develop differentiated operational strategies for supply chain participants. For rare earth oligopolies, procurement pricing strategies should be adjusted in response to policy changes: under subsidy policies, the purchase price can be strategically reduced to capture a larger share of the subsidy-induced surplus; under environmental tax policies, procurement costs should be anticipated to rise, and primary mining reductions should be planned accordingly. For recyclers, capacity planning and resource allocation between external sales and in-house remanufacturing should be calibrated to the prevailing policy mix—subsidy increases favor expansion of both recycling and remanufacturing, while environmental tax increases shift the optimal allocation toward external sales rather than in-house remanufacturing. A flexible operational strategy that adapts to policy changes will be essential for maximizing profitability under different market conditions.
7.3. Limitations and Future Prospects
This study has certain limitations. Firstly, the model assumes that recyclers are symmetric agents and does not account for heterogeneity in terms of recycling technology, cost structures, and market coverage capacity; future research could expand the analysis by incorporating asymmetric recyclers. To elaborate, potential asymmetric scenarios include: (1) asymmetric recycling costs due to differences in geographical location, transportation distances, and access to scrap sources; (2) asymmetric remanufacturing technologies leading to different extraction rates and production efficiencies; (3) asymmetric market coverage capacities or consumer recognition; and (4) asymmetric responses to policy incentives due to varying firm sizes and financial constraints. Incorporating such asymmetries would yield richer equilibrium outcomes—such as differentiated recycling prices and remanufacturing outputs across recyclers, and potentially altered profit distributions and policy effectiveness—which would further enrich our understanding of competitive dynamics in the rare earth reverse supply chain. Secondly, the policy analysis focuses on two instruments—subsidies and environmental taxes—and does not incorporate the individual or combined effects of other policy instruments such as carbon trading, Extended Producer Responsibility (EPR) schemes, or recycling targets and obligations. Subsequent research could further expand the policy analysis framework. Finally, this study employs numerical simulation methods to validate the theoretical model; in the future, empirical testing could be conducted using enterprise survey data or industry panel data to enhance the real-world explanatory power and policy guidance value of the research conclusions.