Article

Does Corporate Tax Avoidance Encourage Greenwashing?

1
School of Economics, Zhejiang University, Hangzhou 310058, China
2
School of Economics and Management, Zhejiang Sci-Tech University, Hangzhou 310018, China
*
Author to whom correspondence should be addressed.
Sustainability 2026, 18(16), 8212; https://doi.org/10.3390/su18168212
Submission received: 6 July 2026 / Revised: 2 August 2026 / Accepted: 7 August 2026 / Published: 11 August 2026

Abstract

Corporate greenwashing has become a growing concern because it may weaken policy incentives for real emissions reductions and environmental investment. However, it remains unclear whether firms’ financial strategies influence their environmental communication strategies. This paper shows that corporate tax avoidance significantly increases corporate greenwashing, with the effect primarily reflecting symbolic environmental communication rather than improvements in substantive environmental practices. Mechanism tests indicate that tax avoidance facilitates greenwashing by increasing information asymmetry and appointing managers with environmental backgrounds. Further analyses reveal that this effect is more pronounced among firms with higher pre-event levels of greenwashing. Moreover, tax avoidance does not improve substantive environmental performance, providing no evidence for the alternative explanation that tax avoidance reduces greenwashing by increasing internal resources available for environmental investment. These findings provide implications for environmental governance, ESG disclosure regulation, and corporate sustainability management.

1. Introduction

Against the backdrop of intensifying global climate change and increasingly stringent environmental constraints, green development agendas such as carbon neutrality have become central to global public governance. Corporate environmental responsibility is gradually shifting from a voluntary commitment to a dimension of widespread concern under external scrutiny. Under rising environmental pressure, firms often rely on low-cost environmental narratives or symbolic disclosures to shape their eco-friendly image [1], generating rapid market rewards [2,3]. Such greenwashing, however, may undermine environmental policy incentives in constraining genuine emissions reductions and environmental investments, thereby impeding progress toward climate- and sustainability-related SDGs.
Tax avoidance is widespread in developing economies. In China, while outright tax evasion is relatively limited, firms face strong incentives to avoid taxes. Although such behavior increases after-tax cash flows, it simultaneously exposes firms to heightened political, reputational, and agency costs [4,5], creating incentives to manage external perceptions ex post [6]. On the one hand, the internal funds generated by tax avoidance may relax financing constraints and support investment in substantive environmental projects [7]. On the other hand, the opacity associated with tax avoidance reduces the verifiability of corporate disclosures, thereby lowering the cost of symbolic environmental actions and narrative-based reporting as substitutes for real performance [8]. Given its lower cost, greater flexibility, and more immediate feedback, greenwashing offers a more attractive use of tax-related cash savings than investments that require sustained commitment and longer payoff horizons (Appendix A provides an illustrative case showing that tax-related misconduct and environmental disclosure concerns may coexist within the same listed firm).
Existing research examines the determinants of corporate greenwashing and the economic consequences of tax avoidance. However, whether and how tax avoidance, as a strategic financial decision, shapes firms’ greenwashing behavior remains largely unexplored. Studies on greenwashing emphasize the role of external institutional environments. Environmental exposure [9], external governance [10,11], and investors’ environmental preferences [8] may encourage firms to rely on symbolic environmental disclosure rather than substantive environmental investment. Financial constraints [12], managerial attributes [13], and information transparency [14] are also closely related to firms’ greenwashing activities. In contrast, the tax avoidance literature documents its implications for firm value [15,16], financial constraints [17,18], and corporate social responsibility performance [6]. However, little is known about whether tax avoidance affects firms’ environmental disclosure or greenwashing behavior.
Using a panel of Chinese A-share listed firms from 2010 to 2023, this paper employs a two-way fixed-effects framework to investigate the relationship between corporate tax avoidance and greenwashing. The results show that firms with greater tax avoidance exhibit higher levels of greenwashing, with the effect primarily reflecting symbolic environmental communication rather than improvements in substantive environmental practices. Instrumental-variable estimation and system GMM are employed to address potential endogeneity, while the Heckman selection approach is used to account for non-random ESG database coverage. Mechanism analyses reveal that tax avoidance facilitates greenwashing by increasing information asymmetry and appointing managers with environmental backgrounds. Further analysis indicates that the effect of tax avoidance on greenwashing is more pronounced among firms with higher pre-event levels of greenwashing. Moreover, tax avoidance does not improve substantive environmental investment and therefore does not reduce greenwashing through an internal cash flow channel.
This study bridges the corporate tax avoidance and environmental disclosure studies by providing new evidence that tax avoidance increases corporate greenwashing, challenging the implicit view that financial opacity and environmental disclosure strategies operate independently. Second, this paper deepens the understanding of the economic consequences of tax avoidance by distinguishing between substantive environmental performance and symbolic environmental responses. The evidence shows that tax avoidance does not improve substantive environmental performance but increases greenwashing.
The remainder of the paper is organized as follows. Section 2 develops the theoretical hypotheses. Section 3 describes the data, variable construction, and model. Section 4 presents the main empirical results, along with endogeneity tests and robustness checks. Section 5 examines the mechanism analysis. Section 6 discusses additional economic consequences. Section 7 concludes the paper.

2. Institutional Background, Literature Review and Hypothesis Development

2.1. Institutional Background

Corporate environmental responsibility has become increasingly important in China’s transition toward sustainable development. Unlike environmental governance systems primarily relying on market-based mechanisms in many developed economies, China has developed a government-led environmental governance framework in which regulatory authorities play an important role in promoting corporate environmental responsibility. Since the introduction of the ecological civilization strategy, environmental protection has been elevated to a national development priority. China’s commitment to achieving carbon peaking before 2030 and carbon neutrality before 2060 has further strengthened regulatory attention toward corporate environmental behavior. Meanwhile, the establishment of the Central Environmental Inspection system has enhanced the enforcement of environmental regulations by strengthening supervision over local governments and enterprises [19]. Under this government-led environmental governance framework, firms face increasing pressure from regulators, local governments, investors, and society to demonstrate environmental responsibility. However, because substantive environmental improvements often require substantial financial resources and long implementation periods, firms may have incentives to enhance their environmental image through symbolic environmental communication.
Another important institutional feature of China is the rapid development and transition of its ESG disclosure system. Compared with developed markets with relatively mature sustainability reporting frameworks and verification mechanisms, China’s ESG disclosure system has expanded rapidly but remains in a transitional stage. Prior studies document that ESG disclosure in China was historically characterized by considerable heterogeneity and a relatively high degree of managerial discretion in reporting practices, which allowed firms considerable discretion in selecting and presenting sustainability-related information [20]. This transition creates a potential gap between increasing demand for environmental transparency and relatively limited verification mechanisms, thereby providing firms with opportunities to engage in symbolic environmental disclosure [2,14].
Furthermore, China’s evolving information disclosure environment provides an important institutional context for examining corporate greenwashing. As ESG disclosure has become an increasingly important channel through which Chinese firms communicate environmental responsibility, the reliability and comparability of such information have become critical for external stakeholders to evaluate firms’ substantive environmental performance. Compared with traditional financial information with relatively standardized reporting frameworks, ESG information is assessed by multiple rating agencies that adopt different indicator systems, information sources, and weighting methodologies. Previous studies document substantial heterogeneity among ESG ratings of Chinese listed firms. For example, Zhu et al. [21] show that, among Chinese firms covered by seven domestic and international ESG rating agencies, the correlation coefficients between pairwise ESG ratings range from 0.057 to 0.736, with an average correlation coefficient of only 0.411. Moreover, only 35% of firms are simultaneously included in the top 100 rankings of all seven ESG rating agencies. These findings indicate that differences in ESG evaluation methodologies generate inconsistent signals regarding firms’ sustainability performance. Such divergence among ESG assessments may increase information uncertainty and weaken external stakeholders’ ability to accurately distinguish between firms’ substantive environmental practices and symbolic environmental disclosures [21].
The strong environmental legitimacy pressure, an evolving ESG disclosure system, and imperfect information verification mechanisms create an environment in which firms may substitute substantive environmental improvements with symbolic environmental disclosures. Therefore, the Chinese setting provides not only a unique empirical context but also a theoretically meaningful institutional background for understanding the relationship between tax avoidance and greenwashing.

2.2. Literature Review and Hypothesis Development

Corporate tax avoidance represents an important financial strategy through which firms reduce tax payments and retain additional internal resources. Existing literature generally suggests that tax avoidance can generate financial benefits by increasing after-tax cash flows and improving firms’ financial flexibility [15,16]. However, tax avoidance may also generate substantial non-tax costs. Because tax strategies are often difficult for external stakeholders to observe and evaluate, firms engaging in aggressive tax avoidance may face increased political scrutiny and reputational risks [4,5]. In particular, stakeholders may perceive aggressive tax avoidance as inconsistent with broader expectations regarding corporate social responsibility, thereby creating incentives for firms to actively manage their external image [6].
Meanwhile, a growing literature examines the determinants of corporate greenwashing. Greenwashing refers to firms’ attempts to create favorable environmental impressions through symbolic environmental communication without corresponding improvements in substantive environmental performance. Existing studies show that environmental pressures, including regulatory requirements, governmental environmental responsibility, and stakeholder expectations, can increase corporate greenwashing [9,10,11]. When firms face stronger expectations regarding environmental responsibility but substantive environmental improvements are costly, they may strategically rely on environmental disclosure and symbolic actions to maintain legitimacy.
Despite extensive research on the determinants of greenwashing, limited attention has been paid to whether firms’ financial strategies influence their environmental communication choices. Tax avoidance may affect greenwashing because it changes firms’ resource allocation decisions and the trade-off between substantive environmental investment and symbolic environmental communication. Although tax savings generated from avoidance activities may provide additional resources for environmental investment, firms may also choose alternative strategies when environmental improvements require substantial and long-term commitments. Compared with substantive environmental actions, symbolic environmental communication allows firms to respond to external expectations with lower costs and greater flexibility. Therefore, this paper argues that tax avoidance is not merely a financial decision but also a strategic choice that may influence firms’ sustainability-related behaviors. Firms engaging in greater tax avoidance may have stronger incentives to emphasize environmental achievements through disclosure and communication, thereby increasing the divergence between environmental claims and substantive environmental performance. Therefore, this paper proposes the following hypothesis.
Hypothesis 1.
Corporate tax avoidance increases firms’ greenwashing activities.
Opaque information environments weaken external monitoring and increase managerial discretion in corporate decision-making [22]. In the context of corporate sustainability, lower transparency makes it more difficult for stakeholders to distinguish substantive environmental improvements from symbolic environmental communication, allowing firms to exaggerate environmental achievements when their actual performance cannot be effectively verified [9,14].
Tax avoidance activities often involve complex transactions and strategic tax planning, which may increase information asymmetry by making firms’ underlying economic activities more difficult for external stakeholders to understand and evaluate [4,5]. As external stakeholders have limited ability to assess firms’ actual conditions, firms may have greater discretion to selectively emphasize favorable environmental information without making substantive improvements in environmental practices. In other words, increased information asymmetry provides firms with greater opportunities to engage in greenwashing behavior. Therefore, this paper proposes the following hypothesis.
Hypothesis 2.
Corporate tax avoidance increases corporate greenwashing by increasing information asymmetry.
Managerial characteristics, values, and cognitive orientations influence firms’ strategic decisions because executives interpret external pressures and formulate organizational responses based on their experiences and backgrounds [23]. In the context of environmental responsibility, managers with environmental backgrounds may possess greater environmental knowledge and stronger awareness of sustainability-related issues, which can influence firms’ environmental communication strategies and sustainability-related decisions.
Although tax avoidance generates financial benefits, it may also expose firms to reputational concerns and legitimacy pressures from external stakeholders [4,5,6]. To alleviate such concerns, firms may strengthen their environmental governance structures and increase the presence of managers with environmental expertise. These managers can provide firms with specialized knowledge regarding environmental issues and enhance their ability to communicate environmental initiatives to external stakeholders.
However, the presence of managers with environmental backgrounds does not necessarily guarantee that firms’ environmental communication is accompanied by equivalent improvements in substantive environmental performance. Sustainability expertise among managers enhances firms’ capacity to identify, process, and communicate environmental information [24]. When substantive environmental improvements are costly or difficult to verify, firms may strategically use this communication capacity to emphasize favorable environmental information, potentially widening the divergence between environmental communication and substantive environmental performance [2]. Therefore, this paper proposes the following hypothesis.
Hypothesis 3.
Corporate tax avoidance increases corporate greenwashing by encouraging firms to appoint managers with environmental backgrounds.
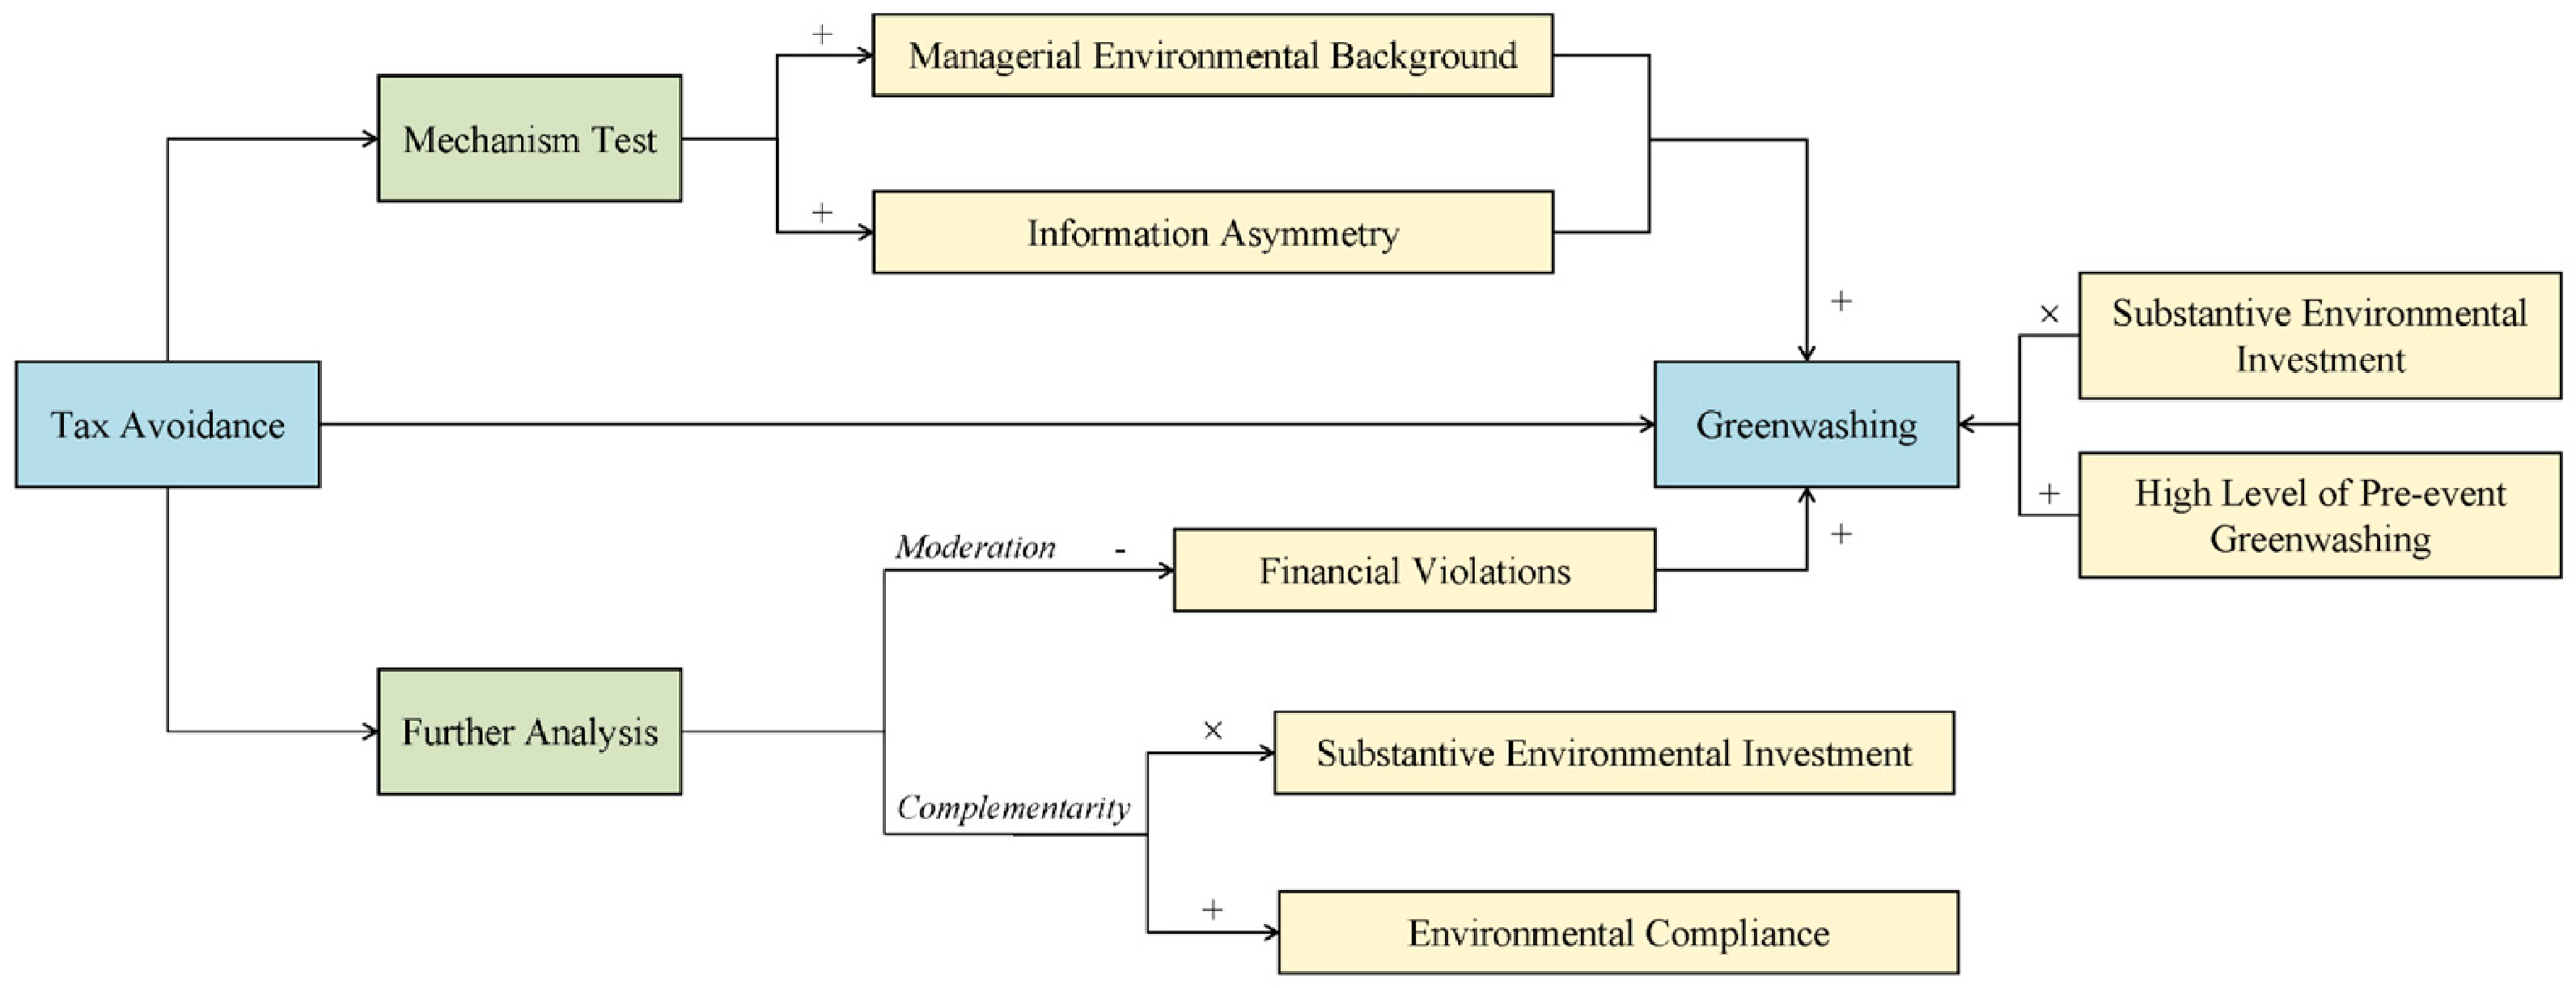
The theoretical framework in this paper is shown in Figure 1.

3. Research Methodology

3.1. Data Sources and Sample Selection

This paper constructs a firm-year panel dataset of Chinese A-share listed firms by integrating information from multiple databases.
The measurement of corporate greenwashing is based on ESG information obtained from the Bloomberg ESG database and the Huazheng ESG dataset accessed through the Wind database. Specifically, this paper obtains firms’ ESG disclosure scores from Bloomberg ESG and ESG performance scores from Huazheng ESG, respectively. Following [25], corporate greenwashing is measured based on the gap between ESG disclosure and ESG performance scores. The textual data used to construct the alternative greenwashing indicator are obtained from the management’s discussion and analysis (MD&A) section of each firm’s annual report, while information on corporate environmental penalties is collected from the China Stock Market and Accounting Research (CSMAR) and the Chinese Research Data Services (CNRDS) database.
The CSMAR database is the primary source of firm-level financial and market information in this study, providing comprehensive data like financial statement information, stock market information, corporate characteristics, and other firm-level attributes. Based on the information obtained from CSMAR, this paper constructs the tax avoidance measures (GAAPETR, CASHETR, and LRate_diff), and calculates the information asymmetry measure (Opaque). In addition, all firm-level control variables and variables used in further analyses are obtained from CSMAR. Managerial environmental background is collected from Sina Finance, while regional cultural characteristics are obtained from the Confucian Culture Database (CFCN) provided by the CNRDS.
The initial sample consists of all nonfinancial A-share listed firms in China from 2010–2023. Following [26], this paper excludes firms in the financial industry because financial firms have substantially different accounting structures and regulatory environments compared with nonfinancial firms. This paper further removes observations with nonpositive pretax income, effective tax rates equal to zero or one, and missing values for key variables. These procedures ensure that the measurement of corporate tax avoidance is economically meaningful and comparable across firms. To mitigate the influence of outliers, all continuous variables are winsorized at the 1% and 99% levels. All datasets are merged at the firm-year level using unique stock identifiers and fiscal years. After applying the sample selection criteria and merging different data sources, the final sample contains 7470 firm-year observations from 843 nonfinancial A-share listed firms.

3.2. Variable Construction

3.2.1. Dependent Variable

Following [2], greenwashing refers to firms’ attempts to create an overly favorable environmental image by selectively communicating positive environmental information while failing to fully reflect their substantive environmental performance. Therefore, greenwashing reflects the potential inconsistency between firms’ environmental communication and environmental actions.
Building on this conceptual framework, the disclosure-performance gap approach is adopted to empirically capture such inconsistency [12,25]. Specifically, environmental disclosure represents firms’ environmental communication, whereas environmental performance reflects their substantive environmental actions. A larger gap between these two dimensions indicates that firms’ environmental communication exceeds their observable environmental performance. Accordingly, GWS in this study is interpreted as a proxy measure of greenwashing rather than a direct measure of intentional deception.
Following [25], this paper measures environmental disclosure using Bloomberg ESG environmental disclosure scores and environmental performance using Huazheng ESG environmental scores accessed through the Wind database. These two datasets capture different dimensions of corporate environmental behavior. Bloomberg ESG disclosure scores mainly reflect the extent and transparency of firms’ environmental information disclosure, whereas Huazheng ESG environmental scores evaluate firms’ environmental practices and environmental risk management across multiple dimensions, including climate change, resource utilization, environmental pollution, environmental friendliness, and environmental management.
Although Huazheng ESG scores are not a pure measure of realized environmental outcomes, they provide a comprehensive assessment of firms’ substantive environmental practices beyond disclosure activities. Therefore, the divergence between Bloomberg disclosure scores and Huazheng environmental scores captures the extent to which firms’ environmental communication exceeds their substantive environmental performance. Detailed comparisons between Bloomberg ESG and Huazheng ESG methodologies are provided in Appendix B.
Based on these two dimensions, a proxy for greenwashing (GWS) is constructed in Equation (1).
G W S i , t = E R d i s   i , t E R ¯ d i s σ d i s E R p e r   i , t E R ¯ p e r σ p e r
where ERdis and ERper represent firm i’s environmental disclosure score and environmental performance score in year t, respectively. E R ¯ dis and E R ¯ per denote the mean environmental disclosure and environmental performance scores, respectively, for firms in industry j and year t. σdis and σper represent the corresponding industry-year standard deviations. A higher GWS indicates that a firm’s environmental disclosure exceeds its relative environmental performance, implying a larger divergence between environmental communication and substantive environmental performance.
This paper also constructs an alternative greenwashing measure following [9]. GW_dum is defined based on the inconsistency between firms’ environmental disclosure behavior and actual environmental outcomes. It equals one when firms exhibit relatively higher environment-related disclosure while simultaneously receiving environmental penalties, and zero otherwise.

3.2.2. Independent Variable

Prior studies commonly use residual book-tax differences (DDBTD) and effective tax rates (ETR) to measure corporate tax avoidance [27,28]. However, these measures capture different dimensions of firms’ tax-related behavior. Book-tax difference-based measures capture the divergence between accounting income and taxable income, but such differences may arise from various sources, including accounting rules, temporary book-tax differences, and earnings management, in addition to tax planning activities [29]. Therefore, the choice of tax avoidance measure should depend on the specific research question and the underlying construct being examined.
This paper focuses on whether firms’ tax burden reduction affects their subsequent greenwashing behavior. Accordingly, effective tax rates are adopted as the primary measure of corporate tax avoidance. This paper uses the GAAP effective tax rate (GAAPETR) as the main proxy because it captures the effective tax burden associated with firms’ reported pretax income and reflects the tax expenses recognized in financial statements [29]. Compared with book-tax difference-based measures, GAAPETR directly reflects firms’ effective tax burden from the perspective of financial reporting, which is consistent with the research objective of examining the economic consequences of firms’ tax-related decisions. This paper defines GAAPETR as total tax expense divided by pretax income. Higher GAAPETR values indicate lower levels of tax avoidance. Following [26], this paper restricts GAAPETR to the [0, 1] interval to ensure economically meaningful variation.
To further examine whether the findings are robust to alternative measures of tax avoidance, this paper employs the cash effective tax rate (CASHETR) and the long-run difference between the statutory tax rate and the actual tax burden (LRate_diff). CASHETR captures firms’ actual cash tax payments and is defined as cash taxes paid divided by pretax income [30]. Similar to GAAPETR, higher CASHETR values indicate weaker tax avoidance. However, because cash taxes paid and pretax income may not correspond to the same economic period due to differences in the timing of tax payments and tax settlements, CASHETR may contain additional measurement noise [30]. Following the long-run measurement perspective of tax avoidance proposed by [28] and the approach adopted by [30], this paper constructs LRate_diff as the five-year average difference between the statutory tax rate and the actual tax burden. A larger value of LRate_diff indicates a greater reduction in firms’ tax burden and, therefore, a higher level of tax avoidance.

3.2.3. Control Variables

This paper controls for firm-level characteristics that may affect greenwashing behavior, thereby enhancing the model’s explanatory power and mitigating potential omitted variable bias. Variable definitions are provided in Table 1.

3.3. Model

To examine the impact of corporate tax avoidance on greenwashing behavior, the following fixed-effects model is constructed:
G W S i , t = β 0 + β 1 G A A P E T R i , t 1 + γ C o n t r o l s i , t 1 + F i r m i + Y e a r t + ε i , t
where GWSi,t denotes firm i’s greenwashing measure in year t, with higher values indicating more greenwashing. GAAPETRi,t−1 captures tax avoidance, where higher values correspond to lower levels of tax avoidance. Controlsi,t−1 is a vector of firm-level control variables. Firmi and Yeart denote firm and year fixed effects, respectively, and εi,t is the error term.
This paper adopts three modeling choices. First, to allow for delayed effects and to mitigate potential endogeneity concerns, this paper lags the tax avoidance measure and all control variables by one period. Second, this paper includes a comprehensive set of firm-level controls and controls for firm- and year-fixed effects to reduce omitted variable bias. Third, standard errors are clustered at the firm level to ensure robust statistical inference.

3.4. Descriptive Statistics

Table 2 reports the descriptive statistics for the main variables used in the empirical analysis. The mean value of GWS is −0.027, with a standard deviation of 1.069, indicating substantial variation in corporate greenwashing behavior across firms. This distribution is comparable to that reported in [12]. The mean value of GAAPETR is 0.204, with a standard deviation of 0.116, suggesting that corporate tax expenses account for approximately 20.4% of pretax income on average. This magnitude is consistent with previous studies [32]. Some variables, such as Growth, TobinQ, and Intang, exhibit relatively higher positive skewness and kurtosis, reflecting the fact that high-growth firms, highly valued firms, and intangible-intensive firms account for only a small proportion of the sample. These distributional patterns are common in firm-level financial data and capture underlying heterogeneity across firms.

3.5. Correlation Analysis and Multicollinearity Test

Before conducting the regression analysis, this paper performs Pearson correlation analysis among the main variables to examine their relationships and potential multicollinearity concerns. As shown in Panel A of Table 3, GAAPETR is significantly negatively correlated with GWS at the 1% significance level, indicating that firms with higher effective tax rates tend to exhibit lower levels of greenwashing. This preliminary evidence is consistent with our main hypothesis.
Furthermore, the correlation results among GWS, ERdis and ERper are shown in Panel B. GWS is significantly positively correlated with ERdis and negatively correlated with ERper, indicating that the greenwashing measure captures the divergence between environmental disclosure and substantive environmental performance. Although ERdis, and ERper are positively correlated, the correlation coefficient is not excessively high, suggesting that they capture different aspects of corporate environmental behavior.
This paper further conducts the variance inflation factor (VIF) test to examine whether multicollinearity exists among the explanatory variables. As reported in Table 4, the mean VIF value is 1.33, well below the commonly used threshold of 10, indicating that multicollinearity is not a serious concern.

4. Empirical Results

4.1. Baseline Results

Table 5 reports the baseline two-way fixed effects estimates from Equation (2). Column (1) presents the specification without control variables. The coefficient on GAAPETR is negative and statistically significant, indicating that greater tax avoidance is associated with higher levels of greenwashing. In Column (2), the regression includes control variables, and the coefficient estimate for GAAPETR remains negative and significant at the 5% level, at −0.309. In economic terms, a one-standard-deviation decrease in GAAPETR is associated with an increase of approximately 0.036 units in GWS, equivalent to about 3.37% of one standard deviation of GWS.
This paper further examines whether the increase in GWS is driven by enhanced environmental disclosure or deteriorated environmental performance. Since GWS is constructed as the difference between environmental disclosure and environmental performance, a higher GWS value may arise from changes in either component. Environmental disclosure (ERdis) and environmental performance (ERper) are separately used as alternative dependent variables, and Equation (2) is re-estimated accordingly.
Columns (3) and (4) present the results. The coefficient of GAAPETR on ERdis in Column (3) is negative and statistically significant at the 1% level, indicating that firms with stronger tax avoidance behavior tend to increase their environmental disclosure. In contrast, Column (4) shows that the coefficient of GAAPETR on ERper is statistically insignificant, suggesting that tax avoidance does not significantly affect firms’ substantive environmental performance. These results indicate that the positive association between tax avoidance and greenwashing is primarily driven by increased environmental disclosure rather than deteriorating environmental performance. Therefore, our findings support the interpretation that tax avoidance encourages firms to engage in symbolic environmental communication and impression management, rather than reducing their substantive environmental performance.

4.2. Endogeneity Discussion

4.2.1. Instrumental Variable Approach

The baseline model may be subject to endogeneity concerns arising from reverse causality and omitted variables. On the one hand, firms’ tax avoidance and greenwashing behaviors may be jointly driven by unobserved managerial preferences or firm-level characteristics. For example, firms with stronger short-term performance incentives or opportunistic managerial motives may simultaneously engage in aggressive tax avoidance and symbolic environmental disclosure to shape external perceptions. On the other hand, regional institutional environments and governance structures may affect both tax avoidance and greenwashing, leading to omitted variable bias.
To mitigate these concerns, this paper employs an instrumental-variable approach based on the interaction between the value-added tax (VAT) reform and the regional distribution of Confucian temples and estimates the model using two-stage least squares (2SLS). The regional distribution of Confucian temples is measured by the number of Confucian temples in each city. The VAT reform provides a plausibly exogenous shock to firms’ tax avoidance incentives by expanding input tax deductions and reducing cascading taxation, thereby affecting corporate tax avoidance behavior [33]. Importantly, the primary objective of the VAT reform was to optimize the structure of indirect taxation rather than to regulate firms’ environmental disclosure or environmental responsibility. Therefore, the reform is unlikely to directly affect firms’ greenwashing behavior through channels other than tax avoidance.
However, the VAT reform mainly varies over time and lacks sufficient cross-sectional heterogeneity to identify differential firm responses. To address this issue, this paper interacts the VAT reform indicator with the number of Confucian temples in each city, which captures cross-regional variation in firms’ exposure to the tax policy shock. The identification relies on the interaction term rather than the direct effect of regional cultural characteristics. The interaction captures heterogeneous tax avoidance responses to the VAT reform across regions with different levels of historical cultural characteristics. Firm fixed effects absorb time-invariant firm and regional characteristics, including persistent differences in local culture, while year fixed effects absorb common national shocks associated with the VAT reform. Therefore, this paper argues that the identifying variation primarily comes from differential firm responses to the VAT reform across regions with different numbers of Confucian temples, rather than from the direct effect of Confucian culture on corporate greenwashing (Supplementary instrumental-variable specification is reported in Appendix C).
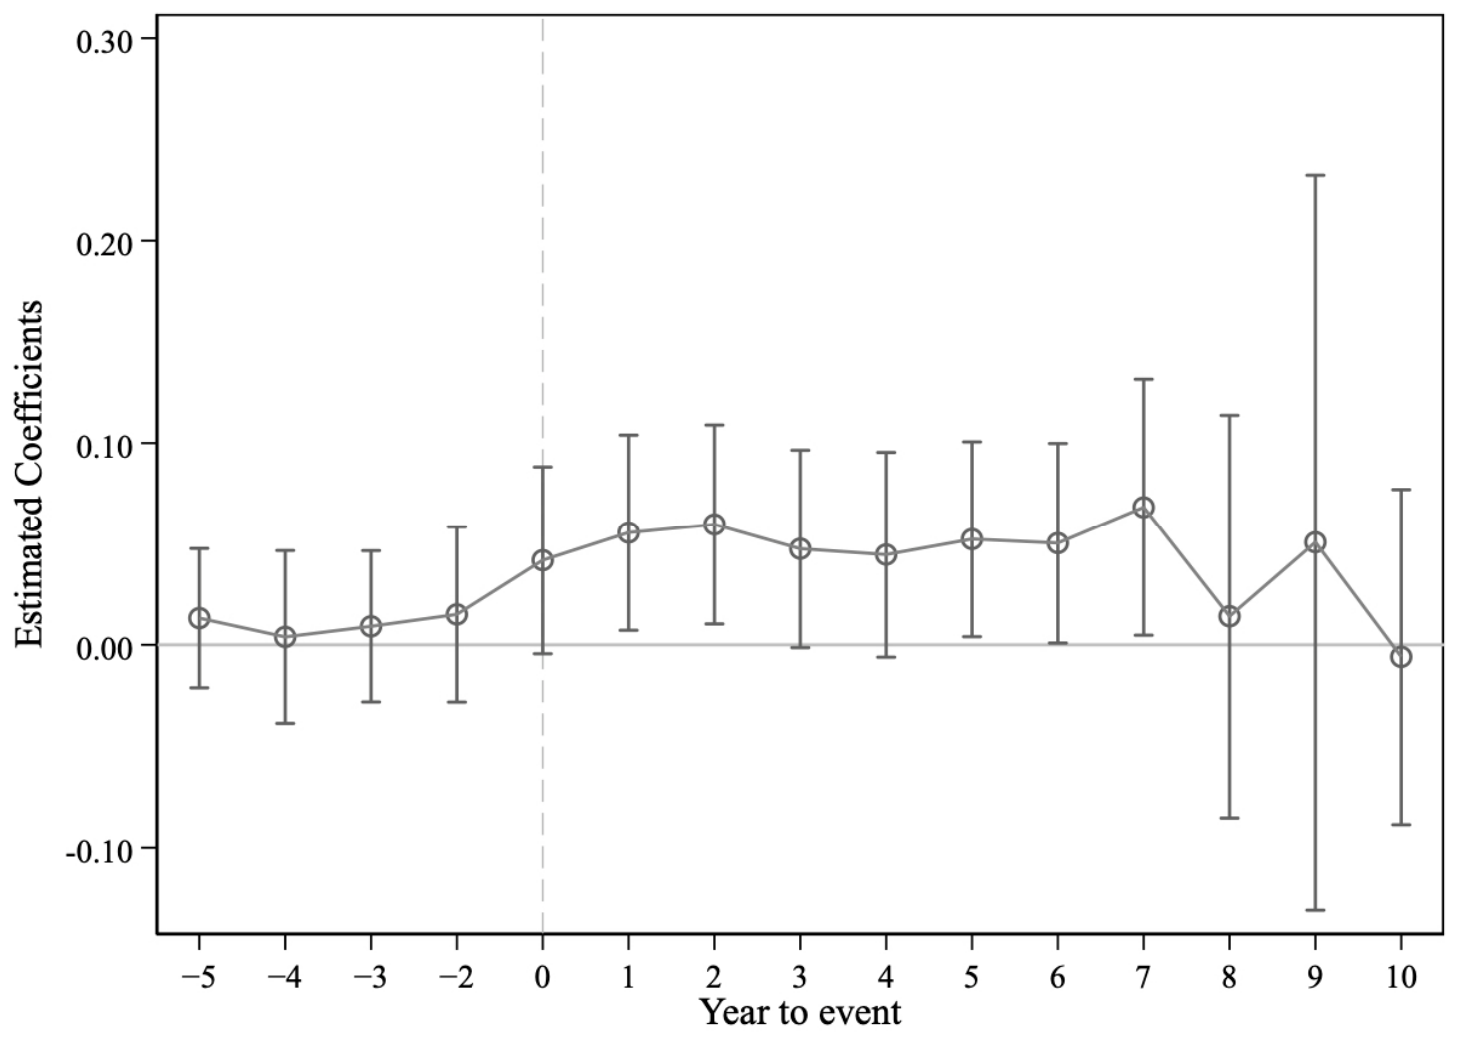
To further examine the validity of the exclusion restriction assumption, this paper conducts a falsification test by investigating whether the number of Confucian temples in each city is associated with corporate greenwashing before the implementation of the VAT reform. If regional Confucian culture directly affects greenwashing behavior through reputation sensitivity, social norms, or other cultural channels, firms located in regions with different numbers of Confucian temples should exhibit systematically different greenwashing behavior even before the policy shock. This paper examines whether the interaction between the number of Confucian temples and the pre-reform period predicts firms’ greenwashing behavior. The results reported in Figure 2 show that the coefficients on the pre-reform interaction terms are statistically insignificant, indicating that there is no evidence of differential pre-reform trends in greenwashing across regions with different numbers of Confucian temples. By contrast, the coefficients from the reform year through seventh years after the VAT reform are positive and statistically significant, indicating stronger responses among firms located in regions with more Confucian temples. This pattern is consistent with the identifying variation arising from heterogeneous firm responses to the VAT reform and provides additional support for the exclusion restriction.
Table 6 reports the instrumental-variable results. Columns (1) and (2) present the results based on the interaction between the VAT reform and the number of Confucian temples in each city as the instrumental variable. The first-stage result is shown in Column (1). The coefficient on the instrument is negative and statistically significant, indicating that firms with greater exposure to the interaction between the VAT reform and regional cultural environment exhibit lower GAAPETR, that is, higher tax avoidance. This first-stage result suggests that the instrument generates meaningful variation in firms’ tax avoidance incentives, rather than implying that regional cultural characteristics directly increase tax avoidance. The second-stage results reported in Column (2) show that the estimated coefficient on GAAPETR remains negative and statistically significant at the 5% level, consistent with the baseline results (The IV estimate is larger in absolute magnitude than the fixed-effects estimate. This difference may arise because the 2SLS estimator relies on policy-induced variation and identifies the effect primarily for firms whose tax avoidance is more responsive to the instrumental variable. In addition, the relatively large standard error indicates that the IV estimate is less precise. Therefore, the IV results are interpreted primarily in terms of the direction and statistical significance of the estimated effect rather than its exact magnitude).
The Kleibergen–Paap (K–P) LM statistic is 11.448, with a p-value below 1%, indicating rejection of the null hypothesis of underidentification. The Kleibergen–Paap (K–P) Wald F statistic is 12.445, which is above the conventional rule-of-thumb threshold of 10, alleviating concerns about weak instruments. These results support the validity of the VAT reform-based instrumental variable strategy and reinforce the robustness of the baseline estimates.

4.2.2. System GMM

A company’s historical greenwashing behavior may influence its subsequent tax-avoidance decisions, potentially biasing the estimated relationship between tax avoidance and greenwashing. To further address this dynamic endogeneity concern, this paper employs the system GMM approach. This paper introduces the lagged dependent variable (L.GWS) into the model to capture the persistence of corporate greenwashing behavior and estimates the dynamic panel model using system GMM.
As reported in Column (1) of Table 7, the coefficient of GAAPETR remains negative and statistically significant after controlling for the dynamic effect of greenwashing. The coefficient of L.GWS is positive and significant, indicating that greenwashing behavior exhibits persistence over time. The AR(1) test is significant, whereas the AR(2) test is insignificant, suggesting that the model does not exhibit second-order serial correlation. In addition, the Hansen test does not reject the null hypothesis of instrument validity. The model contains 89 instruments, which is substantially fewer than the 843 firms in the estimation sample, limiting concerns about instrument proliferation. The Wald test is statistically significant, indicating that the explanatory variables are jointly significant. These results further confirm that the negative relationship between tax avoidance and greenwashing is robust after accounting for potential reverse causality.

4.2.3. Heckman

Although corporate greenwashing is measured based on the difference between ESG disclosure and ESG performance, ESG-related information is not available for all listed firms. The absence of ESG information may not be random, as firms with different characteristics may have different probabilities of being covered by ESG databases, potentially leading to sample selection bias. Therefore, this study employs the Heckman two-step procedure to address this concern.
In the first stage, a selection equation is estimated using a dummy variable GWS_Available, which is defined as one when both the Bloomberg ESG environmental disclosure score and the Huazheng ESG environmental performance score are available for a firm-year observation, and zero otherwise. Based on the first-stage estimation, the inverse Mills ratio (IMR) is calculated and included in the second-stage regression.
Column (2) of Table 7 reports the second-stage outcome equation of the Heckman two-step procedure. The coefficient on IMR is positive and statistically significant, which is consistent with non-random sample inclusion under the assumptions of the Heckman selection model. After accounting for this potential selection process, the coefficient on GAAPETR remains negative and statistically significant. Therefore, the baseline finding is unlikely to be driven solely by the non-random availability of ESG information.

4.3. Robustness Tests

This paper conducts a series of robustness tests, including alternative measures of greenwashing and tax avoidance, sample restrictions, controlling for relevant policy shocks, and alternative fixed effects and clustering methods to ensure baseline results are robust.

4.3.1. Alternative Measures of Greenwashing

Although the baseline measure captures the divergence between environmental disclosure and environmental performance, the measurement of greenwashing may vary depending on the information sources and identification approaches. Therefore, this paper examines whether the main findings remain robust when an alternative greenwashing measure is employed.
Column (1) of Table 8 reports the regression results using this alternative greenwashing measure. The coefficient of GAAPETR remains negative and statistically significant, which is consistent with the baseline findings. This result indicates that the negative relationship between corporate tax avoidance and greenwashing is robust to alternative measurement approaches.

4.3.2. Alternative Measures of Tax Avoidance

The baseline results are based on GAAPETR as the primary measure of corporate tax avoidance. To further examine the robustness of the findings, this paper employs alternative measures of corporate tax avoidance to re-estimates the baseline model.
Columns (2) and (3) of Table 8 report results using CASHETR and LRate_diff as alternative proxies for tax avoidance, respectively. The coefficient on CASHETR is negative, whereas that on LRate_diff is positive. Both coefficients are statistically significant and consistently indicate that greater tax avoidance is associated with higher levels of greenwashing. These results support the robustness of the main conclusions.

4.3.3. Sample Restrictions

To account for potential disruptions caused by the COVID-19 pandemic, this paper excludes observations from 2020 and re-estimates the model. The results are reported in Column (4) of Table 8. In addition, because firms in heavily polluting industries may have stronger incentives to increase corporate greenwashing, this paper excludes these firms and re-runs the analysis, with results shown in Column (5). Both sets of estimates remain consistent with the baseline specification, further supporting the robustness of conclusions.

4.3.4. Controlling for Relevant Policy Shocks

The baseline sample spans from 2010 to 2023. However, this period includes other regulatory changes that may also influence corporate tax avoidance. The Green Financial System Construction Guidelines issued in 2016 may have affected firms’ greenwashing incentives by changing external financing conditions and environmental disclosure pressure, especially for firms in heavily polluting industries [34]. Zhang [12] shows that green financial regulation increases greenwashing among heavily polluting firms by imposing additional financing constraints and reducing their ability to undertake substantive green investment. To account for this policy shock, this paper constructs a dummy variable, GreenFinance, which equals one for heavily polluting firms from 2016 onward and zero otherwise.
Column (6) of Table 8 presents the regression results after controlling for GreenFinance. The coefficient on GAAPETR remains negative and statistically significant, while GreenFinance is not statistically significant, suggesting that the baseline relation between tax avoidance and greenwashing is not driven by the 2016 green financial regulation shock.

4.3.5. Alternative Fixed Effects and Clustering Methods

To further examine whether the baseline findings are sensitive to alternative specifications of fixed effects and inference methods, this paper introduces more stringent fixed effects and alternative clustering approaches.
Columns (1) and (2) of Table 9 replace the baseline year fixed effects with industry-year fixed effects and province-year fixed effects, respectively, to control for time-varying shocks across industries and regions. Columns (3) and (4) retain the baseline fixed-effects structure but cluster standard errors at the industry and province levels, respectively. The coefficient estimates of GAAPETR remain negative and statistically significant across all specifications, suggesting that the negative relationship between tax avoidance and greenwashing is robust to alternative fixed-effects structures and clustering methods.

5. Mechanisms of Tax Avoidance Affecting Greenwashing

5.1. The Role of Information Asymmetry

Firms engaging in stronger tax avoidance activities may rely on more complex transactions and earnings management practices, thereby reducing the transparency of financial reporting and increasing information asymmetry. A more opaque information environment provides managers with greater discretion in corporate disclosure decisions, which may increase the likelihood of symbolic environmental disclosure.
Following [22], this paper uses information asymmetry (Opaque) as a proxy for firms’ information asymmetry. Opaque is measured as the sum of the absolute values of discretionary accruals over the previous three years. Annual discretionary accruals are estimated using the modified Jones model developed by [35]. A higher value of Opaque indicates a higher level of information asymmetry.
Columns (1) and (2) of Table 10 report the estimation results for the information asymmetry mechanism. Column (1) presents the first-step regression results. The coefficient of GAAPETR is significantly negative, indicating that stronger tax avoidance is associated with higher information asymmetry. Column (2) further includes Opaque in the original greenwashing regression model. The coefficient of Opaque is significantly positive, while the effect of GAAPETR on greenwashing remains significant, indicating stronger tax avoidance increases information asymmetry, which subsequently promotes corporate greenwashing. Bootstrap and Sobel tests are conducted to verify the statistical significance of the indirect effects (see Appendix D).

5.2. The Role of Managerial Environmental Background

Managers with environmental expertise may influence firms’ environmental strategies and disclosure decisions. However, the appointment of managers with environmental backgrounds may also reflect firms’ strategic responses to external pressures and reputational concerns.
Following [36], this paper constructs an indicator variable, EGB, which equals one if at least one member of the management team has an environmental background in a given year, and zero otherwise.
Columns (3) and (4) of Table 10 present the estimation results for the managerial environmental background mechanism. Column (3) reports the first-step regression results, showing that the coefficient of GAAPETR is significantly negative, indicating that stronger tax avoidance is associated with firms’ decisions to appoint managers with environmental backgrounds. Column (4) incorporates EGB into the original greenwashing regression model. The coefficient of EGB is significantly positive, and the coefficient of GAAPETR remains significant. This result suggests that stronger tax avoidance increases the firms having managers with environmental backgrounds, which subsequently contributes to corporate greenwashing. Bootstrap and Sobel tests are conducted to verify the statistical significance of the indirect effects (see Appendix D).

6. Discussion and Further Analysis

6.1. Pre-Event Greenwashing Heterogeneity Analysis

Pre-event greenwashing captures firms’ accumulated experience in symbolic environmental communication and reflects the difficulty for external stakeholders to evaluate firms’ substantive environmental performance. Firms with higher baseline greenwashing are more likely to have developed stable symbolic disclosure practices that make their environmental performance more difficult to verify externally. This reduces the marginal cost of further disclosure-based impression-management. Because tax avoidance increases information asymmetry and provides firms with greater discretion in environmental communication, its effect on greenwashing is expected to be stronger among firms with higher pre-event levels of greenwashing. By contrast, firms with lower baseline greenwashing operate in a relatively more transparent information environment and lack established symbolic disclosure strategies, which weakens the marginal effect of tax avoidance on greenwashing.
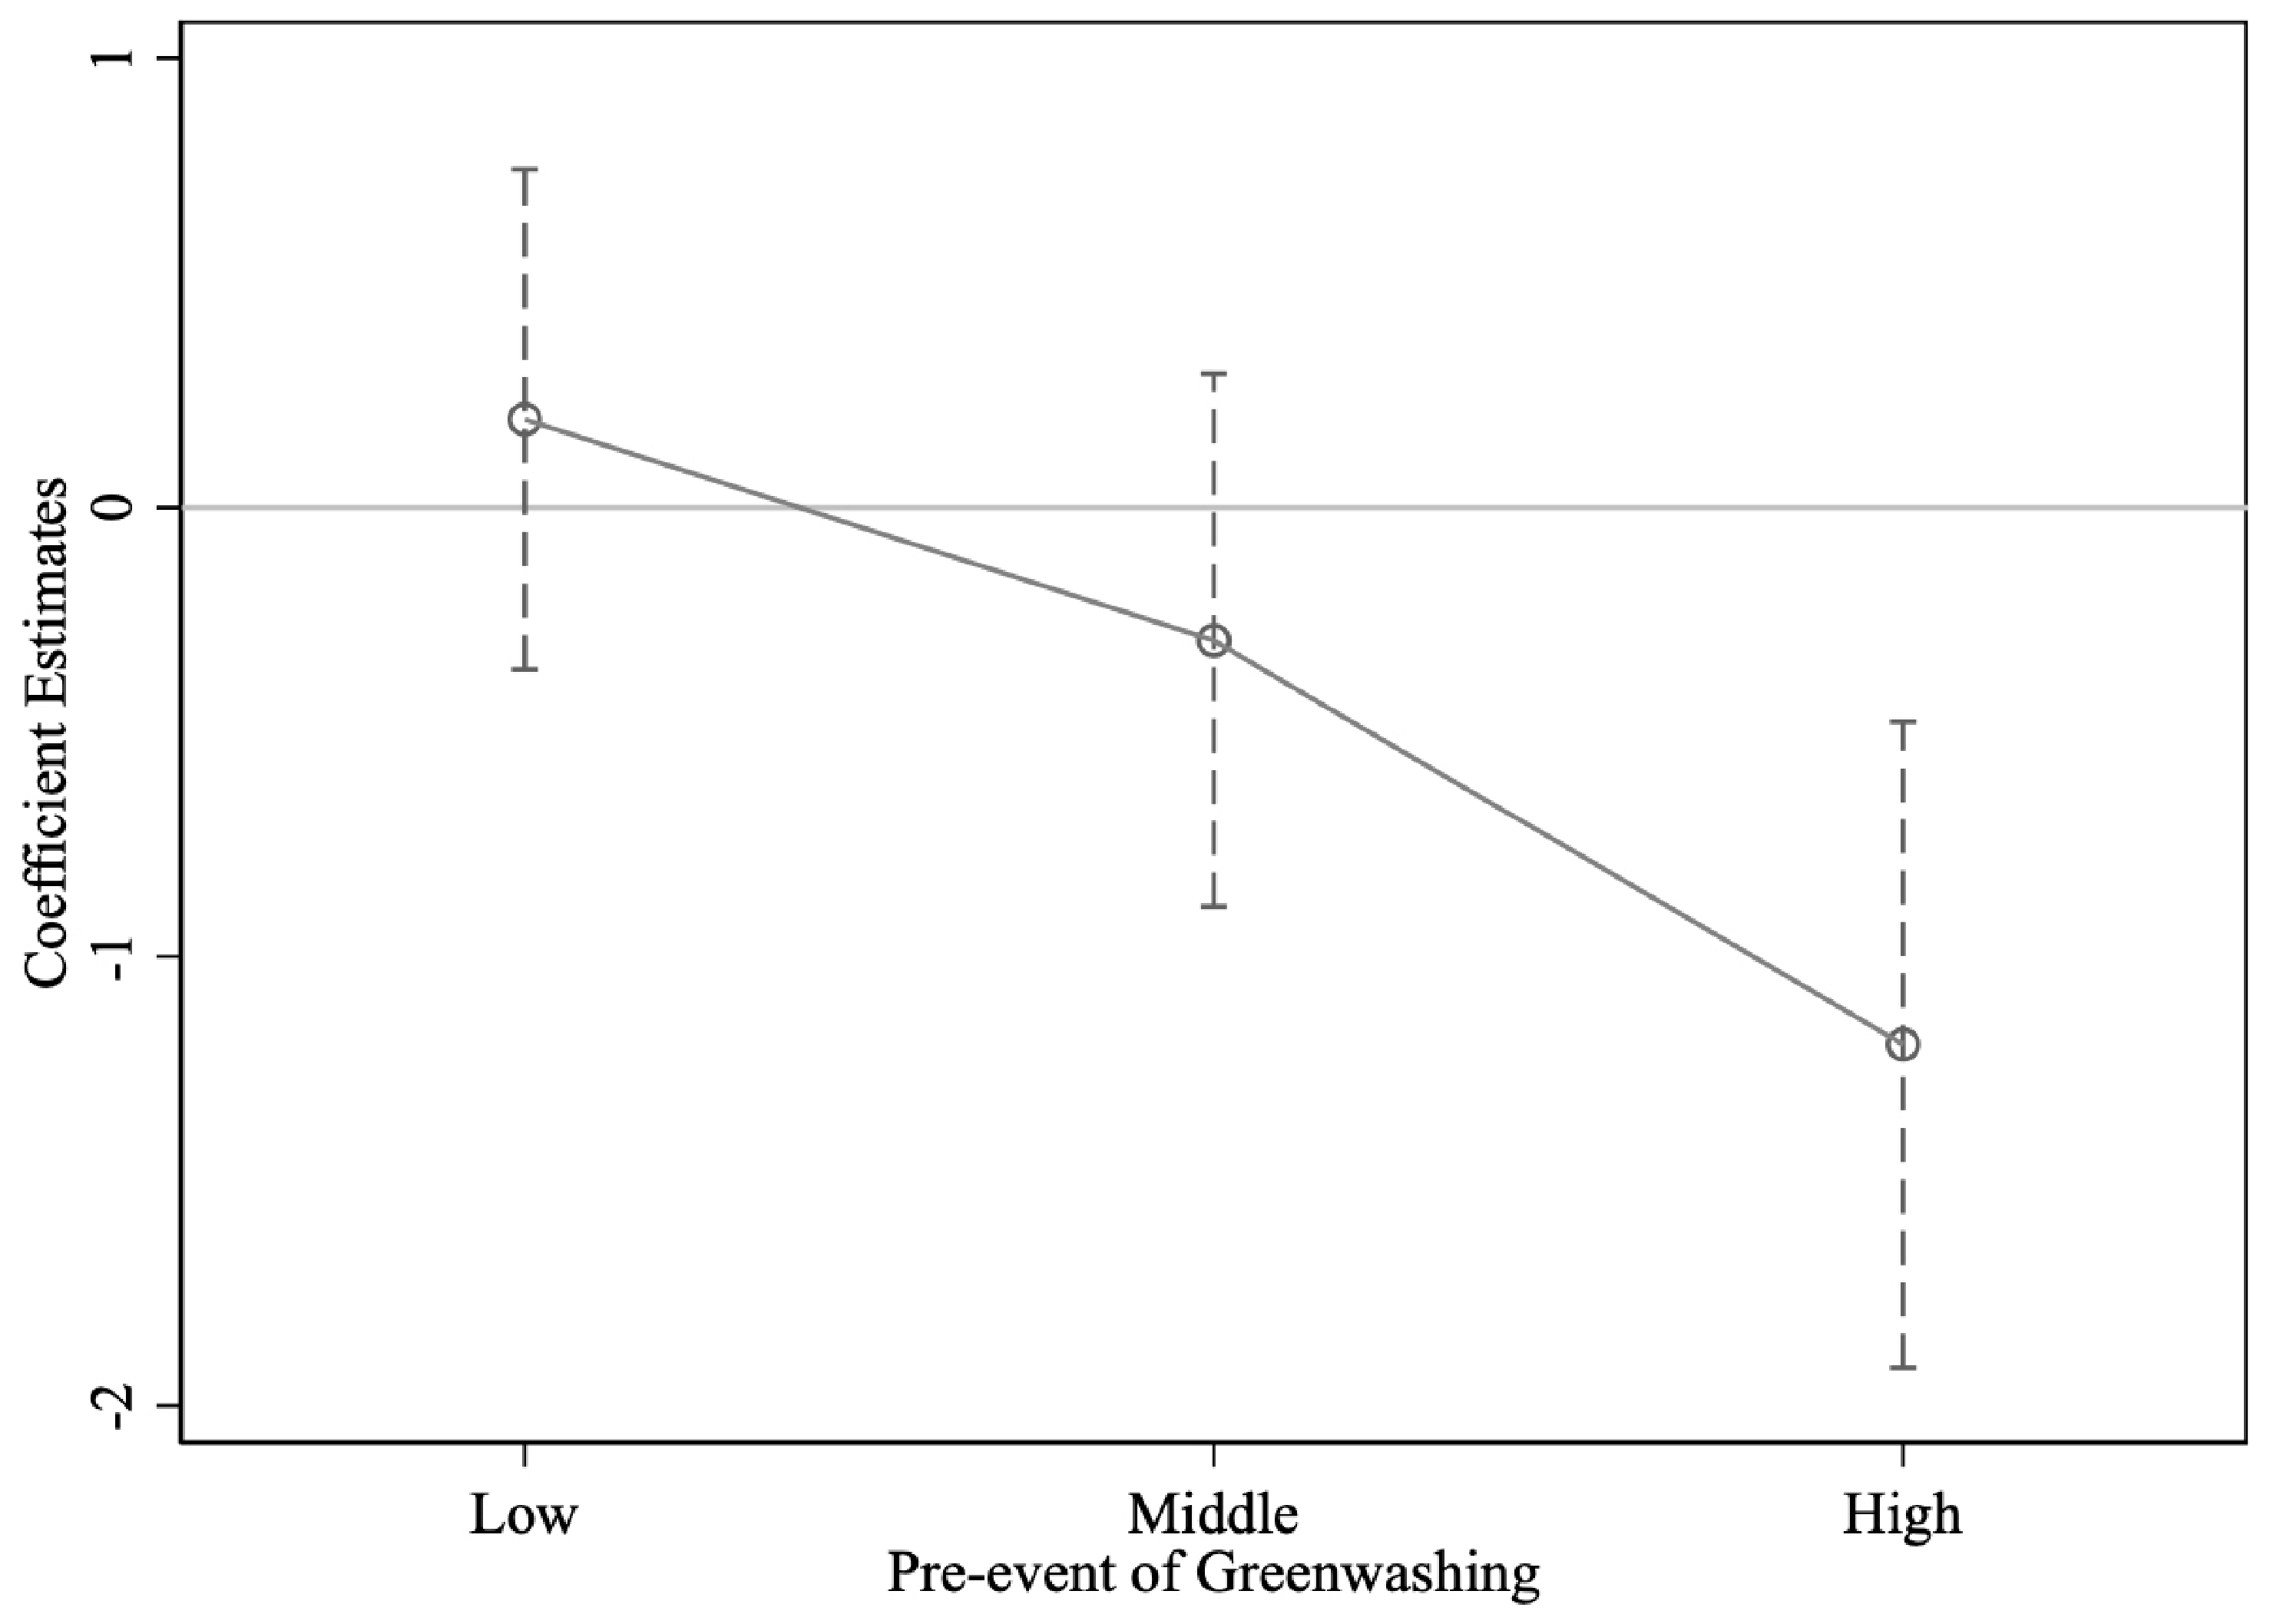
To test this hypothesis, this paper uses firms’ greenwashing measures in the year before the sample period (GWS2009) as a proxy for pre-event greenwashing. This paper classifies firms into Low, Middle, and High groups based on industry terciles. Subsequently, it constructs interaction terms between these three groups and firms’ tax avoidance (GAAPETR) for regression analysis. Figure 3 shows significant heterogeneity across firms with different pre-event levels of greenwashing. The estimated effects for the Low and Middle groups are statistically insignificant, whereas the effect for the High group is negative and statistically significant. These results indicate that tax avoidance has a stronger effect on greenwashing among firms with higher pre-event level of greenwashing.
Although the above analysis shows that the effect of tax avoidance on greenwashing varies across firms with different pre-event levels of greenwashing, firms in the High and non-High groups may have different firm characteristics that could affect both tax avoidance and greenwashing. Therefore, differences in firm characteristics may partly explain the observed heterogeneity. To address this concern, this paper employs entropy balancing to make firms with high and non-high pre-event levels of greenwashing more comparable.
Based on the classification above, firms in the High group are defined as high greenwashing firms (HighGWS = 1), while firms in the Low and Middle groups are combined as non-high greenwashing firms (HighGWS = 0). Entropy balancing is implemented using the firm-level control variables as balancing covariates. The non-high group is reweighted to match the covariate distribution of the High group, and the resulting entropy-balancing weights are subsequently incorporated into the regression analysis.
Column (1) of Table 11 reports the entropy-balanced regression results. After balancing the distribution of control variables between high and non-high pre-event levels of greenwashing firms, the interaction term between GAAPETR and HighGWS remains negative and statistically significant, indicating that the relationship between tax avoidance and greenwashing differs between the High and non-high groups. For firms in the non-high group, the coefficient on GAAPETR is statistically insignificant. Therefore, stronger tax avoidance is significantly associated with greater greenwashing among firms with high pre-event greenwashing. Overall, the findings suggest that the observed heterogeneity is not driven solely by differences in observable firm characteristics.

6.2. The Impact of Tax Avoidance on Substantive Environmental Investments

Col and Patel [6] suggest that corporate tax avoidance can enhance firms’ social responsibility ratings. In the baseline regression, this paper finds that tax avoidance significantly increases greenwashing. However, this paper also investigates whether tax avoidance affects substantive environmental performance, as the cash flow savings from tax avoidance may be directed toward substantive environmental investments rather than solely used to enhance corporate reputation through greenwashing.
Following [37], this paper proxies substantive environmental investment (SEI) using the ratio of substantive environmental investment expenditures to total assets and re-estimates Equation (2). The regression results in Column (2) of Table 11 show that the coefficient on GAAPETR is positive but statistically insignificant, indicating no statistically significant association between tax avoidance and substantive environmental investment. One possible explanation is that firms tend to invest less and retain more of the cash savings generated by tax avoidance, making these funds less likely to be allocated to long-term environmental projects [38]. Moreover, compared to substantive environmental investments, greenwashing is less costly, yields faster results, and requires a lower capital commitment, thereby providing less incentive for managers to allocate tax savings toward substantive environmental investments [12].

6.3. The Impact of Tax Avoidance on Environmental Compliance

This paper next examines whether corporate tax avoidance influences environmental compliance. ISO 14001 certification, based on the international standard for environmental management systems developed by the International Organization for Standardization (ISO), provides firms with a standardized and externally verifiable signal of environmental compliance. In contrast to substantive emissions reduction activities, which require ongoing capital investment and entail uncertain returns, ISO 14001 emphasizes establishing environmental management processes and institutional frameworks. To engage in tax avoidance, firms typically reduce information transparency. To maintain overall compliance without significantly increasing actual environmental costs, firms are more likely to opt for ISO 14001 certification, which is predictable, replicable, and carries third-party endorsement, as a compliance substitute. Thus, this paper hypothesizes that tax avoidance will improve firms’ environmental compliance.
This paper uses ISO 14001 certification status as a proxy for environmental compliance (EC) following [39], and then re-estimates Equation (2). The regression results in Column (3) of Table 11 show that the coefficient on GAAPETR is significantly negative, indicating that tax avoidance is associated with higher levels of environmental compliance.

6.4. The Moderating Role of Financial Violations in the Relationship Between Tax Avoidance and Greenwashing

In the baseline analysis, this paper finds that corporate tax avoidance significantly increases greenwashing. This paper further examines whether prior financial violations moderate this relationship. Firms with a history of financial violations are typically subject to stricter regulatory scrutiny and heightened public attention, making their disclosures more closely monitored by investors and regulators [40]. Reliance on low-cost and narrative-driven greenwashing strategies may be less effective in alleviating external pressure and may instead increase the risk of being perceived as opportunistic. As a result, compared with firms without violations, firms with prior violations may adopt more cautious disclosure strategies following tax avoidance, which weakens the positive association between tax avoidance and greenwashing.
This paper constructs a dummy, Violation, which equals one from the first year in which a firm is involved in financial violations and remains one in all subsequent years, and zero otherwise. The result is reported in Column (4) of Table 11, and the interaction term between GAAPETR and Violation is significantly positive, indicating that the effect of tax avoidance on greenwashing is weakened among firms with prior financial violations. This finding suggests that prior violations intensify external monitoring and reputational concerns, thereby limiting managers’ ability to rely on symbolic environmental disclosure to mask opportunistic behavior.

6.5. Ruling out Substantive Environmental Investment as an Alternative Explanation

Having shown that tax avoidance does not significantly increase substantive environmental investment, this paper further examines whether such investment is associated with lower greenwashing. This paper considers an alternative explanation that tax avoidance may increase discretionary internal cash flows, which could support substantive environmental investment and thereby reduce greenwashing. To examine this possibility, this paper uses substantive environmental investment (SEI) as a proxy for firms’ substantive environmental performance and tests its relationship with greenwashing. The result reported in Column (5) of Table 11 shows that SEI is not significantly associated with greenwashing, suggesting that improvements in substantive environmental performance do not significantly curb symbolic environmental disclosure. This evidence does not support the alternative explanation that substantive environmental investment substitutes for greenwashing.
One possible reason is that substantive environmental investment and symbolic disclosure differ in both nature and timing. Substantive environmental investment is often compliance-driven and shaped by regulatory pressure or pollution control needs. Its implementation and effects are therefore less immediate and may not align with firms’ disclosure responses in the short run. By contrast, symbolic environmental disclosure is less costly and more flexible, allowing firms to respond more quickly to external expectations. As a result, even if tax avoidance relaxes internal cash flow constraints, firms may not allocate these resources primarily to substantive environmental investment and may instead rely on low-cost symbolic actions.

7. Conclusions

7.1. Empirical Results Conclusions

Using a panel of Chinese A-share listed firms from 2010 to 2023, this paper employs a two-way fixed-effects framework to examine the effect of tax avoidance on greenwashing. This paper finds that tax avoidance significantly increases corporate greenwashing, with this effect primarily reflecting firms’ symbolic environmental communication rather than changes in substantive environmental performance. Instrumental-variable estimation and system GMM are employed to address potential endogeneity, while the Heckman selection model is used to examine whether the findings are affected by non-random ESG database coverage. In addition, a series of robustness tests further confirms the reliability of the findings under alternative measures, additional controls, and alternative model specifications. Mechanism analyses show that tax avoidance increases information asymmetry, which facilitates corporate greenwashing. In addition, tax avoidance encourages firms to appoint managers with environmental backgrounds, which further contributes to higher levels of greenwashing. Further analyses show that the association is stronger among firms with higher pre-event levels of greenwashing and weaker among firms subject to prior financial violations. In addition, no significant evidence is found that tax avoidance increases substantive environmental investment, providing no support for the proposed internal-resource channel.

7.2. Contributions

This paper contributes to the literature in several ways. First, it identifies corporate tax avoidance as an economically important determinant of greenwashing and provides new evidence linking firms’ financial reporting strategies to their environmental disclosure behavior. While prior studies document that tax avoidance is associated with higher CSR ratings, they generally do not distinguish between symbolic environmental disclosure and substantive environmental actions. By separating these channels, this paper clarifies how tax avoidance shapes firms’ environmental responses to external pressure. Second, this study extends the literature on the economic consequences of tax avoidance by examining its implications for environmental performance and environmental compliance, thereby providing a broader understanding of how firms allocate resources generated through tax-related activities.

7.3. Policy Implications

The findings of this paper have several policy implications. First, regulatory authorities should strengthen the identification and supervision of firms with potential greenwashing risks. Since firms’ financial strategies may affect their subsequent environmental communication behavior, regulators should pay greater attention to the relationship between corporate financial practices and environmental reporting strategies. In particular, firms with persistent tax avoidance behavior and extensive environmental claims could be subject to enhanced review of the credibility of their ESG-related information and the consistency between their environmental commitments and actual practices.
Second, policymakers should improve the quality and reliability of ESG information systems. Rather than focusing solely on the extent of environmental disclosure, ESG evaluation frameworks should place greater emphasis on the informativeness and comparability of disclosed information. Regulators could further standardize ESG reporting requirements by encouraging firms to provide more quantitative and comparable indicators related to environmental outcomes, while strengthening third-party assurance mechanisms and improving the consistency of ESG rating methodologies.
Third, firms and regulators should strengthen the accountability mechanisms of sustainability governance. The presence of environmentally oriented managers or sustainability-related governance structures should not be regarded as sufficient evidence of genuine environmental commitment. Instead, firms should establish mechanisms that link sustainability responsibilities with measurable environmental outcomes, such as incorporating environmental performance targets into managerial evaluation and improving oversight of ESG-related decisions.

7.4. Limitations and Future Research

Although this study provides new evidence on the relationship between tax avoidance and greenwashing, several limitations remain and warrant further investigation. Following prior studies, greenwashing is measured using the divergence between environmental disclosure and environmental performance based on Bloomberg ESG disclosure scores and Huazheng ESG environmental scores. Although this approach captures the observable inconsistency between firms’ environmental communication and substantive environmental practices, it may not fully capture firms’ underlying intentions or all dimensions of their environmental performance. Future research may further develop alternative measures of greenwashing by incorporating more comprehensive information, such as textual analysis of environmental claims, third-party environmental outcomes, and other institutional indicators.


Author Contributions

Conceptualization, Y.C. and Y.Y.; methodology, Y.C. and Y.Y.; validation, Y.C. and Y.Y.; data curation, Y.C.; writing—original draft preparation, Y.C.; writing—review and editing, Y.C. and Y.Y.; visualization, Y.C. and Y.Y.; supervision, Y.Y.; funding acquisition, Y.Y. All authors have read and agreed to the published version of the manuscript.

Funding

This research was funded by Zhejiang Provincial Soft-Science Research Program, grant number 2026C35076.

Institutional Review Board Statement

Not applicable.

Informed Consent Statement

Not applicable.

Data Availability Statement

Dataset available on request from the corresponding author.

Conflicts of Interest

The authors declare no conflicts of interest.

Abbreviations

The following abbreviations are used in this manuscript:
MD&Athe management’s discussion and analysis
CSMARChina Stock Market and Accounting Research
CNRDSChinese Research Data Services Platform
CFCNConfucian Culture Database
2SLSTwo-stage least squares
VAT reformValue-added tax reform
K–PKleibergen–Paap
ISOInternational Organization for Standardization

Appendix A

In 2015, a subsidiary of Dongjiang Environmental Company Limited (SZ002672) was penalized by the tax authority for using fraudulent value-added tax invoices to claim input tax deductions [41]. In 2018, the company’s Jiangxi Fengcheng project was further sanctioned for environmental violations related to the abnormal operation of pollution control facilities. Around the same time, the stock exchange determined that the company’s clarification announcement contained inaccurate disclosures [42].
This case suggests that tax-related misconduct and environmental disclosure concerns may coexist within the same listed firm. It therefore provides a concrete example of why firms’ tax strategies may be relevant for understanding symbolic environmental disclosure behavior.

Appendix B

Greenwashing is fundamentally characterized by a divergence between firms’ environmental communication and their substantive environmental actions. Following this definition, an appropriate measurement of greenwashing requires distinguishing between what firms disclose to external stakeholders and how firms actually perform in environmental practices. Therefore, this study combines Bloomberg ESG disclosure scores and Huazheng ESG environmental scores to construct a disclosure-performance gap measure for Chinese listed firms.
Bloomberg ESG disclosure scores are appropriate for capturing the environmental communication dimension because Bloomberg evaluates firms’ ESG information based on publicly available corporate disclosures, including annual reports, sustainability reports, and other ESG-related documents. The Bloomberg methodology emphasizes the availability, transparency, and comparability of disclosed ESG information. Therefore, Bloomberg ESG disclosure scores capture the extent to which firms communicate their environmental commitment and activities to external stakeholders, which corresponds to the “talk” dimension of greenwashing.
Huazheng ESG environmental scores are appropriate for capturing the substantive environmental performance dimension in the Chinese institutional context. Unlike disclosure-based measures, Huazheng ESG environmental scores evaluate Chinese listed firms’ environmental behavior through multiple environmental dimensions, including climate change, resource utilization, environmental pollution, environmental friendliness, and environmental management. These dimensions reflect firms’ environmental management practices, environmental risks, and pollution-related performance, providing a broader assessment of firms’ environmental practices beyond the amount of information they disclose.
Importantly, Bloomberg ESG disclosure scores and Huazheng ESG environmental scores are developed under different evaluation frameworks. Bloomberg adopts a materiality-based ESG assessment framework, where environmental issues and indicators are weighted according to their relevance to industry-specific ESG risks and opportunities. In contrast, Huazheng ESG applies its own ESG evaluation framework designed for the Chinese capital market, incorporating China-specific environmental assessment dimensions. Therefore, the two datasets differ in evaluation objectives, indicator systems, weighting mechanisms, and coverage dimensions. These differences allow the disclosure-performance gap to capture the divergence between firms’ environmental communication and environmental practices rather than merely reflecting a common ESG rating component.
The main differences between Bloomberg ESG disclosure scores and Huazheng ESG environmental scores are summarized below.
Table A1. Detailed comparisons between Bloomberg ESG and Huazheng ESG methodologies.
DimensionBloomberg ESG Disclosure ScoresHuazheng ESG Environmental ScoresImplication for Greenwashing Measurement
Primary objectiveEvaluate the extent, transparency, and availability of ESG-related disclosuresEvaluate firms’ environmental practices and environmental management performanceCapture the difference between environmental communication and substantive practices
Conceptual roleEnvironmental “talk”Environmental “walk”Consistent with the conceptual definition of greenwashing
Information basisCorporate-disclosed ESG information from public documentsMulti-dimensional assessment of firms’ environmental behaviorAvoid relying solely on disclosure quantity
Evaluation focusDisclosure scope, transparency, and information accessibilityEnvironmental risks, pollution control, resource utilization, and environmental managementIdentify firms whose communication exceeds environmental practices
Weighting frameworkIndustry-specific materiality-based weightingChina-oriented ESG evaluation framework with multiple environmental dimensionsEnsure the two measures capture distinct aspects of environmental behavior
Application in this studyEnvironmental disclosure score (ERdis)Environmental performance score (ERper)Their divergence forms the greenwashing proxy (GWS)
Note: The ESG disclosure data are obtained from Bloomberg ESG Scores Methodology (December 2025), and the ESG performance data are obtained from Huazheng ESG Ratings Methodology V2.1.

Appendix C

To further examine the robustness of the instrumental-variable results, this paper constructs an alternative instrument using the lagged change in GAAPETR (D_GAAPETR). This instrument exploits the persistence of firms’ tax adjustment behavior over time and provides additional variation in current GAAPETR. The identification assumption is that past changes in GAAPETR affect current greenwashing primarily through their influence on firms’ current tax avoidance behavior, conditional on firm and year fixed effects and control variables.
Columns (1) and (2) of Table A2 present the corresponding IV estimation results. The first-stage estimates indicate that D_GAAPETR is significantly related to GAAPETR, confirming its explanatory power for the endogenous variable. The second-stage coefficient of GAAPETR remains negative and statistically significant, consistent with the baseline findings. The Kleibergen–Paap Wald F statistic exceeds the conventional threshold of 10, suggesting that weak-instrument concerns are limited. Therefore, past changes in GAAPETR mainly affect current greenwashing through their effect on firms’ tax avoidance behavior after controlling for observable firm characteristics and fixed effects.
Table A2. Additional test of instrumental variable approach.
Variables(1)(2)
GAAPETRGWS
First StageSecond Stage
D_GAAPETR0.494 ***
(0.015)
GAAPETR −0.518 **
(0.234)
Size−0.003−0.050
(0.005)(0.067)
Lev0.037 **0.092
(0.018)(0.277)
ROA−0.567 ***0.029
(0.059)(0.711)
Growth0.002−0.000
(0.003)(0.032)
TobinQ0.0010.014
(0.001)(0.020)
PPE−0.0010.455 *
(0.023)(0.270)
Intang0.0370.650
(0.063)(0.611)
Age−0.053−0.204
(0.036)(0.560)
Firm FEYESYES
Year FEYESYES
Observations58155815
K–P LM statistic 187.109 ***
K–P Wald F statistic 1104.227
Note: To alleviate potential reverse causality concerns, GAAPETR and all firm-level control variables are lagged by one period in the corresponding regressions. For notational simplicity, the lag notation is omitted from the variable labels. Standard errors are clustered at the firm level and are reported in parentheses below the coefficient estimates. *, **, and *** denote significance at the 10%, 5%, and 1% levels, respectively.

Appendix D

To further assess the statistical significance of the indirect effects, this paper conducts Bootstrap and Sobel tests. As reported in Appendix D, the indirect effect through Opaque is −0.017, with a 95% percentile bootstrap confidence interval of [−0.036, −0.003]. The indirect effect through EGB is −0.020, with a corresponding confidence interval of [−0.044, −0.003]. Because neither confidence interval includes zero, both indirect effects are statistically significant. The Sobel tests yield consistent conclusions. Moreover, the direct effects of GAAPETR remain statistically significant after the mediators are included, indicating that information opacity and the presence of managers with environmental backgrounds partially mediate the relationship between tax avoidance and greenwashing.
Table A3. Bootstrap and Sobel results.
Panel A: Bootstrap results
EffectCoefficient95% Percentile Bootstrap CI
OpaqueIndirect effect−0.016 **[−0.036, −0.003]
Direct effect−0.298 **[−0.546, −0.036]
EGBIndirect effect−0.020 *[−0.044, −0.003]
Direct effect−0.289 **[−0.525, −0.045]
Panel B: Sobel results
OpaqueEGB
Sobel−0.017 *−0.020 *
Aroian−0.017 *−0.020 *
Bootstrap−0.017 **−0.020 *
Indirect effect−0.017 *−0.020 *
Direct effect−0.298 **−0.289 **
Total effect−0.315 **−0.309 **
Note: The 95% confidence intervals are percentile bootstrap confidence intervals based on 1000 bootstrap replications with firm-level clustering. * and ** denote significance at the 10% and 5% levels, respectively.

References

  1. Zhang, Y.; Yuan, L. In the clash between consumer green values and company green values, who will win? The role of greenwashing and involvement in environmental campaigns on social media. J. Clean. Prod. 2024, 480, 144103. [Google Scholar] [CrossRef]
  2. Lyon, T.P.; Maxwell, J.W. Greenwash: Corporate environmental disclosure under threat of audit. J. Econ. Manag. Strategy 2011, 20, 3–41. [Google Scholar] [CrossRef]
  3. Flammer, C. Corporate green bonds. J. Financ. Econ. 2021, 142, 499–516. [Google Scholar] [CrossRef]
  4. Wilson, R.J. An examination of corporate tax shelter participants. Account. Rev. 2009, 84, 969–999. [Google Scholar] [CrossRef]
  5. Dyreng, S.D.; Hoopes, J.L.; Wilde, J.H. Public pressure and corporate tax behavior. J. Account. Res. 2016, 54, 147–186. [Google Scholar] [CrossRef]
  6. Col, B.; Patel, S. Going to haven? Corporate social responsibility and tax avoidance. J. Bus. Ethics 2019, 154, 1033–1050. [Google Scholar] [CrossRef]
  7. Zhang, Y.-J.; Shi, W. Has China’s carbon emissions trading (CET) policy improved green investment in carbon-intensive enterprises? Comput. Ind. Eng. 2023, 180, 109240. [Google Scholar] [CrossRef]
  8. Cartellier, F.; Tankov, P.; Zerbib, O.D. Can investors curb greenwashing? J. Econ. Dyn. Control 2025, 180, 105195. [Google Scholar] [CrossRef]
  9. Hu, S.; Wang, A.; Du, K. Environmental tax reform and greenwashing: Evidence from Chinese listed companies. Energy Econ. 2023, 124, 106873. [Google Scholar] [CrossRef]
  10. Feng, C.; Wang, Y.; Cheng, X. Local governmental environmental responsibility and corporate greenwashing: Quasi-experimental evidence from China. J. Asian Econ. 2025, 100, 101990. [Google Scholar] [CrossRef]
  11. Jiang, H.; Ning, Z.; Lin, Z. Does local government environmental target affect firms’ greenwashing? Evidence from listed firms in China. J. Asian Econ. 2025, 100, 102023. [Google Scholar] [CrossRef]
  12. Zhang, D. Green financial system regulation shock and greenwashing behaviors: Evidence from Chinese firms. Energy Econ. 2022, 111, 106064. [Google Scholar] [CrossRef]
  13. Zhang, D.; Cheng, Z. Can ancient wisdom curb modern greenwash? CEO overconfidence and the moderating power of China’s three teachings. Financ. Res. Lett. 2025, 86, 108500. [Google Scholar] [CrossRef]
  14. Wu, Y.; Zhang, K.; Xie, J. Bad greenwashing, good greenwashing: Corporate social responsibility and information transparency. Manag. Sci. 2020, 66, 3095–3112. [Google Scholar] [CrossRef]
  15. Goh, B.W.; Lee, J.; Lim, C.Y.; Shevlin, T. The effect of corporate tax avoidance on the cost of equity. Account. Rev. 2016, 91, 1647–1670. [Google Scholar] [CrossRef]
  16. Hasan, M.M.; Lobo, G.J.; Qiu, B. Organizational capital, corporate tax avoidance, and firm value. J. Corp. Financ. 2021, 70, 102050. [Google Scholar] [CrossRef]
  17. Bayar, O.; Huseynov, F.; Sardarli, S. Corporate governance, tax avoidance, and financial constraints. Financ. Manag. 2018, 47, 651–677. [Google Scholar] [CrossRef]
  18. Isin, A.A. Tax avoidance and cost of debt: The case for loan-specific risk mitigation and public debt financing. J. Corp. Financ. 2018, 49, 344–378. [Google Scholar] [CrossRef]
  19. Kou, P.; Han, Y.; Qi, X.Y. The operational mechanism and effectiveness of China’s central environmental protection inspection: Evidence from air pollution. Socio-Econ. Plan. Sci. 2022, 81, 101215. [Google Scholar] [CrossRef]
  20. Liu, M. Quantitative ESG disclosure and divergence of ESG ratings. Front. Psychol. 2022, 13, 936798. [Google Scholar] [CrossRef] [PubMed]
  21. Zhu, Y.F.; Yang, H.L.; Zhong, M. Do ESG ratings of Chinese firms converge or diverge? A comparative analysis based on multiple domestic and international ratings. Sustainability 2023, 15, 12573. [Google Scholar] [CrossRef]
  22. Hutton, A.P.; Marcus, A.J.; Tehranian, H. Opaque financial reports, R2, and crash risk. J. Financ. Econ. 2009, 94, 67–86. [Google Scholar] [CrossRef]
  23. Hambrick, D.C.; Mason, P.A. Upper echelons: The organization as a reflection of its top managers. Acad. Manag. Rev. 1984, 9, 193–206. [Google Scholar] [CrossRef] [PubMed]
  24. Velte, P. Chief sustainability officer expertise, sustainability-related executive compensation and corporate biodiversity disclosure: Empirical evidence for the European capital market. J. Glob. Responsib. 2023, 14, 241–253. [Google Scholar] [CrossRef]
  25. Zhang, D. Does green finance really inhibit extreme hypocritical ESG risk? A greenwashing perspective exploration. Energy Econ. 2023, 121, 106688. [Google Scholar] [CrossRef]
  26. Chen, S.; Chen, X.; Cheng, Q.; Shevlin, T. Are family firms more tax aggressive than non-family firms? J. Financ. Econ. 2010, 95, 41–61. [Google Scholar] [CrossRef]
  27. Desai, M.A.; Dharmapala, D. Corporate tax avoidance and high-powered incentives. J. Financ. Econ. 2006, 79, 145–179. [Google Scholar] [CrossRef]
  28. Dyreng, S.D.; Hanlon, M.; Maydew, E.L. Long-run corporate tax avoidance. Account. Rev. 2008, 83, 61–82. [Google Scholar] [CrossRef]
  29. Hanlon, M.; Heitzman, S. A review of tax research. J. Account. Econ. 2010, 50, 127–178. [Google Scholar] [CrossRef]
  30. Zhang, J.; Wang, N.Z.; Zhu, X.Y.; Yi, X. Does the supply of tax information affect financial restatements? Evidence from the launch of Taxation Administration Information System III in China. Humanit. Soc. Sci. Commun. 2024, 11, 972. [Google Scholar] [CrossRef]
  31. ISO 14001:2026; Your Trusted Standard, Clearer Than Ever. International Organization for Standardization: Geneva, Switzerland, 2026.
  32. Compagnie, V.; Struyfs, K.; Torsin, W. Tax avoidance as an unintended consequence of environmental regulation: Evidence from the EU ETS. J. Corp. Financ. 2023, 82, 102463. [Google Scholar] [CrossRef]
  33. Cheng, C.S.A.; Hsieh, C.-C.; Lin, K.Z. VAT adoption and corporate income tax avoidance. J. Am. Tax. Assoc. 2024, 46, 9–35. [Google Scholar] [CrossRef]
  34. Guidelines for Establishing the Green Financial System. 2016 (PBOC Document No. [2016] 228). Available online: https://www.mee.gov.cn/gkml/hbb/gwy/201611/t20161124_368163.htm (accessed on 25 June 2026).
  35. Dechow, P.M.; Sloan, R.G.; Sweeney, A.P. Detecting earnings management. Account. Rev. 1995, 70, 193–225. [Google Scholar] [CrossRef]
  36. Deng, C.; Peng, W.; Dou, Z.; Zhang, Q. Environmental background directors and ESG performance: A perspective on green governance. Sustainability 2024, 16, 10559. [Google Scholar] [CrossRef]
  37. Zhu, A.; Chen, Q. Is too much green investment a good thing for corporate sustainable development performance? Econ. Anal. Policy 2025, 87, 2164–2182. [Google Scholar] [CrossRef]
  38. Guenther, D.A.; Njoroge, K.; Williams, B.M. Allocation of internal cash flow when firms pay less tax. Account. Rev. 2020, 95, 185–210. [Google Scholar] [CrossRef]
  39. Iatridis, K.; Kesidou, E. What drives substantive versus symbolic implementation of ISO 14001 in a time of economic crisis? Insights from Greek manufacturing companies. J. Bus. Ethics 2018, 148, 859–877. [Google Scholar] [CrossRef]
  40. Amiram, D.; Bozanic, Z.; Cox, J.D.; Dupont, Q.; Karpoff, J.M.; Sloan, R. Financial reporting fraud and other forms of misconduct: A multidisciplinary review of the literature. Rev. Account. Stud. 2018, 23, 732–783. [Google Scholar] [CrossRef]
  41. Dongjiang Environmental Company Limited Announcement (Insider Information: Wholly-Owned Subsidiary Receives Administrative Penalty Decision). Available online: https://www.dongjiang.com.cn/main/files/2025/12/10/543879743857.pdf (accessed on 25 June 2026).
  42. Dongjiang Environmental Company Limited Announcement (No. 2018-49). Available online: https://www.dongjiang.com.cn/main/files/2018/08/30/996442341274.PDF (accessed on 25 June 2026).
Figure 1. Theoretical framework.
Sustainability 18 08212 g001
Figure 2. Pre-reform placebo test for the exclusion restriction. Notes: The period one year before the implementation of the VAT reform is used as the reference period. The vertical axis reports the estimated coefficients on the interaction terms between the number of Confucian temples in each city and the relative years surrounding the VAT reform, while the horizontal axis represents the years relative to the reform implementation. The dashed lines denote 95% confidence intervals based on firm-level clustered standard errors. All pre-reform interaction coefficients are statistically insignificant, whereas the coefficients from the reform year through seventh years after the reform are positive and statistically significant.
Sustainability 18 08212 g002
Figure 3. Pre-event heterogeneity in greenwashing. Notes: GWS2009 is defined as each firm’s greenwashing score in 2009, which serves as the baseline year to minimize the influence of within-sample timing variation. Firms are sorted into industry-specific terciles based on GWS2009, and interaction terms between each tercile indicator and GAAPETR are constructed. The Low group captures the interaction effect for firms in the bottom tercile of baseline greenwashing, while the High group corresponds to firms in the top tercile. The vertical axis reports the estimated coefficients on the interaction terms between GAAPETR and baseline greenwashing. Dashed lines denote 95% confidence intervals computed using firm-level clustered standard errors.
Sustainability 18 08212 g003
Table 1. Variable definitions.
Variable NameDefinition
GWSThe difference between standardized environmental disclosure scores (ERdis) and standardized environmental performance scores (ERper)
ERdisBloomberg ESG environmental disclosure score standardized relative to firms in the same industry and year
ERperHuazheng ESG environmental performance score standardized relative to firms in the same industry and year
GAAPETRTotal tax expense divided by pretax income
SizeThe natural logarithm of total assets
LevTotal liabilities divided by total assets
ROANet income divided by total assets
GrowthThe sales revenue at the end of year t minus the sales revenue at the end of year t − 1, divided by the sales revenue at the end of year t − 1
TobinQMarket capitalization divided by total assets
PPENet value of property, plant, and equipment divided by total assets
IntangNet value of intangible assets divided by total assets
AgeThe natural logarithm of the current year minus the firm’s registration year plus one
VATOne for firm-year observations in which the firm’s industry is included in either the pilot or formal implementation stage of China’s value-added tax reform, otherwise zero
CTThe number of Confucian temples located in the firm’s registered city
GWS_AvailableOne if both the Bloomberg ESG environmental disclosure score and the Huazheng ESG environmental performance score are available for a firm-year observation, and zero otherwise
IMRThe inverse Mills ratio calculated from the first-stage Probit selection equation in the Heckman two-step procedure
GW_dumOne if the frequency of environment-related words in the MD&A section of the firm’s annual report exceeds the industry-year median and the firm receives an environmental penalty in the same year, and zero otherwise.
CASHETRCash taxes paid divided by pretax income
LRate_diffThe five-year average of the difference between the statutory tax rate and the firm’s actual tax rate over the period from year t − 4 to year t
GreenFinanceOne for firm-year observations in which the firm belongs to a heavily polluting industry after the implementation of China’s Green Finance Guidelines in 2016, and zero otherwise
OpaqueThe past three-year sum of the absolute values of discretionary accruals following [22]
EGBOne if at least one member of the firm’s management team is identified as having an environmental background based on environment-related keywords in biographical information, and zero otherwise
GWS2009The pre-event level of greenwashing (GWS in 2009)
HighGWSOne for firms classified into the high pre-event level of greenwashing group based on industry-specific terciles of GWS2009, and zero otherwise
SEISubstantive environmental investment amount divided by total assets
ECOne for firm-year observations in which the firm holds ISO 14001 certification [31], otherwise zero
ViolationOne from the first year in which the firm is involved in a financial violation and thereafter, and zero otherwise
D_GAAPETRThe change in GAAPETR between year t − 2 and year t − 1
Table 2. Descriptive statistics.
Variables(1)(2)(3)(4)(5)(6)(7)
ObservationsMeanSDMinMaxSkewKurt
GWS7470−0.0271.069−2.5613.0630.3393.125
GAAPETR74700.2040.1160.0060.7441.5807.424
Size747023.3091.33619.74026.6080.3352.873
Lev74700.4890.1920.0690.900−0.1762.235
ROA74700.0520.043−0.0380.1941.3254.501
Growth74700.1830.430−0.5933.5914.59933.428
TobinQ74702.0381.4520.84810.7412.91514.085
PPE74700.2390.1830.0010.7250.8262.892
Intang74700.0520.0680.0000.4043.31915.869
Age74702.9920.2992.0793.611−0.6063.361
Note: GAAPETR and all firm-level control variables are lagged by one period in the corresponding regressions. For notational simplicity, the lag notation is omitted from the variable labels. This table reports descriptive statistics for the main variables used in the regressions. Continuous variables are winsorized at the 1% and 99% levels.
Table 3. Correlation Analysis.
Panel A: Correlation analysis of main variables
GWSGAAPETRSizeLevROAGrowthTobinQPPEIntangAge
GWS1.000
GAAPETR−0.034 ***1.000
Size0.072 ***0.135 ***1.000
Lev0.0020.257 ***0.510 ***1.000
ROA0.022 *−0.306 ***−0.198 ***−0.495 ***1.000
Growth0.009−0.049 ***0.0060.064 ***0.133 ***1.000
TobinQ0.032 ***−0.151 ***−0.420 ***−0.410 ***0.475 ***0.056 ***1.000
PPE−0.041 ***0.028 **0.069 ***0.002−0.072 ***−0.047 ***−0.172 ***1.000
Intang0.0120.073 ***0.010−0.049 ***−0.0090.022 *0.118 ***0.0031.000
Age0.023 **0.066 ***0.174 ***0.071 ***−0.105 ***−0.059 ***−0.104 ***−0.077 ***−0.0131.000
Panel B: Correlation analysis of GWS
GWSERdisERper
GWS1.000
ERdis0.567 ***1.000
ERper−0.567 ***0.354 ***1.000
Note: GAAPETR and all firm-level control variables are lagged by one period in the corresponding regressions. For notational simplicity, the lag notation is omitted from the variable labels. This table reports Pearson correlation coefficients among the main variables. *, **, and *** denote significance at the 10%, 5%, and 1% levels, respectively.
Table 4. Multicollinearity Test.
VariablesVIF1/VIF
Lev1.830.55
ROA1.690.59
TobinQ1.580.63
Size1.560.64
GAAPETR1.130.88
Growth1.060.95
PPE1.050.95
Age1.050.95
Intang1.040.96
Mean VIF1.33
Note: GAAPETR and all firm-level control variables are lagged by one period in the corresponding regressions. For notational simplicity, the lag notation is omitted from the variable labels. This table reports the variance inflation factor (VIF) values for the independent variables. A VIF value below 10 indicates that multicollinearity is not a serious concern.
Table 5. Baseline results.
Variables(1)(2)(3)(4)
GWSGWSERdisERper
GAAPETR−0.298 **−0.309 **−0.335 ***−0.027
(0.127)(0.128)(0.099)(0.105)
Size −0.0390.187 ***0.226 ***
(0.050)(0.042)(0.040)
Lev 0.043−0.126−0.169
(0.221)(0.180)(0.166)
ROA −0.100−0.102−0.002
(0.569)(0.430)(0.444)
Growth −0.005−0.023−0.017
(0.023)(0.017)(0.019)
TobinQ 0.0190.026 *0.007
(0.017)(0.014)(0.013)
PPE 0.3450.348 *0.003
(0.236)(0.181)(0.187)
Intang 0.5320.255−0.277
(0.537)(0.439)(0.470)
Age −0.2230.1540.376
(0.438)(0.371)(0.361)
Constant0.0341.448−4.821 ***−6.270 ***
(0.026)(1.726)(1.411)(1.467)
Firm FEYESYESYESYES
Year FEYESYESYESYES
Observations7470747074707470
R-squared0.3900.3910.5930.520
Note: To alleviate potential reverse causality concerns, GAAPETR and all firm-level control variables are lagged by one period in the corresponding regressions. For notational simplicity, the lag notation is omitted from the variable labels. Standard errors are clustered at the firm level in Columns (1)–(4) and are reported in parentheses under the coefficient estimates. *, **, and *** denote significance at the 10%, 5%, and 1% levels, respectively.
Table 6. Instrumental variable approach.
Variables(1)(2)
GAAPETRGWS
First StageSecond Stage
VAT × CT−0.003 ***
(0.001)
GAAPETR −11.747 **
(5.556)
Size0.003−0.002
(0.006)(0.098)
Lev−0.017−0.086
(0.022)(0.404)
ROA−0.804 ***−9.071 **
(0.080)(4.613)
Growth0.0050.093
(0.003)(0.057)
TobinQ0.0020.034
(0.002)(0.027)
PPE0.0050.588
(0.026)(0.439)
Intang0.0901.636
(0.066)(1.052)
Age−0.071 *−0.895
(0.040)(0.809)
Firm FEYESYES
Year FEYESYES
Observations52115211
K–P LM statistic 11.448 ***
K–P Wald F statistic 12.445
Note: To alleviate potential reverse causality concerns, GAAPETR, VAT × CT and all firm-level control variables are lagged by one period in the corresponding regressions. For notational simplicity, the lag notation is omitted from the variable labels. The VAT reform indicator equals one for an industry in the year when the reform is implemented and in all subsequent years, and zero otherwise. Because the reform was fully rolled out across all industries in 2016, the indicator equals one for all industries from 2016 onward. The number of Confucian temples measures the number of Confucian temples located in each city and captures regional variation in historical cultural characteristics. Standard errors are clustered at the firm level and are reported in parentheses below the coefficient estimates. *, **, and *** denote significance at the 10%, 5%, and 1% levels, respectively.
Table 7. System GMM and Heckman.
Variables(1)(2)
GWSGWS
System GMMHeckman Two-Step
GAAPETR−0.432 **−0.386 ***
(0.220)(0.112)
L.GWS0.517 ***
(0.029)
IMR 0.704 ***
(0.105)
Size0.076 **0.327 ***
(0.033)(0.038)
Lev−0.391−0.500 ***
(0.417)(0.106)
ROA−1.1682.049 ***
(0.787)(0.538)
Growth0.013−0.025
(0.035)(0.031)
TobinQ0.0240.074 ***
(0.016)(0.012)
PPE−0.056−0.125 *
(0.088)(0.073)
Intang−0.1110.312
(0.198)(0.199)
Age0.0540.032
(0.064)(0.055)
Constant−1.683 **−8.203 ***
(0.672)(0.957)
Year FEYES
Total Observations584317,426
AR(1) p-value0.000
AR(2) p-value0.389
Hansen J Test p-value0.187
Number of instruments89
Wald Test407.66 ***121.19 ***
Note: To alleviate potential reverse causality concerns, GAAPETR and all firm-level control variables are lagged by one period in the corresponding regressions. For notational simplicity, the lag notation is omitted from the variable labels. The Heckman models are estimated using the full sample before restricting to observations with available GWS data, resulting in a larger sample size than the baseline regressions. *, **, and *** denote significance at the 10%, 5%, and 1% levels, respectively.
Table 8. Robustness tests.
Variables(1)(2)(3)(4)(5)(6)
GW_dumGWSGWSGWSGWSGWS
GAAPETR−0.114 ** −0.242 *−0.312 **−0.309 **
(0.054) (0.139)(0.135)(0.128)
CASHETR −0.241 **
(0.106)
LRate_diff 0.303 **
(0.125)
GreenFinance 0.009
(0.102)
Size0.050 ***−0.071−0.040−0.050−0.029−0.039
(0.017)(0.065)(0.050)(0.051)(0.054)(0.050)
Lev0.003−0.0300.0440.087−0.0080.042
(0.070)(0.295)(0.221)(0.222)(0.242)(0.221)
ROA0.176−0.706−0.102−0.094−0.113−0.101
(0.197)(0.648)(0.570)(0.571)(0.619)(0.570)
Growth0.002−0.032−0.005−0.0030.003−0.005
(0.011)(0.028)(0.023)(0.025)(0.025)(0.023)
TobinQ0.0050.031 *0.0190.0140.0170.019
(0.005)(0.019)(0.017)(0.018)(0.018)(0.017)
PPE0.0690.1560.3440.2710.3620.343
(0.079)(0.280)(0.236)(0.244)(0.268)(0.235)
Intang0.2430.7470.5380.4740.7040.534
(0.224)(0.608)(0.537)(0.541)(0.600)(0.537)
Age−0.047−0.571−0.221−0.134−0.254−0.224
(0.145)(0.525)(0.438)(0.455)(0.451)(0.438)
Constant−0.8093.3101.4021.4181.3351.448
(0.579)(2.078)(1.725)(1.780)(1.818)(1.727)
Firm FEYESYESYESYESYESYES
Year FEYESYESYESYESYESYES
Observations747048627470680767137470
R-squared0.4810.4530.3910.3920.3930.391
Note: To alleviate potential reverse causality concerns, GAAPETR, CASHETR, LRate_diff, GreenFinance and all firm-level control variables are lagged by one period in the corresponding regressions. For notational simplicity, the lag notation is omitted from the variable labels. Standard errors are clustered at the firm level and are reported in parentheses under the coefficient estimates. *, **, and *** denote significance at the 10%, 5%, and 1% levels, respectively.
Table 9. Alternative fixed effects and clustering methods.
Variables(1)(2)(3)(4)
GWSGWSGWSGWS
GAAPETR−0.315 **−0.333 ***−0.309 ***−0.309 **
(0.130)(0.128)(0.093)(0.112)
Size−0.043−0.042−0.039−0.039
(0.052)(0.050)(0.042)(0.069)
Lev−0.0390.0040.0430.043
(0.218)(0.218)(0.181)(0.291)
ROA−0.053−0.037−0.100−0.100
(0.579)(0.571)(0.369)(0.507)
Growth−0.001−0.007−0.005−0.005
(0.023)(0.023)(0.017)(0.028)
TobinQ0.0180.0170.0190.019
(0.018)(0.017)(0.015)(0.016)
PPE0.455 *0.392 *0.3450.345
(0.232)(0.233)(0.216)(0.322)
Intang0.5430.6220.5320.532
(0.538)(0.537)(0.466)(0.647)
Age−0.258−0.230−0.223−0.223
(0.443)(0.439)(0.405)(0.272)
Constant1.6661.5411.4481.448
(1.766)(1.735)(1.449)(1.575)
Firm FEYESYESYESYES
Industry × Year FEYESNONONO
Province × Year FENOYESNONO
Year FENONOYESYES
Observations7466747074707470
R-squared0.3990.3950.3910.391
Note: To alleviate potential reverse causality concerns, GAAPETR and all firm-level control variables are lagged by one period in the corresponding regressions. For notational simplicity, the lag notation is omitted from the variable labels. Standard errors are clustered at the firm level in Columns (1) and (2) and are reported in parentheses under the coefficient estimates. Standard errors are clustered at the industry and province levels, respectively, in Columns (3) and (4), and are reported in parentheses under the coefficient estimates. *, **, and *** denote significance at the 10%, 5%, and 1% levels, respectively.
Table 10. Mechanism analysis.
Variables(1)(2)(3)(4)
OpaqueGWSEGBGWS
GAAPETR−0.053 ***−0.298 **−0.132 ***−0.289 **
(0.020)(0.130)(0.048)(0.128)
Opaque 0.316 ***
(0.099)
EGB 0.152 ***
(0.057)
Size0.012−0.0270.014−0.041
(0.011)(0.051)(0.021)(0.049)
Lev0.071 **0.0000.0210.039
(0.034)(0.224)(0.068)(0.221)
ROA0.432 ***−0.1320.083−0.113
(0.096)(0.571)(0.196)(0.572)
Growth−0.016 **−0.008−0.001−0.005
(0.006)(0.024)(0.009)(0.023)
TobinQ−0.0050.0220.0010.019
(0.004)(0.018)(0.005)(0.017)
PPE−0.159 ***0.3900.0320.340
(0.045)(0.240)(0.100)(0.234)
Intang0.0370.7480.2930.487
(0.086)(0.541)(0.235)(0.535)
Age0.261 ***−0.301−0.198−0.192
(0.075)(0.460)(0.165)(0.437)
Constant−0.881 ***1.3410.5341.367
(0.326)(1.834)(0.721)(1.712)
Firm FEYESYESYESYES
Year FEYESYESYESYES
Observations7247724774707470
R-squared0.4390.3920.7000.392
Note: To alleviate potential reverse causality concerns, GAAPETR, Opaque, EGB, and all firm-level control variables are lagged by one period in the corresponding regressions. For notational simplicity, the lag notation is omitted from the variable labels. The sample size is smaller than in the baseline regressions because Opaque is not available for all firm-year observations. Standard errors are clustered at the firm level and are reported in parentheses under the coefficient estimates. ** and *** denote significance at the 5% and 1% levels, respectively.
Table 11. Further analysis.
Variables(1)(2)(3)(4)(5)
GWSSEIECGWSGWS
GAAPETR0.0410.161−0.115 **−0.309 *
(0.252)(0.185)(0.052)(0.181)
GAAPETR × HighGWS−1.077 **
(0.429)
GAAPETR × Violation 1.045 **
(0.451)
Violation −0.379 ***
(0.144)
L.SEI 0.010
(0.015)
Size−0.0650.058 *0.005−0.051−0.041
(0.105)(0.030)(0.017)(0.067)(0.050)
Lev0.1460.028−0.0010.1020.031
(0.375)(0.157)(0.067)(0.277)(0.222)
ROA1.291−0.044−0.329 *0.2810.166
(1.035)(0.235)(0.191)(0.669)(0.560)
Growth−0.007−0.045−0.0060.000−0.005
(0.058)(0.036)(0.009)(0.032)(0.023)
TobinQ0.026−0.0100.0040.0130.019
(0.025)(0.008)(0.005)(0.020)(0.017)
PPE0.574−0.1760.0030.470 *0.341
(0.455)(0.196)(0.082)(0.269)(0.237)
Intang0.431−0.076−0.1890.6410.510
(0.983)(0.493)(0.195)(0.608)(0.541)
Age0.4460.1950.068−0.167−0.205
(0.646)(0.183)(0.132)(0.559)(0.439)
Constant0.048−1.753 *−0.0181.5271.368
(3.063)(0.991)(0.579)(2.269)(1.725)
Firm FEYESYESYESYESYES
Year FEYESYESYESYESYES
Observations38657470747058157470
R-squared0.3850.5900.5150.4420.390
Note: To alleviate potential reverse causality concerns, GAAPETR, Violation and all firm-level control variables are lagged by one period in the corresponding regressions. For notational simplicity, the lag notation is omitted from the variable labels. Column (1) reports the entropy-balancing weighted regression results. The sample size is smaller than that in the baseline regressions because some firms do not have available GWS data in 2009 and therefore cannot be classified into high and non-high pre-event greenwashing groups. Standard errors are clustered at the firm level and are reported in parentheses under the coefficient estimates. *, **, and *** denote significance at the 10%, 5%, and 1% levels, respectively.
Disclaimer/Publisher’s Note: The statements, opinions and data contained in all publications are solely those of the individual author(s) and contributor(s) and not of MDPI and/or the editor(s). MDPI and/or the editor(s) disclaim responsibility for any injury to people or property resulting from any ideas, methods, instructions or products referred to in the content.