Article

Human Capital Sustainability Leadership and Employee Job Performance in Public Asset Management: The Mediating Role of Innovative Work Behavior Among Indonesian Civil Servants

Faculty of Economics and Business, Universitas Mercu Buana, Jakarta 11650, Indonesia
*
Author to whom correspondence should be addressed.
Sustainability 2026, 18(16), 8115; https://doi.org/10.3390/su18168115
Submission received: 10 May 2026 / Revised: 8 July 2026 / Accepted: 21 July 2026 / Published: 9 August 2026

Abstract

Public sector organizations face mounting pressure to improve employee performance while pursuing sustainable management practices, yet evidence on how sustainability-oriented leadership relates to tangible performance outcomes remains scarce, particularly in regional government settings. Grounded in Self-Determination Theory, this study examines the association of Human Capital Sustainability Leadership (HCSL) with Employee Job Performance (EJP) and the mediating role of Innovative Work Behavior (IWB) among Indonesian civil servants managing regional government assets (Barang Milik Daerah). Survey data were collected from 541 civil servants across the DKI Jakarta Provincial Government using validated multi-item scales and analyzed with Partial Least Squares Structural Equation Modeling (PLS-SEM). HCSL was positively associated with IWB (β = 0.834, p < 0.001) and EJP (β = 0.438, p < 0.001), and IWB was positively associated with EJP (β = 0.383, p < 0.001). Bootstrap analysis indicated a complementary partial mediation of the HCSL–EJP relationship through IWB (β = 0.319, 95% CI [0.194, 0.440]). The model accounted for 61.9% of the variance in EJP and 69.5% in IWB, though the cross-sectional, single-source design and very high construct reliabilities mean these estimates should be read as upper bounds. The findings suggest that sustainable leadership development may be one credible lever for supporting innovation and performance in public asset stewardship, with implications for sustainable governance and human capital development.

1. Introduction

The pursuit of sustainable development has fundamentally reshaped expectations placed on public sector organizations, which are now called upon not only to deliver efficient services but also to model responsible stewardship of human, financial, and physical resources [1,2]. Within this evolving paradigm, the management of public assets has emerged as a critical domain where sustainability principles intersect with organizational performance imperatives. In Indonesia, regional government assets—locally termed Barang Milik Daerah (BMD)—constitute a substantial portion of national wealth, and their effective stewardship hinges on the performance of civil servants tasked with their administration [3,4].
Despite extensive scholarly attention to private-sector leadership, knowledge about how sustainability-oriented leadership shapes performance among public servants remains limited [5,6]. The concept of Human Capital Sustainability Leadership (HCSL), introduced by Di Fabio and Peiró [7], offers a promising framework that integrates ethical, mindful, sustainability-conscious, and well-being-promoting leadership behaviors. HCSL conceptualizes leadership as a long-term investment in human capital that aligns individual development with broader sustainability goals—a framing particularly resonant for public sector contexts where institutional continuity and intergenerational responsibility are paramount [8,9].
While HCSL has been theoretically positioned as a driver of employee outcomes, empirical evidence linking it to concrete performance indicators in public sector settings is scarce. Moreover, the mechanisms through which HCSL exerts its effects remain underexplored. Innovative Work Behavior (IWB)—encompassing idea exploration, generation, championing, and implementation [10]—represents a plausible mediating pathway, given that sustainable leadership theoretically nurtures the autonomy, competence, and relatedness needs that fuel innovation [11,12]. Yet, empirical evidence on this mediating role in compliance-intensive public sector environments has been mixed [13,14].
This study addresses these gaps by examining the relationship between HCSL and Employee Job Performance (EJP) among Indonesian civil servants engaged in regional asset management, with IWB as a mediating mechanism. Grounded in Self-Determination Theory (SDT) [15,16], we hypothesize that HCSL fosters psychological need satisfaction that energizes both proximal innovative behaviors and distal performance outcomes. Drawing on survey data from 541 civil servants in the DKI Jakarta Provincial Government, we employ Partial Least Squares Structural Equation Modeling (PLS-SEM) to test direct and indirect effects.
The contribution of this study is empirical and contextual rather than a claim to novelty in the leadership–innovation–performance structure, which is well established. First, we provide context-specific evidence on Human Capital Sustainability Leadership in a setting organizational research has rarely examined—civil servants responsible for the stewardship of regional government assets—thereby testing whether a construct developed largely in Western, private-sector contexts behaves as theorized within a compliance-intensive public bureaucracy. Second, rather than treating the “innovation–performance paradox” as something this study resolves, we use the public-asset-management context to specify boundary conditions under which innovative behavior is more or less likely to translate into measured performance, offering evidence that speaks to—without claiming to settle—the longstanding debate about innovation in rule-bound bureaucracies. Third, we clarify the relative magnitude of the direct and innovation-mediated pathways from sustainability-oriented leadership to performance in this context, information directly useful for the design of leadership-development and asset-management practices. We are explicit that these contributions are bounded by a single cross-sectional, single-jurisdiction, self-report design (Section 5.9), and we calibrate our claims accordingly.

2. Theoretical Background and Hypothesis Development

2.1. Self-Determination Theory as Theoretical Foundation

Self-Determination Theory (SDT) [15,16] provides the overarching theoretical lens for this study. SDT posits that human motivation and well-being are nourished by the satisfaction of three basic psychological needs: autonomy (the feeling of volition and choice), competence (the experience of mastery and effectiveness), and relatedness (the sense of meaningful connection with others) [17]. In organizational contexts, leadership behaviors that satisfy these needs are theorized to foster autonomous motivation, which in turn drives engagement, creativity, and sustained performance [18,19].
SDT has gained particular relevance for sustainability research because the three psychological needs align closely with the long-term human flourishing that sustainability paradigms emphasize [20]. When leaders behave in ways that respect employees’ agency, build their competencies, and cultivate supportive relationships, they not only improve immediate outcomes but also build the human-capital reservoir needed for sustained organizational vitality [11]. Two points about the role of SDT in this study should be explicit at the outset. First, HCSL is not merely compatible with SDT but can be read as an operationalization of need-supportive leadership: its mindful dimension corresponds to autonomy support, its sustainable dimension to competence development, and its ethical and servant dimensions to relatedness. Second, SDT functions here as the explanatory lens for why HCSL should relate to innovation and performance, rather than as a mechanism this study tests directly—the satisfaction of the three psychological needs is the theorized intervening state but was not measured, and we treat it as such throughout (Section 5.9).

2.2. Human Capital Sustainability Leadership (HCSL)

HCSL is conceptualized as a higher-order leadership construct integrating four dimensions: ethical leadership, mindful leadership, sustainable leadership, and servant leadership [7]. Together, these dimensions articulate a leadership style oriented toward the long-term flourishing of employees and the organization, balancing performance imperatives with concern for well-being, ethics, and sustainability [21]. Unlike transactional or task-focused leadership styles, HCSL emphasizes leaders’ role as stewards of human capital who invest in employees’ growth, integrity, and purpose [22].
Recent scholarship has examined HCSL’s influence on outcomes such as work engagement, well-being, organizational citizenship, and adaptive performance [11,23,24]. However, empirical work on HCSL in public sector settings—especially in emerging economies—remains nascent. The Indonesian public sector, governed by recent reforms emphasizing the BerAKHLAK core values and the Aparatur Sipil Negara (ASN) framework [25], provides a fertile context for examining how sustainability-oriented leadership operates within reformed bureaucratic structures.
Positioning HCSL among adjacent leadership constructs clarifies both its distinctiveness and its conceptual risks. Sustainability- and ethics-oriented leadership is a crowded field: responsible leadership emphasizes the leader’s accountability to a broad set of stakeholders [26]; ethical leadership, as a standalone construct, centers on normatively appropriate conduct and its social-learning transmission to followers [27]; and sustainability- or environmentally specific transformational leadership extends classic transformational behaviors toward ecological and long-horizon goals [28]. HCSL overlaps with each—it shares ethical leadership’s integrity emphasis, responsible leadership’s stakeholder horizon, and transformational leadership’s developmental orientation—yet is distinctive in integrating these strands explicitly around the sustainable development of human capital and in being grounded in the motivational logic of SDT [7,11]. This conceptual proximity is also a measurement caution: because HCSL absorbs behaviors that adjacent constructs treat separately, its dimensions can correlate highly with one another and with proximal outcomes such as innovation—a point we revisit when interpreting discriminant validity and the HCSL–IWB path (Section 4.2.3 and Section 5).

2.3. Innovative Work Behavior (IWB)

IWB refers to the intentional generation, promotion, and implementation of new ideas within a work role [10,29]. It is a multifaceted construct encompassing creative ideation as well as the political and behavioral skills needed to translate ideas into practice. In public sector contexts, IWB is increasingly recognized as essential for adapting to complex challenges, improving service delivery, and embracing digital transformation [30,31].
However, public sector innovation faces structural constraints—procedural rigidity, accountability mechanisms, and risk-averse cultures—that can dampen the translation of innovative ideas into performance outcomes [32,33]. Effective public sector innovation thus depends critically on leadership that creates psychological safety and licenses experimentation [34]. SDT-informed leadership behaviors that satisfy autonomy and competence needs are particularly relevant here, as autonomy supports the exploratory thinking foundational to ideation, while competence support builds the confidence needed to advocate for and implement novel solutions [35].
The relationship between innovation and performance in the public sector is conditional rather than uniform, and the “innovation–performance paradox” is best understood through its boundary conditions. A substantial literature documents that bureaucratic rigidity, accountability pressures, and risk aversion can decouple innovative effort from rewarded performance [14,31], while public service motivation can sustain innovative effort even where formal incentives are weak [36]. Two boundary conditions are especially relevant to regional asset management. First, the type of innovation matters: incremental, process-oriented innovations that improve the speed, accuracy, and traceability of asset administration—digitalized inventory, refined standard operating procedures, integrated reporting—are compliance-reinforcing rather than compliance-threatening, and are therefore more likely to be recognized as performance. Second, the institutional reform context matters: the BerAKHLAK reform agenda and the ASN framework explicitly legitimize adaptiveness and collaboration as expected civil-service conduct [25], lowering the perceived risk of departing from routine and creating conditions under which innovation can be converted into rated performance. These conditions specify when, in this setting, the IWB–EJP link is likely to hold, and they frame the interpretation of H2.

2.4. Employee Job Performance (EJP)

EJP represents employees’ contribution to organizational goals through their job-related actions and outputs [37]. In contemporary scholarship, EJP is conceptualized as multidimensional, encompassing task performance (executing core duties), contextual performance (extra-role behaviors that support the social and organizational environment), and adaptive performance (adjusting to change) [38]. The Individual Work Performance Questionnaire (IWPQ) developed by Koopmans et al. [38] operationalizes this multidimensional view and has been widely validated across sectors.
In public asset management, EJP carries distinct sustainability implications. Civil servants tasked with safeguarding public resources contribute to fiscal sustainability through accurate asset valuation, prudent maintenance, transparent reporting, and effective utilization [3]. Their performance therefore extends beyond individual productivity to encompass stewardship of intergenerational public wealth.
Framing this study within sustainability is therefore substantive rather than nominal. The stewardship of regional government assets is itself a sustainability problem in the resource-governance sense: it concerns the efficient, accountable, and long-horizon management of publicly owned resources whose mismanagement imposes intergenerational fiscal and service costs [39,40]. HCSL connects to this domain through a specific logic—by developing the competence, integrity, and engagement of the personnel who administer these assets, sustainability-oriented leadership invests in the human capital on which long-term stewardship depends. Sustainability in this study thus operates at two linked levels: the sustainable development of human capital (the leadership construct) and the sustainable stewardship of public resources (the performance domain), with innovative work behavior as the proximal mechanism linking the two. To avoid ambiguity about scope: sustainability in this study refers to the sustainable development of human capital and the sustainable stewardship of public resources. The study does not address environmental sustainability, ESG performance, or the technical lifecycle management of physical assets, and no claims are made in those domains.

2.5. Hypothesis Development

2.5.1. HCSL and Innovative Work Behavior (H1)

HCSL is theorized to foster IWB by satisfying employees’ basic psychological needs. Ethical and servant leadership components nurture relatedness through trust and care; mindful leadership supports autonomy by encouraging reflective decision-making; and sustainable leadership reinforces competence by emphasizing long-term capability development [11,21]. These need-satisfying conditions cultivate the autonomous motivation that energizes idea generation, promotion, and implementation [12,41]. Empirical evidence in private sector settings supports the HCSL–IWB linkage [23,42], but evidence from compliance-intensive public sectors is limited. Accordingly:
H1. 
HCSL is positively and significantly associated with IWB.

2.5.2. Innovative Work Behavior and Employee Job Performance (H2)

IWB is theorized to enhance EJP by introducing process improvements, novel solutions, and adaptive responses to emerging challenges [10,43]. Innovative employees identify inefficiencies, propose better methods, and implement changes that elevate task execution and contextual contribution. Meta-analytic evidence in private sector contexts supports a positive IWB–performance link [44]. Public sector evidence is more nuanced: studies have found that procedural constraints and accountability pressures can attenuate or, in some configurations, reverse the IWB–performance relationship [13,45]. Whether IWB enhances performance among Indonesian civil servants managing public assets is therefore an open empirical question. We hypothesize:
H2. 
IWB is positively and significantly associated with EJP.

2.5.3. HCSL and Employee Job Performance (H3)

Beyond its effect through innovation, HCSL is theorized to influence EJP directly through several mechanisms. Ethical and servant leadership components engender psychological safety and reciprocity, encouraging discretionary effort [27]. Mindful leadership reduces stress and enhances cognitive clarity, supporting task execution [46]. Sustainable leadership signals long-term investment in employees, fostering organizational identification and commitment [21]. Empirical work has linked sustainability-oriented leadership to performance outcomes across multiple sectors [11,24]. We hypothesize:
H3. 
HCSL has a positive and significant direct association with EJP.

2.5.4. The Mediating Role of IWB (H4)

If HCSL fosters IWB (H1) and IWB enhances EJP (H2), then IWB should mediate the HCSL–EJP relationship. SDT supports this mediating logic: leadership creates need-supportive conditions that energize proximal innovative behaviors, which in turn translate into distal performance outcomes [11,12]. Mediation may be partial (with HCSL retaining a direct effect on EJP beyond its indirect effect through IWB) or full, depending on whether other mechanisms also operate. We hypothesize:
H4. 
IWB mediates the association between HCSL and EJP.
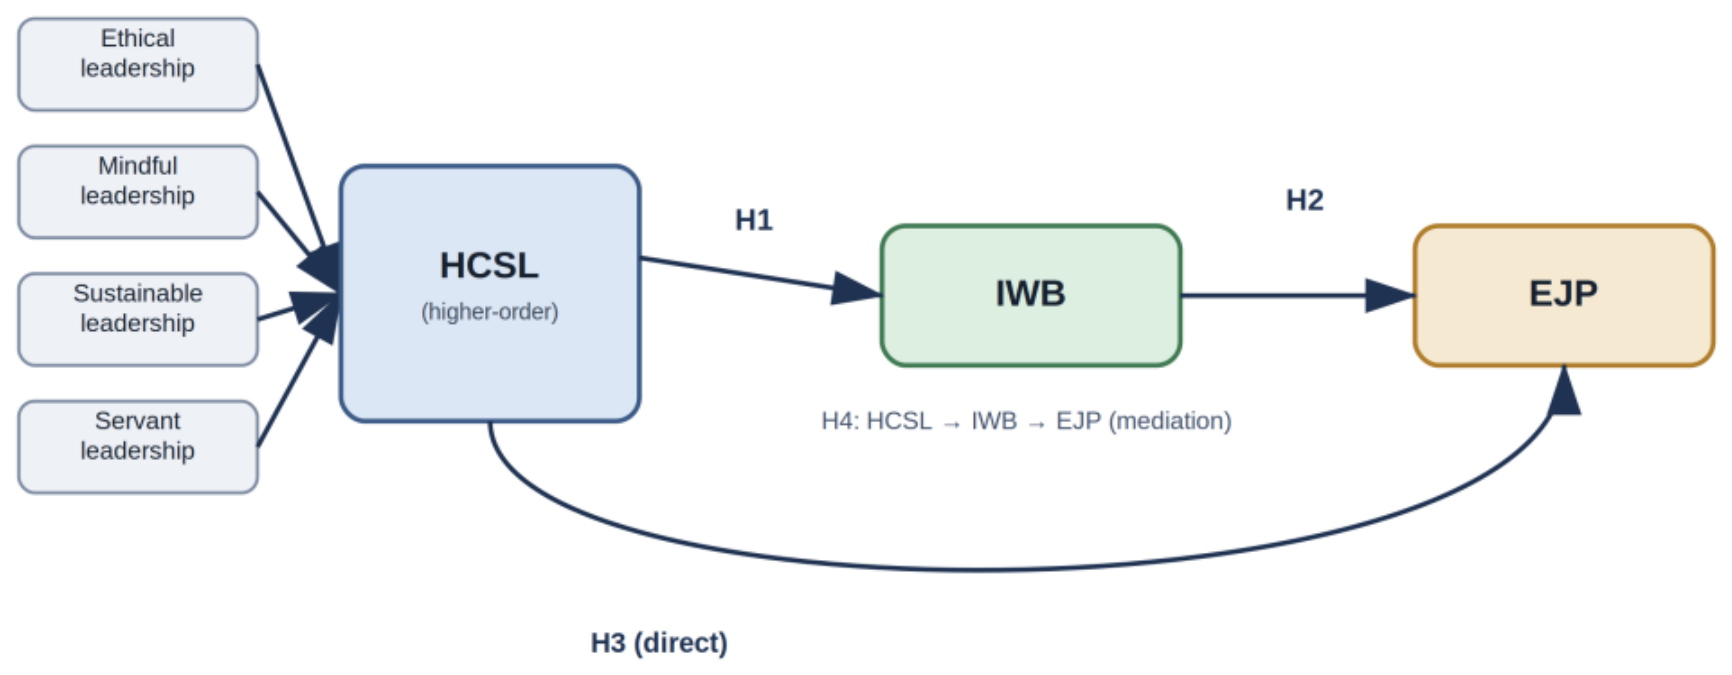
The proposed conceptual model is presented in Figure 1.

3. Materials and Methods

3.1. Research Design and Population

This study employed a cross-sectional survey design and a quantitative analytical approach. The target population comprised civil servants (Aparatur Sipil Negara, ASN) of the DKI Jakarta Provincial Government who are directly engaged in the management of regional government assets (Barang Milik Daerah, BMD). This population includes asset administrators, finance and accounting officers, and supervisory personnel across regional working units (Satuan Kerja Perangkat Daerah, SKPD/UKPD) responsible for asset acquisition, recording, utilization, maintenance, valuation, and disposal in accordance with Indonesian regulations governing public asset management [4,47].
The DKI Jakarta Provincial Government was selected as the research site for three reasons. First, it administers one of the largest regional asset portfolios in Indonesia, encompassing land, buildings, infrastructure, and movable assets of substantial fiscal and strategic significance. Second, as the seat of national government, it operates under heightened public scrutiny, making asset stewardship a salient performance domain. Third, recent governance reforms—including the implementation of the BerAKHLAK core values [25] and integrated asset management information systems—provide a contemporary backdrop for examining sustainable leadership and performance outcomes.

3.2. Sample and Sampling Procedure

A purposive sampling strategy was applied. Eligible respondents were identified from the official personnel rosters of units responsible for BMD management across the Provincial Government’s SKPD and UKPD and were required to have at least one year of direct involvement in BMD-related responsibilities to ensure adequate familiarity with asset-management processes. Following Hair et al. [48], the minimum sample size for PLS-SEM was determined using the inverse square root method for the most complex regression in the model, yielding a minimum of 138 respondents at 80% statistical power and α = 0.05; the achieved sample substantially exceeds this requirement, supporting robust estimation and inference.
Data were collected between 8 and 22 October 2025 through an online questionnaire distributed via secure links to eligible personnel through official BMD coordinator channels. A total of 614 responses were received. Each response was screened against the purposive eligibility criteria and for completeness; 73 responses were excluded as ineligible or incomplete, yielding 541 valid responses for analysis—a valid-response rate of 88.1%. Because the questionnaire was disseminated through coordinator channels rather than to a fixed, enumerated mailing list, 614 denotes the number of submissions received rather than a denominator of invitations sent, and the reported rate reflects the proportion of submissions retained after screening.

3.3. Instruments

All constructs were measured with multi-item reflective scales adapted from validated instruments, each scored on a five-point Likert scale ranging from 1 (strongly disagree/never) to 5 (strongly agree/always). Because the source instruments were originally developed in Western, private-sector, or general organizational settings, a structured adaptation procedure was undertaken to ensure that each construct was represented with adequate conceptual breadth and contextual fidelity for civil servants engaged in regional asset (Barang Milik Daerah, BMD) management. The procedure followed established guidance on measure development and construct validation [49,50,51] and on the cross-cultural adaptation of self-report measures [52].
Item generation proceeded deductively from the established dimensional structure of each parent instrument; no new dimensions were introduced. Instead, each theoretically specified dimension of the source scale was elaborated into several context-specific behavioral indicators that translate the abstract construct into observable conduct within the BMD setting. For HCSL, the four dimensions of the Di Fabio and Peiró scale [7]—ethical, mindful, sustainable, and servant leadership—were each operationalized through multiple indicators referencing concrete asset-stewardship behaviors (e.g., integrity in asset-related decisions, facilitation of competence development, attentiveness to subordinate workload), yielding 48 reflective indicators. The same deductive logic was applied to IWB, whose four behavioral phases [10]—idea exploration, idea generation, idea championing, and idea implementation—were elaborated into 26 indicators, and to EJP, whose task, contextual, and adaptive performance dimensions [38] were elaborated into 35 indicators. This domain-specific elaboration was intended to capture the full conceptual space of each construct as it manifests in public asset management, consistent with the recommendation that higher-order constructs be represented by a sufficient number of indicators per dimension [53].
To be explicit about the status of the resulting instrument: this study employs a contextually elaborated version of the existing validated scales, not a new measurement tool. The elaboration followed a fixed correspondence logic in which each item of the parent instrument was expanded into two to three context-specific behavioral indicators expressing the same underlying behavior in terms concrete to BMD administration. The 16-item HCSL scale of Di Fabio and Peiró [7] was thus elaborated into 48 indicators (three per parent item), the 10-item IWB scale [10] into 26 indicators, and the 18-item IWPQ [38] into 35 indicators, yielding 109 indicators in total. No dimension was added, removed, or redefined at any point; every indicator remains traceable to a specific parent item and dimension, so the theoretical boundaries of the source instruments are preserved by construction. The parent-item-to-indicator mapping is documented in Appendix A alongside the indicator-level statistics, allowing readers to verify this correspondence directly.
The content validity of the adapted instrument was established through expert evaluation prior to data collection. In the first pilot stage (30 July 2025), a senior academic specialist in human resource management reviewed every item for conceptual correspondence to its intended dimension, linguistic clarity, and contextual relevance to ASN respondents. Items judged ambiguous or conceptually imprecise were revised, and the minor refinements recommended by the expert were incorporated into the final instrument before pilot testing [50,54].
Crucially, the dimensional structure and measurement quality of the adapted scales were subsequently confirmed empirically rather than assumed. A statistical pilot with 73 target-population respondents (24–25 August 2025; Section 3.5) provided an initial check, and the full measurement model was then validated on the main sample within the variance-based SEM framework: all indicator loadings, reliability coefficients, and average-variance-extracted values were assessed against established thresholds, and HCSL was estimated as a reflective higher-order construct using the two-stage approach [53] (Section 4.2). This confirmatory assessment serves as the variance-based counterpart to covariance-based confirmatory factor analysis and provides the evidence that the expanded instruments retained their intended factor structure before structural estimation. Indicator-level statistics for all 109 items are reported in Appendix A to permit independent scrutiny of potential item overlap.

3.4. Translation Procedure

Because the original scales were developed in English while data collection was conducted in Indonesian, a forward-backward translation procedure was implemented following Brislin’s [55] guidelines. The English instruments were first translated into Indonesian by a bilingual researcher familiar with the conceptual content of the scales. The Indonesian version was then back-translated into English by an independent bilingual translator who had not seen the original instruments. The two English versions were compared, and discrepancies were resolved through consultation between the translators and the research team to ensure conceptual and linguistic equivalence. The final Indonesian version was reviewed for clarity, cultural appropriateness, and contextual fit to the public asset management setting.

3.5. Pilot Study

Prior to main data collection, a two-stage pilot study was conducted to establish instrument quality. In the first stage (30 July 2025), the questionnaire underwent expert validation through intensive consultation with a senior academic expert in human resource management. The expert reviewed each item for conceptual accuracy, linguistic clarity, and contextual relevance to ASN respondents managing public assets. Revisions and refinements suggested by the expert were integrated into the instrument before pilot testing.
In the second stage (24–25 August 2025), a statistical pilot test was conducted with 73 ASN respondents from the target population.
At the pilot stage all constructs showed very high internal consistency (Cronbach’s α above 0.98; composite reliability, rho_c, above 0.99 for HCSL, IWB, and EJP); consistent with our treatment of the main-study values (Section 4.2.1), we note that reliabilities of this magnitude also warrant scrutiny for potential redundancy rather than being interpreted simply as excellent. Average variance extracted values likewise exceeded the 0.50 threshold (HCSL: 0.689; IWB: 0.802; EJP: 0.738), indicating adequate convergent validity at the pilot stage. These results supported proceeding to the main data collection phase.

3.6. Common Method Bias Remedies

Because all variables were measured through self-report from a single source on a single occasion, common method bias (CMB) was a salient concern, and both procedural and statistical safeguards were applied while recognizing that such safeguards are necessary but not sufficient [56]. Procedurally, respondents were assured of anonymity and confidentiality and were told there were no right or wrong answers, reducing evaluation apprehension; the constructs were presented in clearly separated sections rather than intermixed, introducing psychological separation between predictor and criterion measures; item wording was reviewed to remove ambiguity; and reverse-coded items were used selectively to disrupt acquiescent response patterns.
Statistically, two diagnostics were applied. Harman’s single-factor test, in which all indicators were entered into an unrotated exploratory factor analysis, yielded a first factor accounting for 62.6% of the variance, exceeding the 50% benchmark sometimes used as an informal cut-off. We report this value transparently while noting that Harman’s test is widely regarded as insensitive and a weak diagnostic for CMB, so that neither passing nor failing it is decisive [56]; in a 109-indicator, highly reliable, homogeneous dataset, a large first factor is partly an artifact of the test itself. The full-collinearity approach of Kock [57] produced a highest inner-model variance inflation factor of 3.276, marginally below the 3.3 threshold but close enough that it offers limited reassurance. Taken together, these diagnostics cannot rule out a degree of common-method and halo influence, and the high inter-construct correlations and reliabilities reported above are consistent with—though not proof of—some method-induced inflation superimposed on substantive covariation; the pronounced ceiling effect, which restricts variance, likely amplifies the observed correlations. Accordingly, we refrain from claiming that CMB is absent, interpret the effect magnitudes conservatively, and treat the single-source, single-occasion design as a material limitation. Future research should incorporate stronger safeguards, including temporally separated measurement, an a priori marker variable theoretically unrelated to the focal constructs, and—most importantly for the criterion variable—multi-source data such as supervisor or archival ratings of employee job performance (Section 5.9).

3.7. Data Analysis

Hypothesis testing was conducted using PLS-SEM in SmartPLS 4.1. The choice of PLS-SEM over covariance-based SEM (CB-SEM) was driven by the characteristics of the model and data rather than by sample size, which at 541 is ample for either approach. Three considerations were decisive. First, the measurement structure is complex: HCSL is specified as a reflective higher-order construct estimated through the two-stage approach [53], and PLS-SEM accommodates higher-order constructs and large indicator sets flexibly. Second, the indicators are five-point Likert items whose distributions are markedly non-normal in this sample (a pronounced ceiling effect; Section 4.2.1), consistent with PLS-SEM’s minimal distributional assumptions but in tension with the multivariate-normality assumption underlying CB-SEM maximum-likelihood estimation. Third, the study has a predictive as well as an explanatory aim, and we accordingly report out-of-sample predictive assessment via PLSpredict [58], a capability native to the PLS-SEM workflow. We acknowledge that, as a theory-testing model of moderate complexity, the present model could also be estimated with CB-SEM, and we do not claim the substantive conclusions depend on the estimator; PLS-SEM was selected for the reasons above and in line with established guidance for its use [48,53].
The analysis proceeded in two stages following standard PLS-SEM practice. First, the measurement model was assessed for indicator reliability (outer loadings ≥ 0.708), internal consistency reliability (Cronbach’s α and composite reliability ≥ 0.70), convergent validity (AVE ≥ 0.50), and discriminant validity (HTMT ≤ 0.85 and Fornell–Larcker criterion). Second, the structural model was assessed for collinearity (inner VIF), path coefficients and significance (via bootstrapping with 5000 subsamples and bias-corrected confidence intervals), explanatory power (R2 and adjusted R2), effect size (Cohen’s f2), and predictive relevance (Q2predict via PLSpredict). Mediation was evaluated using the bootstrap-based approach recommended by Zhao, Lynch, and Chen [59], with mediation type classified based on the joint significance of direct and indirect effects.

4. Results

4.1. Descriptive Statistics and Sample Profile

The final analytical sample comprised 541 civil servants from the DKI Jakarta Provincial Government engaged in BMD management activities; the demographic profile is summarized in Table A1. The sample was predominantly male (62.8%), and most respondents were aged 36–45 (45.3%) or 46–55 (31.8%) years. More than half held a bachelor’s degree (54.9%), with smaller proportions holding a master’s degree (14.0%), a diploma (13.3%), or a senior-secondary qualification (17.6%). The majority occupied functional asset-custodian (Pengurus Barang) roles (55.1%), followed by staff/implementer positions (28.5%) and Echelon IV officials (15.7%). Respondents were drawn predominantly from work-unit-level offices (UKPD, 78.7%) and agency-level units (SKPD, 19.2%). Most had served in government for 11–15 years (36.6%) or more than 20 years (23.1%), and the plurality reported 2–5 years (45.1%) of direct BMD-management experience. This composition indicates an experienced, role-relevant respondent pool well positioned to report on the constructs under study; at the same time, its concentration in particular age, tenure, and unit categories is acknowledged as a boundary on generalizability (Section 5.9).

4.2. Measurement Model Assessment

4.2.1. Indicator Reliability and Internal Consistency

All outer loadings exceeded the conservative threshold of 0.708 [48], ranging from 0.806 to 0.895 for EJP, 0.720 to 0.880 for HCSL, and 0.722 to 0.934 for IWB, supporting adequate indicator reliability. Internal consistency was very high for all three constructs (Table 1): Cronbach’s α ranged from 0.989 to 0.990 and composite reliability (rho_a, rho_c) from 0.990 to 0.991. These values exceed the upper bound of 0.95 that the methodological literature treats as a warning signal rather than a strength, because reliability approaching unity typically indicates semantic redundancy among indicators rather than superior measurement [48]. We therefore do not interpret these coefficients as evidence of measurement quality. Several non-mutually-exclusive factors plausibly contribute to their magnitude in this dataset: (i) semantic proximity among the multiple indicators generated to elaborate each construct dimension; (ii) restricted response variance arising from a pronounced ceiling effect, with construct means ranging from 4.37 to 4.45 on the five-point scale and a mean item standard deviation below 0.70; (iii) the homogeneity of a specialized respondent pool sharing institutional norms and task vocabulary; and (iv) potential halo and acquiescence effects inherent to single-source self-report (Section 3.6). To enable independent scrutiny of possible item duplication, indicator-level statistics—loadings, item means, and standard deviations—are reported in Appendix A. Notwithstanding the elevated reliabilities, convergent validity (AVE > 0.50; Section 4.2.2) and discriminant validity (HTMT and cross-loadings; Section 4.2.3) were satisfied, indicating that the constructs do not collapse into one another; nevertheless, the structural estimates reported below are interpreted with corresponding caution.

4.2.2. Convergent Validity

Average variance extracted (AVE) values exceeded the 0.50 threshold for all constructs (Table 1), indicating that each construct explains more than half of its indicators’ variance. The highest AVE was observed for IWB (0.802), followed by EJP (0.737) and HCSL (0.689). These results support convergent validity. Indicator-level statistics for each construct are reported in Appendix A.

4.2.3. Discriminant Validity

Discriminant validity was assessed using the heterotrait–monotrait ratio (HTMT) [60], the Fornell–Larcker criterion [61], and the examination of indicator cross-loadings. As shown in Table 2, all HTMT values fell below the conservative 0.85 threshold (range 0.755 to 0.839), supporting discriminant validity at the construct level; the HCSL–IWB pair showed the highest value (0.839), reflecting their theoretical proximity while remaining within accepted bounds. An item-level inspection further indicated that every indicator loaded more strongly on its own construct than on any other construct, satisfying the cross-loadings criterion; the complete cross-loading matrix is provided in Appendix B.
The Fornell–Larcker criterion (Table 3) was satisfied for all construct pairs except one. For the HCSL–IWB pair, the inter-construct correlation (0.834) marginally exceeded the square root of HCSL’s AVE (0.830)—a difference of 0.004 that constitutes a genuine, if slight, violation of the criterion and that we report transparently rather than characterize as merely “borderline.” Interpreting this result requires placing the three lines of evidence side by side: of the established discriminant-validity diagnostics, two are met (HTMT = 0.839 < 0.85; clean indicator cross-loadings) and one is marginally not met (Fornell–Larcker). Current methodological guidance regards HTMT as the most reliable of these criteria and notes that the Fornell–Larcker test is comparatively insensitive in some configurations yet can be overly stringent when conceptually adjacent constructs are measured with very high reliability [60,61]. The convergence of evidence therefore supports treating HCSL and IWB as empirically distinct but strongly proximate constructs rather than as redundant. This proximity is also theoretically expected: H1 posits HCSL as the principal antecedent of IWB, and a high correlation between a construct and its strongest hypothesized outcome does not, by itself, signal a measurement artifact. At the same time, we cannot exclude that part of the shared variance is method-induced, given the ceiling effect and single-source design (Section 3.6). Two implications follow. Substantively, the very strong HCSL → IWB path (β = 0.834) should be read as reflecting both a genuine need-supportive leadership-to-innovation mechanism and the close conceptual adjacency of the two constructs in this setting; it should not be over-interpreted as evidence of an exceptionally large unique effect. Methodologically, the boundary case underscores the value of multi-source designs and of refining the HCSL indicator set to maximize behavioral distinctiveness from innovation outcomes in future applications. Accordingly, in all subsequent interpretations, the HCSL–IWB path is read as an association observed under conditions of substantial conceptual and empirical proximity between the two constructs; it is not read as evidence of a strong and unique effect of leadership on innovation.

4.3. Structural Model Assessment

4.3.1. Collinearity

Inner-model VIF values were 1.000 for the path HCSL → IWB and 3.276 for both HCSL → EJP and IWB → EJP. While these latter values exceed the more conservative threshold of 3.0, they remain below the widely accepted threshold of 5.0 [48], indicating that collinearity is not severe enough to undermine path estimation.

4.3.2. Hypothesis Testing

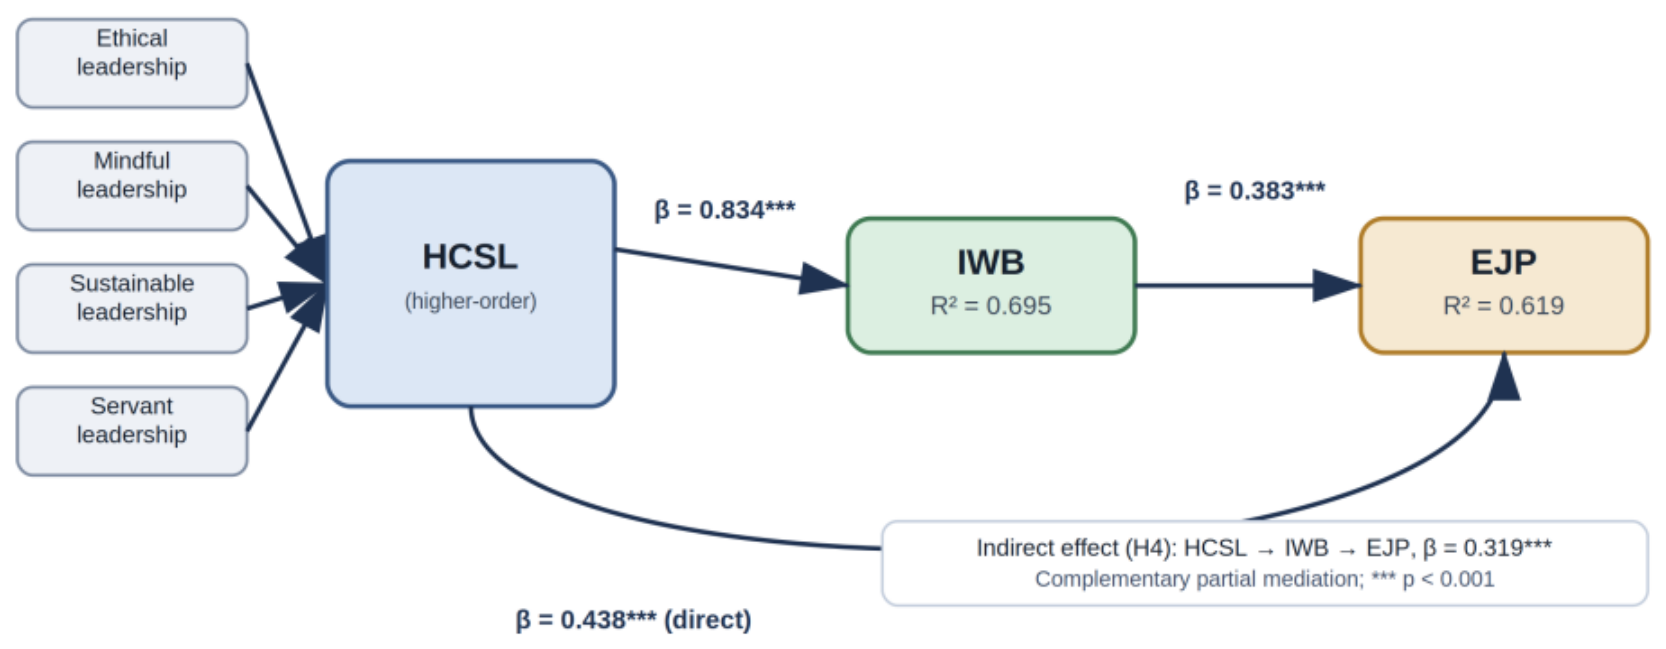
Path coefficient estimates and bootstrap-based significance tests are presented in Table 4 and depicted graphically in Figure 2. All four hypothesized relationships received empirical support.
H1, which proposed a positive association between HCSL and IWB, was supported (β = 0.834, t = 37.270, p < 0.001), with the bootstrap CI [0.793, 0.868] excluding zero. H2, proposing a positive association between IWB and EJP, was likewise supported (β = 0.383, t = 4.211, p < 0.001), with CI [0.234, 0.531] excluding zero. H3, proposing a positive direct association between HCSL and EJP, was supported (β = 0.438, t = 4.879, p < 0.001).
H4, the mediation hypothesis, was supported via the indirect effect HCSL → IWB → EJP (β = 0.319, t = 4.247, p < 0.001), with bias-corrected bootstrap CI [0.194, 0.440] excluding zero. Following the typology proposed by Zhao, Lynch, and Chen [59], the joint significance of the direct effect (β = 0.438) and the indirect effect (β = 0.319) in the same (positive) direction indicates a complementary partial mediation. The indirect effect accounts for approximately 42.1% of the total effect (0.319/0.758), while the direct effect accounts for the remaining 57.9%, indicating that IWB constitutes a substantial—but not exclusive—mechanism through which HCSL translates into EJP.
Consistent with the measurement cautions detailed in Section 3.6 and Section 4.2.1, the coefficients in Table 4 should be interpreted as upper-bound estimates of the underlying relationships rather than accurate representations of their true magnitude. The conditions documented for this dataset—very high construct reliabilities (α and rho_c ≈ 0.99), conceptual proximity between HCSL and IWB, restricted response variance arising from the ceiling effect, and a single-source, single-occasion design—each operate to inflate rather than attenuate observed associations. The direction and statistical significance of the hypothesized paths are robust to this concern; their point estimates are not, and the true unique relationships are plausibly smaller than those reported.

4.3.3. Explanatory Power and Effect Size

The model explained 69.5% of the variance in IWB (R2 = 0.695; adjusted R2 = 0.694) and 61.9% of the variance in EJP (R2 = 0.619; adjusted R2 = 0.618). These values reflect substantial explanatory power [48]. Cohen’s f2 effect sizes [62] indicated a very large effect of HCSL on IWB (f2 = 2.276), a medium-to-large effect of HCSL on EJP (f2 = 0.154), and a small-to-medium effect of IWB on EJP (f2 = 0.118). The same qualification applies to explanatory power. R2 values of 0.695 (IWB) and 0.619 (EJP) partly capitalize on shared method variance and restricted response variance, and should likewise be read as upper bounds on the variance that HCSL and IWB would explain under multi-source measurement.

4.3.4. Predictive Relevance

Predictive relevance was assessed using PLSpredict [58] (Table 5). Q2predict values were positive for both endogenous constructs—0.691 for IWB and 0.570 for EJP—indicating that the model has predictive relevance beyond in-sample fit. RMSE values from the PLS-SEM model were lower than those from a naive linear-regression benchmark for the majority of indicators, supporting the predictive utility of the proposed model.

5. Discussion

5.1. Summary of Findings

This study examined the relationship between Human Capital Sustainability Leadership (HCSL) and Employee Job Performance (EJP) among Indonesian civil servants engaged in regional asset management, with Innovative Work Behavior (IWB) as a hypothesized mediating mechanism. All four hypotheses received empirical support: HCSL was positively associated with IWB (H1) and with EJP (H3), IWB was positively associated with EJP (H2), and IWB complementarily and partially mediated the HCSL–EJP association (H4). Interpreted through Self-Determination Theory, the results indicate that sustainability-oriented leadership relates to public-sector performance through both a direct pathway and an innovation-mediated pathway; the sections that follow interrogate the magnitude, mechanism, and boundary conditions of these associations rather than restating them. Throughout this discussion, all reported magnitudes are treated as upper-bound estimates rather than precise representations of the underlying relationships, for the reasons set out in Section 3.6, Section 4.2.1 and Section 4.3.2.

5.2. HCSL and Innovative Work Behavior

The HCSL–IWB association was the strongest in the model, and its magnitude warrants interpretation on both substantive and methodological grounds rather than celebration. Substantively, the pattern is consistent with SDT-based reasoning: the ethical and servant elements of HCSL plausibly support relatedness, its mindful element supports autonomy, and its sustainable element supports competence—conditions theorized to energize idea exploration, generation, championing, and implementation [7,11,12]. In a strongly hierarchical public-sector culture, leadership cues are an especially visible reference point for acceptable conduct [63], which may amplify the leadership–innovation link relative to private-sector settings. Methodologically, however, an effect of this size, together with the high shared variance documented in Section 4.2 (Appendix A and Appendix B), is also consistent with the close conceptual adjacency of the two constructs and with some common-method and ceiling-related inflation (Section 3.6 and Section 4.2.3). We therefore read this result not as evidence of an exceptionally large unique leadership effect, but as convergent indication that perceived sustainability-oriented leadership and self-reported innovative behavior are tightly coupled in this setting—a coupling that is theoretically expected and empirically robust in direction, but whose reported magnitude (β = 0.834; R2 = 0.695) is best understood as an upper-bound estimate: conceptual overlap between the constructs, response-consistency tendencies, and common-source effects all push the observed coefficient upward, so the unique contribution of leadership to innovative behavior is plausibly smaller than the point estimate suggests.

5.3. Innovative Work Behavior and Employee Job Performance

The positive IWB–EJP association is the more theoretically informative of the two outcome paths, because it bears directly on the innovation–performance debate. Where some public-sector studies report attenuated or negative IWB–performance relationships [13,45]—the basis for claims of an “innovation–performance paradox”—the present estimate is positive and moderate. Consistent with the boundary conditions developed in Section 2.3, the most plausible reading is not that the paradox is absent but that its operative conditions are not met here: in regional asset management, the relevant innovations are predominantly incremental and process-oriented (digital recording, procedural refinement, utilization optimization) and are therefore compliance-reinforcing rather than compliance-threatening, while the BerAKHLAK agenda legitimizes adaptiveness as expected conduct [3,25]. Under these specific conditions, innovative effort and formal performance expectations can be complementary. This is context-specific evidence about when the link holds, not a general resolution of the paradox; where innovation is more disruptive of procedural legitimacy, the relationship could differ. We emphasize that these boundary conditions are an interpretive account rather than an empirically verified contextual mechanism. Neither innovation type nor the reform climate was measured or modeled, so the present design shows that the IWB–EJP association holds within the public-asset-management environment; it does not test whether that environment shapes the association.

5.4. HCSL and Employee Job Performance: Direct Effect

The direct HCSL–EJP path was the larger of the two components of HCSL’s total association with performance, indicating that innovation is not the principal route through which sustainability-oriented leadership relates to performance in this sample. The model does not identify the additional mechanisms, but the SDT and HCSL literature point to candidates it did not measure—organizational identification, ethical commitment, well-being, and reduced turnover intention among them [11,24]. The size of the direct path is therefore best read as a pointer to unmodeled mediators rather than as evidence of an unmediated leadership effect, and it motivates the multi-mediator designs proposed in Section 5.9.

5.5. The Mediating Role of Innovative Work Behavior

The IWB pathway was a complementary partial mediation [59]: the direct and indirect effects were jointly significant and positive, with the indirect effect accounting for roughly two-fifths of the total association. The interpretive weight of this result lies less in the mediation label than in what it implies about mechanism specificity—innovation is a genuine but partial conduit, which is itself informative given that much leadership research treats a single mediator as sufficient. The pattern is consistent with the SDT sequence in which need-supportive leadership energizes proximal behaviors that feed distal outcomes; we note, however, that psychological-need satisfaction was not measured directly (Section 5.9), so the present design is consistent with this mechanism rather than a direct test of it. The practical reading is correspondingly modest: cultivating the conditions that enable innovation is one defensible lever for performance, alongside the direct leadership influences captured by the larger direct path.

5.6. Implications for Sustainable Public Sector Management

The findings have several implications for sustainable public sector management. First, they reposition leadership development as a sustainability investment, not merely an HR concern. To the extent that the associations observed here reflect genuine influence, cultivating HCSL competencies among public-sector managers may advance employee well-being, organizational performance, and the long-term stewardship of public resources together—tripartite goals consistent with the broader sustainability agenda [1,64].
Second, the findings illuminate a productive bridge between innovation and compliance. Public sector innovation has often been framed as in tension with accountability and procedural integrity [33]. The present results are consistent with the view that this tension is not inevitable: where leadership is perceived to cultivate psychological safety and to align innovation with mission-relevant outcomes, innovative behavior and compliance responsibilities appear to coexist. For the Indonesian context specifically, this evidence supports the BerAKHLAK reform’s emphasis on adaptive and collaborative behaviors [25].
Third, the focus on regional asset management as a sustainability domain extends the conversation beyond environmental sustainability narrowly conceived to encompass fiscal and intergenerational sustainability. BMD assets represent stored public wealth across generations; their effective stewardship is therefore an act of intergenerational equity. The findings position frontline civil servants as key actors in this stewardship and point to their leaders as potential enablers. We reiterate that the sustainability contribution claimed here is confined to human-capital development and public-resource stewardship; environmental and ESG dimensions lie outside the scope of this study.

5.7. Theoretical Contributions

The study’s theoretical contribution is correspondingly bounded. First, it provides public-sector evidence for HCSL—a construct tested predominantly in private settings—and shows that it behaves largely as theorized in a compliance-intensive bureaucracy, while also surfacing a discriminant-validity boundary case (HCSL–IWB; Section 4.2.3 and Appendix B) that future applications should address through sharper indicator design. Second, it adds an empirical instance to SDT-informed accounts of the leadership → innovation → performance sequence in the public sector, with the qualification that the underlying need-satisfaction mechanism is assumed rather than measured. Third, it contributes context-specific evidence to the innovation–performance debate, indicating that, under the conditions characterizing regional asset management, innovation and performance are positively linked; we frame this as informing the debate about when the paradox holds, not as resolving it.

5.8. Practical Implications

For public-sector leaders and policymakers, the findings support several tentative implications, offered as plausible considerations rather than evidence-based prescriptions, and with the caveat that this study did not test interventions, training, or institutional reforms and therefore cannot establish their effects directly. To the extent that the observed associations reflect genuine influence, leadership-development efforts might integrate the four HCSL dimensions—ethical, mindful, sustainable, and servant—rather than emphasizing any single dimension; performance-management systems might recognize incremental, compliance-consistent innovation alongside direct task accomplishment; and asset-management training might connect operational competencies to the longer-horizon stewardship narrative so that routine work is seen as contributing to long-term public value. These are hypotheses for practice to be evaluated, not established prescriptions.
For HR practitioners, the strong observed leadership–innovation association is consistent with the possibility that leadership selection and development decisions carry downstream consequences for an organization’s innovation capacity; if so, investment in HCSL development would represent a high-leverage intervention. Confirming this causal logic, however, would require the longitudinal and intervention-based evidence that the present design cannot provide.

5.9. Limitations and Future Research

Several limitations bound these conclusions. First, the cross-sectional design precludes causal inference; reverse and reciprocal relationships—performance shaping perceptions of leadership, for instance—cannot be excluded, and the directional language used here is interpretive rather than demonstrated. Second, all constructs were measured by self-report from a single source on a single occasion; as Section 3.6 makes clear, the available diagnostics cannot rule out common-method and halo influence, and the very high reliabilities and inter-construct correlations are consistent with some method-induced inflation. Third, and relatedly, Employee Job Performance relied entirely on self-report. Because perceptions of leadership, innovative behavior, and performance were collected simultaneously from the same respondents, perception-consistency bias remains a plausible partial explanation for the observed relationships, and the use of self-assessed performance may itself have inflated the estimated associations with EJP. The public-asset-management context offers more objective indicators—reporting accuracy and timeliness, audit and reconciliation outcomes, asset-utilization rates, maintenance efficiency, and compliance performance—that would provide a sterner test of the leadership–performance link than perceptual ratings allow. Fourth, the mediating mechanism posited by SDT—satisfaction of the autonomy, competence, and relatedness needs—was not measured; the study uses SDT as an explanatory frame rather than testing the need-satisfaction pathway directly. Fifth, the borderline Fornell–Larcker result for the HCSL–IWB pair indicates that leadership and innovative behavior are empirically close in this sample, so the H1 estimate in particular should be read with caution. Sixth, the contextual features invoked interpretively throughout the manuscript—bureaucratic rigidity, accountability pressure, administrative hierarchy, and the specific demands of public asset management—were not directly reflected in the empirical model as measured variables or moderators. The study therefore demonstrates that the hypothesized relationships exist within this context, not that the context shapes them; formal tests would require measured contextual constructs (for example, perceived red tape or accountability intensity) or comparative multi-context designs. Finally, the single-jurisdiction, purposively sampled design—one provincial government and one administrative domain—limits generalizability to other regional governments and public-sector settings.
These limitations map onto a clear agenda for future work. Multi-source and multi-wave designs—pairing employee self-reports with supervisor or archival performance data and separating predictor and criterion measurement in time—would address both common-method concerns and causal ambiguity, and the inclusion of an a priori marker variable would sharpen CMB diagnosis. Measuring psychological-need satisfaction directly would convert the assumed SDT mechanism into a testable one, and incorporating the objective performance indicators this domain makes available—audit findings and their follow-up, reporting accuracy, asset-utilization rates, maintenance efficiency, and compliance outcomes—would strengthen the performance side of the model. Extending the design to additional mediators (work engagement, knowledge sharing, psychological empowerment) and replicating across Indonesian regions and public-sector domains (education, health, infrastructure) would establish boundary conditions, while longitudinal study of sustainability-relevant outcomes—resource-utilization efficiency, asset preservation, long-term cost optimization—would more directly connect HCSL to the sustainability outcomes its framing invokes.

6. Conclusions

This study examined how Human Capital Sustainability Leadership relates to Employee Job Performance among Indonesian civil servants engaged in regional asset management, with Innovative Work Behavior as a mediating mechanism. Using PLS-SEM on survey data from 541 ASN respondents, we found that HCSL was positively associated with both IWB and EJP and that IWB complementarily and partially mediated the HCSL–EJP relationship. The strong HCSL–IWB association, in particular, was observed under substantial conceptual and empirical proximity between the two constructs and should not be read as evidence of a unique leadership effect on innovation. The model accounted for a large share of variance in both endogenous constructs, although—as detailed in Section 4.2 and Section 5—the elevated reliabilities, restricted response variance, and single-source design mean these magnitudes should be read as upper-bound estimates rather than precise effects.
The study’s contribution is empirical and contextual: it extends HCSL evidence to a compliance-intensive public-sector setting, offers an SDT-consistent (though not directly tested) account of how sustainability-oriented leadership relates to performance through innovation, and supplies context-specific evidence on the conditions under which innovative behavior and performance are positively linked. Its practical value lies in identifying sustainable leadership development as one credible lever for advancing public-sector performance and stewardship together. In regional government asset management—where fiscal sustainability, intergenerational equity, and good governance converge—cultivating HCSL among public-sector leaders offers a plausible, if not yet causally established, pathway for connecting sustainability commitments to employee and organizational outcomes. Realizing and confirming that pathway will require the multi-source, longitudinal, and mechanism-explicit designs outlined above.

Author Contributions

Conceptualization, I.S. and V.R.; methodology, I.S. and K.; software, I.S.; validation, V.R., K. and F.E.; formal analysis, I.S.; investigation, I.S.; resources, I.S.; data curation, I.S.; writing—original draft preparation, I.S.; writing—review and editing, V.R., K. and F.E.; visualization, I.S.; supervision, V.R. and K.; project administration, F.E. All authors have read and agreed to the published version of the manuscript.

Funding

This research received no external funding.

Institutional Review Board Statement

The study was conducted in accordance with the Declaration of Helsinki and approved by the institutional ethics committee of Universitas Mercu Buana (date of approval: 3 October 2025).

Informed Consent Statement

Informed consent was obtained from all subjects involved in the study.

Data Availability Statement

The data presented in this study are available on reasonable request from the corresponding author. The data are not publicly available due to privacy restrictions related to the participating public sector institution.

Acknowledgments

The authors thank the leadership of the DKI Jakarta Provincial Government and the participating Satuan Kerja Perangkat Daerah/Unit Kerja Perangkat Daerah (SKPD/UKPD) for facilitating data access. The authors also thank the academic experts who contributed to the instrument validation process. During the preparation of this manuscript, the authors used a generative AI assistant (Anthropic Claude) for purposes of language polishing and structural editing. The authors have reviewed and edited the output and take full responsibility for the content of this publication.

Conflicts of Interest

The authors declare no conflicts of interest.

Abbreviations

The following abbreviations are used in this manuscript:
ASNAparatur Sipil Negara (Indonesian civil servants)
AVEAverage Variance Extracted
BMDBarang Milik Daerah (regional government assets)
CIConfidence Interval
CMBCommon Method Bias
EJPEmployee Job Performance
HCSLHuman Capital Sustainability Leadership
HTMTHeterotrait–Monotrait Ratio
IWBInnovative Work Behavior
IWPQIndividual Work Performance Questionnaire
PLS-SEMPartial Least Squares Structural Equation Modeling
SDTSelf-Determination Theory
SKPD/UKPDSatuan Kerja/Unit Kerja Perangkat Daerah (regional working units)
VIFVariance Inflation Factor

Appendix A. Sample Profile and Indicator-Level Statistics for the Focal Constructs

Table A1. Sample demographic profile (N = 541).
CharacteristicCategoryn%
GenderMale34062.8
Female20137.2
Age<25 years10.2
25–35 years8615.9
36–45 years24545.3
46–55 years17231.8
>55 years376.8
EducationSenior high school (SMA/SMK)9517.6
Diploma7213.3
Bachelor’s degree (S1)29754.9
Master’s degree (S2)7614.0
Doctorate (S3)10.2
Tenure in government<5 years387.0
5–10 years8115.0
11–15 years19836.6
16–20 years9918.3
>20 years12523.1
PositionStaff/implementer15428.5
Functional asset custodian (Pengurus Barang)29855.1
Echelon IV official8515.7
Echelon III official40.7
Type of work unitUKPD (work-unit level)42678.7
SKPD (agency level)10419.2
Regional Asset Management Agency (BPAD)112.0
Experience in BMD management<2 years16229.9
2–5 years24445.1
6–10 years9818.1
>10 years376.8
Note. Percentages are column percentages of the total analytical sample (N = 541). No demographic data were missing.
Table A2. Human Capital Sustainability Leadership (HCSL)—48 indicators.
ItemDimensionIndicator (English)MSDr(it)λ
HCSL1EthicalLeader complies with laws and regulations on BMD management4.6060.5560.7480.769
HCSL2EthicalLeader’s integrity in decisions on regional asset management4.5820.5890.7290.750
HCSL3EthicalLeader sets an example in applying good-governance principles4.5710.5780.7630.783
HCSL4EthicalLeader’s transparency in BMD-related decision-making4.5670.5880.7690.788
HCSL5EthicalLeader’s honesty in reporting the condition of BMD4.5990.5680.7460.768
HCSL6EthicalLeader’s fairness in treating all employees4.4840.6630.8140.829
HCSL7EthicalLeader’s consistency in honoring commitments4.5180.6220.8190.834
HCSL8EthicalTrust in the leader to meet performance targets4.5730.5840.7910.809
HCSL9EthicalLeader’s consistency in implementing BMD management policy4.5600.5860.7710.790
HCSL10EthicalLeader’s adherence to rules in BMD management decisions4.5860.5730.7810.800
HCSL11EthicalLeader’s public-interest orientation in BMD decisions4.5550.5830.7980.816
HCSL12EthicalLeader’s prudence in resolving BMD problems4.6160.5640.7550.775
HCSL13SustainableLeader encourages employees to update knowledge of BMD regulations4.4360.7140.7270.739
HCSL14SustainableLeader facilitates training in BMD management4.4550.7250.7380.749
HCSL15SustainableLeader supports employees in pursuing BMD competency certification4.5580.6490.7120.724
HCSL16SustainableLeader identifies employees’ competence-development needs4.4380.7110.8270.833
HCSL17SustainableLeader provides mentoring on technical BMD skills4.3940.7490.8200.826
HCSL18SustainableLeader creates sustainable human-resource development programs4.3660.7760.8250.830
HCSL19SustainableLeader helps plan employees’ career development4.3530.7980.8140.819
HCSL20SustainableLeader provides job-rotation opportunities4.2460.8120.7560.764
HCSL21SustainableLeader supports employees in pursuing formal education4.5230.6650.7810.790
HCSL22SustainableLeader identifies strategic priorities in BMD management4.4620.6730.8400.846
HCSL23SustainableLeader directs resources toward asset-utilization optimization4.4700.6840.8300.837
HCSL24SustainableLeader ensures a focus on sustainable asset management4.4710.6950.8380.844
HCSL25MindfulLeader understands the challenges employees face in managing BMD4.3600.7290.8630.866
HCSL26MindfulLeader is attentive to the workload of BMD staff4.3250.7610.8580.859
HCSL27MindfulLeader is sensitive to the workload levels of BMD staff4.3270.7690.8670.868
HCSL28MindfulLeader understands employees’ perspectives on technical BMD problems4.3480.7390.8720.874
HCSL29MindfulLeader anticipates employees’ support needs before being asked4.2990.7810.8540.857
HCSL30MindfulLeader is responsive to BMD facility and infrastructure needs4.3550.7450.8680.871
HCSL31MindfulLeader provides access to information proactively4.3010.7720.8240.828
HCSL32MindfulLeader recognizes each employee’s specific expertise4.2990.7590.8620.864
HCSL33MindfulLeader assigns tasks accurately according to employee competence4.3620.7010.8750.877
HCSL34MindfulLeader remains calm under BMD audit pressure4.3770.7190.8380.842
HCSL35MindfulLeader’s emotional control when facing complex problems4.3200.7470.8330.838
HCSL36MindfulLeader’s objectivity in assessing problems before key decisions4.3970.7170.8740.877
HCSL37MindfulLeader prioritizes employee capacity development4.3810.7090.8600.864
HCSL38MindfulLeader attends to employees’ work–life balance4.2810.7570.8440.847
HCSL39ServantLeader helps resolve employees’ performance obstacles4.3750.7030.8570.860
HCSL40ServantLeader motivates employees to improve performance4.4490.6690.8440.849
HCSL41ServantLeader encourages employees to innovate in BMD management4.3730.7340.8590.861
HCSL42ServantLeader appreciates employees’ performance achievements4.3120.8170.8400.843
HCSL43ServantLeader ensures employees receive up-to-date BMD regulatory information4.4030.7230.8630.865
HCSL44ServantLeader communicates openly about BMD management policy4.3970.7370.8710.874
HCSL45ServantLeader provides adequate access to information systems4.4210.7020.8720.876
HCSL46ServantCollaborative cross-unit work climate built by the leader4.3970.7140.8710.874
HCSL47ServantLeader’s coordination with other work units4.4440.6720.8560.861
HCSL48ServantCulture of mutual support built by the leader within the team4.4420.6900.8700.874
Note. M = item mean and SD = item standard deviation on a five-point Likert scale (1–5); r(it) = corrected item–total correlation (correlation of each item with the sum of the remaining items of the same construct); λ = standardized indicator loading. Item means, standard deviations, and corrected item–total correlations were computed directly from the raw data (N = 541); loadings are reported to permit assessment of indicator quality and potential redundancy and correspond to the ranges reported in Section 4.2.1. Dimension labels follow the theoretical structure of the source instruments and should be read as indicative groupings.
Table A3. Innovative Work Behavior (IWB)—26 indicators.
ItemDimensionIndicator (English)MSDr(it)λ
IWB1ExplorationAttends to BMD problems beyond one’s own unit4.2130.8740.7070.728
IWB2ExplorationIdentifies potential problems in optimizing BMD management4.3840.6780.8530.863
IWB3GenerationDevelops new methods to speed up BMD inventory4.3270.7740.8490.860
IWB4GenerationSeeks innovative ways to improve asset-data accuracy4.3440.7530.8940.902
IWB5GenerationFinds new approaches to optimizing BMD management4.3590.7480.8900.898
IWB6GenerationGenerates alternative solutions for resolving BMD disputes4.3420.7450.8670.876
IWB7GenerationCreatively formulates solutions for idle-asset optimization4.3220.7720.8870.896
IWB8GenerationProduces practical ideas for BMD management effectiveness4.3380.7370.9150.921
IWB9GenerationFinds efficient ways of recording BMD4.3600.7260.9060.913
IWB10GenerationDevelops innovative approaches to BMD monitoring4.3700.7380.9130.920
IWB11GenerationTakes initiative to improve BMD standard operating procedures4.3660.7320.9210.927
IWB12ChampioningArouses colleagues’ enthusiasm for new BMD systems4.3970.7140.9050.913
IWB13ChampioningSpreads enthusiasm for adopting BMD technology4.4310.6760.8960.906
IWB14ChampioningEncourages colleagues to be open to BMD system change4.4360.6820.8960.905
IWB15ChampioningPersuades colleagues of the benefits of BMD digitalization4.4510.6720.8760.888
IWB16ChampioningSecures support for implementing an integrated BMD system4.4450.6690.8620.874
IWB17ChampioningEffectively communicates the value of asset innovation4.3830.7120.9070.915
IWB18ChampioningPresents BMD-improvement ideas to the team4.3810.7350.9080.916
IWB19ChampioningProposes BMD-efficiency ideas to the leader4.3600.7260.8980.907
IWB20ChampioningSystematically introduces BMD-optimization concepts4.3720.7480.9270.933
IWB21ImplementationApplies innovative BMD ideas in daily work4.3490.7610.8940.903
IWB22ImplementationPersists in realizing a better asset-management system4.4180.6990.8890.899
IWB23ImplementationEnsures BMD-data improvement ideas are implemented4.4010.7170.9120.920
IWB24ImplementationRefines the BMD system based on feedback4.3720.7020.8950.904
IWB25ImplementationDevelops applications into a comprehensive BMD system4.3960.7540.8740.884
IWB26ImplementationAdaptively modifies innovations as needed4.4100.7130.8790.889
Table A4. Employee Job Performance (EJP)—35 indicators.
ItemDimensionIndicator (English)MSDr(it)λ
EJP1TaskCompletes BMD tasks according to standards4.5060.5730.8400.854
EJP2TaskMeets BMD data-accuracy targets4.4940.5830.8530.865
EJP3TaskMeets the leader’s expectations for work output4.4660.5910.8440.858
EJP4TaskPerforms duties per the Governor’s BMD regulation4.5290.5790.8480.862
EJP5TaskReliably completes BMD reports on time4.4570.6440.8170.831
EJP6TaskAchieves performance indicators per the performance agreement4.5080.5980.8590.872
EJP7TaskConsistently meets minimum BMD service standards4.4840.5950.8670.879
EJP8TaskProactively supports an unqualified (WTP) audit opinion4.5580.5530.8240.840
EJP9TaskFocuses on activities affecting SAKIP assessment4.5080.5860.8540.868
EJP10TaskEnsures fulfillment of BMD performance-assessment aspects4.4920.5760.8670.880
EJP11TaskCompletes the BMD management cycle thoroughly4.4940.5790.8740.887
EJP12TaskComplies with mandatory BMD procedures4.5490.5680.8550.870
EJP13TaskEnsures completeness of mandatory BMD documents4.5600.5630.8260.844
EJP14TaskSuccessfully completes periodic BMD reports4.5600.5660.8540.870
EJP15TaskSuccessfully completes periodic BMD reports (second indicator)4.5470.5680.8210.839
EJP16TaskSuccessfully completes periodic BMD reports (third indicator)4.5430.5750.8460.861
EJP17TaskReliable on crucial tasks such as BMD reconciliation4.5060.6010.8540.867
EJP18ContextualCovers tasks for absent colleagues4.3250.7080.8170.822
EJP19ContextualHelps with absent colleagues’ asset work4.2940.7360.8050.809
EJP20ContextualTakes over verification tasks for unavailable colleagues4.2570.7640.8150.819
EJP21ContextualHelps overwhelmed colleagues with BMD work4.3970.6720.8620.865
EJP22ContextualShares inventory tasks with overloaded colleagues4.3490.7320.8210.825
EJP23ContextualHelps ease colleagues’ burden at deadlines4.3960.6770.8560.859
EJP24ContextualTakes initiative to prepare BMD data for the leader4.4550.6240.8860.890
EJP25ContextualProactively supports the leader in BMD meetings4.4770.5920.8870.895
EJP26ContextualVoluntarily helps the leader draft BMD policy4.4510.6470.8740.879
EJP27ContextualListens to colleagues’ BMD-related concerns4.4450.6380.8600.865
EJP28ContextualMakes time to consult on asset problems4.4230.6640.8710.875
EJP29ContextualIs a confidant for colleagues stressed by audits4.3030.7480.8220.827
EJP30ContextualHelps orient new BPAD DKI Jakarta staff4.3530.7370.8360.840
EJP31ContextualGuides new staff to understand the BMD system4.4400.6680.8540.859
EJP32ContextualEnsures new staff understand BMD regulations4.4090.6810.8400.846
EJP33ContextualShares information on BMD policy changes4.4420.6550.8890.892
EJP34ContextualEnsures colleagues receive BMD system updates4.4310.6760.8300.837
EJP35ContextualCommunicates inter-unit coordination in BMD management4.4700.6310.8860.891

Appendix B. Full Item Wording (English and Bahasa Indonesia)

Table A5. Full Item Wording: Human Capital Sustainability Leadership (HCSL)—48 indicators.
ItemIndicator (English)Indikator (Bahasa Indonesia—As Administered)
HCSL1Leader complies with laws and regulations on BMD managementPerilaku pimpinan dalam mematuhi peraturan perundang-undangan pengelolaan Barang Milik Daerah
HCSL2Leader’s integrity in decisions on regional asset managementIntegritas pimpinan dalam mengambil keputusan terkait pengelolaan aset daerah
HCSL3Leader sets an example in applying good-governance principlesKeteladanan pimpinan dalam menerapkan prinsip-prinsip good governance
HCSL4Leader’s transparency in BMD-related decision-makingTransparansi pimpinan dalam pengambilan keputusan terkait Barang Milik Daerah
HCSL5Leader’s honesty in reporting the condition of BMDKejujuran pimpinan dalam melaporkan kondisi Barang Milik Daerah
HCSL6Leader’s fairness in treating all employeesKeadilan pimpinan dalam memperlakukan semua pegawai
HCSL7Leader’s consistency in honoring commitmentsKonsistensi pimpinan dalam menepati komitmen
HCSL8Trust in the leader to meet performance targetsKepercayaan terhadap pimpinan dalam memenuhi target kinerja
HCSL9Leader’s consistency in implementing BMD management policyKonsistensi pimpinan dalam menjalankan kebijakan pengelolaan Barang Milik Daerah
HCSL10Leader’s adherence to rules in BMD management decisionsKepatuhan pimpinan dalam keputusan pengelolaan Barang Milik Daerah
HCSL11Leader’s public-interest orientation in BMD decisionsOrientasi kepentingan publik pimpinan dalam pengambilan keputusan terkait pengelolaan Barang Milik Daerah
HCSL12Leader’s prudence in resolving BMD problemsKehati-hatian pimpinan dalam menyelesaikan permasalahan Barang Milik Daerah
HCSL13Leader encourages employees to update knowledge of BMD regulationsPimpinan mendorong pegawai memperbarui pengetahuan regulasi pengelolaan Barang Milik Daerah
HCSL14Leader facilitates training in BMD managementPimpinan memfasilitasi pelatihan pengelolaan Barang Milik Daerah
HCSL15Leader supports employees in pursuing BMD competency certificationPimpinan mendukung pegawai mengikuti sertifikasi keahlian pengelolaan Barang Milik Daerah
HCSL16Leader identifies employees’ competence-development needsPimpinan mengidentifikasi kebutuhan pengembangan kompetensi pegawai
HCSL17Leader provides mentoring on technical BMD skillsPimpinan memberikan mentoring kemampuan teknis pengelolaan Barang Milik Daerah
HCSL18Leader creates sustainable human-resource development programsPimpinan menciptakan program pengembangan sumber daya manusia yang berkelanjutan
HCSL19Leader helps plan employees’ career developmentPimpinan membantu merencanakan pengembangan karir pegawai
HCSL20Leader provides job-rotation opportunitiesPimpinan memberikan kesempatan rotasi jabatan
HCSL21Leader supports employees in pursuing formal educationPimpinan mendukung pegawai mengikuti pendidikan formal
HCSL22Leader identifies strategic priorities in BMD managementPimpinan mengidentifikasi prioritas strategis pengelolaan Barang Milik Daerah
HCSL23Leader directs resources toward asset-utilization optimizationPimpinan mengarahkan sumber daya pada kegiatan optimalisasi pemanfaatan aset
HCSL24Leader ensures a focus on sustainable asset managementPimpinan memastikan fokus pada pengelolaan aset berkelanjutan
HCSL25Leader understands the challenges employees face in managing BMDPimpinan paham tingkat tantangan pegawai dalam mengelola Barang Milik Daerah
HCSL26Leader is attentive to the workload of BMD staffPimpinan peduli terhadap tingkatan beban kerja pegawai pengelola Barang Milik Daerah
HCSL27Leader is sensitive to the workload levels of BMD staffPimpinan peduli terhadap tingkatan beban kerja pegawai pengelola Barang Milik Daerah 2
HCSL28Leader understands employees’ perspectives on technical BMD problemsPimpinan mampu memahami perspektif pegawai menghadapi permasalahan teknis terkait pengelolaan Barang Milik Daerah
HCSL29Leader anticipates employees’ support needs before being askedPimpinan memenuhi kebutuhan dukungan sebelum diminta pegawai dalam bekerja
HCSL30Leader is responsive to BMD facility and infrastructure needsPimpinan tanggap terhadap kebutuhan sarana prasarana pengelolaan Barang Milik Daerah
HCSL31Leader provides access to information proactivelyPimpinan menyediakan akses informasi tanpa diminta
HCSL32Leader recognizes each employee’s specific expertisePimpinan mampu mengenali keahlian khusus setiap pegawai
HCSL33Leader assigns tasks accurately according to employee competencePimpinan memiliki ketepatan dalam memberikan penugasan sesuai kompetensi pegawai
HCSL34Leader remains calm under BMD audit pressurePimpinan tenang dalam menghadapi tekanan audit pengelolaan Barang Milik Daerah
HCSL35Leader’s emotional control when facing complex problemsPengendalian emosi pimpinan menghadapi permasalahan kompleks
HCSL36Leader’s objectivity in assessing problems before key decisionsTingkat objektivitas pimpinan dalam melihat permasalahan sebelum mengambil keputusan penting
HCSL37Leader prioritizes employee capacity developmentPimpinan mengedepankan prioritas dalam pengembangan kapasitas pegawai
HCSL38Leader attends to employees’ work–life balancePimpinan memperhatikan work–life balance pegawai
HCSL39Leader helps resolve employees’ performance obstaclesBantuan pimpinan menyelesaikan kendala kinerja pegawai
HCSL40Leader motivates employees to improve performancePimpinan memotivasi pegawai untuk meningkatkan kinerja
HCSL41Leader encourages employees to innovate in BMD managementPimpinan mendorong pegawai untuk berinovasi dalam pengelolaan Barang Milik Daerah
HCSL42Leader appreciates employees’ performance achievementsPimpinan memberikan apresiasi atas pencapaian kinerja pegawai
HCSL43Leader ensures employees receive up-to-date BMD regulatory informationPimpinan memastikan pegawai mendapat informasi terkini regulasi pengelolaan Barang Milik Daerah
HCSL44Leader communicates openly about BMD management policyPimpinan berkomunikasi secara terbuka mengenai kebijakan pengelolaan Barang Milik Daerah
HCSL45Leader provides adequate access to information systemsPimpinan menyediakan akses sistem informasi yang memadai
HCSL46Collaborative cross-unit work climate built by the leaderSuasana kerja kolaboratif yang dibangun pemimpinan antar unit
HCSL47Leader’s coordination with other work unitsKoordinasi yang dilakukan pemimpin dengan unit kerja lain dalam bekerja
HCSL48Culture of mutual support built by the leader within the teamBudaya saling mendukung yang dibangun pimpinan dalam tim
Note. Items were administered in Bahasa Indonesia following forward–backward translation (Section 3.4). English renderings are provided for the reader; the Indonesian column reproduces the wording as administered. All items are contextualized to the management of regional government assets (Barang Milik Daerah, BMD).
Table A6. Full Item Wording: Innovative Work Behavior (IWB)—26 indicators.
ItemIndicator (English)Indikator (Bahasa Indonesia—As Administered)
IWB1Attends to BMD problems beyond one’s own unitMemperhatikan masalah pengelolaan Barang Milik Daerah di luar unit kerja
IWB2Identifies potential problems in optimizing BMD managementMengidentifikasi potensi masalah optimalisasi pengelolaan Barang Milik Daerah
IWB3Develops new methods to speed up BMD inventoryMengembangkan metode baru untuk mempercepat inventarisasi BMD
IWB4Seeks innovative ways to improve asset-data accuracyMencari cara inovatif dalam meningkatkan akurasi data aset
IWB5Finds new approaches to optimizing BMD managementMenemukan pendekatan baru optimalisasi pengelolaan Barang Milik Daerah
IWB6Generates alternative solutions for resolving BMD disputesMenghasilkan alternatif solusi dalam menyelesaikan sengketa Barang Milik Daerah
IWB7Creatively formulates solutions for idle-asset optimizationKreatif merumuskan solusi optimalisasi aset yang idle
IWB8Produces practical ideas for BMD management effectivenessMenghasilkan ide praktis efektivitas pengelolaan Barang Milik Daerah
IWB9Finds efficient ways of recording BMDMenemukan cara kerja yang efisien dalam pencatatan Barang Milik Daerah
IWB10Develops innovative approaches to BMD monitoringMengembangkan pendekatan inovatif dalam pelaksanaan monitoring pengelolaan Barang Milik Daerah
IWB11Takes initiative to improve BMD standard operating proceduresBerinisiatif memperbaiki Prosedur Operasi Standar (POS) pengelolaan Barang Milik Daerah
IWB12Arouses colleagues’ enthusiasm for new BMD systemsMembangkitkan antusiasme rekan terhadap sistem pengelolaan Barang Milik Daerah baru
IWB13Spreads enthusiasm for adopting BMD technologyMenularkan semangat penerapan teknologi pengelolaan Barang Milik Daerah
IWB14Encourages colleagues to be open to BMD system changeMendorong rekan terbuka terhadap perubahan sistem pengelolaan Barang Milik Daerah
IWB15Persuades colleagues of the benefits of BMD digitalizationMeyakinkan rekan tentang manfaat digitalisasi pengelolaan Barang Milik Daerah
IWB16Secures support for implementing an integrated BMD systemMendapat dukungan implementasi sistem pengelolaan Barang Milik Daerah yang terintegrasi
IWB17Effectively communicates the value of asset innovationEfektif mengkomunikasikan akan nilai inovasi aset
IWB18Presents BMD-improvement ideas to the teamMempresentasikan ide peningkatan pengelolaan Barang Milik Daerah kepada tim
IWB19Proposes BMD-efficiency ideas to the leaderMengusulkan gagasan efisiensi pengelolaan Barang Milik Daerah kepada pimpinan
IWB20Systematically introduces BMD-optimization conceptsSistematis memperkenalkan konsep optimalisasi pengelolaan Barang Milik Daerah
IWB21Applies innovative BMD ideas in daily workMenerapkan ide inovatif pengelolaan Barang Milik Daerah sehari-hari
IWB22Persists in realizing a better asset-management systemMemiliki sikap gigih guna mewujudkan sistem pengelolaan aset yang lebih baik
IWB23Ensures BMD-data improvement ideas are implementedMemastikan ide peningkatan data Barang Milik Daerah yang diimplementasikan
IWB24Refines the BMD system based on feedbackMenyempurnakan sistem pengelolaan Barang Milik Daerah berdasarkan umpan balik
IWB25Develops applications into a comprehensive BMD systemMengembangkan aplikasi menjadi sistem pengelolaan Barang Milik Daerah yang komprehensif
IWB26Adaptively modifies innovations as neededAdaptif dalam memodifikasi inovasi sesuai kebutuhan
Table A7. Full Item Wording: Employee Job Performance (EJP)—35 indicators.
ItemIndicator (English)Indikator (Bahasa Indonesia—As Administered)
EJP1Completes BMD tasks according to standardsTingkat penyelesaian tugas pengelolaan Barang Milik Daerah sesuai standar
EJP2Meets BMD data-accuracy targetsKemampuan memenuhi target akurasi data Barang Milik Daerah
EJP3Meets the leader’s expectations for work outputPemenuhan hasil kerja terhadap ekspektasi pimpinan
EJP4Performs duties per the Governor’s BMD regulationPelaksanaan kewajiban sesuai Peraturan Gubernur Barang Milik Daerah mengenai pengelolaan Barang Milik Daerah
EJP5Reliably completes BMD reports on timeKeandalan menyelesaikan laporan pengelolaan Barang Milik Daerah tepat waktu
EJP6Achieves performance indicators per the performance agreementPencapaian indikator kinerja sesuai Perjanjian Kinerja
EJP7Consistently meets minimum BMD service standardsKonsistensi memenuhi standar pelayanan minimal pengelolaan Barang Milik Daerah
EJP8Proactively supports an unqualified (WTP) audit opinionProaktivitas mendukung capaian opini wajar tanpa pengecualian (WTP) laporan pengelolaan Barang Milik Daerah
EJP9Focuses on activities affecting SAKIP assessmentFokus pada aktivitas berdampak penilaian sistem akuntabilitas kinerja instansi pemerintah (SAKIP)
EJP10Ensures fulfillment of BMD performance-assessment aspectsKepastian pemenuhan aspek penilaian kinerja pengelolaan Barang Milik Daerah
EJP11Completes the BMD management cycle thoroughlyKelengkapan pelaksanaan siklus pengelolaan Barang Milik Daerah
EJP12Complies with mandatory BMD proceduresKepatuhan terhadap prosedur wajib pengelolaan Barang Milik Daerah
EJP13Ensures completeness of mandatory BMD documentsKepastian kelengkapan dokumen pengelolaan Barang Milik Daerah wajib
EJP14Successfully completes periodic BMD reportsKeberhasilan menyelesaikan laporan pengelolaan Barang Milik Daerah periodik
EJP15Successfully completes periodic BMD reports (second indicator)Keberhasilan menyelesaikan laporan pengelolaan Barang Milik Daerah periodik 2
EJP16Successfully completes periodic BMD reports (third indicator)Keberhasilan menyelesaikan laporan pengelolaan Barang Milik Daerah periodik 3
EJP17Reliable on crucial tasks such as BMD reconciliationKeandalan untuk tugas krusial seperti rekonsiliasi Barang Milik Daerah
EJP18Covers tasks for absent colleaguesMenggantikan tugas rekan kerja yang tidak masuk
EJP19Helps with absent colleagues’ asset workMembantu pekerjaan aset rekan kerja yang absen
EJP20Takes over verification tasks for unavailable colleaguesMengambil alih tugas verifikasi rekan kerja berhalangan
EJP21Helps overwhelmed colleagues with BMD workMembantu rekan kerja saat kewalahan menyusun pengelolaan Barang Milik Daerah
EJP22Shares inventory tasks with overloaded colleaguesBerbagi tugas inventarisasi dengan rekan kerja yang overload
EJP23Helps ease colleagues’ burden at deadlinesMembantu meringankan beban rekan saat deadline
EJP24Takes initiative to prepare BMD data for the leaderInisiatif menyiapkan data pengelolaan Barang Milik Daerah untuk pimpinan
EJP25Proactively supports the leader in BMD meetingsProaktif mendukung pimpinan dalam rapat pengelolaan Barang Milik Daerah
EJP26Voluntarily helps the leader draft BMD policySukarela membantu pimpinan menyusun kebijakan terkait pengelolaan Barang Milik Daerah
EJP27Listens to colleagues’ BMD-related concernsMendengarkan keluhan rekan tentang pengelolaan Barang Milik Daerah
EJP28Makes time to consult on asset problemsMenyediakan waktu konsultasi masalah aset
EJP29Is a confidant for colleagues stressed by auditsMenjadi tempat curhat rekan stress audit
EJP30Helps orient new BPAD DKI Jakarta staffMembantu orientasi pegawai baru bidang BPAD DKI Jakarta
EJP31Guides new staff to understand the BMD systemMembimbing pegawai baru memahami sistem pengelolaan Barang Milik Daerah
EJP32Ensures new staff understand BMD regulationsMemastikan pegawai baru paham regulasi pengelolaan Barang Milik Daerah
EJP33Shares information on BMD policy changesMembagikan informasi perubahan kebijakan pengelolaan Barang Milik Daerah
EJP34Ensures colleagues receive BMD system updatesMemastikan rekan kerja mendapat update sistem pengelolaan Barang Milik Daerah
EJP35Communicates inter-unit coordination in BMD managementKomunikatif menyampaikan koordinasi antar unit dalam pengelolaan Barang Milik Daerah

References

  1. United Nations. Transforming Our World: The 2030 Agenda for Sustainable Development; UN General Assembly: New York, NY, USA, 2015. [Google Scholar]
  2. Pfeffer, J. Building sustainable organizations: The human factor. Acad. Manag. Perspect. 2010, 24, 34–45. [Google Scholar] [CrossRef]
  3. Lokuwaduge, C.S.D.S.; De Silva, K.M. Determinants of public sector asset management: A conceptual review. Int. J. Public Sect. Manag. 2018, 31, 717–733. [Google Scholar]
  4. Republic of Indonesia. Government Regulation No. 27/2014 Jo. 28/2020 on the Management of State/Regional Owned Assets; Government of Indonesia: Jakarta, Indonesia, 2020.
  5. Tummers, L.; Bekkers, V. Policy implementation, street-level bureaucracy, and the importance of discretion. Public Manag. Rev. 2014, 16, 527–547. [Google Scholar]
  6. Vigoda-Gadot, E.; Beeri, I. Change-oriented organizational citizenship behavior in public administration: The power of leadership and the cost of organizational politics. J. Public Adm. Res. Theory 2012, 22, 573–596. [Google Scholar] [CrossRef]
  7. Di Fabio, A.; Peiró, J.M. Human Capital Sustainability Leadership to promote sustainable development and healthy organizations: A new scale. Sustainability 2018, 10, 2413. [Google Scholar] [CrossRef]
  8. Hood, C. The “new public management” in the 1980s: Variations on a theme. Account. Organ. Soc. 1995, 20, 93–109. [Google Scholar] [CrossRef]
  9. Pollitt, C.; Bouckaert, G. Public Management Reform: A Comparative Analysis—Into the Age of Austerity, 4th ed.; Oxford University Press: Oxford, UK, 2017. [Google Scholar]
  10. De Jong, J.; Den Hartog, D. Measuring innovative work behaviour. Creat. Innov. Manag. 2010, 19, 23–36. [Google Scholar] [CrossRef]
  11. Peiró, J.M.; Di Fabio, A. Human capital sustainability leadership and healthy organizations: Building sustainable workplaces. Front. Psychol. 2024, 15, 1352128. [Google Scholar] [CrossRef]
  12. Slemp, G.R.; Kern, M.L.; Patrick, K.J.; Ryan, R.M. Leader autonomy support in the workplace: A meta-analytic review. Motiv. Emot. 2018, 42, 706–724. [Google Scholar] [CrossRef] [PubMed]
  13. Audenaert, M.; Decramer, A.; George, B.; Verschuere, B.; Van Waeyenberg, T. When employee performance management affects individual innovation in public organizations: The role of consistency and LMX. Int. J. Hum. Resour. Manag. 2020, 31, 815–834. [Google Scholar]
  14. Bysted, R.; Jespersen, K.R. Exploring managerial mechanisms that influence innovative work behaviour: Comparing private and public employees. Public Manag. Rev. 2014, 16, 217–241. [Google Scholar]
  15. Ryan, R.M.; Deci, E.L. Self-Determination Theory: Basic Psychological Needs in Motivation, Development, and Wellness; Guilford Publications: New York, NY, USA, 2017. [Google Scholar]
  16. Deci, E.L.; Olafsen, A.H.; Ryan, R.M. Self-determination theory in work organizations: The state of a science. Annu. Rev. Organ. Psychol. Organ. Behav. 2017, 4, 19–43. [Google Scholar] [CrossRef]
  17. Deci, E.L.; Ryan, R.M. The “what” and “why” of goal pursuits: Human needs and the self-determination of behavior. Psychol. Inq. 2000, 11, 227–268. [Google Scholar] [CrossRef]
  18. Gagné, M.; Deci, E.L. Self-determination theory and work motivation. J. Organ. Behav. 2005, 26, 331–362. [Google Scholar] [CrossRef]
  19. Van den Broeck, A.; Ferris, D.L.; Chang, C.H.; Rosen, C.C. A review of self-determination theory’s basic psychological needs at work. J. Manag. 2016, 42, 1195–1229. [Google Scholar] [CrossRef]
  20. Vaamonde, J.D.; Peiró, J.M. Sustainability and well-being at work: Toward an integrative agenda. Sustainability 2025, 17, 1124. [Google Scholar]
  21. Hargreaves, A.; Fink, D. Sustainable Leadership; Jossey-Bass: San Francisco, CA, USA, 2006. [Google Scholar]
  22. Davis, J.H.; Schoorman, F.D.; Donaldson, L. Toward a stewardship theory of management. Acad. Manag. Rev. 1997, 22, 20–47. [Google Scholar] [CrossRef]
  23. Khalil, S.H.; Shah, S.H.A.; Khalil, S.M. Sustaining work outcomes through human capital sustainability leadership. Leadersh. Organ. Dev. J. 2021, 42, 886–902. [Google Scholar] [CrossRef]
  24. Effendi, M.; Setiawan, M.; Soekarno, S. Human capital sustainability leadership and adaptive performance: Evidence from Southeast Asia. J. Manag. Dev. 2024, 43, 215–232. [Google Scholar]
  25. Ministry of Administrative and Bureaucratic Reform of the Republic of Indonesia. Regulation of the Minister No. 6 of 2022 on Core Values of Civil Servants (BerAKHLAK); MENPANRB: Jakarta, Indonesia, 2022. [Google Scholar]
  26. Pless, N.M.; Maak, T. Responsible leadership: Pathways to the future. J. Bus. Ethics 2011, 98, 3–13. [Google Scholar] [CrossRef]
  27. Brown, M.E.; Treviño, L.K.; Harrison, D.A. Ethical leadership: A social learning perspective for construct development and testing. Organ. Behav. Hum. Decis. Process. 2005, 97, 117–134. [Google Scholar] [CrossRef]
  28. Robertson, J.L.; Barling, J. Greening organizations through leaders’ influence on employees’ pro-environmental behaviors. J. Organ. Behav. 2013, 34, 176–194. [Google Scholar]
  29. Janssen, O. Job demands, perceptions of effort-reward fairness and innovative work behaviour. J. Occup. Organ. Psychol. 2000, 73, 287–302. [Google Scholar] [CrossRef]
  30. De Vries, H.; Bekkers, V.; Tummers, L. Innovation in the public sector: A systematic review and future research agenda. Public Adm. 2016, 94, 146–166. [Google Scholar]
  31. Damanpour, F.; Schneider, M. Characteristics of innovation and innovation adoption in public organizations: Assessing the role of managers. J. Public Adm. Res. Theory 2009, 19, 495–522. [Google Scholar]
  32. Borins, S. Encouraging innovation in the public sector. J. Intellect. Cap. 2001, 2, 310–319. [Google Scholar] [CrossRef]
  33. Osborne, S.P.; Brown, L. Managing Change and Innovation in Public Service Organizations; Routledge: London, UK, 2005. [Google Scholar]
  34. Edmondson, A.C. Psychological safety and learning behavior in work teams. Adm. Sci. Q. 1999, 44, 350–383. [Google Scholar] [CrossRef]
  35. Liu, D.; Chen, X.P.; Yao, X. From autonomy to creativity: A multilevel investigation of the mediating role of harmonious passion. J. Appl. Psychol. 2011, 96, 294–309. [Google Scholar] [CrossRef] [PubMed]
  36. Perry, J.L.; Wise, L.R. The motivational bases of public service. Public Adm. Rev. 1990, 50, 367–373. [Google Scholar] [CrossRef]
  37. Atatsi, E.A.; Stoffers, J.; Kil, A. Factors affecting employee performance: A systematic literature review. J. Adv. Manag. Res. 2019, 16, 329–351. [Google Scholar] [CrossRef]
  38. Koopmans, L.; Bernaards, C.M.; Hildebrandt, V.H.; De Vet, H.C.; Van der Beek, A.J. Construct validity of the individual work performance questionnaire. J. Occup. Environ. Med. 2014, 56, 331–337. [Google Scholar] [CrossRef] [PubMed]
  39. Bovaird, T.; Loeffler, E. From engagement to co-production: The contribution of users and communities to outcomes and public value. Volunt. Int. J. Volunt. Nonprofit Organ. 2012, 23, 1119–1138. [Google Scholar] [CrossRef]
  40. Ferlie, E.; Ashburner, L.; Fitzgerald, L.; Pettigrew, A. The New Public Management in Action; Oxford University Press: Oxford, UK, 1996. [Google Scholar]
  41. Amabile, T.M.; Schatzel, E.A.; Moneta, G.B.; Kramer, S.J. Leader behaviors and the work environment for creativity: Perceived leader support. Leadersh. Q. 2004, 15, 5–32. [Google Scholar] [CrossRef]
  42. Khalil, S.A.; Khan, M.A.; Mahmood, K. Sustainable leadership and innovative work behaviour: The mediating role of organizational learning culture. Sustainability 2021, 13, 12081. [Google Scholar]
  43. Yuan, F.; Woodman, R.W. Innovative behavior in the workplace: The role of performance and image outcome expectations. Acad. Manag. J. 2010, 53, 323–342. [Google Scholar] [CrossRef]
  44. Hammond, M.M.; Neff, N.L.; Farr, J.L.; Schwall, A.R.; Zhao, X. Predictors of individual-level innovation at work: A meta-analysis. Psychol. Aesthet. Creat. Arts 2011, 5, 90–105. [Google Scholar] [CrossRef]
  45. Demircioglu, M.A. The effects of empowerment practices on perceived barriers to innovation: Evidence from public organizations. Int. J. Public Adm. 2018, 41, 1302–1313. [Google Scholar] [CrossRef]
  46. Reb, J.; Narayanan, J.; Chaturvedi, S. Leading mindfully: Two studies on the influence of supervisor trait mindfulness on employee well-being and performance. Mindfulness 2014, 5, 36–45. [Google Scholar] [CrossRef]
  47. Ministry of Home Affairs of the Republic of Indonesia. Regulation of the Minister No. 19/2016 Jo. 47/2021 on the Management of Regional Government Assets (Barang Milik Daerah); Ministry of Home Affairs: Jakarta, Indonesia, 2021.
  48. Hair, J.F.; Hult, G.T.M.; Ringle, C.M.; Sarstedt, M. A Primer on Partial Least Squares Structural Equation Modeling (PLS-SEM), 3rd ed.; Sage: Thousand Oaks, CA, USA, 2022. [Google Scholar]
  49. Hinkin, T.R. A brief tutorial on the development of measures for use in survey questionnaires. Organ. Res. Methods 1998, 1, 104–121. [Google Scholar] [CrossRef]
  50. MacKenzie, S.B.; Podsakoff, P.M.; Podsakoff, N.P. Construct measurement and validation procedures in MIS and behavioral research: Integrating new and existing techniques. MIS Q. 2011, 35, 293–334. [Google Scholar] [CrossRef]
  51. Carpenter, S. Ten steps in scale development and reporting: A guide for researchers. Commun. Methods Meas. 2018, 12, 25–44. [Google Scholar] [CrossRef]
  52. Beaton, D.E.; Bombardier, C.; Guillemin, F.; Ferraz, M.B. Guidelines for the process of cross-cultural adaptation of self-report measures. Spine 2000, 25, 3186–3191. [Google Scholar] [CrossRef] [PubMed]
  53. Sarstedt, M.; Hair, J.F.; Cheah, J.H.; Becker, J.M.; Ringle, C.M. How to specify, estimate, and validate higher-order constructs in PLS-SEM. Australas. Mark. J. 2019, 27, 197–211. [Google Scholar] [CrossRef]
  54. Lawshe, C.H. A quantitative approach to content validity. Pers. Psychol. 1975, 28, 563–575. [Google Scholar] [CrossRef]
  55. Brislin, R.W. Back-translation for cross-cultural research. J. Cross-Cult. Psychol. 1970, 1, 185–216. [Google Scholar] [CrossRef]
  56. Podsakoff, P.M.; MacKenzie, S.B.; Podsakoff, N.P. Sources of method bias in social science research and recommendations on how to control it. Annu. Rev. Psychol. 2012, 63, 539–569. [Google Scholar] [CrossRef] [PubMed]
  57. Kock, N. Common method bias in PLS-SEM: A full collinearity assessment approach. Int. J. e-Collab. 2015, 11, 1–10. [Google Scholar]
  58. Shmueli, G.; Sarstedt, M.; Hair, J.F.; Cheah, J.H.; Ting, H.; Vaithilingam, S.; Ringle, C.M. Predictive model assessment in PLS-SEM: Guidelines for using PLSpredict. Eur. J. Mark. 2019, 53, 2322–2347. [Google Scholar] [CrossRef]
  59. Zhao, X.; Lynch, J.G.; Chen, Q. Reconsidering Baron and Kenny: Myths and truths about mediation analysis. J. Consum. Res. 2010, 37, 197–206. [Google Scholar] [CrossRef]
  60. Henseler, J.; Ringle, C.M.; Sarstedt, M. A new criterion for assessing discriminant validity in variance-based structural equation modeling. J. Acad. Mark. Sci. 2015, 43, 115–135. [Google Scholar] [CrossRef]
  61. Fornell, C.; Larcker, D.F. Evaluating structural equation models with unobservable variables and measurement error. J. Mark. Res. 1981, 18, 39–50. [Google Scholar] [CrossRef]
  62. Cohen, J. Statistical Power Analysis for the Behavioral Sciences, 2nd ed.; Lawrence Erlbaum Associates: Hillsdale, NJ, USA, 1988. [Google Scholar]
  63. Hofstede, G. Culture’s Consequences: International Differences in Work-Related Values; Sage: Beverly Hills, CA, USA, 1980. [Google Scholar]
  64. Lozano, R. Envisioning sustainability three-dimensionally. J. Clean. Prod. 2008, 16, 1838–1846. [Google Scholar] [CrossRef]
Figure 1. Conceptual model of the hypothesized relationships among Human Capital Sustainability Leadership (HCSL), Innovative Work Behavior (IWB), and Employee Job Performance (EJP).
Sustainability 18 08115 g001
Figure 2. Structural model results. Standardized path coefficients (β), R2, and the mediated indirect effect with 95% bias-corrected bootstrap confidence interval. *** p < 0.001.
Sustainability 18 08115 g002
Table 1. Construct reliability and convergent validity.
AVErho_crho_aCronbach’s αConstruct
0.7370.9900.9900.989EJP
0.6890.9910.9910.990HCSL
0.8020.9910.9900.990IWB
Note. Recommended thresholds: Cronbach’s α ≥ 0.70, composite reliability (rho_a, rho_c) ≥ 0.70, AVE ≥ 0.50 [48]. EJP = Employee Job Performance; HCSL = Human Capital Sustainability Leadership; IWB = Innovative Work Behavior.
Table 2. Discriminant validity—Heterotrait–monotrait ratio (HTMT).
IWBHCSLEJPConstruct
EJP
0.765HCSL
0.8390.755IWB
Note. HTMT < 0.85 indicates discriminant validity [60].
Table 3. Discriminant validity—Fornell–Larcker criterion.
IWBHCSLEJPConstruct
0.859EJP
0.8300.758HCSL
0.8950.8340.749IWB
Note. Diagonal elements (in the original presentation, in bold) are square roots of AVE; off-diagonal elements are inter-construct correlations. The criterion requires diagonal values to exceed corresponding row/column correlations [61].
Table 4. Hypothesis testing results.
Decision95% CIptSEβPathHypothesis
Supported[0.793, 0.868]<0.00137.2700.0220.834HCSL → IWBH1
Supported[0.234, 0.531]<0.0014.2110.0910.383IWB → EJPH2
Supported<0.0014.8790.0900.438HCSL → EJPH3
Supported[0.194, 0.440]<0.0014.2470.0750.319HCSL → IWB → EJPH4
Note. β = standardized path coefficient; SE = standard deviation of the bootstrap distribution; CI = bias-corrected and accelerated 95% bootstrap confidence interval (5000 subsamples). H4 corresponds to the specific indirect effect.
Table 5. PLSpredict results.
MAERMSEQ2predictConstruct
0.4800.6590.570EJP
0.3480.5600.691IWB
Note. Q2predict > 0 indicates predictive relevance beyond mean prediction [58].
Disclaimer/Publisher’s Note: The statements, opinions and data contained in all publications are solely those of the individual author(s) and contributor(s) and not of MDPI and/or the editor(s). MDPI and/or the editor(s) disclaim responsibility for any injury to people or property resulting from any ideas, methods, instructions or products referred to in the content.