Article

TOPSIS-Based MCDM Approach for Prioritizing Biomass Resources for Sustainable Bioenergy Development in Ethiopia: Techno-Economic and Availability Assessment

by
Teshale Tadesse Fufa
1,2,
Ludovic Montastruc
1,*,
Stéphane Negny
1,
Léa van der Werf
1,
Abubeker Yimam
2 and
Brook Tesfamichael
2
1
Laboratoire de Génie Chimique, Université de Toulouse, CNRS, INPT, UPS, 31432 Toulouse, France
2
School of Chemical and Bio Engineering, College of Technology and Built Environment, Addis Ababa University, Addis Ababa P.O. Box 1176, Ethiopia
*
Author to whom correspondence should be addressed.
Sustainability 2026, 18(16), 8112; https://doi.org/10.3390/su18168112
Submission received: 27 April 2026 / Revised: 13 July 2026 / Accepted: 27 July 2026 / Published: 9 August 2026
(This article belongs to the Section Environmental Sustainability and Applications)

Abstract

Bioenergy development from biomass resources requires multi-criteria decision-making (MCDM) methods to rank and select suitable feedstock alternatives. Conventional TOPSIS (Technique for Order Preference by Similarity to Ideal Solution) is a widely used MCDM method that assists in selecting alternatives based on their relative closeness to the ideal solution. Unlike the existing TOPSIS, which provides only an overall ranking of alternatives, this study proposes a framework that integrates TOPSIS ranking with threshold-based performance classification and mapping to enable a more comprehensive assessment and support decision-making, thereby improving the interpretability of complex multi-criteria decision problems. The proposed framework was applied to evaluate, rank, and select eight potential biomass feedstocks in Ethiopia by integrating feedstock availability, technological readiness, and economic criteria. The ranking results indicate that molasses is the most suitable, followed by non-edible oil crops (castor seed, Ethiopian mustard, and Jatropha curcas) and lignocellulosic residues (cereal, cane, and coffee residues), while water hyacinth ranked lowest. The results were mapped into a strategic implementation timeline, with molasses prioritized for the short term, non-edible oil crops for the medium term, and lignocellulosic residues for the long term in Ethiopia’s bioenergy development. The study further supports decision-makers in strategic energy planning and facilitates bioenergy development.

1. Introduction

Sustainable bioenergy development from renewable biomass has gained increasing global attention due to its contribution to energy security, fossil fuel substitution, and socio-economic development [1,2]. Biomass-based biorefineries offer significant potential to produce biofuels and high-value bio-based chemicals, positioning agro-industrial residues as promising alternatives to fossil-based resources [3,4]. Ethiopia possesses diverse agro-industrial biomass resources derived from cereal crops, non-edible oilseeds, sugarcane processing, coffee production, and other value-chain residues. These resources are widely distributed across the country and represent substantial potential for sustainable bioenergy development.
Among the most promising feedstocks is sugarcane molasses [5,6]. Ethiopia’s eight operational sugar factories generate over 300,000 tons of molasses annually, and ongoing industrial expansion is expected to further increase availability [6,7]. However, only three factories currently convert molasses into bioethanol, operating at approximately 6% of their theoretical capacity [6,7]. Despite its significant annual production, molasses remains underutilized due to infrastructural limitations, technological gaps, investment constraints, and policy-related challenges. Effective utilization could produce an estimated 326 million liters of ethanol per year [7].
Lignocellulosic biomass represents another major resource category, including sugarcane bagasse [8], coffee pulp and husk [9], and cereal residues [10]. Sugarcane bagasse, generated at approximately 0.28 tons per ton of processed cane [11], is partly used for internal energy generation in sugar factories, while surplus quantities are often discarded or inefficiently utilized [11,12]. Similarly, coffee processing residues constitute 45–50% of harvested coffee cherries. With national production reaching 584,789.6 tons of green coffee in 2020, substantial quantities of pulp and husk are generated annually [9,13]. Gabisa and Gheewala [14] assessed different biomass sources in Ethiopia and reported that the bioenergy potential from crop residues alone, excluding other resources, was approximately 550 PJ/year, of which around 250 PJ/year was considered recoverable. Among crop residues, maize contributed the highest share (45%), followed by coffee husk (18%) and sorghum (15%) [14]. Similarly, A. Tolessa [10] assessed crop residue bioenergy potential across Ethiopian regions and reported that Ethiopia produces approximately 69,569–105,522 kilotons of gross cereal residues annually, of which 61–68% is technically recoverable. Although these residues are commonly used for domestic purposes in rural areas, significant surpluses remain underutilized or openly burned, contributing to environmental degradation.
Numerous studies have highlighted the potential of lignocellulosic resources for conversion into bioenergy and other value-added bio-based products, as well as the availability and utilization of biomass resources for bioenergy production. In the Ethiopian context, E.W. Gabisa and S.H. Gheewala [14], as well as A. Tolessa [10], assessed different biomass residues and indicated their suitability for bioenergy applications. Tesfamichael et al. [8,15] and Mamo et al. [16] explored biomass-to-biofuel supply chain design and planning using linear optimization models, while B. Chala et al. [13] and Woldesenbet et al. [9] evaluated coffee residues and reported their potential for bioenergy production. In addition, M. Berhanu et al. [17] and Berhanu Sugebo [18] reviewed the potential of various biomass resources to support biofuel development strategies in Ethiopia. Beyond Ethiopia, Uzoagba et al. [19] and Shane et al. [20] assessed crop residue biomass resources across Africa and highlighted their availability for bioenergy production. Similarly, L. Wietschel et al. [21], La et al. [22], A. Thorenz et al. [23] and Schaeffer et al. [24] assessed agricultural residues in the European Union, Brazil, and India, while W. Sarache et al. [25] evaluated coffee crop residues in Colombia and reported their potential for bioethanol production.
Non-edible energy crops also present considerable opportunities, particularly for biodiesel production. Ethiopian mustard (Brassica carinata) [26,27], castor (Ricinus communis) [28,29], and Jatropha curcas [28,30] are characterized by high oil content, adaptability to marginal lands, and non-edible properties, making them suitable bioenergy feedstocks [31]. Following the 2007 biofuel strategy, Ethiopia introduced ambitious biodiesel plans, including large-scale Jatropha cultivation targeting 1.6 billion liters of biodiesel by 2015 [28,32]. However, implementation has been limited due to low productivity and institutional challenges [28,31].
More recently, water hyacinth, an invasive aquatic weed affecting Lake Tana and other water bodies, has been identified as a potential non-crop feedstock [33,34]. Although its valorization could simultaneously support bioenergy production and ecosystem restoration, utilization remains constrained by harvesting difficulties, high moisture content, logistical barriers, and limited feasibility assessments [33,34].
Despite abundant biomass resources and national targets to increase domestic bioethanol production to 195 million liters by 2025 [7], Ethiopia’s bioenergy sector has stagnated over the past fifteen years. Key challenges include weak feedstock prioritization, inadequate selection mechanisms, and limited alignment between resource availability and technological readiness. Although studies have suggested the integration of various dimensions for bioenergy planning and development, significant gaps remain in the prioritization, integration, and selection of suitable feedstocks for bioenergy planning and development in Ethiopia’s bioenergy sector.
One limitation of existing studies is that they have primarily focused on biomass potential assessments or single- and multi-objective optimization models emphasizing economic and/or environmental criteria [8,15,16], while lacking multi-criteria decision-making approaches for feedstock prioritization and strategic bioenergy development. For example, Tesfamichael et al. [8,15] and Mamo et al. [16] applied single- and multi-objective linear models integrating economic and environmental criteria, but these approaches do not employ multi-criteria techniques to rank and select among diverse biomass alternatives. While such approaches identify optimal designs, they do not provide structured multi-criteria ranking and strategic selection among diverse biomass alternatives. Biomass selection for sustainable bioenergy development is inherently multi-criteria and time-dependent, requiring systematic decision-support tools.
Another limitation of previous studies on bioenergy development and planning is their predominant focus on economic and/or environmental sustainability, thereby overlooking technological maturity and availability for bioenergy development [8,15,16]. However, feedstock selection for bioenergy development and planning requires the integration of technological maturity and net availability dimensions alongside other dimensions.
Moreover, most previous studies on bioenergy planning and development in Ethiopia lack strategic time-based mapping [14,35]. They have primarily focused on single biomass potential assessments for bioenergy production while neglecting prioritization and strategic time-based mapping integrated with other dimensions, such as technological and economic criteria. However, effective bioenergy planning requires integration of feedstock availability with other dimensions for strategic planning and informed decision-making. Therefore, prioritizing and incorporating feedstock metrics with economic and technological indicators is crucial for informed decision-making and sustainable bioenergy development.
To address these, studies have applied MCDM approaches to rank and select biomass resources and renewable energy alternatives, including biomass resource assessment [36], renewable energy site selection [37], technology evaluation for waste-to-energy systems [38,39], energy planning, prioritization of renewable resources [40], and sustainability assessment of biomass supply chains [41]. For example, Ngetuny et al. (2025) [42] applied AHP to prioritize feedstocks for sustainable biogas production, while Ngando et al. (2025) [43] used AHP to rank crop residues for bioenergy production. Similarly, SAW (WSM) has been used to evaluate alternatives through weighted aggregation of criteria scores [44,45]. VIKOR and PROMETHEE have also been employed for renewable energy planning and biomass resource selection [46,47]. The selection of an appropriate MCDM method depends on factors such as study objectives, problem structure, criteria characteristics, data availability, and the required level of analytical complexity [48,49].
Among MCDM methods, TOPSIS (Technique for Order Preference by Similarity to Ideal Solution) is one of the most widely used for ranking and selecting alternatives by evaluating alternatives based on their relative closeness to a positive ideal solution and distance from a negative ideal solution. Originally developed by Hwang and Yoon, 1981 [50], TOPSIS has been enhanced through various improvements and offers a systematic framework for evaluating and comparing alternatives across multiple criteria. It has been applied in diverse decision-making problems, including material selection [51] and selection of biomass pretreatment technologies [52]. Other studies have also used TOPSIS with other methods, such as AHP, FAHP, TOPSIS, and FTOPSIS, to enhance the reliability of renewable energy assessments [53]. For instance, AHP–TOPSIS is one of the common methods used in hybrid approaches, where AHP is employed to determine criteria weights, and TOPSIS is used to rank alternatives. In the bioenergy sector, AHP–TOPSIS has been applied for biomass feedstock selection for pyrolysis [54], gasification [55], biodiesel production [56], and renewable energy planning [57]. The summarized review of MCDM applications reported in the literature for ranking and selecting suitable alternatives in the energy sector is provided in Appendix A (Table A2). Despite wide utilization for ranking and selecting various alternatives, the conventional TOPSIS provides only overall ranking lists and lacks integration of ranking results with performance classification and mapping. In this study, integration of TOPSIS ranking with threshold-based performance classification and mapping is addressed.
This study addresses the limitations discussed above, which primarily focus on biomass potential assessment, linear modeling and optimization, and the use of single or limited indicators, while neglecting multi-criteria approaches and the integration of ranking with performance-based classification and mapping for feedstock prioritization and strategic time-based planning. It achieves this by integrating multiple criteria to provide a structured framework for ranking and strategically selecting diverse biomass feedstock alternatives. Therefore, this study proposes a framework that integrates TOPSIS ranking with threshold-based performance classification and mapping for ranking and selecting potentially available feedstocks for bioenergy development in Ethiopia. This extends the existing biomass evaluation method by integrating TOPSIS ranking with threshold-based performance classification and mapping. To achieve this objective, potential biomass resources were evaluated based on feedstock availability, technological readiness, and economic criteria. The evaluation results were then integrated using TOPSIS to prioritize feedstock alternatives, followed by strategic time-based mapping for bioenergy development planning. The findings of this study will support policymakers, stakeholders, and decision-makers in feedstock selection and strategic energy planning, thereby improving the interpretability of complex multi-criteria decision problems and facilitating sustainable bioenergy development.
The remainder of this paper is organized as follows. Section 2 describes the step-by-step methodology used for criteria assessment and the TOPSIS framework. Section 3 presents the assessment results, a discussion of the findings, and the study’s limitations. Finally, Section 4 presents the conclusions drawn from the results.

2. Materials and Methods

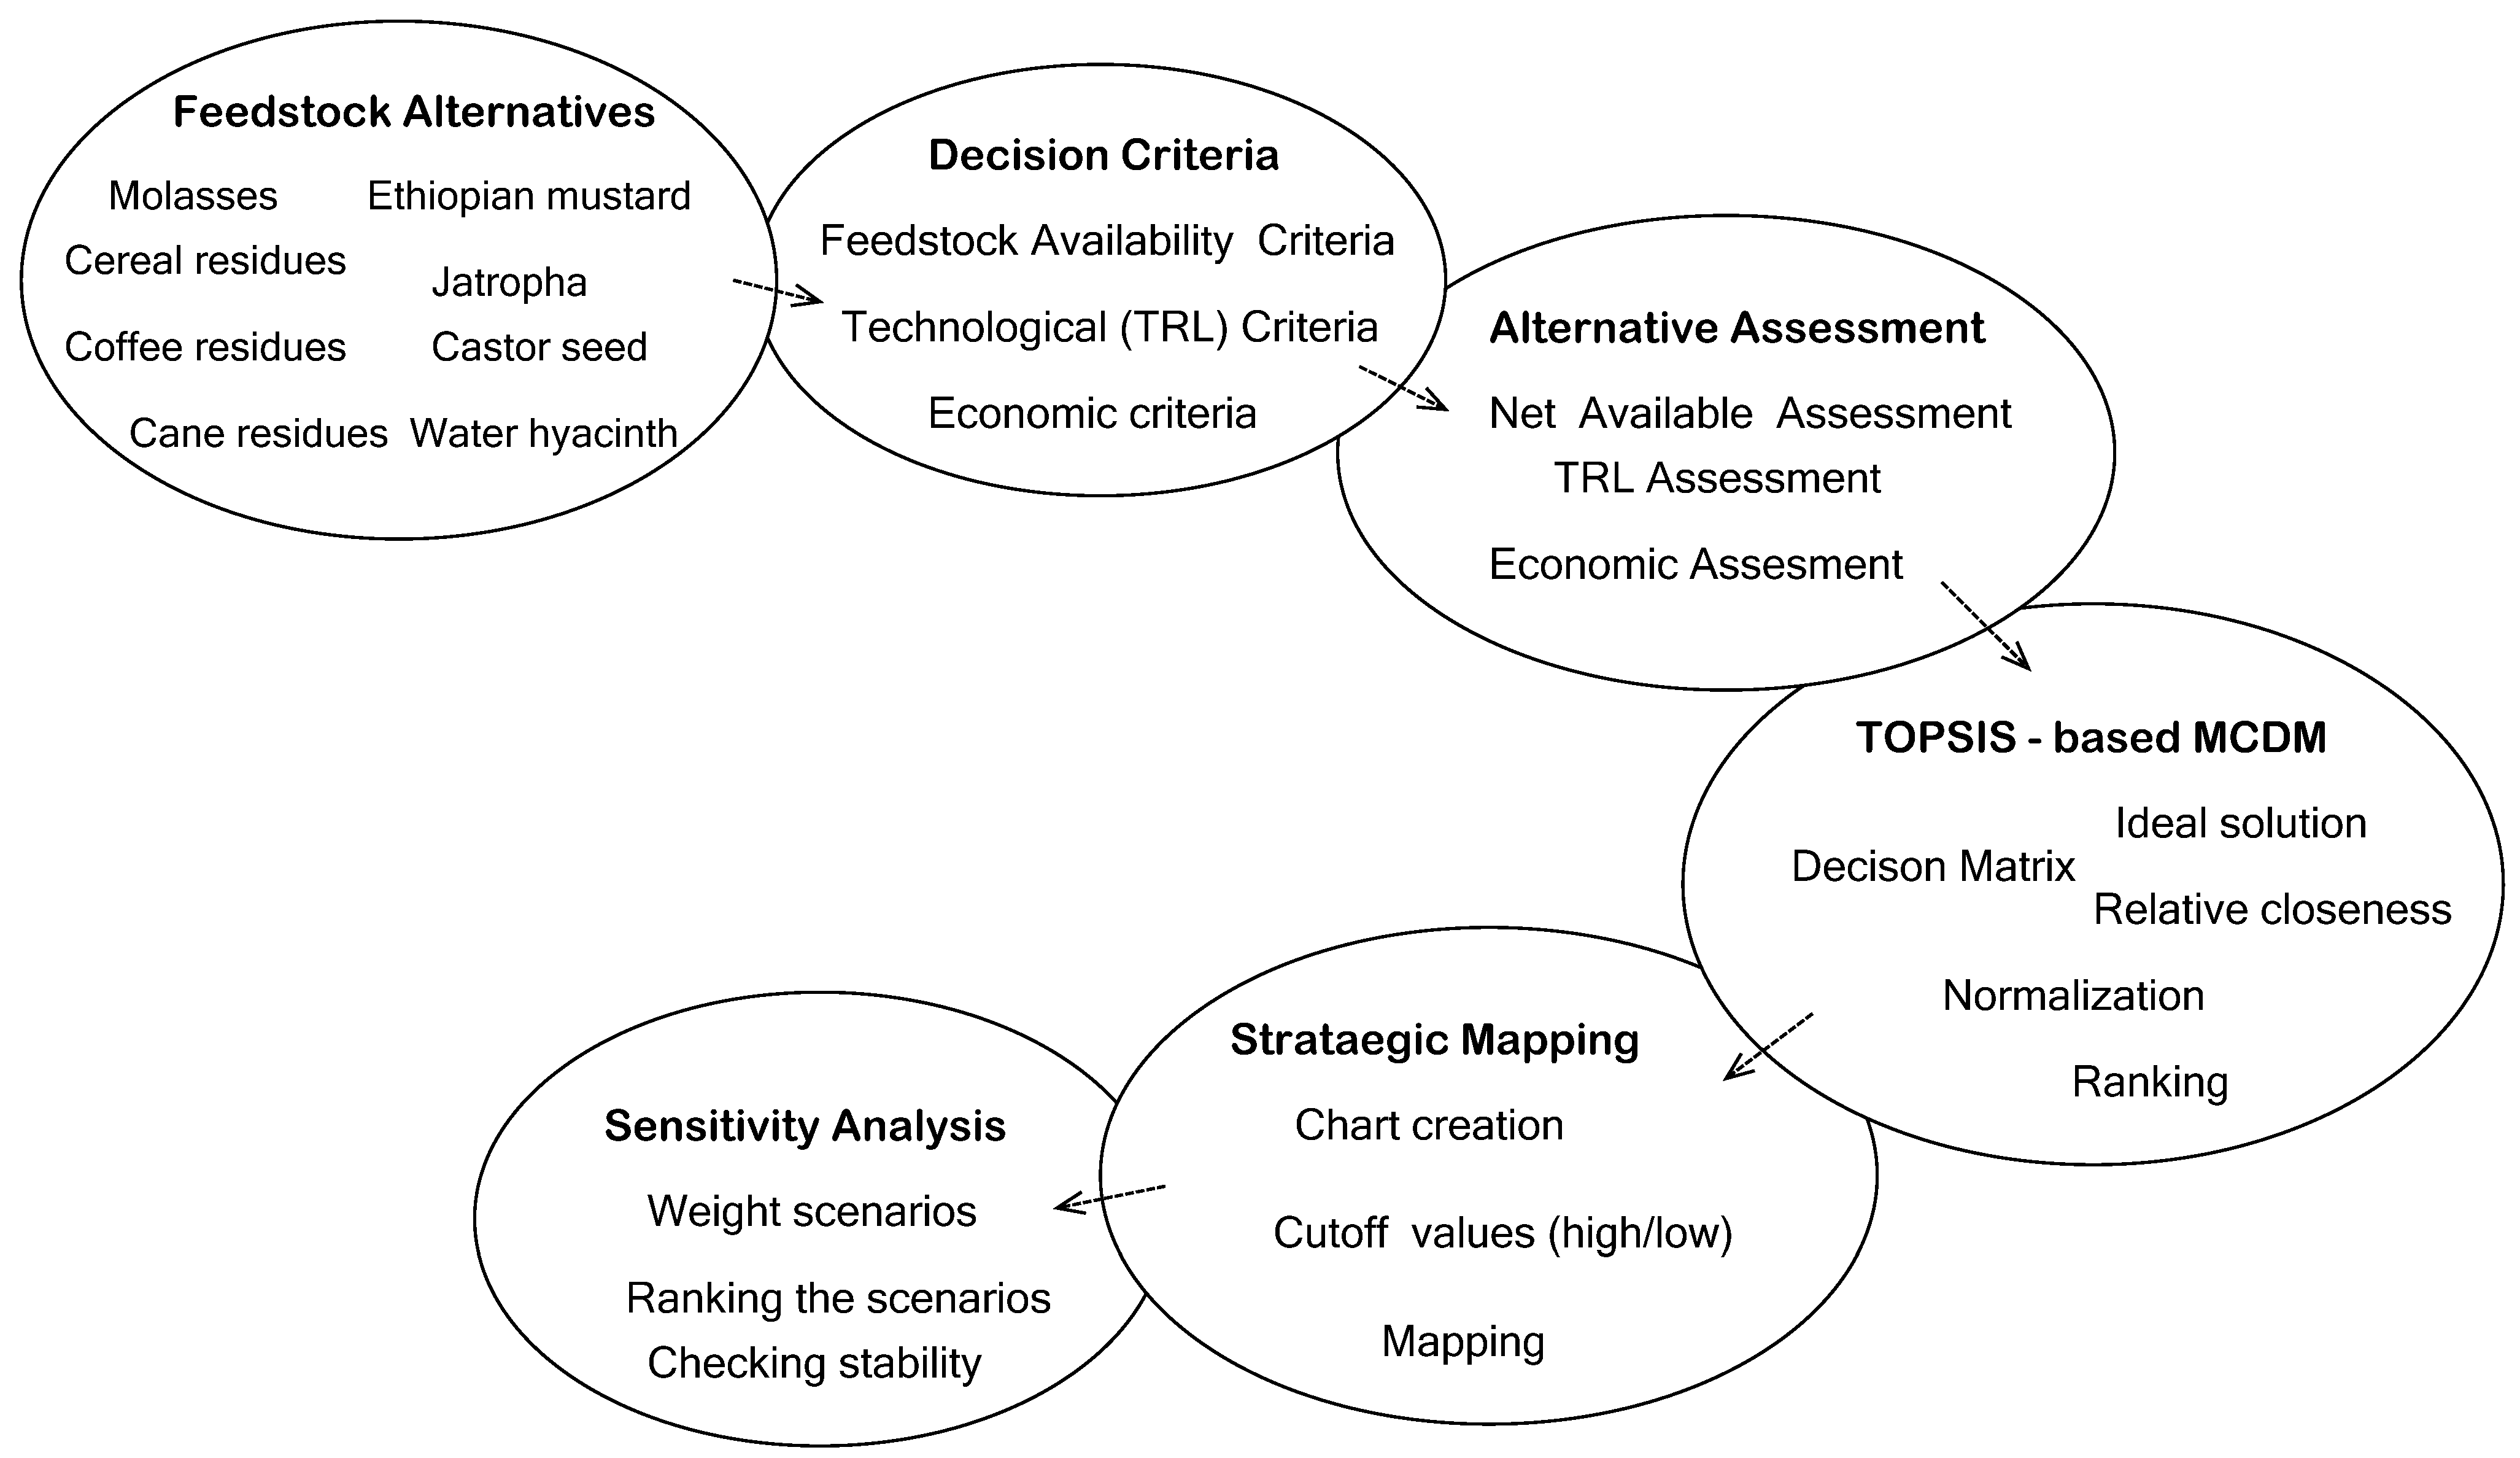
The detailed methodological framework procedures are described in the following sections. The study integrates TOPSIS ranking with performance classification and mapping to select suitable biomass feedstocks for sustainable bioenergy development in Ethiopia. The methodology consists of six main steps: (i) Identification of biomass alternatives; (ii) selection of criteria for biomass assessment; (iii) performing feedstock assessment; (iv) application of TOPSIS-based MCDM for biomass ranking and selection; (v) integrating TOPSIS ranking results with performance-based classification and mapping; and (vi) sensitivity analysis and validation. The overview of the methodological schematic is presented in Figure 1.

2.1. Identification of Alternative Feedstocks

Ethiopia possesses diverse biomass resources with potential for bioenergy production. Based on the scientific literature, national reports, and stakeholder consultations, eight major feedstocks were identified: molasses, cereal residues, coffee residues, sugarcane residues (bagasse), castor seed, Jatropha curcas, Ethiopian mustard, and water hyacinth. Each identified feedstock was evaluated through three sequential assessments: Feedstock availability assessment, using theoretical, recoverable, and net available potential; technological readiness assessment, using the technological readiness level (TRL) framework; and economic feasibility assessment, including production cost, investment requirements, revenue, return on investment (ROI), and payback period (PBP).

Selection of Criteria for Feedstock Assessment

Although various sustainability criteria have been used in biomass assessment, no standardized framework exists for comprehensive biomass ranking and selection. Previous studies have adopted economic, environmental, social, techno-economic, or multidimensional sustainability frameworks [38,58]. However, feedstock availability and technological maturity are often treated separately or embedded within economic assessments. Criteria for this study were selected based on the literature [59,60], primarily considering two aggregated aspects: (i) the importance of criteria in early-stage energy system planning and (ii) the ease of scientific validity of indicators. The ease of scientific validity refers to data accessibility, measurability, simplicity, and scientific evaluability of the criteria to support decision-making and achieve study objectives. Accordingly, selected indicators should be data-accessible, quantifiable using established methods, scientifically sound, contextually relevant, and consistent across scales (e.g., sectors, national/global levels, or timeframes) [61,62]. In addition, criteria selection was guided by their relevance to early-stage energy planning and decision-making processes, ensuring they reflect stakeholder needs and support collaborative decision-making and supply chain development. In the context of energy system planning [63], emphasis is placed on indicators relevant to national-level, early-stage planning, particularly for feedstock selection and long-term strategic prioritization.
Among sustainability dimensions, technical criteria (e.g., resource availability and technological readiness) and economic criteria are most widely applied in energy planning studies [43], while environmental and social dimensions are often partially integrated alongside technical aspects. Although this study focuses on technical and economic dimensions, environmental and social considerations are acknowledged as important for sustainability and are noted as a limitation of the study. Based on these considerations, net availability, technological readiness, and economic criteria, along with their sub-criteria, were selected due to their strong scientific validity and suitability for evaluation:
  • Feedstock Availability Criteria: The feedstock availability criterion evaluates the reliability and long-term accessibility of biomass resources. Feedstock availability includes three availability indicators: Theoretical potential, recoverable potential, and net available potential [10,14,21]
  • Economic Criteria: The economic criterion evaluates financial feasibility and investment attractiveness. It includes capital expenditure (CAPEX), operating expenditure (OPEX), feedstock purchasing cost, transportation and inventory costs, annual revenue, net profit, payback period (PBP), and return on investment (ROI) [15,64,65].
  • Technological Readiness Criteria: This criterion assesses the maturity and practical applicability of conversion technologies for each feedstock. Technological readiness level (TRL), ranging from 1 (basic research) to 9 (fully commercialized) [66], was used to classify technology maturity.

2.2. Assessment of Feedstocks

2.2.1. Feedstock Availability Assessment

The feedstock availability criterion evaluates the reliability and long-term accessibility of biomass resources. It incorporates harvested area, allocated land, crop yield, residue-to-product ratio, recoverability factors, and competing uses. For this analysis, quantitative data were obtained from FAOSTAT (2014–2021) for coffee and non-edible oil crops, Ethiopian Statistical Survey Reports (2015/16–2020/21) for cereals, and official reports from the Ethiopian Sugar Corporation for molasses and bagasse. Residue-to-product ratios and recoverability factors were compiled from the published literature, and missing values were estimated using literature-based assumptions. For strategic time horizon mapping of feedstocks, five strategic timeframes were considered: 2019 (reference year), 2025 (present), 2030 (short-term), 2035 (medium-term), and 2050 (long-term). The calculations of theoretical, recoverable, and net available biomass potentials were performed using Microsoft Excel. A detailed assessment of these availability potentials, including data sources, assumptions, and forecasting methods, is provided in Supplementary File S1.
Feedstock availability was assessed using three availability indicators: Theoretical potential, recoverable potential, and net available potential. The assessment was performed using methodologies described in [14,23,35]. Lists of abbreviations used in this manuscript are provided are in Appendix A, in Table A1.
  • Theoretical Potential Biomass: also referred to as the gross residue availability potential, represents the total annual quantity of biomass residues generated from a specific crop based on its annual production. The theoretical potential was calculated by multiplying the harvested area (ha), crop yield, and the residue-to-product ratio using the following Equation (1):
    T F P ( A n ) t = H A ( A n ) t × Y A n × R T P A n
    where TFP (An)t is theoretical potential for alternative feedstock (An) in time t, in tons; HA (An)t is harvested area or covered area for alternative feedstock (An) in time t, in hectares; Y(An)t is yield for the alternative feedstock (An) in time t, in tons per hectare; RTP (An) is residues-to-product ratio for the alternative feedstock (An).
  • Recoverable Potential Biomass: This represents a portion of the theoretical potential that can be recovered from the field without considering competing uses, recognizing that not all theoretical residues are technically recoverable for bioenergy production. It is determined by multiplying recoverable factors by theoretical feedstock potential for the specific crop using Equation (2):
    R F P ( A n ) t = T F P ( A n ) t × R F A n
    where RFP (An)t is recoverable feedstock potential for alternative feedstock (An) in time t, in tons; TFP(An)t is theoretical potential for alternative feedstock (An) in time t, in tons; RF(An) is recoverability factor for the alternative feedstock (An).
  • Net Available Potential: This indicates a portion of the recoverable potential that remains available for bioenergy development after accounting for competing uses. Biomass residues are widely utilized by local communities for animal feed, cooking fuel, composting, mulching, and other purposes, which reduces the amount of the net available for bioenergy production. The net available potential for each feedstock was determined by multiplying the recoverable potential by the availability factor of the respective crop, as shown in the following Equation (3):
    A F P ( A n ) t = R F P ( A n ) t × A F A n
    where AFP (An)t is net available potential for alternative feedstock (An) in time t, in tons; RFP(An)t is recoverable feedstock potential for alternative feedstock (An) in time t, in tons; AF(An) is availability factor for the alternative feedstock (An) (%).

2.2.2. Technological Readiness Level (TRL) Assessment

Technological readiness level (TRL), ranging from 1 (basic research) to 9 (fully commercialized) [66] was used to classify technology maturity. TRL values were assigned based on the published literature and national operational evidence [6,14,31]. For example, biodiesel production from Jatropha curcas has reached pilot-scale demonstration [31], and it was categorized as TRL 5, while bioethanol production from molasses is fully commercialized in Ethiopia and was assigned TRL 9. Assigned TRL values for all feedstocks are summarized in Appendix A, Table A4, and were used in subsequent MCDM analysis.

2.2.3. Economic Values Assessment

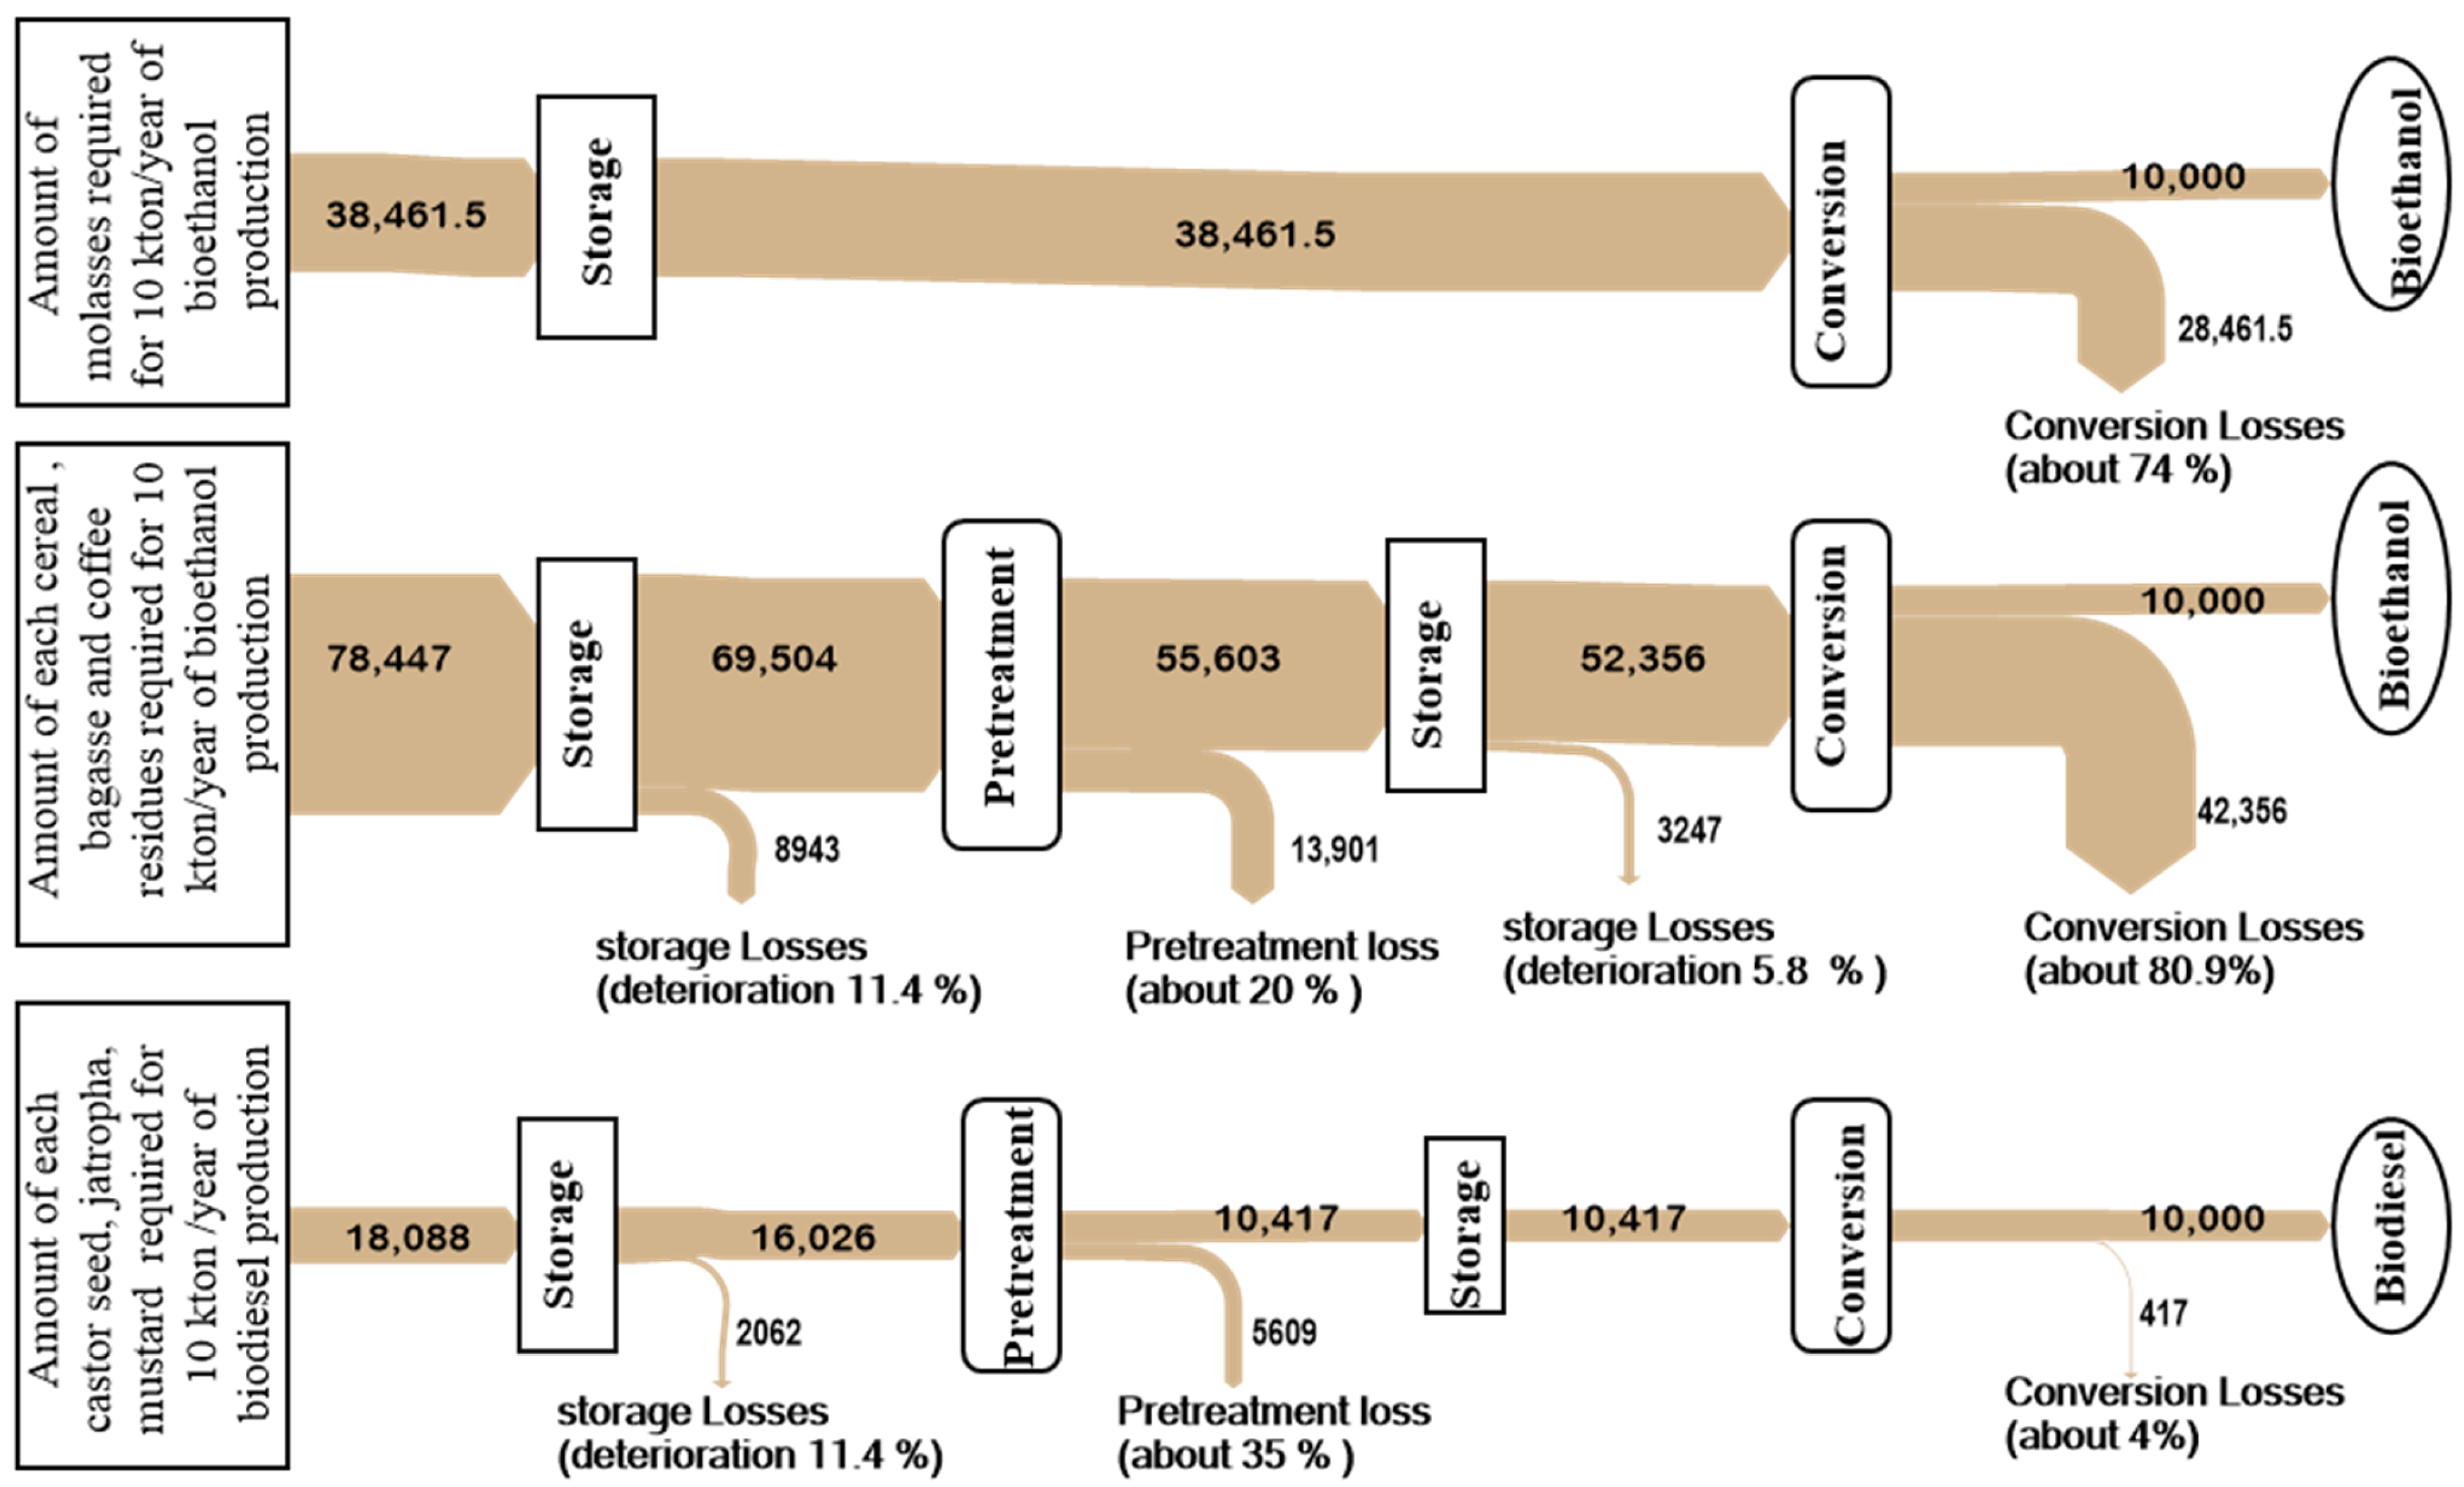
For this economic evaluation, a production basis was assumed and taken. A standardized production capacity of 10,000 tons of biofuel per year was assumed for all feedstocks to ensure comparability. The capacity and amount of feedstock and product at each stage were determined using material input−output analysis to quantify input and output flows across the supply chain, from feedstock supply to final biofuel distribution. Conversion factors for the selected processing pathways were obtained from the literature and applied to estimate material flows and production capacities at each stage [8,61,67]. Based on the reviewed literature, molasses was assumed to be converted to bioethanol via a biochemical conversion pathway, with a conversion factor of 0.26 kg/kg. For lignocellulosic biomass (bagasse, cereal residues, and coffee residues), drying and size reduction (0.8 kg/kg) were applied as pretreatment steps, followed by thermochemical gasification for bioethanol production, with a conversion factor of 0.191 kg/kg. For non-edible oil crops (Jatropha, mustard, and castor seed), solvent extraction (0.35 kg/kg) was used as the pretreatment step, followed by heterogeneous base-catalyzed transesterification for biodiesel production, with a conversion factor of 0.96 kg/kg. Based on this assumption, a biomass flow analysis was conducted to quantify input and output streams at each stage of the supply chain, from feedstock supply to final biofuel distribution. Material balances at each stage were performed to estimate the economic criteria under a uniform production basis. The resulting biomass input–output balances for each feedstock are presented in (Appendix A, Figure A1).
Subsequently, economic estimations were conducted for each stage of the supply chain under the same production basis (10 kton/year). The analysis included capital expenditure (CAPEX), operating expenditure (OPEX), feedstock cost, inventory cost, transportation cost, revenue, net profit, and payback period. These values were aggregated into the following key economic indicators: initial investment (CAPEX), total production cost (excluding CAPEX), net profit, and payback period for each feedstock. The detailed computations of the economic estimations are presented in Supplementary File S1.
Based on the capacity results obtained from input–output balances at each stage, economic criteria estimation for feedstock cost, CAPEX, OPEX, transportation and inventory cost, revenue and profit, and payback period were performed.
  • Feedstock Cost Estimation: The purchasing cost of each biomass feedstock was determined using unit price ranges reported in the literature [8,15], from which average values were adopted. The total annual feedstock purchasing cost was calculated based on the net available feedstock potential and the corresponding unit price. Feedstock purchasing costs were estimated by multiplying net available feedstock potential by average unit prices obtained from the literature.
  • Capital Expenditure (CAPEX): Initial investment costs were estimated based on the calculated production capacities. Cost data (base year of 2021) were used as reference values [8,15], and updated to the 2025 cost using Chilton’s power-law scaling method using Equation (4):
    c o s t t c o s t r e f = ( c a p a c i t y t c a p a c i t y r e f ) x ;
    where the exponent x depends on process type and cost category.
  • Operating Expenditure (OPEX): These expenses represent a critical component of economic evaluation and include both fixed and variable costs. Fixed operating costs are independent of production volume and include overheads, labor, property taxes, insurance, and depreciation. Variable operating costs depend on production levels and include expenses related to feedstock, utilities, labor, and consumables. Cost data (base year of 2021) were used as reference values [8,15], and OPEX was estimated using Chilton’s law based on production capacity.
  • Transportation and Inventory Costs: For transport cost estimation, a unit transportation cost per ton per kilometer ($/ton/km) was used as the basis for feedstocks, intermediate products, and final biofuels. Unit transportation costs ($/ton/km) from the literature [8,15] were used as the basis and multiplied by transported quantities. Then, total transportation costs were estimated by multiplying the unit transportation cost by the transported quantity. Inventory holding costs were estimated using literature-based unit storage costs and aggregated across all supply chain stages [8,15], and interpolation was performed to adjust the costs to the required processing capacity.
  • Annual Revenue: Annual revenue was estimated based on the annual production volumes of bioethanol and biodiesel and their corresponding market prices. The prices of bioethanol and biodiesel were obtained from Tesfamichael et al. [8,15].
  • Net Profit: For profitability analysis, net profit was determined by subtracting total operating costs and tax from annual revenue using Equation (5). For this, we have an income tax of 30% and a project lifetime of 20 years:
N e t   p r o f i t   =   A n n u a l   r e v e n u e     T o t a l   c o s t     T a x
  • Payback Period (PBP): Payback period, which is the time required to recover the initial investment from annual net cash flow, was determined by dividing the CAPEX by net profit using Equation (6). The PBP indicates the economic attractiveness; shorter PBP values indicate higher investment attractiveness:
P B P = C A P E X N e t   P r o f i t

2.3. Applying TOPSIS-Based MCDM for Feedstocks Ranking

This study uses a TOPSIS-based MCDM approach to evaluate, rank, and select biomass alternatives for sustainable bioenergy development in Ethiopia. TOPSIS provides a structured and computationally efficient framework through normalization, determination of ideal solutions, calculation of Euclidean distances, and estimation of relative closeness coefficients [62,68]. Due to its simplicity and structured mathematical framework, TOPSIS is widely used for solving MCDM problems. The procedures of the TOPSIS method are presented below (2.4.1–2.4.7 steps). In this study, the integration of TOPSIS ranking with threshold-based performance classification and mapping is addressed.

2.3.1. Establishing Matrix for Assessed Values

A decision matrix was constructed using the computed values for each biomass alternative. The matrix consists of n rows representing the alternatives (molasses, cereal residues, coffee residues, cane residues, castor seed, Jatropha curcas, Ethiopian mustard, and water hyacinth) and m columns representing the selected sub-criteria (shown in Table 1). The sub-criteria considered in this study include average annual net biomass availability, technological readiness level (TRL), capital expenditure (CAPEX), total production cost, net profit, and payback period. Let A1, A2, A3, …, denote the biomass alternatives among which the optimal option is to be selected.

2.3.2. Normalizing the Assessed Values

Since the evaluation criteria are expressed in different units (e.g., tons, dollars, and years), normalization was performed to convert all criteria into dimensionless values prior to aggregation and ranking. The Euclidean normalization method was applied as follows (Equation (7)):
v i j = y i j i = 1 m ( y i j ) 2
where i = 1, 2, 3, …, n represents the index of biomass alternatives along the row; j = 1, 2, 3, …, m represents the index of sub-criteria along the column; yij denotes the original value of the ith alternative under the jth sub-criterion, and vij denotes the corresponding normalized value.

2.3.3. Weight Normalizing the Decision Matrix

Following normalization of assessed values, a weight normalization of the normalized values of the decision matrix was performed by multiplying the normalized values by assigned weights to each of the criteria; the corresponding weighted normalized decision matrix was obtained. Determination of the weighted normalized decision matrix involves two stages: determining weight for each criterion, and then calculating weighted normalized values.
Assigning Criteria Weights for Normalization
Criteria weights indicate the relative importance or influence of each evaluation criterion in the decision-making process. In this study, an equal-weighting approach was assumed and used as the baseline for biomass evaluation and ranking. We selected this equal weighting because sufficient information that supports non-equal weighting was unavailable. This assumption enables a balanced assessment of alternative feedstocks while minimizing uncertainty and complexity, and it provides a neutral baseline for the decision-making process by avoiding the introduction of bias. Previous studies have reported that when there is insufficient and immature information that supports different weights for each criterion, equal weighting provides a neutral and unbiased basis for decision-making while avoiding the introduction of subjective preferences [69,70,71]. It also offers a simple and transparent approach for early-stage bioenergy planning, where reliable weighting information is limited. Accordingly, all six sub-criteria were assumed equally important and were each assigned a weight of 1/6 (0.167).
Although equal weighting provides a neutral baseline, it may influence the final ranking results. Therefore, to evaluate the reliability, stability, and robustness of the rankings obtained under the equal-weight assumption, we performed a sensitivity analysis using different weighting scenarios and validated the results using the weighted sum method. These analyses provide additional confidence in the robustness of the proposed TOPSIS-based ranking framework.
Normalizing Using Assigned Weight
Weighted normalization was determined using Equation (8) by multiplying the normalized values by assigned weights to each of the criteria, corresponding to the assigned weights:
f i j = v i j     w j
where vij represents the Euclidean-based normalized values and fij indicates the weighted normalized values (i = 1, 2, 3, …, n represents alternatives, j = 1, 2, 3, …, m represents sub-criteria), and wj represents the weight assigned to each criterion (in this study, equal weighting was assumed; therefore, wj = 0.167)

2.3.4. Determining Positive and Negative Ideal Solutions

For each criterion, the positive ideal solution (PIS) and negative ideal solution (NIS) were determined (Equation (9)). The PIS and NIS represent the best and worst values, respectively, among all alternatives for each criterion. For benefit-type criteria (e.g., biomass availability, TRL, and net profit), the objective is maximization. Hence, the maximum value represents the PIS, and the minimum value represents the NIS. For cost-type criteria (e.g., CAPEX, total production cost, and payback period), the objective is minimization. Therefore, the minimum value constitutes the PIS, while the maximum value represents the NIS:
For benefit criteria f j positive ideal = m a x i m u m f 1 j , f 2 j , , f n j f j negative ideal = m i n i m u m f 1 j , f 2 j , , f n j   F o r   cost criteria   f j positive ideal = m i n i m u m f 1 j , f 2 j , , f n j f j negative ideal = m a x i m u m f 1 j , f 2 j , , f n j
Here, index i denotes alternative feedstocks (i = 1, 2, …, n), and index j represents sub-criteria (j = 1, 2, …, m).

2.3.5. Calculating the Separation Distance

Separation distance is the distance each feedstock alternative is from both the positive and negative ideal solution, indicating how far each biomass alternative deviates from the best and worst hypothetical solutions. It was obtained using the Euclidean distance method (Equation (10)):
S i + = j = 1 m ( f i j f j   p o s i t i v e   i d e a l ) 2 ;                     i = 1 , 2 , , n S i = j = 1 m ( f i j f j n e g a t i v e   i d e a l ) 2 ;           i = 1 , 2 , , n
where Si+ and Si represent the separation distance each alternative has from the positive ideal solution and negative ideal solution, respectively.

2.3.6. Calculating the Closeness Coefficient

The relative closeness coefficient (Ci) indicates the degree to which an alternative is closer to the positive ideal solution and farther from the negative ideal solution. A higher Ci value indicates greater suitability of the alternative. This relative closeness (Ci) was determined for each alternative using Equation (11):
R e l a t i v e   c l o s e n e s s C i = S i S i + + S i ;           i = 1 , 2 , , n
where Si+ represents the distance between each feedstock and the positive ideal solution; Si denotes the distance between each feedstock and the negative ideal solution; and Ci is the relative closeness coefficient between them.

2.3.7. Ranking the Feedstocks

The biomass alternatives were ranked based on their relative closeness coefficients (Ci). Alternatives were ordered from highest to lowest (Ci), where the alternative with the maximum relative closeness was considered the most suitable for sustainable biofuel development. Thus, feedstocks were prioritized according to their suitability, with higher-ranked alternatives representing the best suitable for bioenergy investment and development. The feedstocks were ranked as described by inequality Equation (12) based on their relative closeness (Ci). The best alternative is the one with the largest closeness to the ideal solutions:
C 1 ( B e s t   C i ) C 2 C 3 C n   ( L e a s t   C i )

2.4. Integration of TOPSIS Rankings with Performance Classification and Mapping

The purpose of integrating TOPSIS ranking with performance classification and mapping is to link the TOPSIS ranking results with threshold-based performance classification and mapping, thereby providing a visual decision-support framework that illustrates the relative performance of each feedstock and supports strategic bioenergy planning. The framework enables the identification of the current performance regions of the alternatives and facilitates the development of implementation priorities and timelines for bioenergy development. This integration comprises three procedures: (i) establishing the net feedstock availability and techno-economic feasibility matrices; (ii) classifying feedstock performance into high- and low-performance categories; and (iii) performance mapping.

2.4.1. Establishing Net Availability and Techno-Economic Matrix

To facilitate decision-making and enable clear visualization of feedstock suitability through the mapping framework, a net feedstock availability−techno-economic matrix was established.
  • Techno-economic represents the technological maturity and economic feasibility of feedstock alternatives for sustainable bioenergy development. This matrix includes technological readiness level (TRL), capital expenditure (CAPEX), total production cost, net profit, and payback period (PBP).
  • Net feedstock availability represents the actual quantity of biomass available for bioenergy production after considering biomass yield, residue-to-product ratios, recoverability factors, and competing uses. This criterion reflects the availability of feedstock for sustainable bioenergy planning and decision-making.

2.4.2. Classification of Feedstock Performance (High/Low)

Following net availability and techno-economic matrix establishment, feedstocks were classified into high- and low-performance categories for both net feedstock availability and techno-economic feasibility to integrate the TOPSIS ranking with the proposed performance-mapping framework. Performance classification was based on independently calculated TOPSIS closeness coefficients for each separated criterion. Feedstocks with closeness coefficient values greater than or equal to the average closeness coefficient were classified as high performance, indicating greater proximity to the positive ideal solution, whereas those with values below the average were classified as low performance, indicating greater proximity to the negative ideal solution.
For net feedstock availability, a separate TOPSIS closeness coefficient was calculated using the weighted normalized values of the net availability criterion. Similarly, for techno-economic feasibility, separate closeness coefficients were calculated using the weighted normalized values of the aggregated techno-economic criteria, excluding the net feedstock availability criterion. In both cases, the average closeness coefficient was used as the cutoff (threshold) value to classify feedstocks into high- and low-performance categories for subsequent mapping and strategic planning.

2.4.3. Performance Mapping

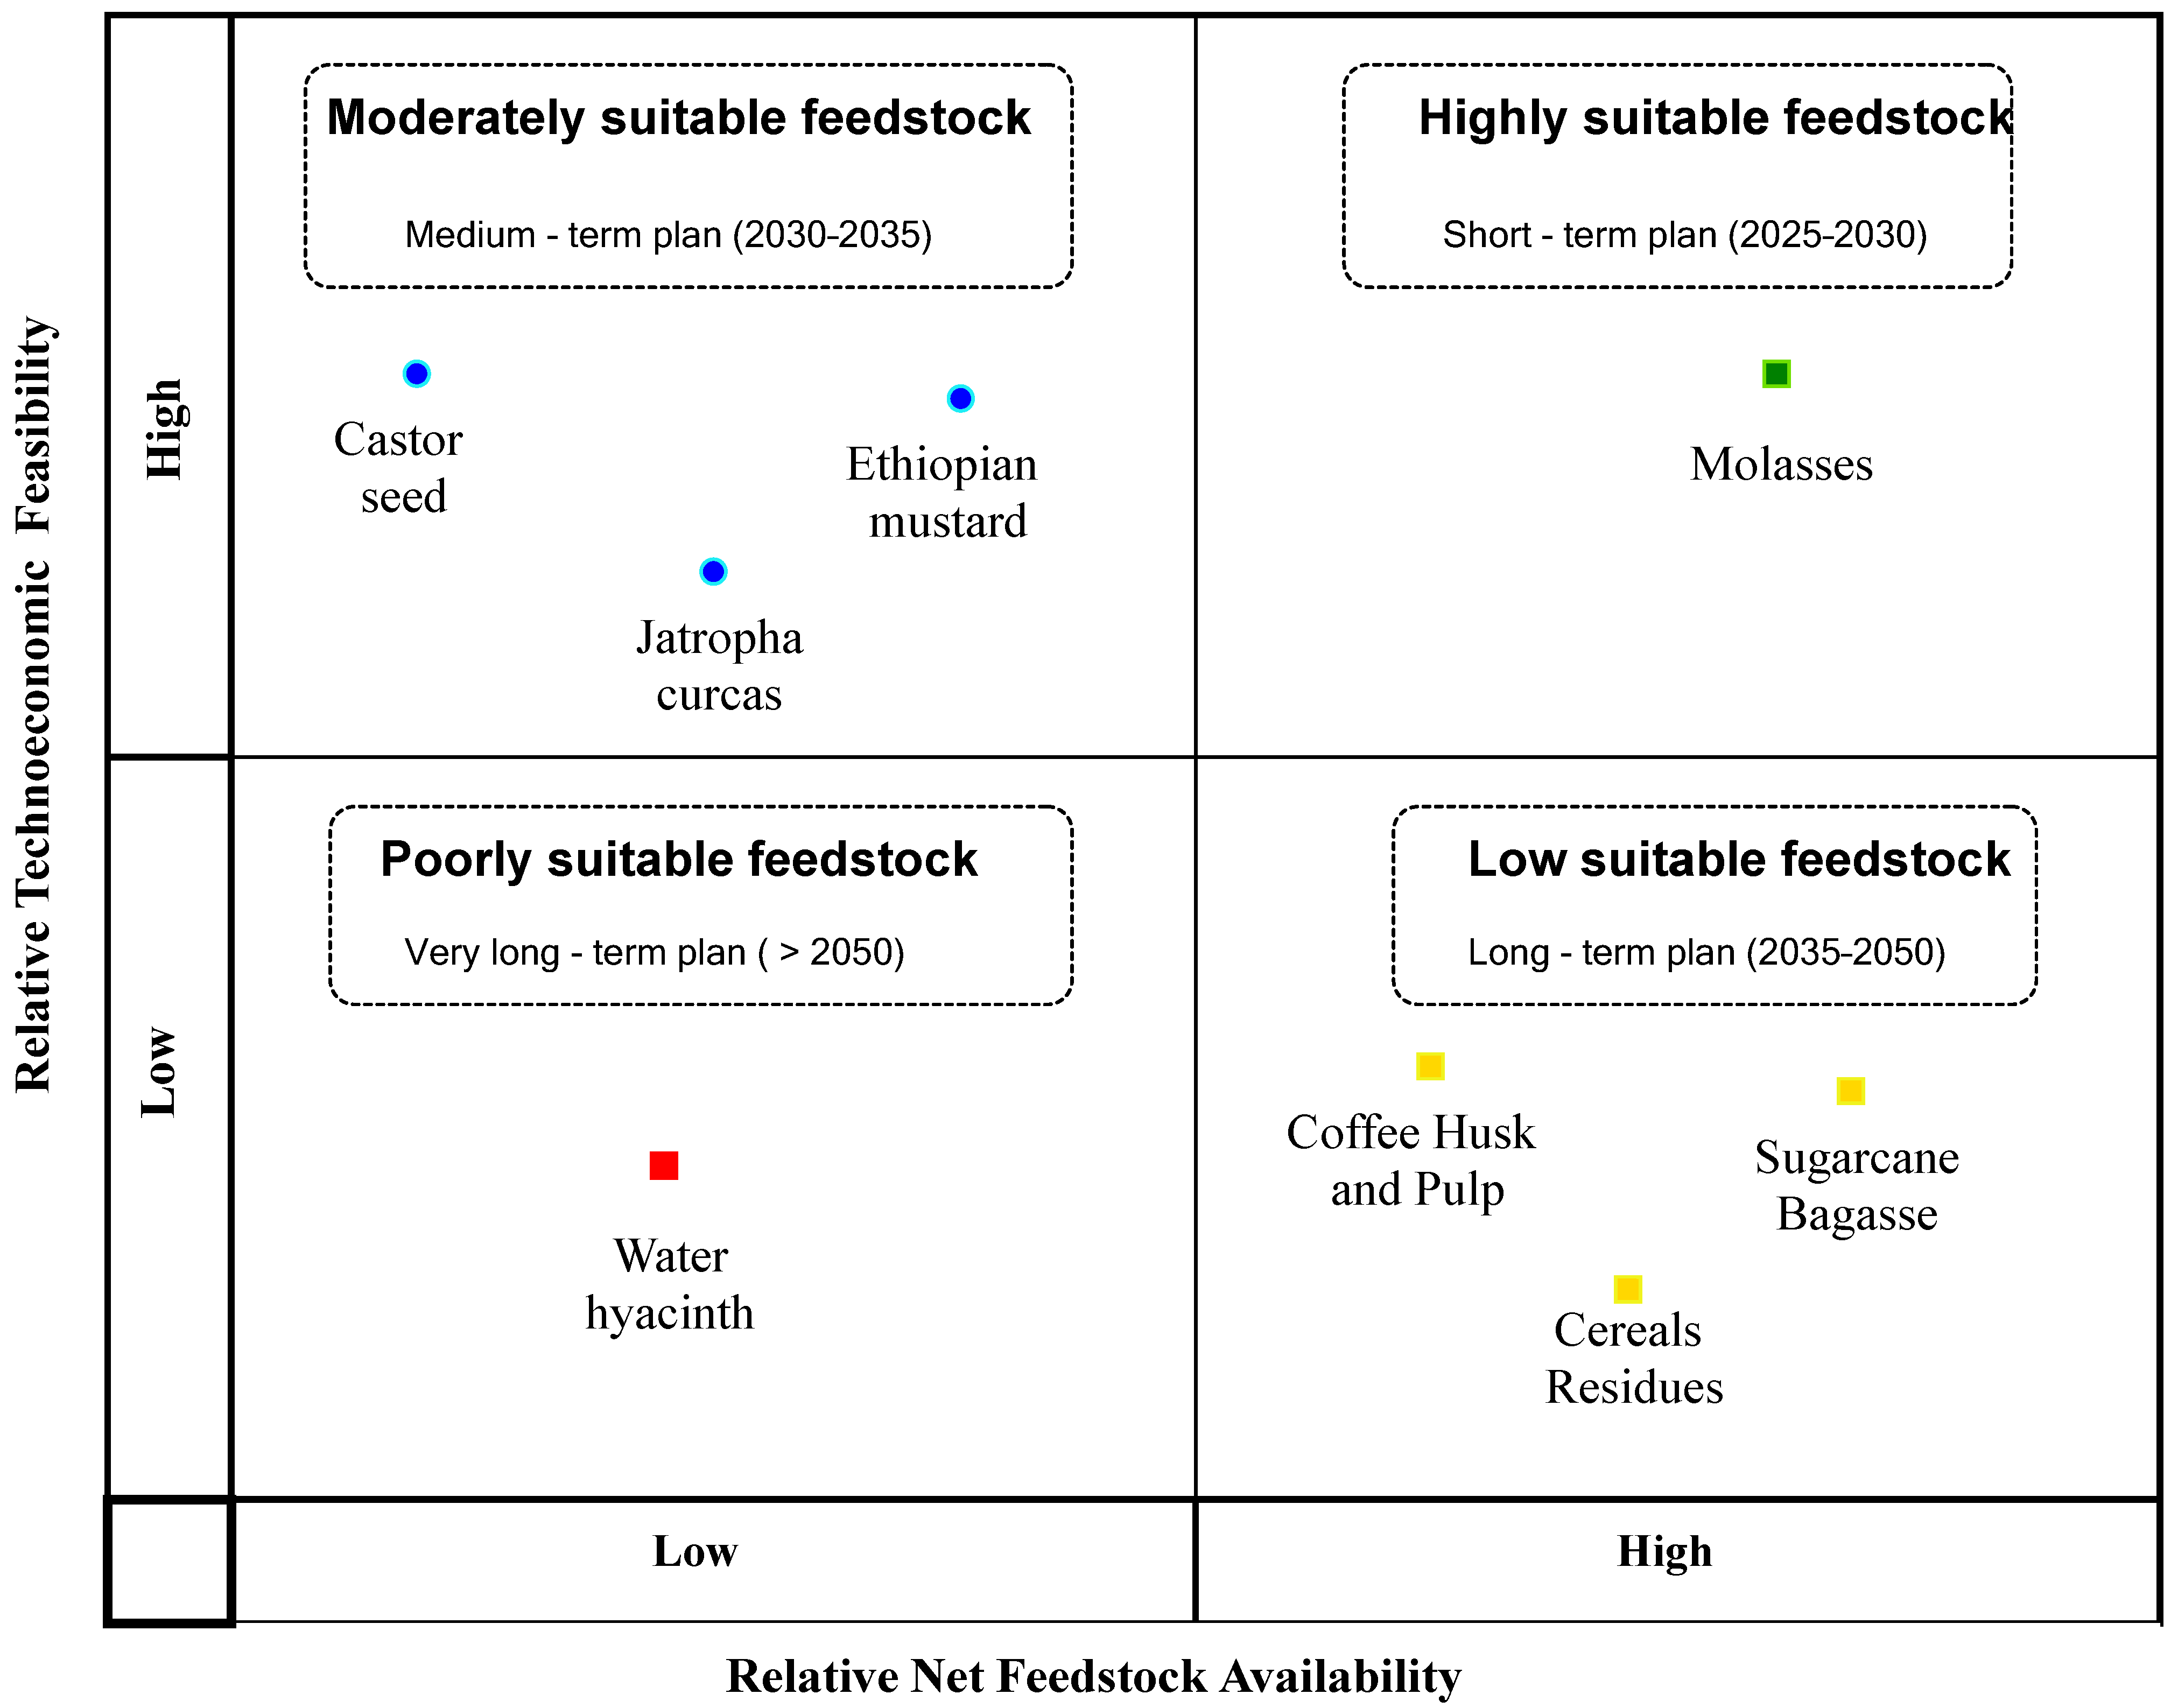
Following the classification of feedstock availability and techno-economic feasibility into high and low categories, feedstock performance mapping was performed using a modified framework adapted from established strategic mapping approaches [72]. The purpose of performing this mapping is to align feedstock suitability with implementation priority and urgency in bioenergy planning by identifying feedstocks suitable for short-term, medium-term, long-term, and very-long-term implementation according to their relative performance. A two-dimensional matrix was developed in which the x-axis represents feedstock availability (high/low) and the y-axis represents techno-economic feasibility (high/low). This matrix was used to classify and prioritize the feedstock alternatives according to their relative availability and techno-economic feasibility for sustainable bioenergy development. The matrix consists of four quadrants:
  • Highly suitable (high availability and high techno-economic feasibility).
  • Moderately suitable (low availability and high techno-economic feasibility).
  • Low suitable (high availability and low techno-economic feasibility).
  • Poorly suitable (low availability and low techno-economic feasibility).
  • Based on their relative positions within the matrix, the feedstocks were assigned into these four quadrants for strategic prioritization.

2.5. Sensitivity Analysis and Validation

2.5.1. Sensitivity Analysis Using Scenarios

Sensitivity analysis was conducted to evaluate the stability and robustness of the TOPSIS ranking results by examining the effect of changes in criterion weights on the ranking of alternative feedstocks. The analysis assesses whether the ranking remains reliable under different weighting scenarios and determines the influence of each criterion on the final prioritization of feedstocks for sustainable bioenergy development [73].
The sensitivity analysis was performed in two steps. First, seven weighting scenarios were developed. The base scenario assumed equal weights (1/6) for all six sub-criteria, whereas in Scenarios 1–6, the weight of one sub-criterion was increased to 0.5 while the remaining five sub-criteria were each assigned a weight of 0.1. The evaluated scenarios included: Base scenario (equal weights), Scenario 1 (net feedstock availability priority), Scenario 2 (TRL priority), Scenario 3 (CAPEX priority), Scenario 4 (total production cost priority), Scenario 5 (net profit priority), and Scenario 6 (payback period priority). The detailed weighting schemes are provided in Supplementary File S2 (Table S1).
Second, for each scenario, a weighted normalized decision matrix was generated by multiplying the normalized values by the corresponding scenario-specific weights. The positive and negative ideal solutions were then determined, followed by the calculation of the Euclidean distances and relative closeness coefficients. Finally, the feedstocks were ranked according to their closeness coefficients under each weighting scenario, and the results were compared with the base scenario to evaluate ranking stability and robustness.

2.5.2. Validation Using WSM

To strengthen and validate the robustness of the proposed framework, the TOPSIS ranking results were validated using the weighted sum method (WSM). The rankings obtained from TOPSIS were compared with those generated by WSM using the same feedstock alternatives and evaluation criteria. The WSM analysis was conducted in four steps. First, the original assessment values were normalized using the min–max normalization method (Equation (13)) to transform all criteria into dimensionless values. Second, weighted normalization was performed by assigning equal weights (1/6) to each sub-criterion (Equation (14)). Third, the weighted normalized values were aggregated using the weighted linear summation method (Equation (15)) to obtain the overall performance score for each feedstock. Finally, the aggregated scores were ranked, where higher scores indicate higher-priority feedstocks. The resulting WSM rankings were then compared with the TOPSIS rankings to assess the consistency and validity of the proposed TOPSIS-based framework. For normalization, different equations were applied for benefit and cost criteria, as presented below:
F o r   b e n e f i t   c r i t e r i a ,           v i j = y i j y i j m i n y i j m a x y i j m i n F o r   c o s t   c r i t e r i a ,           v i j = y i j m a x y i j y i j m a x y i j m i n
N i j = v i j     w j
T i j = j = 1 m ( v i j     w j )
where yij denotes the assessment values under each sub-criterion, vij represents the min–max normalized values, Nij indicates the weighted normalized values, and Tij denotes the aggregated criteria values of each alternative.

3. Results and Discussion

This section presents the Results and Discussion. The quantified results were subsequently used for ranking, performance classification, mapping, sensitivity analysis, and validation, and the results derived from these analyses are discussed.

3.1. Results

3.1.1. Assessment Results

Table 2 presents a summary of the assessment results for each feedstock evaluated under the selected sub-criteria. Detailed computations for net availability potential are provided in Supplementary File S1.

3.1.2. Normalized Values

Table 3 summarizes the normalized values obtained from the assessed values (Table 3) using the Euclidean normalization method.

3.1.3. Weighted Normalized Values and TOPSIS Ranking

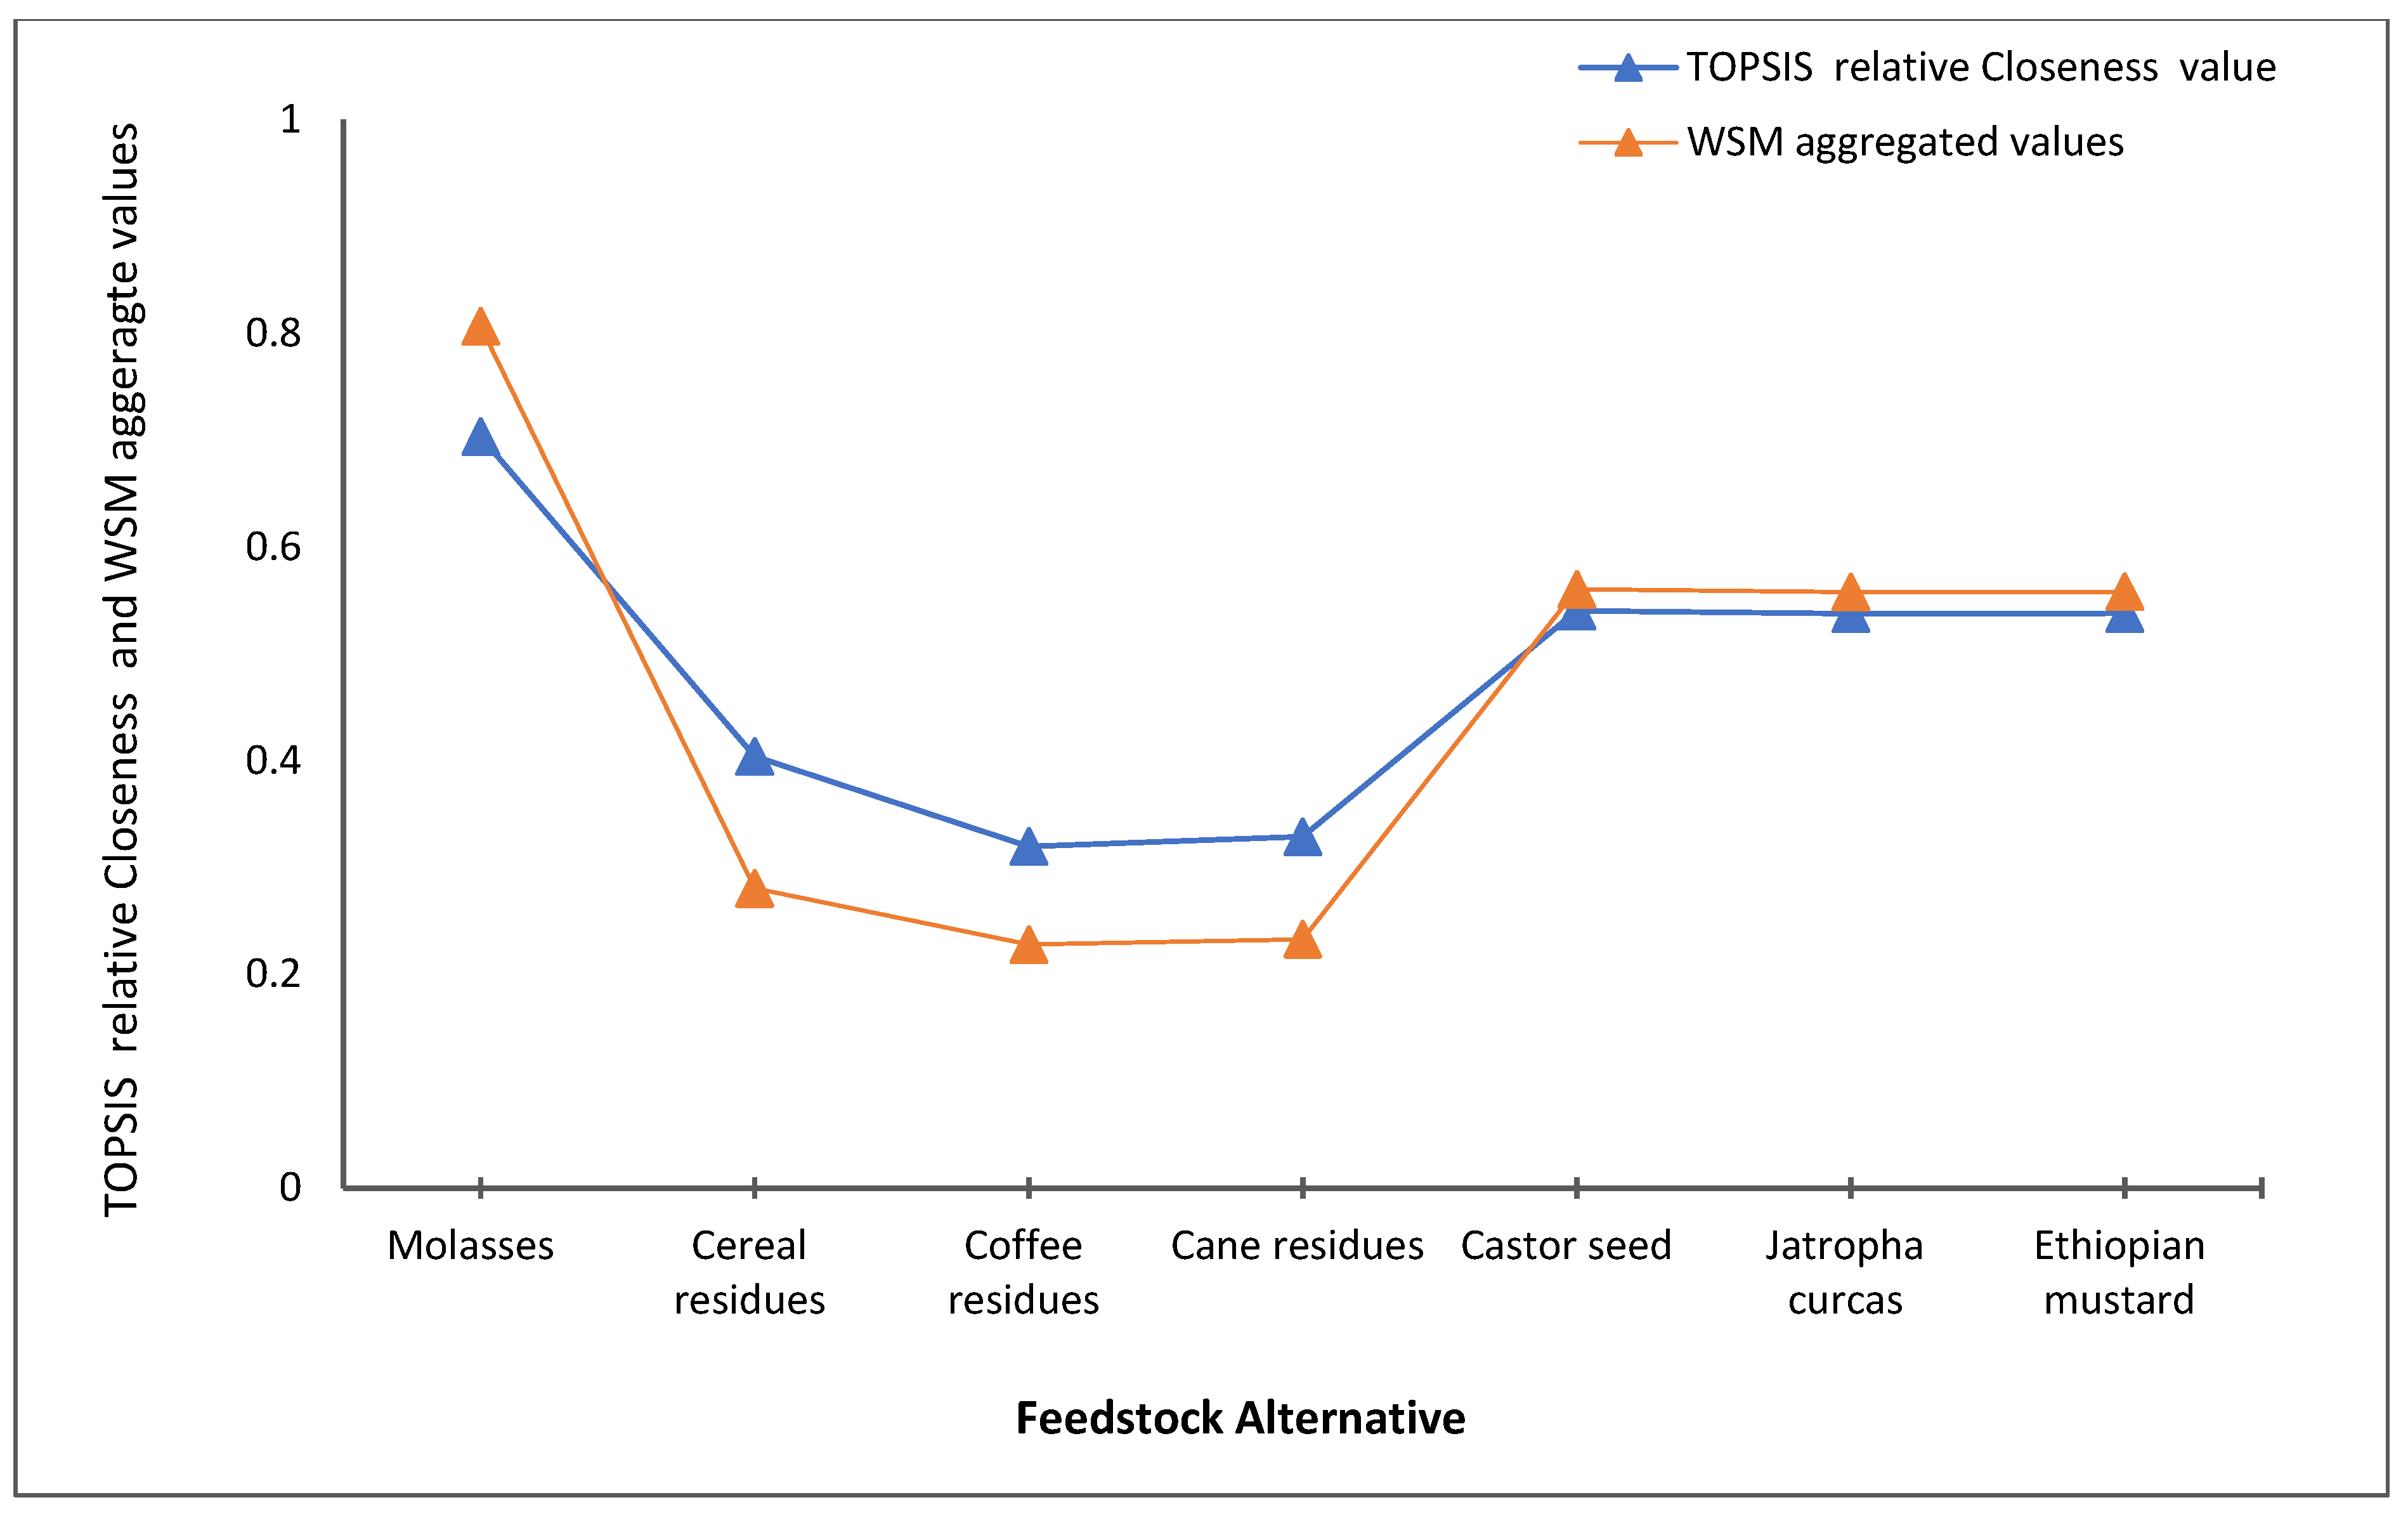
Table 4 presents the weighted normalized decision matrix and comprehensive TOPSIS ranking results, including the alternatives, sub-criteria, positive ideal (best) and negative ideal (worst) solutions, separation distances, closeness coefficients, and final rankings. Based on their closeness coefficients, molasses achieved the highest score (0.7031), followed by castor seed (0.5401), Ethiopian mustard (0.5377), Jatropha curcas (0.5375), cereal residues (0.4039), cane residues (0.3288), and coffee residues (0.3197), while water hyacinth ranked last.

3.1.4. Performance Classification of Feedstocks (High and Low)

Table 5 and Table 6 present the performance classification results (high and low) for net feedstock availability and techno-economic feasibility, respectively. For net feedstock availability, the calculated closeness coefficients and corresponding cutoff value for net availability are presented in Table 5. Based on the TOPSIS closeness coefficients, feedstocks were classified into high- and low-performance categories using the corresponding cutoff values.
The average closeness coefficient for net feedstock availability was 0.3662, with feedstocks having closeness coefficients greater than or equal to 0.3662 classified as high availability and those with values less than this value were classified as low availability, as presented in Table 5. Based on this cutoff value, molasses and the lignocellulosic feedstocks (cereal residues, coffee residues, and cane residues) were classified as having relatively high net feedstock availability, whereas castor seed, Ethiopian mustard, Jatropha curcas, and water hyacinth were classified as having relatively low net feedstock availability.
Similarly, for techno-economic feasibility, feedstocks were classified into high and low techno-economic performance categories based on the corresponding cutoff (threshold) value. The calculated closeness coefficients and cutoff value for techno-economic performance are presented in Table 6. The average closeness coefficient for techno-economic feasibility was 0.5370. Therefore, feedstocks with closeness coefficient values greater than or equal to 0.5370 were categorized as having high techno-economic feasibility, while those with values below this were categorized as having low techno-economic feasibility for bioenergy development.
Based on the cutoff value of 0.5370, molasses and the non-edible oil crops (castor seed, Ethiopian mustard, and Jatropha curcas) were classified as possessing relatively high techno-economic feasibility, whereas the lignocellulosic feedstocks (cereal residues, coffee residues, and cane residues) and water hyacinth were classified as possessing relatively low techno-economic feasibility for bioenergy development.

3.1.5. Performance Mapping

The feedstock performance mapping results are presented in Figure 2. Based on the classification of feedstocks into relatively high and low availability and techno-economic feasibility categories, all feedstocks were mapped onto a net feedstock availability−techno-economic feasibility matrix. Accordingly, the feedstocks were grouped into four strategic priority categories to support bioenergy planning and decision-making.
Highly suitable feedstocks included molasses, which exhibited both relatively high net availability and high techno-economic feasibility. Moderately suitable feedstocks comprised the non-edible oil crops castor seed, Ethiopian mustard, and Jatropha curcas, which showed high techno-economic feasibility but relatively low feedstock availability. Low-priority feedstocks included the lignocellulosic residues cereal residues, cane residues, and coffee residues, which exhibited relatively high net availability but low techno-economic feasibility. Water hyacinth was classified as a poorly suitable feedstock because it exhibited both relatively low net availability and low techno-economic feasibility.

3.1.6. Sensitivity Analysis

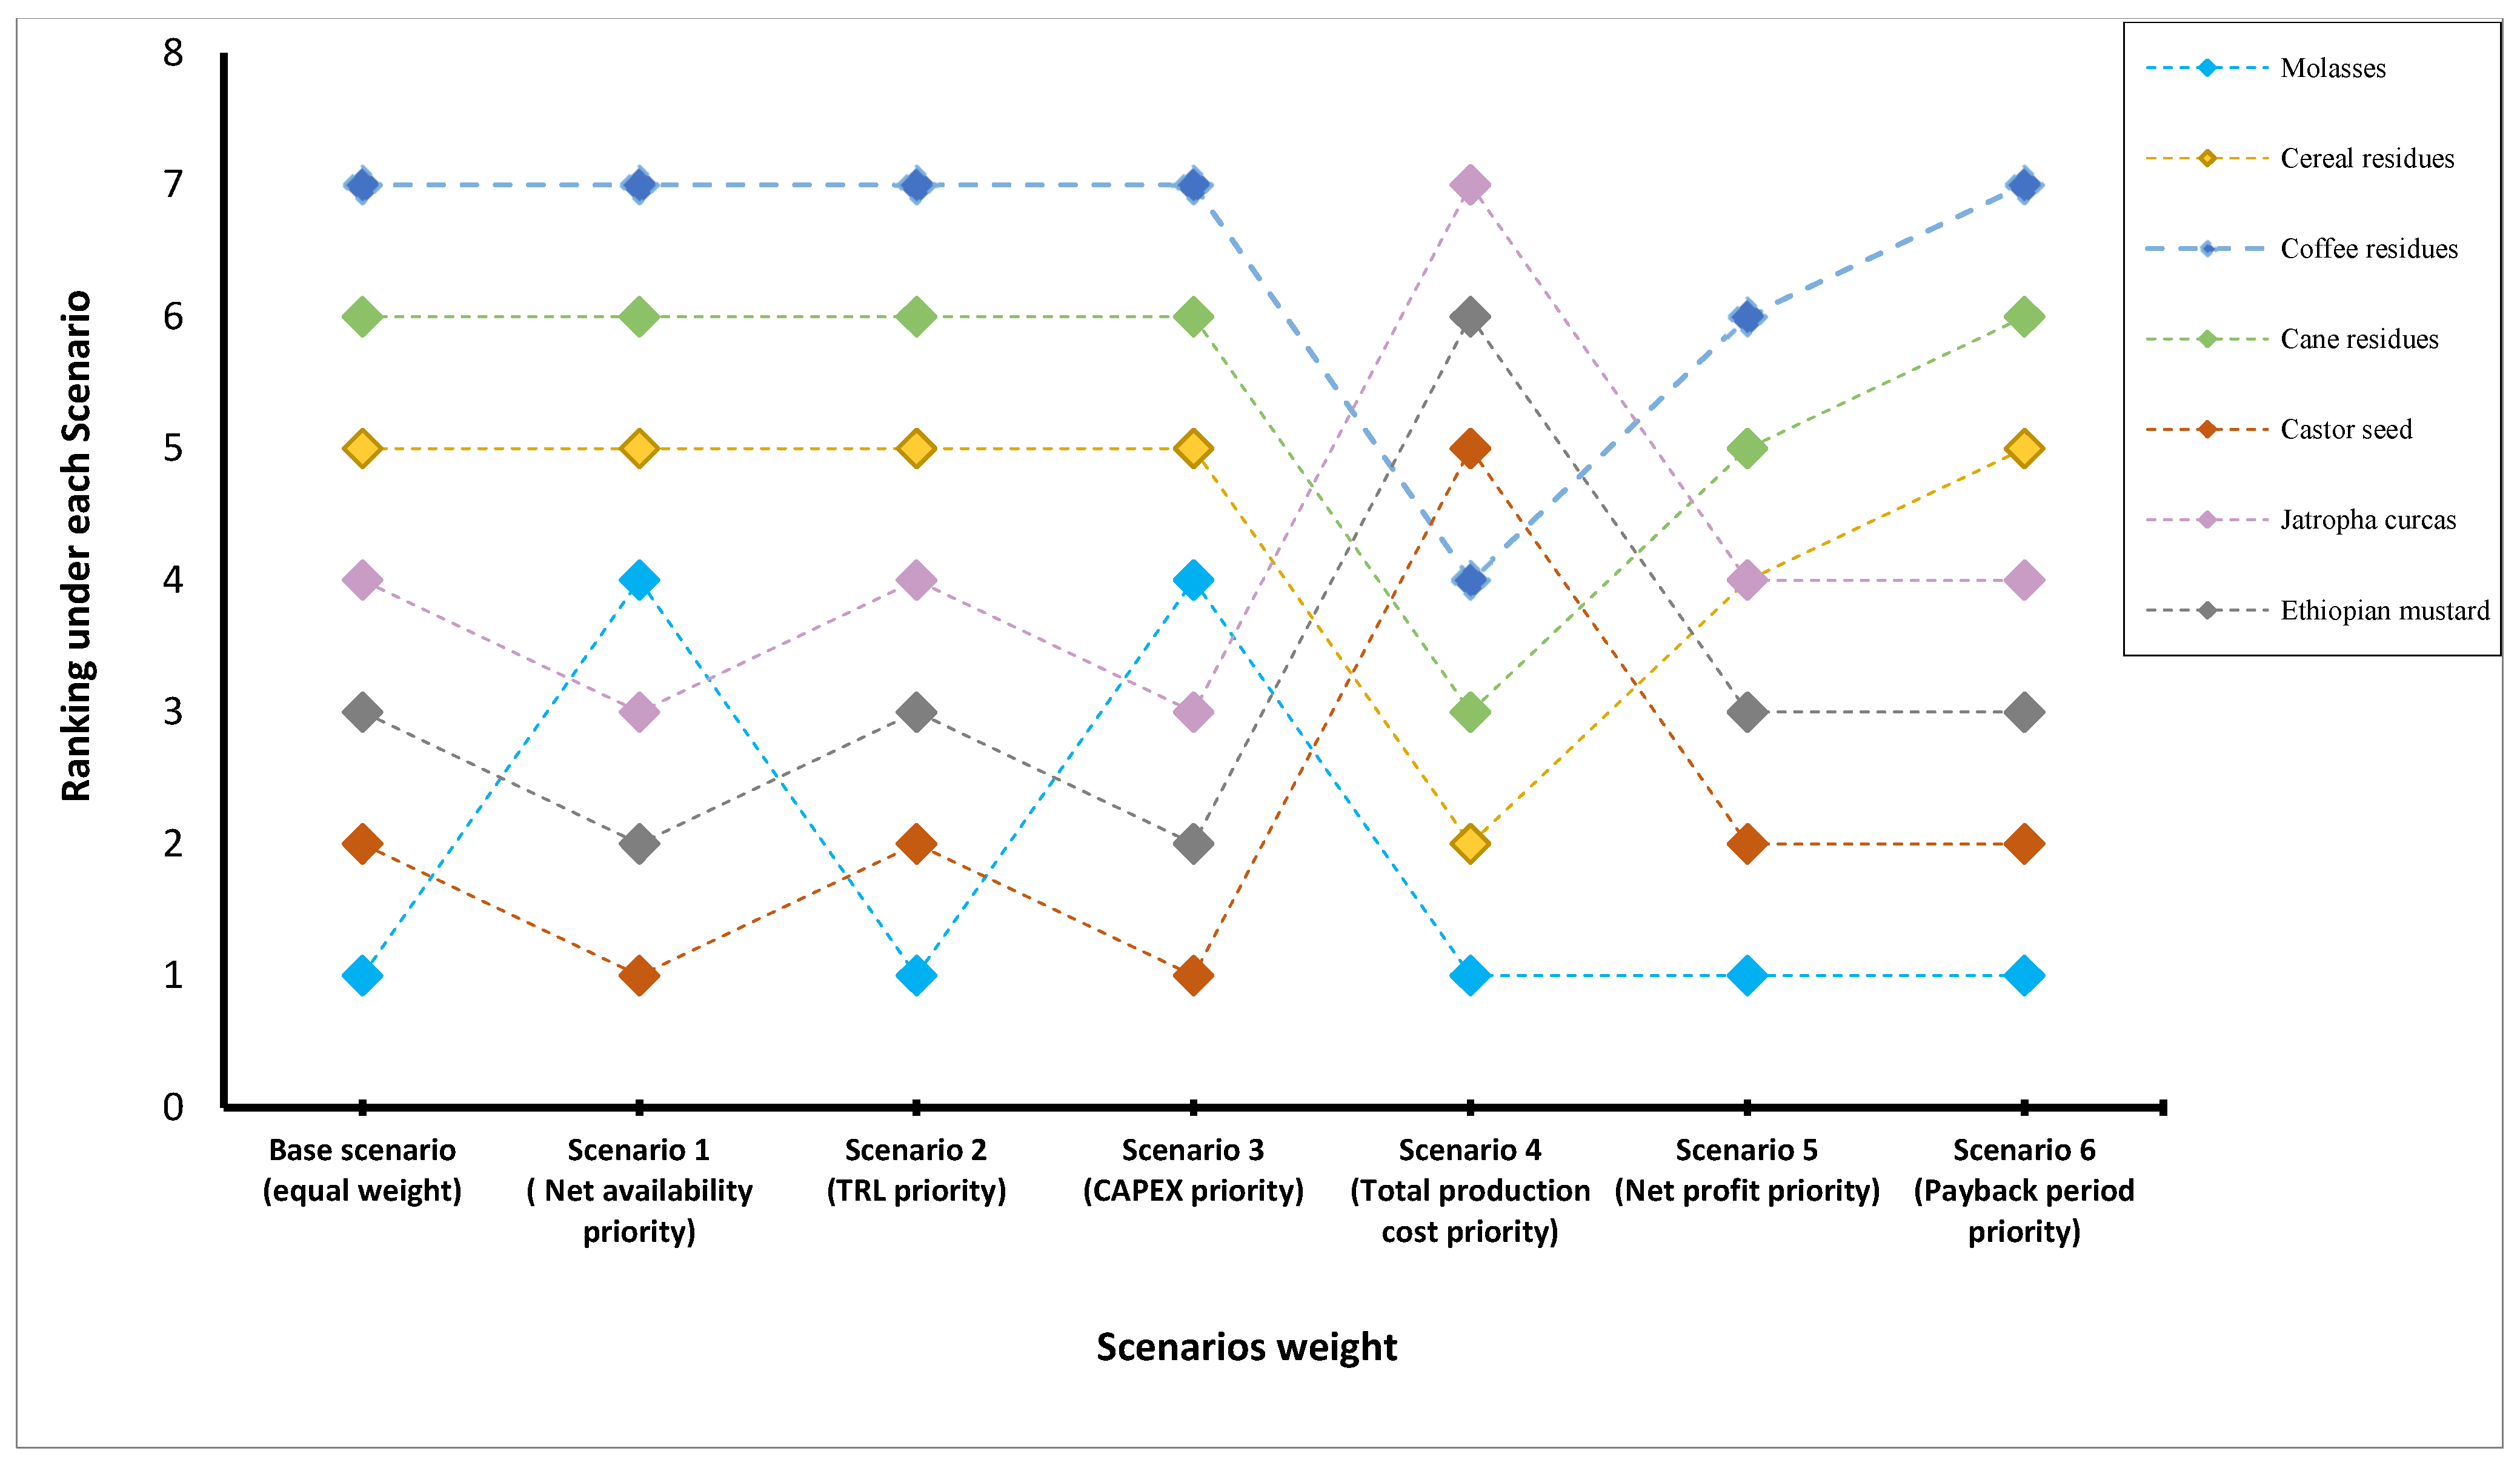
The sensitivity analysis results obtained using the TOPSIS method under different weighting scenarios are presented in Figure 3, while the detailed calculations are provided in Supplementary File S2 (Table S2). The stability of the ranking results was evaluated under seven weighting scenarios, including the base scenario (equal weighting) and six scenarios in which the weight of one criterion was increased while the others were proportionally adjusted.
In the base scenario (balanced weighting), where all criteria were assigned equal weights, the ranking followed the original TOPSIS results: molasses ranked first, followed by castor seed, Ethiopian mustard, Jatropha curcas, cereal residues, cane residues, coffee residues, and water hyacinth. Molasses achieved the highest ranking due to its balanced performance across all criteria, including high feedstock availability, mature technology, low production cost, high net profit, relatively short payback period (PBP), and low capital expenditure (CAPEX). The non-edible oil crops (castor seed, Ethiopian mustard, and Jatropha curcas) ranked below molasses because of their relatively lower feedstock availability and technological maturity, despite favorable economic performance. In contrast, lignocellulosic feedstocks ranked lower mainly because of their lower technological maturity, higher initial investment requirements, lower profitability, and longer payback periods, despite their relatively high feedstock availability and lower production costs.
Under Scenario 1 (net feedstock availability priority), increasing the weight of feedstock availability changed the ranking, with castor seed, Ethiopian mustard, and Jatropha curcas moving to the first, second, and third positions, respectively, while molasses dropped to fourth. This indicates that greater emphasis on feedstock availability favors non-edible oil crops over molasses. However, the ranking of lignocellulosic feedstocks remained unchanged, suggesting that increasing the importance of feedstock availability alone does not substantially influence their relative positions. In Scenario 2 (TRL priority), increasing the weight assigned to technological readiness did not alter the original ranking, demonstrating the robustness of the results with respect to this criterion. Similarly, Scenario 3 (CAPEX priority) shifted the non-edible oil crops to the top three positions and displaced molasses to fourth, indicating that CAPEX has a significant influence on the ranking outcome, whereas the positions of the lignocellulosic feedstocks remained unchanged. In Scenario 4 (total production cost priority), molasses retained the first position, while cereal residues, cane residues, and coffee residues moved to the second, third, and fourth positions, respectively, surpassing the non-edible oil crops. This finding suggests that emphasizing total production cost improves the relative ranking of lignocellulosic feedstocks because of their comparatively lower production costs. In Scenario 5 (net profit priority) and Scenario 6 (payback period priority), all feedstocks maintained the same ranking as in the base scenario, indicating that increasing the weights of net profit or payback period had no effect on the overall ranking. These results demonstrate the stability and robustness of the TOPSIS rankings with respect to these economic criteria.
Overall, the sensitivity analysis confirms that the ranking results are generally robust under different weighting scenarios. Among the seven scenarios analyzed, molasses predominantly achieved the top and highest ranking in five scenarios, demonstrating stable performance across varying weight conditions. Similarly, castor seed, Ethiopian mustard, and Jatropha curcas predominantly maintained second, third, and fourth positions, respectively, with only minor ranking shifts under a few scenarios. Cereal residues, cane residues, and coffee residues consistently maintained fifth, sixth, and seventh positions, respectively, indicating stable ranking performance across most scenarios. Minor ranking shifts were observed under a few weighting scenarios due to increased emphasis favoring specific feedstocks. These findings indicate that variations in criteria weighting had limited influence on the overall ranking pattern, demonstrating the robustness and reliability of the model for decision-making.

3.1.7. Validation Analysis with WSM

The aggregated scores obtained from WSM and the relative closeness coefficients obtained from TOPSIS are presented in Figure 4, while the detailed calculations are provided in Appendix A.2. Based on these values, the corresponding ranking results from both methods were compared.
The comparison showed that both methods produced a similar ranking pattern. Molasses ranked first, followed by the non-edible oil crops (castor seed, Ethiopian mustard, and Jatropha), while the lignocellulosic feedstocks (cereal residues, cane residues, and coffee residues) occupied the subsequent positions. Although the two methods differ in their computational approaches—TOPSIS ranks alternatives based on their relative closeness to the positive and negative ideal solutions using Euclidean distances, whereas WSM ranks alternatives based on weighted aggregated normalized scores—both methods yielded the same overall ranking order. This consistency confirms the validity and robustness of the TOPSIS ranking results.
However, differences were observed in the magnitude of the scores produced by the two methods. WSM generated relatively higher aggregated scores for molasses and the non-edible oil crops, whereas TOPSIS produced relatively higher closeness coefficients for the lignocellulosic feedstocks. For some feedstocks, particularly molasses and the lignocellulosic residues, larger disparities were observed between the WSM scores and TOPSIS closeness coefficients, although these differences did not affect their ranking positions. In contrast, the non-edible oil crops exhibited relatively small disparities in scores across the two methods, due to their close performance and the difficulty of clearly differentiating among them. This suggests that further evaluation using statistical analysis or additional MCDM techniques could provide greater discrimination among these feedstocks. Overall, the WSM results validated and confirmed the TOPSIS ranking outcomes.

3.2. Discussion

Molasses emerged as the highest-priority feedstock due to its strong performance in feedstock availability, technological maturity, and economic feasibility. Ethiopia currently operates six sugar factories producing molasses, with several additional plants under construction or expansion. Once all planned facilities become operational, annual molasses availability is expected to increase to approximately 325,057 tons, with the potential to produce about 84,515 tons of bioethanol per year. The estimated annual molasses production of 325,057 tons is comparable to the value reported by Gebreeyessus et al. [6], which exceeds 300,000 tons per year. This positions molasses as the most attractive short-term option for sustainable biofuel investment and for addressing growing national energy demand. The economic assessment confirms its viability, indicating a net profit of USD 2.82 million and a payback period (PBP) of 7.95 years. Conversion technology for molasses-based bioethanol is commercially established in some sugar factories; however, production remains below installed capacity due to constraints such as limited plant efficiency, weak policy enforcement, pricing disparities, and other constraints. Currently, only Finchaa and Metehara produce bioethanol, primarily technical alcohol, while other factories do not yet have ethanol plants [31]. To fully utilize this resource and enhance its socio-economic and environmental benefits, including improved energy security, job creation, and reduced fossil fuel dependence, strategic planning is required to expand ethanol production facilities. Short-term priorities should therefore include strengthening regulatory frameworks, improving infrastructure and institutional capacity, promoting flex-fuel vehicle adoption, enhancing market development, and fostering coordinated collaboration among government bodies, industry actors, and academic researchers to improve process efficiency and ensure effective implementation [72].
Non-edible oil crops (castor seed, Ethiopian mustard, and jatropha curcas) were classified as moderate-priority feedstocks after molasses. Compared to molasses, their feedstock availability, TRL, and economic performance are relatively lower, positioning them as the second most suitable resource for future biofuel investment. Collectively, they have the potential to produce approximately 7497 tons of biodiesel annually, which is substantially lower than the output potential of molasses. However, their economic performance is less attractive due to higher production and logistics costs. Although it indicates a positive net profit of USD 1.82 million and a short payback period (PBP) of 2.18 years, this result is based on an assumed production capacity (10,000 tons/year) that requires feedstock volumes significantly higher than currently available. In practice, limited and inconsistent feedstock supply remains the principal constraint, reducing real-world feasibility. These limitations are further compounded by technological inefficiencies and supply chain challenges. From a technological perspective, conversion processes have been demonstrated at pilot scale, indicating relative readiness. Nevertheless, scalability has been constrained primarily by inadequate and unreliable feedstock supply rather than technological barriers. Despite ambitious national biodiesel strategies launched in 2007 to promote large-scale jatropha production, the sector has stagnated over the past decade due to weak institutional support, land allocation challenges, limited market access, and poor stakeholder coordination [28,31]. Consequently, these feedstocks are currently less attractive for large-scale sustainable energy deployment. Enhancing their future viability requires medium-term strategies focused on expanding feedstock cultivation, strengthening farmer participation, improving infrastructure and supply chain coordination, reducing production costs, and reinforcing governance and multi-stakeholder collaboration among government, industry, NGOs, and research institutions [72].
Lignocellulosic residues (cereal, cane, and coffee residues) were considered the third most important resource category for future bioenergy development. Although their theoretical availability is substantial (approximately 1.51 million tons annually), with the potential to produce about 192,864 tons of bioethanol, their practical feasibility is constrained by technological immaturity, high production costs, and limited effective feedstock supply. These residues are generated from small-scale and scattered farming systems and are often used for competing purposes, further limiting their availability for biofuel production. Conversion technologies for lignocellulosic biomass remain at laboratory or early development stages, making them unsuitable for short- or medium-term deployment. Economic analysis also indicates poor performance (net profit of USD 0.38 million; PBP of 89.46 years), primarily due to high capital and operating costs, transportation expenses, and low technological readiness. Accordingly, these feedstocks are more appropriate for long-term strategies focused on research, technological innovation, and pilot-scale demonstration to advance commercialization. Progress will require strong stakeholder collaboration [72], including government support through regulatory frameworks and incentives, active engagement of academic and research institutions to reduce technological uncertainty, and NGO involvement in capacity-building and community engagement. Long-term collaborative efforts aimed at improving feedstock management, advancing conversion technologies, and reducing system costs could enhance their future viability for sustainable biofuel development.
For water hyacinth evaluation and ranking, data were unavailable for estimating CAPEX, total production cost, payback period, and net profit. Therefore, the ranking was estimated based on its current characteristics and poor management status, without considering its potential social and environmental benefits, such as water remediation. Due to its current poor management, low technological maturity, and high logistics and pretreatment requirements, water hyacinth was ranked as the lowest alternative feedstock and assigned the lowest priority for bioenergy utilization. However, its priority may increase in the future if proper management and utilization strategies for this invasive species are implemented for energy production.

3.3. Limitations and Future Work

This study focused on feedstock availability, technological readiness, and economic criteria, while environmental and social dimensions were not incorporated into the MCDM framework, representing a limitation for comprehensive sustainability assessment. Future studies should integrate these dimensions for sustainable bioenergy planning. Equal weights were assumed for all sub-criteria, which may influence ranking robustness. Future studies should determine criteria weights using AHP, Fuzzy-TOPSIS, or other hybrid MCDM techniques. In addition, economic evaluation for water hyacinth was limited due to data unavailability, and the economic assessment was based on 2021 price data, which may vary over time due to inflation, market conditions, and policy changes. Future studies should incorporate dynamic economic factors and complete economic evaluations.
Feedstock prioritization may also change over time due to variations in biomass availability, management practices, technological advancement, and sectoral demand. However, this study applied constant assumptions based on current conditions. Future studies should incorporate temporal and dynamic factors to better reflect real-world conditions. The study relied on nationally aggregated data, which may overlook regional variations in feedstock availability and logistics. Therefore, future studies should apply the framework at regional and local levels using disaggregated data. Water hyacinth was ranked lowest due to poor management, low technological maturity, and high pretreatment requirements, without considering potential environmental and social benefits such as water remediation. Future studies should incorporate these benefits to better reflect their priority.
Sensitivity analysis showed close ranking values among castor seed, Ethiopian mustard, and Jatropha curcas. Future studies should include additional criteria or statistical analyses to better differentiate these feedstocks. Finally, future research should compare the proposed framework with alternative or hybrid MCDM approaches to further validate the robustness of the results.

4. Conclusions

Biomass selection for bioenergy development is a complex and time-dependent process involving multiple criteria. Such complexity necessitates the application of multi-criteria decision-making (MCDM) techniques. Among the available methods, TOPSIS provides a structured and transparent approach for ranking alternatives based on their relative proximity to positive and negative ideal solutions. This paper presents a feedstock prioritization and selection framework for bioenergy development in Ethiopia using a multi-criteria decision-making (MCDM) approach that integrates net feedstock availability, technological maturity, and economic criteria, while further combining TOPSIS-based ranking with threshold-based performance classification and strategic mapping.
The results indicate that molasses achieved the highest closeness coefficient and was ranked as the most suitable feedstock. It was followed by castor seed, Ethiopian mustard, Jatropha curcas, cereal residues, cane residues, and coffee residues, while water hyacinth received the lowest score and ranked last among the evaluated alternatives. The consistency observed in both the sensitivity and WSM validation analyses demonstrates the robustness and reliability of the proposed feedstock prioritization framework. The sensitivity analysis confirmed the stability and robustness of the TOPSIS ranking results, with the majority of the weighting scenarios producing the same ranking order: molasses ranked first, followed by the non-edible oil crops in the second to fourth positions, while the lignocellulosic feedstocks consistently ranked from fifth to seventh.
Based on these results, a strategic time-based implementation roadmap was developed at the national level. Four implementation horizons were considered: short-term deployment (2025–2030), medium-term development (2030–2035), long-term development (2035–2050), and very-long-term development (beyond 2050). Molasses emerged as the highest-priority feedstock and is recommended for short-term deployment. Non-edible oil crops (castor seed, Ethiopian mustard, and Jatropha curcas), which exhibited similar closeness coefficients, can be categorized as moderately suitable and aligned with medium-term development. Lignocellulosic residues (cereal, cane, and coffee residues) were identified as the third most promising resource category and can be associated with long-term implementation (2035–2050). Water hyacinth, which received the lowest ranking, was classified as poorly suitable and may be considered only for very-long-term prospects beyond 2050.
In addition to linking net availability, technological maturity, and economic criteria, this study extends the existing biomass evaluation methods by integrating TOPSIS ranking with threshold-based performance classification and mapping to enable a more comprehensive assessment and support decision-making, thereby improving the interpretability of complex multi-criteria decision problems. The study supports decision-makers in strategic energy planning and bioenergy development. This finding also helps with other decision-making problems requiring the ranking and selection of alternatives under multiple criteria.

Supplementary Materials

The following supporting information can be downloaded at: https://www.mdpi.com/article/10.3390/su18168112/s1; Supplementary File S1: Excel-based computations for feedstock alternatives (bagasse, cereals, coffee, castor, mustard, and molasses), including underlying assumptions and economic estimation; Supplementary File S2: Sensitivity analysis and validation.

Author Contributions

T.T.F.: Writing—original draft, writing—review and editing, conceptualization, methodology, investigation, and visualization. L.M.: Supervision, writing—review and editing, conceptualization, methodology, and visualization. S.N.: Supervision, writing—review and editing, conceptualization, methodology, and visualization. L.v.d.W.: Supervision, writing—review and editing, conceptualization, methodology, and visualization. A.Y.: Supervision. B.T.: Supervision. All authors have read and agreed to the published version of the manuscript.

Funding

This research was funded by EUR BIO ECO with grant number: ANR-18-EURE-0021.

Institutional Review Board Statement

Not applicable.

Informed Consent Statement

Not applicable.

Data Availability Statement

The original contributions presented in this study are included in the article, Supplementary Materials, and Appendix A.

Conflicts of Interest

The authors declare no conflicts of interest.

Appendix A

Appendix A.1. Abbreviations

List of abbreviations used in this manuscript:
Table A1. List of abbreviations used.
List of Variables UsedName of VariablesUnit
tTime year
AnAlternative feedstock considered
A ( n ) t Harvested area or covered area for alternative feedstock in time t ha
Y ( A n ) t Yield for the alternative feedstock (An) in time tton/ha
R T P A n Residues-to-product ratio for the alternative feedstock (An)%
R F A n Recoverability factor for the alternative feedstock (An)%
A F A n Availability factor for the alternative feedstock (An)%
C F A n Competitive usage factor for the alternative feedstock (An)%
T F P ( A n ) t Theoretical Feedstocks potential for alternative feedstock (An) in time tton
R F P ( A n ) t Recoverable Feedstocks potential for alternative feedstock (An) in time tton
A F P ( A n ) t Available Feedstocks potential for alternative feedstock (An) in time tton
TRL Technological readiness level
PBPPayback periodyear
TOPSISTechnique for order preference by similarity to ideal solution
WSMWeighted sum method
VIKORVise Kriterijumska Optimizacija I Kompromisno Resenje
AHPAnalytic hierarchy process
PROMETHEEPreference Ranking Organization Method for Enrichment Evaluation
ELECTREElimination and choice translating reality

Appendix A.2. Summarized Literature Review of MCDM Application Reports

This Appendix presents a summarized review of MCDM applications reported in the literature for ranking and selecting suitable alternatives in the energy sector, including bioenergy.
Table A2. Summarized literature review of MCDM applications used for ranking and prioritization.
AuthorsMCDM UsedStudy Objective
Ngetuny et al., 2025 [42]AHPPrioritization and selection of potential feedstocks for sustainable biogas production
Ngando et al., 2025 [43]AHPRanking and selection of crop residues for sustainable bioenergy production in west Africa
Zandi et al., 2025 [74]SAWEvaluating and ranking of food product portfolios alternatives
Sultana & Kumar, 2012 [75]PROMETHEERanking and selection best option among alternative biomass feed-based pellets for power generation plant
Kumar & Samuel, 2017 [46]VIKORRanking and selecting renewable energy sources for power generation among solar, wind, biomass and geothermal alternative sources
San Cristóbal, 2011 [47]VIKORSelecting suitable renewable energy sources for renewable energy project planning among energy source alternatives of wind, solar, biomass and hydroelectricity
Shanian & Savadogo, 2006 [51]TOPSISRanking and selecting appropriate materials for polymers electrolyte fuel cell
Vannarath & Kumar, 2019 [52]TOPSISRanking and selecting suitable pretreatment methods for conversion of biomass to biogas among treatment alternative physical, chemical and biological
Howari et al., 2023 [54]AHP–TOPSISRanking and selecting biomass feedstock for pyrolysis process of thermochemical conversion among six agro-waste alternative biomasses
Jiao et al., 2026 [57] AHP–TOPSISRanking and Selecting renewable energy sources for energy planning in China among wind, solar, biomass and hydrogen storage alternatives
George et al., 2021 [55]AHP–TOPSISRanking and selecting appropriate alternative biomass feedstocks for gasification
Abdulvahitoglu & Kilic, 2022 [56]AHP–TOPSISRanking and selecting best suitable among energy crops for biodesiel production
Kemausuor, 2021 [49]FTOPSISRanking and selecting biomass resources for bioenergy production from vast range of alternative biomass in Ghana
Zoma & Sawadogo, 2023 [36] AHP–TOPSISPrioritization and selecting suitable biomass feedstock for bioenergy production in Burkina Faso
Avramova & Peneva, 2025 [76]AHP, TOPSIS, VIKOR and othersOverview of existing MCDM and their applicability for evaluation and selection of appropriate technologies in industrial environment along their advantage and disadvantage
Manuel et al., 2024 [53]AHP, FAHP, TOPSIS and FTOPSISRanking and selecting renewable energy sources for renewable energy technologies planning and implementation in Colombia
Malefaki, 2025 [77]TOPSIS, VIKOR, WSM and othersComparative analysis of MCDM for sustainable evaluation and normalization in engineering application
Anwar, 2021 [78]PROMETHEE, WSM, WPM, TOPSISRanking and selection of feedstock for biodiesel production among sixteen feedstock alternatives

Appendix A.3. Summary of Criteria Used in Previous Studies, Their Limitations, and the Criteria Used in the Present Study

This Appendix presents a comprehensive review of the criteria employed in previous studies, their associated limitations, and the criteria selected and adopted for the present study.
Table A3. Summary of comprehensive review of the criteria employed in previous studies, their associated limitations, and the criteria selected and adopted for the present study.
AuthorsObjective of StudyDimensions Used for StudyCriteria/Indicators the Study UsedLimitation of the StudyCriteria Used from This Review for This StudyAdopted Criteria
Tolessa, 2023 [35]Assessment of biomass resources and bioenergy potential of crop residues in Ethiopia Feedstock availabilityGross
Potential

Recoverable potential

Surplus Residue Potential

Energy potential
Lack of a multidimensional assessment (integrating economic, environmental, technical, and social criteria).

Lack of feedstock prioritization and selection approaches to support bioenergy planning and development.

Lack of strategic mapping of feedstock availability for long-term bioenergy development
Gross
Potential

Recoverable
potential

Surplus residue potential

Technological readiness level

Economic criteria
Gabisa & Gheewala, 2018 [14]Investigate potentially available bioenergy production from biomass resources available in Ethiopia.
Uzoagba et al., 2024 [19]Assessment of the energy potential crop residue biomass resources in Africa
Tesfamichael et al., 2021a [8]Biomass-to-biofuel supply optimization model and planning
in Ethiopia considering economic dimension
Feedstock availability

Economic

Environmental
Biomass availability
Biomass purchase
Investment cost
Transportation cost
Production cost
Inventory cost
Total revenue
Profit
Life cycle assessment (LCA)
Lack of MCDM-based approaches integrating technological dimensions.


Lack of feedstock prioritization and selection frameworks for bioenergy development.
Biomass purchase cost
Investment cost
Transportation cost
Production cost
Inventory cost
Total revenue
Profit
Technological readiness level

Feedstock availability
Tesfamichael et al., 2021b [15] Biomass-to-biofuel supply chain optimization model and planning considering economic and environmental
in Ethiopia
Mamo et al., 2023 [16]Biomass-to-bioethanol supply chain optimization model and planning in Ethiopia considering economic aspect
Chala et al., 2018 [13]Physicochemical evaluation and biogas potential of coffee processing waste in EthiopiaPhysicochemical characterization

Elemental composition

Chemical analysis
Product yield Lack of biomass potential assessment for bioenergy development
Lack of a multidimensional assessment (integrating economic, environmental, technical, and social criteria)
Lack of feedstock prioritization and selection frameworks for bioenergy development.
Proposed utilization of coffee waste for bioenergy production Feedstock availability
Technological readiness
Economic dimensions
Woldesenbet et al., 2016 [9]Quantification of wet coffee processing waste and estimation of its bioethanol production in Ethiopia
Wietschel et al., 2019 [21]Prediction of agricultural residue potentials for second generation bioconversion industry in the European UnionFeedstock availability potentialTheoretical Potential

Technical potential

Net available potential
Lack of a multidimensional assessment (integrating economic, environmental, technical, and social criteria)


Lack of feedstock prioritization and selection frameworks for bioenergy development.
Theoretical potential

Technical potential

Net available potential
Technological readiness

Economic dimensions
Shane et al., 2016 [20]Assessment of bioenergy resource assessment for Zambia
Hiloidhari et al., 2014 [79] Assessment of bioenergy potential from crop residue biomass in India

Appendix A.4. Technological Readiness Level and Assignment

Technological readiness level (TRL) scale and assignment for each feedstock alternative based on the literature and local context. Assigned TRL values for all feedstocks are summarized in Table A4.
Table A4. The TRL scale and the assigned values for each selected feedstock.
TRLTRL ScaleCorrespondence TRL DefinitionsExampleReferences
TRL 1Conceptual scaleBasic principle or idea of conversion technologies for the feedstock is in exploration, early emerging concepts without laboratory workBioethanol production from water hyphen, etc.[28,31,66,80]
TRL 3Laboratory research scaleConversion technologies for processing the feedstock are in the experimentation phase at the laboratory level and research proof for feasibilityBioethanol production from lignocellulosic feedstock such as cereal residues, coffee husk and pulp, bagasse, etc.
TRL 5Laboratory proof/validation scaleConversion technologies for the feedstock is on laboratory feasibility or validation phase to operate in a relevant environment
TRL 7Pilot scale or small scale productionConversion technologies for the feedstock operating at pilot scale in a real world for small scale production Biodesiel product from non-edible oil crops such as Jatropha carcus, castor seed, Ethiopian mustard, etc.
TRL 9Fully commercialized or large scale productionConversion technologies for the feedstock is fully commercialized, mature and well-established for high-volume productionBioethanol production from molasses
TRL2, TRL4,
TRL6, TRL8
Intermediate values between the two adjacent TRLs Technology Intermediate scale between the two adjacent TRLs

Appendix A.5. Biomass Input and Output Analysis

Material flow analysis was conducted to quantify input and output flows across the supply chain, from feedstock supply to final biofuel distribution. Conversion factors for the selected processing pathways were obtained from the literature and applied to estimate material flows and production capacities at each stage. Cost parameters were adopted from [8,15,81] as described in the Methodology. A standardized production capacity of 10,000 tons of biofuel per year was assumed for all feedstocks to ensure comparability. Material balances at each stage were calculated to estimate economic criteria under this uniform production basis. The resulting biomass input–output balances for each feedstock are presented in Figure A1 of Appendix A below.
Figure A1. Biomass input and output material balance assuming a basis of 10,000 ton/year biofuel production. Note that the unit used in this Figure is ton/year.
Sustainability 18 08112 g0a1

References

  1. Duan, Y.; Tarafdar, A.; Kumar, V.; Ganeshan, P.; Rajendran, K.; Shekhar Giri, B.; Gómez-García, R.; Li, H.; Zhang, Z.; Sindhu, R.; et al. Sustainable biorefinery approaches towards circular economy for conversion of biowaste to value added materials and future perspectives. Fuel 2022, 325, 124846. [Google Scholar] [CrossRef]
  2. Kumar, B.; Verma, P. Biomass-based biorefineries: An important architype towards a circular economy. Fuel 2021, 288, 119622. [Google Scholar] [CrossRef]
  3. Awasthi, M.K.; Sindhu, R.; Sirohi, R.; Kumar, V.; Ahluwalia, V.; Binod, P.; Juneja, A.; Kumar, D.; Yan, B.; Sarsaiya, S.; et al. Agricultural waste biorefinery development towards circular bioeconomy. Renew. Sustain. Energy Rev. 2022, 158, 112122. [Google Scholar] [CrossRef]
  4. Prado-Acebo, I.; Cubero-Cardoso, J.; Lu-Chau, T.A.; Eibes, G. Integral multi-valorization of agro-industrial wastes: A review. Waste Manag. 2024, 183, 42–52. [Google Scholar] [CrossRef] [PubMed]
  5. Sharew, S.; Montastruc, L.; Yimam, A.; Negny, S.; Ferrasse, J.H. Alternative Energy Potential and Conversion Efficiency of Biomass into Target Biofuels: A Case Study in Ethiopian Sugar Industry- Wonji-Shoa. Biomass 2022, 2, 279–298. [Google Scholar] [CrossRef]
  6. Gebreeyessus, G.D.; Mekonnen, A.; Chebude, Y.; Alemayehu, E. Quantitative characterization and environmental techno-legal issues on products and byproducts of sugar and ethanol industries in Ethiopia. Renew. Sustain. Energy Rev. 2021, 145, 111168. [Google Scholar] [CrossRef]
  7. Gabisa, E.W.; Gheewala, S.H. Can substitution of imported gasoline by locally produced molasses ethanol in Ethiopia be sustainable? An eco-efficiency assessment. Renew. Sustain. Energy Rev. 2020, 123, 109770. [Google Scholar] [CrossRef]
  8. Tesfamichael, B.; Montastruc, L.; Negny, S.; Yimam, A. Designing and planning of Ethiopia’s biomass-to-biofuel supply chain through integrated strategic-tactical optimization model considering economic dimension. Comput. Chem. Eng. 2021, 153, 107425. [Google Scholar] [CrossRef]
  9. Woldesenbet, A.G.; Woldeyes, B.; Chandravanshi, B.S. Bio-ethanol production from wet coffee processing waste in Ethiopia. Springerplus 2016, 5, 1903. [Google Scholar] [CrossRef] [PubMed]
  10. Tolessa, A. Bioenergy potential from crop residue biomass resources in Ethiopia. Heliyon 2023, 9, e13572. [Google Scholar] [CrossRef] [PubMed]
  11. Lemessa, G.; Gabbiye, N.; Alemayehu, E. Waste to resource: Utilization of waste bagasse as an alternative adsorbent to remove heavy metals from wastewaters in sub-Saharan Africa: A review. Water Pract. Technol. 2023, 18, 393–407. [Google Scholar] [CrossRef]
  12. Haile, A.; Gebino, G.; Tesfaye, T.; Mengie, W.; Ayele, M.; Abuhay, A.; Yilie, D. Utilization of non-wood biomass for pulp manufacturing in paper industry: Case of Ethiopia, Biomass Convers. Biorefinery 2023, 13, 7441–7459. [Google Scholar] [CrossRef]
  13. Chala, B.; Oechsner, H.; Latif, S.; Müller, J. Biogas potential of coffee processing waste in Ethiopia. Sustainability 2018, 10, 2678. [Google Scholar] [CrossRef]
  14. Gabisa, E.W.; Gheewala, S.H. Potential of bio-energy production in Ethiopia based on available biomass residues. Biomass Bioenergy 2018, 111, 77–87. [Google Scholar] [CrossRef]
  15. Tesfamichael, B.; Montastruc, L.; Negny, S.; Yimam, A. Incorporating environmental perspective in integrated strategic-tactical economic optimization model of biomass-to-biofuel supply chain—A real case study in Ethiopia. Processes 2021, 9, 1879. [Google Scholar] [CrossRef]
  16. Mamo, T.; Montastruc, L.; Negny, S.; Dendena, L. Integreted strategic and tactical optimization planning of biomass to bioethanol supply chains coupled with operational plan using vehicle routing: A case study in Ethiopia. Comput. Chem. Eng. 2023, 172, 108186. [Google Scholar] [CrossRef]
  17. Berhanu, M.; Jabasingh, S.A.; Kifile, Z. Expanding sustenance in Ethiopia based on renewable energy resources—A comprehensive review. Renew. Sustain. Energy Rev. 2017, 75, 1035–1045. [Google Scholar] [CrossRef]
  18. Sugebo, B. A review on enhanced biofuel production from coffee by-products using different enhancement techniques. Mater. Renew. Sustain. Energy 2022, 11, 91–103. [Google Scholar] [CrossRef]
  19. Uzoagba, C.; Bello, A.; Kadivar, M.; Okoroigwe, E.; Ezealigo, U.S.; Anye, V.C.; Kemausuor, F.; Onwualu, P.A. Bioenergy Potential Assessment of Crop Residue Biomass Resources in Africa Towards Circular Economy. Cureus J. 2024, 1, 1. [Google Scholar] [CrossRef]
  20. Shane, A.; Gheewala, S.H.; Fungtammasan, B.; Silalertruksa, T.; Bonnet, S.; Phiri, S. Bioenergy resource assessment for Zambia, Renew. Sustain. Energy Rev. 2016, 53, 93–104. [Google Scholar] [CrossRef]
  21. Wietschel, L.; Thorenz, A.; Tuma, A. Spatially explicit forecast of feedstock potentials for second generation bioconversion industry from the EU agricultural sector until the year 2030. J. Clean. Prod. 2019, 209, 1533–1544. [Google Scholar] [CrossRef]
  22. La, L.; De Souza, P.; Rajabi, S.; Eduardo, E.; Lora, S.; Escobar, C.; Comodi, G.; Villarini, M.; Colantoni, A. Theoretical and technical assessment of agroforestry residue potential for electricity generation in Brazil towards 2050. Energy Rep. 2021, 7, 2574–2587. [Google Scholar] [CrossRef]
  23. Thorenz, A.; Wietschel, L.; Stindt, D.; Tuma, A. Assessment of agroforestry residue potentials for the bioeconomy in the European Union. J. Clean. Prod. 2018, 176, 348–359. [Google Scholar] [CrossRef] [PubMed]
  24. Schaeffer, R.; Szklo, A.; Portugal-pereira, J.; Soria, R. Biomass and Bioenergy Agricultural and agro-industrial residues-to-energy: Techno-economic and environmental assessment in Brazil. Biomass Bioenergy 2015, 81, 521–533. [Google Scholar] [CrossRef]
  25. Duarte, A.; Uribe, J.C.; Sarache, W.; Calderón, A. Economic, environmental, and social assessment of bioethanol production using multiple coffee crop residues. Energy 2021, 216, 119170. [Google Scholar] [CrossRef]
  26. Licata, M.; Farruggia, D.; Sgroi, F.; Salamone, F.; Leto, C.; Di Miceli, G. A comparative study to assess the production of two oilseed crops (Brassica carinata A. Braun and Carthamus tinctorius L.) and the energy potential of their agricultural biomass residues. Heliyon 2024, 10, e38654. [Google Scholar] [CrossRef] [PubMed]
  27. Hagos, R.; Shaibu, A.S.; Zhang, L.; Cai, X.; Liang, J.; Wu, J.; Lin, R.; Wang, X. Ethiopian mustard (Brassica carinata A. Braun) as an alternative energy source and sustainable crop. Sustainability 2020, 12, 7492. [Google Scholar] [CrossRef]
  28. Benti, N.E.; Aneseyee, A.B.; Geffe, C.A.; Woldegiyorgis, T.A.; Gurmesa, G.S.; Bibiso, M.; Asfaw, A.A.; Milki, A.W.; Mekonnen, Y.S. Biodiesel production in Ethiopia: Current status and future prospects. Sci. Afr. 2023, 19, e01531. [Google Scholar] [CrossRef]
  29. Carrino, L.; Visconti, D.; Fiorentino, N.; Fagnano, M. Biofuel production with castor bean: A win-win strategy for marginal land. Agronomy 2020, 10, 1690. [Google Scholar] [CrossRef]
  30. Ewunie, G.A.; Morken, J.; Lekang, O.I.; Yigezu, Z.D. Factors affecting the potential of Jatropha curcas for sustainable biodiesel production: A critical review. Renew. Sustain. Energy Rev. 2021, 137, 110500. [Google Scholar] [CrossRef]
  31. Yimam, A. Contextual analysis of the biofuel sector in Ethiopia: A comprehensive review focusing on sustainability. Biofuels Bioprod. Biorefining 2022, 16, 290–302. [Google Scholar] [CrossRef]
  32. Wendimu, M.A. Jatropha potential on marginal land in Ethiopia: Reality or myth? Energy Sustain. Dev. 2016, 30, 14–20. [Google Scholar] [CrossRef]
  33. Damtie, Y.A.; Mengistu, D.A.; Meshesha, D.T. Spatial coverage of water hyacinth (Eichhornia crassipes (Mart.) Solms) on Lake Tana and associated water loss. Heliyon 2021, 7, e08196. [Google Scholar] [CrossRef] [PubMed]
  34. Nega, D.T.; Ancha, V.R.; Manenti, F.; Adeel, Z. A comprehensive policy framework for unlocking the potential of water hyacinth in Ethiopia’s circular bioeconomy. J. Clean. Prod. 2024, 435, 140509. [Google Scholar] [CrossRef]
  35. Tolessa, A. Bioenergy Production Potential of Available Biomass Residue Resources in Ethiopia. J. Renew. Energy 2023, 2023, 2407300. [Google Scholar] [CrossRef]
  36. Zoma, F.; Sawadogo, M. Heliyon A multicriteria approach for biomass availability assessment and selection for energy production in Burkina Faso: A hybrid AHP-TOPSIS approach. HLY 2023, 9, e20999. [Google Scholar] [CrossRef] [PubMed]
  37. Shao, M.; Han, Z.; Sun, J.; Xiao, C.; Zhang, S.; Zhao, Y. A review of multi-criteria decision making applications for renewable energy site selection. Renew. Energy 2020, 157, 377–403. [Google Scholar] [CrossRef]
  38. Patil, S.C.; Schulze-Netzer, C.; Korpås, M. Current and emerging waste-to-energy technologies: A comparative study with multi-criteria decision analysis. Smart Energy 2024, 16, 100157. [Google Scholar] [CrossRef]
  39. Farooq, A.; Haputta, P.; Silalertruksa, T.; Gheewala, S.H. A Framework for the Selection of Suitable Waste to Energy Technologies for a Sustainable Municipal Solid Waste Management System. Front. Sustain. 2021, 2, 1–17. [Google Scholar] [CrossRef]
  40. Godoy, J.C.; Cajo, R.; Mesa Estrada, L.; Hamacher, T. Multi-criteria analysis for energy planning in Ecuador: Enhancing decision-making through comprehensive evaluation. Renew. Energy 2025, 241, 122278. [Google Scholar] [CrossRef]
  41. Mola-Yudego, B.; Dimitriou, I.; Gagnon, B.; Schweinle, J.; Kulišić, B. Priorities for the sustainability criteria of biomass supply chains for energy. J. Clean. Prod. 2024, 434, 140075. [Google Scholar] [CrossRef]
  42. Ngetuny, J.; Baldauf, T.; Zörner, W. Optimizing Feedstock Selection for Sustainable Small-Scale Biogas Systems Using the Analytic Hierarchy Process †. Energies 2025, 18, 1739. [Google Scholar] [CrossRef]
  43. Ngando, N.; Olatunji, A.; Chaulagain, D.; Park, J.; Babatunde, A.; Ok, J.; Wook, J.; Suh, D. A multicriteria decision analysis for the selection and ranking of crop residue for sustainable energy generation in West Africa. Energy Nexus 2025, 18, 100408. [Google Scholar] [CrossRef]
  44. Mukhametzyanov, I.Z. Normalization of Multidimensional Data for Multi-Criteria Decision Making Problems; Springer Nature: Durham, NC, USA, 2023. [Google Scholar]
  45. Yilmaz, B.; Harmancioglu, N.B. Multi-criteria decision making for water resource management: A case study of the Gediz River Basin, Turkey. Water SA 2010, 36, 563–576. [Google Scholar] [CrossRef]
  46. Kumar, M.; Samuel, C. Selection of Best Renewable Energy Source by Using VIKOR Method. Technol. Econ. Smart Grids Sustain. Energy 2017, 2, 8. [Google Scholar] [CrossRef]
  47. San Cristóbal, J.R. Multi-criteria decision-making in the selection of a renewable energy project in spain: The Vikor method. Renew. Energy 2011, 36, 498–502. [Google Scholar] [CrossRef]
  48. Kaya, İ.; Çolak, M.; Terzi, F. Use of MCDM techniques for energy policy and decision-making problems: A review. Int. J. Energy Res. 2018, 42, 2344–2372. [Google Scholar] [CrossRef]
  49. Ossei-Bremang, R.N.; Kemausuor, F. A decision support system for the selection of sustainable biomass resources for bioenergy production. Environ. Syst. Decis. 2021, 41, 437–454. [Google Scholar] [CrossRef]
  50. Hwang, C.L.; Yoon, K.P. Multiple Attribute Decision Making. Methods and Applications. A State-of-the-Art Survey; Springer: Berlin/Heidelberg, Germany, 1981. [Google Scholar]
  51. Shanian, A.; Savadogo, O. TOPSIS multiple-criteria decision support analysis for material selection of metallic bipolar plates for polymer electrolyte fuel cell. J. Power Sources 2006, 159, 1095–1104. [Google Scholar] [CrossRef]
  52. Vannarath, A.; Kumar, A. Evaluation, ranking, and selection of pretreatment methods for the conversion of biomass to biogas using multi-criteria decision-making approach. Environ. Syst. Decis. 2019, 40, 510–525. [Google Scholar] [CrossRef]
  53. Manuel Moreno Rocha, C.; Arenas Buelvas, D. Evaluation of renewable energy technologies in Colombia: Comparative evaluation using TOPSIS and TOPSIS fuzzy metaheuristic models. Energy Inform. 2024, 7, 62. [Google Scholar] [CrossRef]
  54. Howari, H.; Parvez, M.; Khan, O.; Alhodaib, A.; Mallah, A.; Yahya, Z. Multi-Objective Optimization for Ranking Waste Biomass Materials Based on Performance and Emission Parameters in a Pyrolysis Process—An AHP–TOPSIS Approach. Sustainability 2023, 15, 3690. [Google Scholar] [CrossRef]
  55. George, J.; Arun, P.; Muraleedharan, C. Region-specific biomass feedstock selection for gasification using multi-attribute deci-sion-making techniques. Int. J. Sustain. Eng. 2021, 14, 1101–1109. [Google Scholar] [CrossRef]
  56. Abdulvahitoglu, A.; Kilic, M. A new approach for selecting the most suitable oilseed for biodiesel production; the integrated AHP-TOPSIS method. Ain Shams Eng. J. 2022, 13, 101604. [Google Scholar] [CrossRef]
  57. Jiao, C.; Alfarraj, O.; Tolba, A.; Yu, J.; Park, J.H. Integrated AHP–TOPSIS model for renewable energy planning in low-carbon port cities: Implications for marine pollution mitigation. Mater. Today Sustain. 2026, 33, 101302. [Google Scholar] [CrossRef]
  58. Živković, S.B.; Veljković, M.V.; Banković-Ilić, I.B.; Krstić, I.M.; Konstantinović, S.S.; Ilić, S.B.; Avramović, J.M.; Stamenković, O.S.; Veljković, V.B. Technological, technical, economic, environmental, social, human health risk, toxicological and policy considerations of biodiesel production and use. Renew. Sustain. Energy Rev. 2017, 79, 222–247. [Google Scholar] [CrossRef]
  59. Gebara, C.H.; Thammaraksa, C.; Hauschild, M.; Laurent, A. Selecting indicators for measuring progress towards sustainable development goals at the global, national and corporate levels. Sustain. Prod. Consum. 2024, 44, 151–165. [Google Scholar] [CrossRef]
  60. Bonisoli, L.; Galdeano-Gómez, E.; Piedra-Muñoz, L. Deconstructing criteria and assessment tools to build agri-sustainability indicators and support farmers’ decision-making process. J. Clean. Prod. 2018, 182, 1080–1094. [Google Scholar] [CrossRef]
  61. Hu, Y.; Chen, J.; Tian, H.; Hu, Z. Techno-economic and environmental evaluation of the production of biodiesel from rice-straw in China. Front. Energy Res. 2023, 11, 1286373. [Google Scholar] [CrossRef]
  62. Kalita, K.; Pal, S.; Haldar, S.; Chakraborty, S. A Hybrid TOPSIS-PR-GWO Approach for Multi-objective Process Parameter Optimization. Process Integr. Optim. Sustain. 2022, 6, 1011–1026. [Google Scholar] [CrossRef]
  63. Gallozzi, T.; Micangeli, F.; Bricca, D.; Groppi, D.; Astiaso Garcia, D. Multi-Criteria Decision-Making for Distributed Renewable Energy Systems: A Review of Methods, Criteria Selection and Weighting Techniques. Energies 2026, 19, 2810. [Google Scholar] [CrossRef]
  64. Padi, R.K. Techno-Economic and Sustainability Models for Integration of Cassava Waste-Based Biorefineries into Cassava Starch Processes Based on Process Simulation and a Systems Modelling Approach. Ph.D. Thesis, Stellenbosch University, Stellenbosch, South Africa, 2021. [Google Scholar]
  65. Shah, A.; Darr, M. A techno-economic analysis of the corn stover feedstock supply system for cellulosic biorefineries. Biofuels Bioprod. Biorefining 2016, 10, 542–559. [Google Scholar] [CrossRef]
  66. Moni, S.M.; Mahmud, R.; High, K.; Carbajales-Dale, M. Life cycle assessment of emerging technologies: A review. J. Ind. Ecol. 2020, 24, 52–63. [Google Scholar] [CrossRef]
  67. Lee, S.Y.; Sankaran, R.; Chew, K.W.; Tan, C.H.; Krishnamoorthy, R.; Chu, D.-T.; Show, P.-L. Waste to bioenergy: A review on the recent conversion technologies. BMC Energy 2019, 1, 4. [Google Scholar] [CrossRef]
  68. Bisht, A.S.; Thakur, N.S. A Decision-making Framework to Evaluate and Select Optimal Biomass Gasification Plant Size for Sustainable Regional Bioenergy Development. Process Integr. Optim. Sustain. 2022, 7, 215–233. [Google Scholar] [CrossRef]
  69. Ezell, B.; Lynch, C.J.; Hester, P.T. Methods for weighting decisions to assist modelers and decision analysists: A review of ratio assignment and approximate techniques. Appl. Sci. 2021, 11, 10397. [Google Scholar] [CrossRef]
  70. Gan, X.; Fernandez, I.C.; Guo, J.; Wilson, M.; Zhao, Y.; Zhou, B.; Wu, J. When to use what: Methods for weighting and aggregating sustainability indicators. Ecol. Indic. 2017, 81, 491–502. [Google Scholar] [CrossRef]
  71. Brodny, J.; Tutak, M. Disparities of Central and Eastern European Countries of European Union in innovation potential: A multi-criteria assessment. J. Open Innov. Technol. Mark. Complex. 2024, 10, 100282. [Google Scholar] [CrossRef]
  72. Fufa, T.T.; Montastruc, L.; Negny, S.; Van Der Werf, L.; Yimam, A. Framework to Support the Development of Collaborative and Sustainable Biofuels Supply Chains in Ethiopia. Logistics 2026, 10, 36. [Google Scholar] [CrossRef]
  73. Więckowski, J.; Kizielewicz, B.; Sałabun, W. A multi-dimensional sensitivity analysis approach for evaluating the robustness of renewable energy sources in European countries. J. Clean. Prod. 2024, 469, 143225. [Google Scholar] [CrossRef]
  74. Zandi, P.; Ajalli, M.; Ekhtiyati, N.S. An extended simple additive weighting decision support system with application in the food industry. Decis. Anal. J. 2025, 14, 100553. [Google Scholar] [CrossRef]
  75. Sultana, A.; Kumar, A. Ranking of biomass pellets by integration of economic, environmental and technical factors. Biomass Bioenergy 2012, 39, 344–355. [Google Scholar] [CrossRef]
  76. Avramova, T.; Peneva, T.; Ivanov, A. Overview of Existing Multi-Criteria Decision-Making (MCDM) Methods Used in Industrial Environments. Technologies 2025, 13, 444. [Google Scholar] [CrossRef]
  77. Malefaki, S.; Markatos, D.; Filippatos, A.; Pantelakis, S. A Comparative Analysis of Multi-Criteria Decision-Making Methods and Normalization Techniques in Holistic Sustainability Assessment for Engineering Applications. Aerospace 2025, 12, 100. [Google Scholar] [CrossRef]
  78. Anwar, M. Biodiesel feedstocks selection strategies based on economic, technical, and sustainable aspects. Fuel 2021, 283, 119204. [Google Scholar] [CrossRef]
  79. Hiloidhari, M.; Das, D.; Baruah, D.C. Bioenergy potential from crop residue biomass in India. Renew. Sustain. Energy Rev. 2014, 32, 504–512. [Google Scholar] [CrossRef]
  80. SAF Roadmap, Development of Sustainable Aviation Fuel in Ethiopia: A Roadmap; Boeing Company: Arlington, VA, USA, 2021.
  81. Tesfamichael, B. Designing and Planning of Ethiopia’s Biomass-to-Biofuel (Bioethanol and Biodiesel) Supply Chain Through Integrated Strategic-Tactical Optimization Model Under Economic and Environmental Dimensions. Ph.D. Thesis, Institut National Polytechnique de Toulouse, Toulouse, France, 2023. [Google Scholar]
Figure 1. Methodological framework.
Sustainability 18 08112 g001
Figure 2. Mapping feedstocks within feedstock availability−techno-economic dimensions.
Sustainability 18 08112 g002
Figure 3. The result of sensitivity analysis under different scenario weights.
Sustainability 18 08112 g003
Figure 4. Comparison of the ranking results obtained using TOPSIS relative closeness values and WSM aggregated scores.
Sustainability 18 08112 g004
Table 1. Constructing decision matrix for alternative versus sub criteria.
TOPSIS Sub-Criteria (Cm)
C1C2 Cm
Alternative feedstocks (An)A1y21y12 y1m
A2y21y22 y2m
Anyn1yn2 ynm
Table 2. Assessment values for each feedstock evaluated under the selected sub-criteria.
Feedstock
Criteria
Technology
Criteria
Economic
Criteria
Feedstock
Alternatives
Average Net
Available (Ton)
Technological Readiness Level (TRL)CAPEX (Million $)Total Production Costs (In Million $)Net Profit After Tax (In Million $)Payback Period (Year)
Molasses325,057922.403.732.827.95
Cereal residues630,367333.666.960.3889.46
Coffee residues431,882333.666.960.3889.46
Cane residues450,712333.666.960.3889.46
Castor seed990073.979.391.822.18
Jatropha curcas150073.979.391.822.18
Ethiopian mustard216173.979.391.822.18
Water hyacinth10001****
The ‘*’ used in this Table indicates data are not available for estimation of economic criteria.
Table 3. Normalized values of feedstock alternatives (unweighted).
Feedstock
Alternatives
Feedstock
Criteria
Technology
Criteria
Economic Criteria
Net Biomass AvailableTRLCAPEXTotal Production CostNet ProfitPayback Period
Molasses0.34400.56250.35650.18110.65800.0512
Cereal residues0.66710.18750.53570.33810.08780.5764
Coffee residues0.45710.18750.53570.33810.08780.5764
Cane residues0.47700.18750.53570.33810.08780.5764
Castor seed0.01050.43750.06320.45620.42580.0140
Jatropha curcas0.00160.43750.06320.45620.42580.0140
Ethiopian mustard0.00230.43750.06320.45620.42580.0140
Water hyacinth0.00110.0625****
The ‘*’ used in this Table indicates data are not available for estimation.
Table 4. Weighted normalized values and TOPSIS ranking results (under equal weight assumptions).
Closeness Coefficients
Feedstock
Alternatives
Net Biomass AvailableTRLCAPEXProduction CostNet ProfitPayback
Period
Si+SiCiRanking
Molasses0.05730.09380.05940.03020.10970.00850.07300.17290.70311
Cereal residues0.11120.03130.08930.05630.01460.09610.16920.11460.40395
Coffee residues0.07620.03130.08930.05630.01460.09610.17280.08120.31977
Cane residues0.07950.03130.08930.05630.01460.09610.17220.08430.32886
Castor seed0.00170.07290.01050.07600.07100.00230.12660.14860.54012
Jatropha curcas0.00030.07290.01050.07600.07100.00230.12780.14860.53754
Ethiopian mustard0.00040.07290.01050.07600.07100.00230.12770.14860.53773
Water hyacinth0.00020.0104********
Ideal best (PIS)0.11120.09380.01050.03020.10970.0023
Ideal worst (NIS)0.00020.01040.08930.07600.01460.0961
The ‘*’ used in this Table indicates data are not available for estimation.
Table 5. Net availability classification using average closeness coefficient value (Ci) as the cutoff value.
Feedstock
Alternatives
Net
Available
Closeness CoefficientsClassifying Net Availability into (High/Low) Based on Average Closeness Coefficients (Cutoff Value = 0.3662)
(High ≥ 0.3662 and Low < 0.3662)
Si+SiCi
Molasses0.05730.05390.05710.5147High
Cereal residues0.11120.00000.11100.9999High
Coffee residues0.07620.03500.07600.6845High
Cane residues0.07950.03170.07930.7144High
Castor seed0.00170.10950.00150.0139Low
Jatropha curcas0.00030.11090.00010.0006Low
Ethiopian mustard0.00040.11080.00020.0016Low
Water hyacinth0.00020.11100.00000.0002Low
Ideal best (PIS)0.1112
Ideal worst (NIS)0.0002
Cutoff value = Average Ci0.3662
Table 6. Techno-economic feasibility classification using average closeness coefficient value (Ci) as the cutoff value.
Feedstock
Alternatives
TRLCAPEXProduction CostNet ProfitPayback PeriodCloseness CoefficientsClassifying Techno-Economic Feasibility into (High/Low) Based on Closeness Coefficients (Cutoff Value = 0.5370)
(High ≥ 0.5370 and
Low < 0.5370)
Si+SiCi
Molasses0.09380.05940.03020.10970.00850.02460.18090.8803High
Cereal residues0.03130.08930.05630.01460.09610.14760.04280.2249Low
Coffee residues0.03130.08930.05630.01460.09610.14760.04280.2249Low
Cane residues0.03130.08930.05630.01460.09610.14760.04280.2249Low
Castor seed0.07290.01050.07600.07100.00230.05130.14200.7345High
Jatropha curcas0.07290.01050.07600.07100.00230.05130.14200.7345High
Ethiopian mustard0.07290.01050.07600.07100.00230.05130.14200.7345High
Water hyacinth0.0104*******Low
Ideal best0.09380.01050.03020.10970.0023
Ideal worst0.01040.08930.07600.01460.0961
Cutoff = Average Ci0.5370
The ‘*’ used in this Table indicates data are not available.
Disclaimer/Publisher’s Note: The statements, opinions and data contained in all publications are solely those of the individual author(s) and contributor(s) and not of MDPI and/or the editor(s). MDPI and/or the editor(s) disclaim responsibility for any injury to people or property resulting from any ideas, methods, instructions or products referred to in the content.