Article

Structural Evolution and Determinants of the Agricultural Machinery Trade Network Among RCEP Members: Implications for Sustainable Technology Diffusion and Supply-Chain Resilience

1
School of Business, Shandong University, Weihai 264209, China
2
Nanjing Institute of Agricultural Mechanization, Ministry of Agriculture and Rural Affairs, Nanjing 210014, China
3
Graduate School of the Chinese Academy of Agricultural Sciences, Beijing 100081, China
*
Author to whom correspondence should be addressed.
Sustainability 2026, 18(16), 8070; https://doi.org/10.3390/su18168070
Submission received: 14 July 2026 / Revised: 25 July 2026 / Accepted: 29 July 2026 / Published: 7 August 2026
(This article belongs to the Section Sustainable Agriculture)

Abstract

Using bilateral agricultural machinery trade data for 15 RCEP member states from 2004 to 2023, this study constructs a directed weighted network and applies social network analysis and the quadratic assignment procedure (QAP) to examine structural evolution, node positions, community patterns, and factors associated with bilateral trade ties. Network density increased from 0.467 to 0.962, average path length declined from 1.533 to 1.038, and betweenness centralization fell from 0.064 to 0.021, indicating denser connections, shorter potential transmission paths, and lower dependence on intermediary nodes. After 2020, China recorded the highest centrality, while Japan, the Republic of Korea, Australia, Singapore, and major ASEAN economies retained complementary positions. QAP results show positive associations of trade ties with GDP differences, common language, contiguity, and exchange-rate differences, and negative associations with water-resource differences, trade-structure differences, and institutional distance. These findings demonstrate a close relationship between trade networks, the diffusion of sustainable technologies, and regional supply chain resilience. Policy priorities include supplier diversification, compatible sustainability standards, lifecycle governance, regional repair and remanufacturing capacity, and inclusive access to machinery services.

1. Introduction

Agricultural machinery provides an essential material and technological foundation for food security, higher agricultural productivity, and the timely completion of farm operations [1,2,3]. Unlike conventional approaches to mechanization that emphasize labor substitution and scale expansion, sustainable agricultural mechanization gives greater weight to economic viability, environmental compatibility, social inclusion, and adaptation to local farming systems. Appropriate mechanization can reduce drudgery, improve land and labor productivity, support conservation tillage, post-harvest handling, and agro-processing, and thereby enhance the operational efficiency of food systems [2,4,5,6].
The sustainability effects of agricultural machinery are determined not by machinery inputs alone but by the production technologies and practices they embody. Precision seeding, variable-rate input application, water-efficient irrigation, reduced or zero tillage, energy-efficient drying, and digital control can lower the use of fuel, water, fertilizers, and pesticides while maintaining or increasing output [2,7]. International trade can broaden access to relevant equipment, components, and technical knowledge. The extent of diffusion nevertheless depends on equipment prices, financing conditions, skills training, maintenance capacity, and the compatibility of machinery with local crop types, farm sizes, water conditions, and climate risks [4,5,6,8].
RCEP entered into force on 1 January 2022. Its member economies differ substantially in manufacturing capacity, agricultural production structures, and market demand [9,10,11,12,13]. Available industrial and trade patterns suggest that Japan and the Republic of Korea have relatively strong capabilities in high-value equipment, precision components, and intelligent control systems; China combines a broad manufacturing base with scale and cost advantages; Singapore is well positioned to support logistics organization and supply-chain services; ASEAN members represent expanding markets for scale-appropriate agricultural machinery; and Australia and New Zealand have demand associated with large-scale cropping and livestock production. These production-demand complementarities provide an economic and functional basis for regional agricultural machinery trade and potential cross-border technology flows [8].
Regional trade integration generates both efficiency gains and concentration risks. Dense agricultural machinery trade ties and specialized supply systems can reduce procurement costs, shorten delivery times, and facilitate technological learning. Conversely, excessive dependence on a single country or a small number of producers of critical components may allow localized shocks to spread rapidly through the trade network [14,15]. The sustainability of agricultural machinery trade therefore depends not only on cost and efficiency improvements but also on diversified sources of supply, interoperable technical standards, inventories of critical components, maintenance capacity, and coordination across communities. Because agricultural machinery is a durable capital good, sustainable governance should extend across the product lifecycle, including environmental performance assessment, durable and repairable design, component reuse, remanufacturing, recycling, and regulated end-of-life treatment [16,17,18,19].
Against this background, this study addresses three questions. How has the structure of the agricultural machinery trade network among RCEP members evolved? How have the relative positions of individual members changed within the regional network? How are economic, resource, geographical, cultural, and institutional differences associated with bilateral agricultural machinery trade ties, and what possible implications follow for sustainable technology diffusion and regional supply-chain resilience? This study provides significant insights into the development of the agricultural machinery trade network within the RCEP region, the influencing factors, the promotion of sustainable technology diffusion, and the regional supply chain resilience of agricultural machinery.

2. Literature Review

The literature relevant to this study comprises three strands. The first examines the structure and evolution of international trade networks. As global trade has shifted from linear bilateral relationships toward interactions among multiple actors, conventional trade analysis has become less able to capture structural dependence among countries. Complex network analysis and social network analysis have therefore been widely applied to international trade. These studies typically treat countries as nodes and bilateral trade flows as directed weighted edges, and investigate the topology and evolution of global trade networks in terms of connectivity, node centrality, and community structure [20,21,22,23,24,25,26,27]. Related research on international economic integration and the dynamics of global trade communities has documented core–periphery structures and regional differentiation [28,29,30]. Within the RCEP context, recent studies have examined the structural evolution and formation mechanisms of manufacturing trade networks [31,32]. This work provides an important methodological foundation, but network research remains limited for agricultural machinery, which simultaneously functions as a capital good, a carrier of technology, and an agricultural input.
The second strand concerns agricultural mechanization and sustainable development. Early research focused mainly on the economic effects of machinery through labor substitution, productivity growth, and technology adoption [1]. More recent work has expanded to resource use, climate adaptation, social inclusion, and food-system transformation [2,3]. Farm size and land fragmentation directly affect machinery adoption and operating efficiency [33], whereas machinery-service outsourcing and specialization can ease the fixed-investment constraints faced by smallholders [34]. Studies further show that scale-appropriate equipment, leasing services, and cooperative use can improve smallholder access to technology, although diffusion still depends on financing, skills training, local repair networks, and supportive institutions [4,5,6,8]. Regarding environmental outcomes, precision agriculture can improve input-use efficiency and offer emissions-reduction potential [7]. Durable design, repair, remanufacturing, and material recovery are also integral to sustainable lifecycle governance of agricultural machinery [16,17,18,19].
The third strand addresses trade in agricultural machinery products and its determinants. Existing studies examine trade scale and product structure [35], export flows and trade potential [36,37,38], intra-industry trade [39], developments in agricultural machinery markets in major advanced economies [40], and the comparative competitiveness of agricultural machinery products from China and India [41]. Research on export competitiveness evaluates Chinese agricultural machinery products in terms of comparative advantage, market share, export technological sophistication, and product quality. It generally finds continued growth in China’s agricultural machinery exports but substantial heterogeneity in competitive advantage, quality tier, and market performance across products [42,43,44,45]. Trade-policy shocks can also affect agricultural machinery trade through import costs, product substitution, and supply-chain adjustment [46]. Overall, this literature relies largely on gravity models, constant-market-share models, and competitiveness indices to explain bilateral trade volumes or export performance, while paying less attention to the overall regional structure of agricultural machinery trade from a relational-network perspective.
Taken together, the literature provides a strong basis for understanding trade-network structures, the effects of agricultural mechanization, and trade in agricultural machinery, but three gaps remain. First, trade-network studies focus mainly on global trade or manufacturing as a whole, whereas research on agricultural machinery trade concentrates on export competitiveness, trade potential, and bilateral determinants. The overall evolution of the RCEP agricultural machinery trade network has not been systematically identified. Second, few studies examine agricultural machinery trade simultaneously through the lenses of structural readiness for technology diffusion and exposure to supply-chain concentration. Consequently, they reveal little about how connectivity, centralization, and community structure may enable cross-border technology flows while also creating concentration risk. Third, conventional regression models cannot adequately account for the structural dependence inherent in relational data between countries. This article attempts to provide a supplement. This study makes three contributions: first, it constructs a directed weighted agricultural machinery trade network among RCEP member countries from 2004 to 2023, characterizing its evolution at the levels of the overall network, nodes, and communities; second, it evaluates this network as critical infrastructure facilitating technology flow, supply chain coordination, and inclusive mechanization, exploring its potential links to sustainable technology diffusion and regional supply chain resilience; third, it employs QAP methods to identify statistical associations between factors such as economic scale, agricultural resources, geography and culture, exchange rates, trade structure, and institutional distance, and bilateral trade relationships.

3. Evolution of the Agricultural Machinery Trade Network Among RCEP Member States

3.1. Data and Product Coverage

This study uses bilateral agricultural machinery trade data for 2004–2023 from the United Nations Comtrade Database (UN Comtrade) [47]. Because statistical definitions and product coverage differ across members, this study follows the function- and production-stage-based classification adopted in related research [46] and groups six-digit HS products into nine categories: tillage and land preparation, planting and fertilizing, harvesting, post-harvest handling, primary processing of agricultural products, agricultural transport, livestock machinery, agricultural power machinery, and other agricultural machinery (Table 1). This classification broadly covers the pre-production, production, and post-production stages of agriculture and permits the network analysis to capture trade channels through which machinery, components, and related technical knowledge may move.

3.2. Node Selection and Network Construction

In the trade network, countries constitute nodes and bilateral trade relationships form directed edges; trade among multiple countries therefore creates a directed weighted network [20,21,22,23]. The sample comprises all 15 RCEP members: China, Japan, the Republic of Korea, Australia, New Zealand, and the ten ASEAN members. Bilateral 15 × 15 trade matrices are constructed from data for 2004–2023. To represent changes across stages of network development, 2004, 2010, 2015, 2020, and 2023 are selected as benchmark years. A bilateral trade value of USD 1 million is used as the edge threshold to identify economically substantive capital-goods relationships and to prevent low-frequency, very small, or one-off transactions from mechanically inflating network density. The cutoff is an operational definition of the high-value trade backbone, not a minimum level required for technology diffusion. It may understate fragmented participation by smaller economies, including Laos, Cambodia, Myanmar, and Brunei; consequently, findings concerning peripheral participation and network density are conditional on this threshold. Alternative cutoffs could change the number of low-value ties and should be examined in future sensitivity analyses. Network visualization and indicator calculation are performed in Gephi 0.9.2 and UCINET 6, respectively [47,48].

3.3. Evolution of Agricultural Machinery Trade Network Patterns

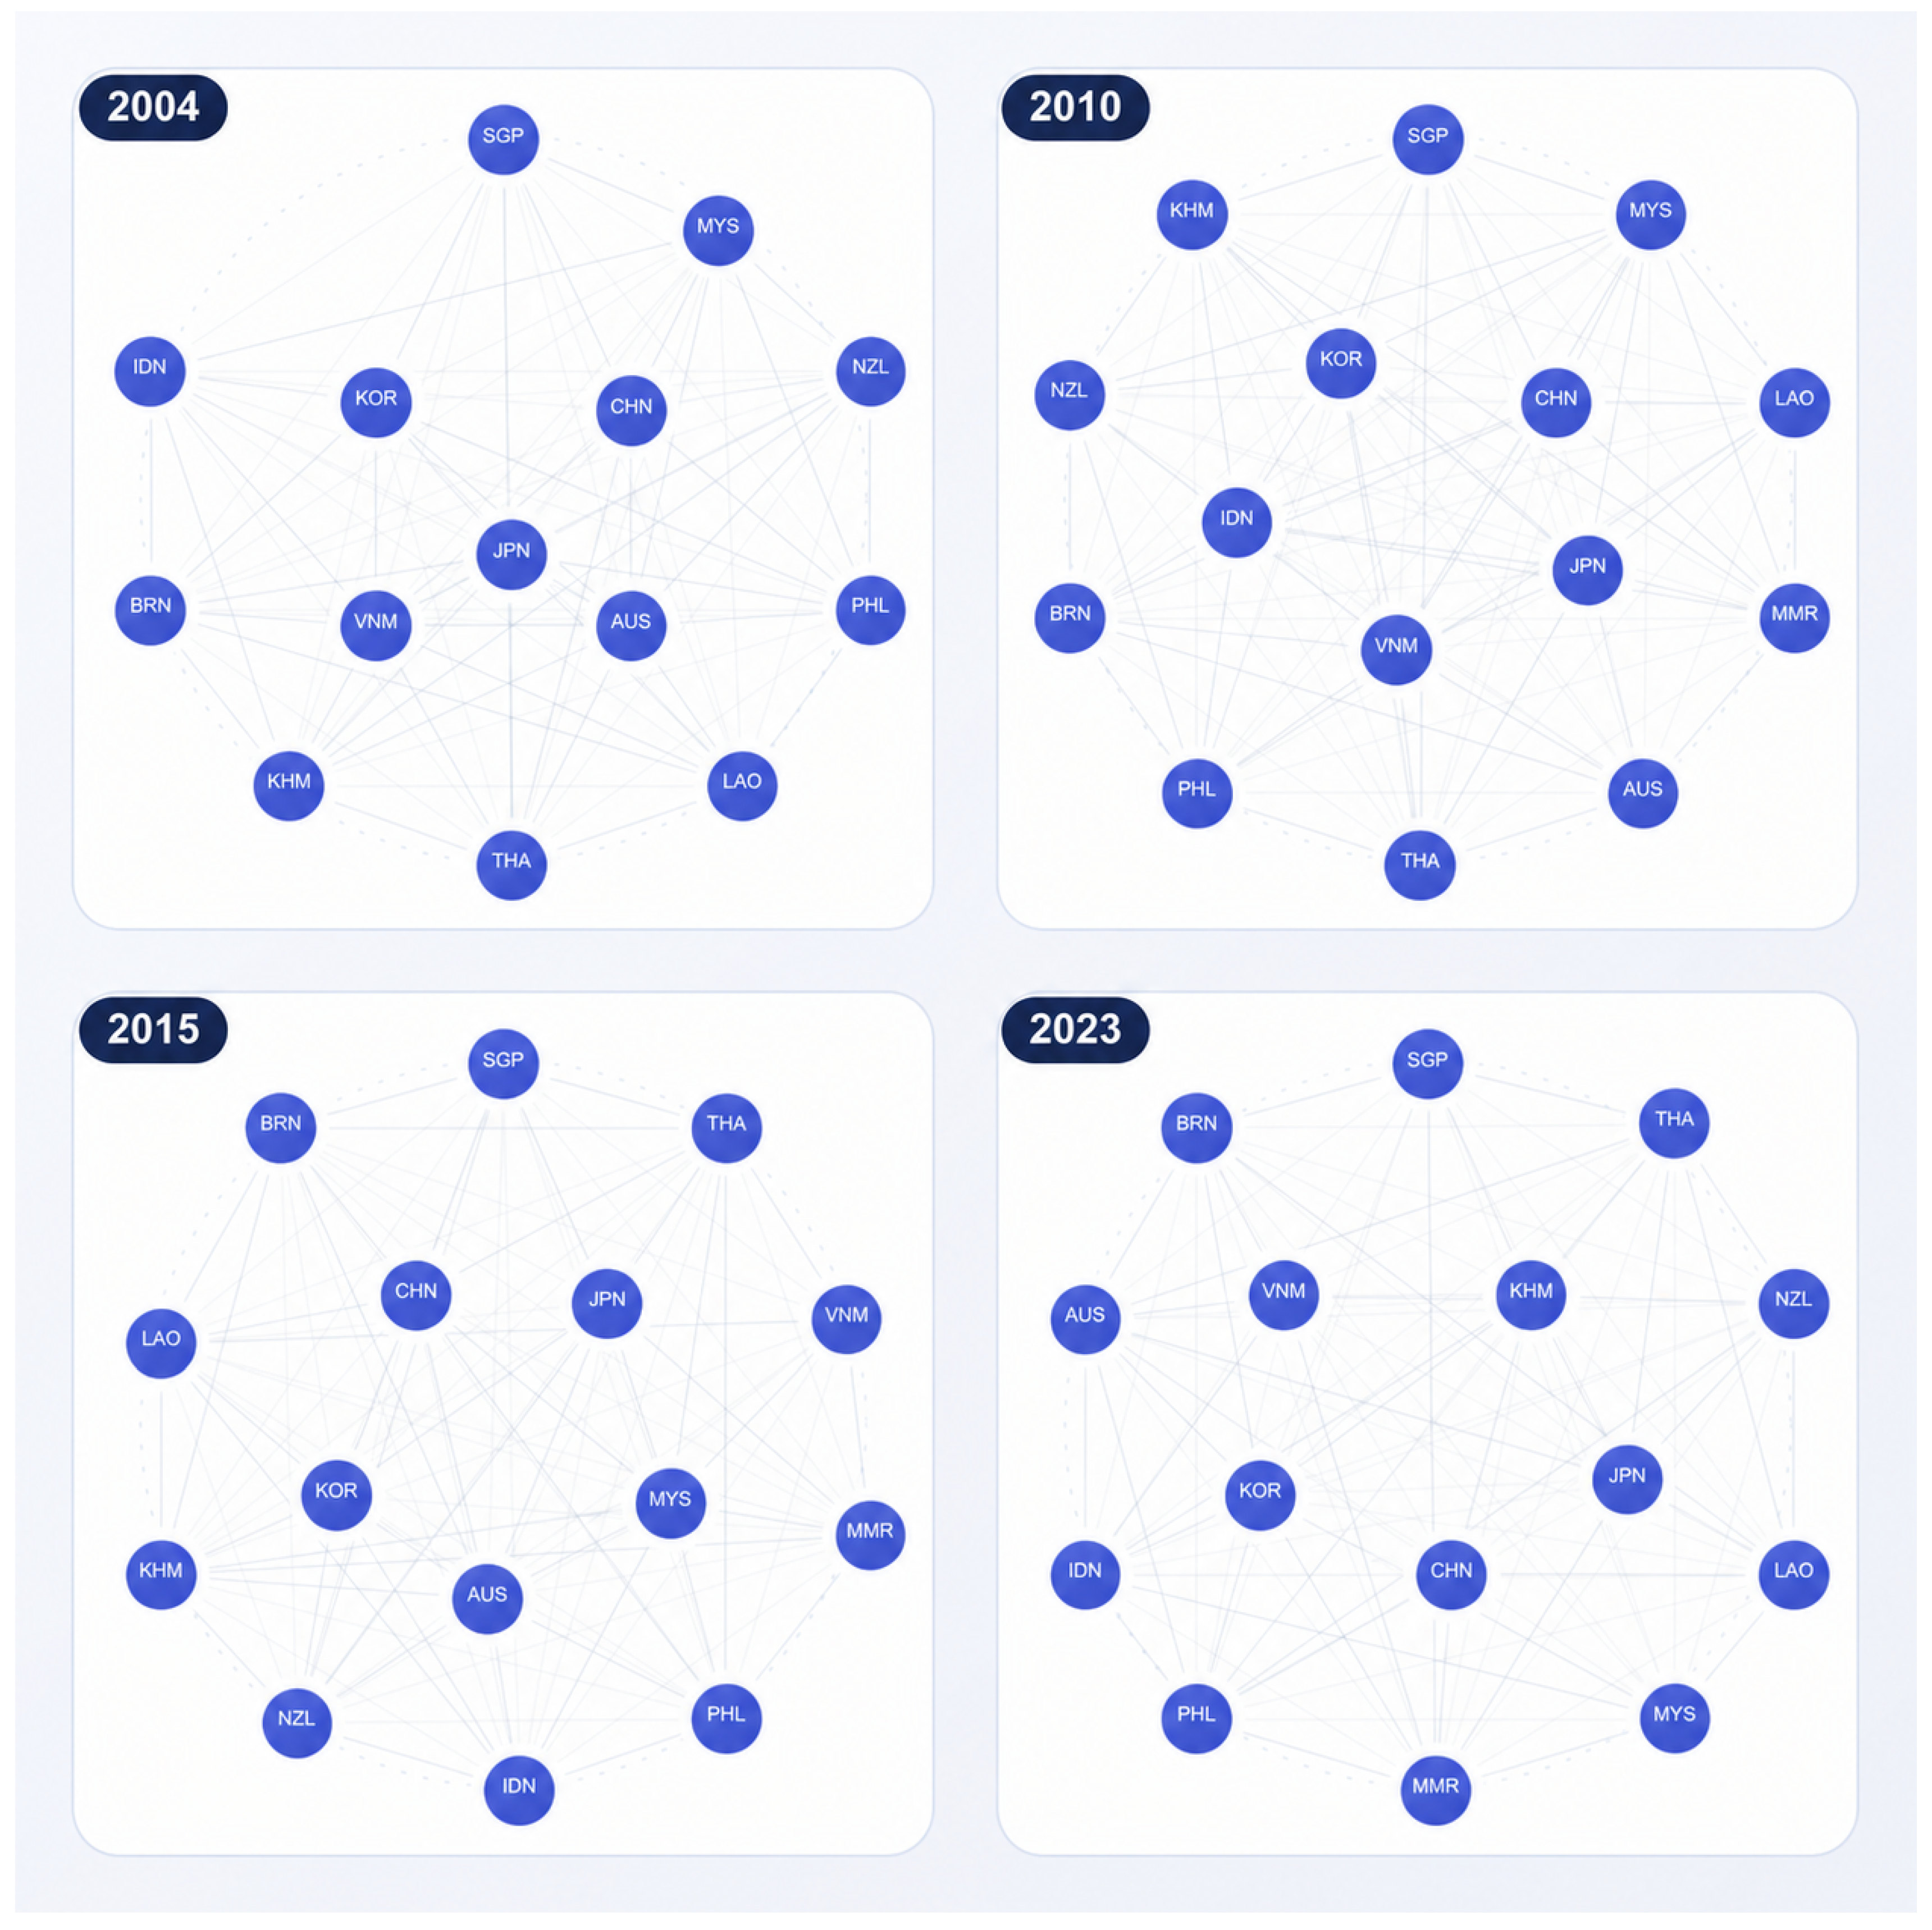
Gephi is used to visualize the agricultural machinery trade network among RCEP members. Nodes represent member states, and node size reflects a country’s share of total regional agricultural machinery trade. Directed edges represent export relationships and point from the exporter to the importer; edge thickness reflects bilateral trade flows. Figure 1 presents the network structures in 2004, 2010, 2015, and 2023. China, Japan, the Republic of Korea, Singapore, Thailand, Vietnam, Malaysia, and Australia display relatively high node weights in the selected benchmark years, whereas Laos, Myanmar, Cambodia, Brunei, and New Zealand display relatively low weights under the USD 1 million threshold. The visualized network therefore exhibits a marked hierarchy in high-value trade participation.
China’s observed position in the regional agricultural machinery trade network strengthened over the sample period. In 2004, China already had substantial trade ties with the Republic of Korea, Japan, Thailand, Vietnam, and Malaysia, with the China–Republic of Korea relationship particularly prominent. China’s node size subsequently expanded, and its connections with Japan, the Republic of Korea, Vietnam, Malaysia, Thailand, and Singapore became markedly thicker. By the later part of the sample period, a larger share of high-value trade flows involved China, which is consistent with an expanding hub position in regional agricultural machinery imports, exports, and industrial-chain linkages.
Japan, the Republic of Korea, and Singapore retained comparatively important network positions throughout the sample period. Japan and the Republic of Korea consistently ranked among the members with high node weights and maintained strong trade ties with China, Vietnam, Malaysia, and Thailand. In conjunction with the industrial patterns discussed in the literature, these network positions are consistent with important roles in high-value equipment and component supply. The China–Republic of Korea link was prominent in several benchmark years, indicating a stable bilateral agricultural machinery trade relationship. Japan’s links with China, Vietnam, and Malaysia strengthened toward the end of the sample period. Singapore’s high connectivity, despite its small agricultural sector, is consistent with a role in re-export trade, logistics organization, and supply-chain services.
At the same time, high-value regional trade in agricultural machinery gradually became concentrated around China and the major ASEAN economies. Early in the sample, the thickest links were mainly between the Republic of Korea and China, between China and Japan, and among several ASEAN members, and the overall structure was relatively dispersed. As regional economic and trade ties deepened, China’s trade with Japan, the Republic of Korea, Vietnam, Malaysia, and Thailand expanded substantially. By the end of the sample period, China, Vietnam, the Republic of Korea, Japan, Thailand, Malaysia, and Singapore formed a dense set of multilateral ties. The rising node weights of ASEAN members such as Vietnam, Thailand, and Malaysia reflect both expanding demand in ASEAN agricultural machinery markets and greater participation in the regional network.
Overall, between 2004 and 2023, the agricultural machinery trade network among RCEP members evolved from a relatively dispersed pattern toward a multicentric structure involving several core economies. China’s node weight and trade connectivity increased rapidly, and it occupied the most central observed position in the later sample years. Japan and the Republic of Korea retained high network positions that are consistent with their capabilities in advanced equipment and components; Singapore remained highly connected in ways consistent with re-export and logistics functions; and the participation of ASEAN members—including Vietnam, Thailand, Malaysia, Indonesia, and the Philippines—increased. These interpretations combine the network evidence with established industrial characteristics.

3.4. Network-Level and Node-Level Indicators

3.4.1. Regional Integration, Technology Diffusion, and Structural Resilience

To assess the integration of the agricultural machinery trade network among RCEP members, this study draws on the small-world property in social network analysis. A network has a small-world structure when any two nodes can connect through only a small number of intermediate nodes [49]. Short average path length and a high average clustering coefficient are the principal criteria for identifying such networks [50]. In an agricultural machinery trade network, high connectivity and short paths indicate structural capacity for equipment, components, and related technical knowledge to move through fewer intermediaries. They do not establish that technologies are adopted by farms or produce measurable sustainability gains.
This study uses network density, the average clustering coefficient, average path length, and betweenness centralization to characterize the overall structure of the RCEP agricultural machinery trade network [20,24,25,26,27]. Network density captures the number of economically meaningful trade ties among members; average path length measures the mean number of transmission steps between suppliers and users; the average clustering coefficient indicates the cohesiveness of local trading groups; and betweenness centralization measures the network’s dependence on a small number of intermediary nodes. Higher density and shorter paths can be interpreted as greater structural readiness for cross-border flows, a higher clustering coefficient as stronger potential for repeated trading and service relationships, and lower betweenness centralization as greater route redundancy. These are enabling conditions rather than realized measures of diffusion, resilience, or sustainability.
Table 2 shows that connectivity in the agricultural machinery trade network among RCEP members increased markedly between 2004 and 2023. The number of effective links rose from 98 to 202, network density increased from 0.467 to 0.962, and average path length decreased from 1.533 to 1.038. The average clustering coefficient remained high at 0.890–0.926, while betweenness centralization fell from 0.064 to 0.021. These directly observed changes indicate more high-value trade channels, shorter network paths, and lower dependence on a small number of intermediaries. They are consistent with stronger structural readiness for potential technology flows and route substitution.

3.4.2. Network Centrality

Centrality indicators capture the relative positions of economies within the trade network [51]. This study examines node strength, betweenness centrality, and closeness centrality. Node strength reflects trade scale and tie intensity, betweenness centrality measures a country’s position along shortest trade paths, and closeness centrality indicates how readily it can connect with other members. High centrality may be consistent with stronger capacities for technology supply, resource allocation, or service coordination, but these functional interpretations require supporting industrial evidence. Excessive concentration of centrality can also increase regional exposure to shocks at a small number of critical nodes. All values reported in Table 3, Table 4, Table 5 and Table 6 are normalized on a 0–1 scale, and the figures in parentheses are country rankings rather than percentages.
(1) Node Strength
A node’s total strength comprises outward and inward strength, corresponding to its export and import ties. A higher value indicates stronger trade ties and a more central network position. It is calculated as:
C D ( i )   = j = 1 N a ij + i = 1 N a ij  
where a ij denotes a directed edge from node i to node j .
(2) Betweenness Centrality (BC)
Betweenness centrality measures a node’s brokerage role in the trade network. A higher value indicates that more shortest trade paths pass through the node. It is calculated as:
C B ( i )   =   1 N j , k n j , k i g j , k  
where g j , k is the number of shortest paths between nodes j and k , and n j , k i is the number of those paths that pass through node jki .
(3) Closeness Centrality (CC)
Closeness centrality measures how readily a node can reach other nodes. Lower closeness indicates longer connection paths and greater dependence on intermediaries. In a directed network, it comprises out-closeness ( CC 0 , i ) and in-closeness ( CC i , 0 ), calculated as:
CC 0 , i   =   1 1 N 1 j i , j   =   1 N d ij
CC i , 0 = 1 1 N 1 j i , j = 1 N d ji
d ij and d ji denote the shortest-path distances from node i ( j ) to node j ( i ), respectively.
(1) Node strength. Table 3 shows that Japan, the Republic of Korea, and Australia generally maintained high normalized node strength from 2004 to 2023. Japan ranked first in both 2004 and 2010 and occupied the most central position in high-value regional agricultural machinery trade early in the sample period. China recorded the largest increase, moving from a normalized node strength of 0.142 and 11th place in 2004 to 0.328 and fourth place in 2015. It rose further to 0.456 and first place in 2020 and reached 0.523 in 2023. Over the same period, Japan’s value declined from 0.486 to 0.375 and its ranking fell to second, while the Republic of Korea and Australia ranked third and fourth, respectively, in 2023. These changes indicate that the network’s highest observed node-strength position shifted gradually from Japan to China.
(2) Betweenness centrality. Table 4 shows that China’s normalized betweenness centrality rose from 0.032 and 13th place in 2004 to 0.198 in 2020 and 0.236 in 2023. It ranked first in both 2020 and 2023, indicating that a larger share of shortest network paths passed through China. Japan’s value declined from 0.215 in 2004 to 0.148 in 2023, and its ranking fell from first to second. Australia, the Republic of Korea, Singapore, and Thailand also maintained comparatively high betweenness centrality and occupied important bridging positions in the observed trade network.
(3) Closeness centrality. Higher normalized closeness centrality indicates a shorter average network distance between a country and other members. In-closeness centrality reflects the ease with which a country, as an importer, can access regional suppliers; out-closeness centrality reflects the reach of a country, as an exporter, to other members. Table 5 and Table 6 show that between 2004 and 2023 China’s in-closeness centrality increased from 0.623 to 0.853 and its out-closeness centrality rose from 0.586 to 0.835. Its ranking on both indicators climbed from ninth to first, showing a marked improvement in network accessibility for agricultural machinery imports and exports. Japan, Australia, and the Republic of Korea remained highly accessible, although their relative advantages narrowed.
Taken together, the centrality indicators show that, in the later sample years, China occupied the highest observed centrality positions, while several other economies remained important within the network. After 2020, China ranked first in normalized node strength, betweenness centrality, in-closeness centrality, and out-closeness centrality. Japan, the Republic of Korea, Australia, Singapore, Thailand, Malaysia, and Vietnam retained complementary network positions. When interpreted alongside external evidence on manufacturing, components, logistics, and market demand, this pattern is consistent with a multicentric division of functions. The structure may reduce search and coordination costs, but shocks affecting China or a small number of specialized component suppliers may also generate spillovers. Higher centrality should therefore be evaluated in terms of both potential coordination efficiency and concentration exposure and it may be related to supply chain resilience.

3.4.3. Community Structure and Regional Inclusiveness

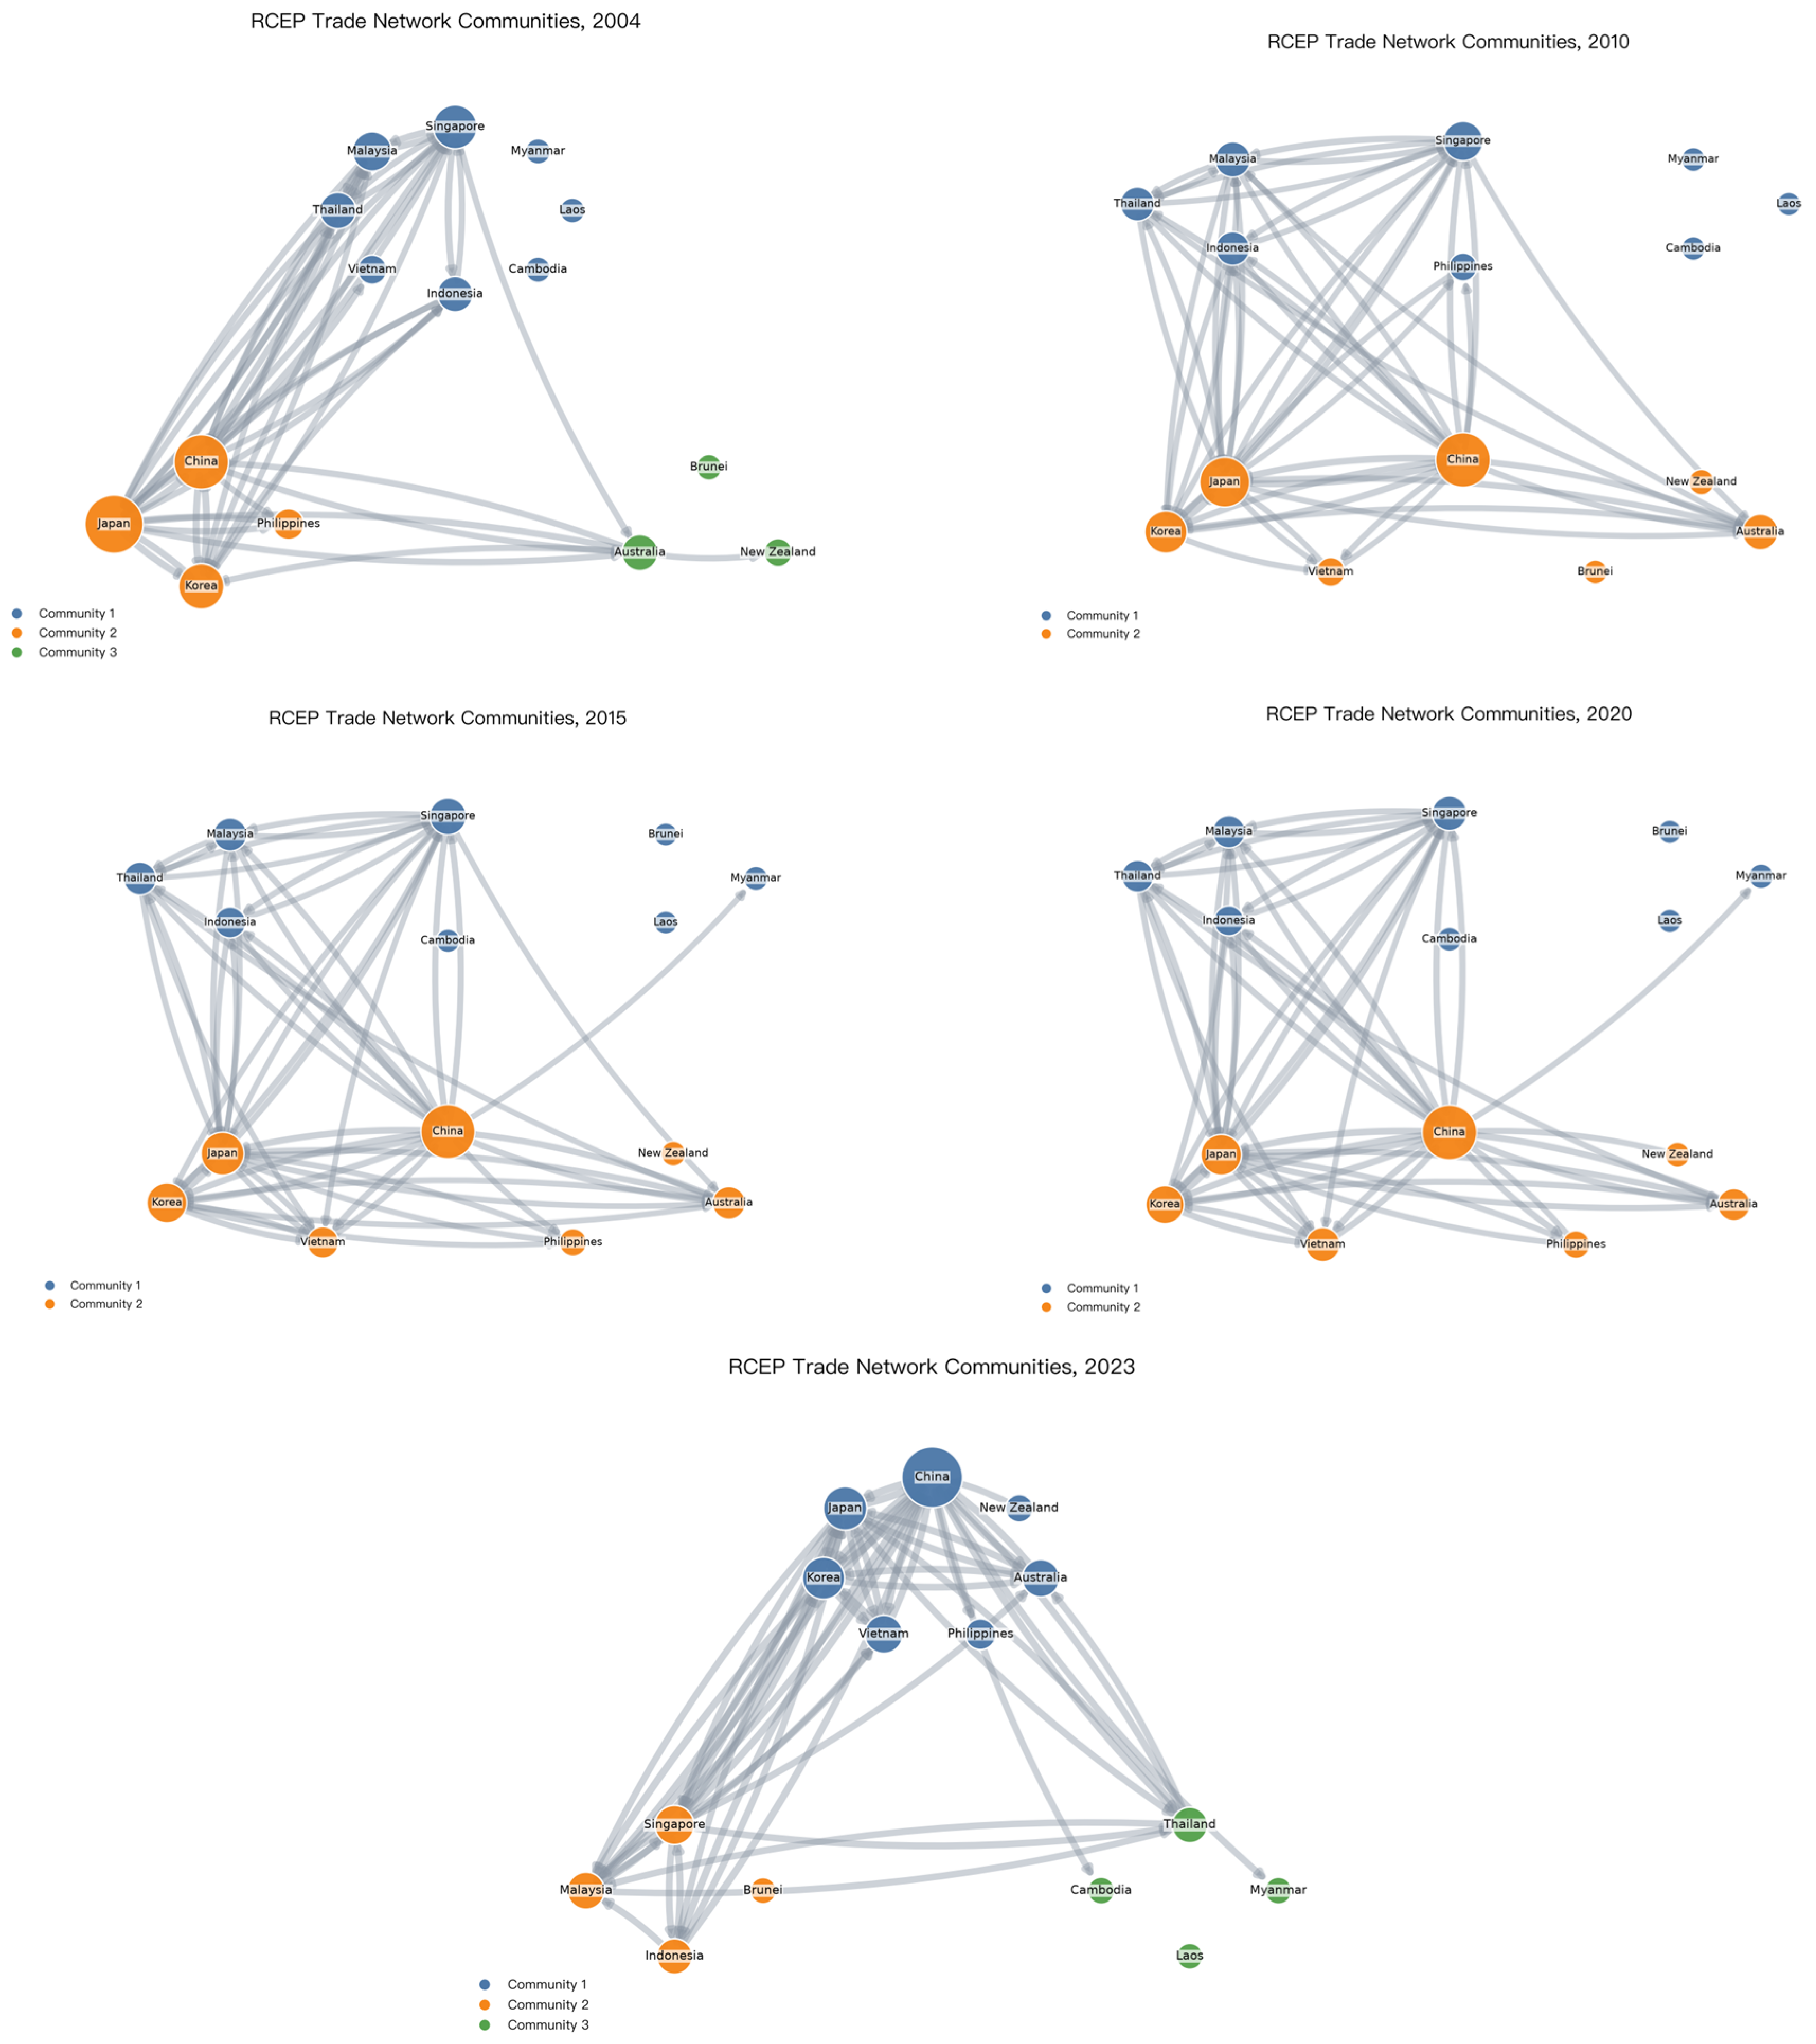
This study applies community detection to identify relatively dense trading groups in the agricultural machinery trade network among RCEP members and uses modularity Q to measure the distinctiveness of the partition. A higher Q value indicates that within-community ties are more concentrated relative to cross-community ties. Network modularity generally declined between 2004 and 2023, falling from 0.411 in 2010 to 0.304 in 2023. The decline indicates that the detected communities became less clearly separated even when the algorithm continued to assign countries to discrete groups. Thus, a change in the number of communities does not necessarily imply stronger segmentation; the number of groups and the strength of their boundaries are distinct properties.
In terms of composition, the network formed three communities in 2004. China, Japan, the Republic of Korea, and the Philippines formed the first; Singapore, Malaysia, Thailand, Indonesia, Vietnam, and other ASEAN members, including Myanmar, Laos, and Cambodia, formed the second; and Australia, New Zealand, and Brunei formed the third. This pattern is consistent with a combination of geographical proximity, market segmentation, and differences in industrial foundations. Between 2010 and 2020, the original three communities consolidated into a Northeast Asia–Australia–New Zealand group and an ASEAN group. China, Japan, the Republic of Korea, Vietnam, Australia, and New Zealand were assigned to the same community, while the remaining ASEAN members formed another. The partition suggests that stronger cross-regional trade links coexisted with persistent intra-ASEAN ties and geographical proximity.
In 2023, the community-detection algorithm again identified three groups. China, Japan, the Republic of Korea, Vietnam, the Philippines, Australia, and New Zealand formed the largest group; Singapore, Malaysia, Indonesia, and Brunei formed a maritime Southeast Asian group; and Thailand, Cambodia, Laos, and Myanmar formed a mainland Southeast Asian group. The visual pattern in Figure 2 is consistent with relative specialization around Northeast Asian manufacturing links, maritime logistics routes, and mainland geographical proximity and agricultural-production similarities. The re-emergence of three groups does not contradict the decline in modularity to 0.304: it means that the algorithm identified three internally denser clusters, while the comparatively low Q value shows that cross-group ties remained extensive and the boundaries were weak. The 2023 partition therefore reflects relative specialization within an increasingly integrated network rather than renewed trade segmentation.
Overall, the RCEP agricultural machinery trade network evolved from three detected communities to two and then back to three, while modularity declined and cross-community ties strengthened. The directly observed result is weaker structural separation among the groups. This pattern may facilitate cross-community movement of machinery, components, and related knowledge, but it does not establish inclusive technology adoption. Cambodia, Laos, Myanmar, and Brunei still have relatively low trade weights under the selected threshold, while smallholders may face constraints related to financing, training, and maintenance services. Assessing inclusiveness therefore requires farm-level evidence on access to scale-appropriate products, leasing and sharing services, local training, and repair networks.

4. Determinants of the Agricultural Machinery Trade Network

The quadratic assignment procedure (QAP) is widely used to analyze relational data in social networks. It constructs an empirical distribution of a statistic by simultaneously and randomly permuting the rows and columns of a matrix, thereby testing correlations between relational matrices. Compared with ordinary least squares, QAP reduces bias in significance tests arising from structural dependence in dyadic data and is therefore better suited to the analysis of trade networks among countries [52,53]. This study conducts QAP correlation analysis followed by QAP regression analysis, and all coefficients are interpreted as conditional statistical associations.

4.1. Model Specification, Variable Definitions, and Theoretical Basis

After identifying the structural evolution of the agricultural machinery trade network among RCEP members, this study examines factors associated with bilateral trade ties. Drawing on comparative advantage theory, trade gravity theory, and resource endowment theory, the preliminary QAP correlation analysis considers nine candidate explanatory matrices. GDP-per-capita difference (pgdp) and arable-land-per-capita difference (farm) are not included in the final multivariate specification because neither is significantly correlated with the trade matrix in Table 7. Equation (5) therefore reports the seven-variable QAP regression specification that corresponds exactly to Table 8.
T = f(gdp, water, language, border, ex, is, D)
The dependent variable is the matrix of bilateral trade values in agricultural machinery products among RCEP members. The final explanatory variables comprise seven matrices. (1) Economic scale is measured by the absolute bilateral difference in GDP (gdp). GDP-per-capita difference (pgdp) was retained in the preliminary correlation analysis but excluded from the final regression as explained above. (2) Agricultural resource compatibility is represented by the absolute bilateral difference in renewable water resources per capita (water). Arable-land-per-capita difference (farm) was also examined in the correlation analysis but excluded from the final regression. Water is retained because of its theoretical relevance to irrigation systems, crop production conditions, and machinery suitability. (3) Common language (language) equals 1 when two countries share an official language and 0 otherwise. (4) Contiguity (border) equals 1 when two countries share a land border and 0 otherwise [54]. (5) Exchange-rate difference (ex) is constructed from the absolute difference between the World Bank annual period-average official exchange rates, expressed as local-currency units per US dollar. (6) Trade-structure difference (is) is measured by the absolute bilateral difference in the share of agricultural machinery exports in total exports of goods and services. (7) Institutional distance (D) is calculated from the World Bank’s six Worldwide Governance Indicators.
Following the standard range-normalization approach, institutional distance is calculated as the arithmetic mean of the six absolute bilateral governance-score differences after each dimension is divided by its cross-country range, as shown in Equation (6). This procedure gives equal weight to voice and accountability, political stability and absence of violence, government effectiveness, regulatory quality, rule of law, and control of corruption.
D ij = 1 6 k 6 I i , k I j , k maxI k minI k
In Equation (6), k denotes the kth dimension of the Worldwide Governance Indicators (k = 1, …, 6). The numerator is the absolute difference between countries i and j on dimension k, and the denominator is the range of that dimension across the sample countries. The final matrices were constructed from observations matched across all 15 members; missing WGI values were not imputed. GDP, annual period-average official exchange rates, and the Worldwide Governance Indicators are obtained from the World Bank databases [55,56]. Renewable water resources per capita and arable land per capita are obtained from the FAO database [57], and common-language and contiguity data are obtained from the CEPII database [58].

4.2. QAP Correlation Analysis

Table 7 reports the QAP correlation results. UCINET 6 is used to perform 5000 random permutations [48]. The agricultural machinery trade matrix T is significantly correlated with the GDP-difference matrix gdp, common-language matrix language, contiguity matrix border, exchange-rate-difference matrix ex, trade-structure-difference matrix is, and institutional-distance matrix D. Its correlations with the GDP-per-capita-difference matrix pgdp, arable-land-per-capita-difference matrix farm, and renewable-water-resources-per-capita-difference matrix water are not significant. These results provide an initial indication of the matrices associated with bilateral trade ties. In the final QAP regression, pgdp and farm are excluded because they lack a significant bivariate association with T, whereas water is retained because resource compatibility is central to the theoretical framework and its conditional association may differ from its bivariate correlation.

4.3. QAP Regression Results Analyse

Table 8 reports the QAP regression results. The coefficient on GDP difference is 0.042 and positive at the 5% significance level, showing that larger differences in economic scale are conditionally associated with stronger agricultural machinery trade ties. A plausible mechanism is supply–demand complementarity between economies with different manufacturing capacities and market sizes, although the QAP estimate does not identify a causal effect. The coefficient on water-resource difference is −0.027 and negative at the 5% significance level, indicating stronger trade ties between members with more similar water-resource conditions, conditional on the other matrices. Similar water endowments can correspond to comparable crop systems and operating requirements: irrigated rice systems often require machinery adapted to wet-field preparation, transplanting, harvesting, drainage, and post-harvest drying, whereas water-scarce dryland systems place greater emphasis on conservation tillage, drought-adapted seeding, precision irrigation, and soil-moisture management [2,7]. Comparable irrigation, drainage, and soil-moisture conditions may therefore reduce the cost of adapting machinery specifications, operator practices, and after-sales services across markets. This compatibility explanation is theoretically plausible but remains an interpretation of a statistical association rather than a directly tested mechanism.
The coefficients on common language and contiguity are 0.064 and 0.258, respectively, and both are positive at the 1% significance level. These results show that linguistic accessibility and geographical proximity are positively associated with agricultural machinery trade ties. Agricultural machinery is a technology- and service-intensive durable capital good. In addition to transaction and transportation costs, its cross-border movement entails continuing costs for installation and commissioning, operator training, fault diagnosis, warranty service, and component delivery. A common language and contiguity may reduce these complementary service costs and make equipment purchase, leasing, and subsequent use more feasible. This interpretation identifies a potential mechanism; the QAP coefficients themselves remain associational.
The coefficient on exchange-rate difference is 0.066 and positive at the 5% significance level, indicating a conditional association between differences in annual period-average official exchange-rate levels and agricultural machinery trade ties. The result should not be interpreted as evidence that exchange-rate divergence causes trade. Moreover, the measure captures level differences rather than exchange-rate volatility, invoicing currency, or hedging arrangements; short-term volatility may increase acquisition costs and uncertainty in component supply and is treated as a limitation of the present analysis. The coefficients on trade-structure difference and institutional distance are −0.023 and −0.027, respectively, and both are negative at the 10% significance level. These estimates indicate stronger trade ties between economies with more similar trade structures and governance environments. Institutional compatibility may reduce coordination costs associated with certification, warranty enforcement, information sharing, and lifecycle responsibilities.

4.4. Extended Analysis of Sustainable Technology Diffusion and Supply-Chain Resilience

The overall network results indicate that RCEP members have developed greater structural readiness for potential cross-border flows of agricultural machinery, components, and related knowledge. More high-value trade ties and shorter average paths reduce the number of network steps between suppliers and potential users, while a high clustering coefficient is consistent with repeated transactions and service relationships. These properties may facilitate the movement of technologies such as precision seeding, water-efficient irrigation, low-disturbance tillage, energy-efficient power systems, and post-harvest handling.
The centrality results illustrate a potential trade-off between coordination efficiency and concentration exposure. China’s high centrality, together with its manufacturing scale, is consistent with an ability to supply a broad range of agricultural machinery at relatively low unit cost. Japan and the Republic of Korea also occupy high network positions that, when combined with external industrial evidence, are consistent with important roles in advanced equipment, precision components, and control systems. The network indicators do not directly measure product quality or functional specialization. Concentration of trade volume and intermediary positions in a small number of nodes may create exposure to disruptions affecting dominant suppliers or specialized components. The decline in overall betweenness centralization indicates more direct ties, but structural redundancy can support realized supply chain resilience only when products, components, standards, and service capabilities are substitutable.
The evolution of community structure also highlights limits to inferring inclusive diffusion from country-level connectivity. Stronger cross-community ties connect ASEAN demand with Northeast Asian manufacturing capacity and the agricultural production systems of Australia and New Zealand. However, more country-level trade ties do not mean that all members, firms, or farmers can access and use the relevant technologies. The low trade weights of less-developed members under the selected threshold, together with possible constraints in finance, training, repair, and component services, may leave smallholders outside the effective adoption network. Realized inclusiveness must therefore be evaluated with farm- and service-level evidence on machinery availability, affordability, operator capability, and maintenance access.
The QAP results identify associations between bilateral trade ties and language, geographical proximity, trade structures, exchange-rate conditions, and institutional distance. They do not directly test sustainability standards or lifecycle outcomes. Therefore, this study implys harmonized testing and certification may reduce duplicative compliance costs, while coordination on durability, diagnosability, repairability, remanufacturing, and recycling may improve lifecycle performance. These propositions should be evaluated in future research using product-level standards data and observed environmental and service outcomes.

5. Conclusions and Policy Implications

5.1. Conclusions

Using bilateral agricultural machinery trade data for 15 RCEP members from 2004 to 2023, this study constructs a directed weighted trade network and combines social network analysis with QAP to examine structural evolution, node positions, community patterns, and factors associated with bilateral ties. In addition, this study explores its potential links to sustainable technology diffusion and regional supply chain resilience.
First, the direct network evidence shows that high-value connectivity strengthened: network density increased, average path length shortened, the average clustering coefficient remained high, and betweenness centralization declined. These changes mean that the observed network contained more direct trade channels, shorter paths, and less dependence on intermediary nodes. They imply stronger structural readiness for potential equipment and knowledge flows and for route substitution.
Second, China occupied the highest observed centrality positions after 2020, while Japan, the Republic of Korea, Australia, Singapore, and major ASEAN economies retained important positions. The network evidence directly establishes relative centrality, not the precise industrial function of each country. When combined with external evidence on manufacturing, components, logistics, and demand, the pattern is consistent with a multicentric regional division of functions. Such a structure may support coordination and affordability, but it may also expose the region to shocks affecting dominant suppliers and specialized components.
Third, community boundaries weakened even though the number of detected groups changed from three to two and back to three. The direct evidence is the decline in modularity and the persistence of extensive cross-community ties. The 2023 three-group partition reflects relative specialization within an integrated network rather than renewed segmentation. Therefore, implication for inclusive technology diffusion remains conditional.
Fourth, QAP regression identifies conditional associations between bilateral trade ties and economic scale, resource compatibility, language, contiguity, exchange-rate levels, trade structures, and institutional distance. GDP difference, common language, contiguity, and exchange-rate difference are positively associated with trade ties, whereas water-resource difference, trade-structure difference, and institutional distance are negatively associated with them.

5.2. Policy Implications

The following recommendations are as follows. First, RCEP members should orient agricultural machinery cooperation toward verifiable sustainability performance. Cooperation should go beyond increasing trade volumes and incorporate energy efficiency, water conservation, reduced input use, productivity, operator safety, and total lifecycle costs into technology assessment. Priority areas may include precision seeding and fertilizing, efficient irrigation, low-disturbance tillage, energy-efficient drying, low-emission power systems, and digital control. Regional demonstration projects, public procurement, export finance, and subsidy policies should use comparable performance-disclosure requirements rather than generic green labels.
Second, RCEP members should develop a more multicentric and substitutable agricultural machinery supply chain. China’s high observed centrality can be used to support scale-efficient supply, while members should also diversify sources of critical components such as engines, electronic control units, sensors, and batteries; improve interoperability; and identify single-source dependencies. Based on their observed network positions and documented industrial capabilities, China, Japan, the Republic of Korea, Australia, Singapore, and ASEAN economies with relevant capacity may contribute complementary manufacturing, technology, testing, logistics, and service functions. Disruption-information sharing and emergency-support mechanisms may reduce the impact of shocks on time-sensitive operations.
Third, RCEP members should make access to agricultural machinery and related services more inclusive. Because this study measures structural readiness rather than actual adoption, future monitoring should assess whether regional trade reaches less-developed members and small and medium-sized farms. Scale-appropriate machinery, leasing and pay-per-use models, cooperative ownership, concessional finance, and machinery services can reduce high upfront costs. Local dealers, vocational institutions, farmer organizations, and small and medium-sized enterprises should be supported in providing operator training, fault diagnosis, component supply, and safe-use services. Multilingual manuals and digital service platforms may improve access in remote areas.

5.3. Limitations and Future Research

This study has three principal limitations. First, the network indicators measure structural readiness for cross-border technology flows, not realized adoption, emissions reduction, productivity gains, smallholder inclusion, repair, remanufacturing, or recycling. Future research should link bilateral machinery trade to product-level environmental attributes and farm- or firm-level adoption outcomes. Second, the USD 1 million threshold isolates the high-value trade backbone but may omit fragmented ties involving smaller economies; alternative thresholds and fully weighted-network specifications should be compared. Third, QAP regression addresses dyadic dependence but identifies associations rather than causal effects. Longitudinal MRQAP designs, policy shocks, or other sources of exogenous variation are needed for causal inference. Future analysis should incorporate these dimensions and test whether they alter the observed associations.

Author Contributions

Conceptualization, methodology, data curation, and writing—original draft preparation, X.L.; software, validation, and formal analysis, W.W.; investigation, resources, and writing—review and editing, funding acquisition, M.Z. All authors have read and agreed to the published version of the manuscript.

Funding

This research was funded by Agricultural Science and Technology Innovation Program of the Chinese Academy of Agricultural Science(ASTIP) and The Soft Science Research Project of the Chinese Society of Agricultural Engineering (CSAE-SS-2026001).

Institutional Review Board Statement

Not applicable.

Informed Consent Statement

Not applicable.

Data Availability Statement

All data were obtained from publicly accessible sources, as explained above in the text.

Acknowledgments

The authors thank the relevant institutions for providing access to publicly available data.

Conflicts of Interest

The authors declare no conflicts of interest. The funders had no role in the design of this study; the collection, analysis, or interpretation of the data; the writing of the manuscript; or the decision to publish the results.

References

  1. Pingali, P. Agricultural mechanization: Adoption patterns and economic impact. In Handbook of Agricultural Economics; Evenson, R., Pingali, P., Eds.; Elsevier: Amsterdam, The Netherlands, 2007; Volume 3, pp. 2779–2805. [Google Scholar]
  2. Food and Agriculture Organization of the United Nations. The State of Food and Agriculture 2022: Leveraging Automation in Agriculture for Transforming Agrifood Systems; FAO: Rome, Italy, 2022. [Google Scholar]
  3. Yang, M.; Jiang, S. Sustainable Agricultural Mechanization in China: A Comprehensive Review; Food and Agriculture Organization of the United Nations: Rome, Italy, 2023. [Google Scholar] [CrossRef]
  4. Sims, B.; Kienzle, J. Making mechanization accessible to smallholder farmers in sub-Saharan Africa. Environments 2016, 3, 11. [Google Scholar] [CrossRef]
  5. Daum, T.; Birner, R. Agricultural mechanization in Africa: Myths, realities and an emerging research agenda. Glob. Food Secur. 2020, 26, 100393. [Google Scholar] [CrossRef]
  6. Sims, B.; Kienzle, J. Sustainable agricultural mechanization for smallholders: What is it and how can we implement it? Agriculture 2017, 7, 50. [Google Scholar] [CrossRef]
  7. Balafoutis, A.; Beck, B.; Fountas, S.; Vangeyte, J.; Van der Wal, T.; Soto, I.; Gómez-Barbero, M.; Barnes, A.; Eory, V. Precision agriculture technologies positively contributing to GHG emissions mitigation, farm productivity and economics. Sustainability 2017, 9, 1339. [Google Scholar] [CrossRef]
  8. Asian Development Bank Institute. Transforming Smallholder Agriculture Through Mechanization in Asia, Volume 2: Impacts and Policy Options; Asian Development Bank Institute: Tokyo, Japan, 2026. [Google Scholar] [CrossRef]
  9. Australian Government Department of Foreign Affairs and Trade. Regional Comprehensive Economic Partnership (RCEP). Available online: https://www.dfat.gov.au/trade/agreements/in-force/rcep (accessed on 24 July 2026).
  10. Asian Development Bank. The Regional Comprehensive Economic Partnership Agreement: A New Paradigm in Asian Regional Cooperation; Asian Development Bank: Manila, Philippines, 2022. [Google Scholar]
  11. Petri, P.A.; Plummer, M.G. East Asia Decouples from the United States: Trade War, COVID-19, and East Asia’s New Trade Blocs; Working Paper 20-9; Peterson Institute for International Economics: Washington, DC, USA, 2020. [Google Scholar]
  12. United Nations Conference on Trade and Development. A New Centre of Gravity: The Regional Comprehensive Economic Partnership and Its Trade Effects; UNCTAD: Geneva, Switzerland, 2021. [Google Scholar]
  13. Estrades, C.; Maliszewska, M.; Osorio-Rodarte, I.; Seara e Pereira, M. Estimating the economic impacts of the Regional Comprehensive Economic Partnership. Asia Glob. Econ. 2023, 3, 100060. [Google Scholar] [CrossRef]
  14. World Trade Organization. World Trade Report 2023: Re-globalization for a Secure, Inclusive and Sustainable Future; WTO: Geneva, Switzerland, 2023. [Google Scholar]
  15. Baldwin, R.; Freeman, R. Risks and global supply chains: What we know and what we need to know. Annu. Rev. Econ. 2022, 14, 153–180. [Google Scholar] [CrossRef]
  16. Geissdoerfer, M.; Savaget, P.; Bocken, N.M.P.; Hultink, E.J. The circular economy—A new sustainability paradigm? J. Clean. Prod. 2017, 143, 757–768. [Google Scholar] [CrossRef]
  17. Bocken, N.M.P.; de Pauw, I.; Bakker, C.; van der Grinten, B. Product design and business model strategies for a circular economy. J. Ind. Prod. Eng. 2016, 33, 308–320. [Google Scholar] [CrossRef]
  18. ISO 14040:2006; Environmental Management—Life Cycle Assessment—Principles and Framework. ISO: Geneva, Switzerland, 2006.
  19. ISO 14044:2006; Environmental Management—Life Cycle Assessment—Requirements and Guidelines. ISO: Geneva, Switzerland, 2006.
  20. Newman, M.E.J. The structure and function of complex networks. SIAM Rev. 2003, 45, 167–256. [Google Scholar] [CrossRef]
  21. Serrano, M.A.; Boguñá, M. Topology of the world trade web. Phys. Rev. E 2003, 68, 015101. [Google Scholar] [CrossRef] [PubMed]
  22. Fagiolo, G.; Reyes, J.; Schiavo, S. The evolution of the world trade web: A weighted-network analysis. J. Evol. Econ. 2010, 20, 479–514. [Google Scholar]
  23. Bhattacharya, K.; Mukherjee, G.; Saramäki, J.; Kaski, K.; Manna, S.S. The international trade network: Weighted network analysis and modelling. J. Stat. Mech. Theory Exp. 2008, 2008, P02002. [Google Scholar] [CrossRef]
  24. Barrat, A.; Barthélemy, M.; Pastor-Satorras, R.; Vespignani, A. The architecture of complex weighted networks. Proc. Natl. Acad. Sci. USA 2004, 101, 3747–3752. [Google Scholar] [CrossRef] [PubMed]
  25. Opsahl, T.; Agneessens, F.; Skvoretz, J. Node centrality in weighted networks: Generalizing degree and shortest paths. Soc. Netw. 2010, 32, 245–251. [Google Scholar] [CrossRef]
  26. Blondel, V.D.; Guillaume, J.-L.; Lambiotte, R.; Lefebvre, E. Fast unfolding of communities in large networks. J. Stat. Mech. Theory Exp. 2008, 2008, P10008. [Google Scholar] [CrossRef]
  27. Newman, M.E.J. Modularity and community structure in networks. Proc. Natl. Acad. Sci. USA 2006, 103, 8577–8582. [Google Scholar] [CrossRef] [PubMed]
  28. Kali, R.; Reyes, J. The architecture of globalization: A network approach to international economic integration. J. Int. Bus. Stud. 2007, 38, 595–620. [Google Scholar] [CrossRef]
  29. De Benedictis, L.; Tajoli, L. The world trade network. World Econ. 2011, 34, 1417–1454. [Google Scholar] [CrossRef]
  30. Tzekina, I.; Danthi, K.; Rockmore, D.N. Evolution of community structure in the world trade web. Eur. Phys. J. B 2008, 63, 541–545. [Google Scholar] [CrossRef]
  31. Zhu, N.; Huang, S. Impact of the tariff concessions of the RCEP agreement on the structure and evolution mechanism of manufacturing trade networks. Soc. Netw. 2023, 74, 78–101. [Google Scholar] [CrossRef]
  32. Zhu, N.; Wang, Y.; Yang, S.; Lyu, L.; Gong, K.; Huang, X.; Huang, S. Structure characteristics and formation mechanism of the RCEP manufacturing trade network: An ERGM analysis. Phys. A Stat. Mech. Its Appl. 2024, 635, 129488. [Google Scholar] [CrossRef]
  33. Wang, X.; Yamauchi, F.; Huang, J.; Rozelle, S. What constrains mechanization in Chinese agriculture? Role of farm size and fragmentation. China Econ. Rev. 2020, 62, 101221. [Google Scholar] [CrossRef]
  34. Zhang, X.; Yang, J.; Reardon, T. Mechanization outsourcing clusters and division of labor in Chinese agriculture. China Econ. Rev. 2017, 43, 184–195. [Google Scholar] [CrossRef]
  35. Lian, X.; Tian, Z.; Han, L.; Wang, M. Measurement and analysis of changes in the export value of China’s agricultural machinery products. Trans. Chin. Soc. Agric. Mach. 2007, 38, 77–81. (In Chinese) [Google Scholar]
  36. Zhang, M.; Zhang, Z. Export trade flows and potential of China’s agricultural machinery products: An empirical analysis based on the gravity model. J. Int. Trade 2015, 6, 148–154. (In Chinese) [Google Scholar]
  37. Huang, X.; Li, G. Export efficiency and potential of China’s agricultural machinery products to RCEP member states: An analysis based on the stochastic frontier gravity model. Prices Mon. 2022, 8, 28–36. (In Chinese) [Google Scholar]
  38. Zhang, Z.; Zhang, M.; Xiao, X. Research on China’s Agricultural Machinery Trade and Investment in Latin America; Nanjing Research Institute for Agricultural Mechanization, Ministry of Agriculture: Nanjing, China, 2020. (In Chinese) [Google Scholar]
  39. Shi, G.; Zhu, R.; Tian, Z. Intra-industry trade in China’s agricultural machinery products. J. China Agric. Univ. 2008, 13, 102–108. (In Chinese) [Google Scholar]
  40. Zhang, M. Research on the Development of Agricultural Mechanization and Agricultural Machinery Markets in Major Developed Countries; China Agriculture Press: Beijing, China, 2020. (In Chinese) [Google Scholar]
  41. Shi, G.; Zhu, R.; Tian, Z. A comparison of the export trade and competitiveness of agricultural machinery products between China and India. J. Int. Trade 2006, 11, 50–54. (In Chinese) [Google Scholar]
  42. Lian, X.; Tian, Z. An analysis of the comparative advantages of China’s foreign trade in agricultural machinery products. J. Agrotech. Econ. 2004, 4, 74–79. (In Chinese) [Google Scholar]
  43. Yao, L.; Tian, Z. A study of the export market share of China’s agricultural machinery products. J. Int. Trade 2006, 3, 46–50. (In Chinese) [Google Scholar]
  44. Tong, G.; Wang, Y. Trade potential of agricultural machinery products between China and countries along the Belt and Road. J. Chin. Agric. Mech. 2023, 44, 244–253. (In Chinese) [Google Scholar]
  45. Zhang, M.; Xie, J. Export competitiveness of China’s agricultural machinery products: From the perspective of export technological complexity. Inq. Into Econ. Issues 2016, 2, 159–165. (In Chinese) [Google Scholar]
  46. Li, X.; Zhang, M. China–U.S. trade friction and China’s agricultural machinery imports: Mechanism and empirical evidence. Agriculture 2024, 14, 1517. [Google Scholar] [CrossRef]
  47. UN Comtrade Database. International Trade Statistics Database. Available online: https://comtradeplus.un.org/ (accessed on 24 July 2026).
  48. Borgatti, S.P.; Everett, M.G.; Freeman, L.C. UCINET for Windows: Software for Social Network Analysis; Analytic Technologies: Harvard, MA, USA, 2002. [Google Scholar]
  49. Milgram, S. The small world problem. Psychol. Today 1967, 1, 61–67. [Google Scholar] [CrossRef]
  50. Watts, D.J.; Strogatz, S.H. Collective dynamics of “small-world” networks. Nature 1998, 393, 440–442. [Google Scholar] [CrossRef] [PubMed]
  51. Freeman, L.C. Centrality in social networks: Conceptual clarification. Soc. Netw. 1978, 1, 215–239. [Google Scholar] [CrossRef]
  52. Krackhardt, D. Predicting with networks: A multiple regression approach to analyzing dyadic data. Soc. Netw. 1988, 10, 359–381. [Google Scholar] [CrossRef]
  53. Dekker, D.; Krackhardt, D.; Snijders, T.A.B. Sensitivity of MRQAP tests to collinearity and autocorrelation conditions. Psychometrika 2007, 72, 563–581. [Google Scholar] [CrossRef] [PubMed]
  54. Anderson, J.E.; van Wincoop, E. Gravity with gravitas: A solution to the border puzzle. Am. Econ. Rev. 2003, 93, 170–192. [Google Scholar] [CrossRef]
  55. World Bank. World Development Indicators. Available online: https://databank.worldbank.org/ (accessed on 24 July 2026).
  56. World Bank. Worldwide Governance Indicators. Available online: https://www.worldbank.org/en/publication/worldwide-governance-indicators (accessed on 24 July 2026).
  57. Food and Agriculture Organization of the United Nations. AQUASTAT Database. Available online: https://www.fao.org/aquastat/ (accessed on 24 July 2026).
  58. CEPII. GeoDist Database. Available online: http://www.cepii.fr/ (accessed on 24 July 2026).
Figure 1. Evolution of the Agricultural Machinery Trade Network, 2004, 2010, 2015, and 2023. Note: In Figure 1, from left to right, these represent the years 2004, 2010, 2015, and 2023.
Sustainability 18 08070 g001
Figure 2. Evolution of Communities in the Agricultural Machinery Trade Network among RCEP Member States [9].
Sustainability 18 08070 g002
Table 1. Classification and HS Codes of Agricultural Machinery Products.
CategoryMachinery CategoryAgricultural Machinery Products and HS CodesNo. of
Products
1Tillage and Land-Preparation MachineryPloughs (843210); disc harrows (843221); other soil-preparation and cultivation machinery (843229); rollers and other soil-preparation machinery not elsewhere specified (843280)4
2Planting and Fertilizing MachinerySeeders and transplanters (843230); fertilizer distributors (843240); parts (843290)3
3Harvesting MachineryMowers, harvesters, and picking machinery (843311, 843319, 843320, 843330, 843340, 843351, 843353, 843359); parts (843390)9
4Post-Harvest Handling MachineryDryers for agricultural products (841931); threshing machinery (843352); cleaning and sorting machinery (843710); parts (843790)4
5Primary Agricultural-Product Processing MachineryGrading machinery (843360); presses and crushers (843510); parts (843590); machinery for milling cereals or dried legumes (843780); other machinery for the preparation or manufacture of food or beverages (843810–843890)12
6Agricultural Transport MachinerySelf-loading or self-unloading agricultural trailers and semi-trailers (871620)1
7Livestock MachineryCream separators (842111); milking and dairy-processing machinery (843410, 843420, 843490); feed-preparation machinery, poultry incubators, etc. (843610, 843621, 843629); parts (843691, 843699)9
8Agricultural Power MachineryTractors and road tractors (870110, 870130, 870190)3
9Other Agricultural MachineryKnives and cutting blades for machinery (820840); other machinery (843680)2
Table 2. Overall Characteristics of the Agricultural Machinery Trade Network among RCEP Member States.
YearNo. of EdgesNetwork
Density
Average Clustering
Coefficient
Average Path LengthBetweenness
Centralization
2004980.4670.8901.5330.064
20101220.5810.8921.4190.047
20151710.8140.8991.1860.040
20201930.9190.9231.0810.034
20232020.9620.9261.0380.021
Source: Authors’ calculations based on UN Comtrade data.
Table 3. Node Strength in the Agricultural Machinery Trade Network among RCEP Member States.
Country/Year20042010201520202023
China0.142 (11)0.215 (9)0.328 (4)0.456 (1)0.523 (1)
Japan0.486 (1)0.452 (1)0.421 (2)0.398 (2)0.375 (2)
Republic of Korea0.356 (3)0.348 (3)0.435 (1)0.386 (3)0.358 (3)
Australia0.412 (2)0.389 (2)0.365 (3)0.342 (4)0.321 (4)
Thailand0.312 (4)0.305 (4)0.298 (5)0.292 (5)0.286 (5)
Singapore0.298 (5)0.287 (5)0.276 (6)0.265 (7)0.254 (6)
Vietnam0.176 (10)0.232 (7)0.245 (8)0.256 (8)0.248 (7)
Malaysia0.265 (6)0.258 (6)0.252 (7)0.278 (6)0.243 (8)
Indonesia0.234 (7)0.226 (8)0.238 (9)0.231 (9)0.225 (9)
New Zealand0.218 (8)0.205 (10)0.192 (10)0.185 (10)0.178 (10)
Philippines0.195 (9)0.188 (11)0.182 (11)0.176 (11)0.171 (11)
Myanmar0.125 (13)0.132 (13)0.145 (12)0.138 (12)0.132 (12)
Cambodia0.138 (12)0.145 (12)0.132 (13)0.126 (13)0.121 (13)
Laos0.092 (15)0.105 (14)0.112 (14)0.108 (14)0.103 (14)
Brunei0.105 (14)0.098 (15)0.092 (15)0.086 (15)0.081 (15)
Source: Authors’ calculations based on UN Comtrade data. Note: Node-strength values are normalized to a 0–1 scale; rankings are reported in parentheses and are not percentages.
Table 4. Normalized Betweenness Centrality in the Agricultural Machinery Trade Network among RCEP Member States.
Country/Year20042010201520202023
China0.032 (13)0.068 (9)0.125 (4)0.198 (1)0.236 (1)
Japan0.215 (1)0.198 (1)0.182 (1)0.165 (2)0.148 (2)
Australia0.178 (2)0.165 (2)0.152 (2)0.138 (3)0.125 (3)
Republic of Korea0.132 (3)0.142 (3)0.148 (3)0.132 (4)0.118 (4)
Thailand0.115 (4)0.118 (4)0.122 (5)0.115 (5)0.108 (5)
Singapore0.108 (5)0.112 (5)0.115 (6)0.108 (6)0.102 (6)
Malaysia0.095 (6)0.098 (6)0.102 (7)0.096 (7)0.091 (7)
Indonesia0.078 (8)0.085 (7)0.092 (8)0.085 (8)0.078 (8)
Vietnam0.045 (10)0.058 (11)0.068 (10)0.075 (9)0.068 (9)
New Zealand0.085 (7)0.078 (8)0.072 (9)0.065 (10)0.058 (10)
Philippines0.062 (9)0.065 (10)0.058 (11)0.052 (11)0.048 (11)
Myanmar0.038 (12)0.042 (13)0.048 (12)0.042 (12)0.038 (12)
Cambodia0.042 (11)0.048 (12)0.042 (13)0.038 (13)0.034 (13)
Laos0.022 (15)0.028 (14)0.032 (14)0.028 (14)0.025 (14)
Brunei0.028 (14)0.025 (15)0.022 (15)0.019 (15)0.016 (15)
Source: Authors’ calculations based on UN Comtrade data. Note: Betweenness-centrality values are normalized to a 0–1 scale; rankings are reported in parentheses and are not percentages.
Table 5. Normalized In-Closeness Centrality in the Agricultural Machinery Trade Network among RCEP Member States.
Country/Year20042010201520202023
China0.623 (9)0.685 (7)0.752 (4)0.826 (1)0.853 (1)
Japan0.836 (1)0.821 (1)0.805 (1)0.789 (2)0.772 (2)
Australia0.802 (2)0.786 (2)0.771 (2)0.755 (3)0.738 (3)
Republic of Korea0.745 (3)0.752 (3)0.763 (3)0.748 (4)0.732 (4)
Thailand0.726 (4)0.732 (4)0.738 (5)0.732 (5)0.722 (5)
Singapore0.712 (5)0.718 (5)0.725 (6)0.715 (6)0.705 (6)
Malaysia0.685 (6)0.692 (6)0.698 (7)0.691 (7)0.682 (7)
Indonesia0.652 (8)0.662 (8)0.672 (8)0.663 (9)0.653 (8)
Vietnam0.568 (11)0.615 (11)0.655 (9)0.668 (8)0.645 (9)
New Zealand0.668 (7)0.655 (9)0.642 (10)0.631 (10)0.618 (10)
Philippines0.598 (10)0.628 (10)0.615 (11)0.602 (11)0.589 (11)
Myanmar0.512 (13)0.535 (13)0.558 (12)0.542 (12)0.526 (12)
Cambodia0.535 (12)0.552 (12)0.535 (13)0.518 (13)0.502 (13)
Laos0.465 (15)0.488 (14)0.505 (14)0.492 (14)0.478 (14)
Brunei0.482 (14)0.465 (15)0.448 (15)0.432 (15)0.418 (15)
Source: Authors’ calculations based on UN Comtrade data. Note: In-closeness-centrality values are normalized to a 0–1 scale; rankings are reported in parentheses and are not percentages.
Table 6. Normalized Out-Closeness Centrality in the Agricultural Machinery Trade Network among RCEP Member States.
Country/Year20042010201520202023
China0.586 (9)0.652 (7)0.725 (4)0.802 (1)0.835 (1)
Japan0.815 (1)0.802 (1)0.788 (1)0.772 (2)0.756 (2)
Australia0.782 (2)0.768 (2)0.753 (2)0.738 (3)0.722 (3)
Republic of Korea0.725 (3)0.735 (3)0.746 (3)0.731 (4)0.715 (4)
Thailand0.708 (4)0.715 (4)0.722 (5)0.715 (5)0.705 (5)
Singapore0.692 (5)0.698 (5)0.708 (6)0.698 (6)0.688 (6)
Malaysia0.665 (6)0.672 (6)0.682 (7)0.675 (7)0.665 (7)
Indonesia0.632 (8)0.642 (8)0.652 (8)0.643 (9)0.632 (8)
Vietnam0.545 (11)0.595 (11)0.635 (9)0.648 (8)0.625 (9)
New Zealand0.648 (7)0.635 (9)0.622 (10)0.610 (10)0.598 (10)
Philippines0.578 (10)0.608 (10)0.595 (11)0.582 (11)0.568 (11)
Myanmar0.492 (13)0.515 (13)0.538 (12)0.522 (12)0.505 (12)
Cambodia0.515 (12)0.532 (12)0.515 (13)0.498 (13)0.482 (13)
Laos0.442 (15)0.465 (14)0.482 (14)0.468 (14)0.455 (14)
Brunei0.462 (14)0.445 (15)0.428 (15)0.412 (15)0.398 (15)
Source: Authors’ calculations based on UN Comtrade data. Note: Out-closeness-centrality values are normalized to a 0–1 scale; rankings are reported in parentheses and are not percentages.
Table 7. QAP Correlations between Agricultural Machinery Trade and Explanatory Matrices.
VariableObserved Correlationp-ValueStd. Dev.Min.Max.p ≥ 0p ≤ 0
pgdp−0.0040.4870.024−0.0570.1000.5130.487
gdp0.0680.0430.025−0.0320.0880.0430.957
farm−0.0160.2670.025−0.0510.1090.7330.267
water−0.0440.4690.025−0.0510.1120.5310.469
language0.1270.000 *0.017−0.0330.0910.0001.000
border0.2880.000 *0.017−0.0360.0840.0001.000
ex0.0670.0230.025−0.0430.1320.0230.978
is−0.0350.0320.023−0.0600.1090.9680.032
D−0.0720.000 *0.021−0.0630.0831.0000.000
note: *, denote significance at the 10%, 5%, and 1% levels, respectively. The same notation applies below.
Table 8. QAP Regression Results.
VariableStandardized Coefficientp-Valuep ≥ 0p ≤ 0
gdp0.0420.0380.0380.962
water−0.0270.0400.9600.040
language0.0640.003 *0.0030.998
border0.2580.000 *0.0001.000
ex0.0660.0110.0110.990
is−0.0230.085 *0.9150.085
D−0.0270.057 *0.9430.057
Observations4200
R20.393
note: * denote significance at the 10% level.
Disclaimer/Publisher’s Note: The statements, opinions and data contained in all publications are solely those of the individual author(s) and contributor(s) and not of MDPI and/or the editor(s). MDPI and/or the editor(s) disclaim responsibility for any injury to people or property resulting from any ideas, methods, instructions or products referred to in the content.