Article

The Impact of Road Traffic Noise on Apartment Prices in Kraków: A Hedonic Analysis of the Primary and Secondary Markets

by
Elżbieta Jasińska
* and
Edward Preweda
Department of Integrated Geodesy and Cartography, AGH University of Krakow, 30-059 Krakow, Poland
*
Author to whom correspondence should be addressed.
Sustainability 2026, 18(16), 8029; https://doi.org/10.3390/su18168029
Submission received: 10 July 2026 / Revised: 23 July 2026 / Accepted: 3 August 2026 / Published: 7 August 2026

Abstract

This study examines the effect of road traffic noise on apartment prices in Kraków, treated on an equal footing with the other price-forming attributes. The analysis draws on 6244 transactions from the primary and secondary markets concluded between January 2021 and June 2022. Multiple regression in linear and semi-logarithmic form was applied, and outliers were removed iteratively on the basis of standardised residuals; the sensitivity of the estimates to the adopted elimination threshold was examined and the results were compared with robust regression. The effect of road noise differs between market segments. In the primary market, in the sample after outlier elimination, the noise attribute is statistically significant and the NSDI equals 0.17% of the price per 1 dB (95% CI: 0.13–0.21%). In the secondary market, the estimate is close to zero, and the difference between the segments is significant (z = 6.0; p < 0.001). In the full samples, where prices are strongly differentiated by dwelling standard not recorded in the register, the noise effect does not reach significance, which points to the conditional character of the estimates. The influence of noise also depends on the position relative to the city centre: it is strongest in the intermediate zone (0.23%/dB), weaker on the periphery, and disappears in the central zone, where the elevated sound level is offset by the advantages of the location. The diagnostics covered VIF coefficients, sensitivity analysis, and Moran’s I for the residuals. The results, set against international research on noise capitalisation, support the routine inclusion of the acoustic climate in the valuation of new dwellings and provide a monetary reference point for noise abatement policy.

1. Introduction

People are surrounded by sounds that may be perceived as noise, defined as unwanted sound [1,2]. Noise is a serious environmental and health problem in many developed countries [3,4]. Its harmfulness depends largely on intensity and on the duration of exposure. Prolonged exposure may cause a range of complaints and illnesses, from difficulties with concentration and headaches to hearing damage and disorders of the circulatory, digestive, and nervous systems [5,6,7]. Sensitivity to noise is subjective and depends above all on individual characteristics [8,9]. One of the main sources of noise exposure is the transport sector [10]. This noise is difficult to remove from the environment because of the growing number of vehicles and the constant need to move goods and people. Environmental noise therefore deserves attention both when investing in urban space and at the point of purchasing a property [11,12,13,14]. Noise can strongly affect residents’ quality of life and, through it, property prices [15,16,17]. The strength of this effect depends on the class of the adjacent road and thus on traffic volume [18,19,20].
Traffic noise is regarded as particularly widespread; as cities and their infrastructure grow, it becomes a nuisance for an increasing number of residents [21]. Although exposure to noise reduces residential comfort, new housing estates keep appearing very close to busy streets. Transport, for its part, generates noise but enables the rapid movement of people and goods and remains a condition of a functioning city. Research confirms this: dwellings located close to tram stops or railway stations, for example, are more expensive than those situated much further away [22]. In Poland, permissible noise levels range from 40 to 70 dB and depend on the type of area (health resorts, single-family housing, multi-family and farm housing, and so on), the noise source, and the time of day (day; night) [23].
The relevance of the problem is confirmed by the 2025 report of the European Environment Agency, according to which more than 20% of Europe’s population, and under the stricter recommendations of the World Health Organization, nearly one in three is exposed to harmful levels of transport noise; road noise remains the dominant source and affects around 92 million people [24,25]. In the European Union, long-term exposure to transport noise is associated with tens of thousands of premature deaths annually, which places noise among the top three environmental health threats, just behind air pollution [24]. Reducing noise exposure is thus part of the sustainable urban development agenda, and knowledge of how the market prices the acoustic climate provides an important premise for spatial planning and housing policy. The European Union’s Zero Pollution Action Plan sets the target of reducing the share of people chronically disturbed by transport noise by 30% by 2030 relative to 2017, which ties the acoustic climate directly to the monitoring of Sustainable Development Goal 11 [24,26].
The theoretical basis for measuring these effects is the hedonic price theory formulated by Rosen [27]. A dwelling is treated as a bundle of structural and locational attributes, and its transaction price as the sum of their implicit prices; in market equilibrium, the implicit price of quiet reflects the marginal willingness of buyers to pay for a better acoustic climate. Unlike floor area or the number of rooms, traffic noise is a qualitative attribute of the surroundings: the owner cannot change it, it is supplied jointly with the location, and its perception is nonlinear, with annoyance rising sharply once the sound level exceeds the threshold of about 53 dB indicated for road noise in the WHO guidelines [25]. The implicit price estimated in a hedonic model is therefore an equilibrium outcome of local supply and demand, not a universal constant, and the nonlinearity and threshold character of noise perception justify treating the sound level in classes rather than only as a continuous variable.
In the international literature, hedonic regression remains the basic tool for measuring the economic effects of noise, and the synthetic measure of the results is the NSDI (Noise Sensitivity Depreciation Index), expressing the percentage decrease in property price per 1 dB increase in the sound level [3,28]. Reviews of hedonic studies indicate that for road noise the NSDI most often falls between about 0.2% and more than 1% per decibel, whereas for aircraft noise a value of about 1% is typically assumed [28]. The variation in the estimates is nevertheless considerable. The dispersion has identifiable sources: studies differ in the noise indicator (LDEN, Leq, ordinal classes), in the functional form of the model, in the treatment of spatial dependence, in the segment analysed (dwellings, land, rents), and in the ambient sound level and incomes of the local population, so the reported NSDI values are conditional on the research design and are not directly transferable between markets [3,28]. In Hamburg, a discount of about 0.23% per decibel was recorded [19], in Geneva a 1% increase in the noise level lowered rents by about 0.7% [29], and in Seoul an analogous increase in road noise was associated with a 1.3% decline in land prices [30]. Negative capitalisation of noise has also been confirmed in Nantes and Bari [31,32] and in the vicinity of Taoyuan airport [33]; in Poland, dwellings located within the Limited Use Area around Warsaw Chopin Airport proved significantly cheaper than comparable units outside the zone [34]. The direction and strength of the relationship are not universal, however. In Berlin, the mere announcement of an airport expansion triggered a price response before the actual acoustic climate changed [35], and British studies have shown that in some locations the relationship is insignificant or even positive [3].
In recent years, classical hedonic models have increasingly been supplemented with machine learning methods and model interpretability techniques. A study of Thessaloniki using gradient boosting models showed that the effect of noise on apartment prices differs markedly between areas of the same city: In the commercial inner zone higher noise levels coincided with higher prices, while in districts away from the centre the relationship was clearly negative [36]. American analyses likewise confirm the spatial non-stationarity of this relationship [12]. Spatial econometric specifications, including spatial lag and spatial error models and geographically weighted regression, address this non-stationarity directly [37], while machine learning methods relax the assumption of a single functional form; in this study both strands set the reference point for the spatial diagnostics of the residuals and for the directions of further work. Despite the rich body of work, studies of Central and Eastern European markets remain scarce, concentrate on medium-sized cities and on the housing stock considered jointly [16,17,18], and the authors’ earlier analyses of the statistical modelling of dwelling values in Kraków [38] did not include the acoustic climate as a separate attribute. The gap addressed by this paper has three dimensions: the separation of the primary and secondary markets under limited information on dwelling standard, the interaction between noise and the position of a property relative to the centre, and a sample size unusually large for research conducted in this part of Europe.
The contribution of the paper follows from this gap. First, it provides NSDI estimates for Kraków from register data covering both market segments, so the capitalisation of noise can be compared between the primary and secondary markets within one city and one data system. The segments are compared because the price register records no information on dwelling standard, and unobserved renovation and fittings differentiate prices in the older stock much more strongly than in new supply; the comparison therefore shows how far the information deficit of public registers masks the noise effect, a difficulty that affects any hedonic estimation based on such registers. Second, the interaction between noise and the position relative to the centre tests whether the negative capitalisation documented for Western European cities holds in a post-transition market with strong tourist pressure on the central zone. Third, the sensitivity of the estimates to the outlier elimination threshold is reported in full, which hedonic studies rarely do and which defines the scope of validity of the conclusions.
Given the role of noise in the urban environment and its effects on people, the influence of road traffic noise on apartment prices in Kraków was examined. The city was chosen for its extensive road network, its large number of noise sources, and the high transaction activity of its housing market. Three research hypotheses were formulated. According to the first (H1), road traffic noise is a statistically significant price-forming attribute in the Kraków apartment market. The second (H2) assumes that this effect is stronger in the primary market, where prices are not distorted by unobserved differences in dwelling standard. The third (H3) predicts that the effect of noise depends on the position of a property relative to the city centre and is strongest in peripheral locations, where an elevated sound level is not offset by the advantages of a central position.

2. Materials and Methods

2.1. Study Area and Market Context

Kraków covers an area of 327 km2 and has more than 800 thousand inhabitants [39]. After the outbreak of the full-scale war in Ukraine in 2022, the city received close to 200 thousand refugees at the peak, which temporarily increased its population by about one-fifth. Kraków is the second-largest Polish city by area and population. National roads, expressways, and the A4 motorway run through the city, and the railway network includes long-distance connections and an agglomeration railway with stops within the city. The John Paul II International Airport, the largest regional airport in Poland, operates near Kraków [40]. The city comprises 4 administrative areas divided into 18 districts.
The Kraków real estate market is large and well developed, and apartment transactions account for a substantial share of turnover. Over the past decade, the market recorded rapid growth in apartment prices, driven among other things by strong demand linked to low interest rates and a stable labour market [41]. The difference between average prices in the secondary and primary markets remains relatively small [42], with a noticeable predominance of primary-market transactions, at times even four times more numerous than in the secondary market. Nationally, Kraków lies in a voivodeship with one of the highest median prices per square metre of an apartment [43].
In 2022, as mortgage costs and inflation rose, the number of apartment sale transactions fell sharply despite the continued nominal growth of prices [44]. The inflow of war refugees from Ukraine proved an additional demand impulse, which in the short run strongly affected the rental market of the largest Polish cities in particular [45]. The years 2023–2024 brought renewed double-digit price growth, stimulated, among other things, by a government programme of preferential housing loans, after which the market entered a phase of stabilisation. According to the National Bank of Poland, in the first quarter of 2026 the average transaction price of apartments in Kraków is PLN 15,384/m2 in the primary market and PLN 15,110/m2 in the secondary market, with the difference between the two segments almost completely erased [43]. Locational attributes, including the acoustic climate, are capitalised in prices regardless of the phase of the business cycle, which makes the structural relationships analysed here resistant to changes in the general price level.

2.2. Acquisition of Transaction Price Data on Apartments

To examine the effect of noise and transport on property prices, transaction data on apartments were obtained from the real estate price register (RCN), a public register kept in Poland by the county head (starosta). The register contains prices specified in notarial deeds and basic information on the properties traded; property values from appraisal reports, collected in the previously kept register of prices and values, are no longer entered. The data covered transactions concluded within the city of Kraków between January 2021 and June 2022. The reference date of the analyses is December 2022, and the time attribute expresses the number of months from the transaction to that date. The study covered more than 6 thousand apartments traded in the primary and secondary markets. The register records basic information on a dwelling, such as the address, transaction price, transaction date, number of rooms, market type, the share in the right being traded, and floor area. The register unfortunately lacks information on the standard and fittings of a property, which matters particularly in the analysis of the secondary market. The attributes available from the register were supplemented with optional attributes and with road noise intensity. The adopted procedure comprised the following steps:
  • Acquisition of data from the real estate price register.
  • Assignment of attributes to the apartments.
  • Determination of the location attribute on the basis of the address (geocoding).
  • Determination of the transport access attribute on the basis of stop locations.
  • Determination of the noise attribute on the basis of acoustic maps.
  • Preliminary estimation of multiple regression models for the primary and secondary markets jointly and separately.
  • Elimination of outliers.
  • Estimation of the final multiple regression models for the primary and secondary markets jointly and separately.
  • Analysis of the influence of the attributes on property prices.
  • Estimation of multiple regression models separately for each location.
  • Conclusions from the analysis of the influence of noise on property prices.

2.3. Assignment of Attributes to the Apartments

Empty records and records lacking key information, such as the transaction price or the address, were removed from the data obtained from the register. Only open-market transactions concerning dwellings intended for residential use were retained, in which the object of trade was ownership of the dwelling together with the associated share of 1/1 in the common property; records burdened with gross errors were removed. The database prepared in this way contains 6244 properties in total, including 2986 from the primary market and 3258 from the secondary market.
For the apartments gathered in the database, market attributes were adopted that potentially influence property prices in Kraków (Table 1).
For the attributes time, number of rooms, floor, floor area, and market, the values were assigned on the basis of information from the RCN. Market type was coded as a binary variable (0 for the primary market, 1 for the secondary market), so the intercepts of the models retain a direct interpretation. Location, transport access, and noise exposure were determined in QGIS 3.40 LTR (QGIS Association, Grüt, Switzerland). The geographic coordinates of the properties were derived from address data using the geocoding service of the Head Office of Geodesy and Cartography [46]. The location attribute was assigned on the basis of buffers with radii of 2.5 km and 5 km around the city centre, distinguishing zones up to 2.5 km, from 2.5 to 5 km, and beyond 5 km.
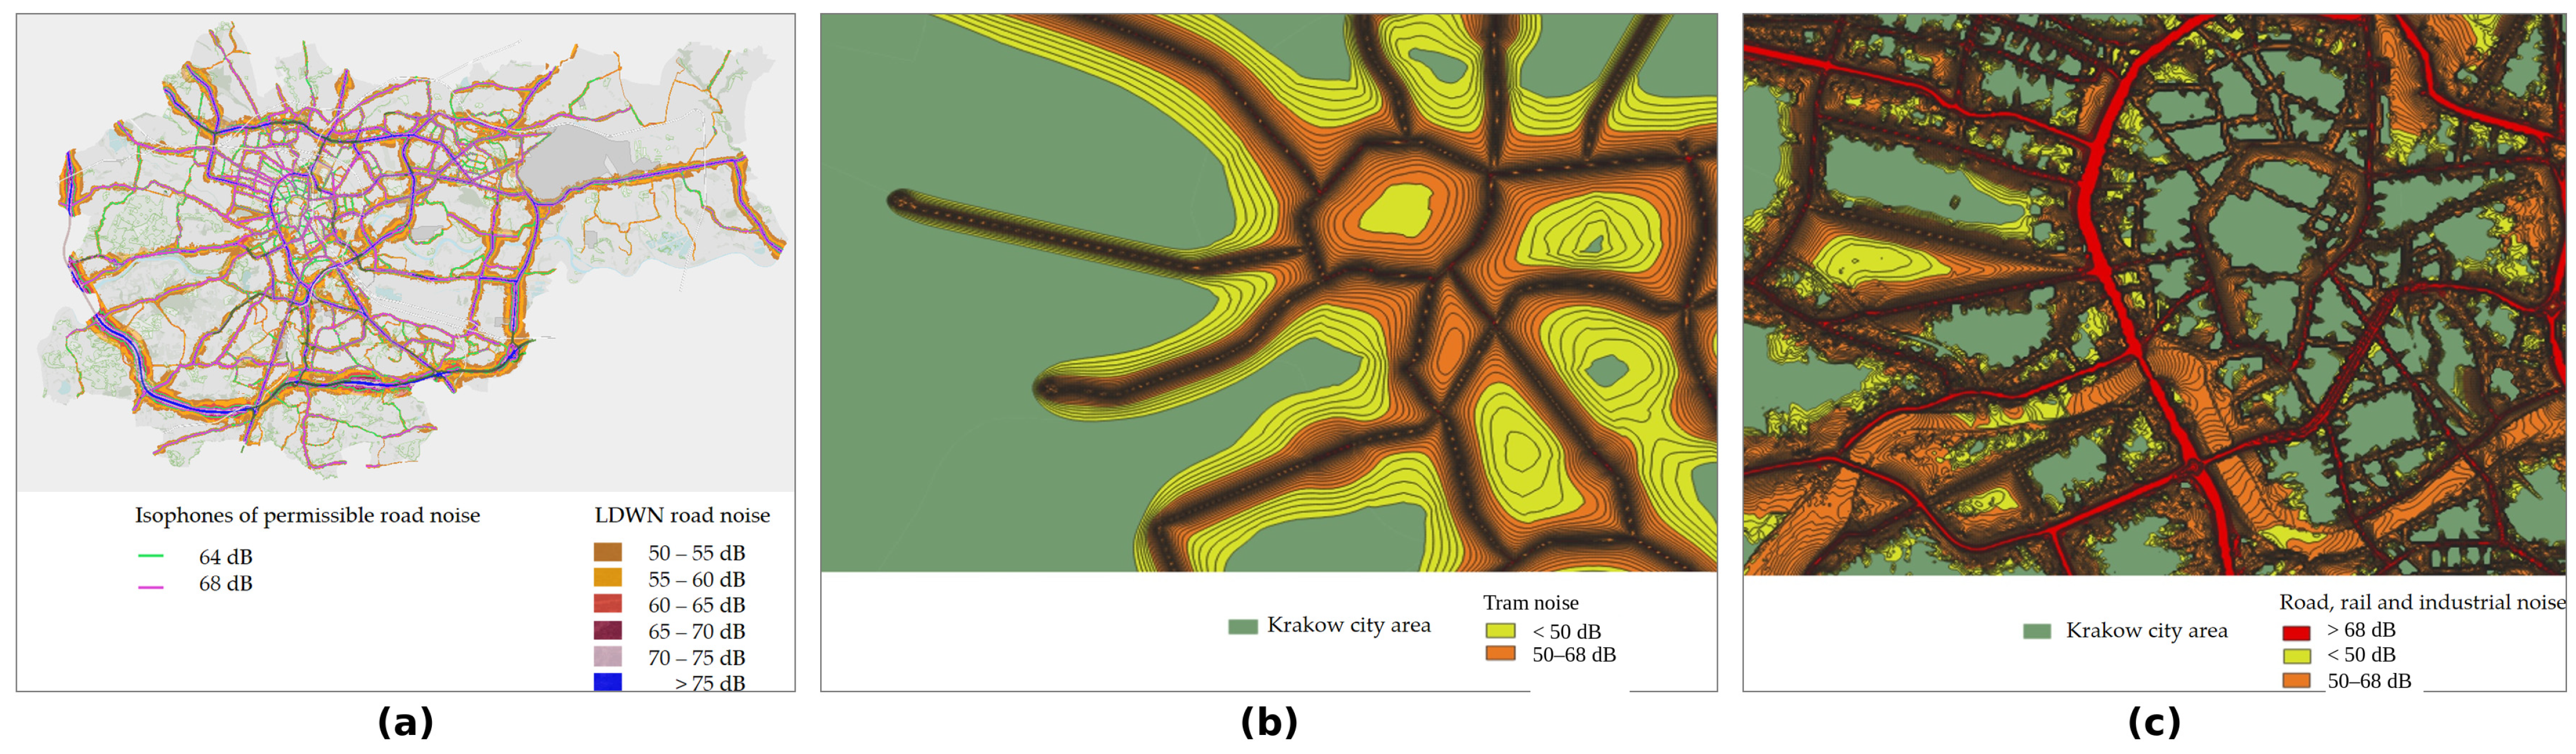
Data in .shp format on bus and tram stops in Kraków were obtained through the MSIP Obserwatorium portal, and vector data on the districts of Kraków from the Gis-Support service [47]. For the transport access attribute, buffers with radii of 150 m and 300 m were created around the stops, and the properties located within 150 m, between 150 and 300 m, or more than 300 m from a stop were then selected and assigned attribute values accordingly. To determine the noise to which the properties are exposed, the acoustic maps of Kraków were used, obtained in .shp format from the MSIP Obserwatorium portal. The maps were compiled for data recorded in 2017; they contain information on, among other things, noise emission and immission, exceedances of the permissible noise level, and the extent of areas threatened by above-normative noise. The analyses used immission data for road, industrial, railway, and tram noise, expressed by the long-term assessment indicator LDEN. Where the ranges of several sources overlapped, the attribute class was determined by the highest immission level at the address point of the property. The maps used are the strategic noise maps of Kraków drawn up under Directive 2002/49/EC [2] and made available through the MSIP Obserwatorium portal [48]. They were produced by computational modelling with the interim methods applicable to the 2017 mapping round (for road noise, the French NMPB-Routes-96 method), on the basis of measured traffic volumes and speeds, the geometry of the road and tram network, a three-dimensional model of buildings and terrain, and ground absorption data; the results are presented as isophone bands of 5 dB width at a height of 4 m above ground level, and the accuracy of maps of this class is usually put at 2 to 3 dB. The 2017 round was used because it was the last complete round of strategic mapping preceding the analysed transactions: the subsequent round, prepared under the CNOSSOS-EU methodology, was drawn up in 2022, at the close of the transaction window. A map compiled before the transaction period also reproduces the information on the acoustic climate that was actually available to market participants at the time of purchase. Between 2017 and the study period, parts of the road layout and traffic organisation changed; the main transport corridors that determine membership of the noisiest class remained stable, but for individual properties the class may be misstated, which Section 4 discusses among the limitations. The noise immission data were loaded in QGIS (Figure 1), and selection by location identified the areas where noise was below 50 dB, within 50–68 dB, or above 68 dB. The threshold values were adopted on the basis of the Regulation of the Minister of the Environment on permissible noise levels [23], applying the extreme permissible values for roads and railway lines and a uniform interval regardless of the noise source and the type of area. Noise classes were assigned by the spatial intersection of the geocoded address points with the isophone bands. Geocoding with the national service locates a property at the address point of the building, so the assigned exposure describes the building rather than a particular dwelling or its façade. Two kinds of error enter here: georeferencing error of the address point, in the Polish address register typically of the order of single metres, and misclassification of properties lying close to a class boundary, where a shift in several metres can change the assigned class. The width of the 50–68 dB interval limits the second effect, because reclassification requires crossing an isophone rather than a small change in the modelled level.
The resulting apartment database with the assigned attributes was divided by market type. The primary market comprises 2986 properties and the secondary market 3258.
The structure of the sample by ordinal attributes differs between the segments. The average location zone contains 1245 primary-market and 1251 secondary-market dwellings, the good zone 1482 and 1162, and the very good zone 259 and 844, respectively. The noise class below 50 dB was assigned to 1864 primary-market and 1736 secondary-market dwellings, the class 50–68 dB to 1091 and 1310, and the class above 68 dB to 31 and 211. The sparse representation of the noisiest class in the primary market reflects the structure of new supply and calls for caution in interpreting the estimates for extreme sound levels. Descriptive statistics of the continuous variables are given in Table 2.

2.4. Elimination of Outliers

Preliminary data analysis showed that the database contains outliers [49,50], caused mainly by data errors. The methods and estimators applied in this paper rest on the assumptions of normality and linear relationships. Such methods are particularly sensitive to outliers, so the outliers must be removed from the set or their influence minimised. Methods of outlier detection in apartment databases are described, among others, in [38,51,52]. Multiple regression was used to build the model. The dependent variable is the unit price (PLN/m2), which limits the heteroskedasticity related to differences in dwelling size, while the linear form of the model allows the estimated parameters to be interpreted directly in monetary units, in line with valuation practice, where the weights of market attributes are expressed in amounts. To detect outliers, an analysis of the standardised residuals of the model was carried out [37,53]. Since the model is estimated by least squares, the residuals are normally distributed and the t statistic follows Student’s t distribution with (nu) degrees of freedom. Adopting a significance level α, a residual vi can be regarded as consistent with the model by comparing the statistic ti = vi/mvi with the quantile of Student’s t distribution, where mvi = m0(1 − hii)1/2, m0 denotes the estimator of the standard deviation of the residuals, and hii is the diagonal element of the projection matrix. An observation is regarded as an outlier if |ti| > t1−α/2; nu.
A probability level of p = 0.90 was adopted; after the observation most distant from the model had been detected, it was removed from the set and the regression model was rebuilt, with the coefficient of determination R2 and the standardised residuals monitored. This procedure was chosen instead of symmetric trimming of the price distribution or interquartile rules because of what it removes: one observation at a time, the transaction most poorly explained by the observable attributes, that is, records whose prices are governed by information absent from the register, above all the standard and fittings of the dwelling. The threshold was set so that the final models reach the goodness of fit required of models used in valuation practice, and its consequences are treated as a result in itself, not as a technical detail. The procedure at p = 0.90 is deliberately restrictive and removes a substantial share of observations: in the joint variant from 6244 to 2130 transactions, in the primary market from 2986 to 1230, and in the secondary market from 3258 to 1193. The removed observations are predominantly transactions whose prices deviate from the model because of attributes not recorded in the register, above all the standard and fittings of the dwellings. The estimates obtained on the final samples are therefore interpreted as a description of the typical market segment, and their sensitivity to the adopted elimination threshold is examined in Section 3.3 by comparing the results for the full samples, the samples corresponding to R2 of 0.75 and 0.80, and the final samples, along with robust regression estimates (Huber M-estimator). The composition of the samples supports this interpretation: the removed observations have higher and more dispersed unit prices than the retained ones and are located on average closer to the centre, while the distribution of the noise attribute changes only moderately (Table S2).
The outlier elimination process was carried out for the primary and secondary markets jointly and separately.

2.5. Semi-Logarithmic Specification, Sensitivity Analysis, and Model Diagnostics

To present the results at the price level current for valuation practice, unit prices were expressed at the level of the first quarter of 2026 using segment-specific scaling: the transaction prices from the study period were multiplied by factors of 1.746 (primary market) and 1.553 (secondary market), set so that the mean unit price in each segment matched the mean transaction price of apartments in Kraków in the first quarter of 2026 according to the National Bank of Poland [43]. Scaling by a constant factor within a segment does not change the coefficients of determination, the t-statistics and p-values, the standardised coefficients, the partial correlations, or the NSDI estimates; only the parameters expressed in monetary terms are rescaled. The parameters of the joint model were estimated on the rescaled prices. Outlier elimination was performed before scaling, and the observation sets were left unchanged; the relative price trend within the sample is still captured by the time attribute.
To ensure comparability with the international literature, semi-logarithmic models were additionally estimated, with the natural logarithm of the unit price as the dependent variable. The working analytical database retains only the ordinal classes of the noise attribute, without continuous sound levels assigned to individual dwellings, so the attribute was expressed in decibels by assigning the midpoints of the adopted intervals (45 dB, 59 dB, and 73 dB). The NSDI (Noise Sensitivity Depreciation Index) was calculated as the percentage change in the unit price per 1 dB increase in the sound level [28]. The midpoint approximation introduces additional uncertainty not captured by the confidence intervals, so the NSDI estimates should be treated as approximate. The stability of the results was assessed in three steps. First, the models were estimated on the full samples and on the samples after outlier elimination corresponding to R2 of 0.75, 0.80, and 0.90. Second, robust regression with the Huber weight function was applied to the full samples. Third, a control variant in the international convention was estimated, with the logarithm of the total price as the dependent variable and the logarithm of floor area among the regressors; the conclusions on noise remain consistent (primary market: NSDI 0.19%/dB, p < 0.001; secondary market: insignificant estimate). The equality of the NSDI estimates between segments was verified with a z-test for coefficients from independent models, and the spatial differentiation with an F-test for the zone × sound level interaction. The diagnostics were supplemented with variance inflation factors (VIFs) for all regressors and a test of spatial autocorrelation of the residuals using Moran’s I [54]. Because the working analytical database contained property addresses, the spatial weights matrix was defined by address adjacency: properties located on the same street were treated as neighbours, with row standardisation of the weights, and significance was assessed with a permutation test (999 permutations). This approximation captures well the clustering of transactions within individual buildings and developments, but it is coarse; estimation with a distance matrix based on geocoded coordinates remains a direction for further work. All computations were carried out in Python 3.12 (Python Software Foundation, Wilmington, DE, USA) with the NumPy, pandas, and statsmodels libraries.

3. Results

3.1. Regression Models for the Primary and Secondary Markets

The analysis covers dwellings traded in the primary and secondary markets. Table 3, Table 4 and Table 5 document the regression models estimated for the markets considered jointly and separately, and the full parameter tables of the additional specifications are given in the Supplementary Materials (Table S3). The semi-logarithmic estimates of the NSDI, the sensitivity analysis and the diagnostics are reported in Section 3.3. The parameters of the model for the markets considered jointly, estimated on the final sample (n = 2130), are given in Table 3; the coefficient of determination R2 equals 0.896 (adjusted 0.895; F(8, 2121) = 2275; p < 0.001). Table 3, Table 4 and Table 5 report the unstandardised coefficients b with their standard errors, t-statistics and p-values, the standardised coefficients b*, and the partial correlations between the individual attributes and the unit price. The noise attribute increases as the acoustic climate improves (a value of two denotes a level below 50 dB); a positive parameter therefore means higher prices of dwellings in quieter surroundings.
Apart from floor, all attributes of the joint model are statistically significant (p < 0.001). Location has the strongest influence on property prices. An analogous model without the noise attribute has R2 of 0.891, and the mean modulus of the residuals rises from 497 to 506 PLN/m2; in the joint specification, the effect of noise is therefore small but statistically significant. To deepen the analysis, the influence of the attributes was examined separately for the primary and secondary markets. Table 4 reports the parameters of the primary-market model (n = 1230); R2 equals 0.900, against 0.893 in the model without the noise attribute.
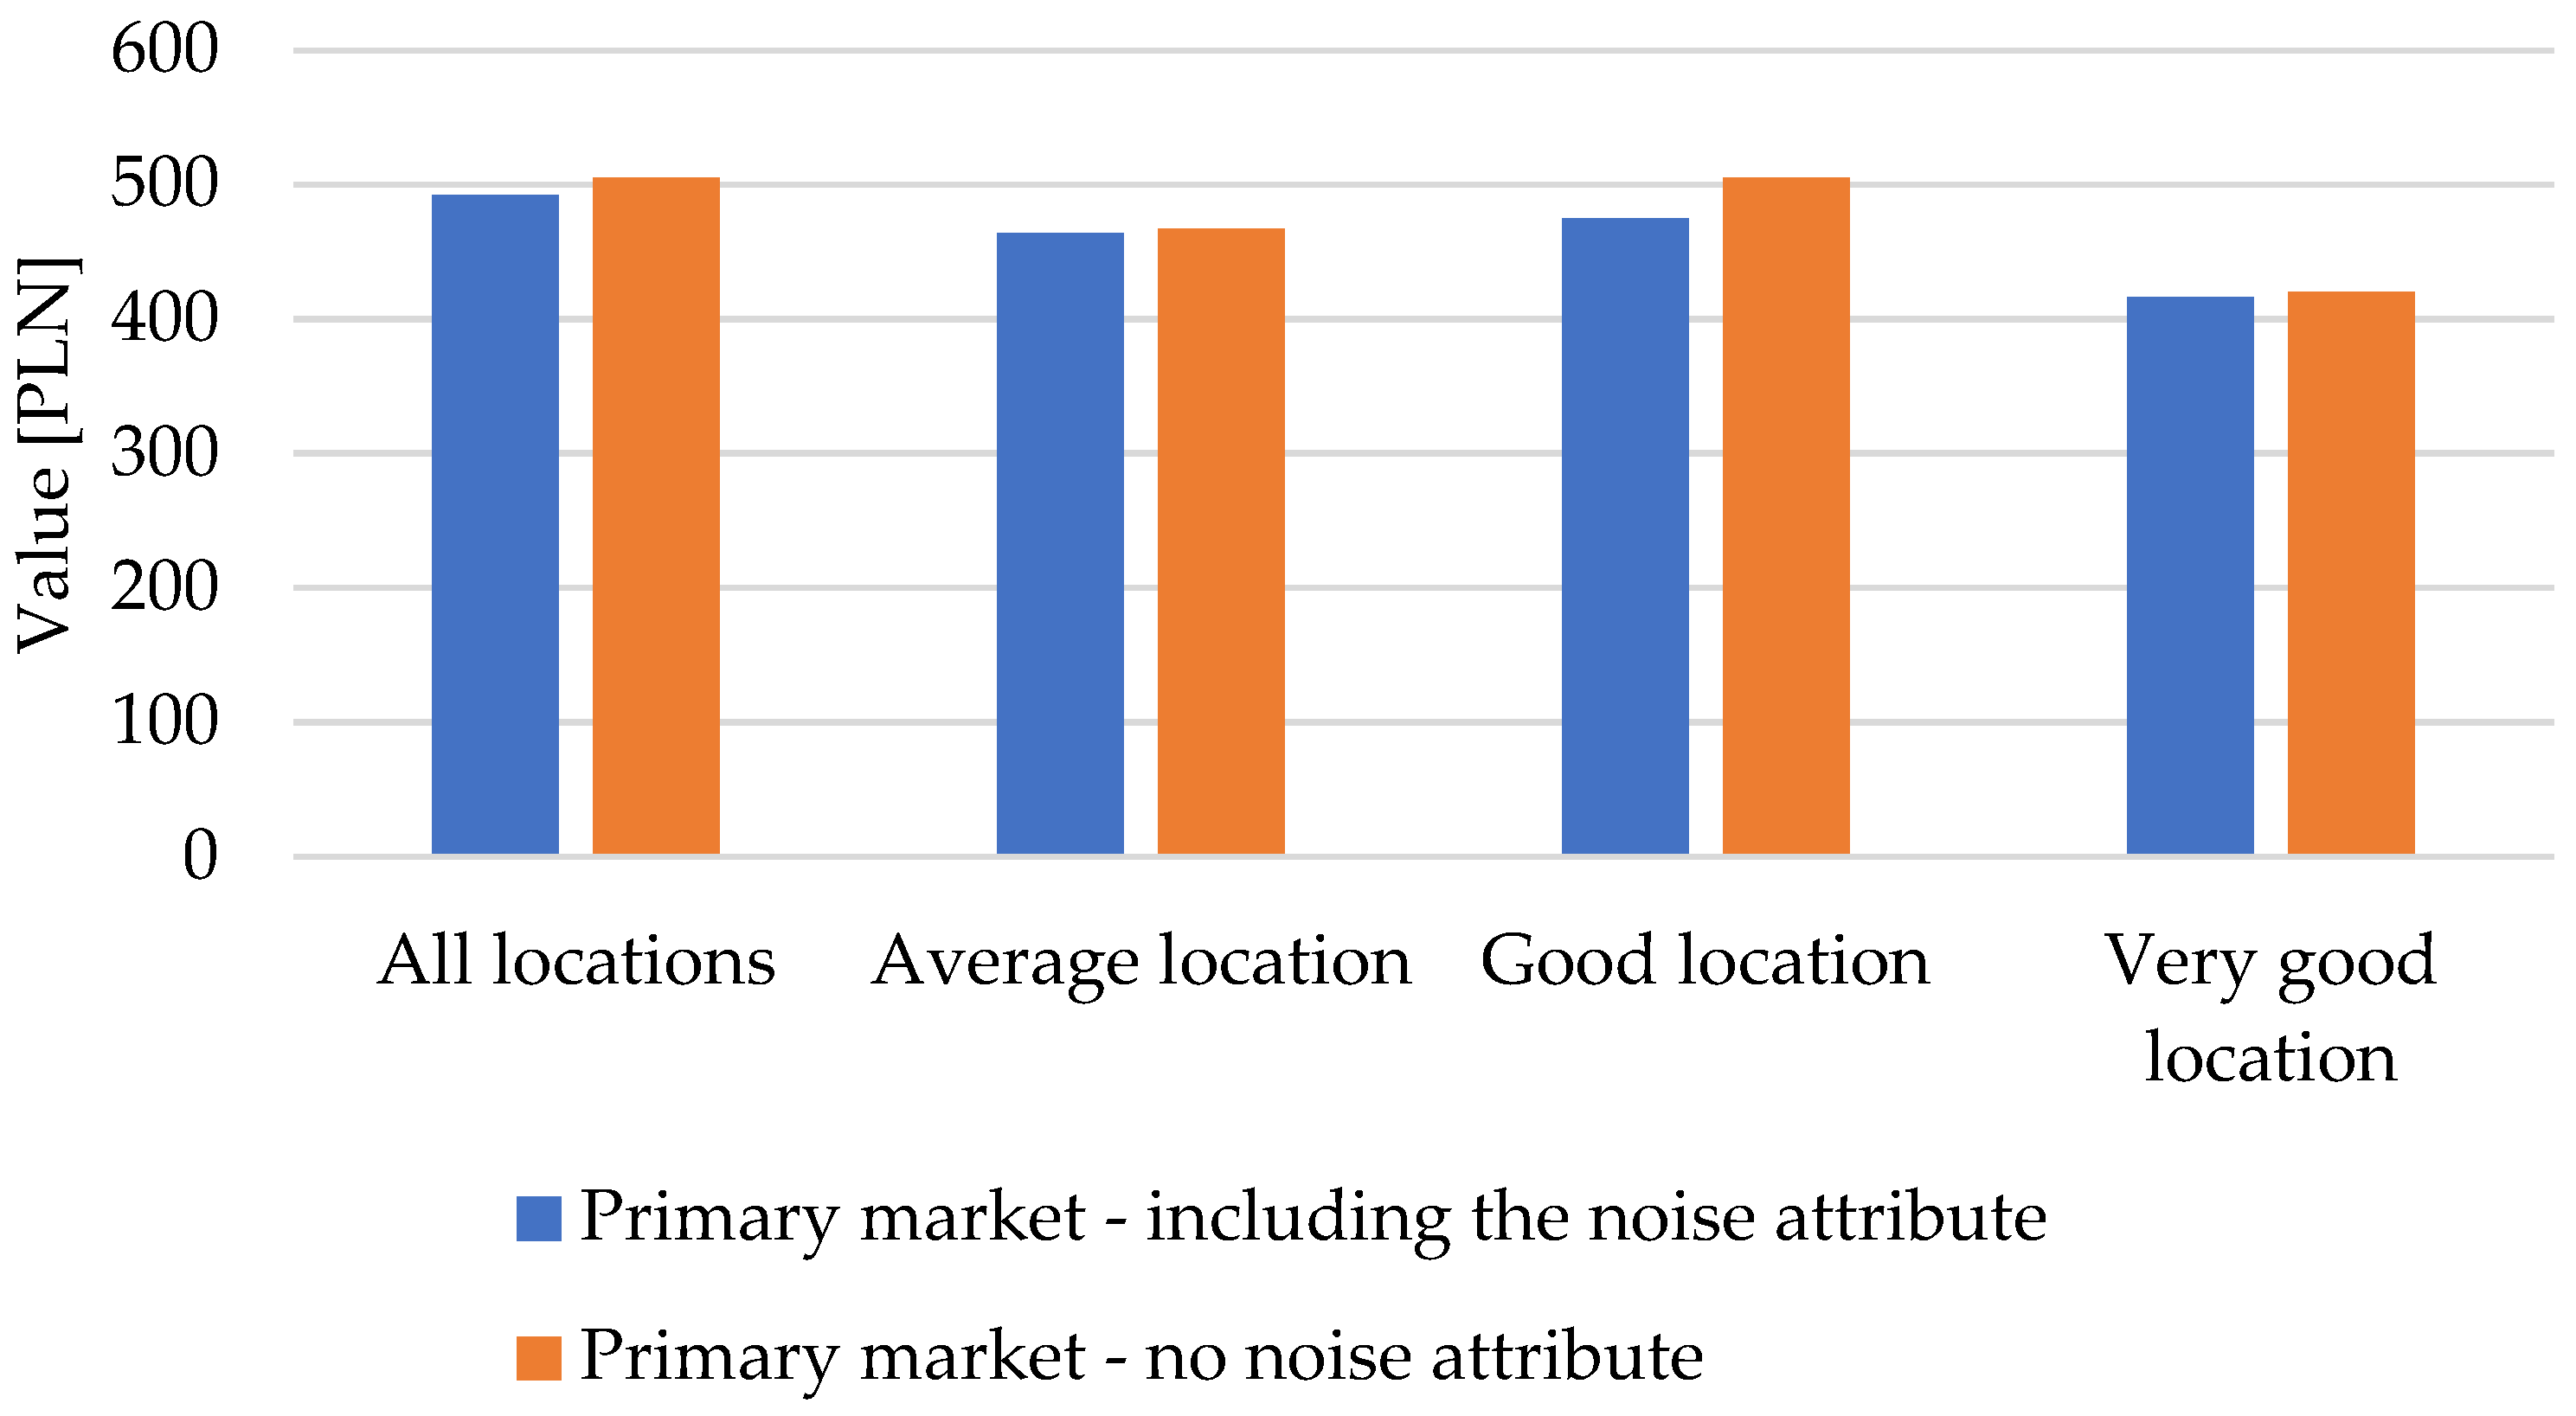
In the primary market, too, location has the strongest influence on the market value of a property. The noise attribute is statistically significant (p < 0.001), and its inclusion narrows the differences between predicted and transaction values: the mean modulus of the residuals falls from 505 to 492 PLN/m2.
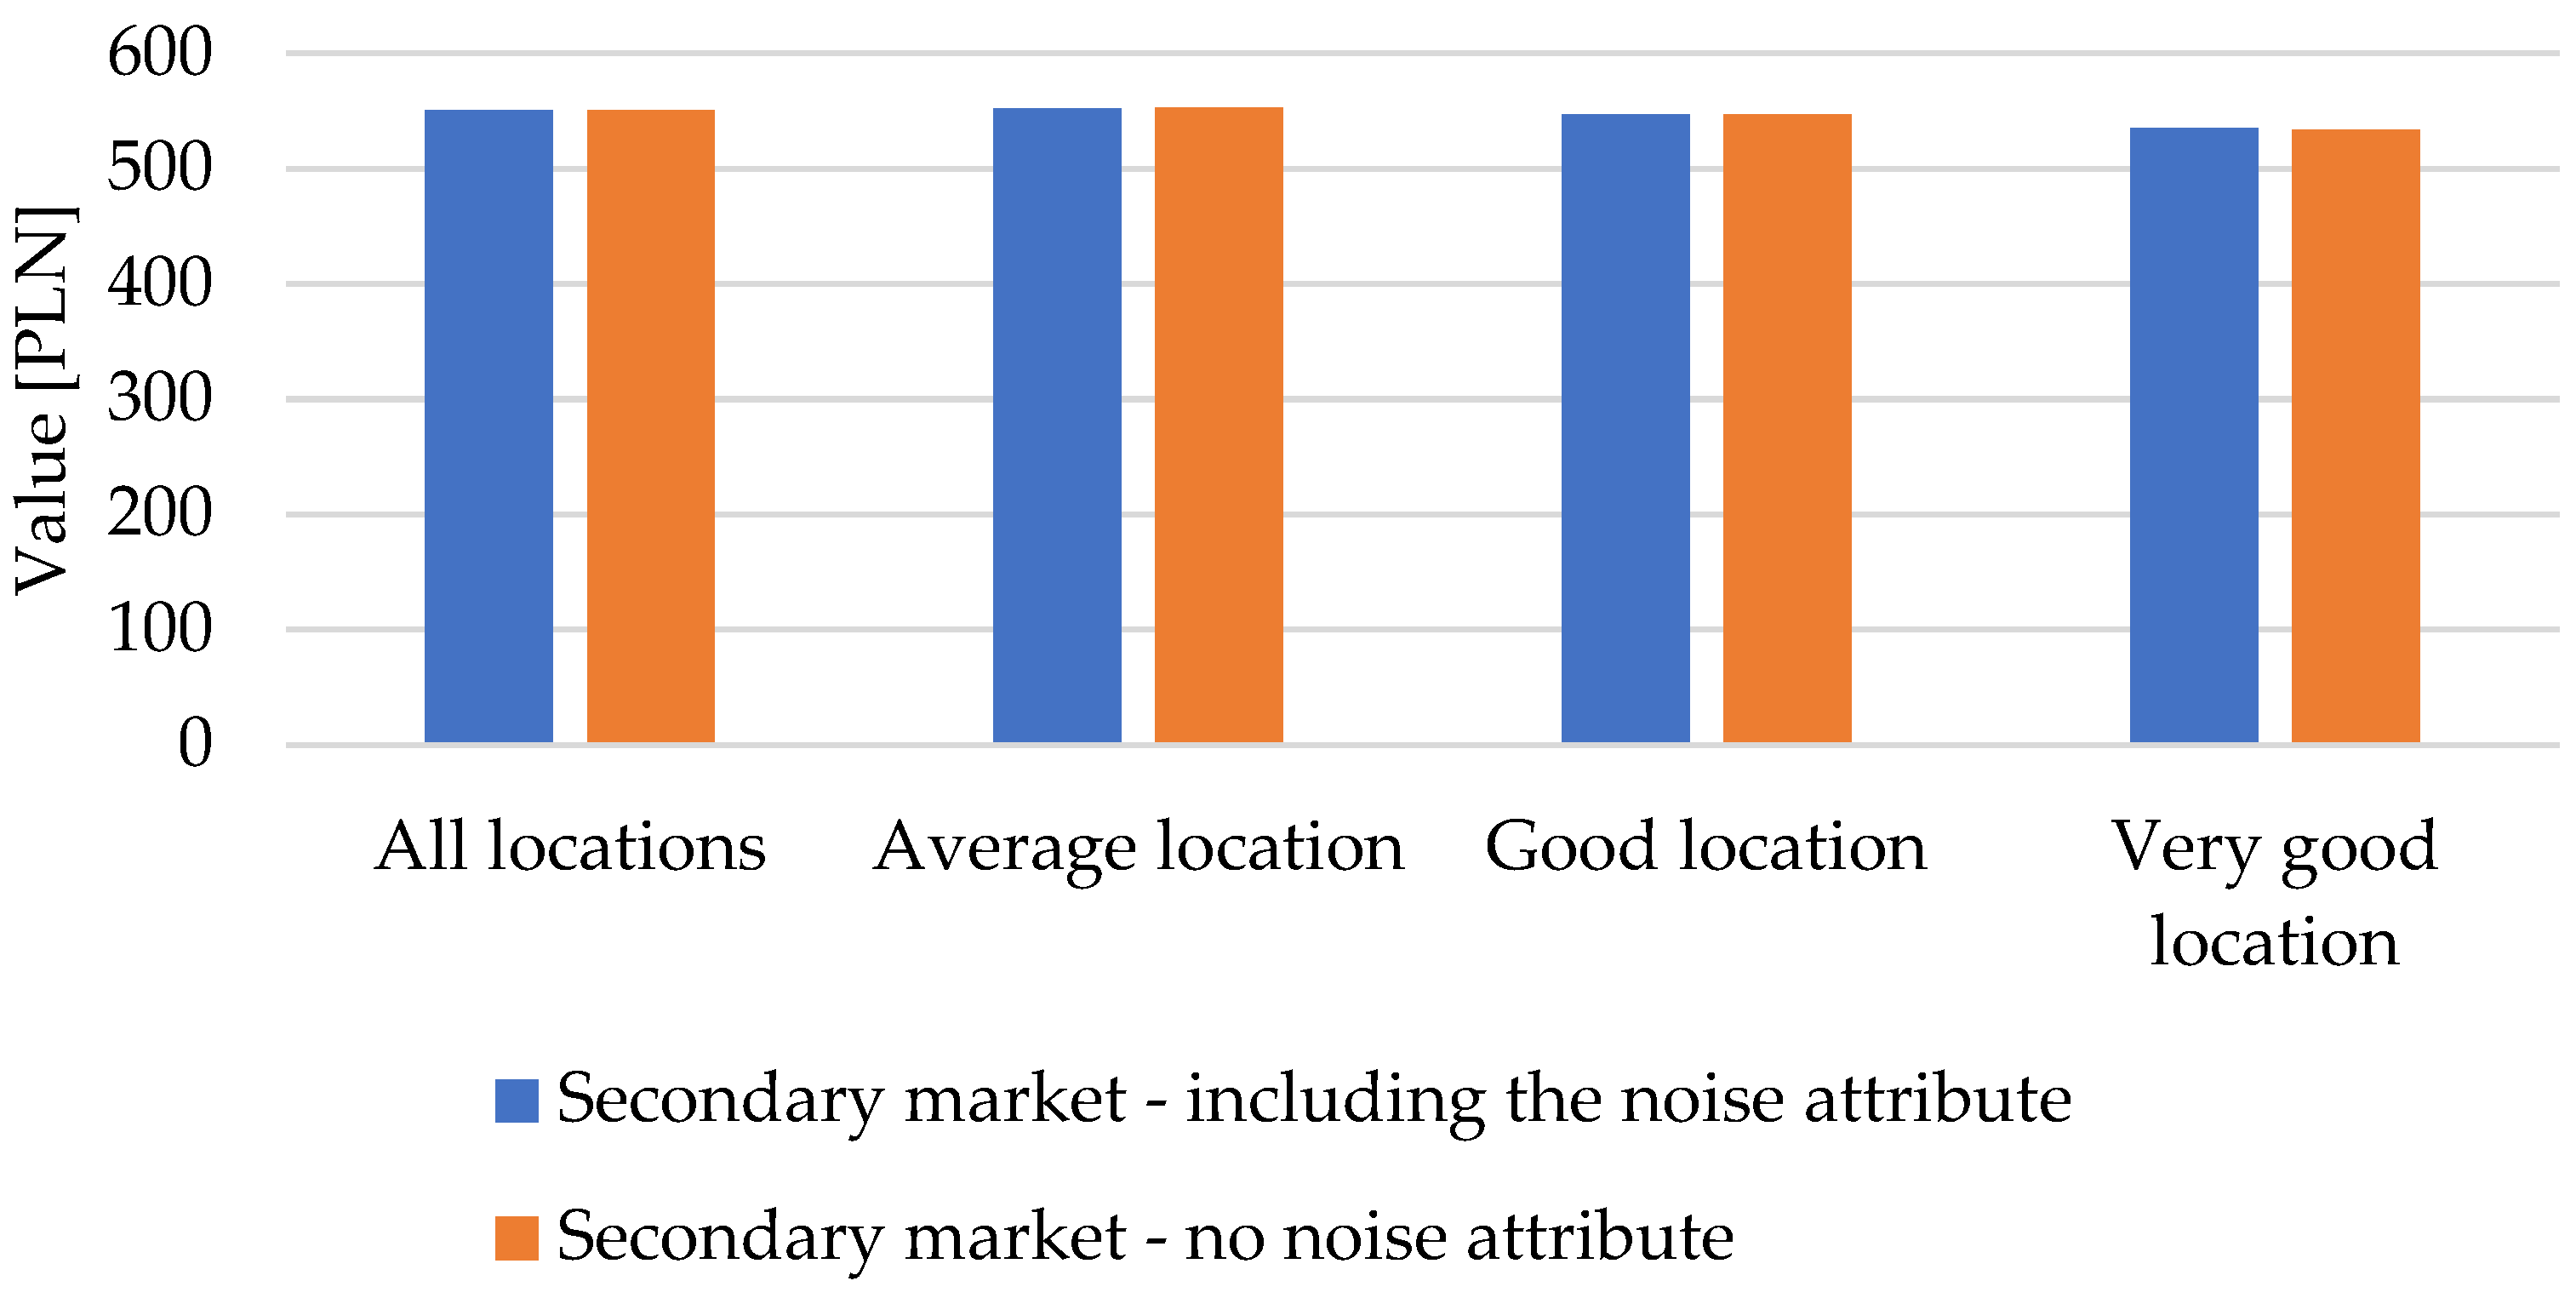
The analysis of the secondary market shows no effect of noise on prices (Table 5): The attribute’s parameter is close to zero and insignificant (p = 0.93), and the models with and without noise fit identically (R2 = 0.900; mean modulus of residuals of 551 PLN/m2 in both variants). The conclusion is robust to specification: in the model variant without the number of rooms, whose parameter may raise interpretive doubts, the noise attribute remains insignificant (p = 0.49).
In both the primary and the secondary market, location shows the strongest influence on prices; in the secondary market, the effect is smaller yet still reaches a high partial correlation.
To identify the effect of noise more clearly, further analyses were carried out with the location attribute excluded. For this purpose, multiple regression models were estimated within the individual location zones of the city for the primary and secondary markets, jointly and separately.

3.2. Synthesis of the Models for the Location Zones

The zone models were estimated on the final segment samples, without renewed outlier elimination within the zones. In the primary market, the effect of noise is most visible outside the central zone. In the good location, including the noise attribute raises the model’s R2 from 0.67 to 0.71 (n = 617; partial correlation 0.34; p < 0.001), and in the average location from 0.65 to 0.66 (n = 573; r = 0.16; p < 0.001). In the very good location of the primary market (n = 40), the noise parameter is insignificant (p = 0.47). In the secondary market, the noise attribute proved insignificant in all zones.
A formal test of spatial differentiation was carried out in the semi-logarithmic primary-market model with zone × sound level interactions. The joint significance test of the interactions, F(2, 1219) = 6.31 (p = 0.002), confirms the spatial non-stationarity of the effect. The NSDI estimates equal 0.23%/dB (95% CI: 0.18–0.28) in the good location, 0.10%/dB (0.03–0.17) in the average location, and a value indistinguishable from zero in the very good location (0.00; −0.19–0.19). The noise effect thus fades with proximity to the centre, and its maximum falls in the intermediate zone rather than on the periphery. This pattern is interpreted in the Discussion.
Figure 2 and Figure 3 show the mean moduli of the residuals separately for the primary and secondary markets, with and without the noise attribute, in the individual location zones of the city.

3.3. The NSDI and Model Diagnostics

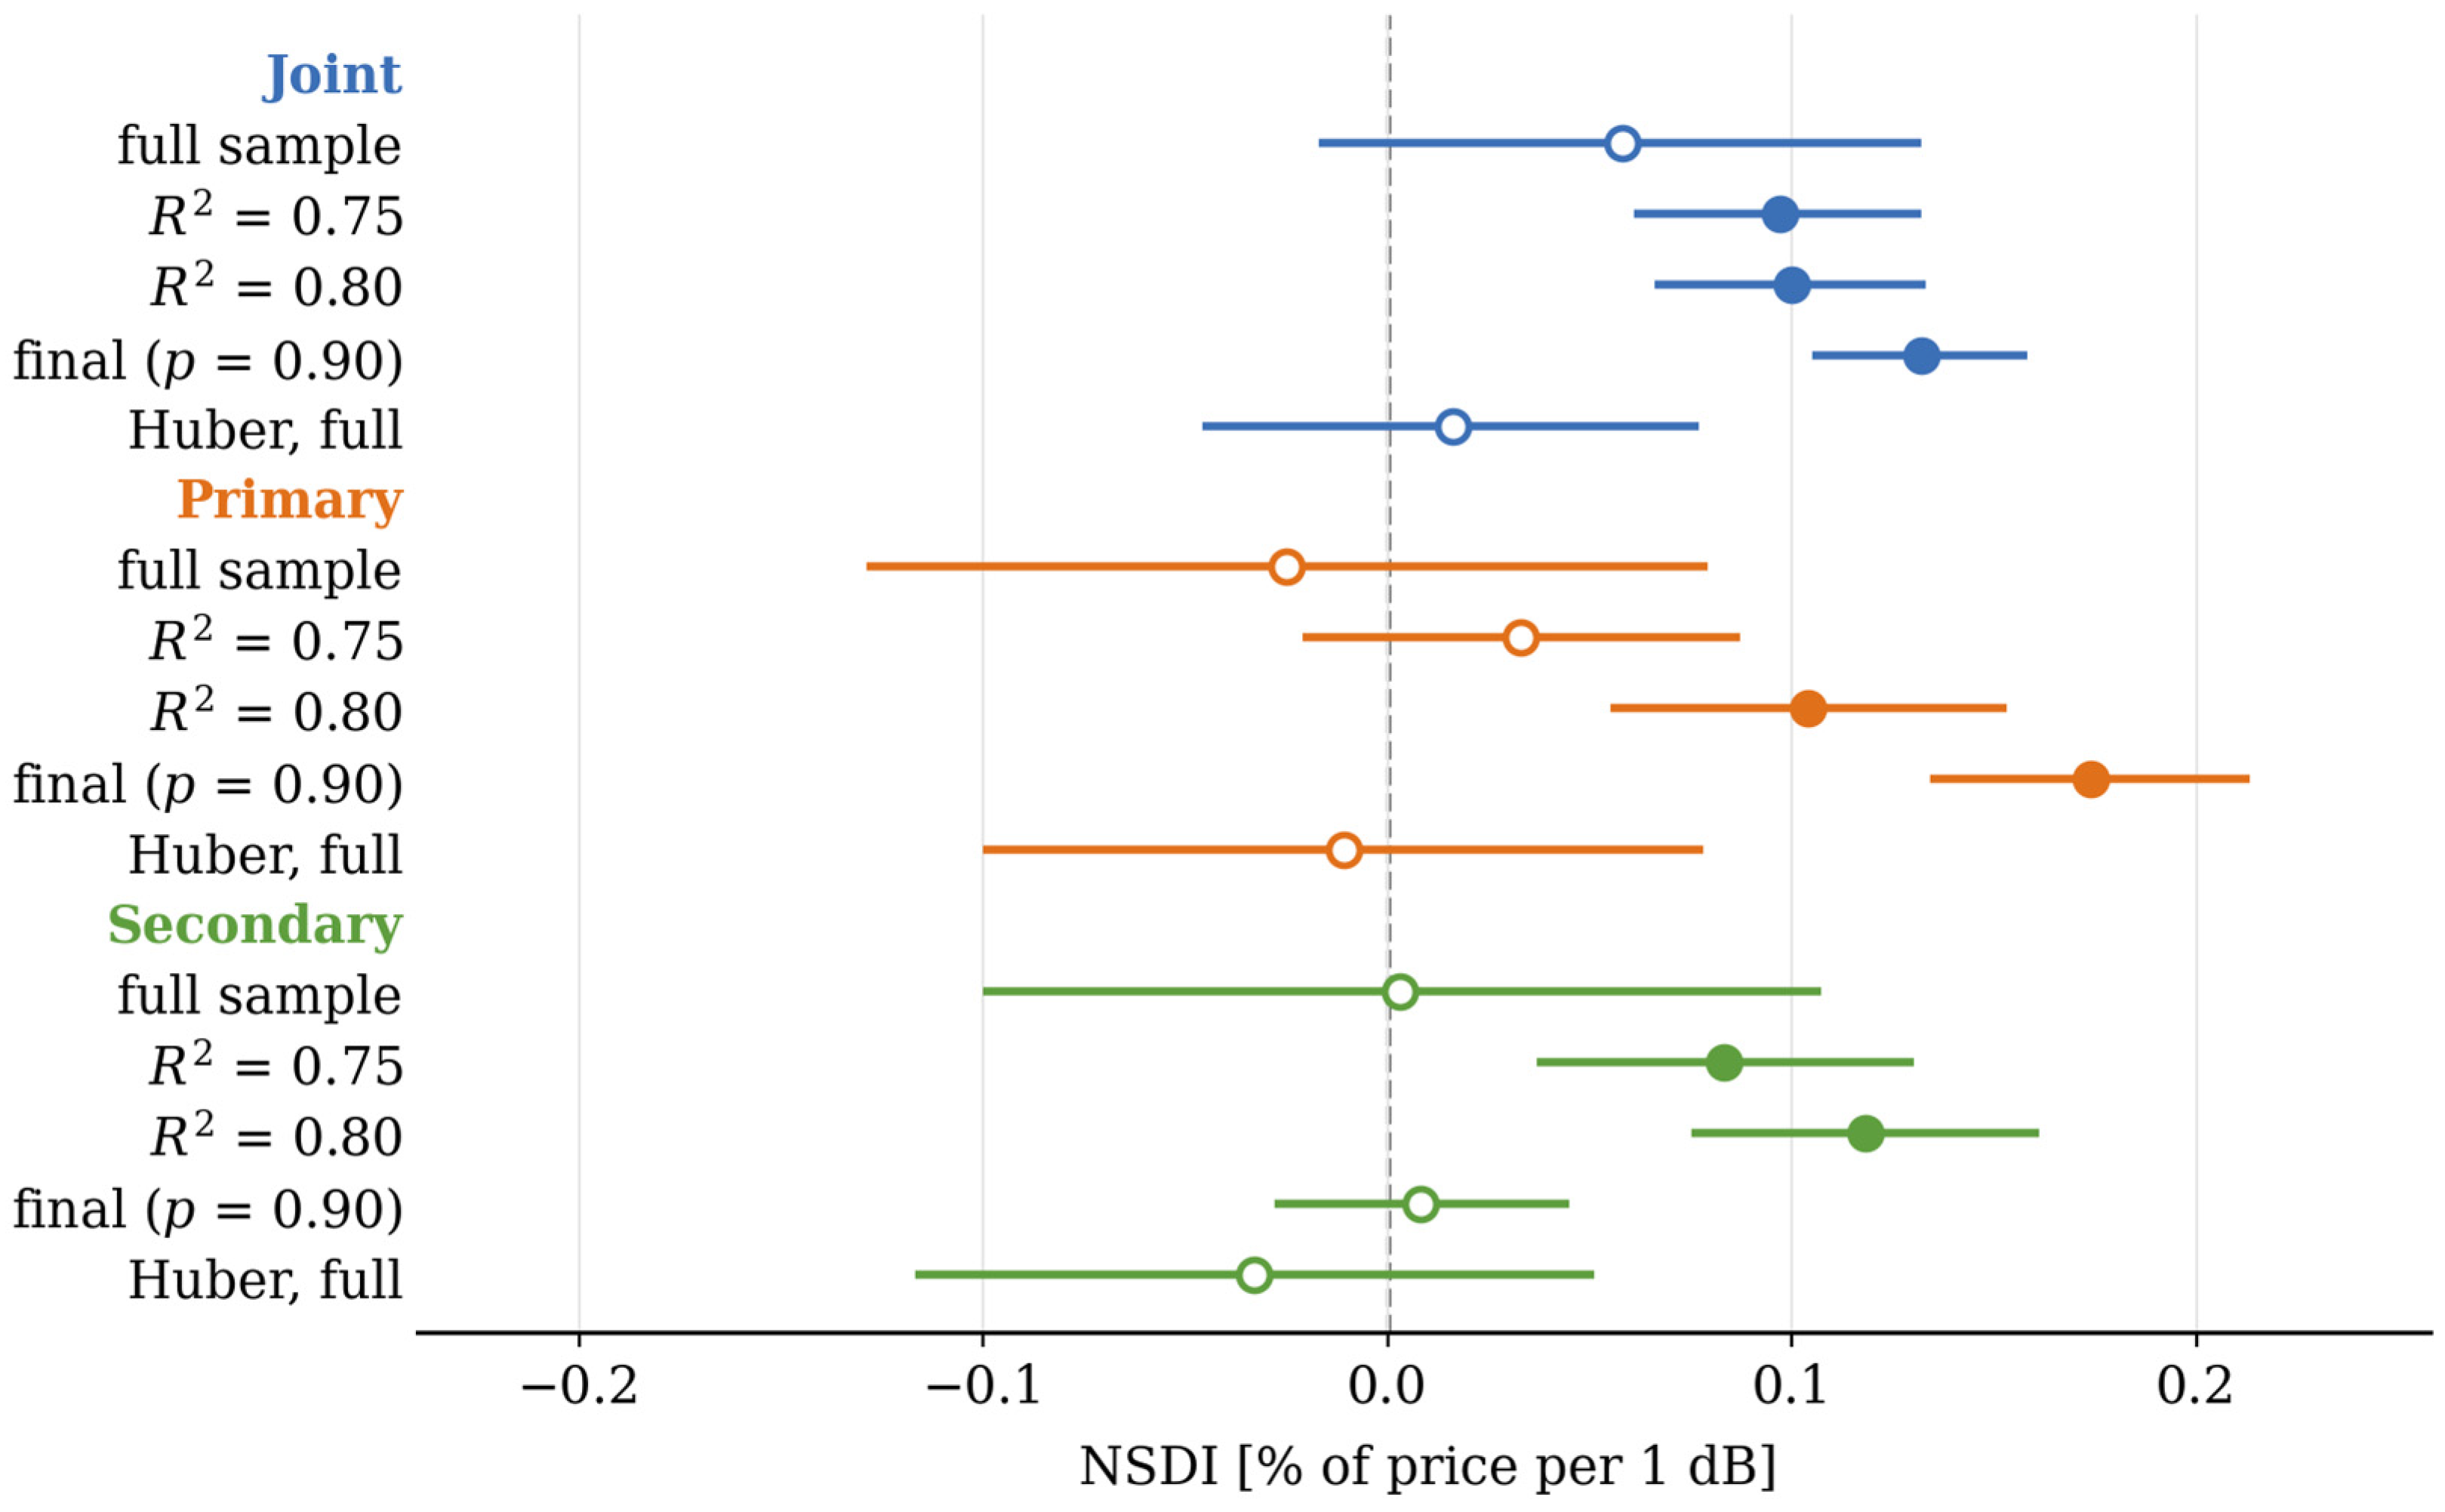
The results of the semi-logarithmic estimation, together with the sensitivity analysis and diagnostics, are compiled in Table 6. In the full samples, dominated by unobserved variation in dwelling standard, the noise attribute does not reach significance in any segment, including in robust regression. The effect emerges as the sample is narrowed to typical transactions. In the primary market, the NSDI estimate grows monotonically as the elimination threshold is tightened, from an insignificant value in the full sample to 0.17% of the price per 1 dB in the final sample (95% CI: 0.13–0.21; p < 0.001), with its significance stabilising from the threshold R2 = 0.80. For the markets considered jointly, the NSDI in the final sample equals 0.13%/dB. In the secondary market, the estimates are unstable with respect to the threshold (0.08–0.12%/dB at intermediate thresholds, 0.01%/dB in the final sample, insignificant), which does not allow the effect to be regarded as reliably identified in this segment. The difference in NSDI between the final primary- and secondary-market models is statistically significant (z-test for coefficients from independent models: z = 6.0; p < 0.001), which formally verifies hypothesis H2. After elimination, the noisiest class retains only two dwellings in the primary market and 58 in the secondary market (the intermediate and quietest classes: 411 and 817, and 450 and 685 dwellings respectively), so the primary-market NSDI is identified in practice from the contrast between the 50–68 dB class and the quietest class and should be referred to the 45–68 dB range. A specification with the noise classes entered as dummies confirms this reading: in the final primary-market model the 50–68 dB class carries a price discount of 2.4% relative to the quietest class (95% CI: 1.9–3.0%; p < 0.001), which over the 14 dB distance between the class midpoints reproduces the estimate of 0.17%/dB, while the parameter of the sparsely represented noisiest class cannot be estimated with any precision; in the secondary market both class parameters are insignificant. A pooled model estimated on the final segment samples with a full set of market interactions confirms H2 in the interaction convention: the market × sound level parameter equals 0.165 percentage points per dB (95% CI: 0.111–0.220; t = 5.93; p < 0.001), consistent with the z-test; the full parameter tables of both specifications are provided in the Supplementary Materials (Table S3). The NSDI estimates from Table 6 are visualised in Figure 4.
The variance inflation factors do not exceed 3.5 for any regressor, and for the location, transport access, and noise attributes they fall within 1.1–1.5, which rules out collinearity as a source of instability of the estimates; the elevated values for the floor area and number of rooms pair stem from the natural relationship between the two attributes. Moran’s I for the residuals, computed with the street adjacency matrix, indicates strong positive spatial autocorrelation in the full samples (I from 0.25 to 0.59; p = 0.001) and its clear weakening after outlier elimination. In the final secondary-market model, the autocorrelation is insignificant (I = 0.03; p = 0.30), while in the joint and primary-market models it remains moderate (I = 0.12 and 0.18; p = 0.001), reflecting the clustering of transactions within individual development projects sold on the same streets. The standard errors of the parameters in these models may be understated as a result, so inference on significance should be treated with caution; hierarchical models with a development effect and geographically weighted regression remain directions for further work.

4. Discussion

The results fit the picture emerging from the international literature and at the same time extend it. The negative capitalisation of noise in apartment prices, well documented for Western European cities [11,19,20,29,31], manifests itself in Kraków in a manner strongly dependent on the market segment and the position of the property relative to the centre. The strongest effect of noise was found in the primary market outside the central zone, with a maximum in the intermediate zone (NSDI 0.23%/dB), while in the central zone the effect disappears. This result corresponds with the findings for Thessaloniki, where the relationship between noise and prices likewise differed between the inner zone and the districts away from the centre [36]. A similar mechanism can be indicated in Kraków: In the very good location, noise and transport accessibility are strongly interrelated, and buyers accept a higher sound level as the cost of a central position.
The results allow the hypotheses to be addressed. H1 was confirmed for the primary market and for the markets considered jointly, but only in the samples after outlier elimination; in the full samples the effect remains indistinguishable from zero. H1 is therefore confirmed only conditionally, within the typical market segment defined by the elimination procedure. H2 was confirmed in full: The difference in NSDI between the segments is statistically significant (z = 6.0; p < 0.001). H3 was confirmed in part. The noise effect does disappear in the central zone, but its maximum falls in the intermediate zone (2.5–5 km from the centre) rather than on the periphery, which points to a complex structure of buyer preferences rather than a simple spatial gradient.
The NSDI estimated for the primary market (0.17% per 1 dB) places Kraków slightly below the value reported for Hamburg (0.23% per 1 dB) and in the lower part of the range typical of road noise, which is consistent with the ordinal character of the noise measure, which suppresses part of the variance. Table 7 provides a synthetic comparison of selected foreign and Polish studies against the present work.
Against the background of Central European research, the comparison with Olsztyn, a city operating within the same system of public registers, is particularly instructive [17]. The weaker capitalisation of noise in the secondary market observed in Kraków may be systemic in nature and stem from the deficit of information on dwelling standard in the registers, common to post-transition markets, rather than from local specificity. A distinct feature of Kraków remains tourist pressure: In the very good location, a substantial part of demand consists of investment purchases for short-term rental, which makes the city centre resemble destinations such as Prague or Florence and explains the acceptance of an elevated noise level as the cost of a profitable location. The opposite signs of the number-of-rooms parameter in the two markets reflect, with floor area controlled, the density of the dwelling’s division, valued differently in the segment of new apartments and in the older stock; the conclusion on noise is robust to this variable, as shown by the secondary-market model variant without the number of rooms. The negative parameter of transport accessibility, seemingly at odds with the premium for proximity to stops reported, among others, in [22], follows from the construction of the attribute set: Once distance from the centre and the acoustic climate are included in the model, proximity to a stop mainly proxies the vicinity of busy transport corridors.
The different picture of the secondary market, where the effect of noise proved marginal or statistically insignificant, calls for careful interpretation. The real estate price register contains no information on the standard and fittings of dwellings, that is, on the attributes that differentiate prices in this market most strongly; unobserved heterogeneity may therefore mask the noise effect. Part of the cost of noise is, in addition, capitalized in qualitative features of the building, such as window joinery with enhanced acoustic insulation, which are not reflected in the register data. The nonlinear character of the relationship between price and sound level, reported for Hamburg among others [19], may further weaken estimates based on a three-level attribute scale.
The estimates describe statistical associations and should not be read as causal effects. Traffic noise co-varies with other nuisances of proximity to higher-class roads, above all air pollution and the barrier effect, and with the condition of buildings and the accessibility of services; some of these factors are absent from the register, so omitted-variable bias cannot be excluded. Controlling the distance from the centre and transport access limits this risk only in part. Identification of a causal effect would require a quasi-experimental design, for example one exploiting changes in the road layout or the construction of acoustic screens, which the available data do not support.
A limitation of the study is that the noise attribute rests on acoustic maps from 2017 and on an ordinal scale, resulting from the retention of only the attribute classes in the working analytical database and only partly mitigated by the midpoint approximation; moreover, between the compilation of the maps and part of the transactions, changes to the road layout occurred that the maps do not reflect. Another limitation is the conditional character of the estimates: The noise effect emerges only after the removal of a substantial share of observations whose prices are shaped by attributes not recorded in the register, so the NSDI values should be referred to the typical market segment rather than the full population of transactions. The covariation of location, transport access, and noise, natural in urban structures, does not threaten the stability of the estimates (the VIF values for these attributes do not exceed 1.5), whereas the moderate autocorrelation of residuals within streets, persisting in the final primary-market models, points to the need for models accounting for the development-project effect. Geographically weighted regression models, which require full geolocation of transactions, remain a direction for further research. The adopted measure also does not allow the effect of noise to be fully separated from the other nuisances of proximity to higher-class roads, such as air pollution or the barrier effect. A further consequence of relying on strategic maps is that the LDEN indicator describes the long-term average level at the building, while the acoustic comfort of a particular dwelling depends on the orientation of its windows, the floor on which it is located, the acoustic insulation of the joinery, the presence of balconies, greenery or local screens, and the diurnal distribution of traffic; none of these elements is observed in the data, although all of them shape the buyer’s perception of noise and the price actually paid. Subsequent rounds of strategic mapping under Directive 2002/49/EC [2], together with the growing availability of high-resolution spatial data, will make it possible in the future to estimate continuous NSDI values for the Kraków market and to apply machine learning methods with model interpretability techniques [36]. Combining register data with building-specific information, such as the year of construction and the acoustic parameters of the window joinery, and with surveys of buyers’ perception of noise would allow the exposure read from the map to be confronted with the exposure actually experienced; quasi-experimental designs based on changes in the road network offer a route to causal estimates. A separate research direction is the quantification of expectations regarding future changes in the acoustic climate, whose importance was demonstrated for the Berlin market [35]. From an applied standpoint, the results matter directly for property valuers, developers, and planners. They show that ignoring the acoustic climate in the valuation of primary-market dwellings outside the central zone leads to systematic prediction errors, and that locating new housing along main transport corridors without acoustic protection measures is reflected in reduced market value. At the mean parameters of the final primary-market sample (14,507 PLN/m2 and 53.2 m2), the estimated NSDI corresponds to a loss of about PLN 1.3 thousand of the value of an average new dwelling per decibel, and the 14 dB distance between the midpoints of the intermediate and the quietest class to about PLN 18 thousand (roughly EUR 300 and EUR 4200 respectively, at the mid-2026 exchange rate); these amounts provide a direct reference point for the cost–benefit analysis of noise abatement measures.

5. Conclusions

On the basis of 6244 transactions concluded in Kraków between January 2021 and June 2022, the capitalisation of road traffic noise in apartment prices was examined, with the primary and secondary markets analysed separately. Road noise proved a statistically significant price-forming attribute in the primary market (H1): in the final model of this segment, the NSDI amounted to 0.17% of the price per 1 dB (95% CI: 0.13–0.21%), and 0.13% for the markets considered jointly. These values characterise the typical market segment defined by the elimination procedure, not the full population of transactions. The effect of noise is significantly stronger in the primary market than in the secondary market (H2; z = 6.0; p < 0.001); in the secondary market, the estimates are unstable with respect to the elimination threshold and indistinguishable from zero in the final sample. The effect of noise depends on the position relative to the centre (H3): it is strongest in the zone 2.5–5 km from the centre (0.23%/dB), weaker on the periphery (0.10%/dB), and disappears in the central zone.
The estimates are conditional on the outlier elimination procedure. In the full samples, the noise effect does not reach significance, because price variation is dominated by differences in the standard and fittings of dwellings, which the register does not record; the effect emerges and stabilises as the sample is narrowed to typical transactions. Since the real estate price register contains no information on dwelling standard and fittings, the primary and secondary markets should be analysed separately and the NSDI values referred to the typical market segment. The moderate autocorrelation of residuals within streets in the primary market reflects the clustering of transactions in development projects and justifies the use of hierarchical models and geographically weighted regression in subsequent research.
From a practical standpoint, the results indicate that the acoustic climate should be routinely included in the valuation of primary-market dwellings, especially outside the central zone, where its omission leads to systematic prediction errors. For spatial policy, the conclusion aligns with the goals of sustainable urban development: limiting the exposure of new housing to road noise is directly reflected in the market value of dwellings, and thus in household wealth. Further research will cover the estimation of continuous NSDI values based on subsequent rounds of strategic noise maps and models using the full geolocation of transactions. The estimated capitalisation also gives the European Union’s target of reducing the share of people chronically disturbed by transport noise by 2030 a measurable market counterpart [26].

Supplementary Materials

The following supporting information can be downloaded at: https://www.mdpi.com/article/10.3390/su18168029/s1. Table S1: Anonymized transaction database; Table S2: Composition of the full, final and removed samples by market segment; Table S3: Noise-class dummy specification and market-interaction model.

Author Contributions

Conceptualisation, E.J. and E.P.; methodology, E.J. and E.P.; software, E.P.; validation, E.J.; formal analysis, E.P. and E.J.; investigation, E.P. and E.J.; resources, E.P. and E.J.; data curation, E.J. and E.P.; writing—original draft preparation, E.P.; writing—review and editing, E.J.; visualisation, E.P.; supervision, E.P.; project administration, E.P.; funding acquisition, E.J. All authors have read and agreed to the published version of the manuscript.

Funding

This research was partly financed by a subsidy for maintaining research potential, no. 16.16.150.545, allocated to the Department of Integrated Geodesy and Cartography, AGH University of Krakow, and was partly supported by the “Excellence Initiative—Research University” program for AGH University of Krakow.

Institutional Review Board Statement

Not applicable.

Informed Consent Statement

Not applicable.

Data Availability Statement

The data supporting the findings of this study are openly provided in the Supplementary Materials (Table S1); the composition of the samples used and the additional model specifications are documented in Tables S2 and S3.

Conflicts of Interest

The authors declare no conflicts of interest.

References

  1. Seidman, M.D.; Standring, R.T. Noise and quality of life. Int. J. Environ. Res. Public Health 2010, 7, 3730–3738. [Google Scholar] [CrossRef] [PubMed]
  2. European Parliament and Council. Directive 2002/49/EC of 25 June 2002 relating to the assessment and management of environmental noise. Off. J. Eur. Communities 2002, L 189, 12–25. [Google Scholar]
  3. Blanco, J.C.; Flindell, I. Property prices in urban areas affected by road traffic noise. Appl. Acoust. 2011, 72, 133–141. [Google Scholar] [CrossRef]
  4. European Environment Agency. Environmental Noise in Europe—2020; EEA Report No 22/2019; Publications Office of the European Union: Luxembourg, 2020.
  5. Bodin, T.; Björk, J.; Mattisson, K.; Bottai, M.; Rittner, R.; Gustavsson, P.; Jakobsson, K.; Östergren, P.O.; Albin, M. Road traffic noise, air pollution and myocardial infarction: A prospective cohort study. Int. Arch. Occup. Environ. Health 2016, 89, 793–802. [Google Scholar] [CrossRef] [PubMed]
  6. Bodin, T.; Albin, M.; Ardö, J.; Stroh, E.; Östergren, P.O.; Björk, J. Road traffic noise and hypertension: Results from a cross-sectional public health survey in southern Sweden. Environ. Health 2009, 8, 38. [Google Scholar] [CrossRef] [PubMed]
  7. Beutel, M.E.; Jünger, C.; Klein, E.M.; Wild, P.; Lackner, K.; Blettner, M.; Binder, H.; Michal, M.; Wiltink, J.; Brähler, E.; et al. Noise annoyance is associated with depression and anxiety in the general population—The contribution of aircraft noise. PLoS ONE 2016, 11, e0155357. [Google Scholar] [CrossRef] [PubMed]
  8. Belojevic, G.; Jakovljevic, B.; Slepcevic, V. Noise and mental performance: Personality attributes and noise sensitivity. Noise Health 2003, 6, 77–89. [Google Scholar] [PubMed]
  9. Saint-Gobain. Polska w Decybelach. Raport o Stanie Akustycznym Największych Aglomeracji w Polsce. Available online: https://oknonet.pl/polska-w-decybelach-raport-o-stanie-akustycznym-najwiekszych-aglomeracji-w-polsce/ (accessed on 3 February 2023).
  10. Jacyna, M.; Wasiak, M.; Lewczuk, K.; Karoń, G. Noise and environmental pollution from transport: Decisive problems in developing ecologically efficient transport systems. J. Vibroeng. 2017, 19, 5639–5655. [Google Scholar] [CrossRef]
  11. Beimer, W.; Maennig, W. Noise effects and real estate prices: A simultaneous analysis of different noise sources. Transp. Res. Part D Transp. Environ. 2017, 54, 282–286. [Google Scholar] [CrossRef]
  12. Swoboda, A.; Nega, T.; Timm, M. Hedonic analysis over time and space: The case of house prices and traffic noise. J. Reg. Sci. 2015, 55, 644–670. [Google Scholar] [CrossRef]
  13. Mann, S.; Singh, G. Traffic noise monitoring and modelling—An overview. Environ. Sci. Pollut. Res. 2022, 29, 55568–55579. [Google Scholar] [CrossRef] [PubMed]
  14. Levkovich, O.; Rouwendal, J.; van Marwijk, R. The effects of highway development on housing prices. Transportation 2016, 43, 379–405. [Google Scholar]
  15. Del Giudice, V.; De Paola, P.; Manganelli, B.; Forte, F. The monetary valuation of environmental externalities through the analysis of real estate prices. Sustainability 2017, 9, 229. [Google Scholar] [CrossRef]
  16. Cellmer, R. Spatial analysis of the effect of noise on the prices and value of residential real estates. Geomat. Environ. Eng. 2011, 5, 13–28. [Google Scholar]
  17. Szczepańska, A.; Senetra, A.; Wasilewicz-Pszczółkowska, M. The effect of road traffic noise on the prices of residential property—A case study of the Polish city of Olsztyn. Transp. Res. Part D Transp. Environ. 2015, 36, 167–177. [Google Scholar] [CrossRef]
  18. Szopińska, K.; Krajewska, M. Methods of assessing noise nuisance of real estate surroundings. Real Estate Manag. Valuat. 2016, 24, 19–30. [Google Scholar] [CrossRef]
  19. Brandt, S.; Maennig, W. Road noise exposure and residential property prices: Evidence from Hamburg. Transp. Res. Part D Transp. Environ. 2011, 16, 23–30. [Google Scholar] [CrossRef]
  20. Andersson, H.; Jonsson, L.; Ögren, M. Property prices and exposure to multiple noise sources: Hedonic regression with road and railway noise. Environ. Resour. Econ. 2010, 45, 73–89. [Google Scholar] [CrossRef]
  21. Murphy, E.; Douglas, O. Population exposure to road traffic noise: Experimental results from varying exposure estimation approaches. Transp. Res. Part D Transp. Environ. 2018, 58, 70–79. [Google Scholar] [CrossRef]
  22. Butryn, K.; Jasińska, E.; Kovalyshyn, O.; Preweda, E. Sustainable formation of urban development on the example of the primary real estate market in Krakow. In E3S Web of Conferences; EDP Sciences: Les Ulis, France, 2019; Volume 86, p. 00010. [Google Scholar]
  23. Rozporządzenie Ministra Środowiska w sprawie dopuszczalnych poziomów hałasu w środowisku. Dziennik Ustaw, 12 January 2014; poz. 112. Available online: https://isap.sejm.gov.pl/isap.nsf/download.xsp/WDU20140000112/O/D20140112.pdf (accessed on 3 February 2026).
  24. European Environment Agency. Environmental Noise in Europe—2025; Publications Office of the European Union: Luxembourg, 2025.
  25. World Health Organization. Environmental Noise Guidelines for the European Region; WHO Regional Office for Europe: Copenhagen, Denmark, 2018. [Google Scholar]
  26. European Commission. Pathway to a Healthy Planet for All. EU Action Plan: ‘Towards Zero Pollution for Air, Water and Soil’; COM(2021) 400 Final; European Commission: Brussels, Belgium, 2021.
  27. Rosen, S. Hedonic prices and implicit markets: Product differentiation in pure competition. J. Polit. Econ. 1974, 82, 34–55. [Google Scholar] [CrossRef] [PubMed]
  28. Nelson, J.P. Hedonic property value studies of transportation noise: Aircraft and road traffic. In Hedonic Methods in Housing Markets; Baranzini, A., Ramirez, J., Schaerer, C., Thalmann, P., Eds.; Springer: New York, NY, USA, 2008; pp. 57–82. [Google Scholar]
  29. Baranzini, A.; Ramirez, J.V. Paying for quietness: The impact of noise on Geneva rents. Urban Stud. 2005, 42, 633–646. [Google Scholar] [CrossRef]
  30. Kim, K.S.; Park, S.J.; Kweon, Y.-J. Highway traffic noise effects on land price in an urban area. Transp. Res. Part D Transp. Environ. 2007, 12, 275–280. [Google Scholar] [CrossRef]
  31. Le Boennec, R.; Salladarré, F. The impact of air pollution and noise on the real estate market. The case of the 2013 European Green Capital: Nantes, France. Ecol. Econ. 2017, 138, 82–89. [Google Scholar] [CrossRef]
  32. Morano, P.; Tajani, F.; Di Liddo, F.; Darò, M. Economic evaluation of the indoor environmental quality of buildings: The noise pollution effects on housing prices in the city of Bari (Italy). Buildings 2021, 11, 213. [Google Scholar] [CrossRef]
  33. Tsao, H.-C.; Lu, C.-J. Assessing the impact of aviation noise on housing prices using new estimated noise value: The case of Taiwan Taoyuan International Airport. Sustainability 2022, 14, 1713. [Google Scholar] [CrossRef]
  34. Trojanek, R.; Huderek-Glapska, S. Measuring the noise cost of aviation—The association between the Limited Use Area around Warsaw Chopin Airport and property values. J. Air Transp. Manag. 2018, 67, 103–114. [Google Scholar] [CrossRef]
  35. Mense, A.; Kholodilin, K.A. Noise expectations and house prices: The reaction of property prices to an airport expansion. Ann. Reg. Sci. 2014, 52, 763–797. [Google Scholar] [CrossRef]
  36. Kamtziridis, G.; Vrakas, D.; Tsoumakas, G. Does noise affect housing prices? A case study in the urban area of Thessaloniki. arXiv 2023, arXiv:2302.13034. [Google Scholar]
  37. Anselin, L.; Rey, S. Properties of tests for spatial dependence in linear regression models. Geogr. Anal. 1991, 23, 112–131. [Google Scholar] [CrossRef]
  38. Jasińska, E.; Preweda, E. Statistical modelling of the market value of dwellings, on the example of the city of Kraków. Sustainability 2021, 13, 9339. [Google Scholar] [CrossRef]
  39. Kraków w Liczbach—Kraków in Numbers. Available online: https://strategia.krakow.pl/bank_informacji_o_miescie_i_metropolii/253604,artykul,krakow_w_liczbach___krakow_in_numbers.html (accessed on 3 February 2023).
  40. Kraków Airport—About the Airport. Available online: https://www.krakowairport.pl/en/company/airport/about-airport/about/information/ (accessed on 3 February 2023).
  41. Narodowy Bank Polski. Rynek Nieruchomości—Raporty i Analizy. Available online: https://www.nbp.pl/home.aspx?f=/publikacje/rynek_nieruchomosci/index2.html (accessed on 3 February 2023).
  42. Ceny Mieszkań w Polsce—Rynek Pierwotny i Wtórny. Available online: https://podkluczyk.pl/ceny-mieszkan-w-polsce-rynek-pierwotny-i-wtorny-listopad-2021/ (accessed on 3 February 2023).
  43. Narodowy Bank Polski. Informacja o Cenach Mieszkań i Sytuacji na Rynku Nieruchomości Mieszkaniowych w Polsce w I Kwartale 2026 r. Available online: https://nbp.pl (accessed on 7 July 2026).
  44. Sprzedaż Mieszkań Spadła o 47 Proc. Kraków Nasze Miasto. Available online: https://krakow.naszemiasto.pl/sprzedaz-mieszkan-spadla-o-47-proc-to-byl-dla-deweloperow/ar/c9-8856655 (accessed on 3 February 2023).
  45. Trojanek, R.; Gluszak, M. Short-run impact of the Ukrainian refugee crisis on the housing market in Poland. Financ. Res. Lett. 2022, 50, 103236. [Google Scholar] [CrossRef]
  46. Główny Urząd Geodezji i Kartografii. Usługa Geokodowania CAPAP. Available online: https://www.gov.pl/web/gugik (accessed on 3 February 2023).
  47. GIS Support. Granice Administracyjne—Dane Do Pobrania. Available online: https://gis-support.pl/baza-wiedzy-2/dane-do-pobrania/granice-administracyjne/ (accessed on 3 February 2023).
  48. Miejski System Informacji Przestrzennej Krakowa. Obserwatorium—Mapa akustyczna Krakowa. 2017. Available online: https://msip.krakow.pl (accessed on 20 July 2026).
  49. Hawkins, D.M. Identification of Outliers; Chapman and Hall: London, UK, 1980. [Google Scholar]
  50. Cook, R.D. Detection of influential observations in linear regression. Technometrics 1977, 19, 15–18. [Google Scholar] [CrossRef] [PubMed]
  51. Preweda, E. Outlier detection in surveying networks. In Proceedings of the 14th International Multidisciplinary Scientific GeoConference (SGEM 2014), Albena, Bulgaria, 17–26 June 2014; Book 2. Volume 2, pp. 365–372. [Google Scholar]
  52. Kannan, K.S.; Manoj, K. Outlier detection in multivariate data. Appl. Math. Sci. 2015, 9, 2317–2324. [Google Scholar] [CrossRef]
  53. Wang, A.; Xu, Y. Multiple linear regression analysis of real estate price. In Proceedings of the International Conference on Robots & Intelligent System (ICRIS), Changsha, China, 26–27 May 2018; pp. 564–568. [Google Scholar]
  54. Moran, P.A.P. Notes on continuous stochastic phenomena. Biometrika 1950, 37, 17–23. [Google Scholar] [CrossRef]
Figure 1. Noise immission maps for Kraków: (a) road noise; (b) tram noise in the city centre area; (c) road, railway, and industrial noise. Own elaboration based on the acoustic maps from the MSIP Obserwatorium portal. The source maps are public municipal data of the City of Kraków [48], drawn up under Directive 2002/49/EC [2]. The black bands visible in panels (b,c) are the isophone lines of the source maps, drawn at 5 dB intervals; they merge visually wherever the sound level changes steeply and do not represent a separate noise class.
Sustainability 18 08029 g001
Figure 2. Primary market: Mean modulus of residuals.
Sustainability 18 08029 g002
Figure 3. Secondary market: Mean modulus of residuals.
Sustainability 18 08029 g003
Figure 4. NSDI estimates with 95% confidence intervals by market segment, outlier elimination threshold, and robust regression on the full samples (semi-logarithmic models; filled markers denote estimates significant at the 5% level). Own elaboration based on Table 6.
Sustainability 18 08029 g004
Table 1. Description of the market attributes of the apartments (own elaboration).
Attribute NameDescriptionAttribute Scale
TimeTime expressed in months from the transaction date to the date of the analysesExpressed in months
LocationProperty located within 2.5 km of the centre of Kraków, conventionally taken as the Main Market Squarevery good (2)
Property located between 2.5 and 5 km from the centre of Kraków, conventionally taken as the Main Market Squaregood (1)
Property located more than 5 km from the centre of Kraków, conventionally taken as the Main Market Squareaverage (0)
Transport accessA bus or tram stop within 150 mvery good (2)
A bus or tram stop within 150 to 300 mgood (1)
Bus or tram stop more than 300 m awaypoor (0)
Noise exposureBelow 50 dBvery good (2)
50–68 dBgood (1)
Above 68 dBpoor (0)
Number of roomsNumber of rooms comprising the dwellingExpressed as the number of rooms
FloorFloor on which the dwelling is locatedExpressed as the floor number
Floor areaTotal floor area of the dwelling expressed in m2Expressed in m2
MarketPrimary market0
Secondary market1
Table 2. Descriptive statistics of the continuous variables by market segment: primary market (n = 2986) and secondary market (n = 3258); transactions from January 2021–June 2022, prices scaled to the Q1 2026 level (own elaboration). The number of rooms follows the definition of a room (izba) used in the Polish register, which also counts the kitchen; negative floor values denote below-ground storeys.
VariableMarketMeanMedianSDMinMax
Price [PLN/m2]primary15,384.014,752.44253.55241.353,091.4
secondary15,110.014,456.94229.21267.046,249.7
Floor area [m2]primary53.249.319.814.0152.4
secondary50.147.220.313.5229.6
Number of roomsprimary2.73.01.018
secondary2.73.01.018
Floorprimary3.43.02.2−115
secondary3.13.02.4−117
Time [months]primary14.415.02.0617
secondary13.313.02.5617
Table 3. Regression model parameters: Primary and secondary markets jointly.
AttributebSE(b)tpb*Partial r
Intercept18,594.43117.10158.80<0.001
Time−267.106.07−44.04<0.001−0.32−0.69
Market (secondary)−1465.7927.90−52.54<0.001−0.40−0.75
Floor6.085.301.150.2510.010.02
Number of rooms−250.0020.57−12.16<0.001−0.14−0.26
Floor area−19.711.11−17.77<0.001−0.20−0.36
Location2251.5820.88107.82<0.0010.830.92
Transport access−118.5418.50−6.41<0.001−0.05−0.14
Noise263.0726.339.99<0.0010.080.21
Table 4. Regression model parameters: Primary market.
AttributebSE(b)tpb*Partial r
Intercept18,712.93181.83102.92<0.001
Time−380.549.52−39.97<0.001−0.37−0.75
Floor66.037.249.11<0.0010.080.25
Number of rooms288.7731.609.14<0.0010.150.25
Floor area−31.691.73−18.31<0.001−0.31−0.46
Location2723.5134.6678.58<0.0010.830.91
Transport access−191.9525.49−7.53<0.001−0.08−0.21
Noise369.8539.649.33<0.0010.100.26
Table 5. Regression model parameters: Secondary market.
AttributebSE(b)tpb*Partial r
Intercept19,070.10139.01137.18<0.001
Time−154.807.41−20.89<0.001−0.19−0.52
Floor50.337.047.15<0.0010.070.20
Number of rooms−1300.6525.63−50.74<0.001−0.64−0.83
Floor area−3.121.37−2.280.023−0.03−0.07
Location1770.0725.8368.52<0.0010.660.89
Transport access−527.6327.46−19.22<0.001−0.19−0.49
Noise3.1934.630.090.9270.000.00
Table 6. Semi-logarithmic models: NSDI by market segment and outlier elimination threshold, robust regression estimates, and diagnostics: maximum VIF and Moran’s I for the residuals with the street adjacency matrix (own elaboration).
SamplenR2NSDI [%/dB]95% CI NSDIp (NSDI)VIF MaxMoran’s I (p)
Joint, full62440.330.058−0.017–0.1320.132.530.399 (0.001)
Joint, R2 = 0.7534510.730.0970.061–0.132<0.0012.510.203 (0.001)
Joint, R2 = 0.8031130.780.1000.066–0.133<0.0012.510.180 (0.001)
Joint, final (p = 0.90)21300.890.1320.105–0.158<0.0012.540.123 (0.001)
Joint, Huber (full)62440.016−0.046–0.0770.62
Primary, full29860.43−0.025−0.129–0.0790.643.440.592 (0.001)
Primary, R2 = 0.7518560.740.033−0.021–0.0870.233.270.325 (0.001)
Primary, R2 = 0.8016620.800.1040.055–0.153<0.0013.300.284 (0.001)
Primary, final (p = 0.90)12300.900.1740.134–0.213<0.0013.420.179 (0.001)
Primary, Huber (full)2986−0.011−0.100–0.0780.80
Secondary, full32580.280.003−0.100–0.1070.952.100.248 (0.001)
Secondary, R2 = 0.7518370.740.0830.037–0.130<0.0011.930.045 (0.016)
Secondary, R2 = 0.8016420.790.1180.075–0.161<0.0011.920.063 (0.006)
Secondary, final (p = 0.90)11930.890.008−0.028–0.0450.651.890.030 (0.300)
Secondary, Huber (full)3258−0.033−0.117–0.0510.44
Table 7. The effect of transport noise on property values in selected cities (own elaboration based on the cited literature). Results expressed in %/dB (NSDI) and as elasticities (% of price per 1% increase in the noise level) are not directly comparable.
City (Country)Object of StudyNoise MeasureMethodMain ResultSource
Hamburg (Germany)dwellingssound level in dBhedonic regressiondiscount of about 0.23% of the price per 1 dB[19]
Geneva (Switzerland)rentstotal noise levelhedonic regressionrent decrease of about 0.7% per 1% increase in noise[29]
Seoul (Republic of Korea)land pricesroad noisehedonic regressionprice decrease of about 1.3% per 1% increase in noise[30]
Olsztyn (Poland)dwellings, secondary marketdB from the acoustic mapNSDI, correlations, krigingnegative relationship between prices and noise level[17]
Bari (Italy)dwellingsroad noiseeconometric modelsnegative effect of noise on apartment prices[32]
Thessaloniki (Greece)dwellingsnoise mapsgradient boosting, model interpretabilityeffect dependent on the district: negative outside the centre, positive in the commercial zone[36]
Warsaw (Poland)dwellingsaircraft noise (Limited Use Area)hedonic regressionsignificantly lower prices of dwellings within the zone around Chopin Airport[34]
Kraków (this study)dwellings, primary and secondary marketsordinal scale from acoustic mapsmultiple and semi-logarithmic regressionNSDI of 0.17% per 1 dB in the primary market (maximum in the intermediate zone, disappearing in the centre), effect not identified in the secondary marketthis study
Disclaimer/Publisher’s Note: The statements, opinions and data contained in all publications are solely those of the individual author(s) and contributor(s) and not of MDPI and/or the editor(s). MDPI and/or the editor(s) disclaim responsibility for any injury to people or property resulting from any ideas, methods, instructions or products referred to in the content.