_Li.png)
The Spatio-Temporal Dynamic Mechanism of Multidimensional Population on Both Sides of the Hu Line in China Under Climate Change


Abstract
1. Introduction
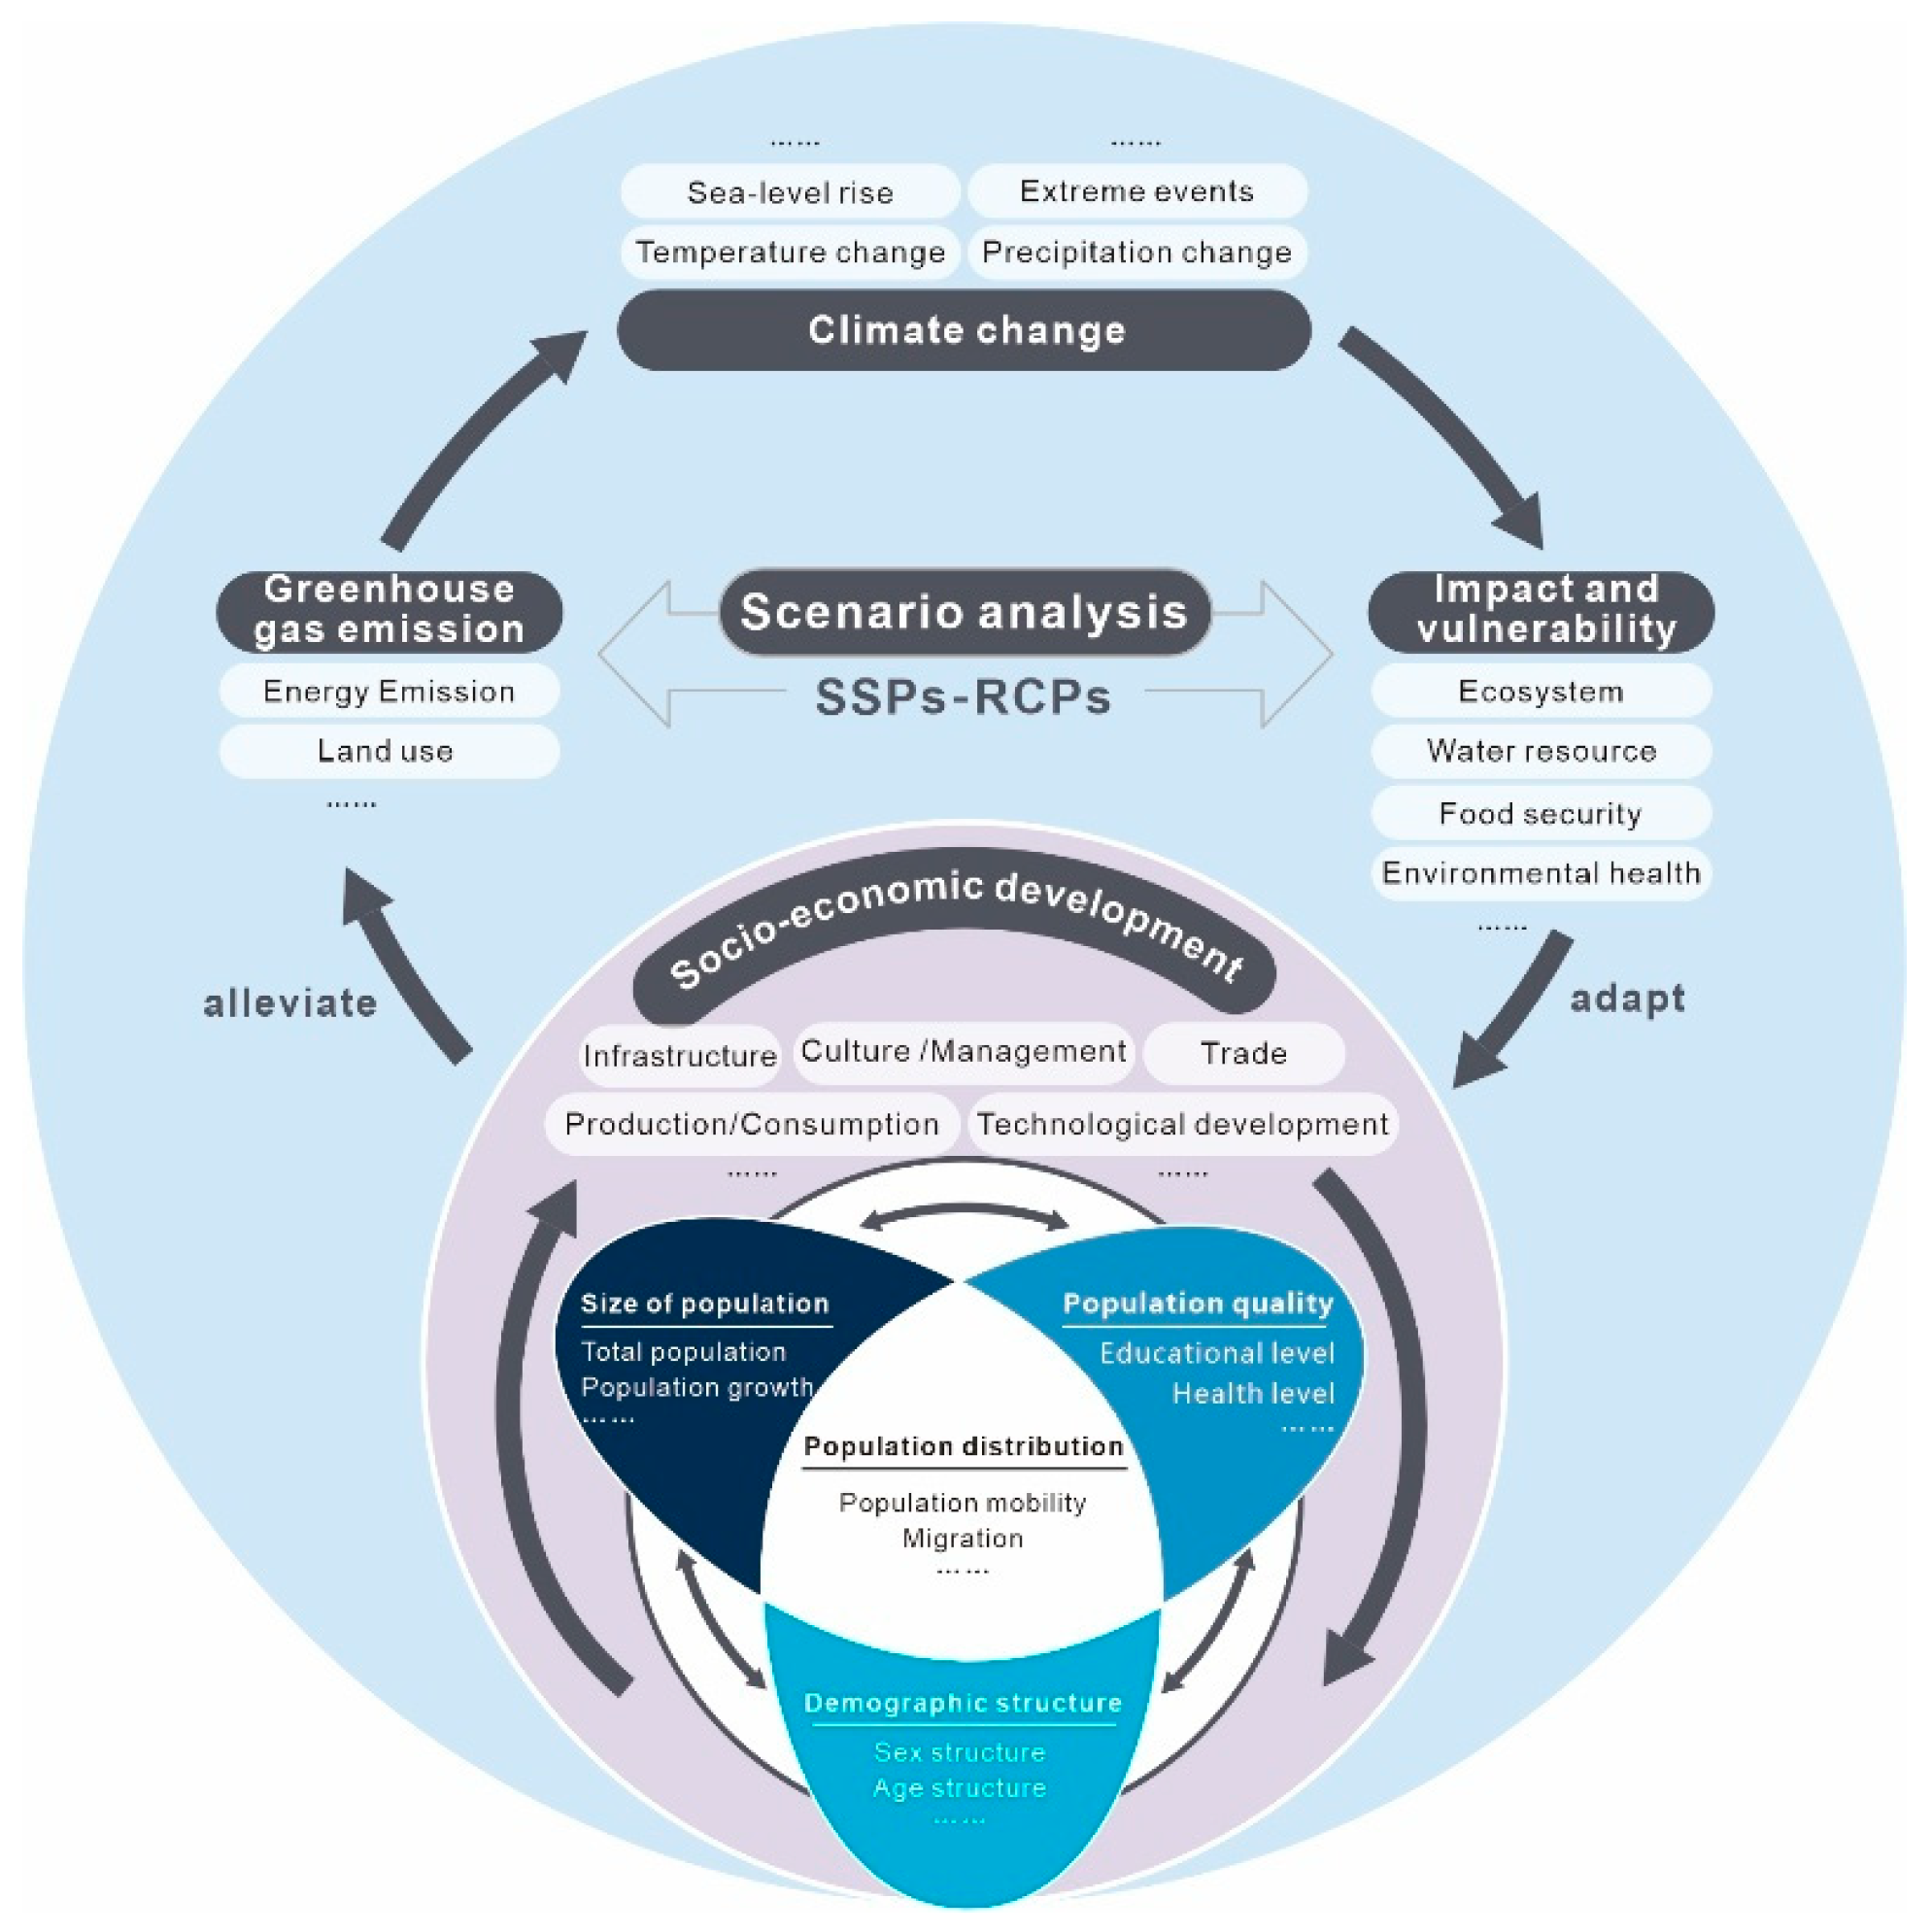
2. The Driving Mechanisms Behind the Breakthrough of the Hu Line from a Multidimensional Population Perspective
3. Comparative Analysis of Multidimensional Demographic Characteristics on Both Sides of the Hu Line
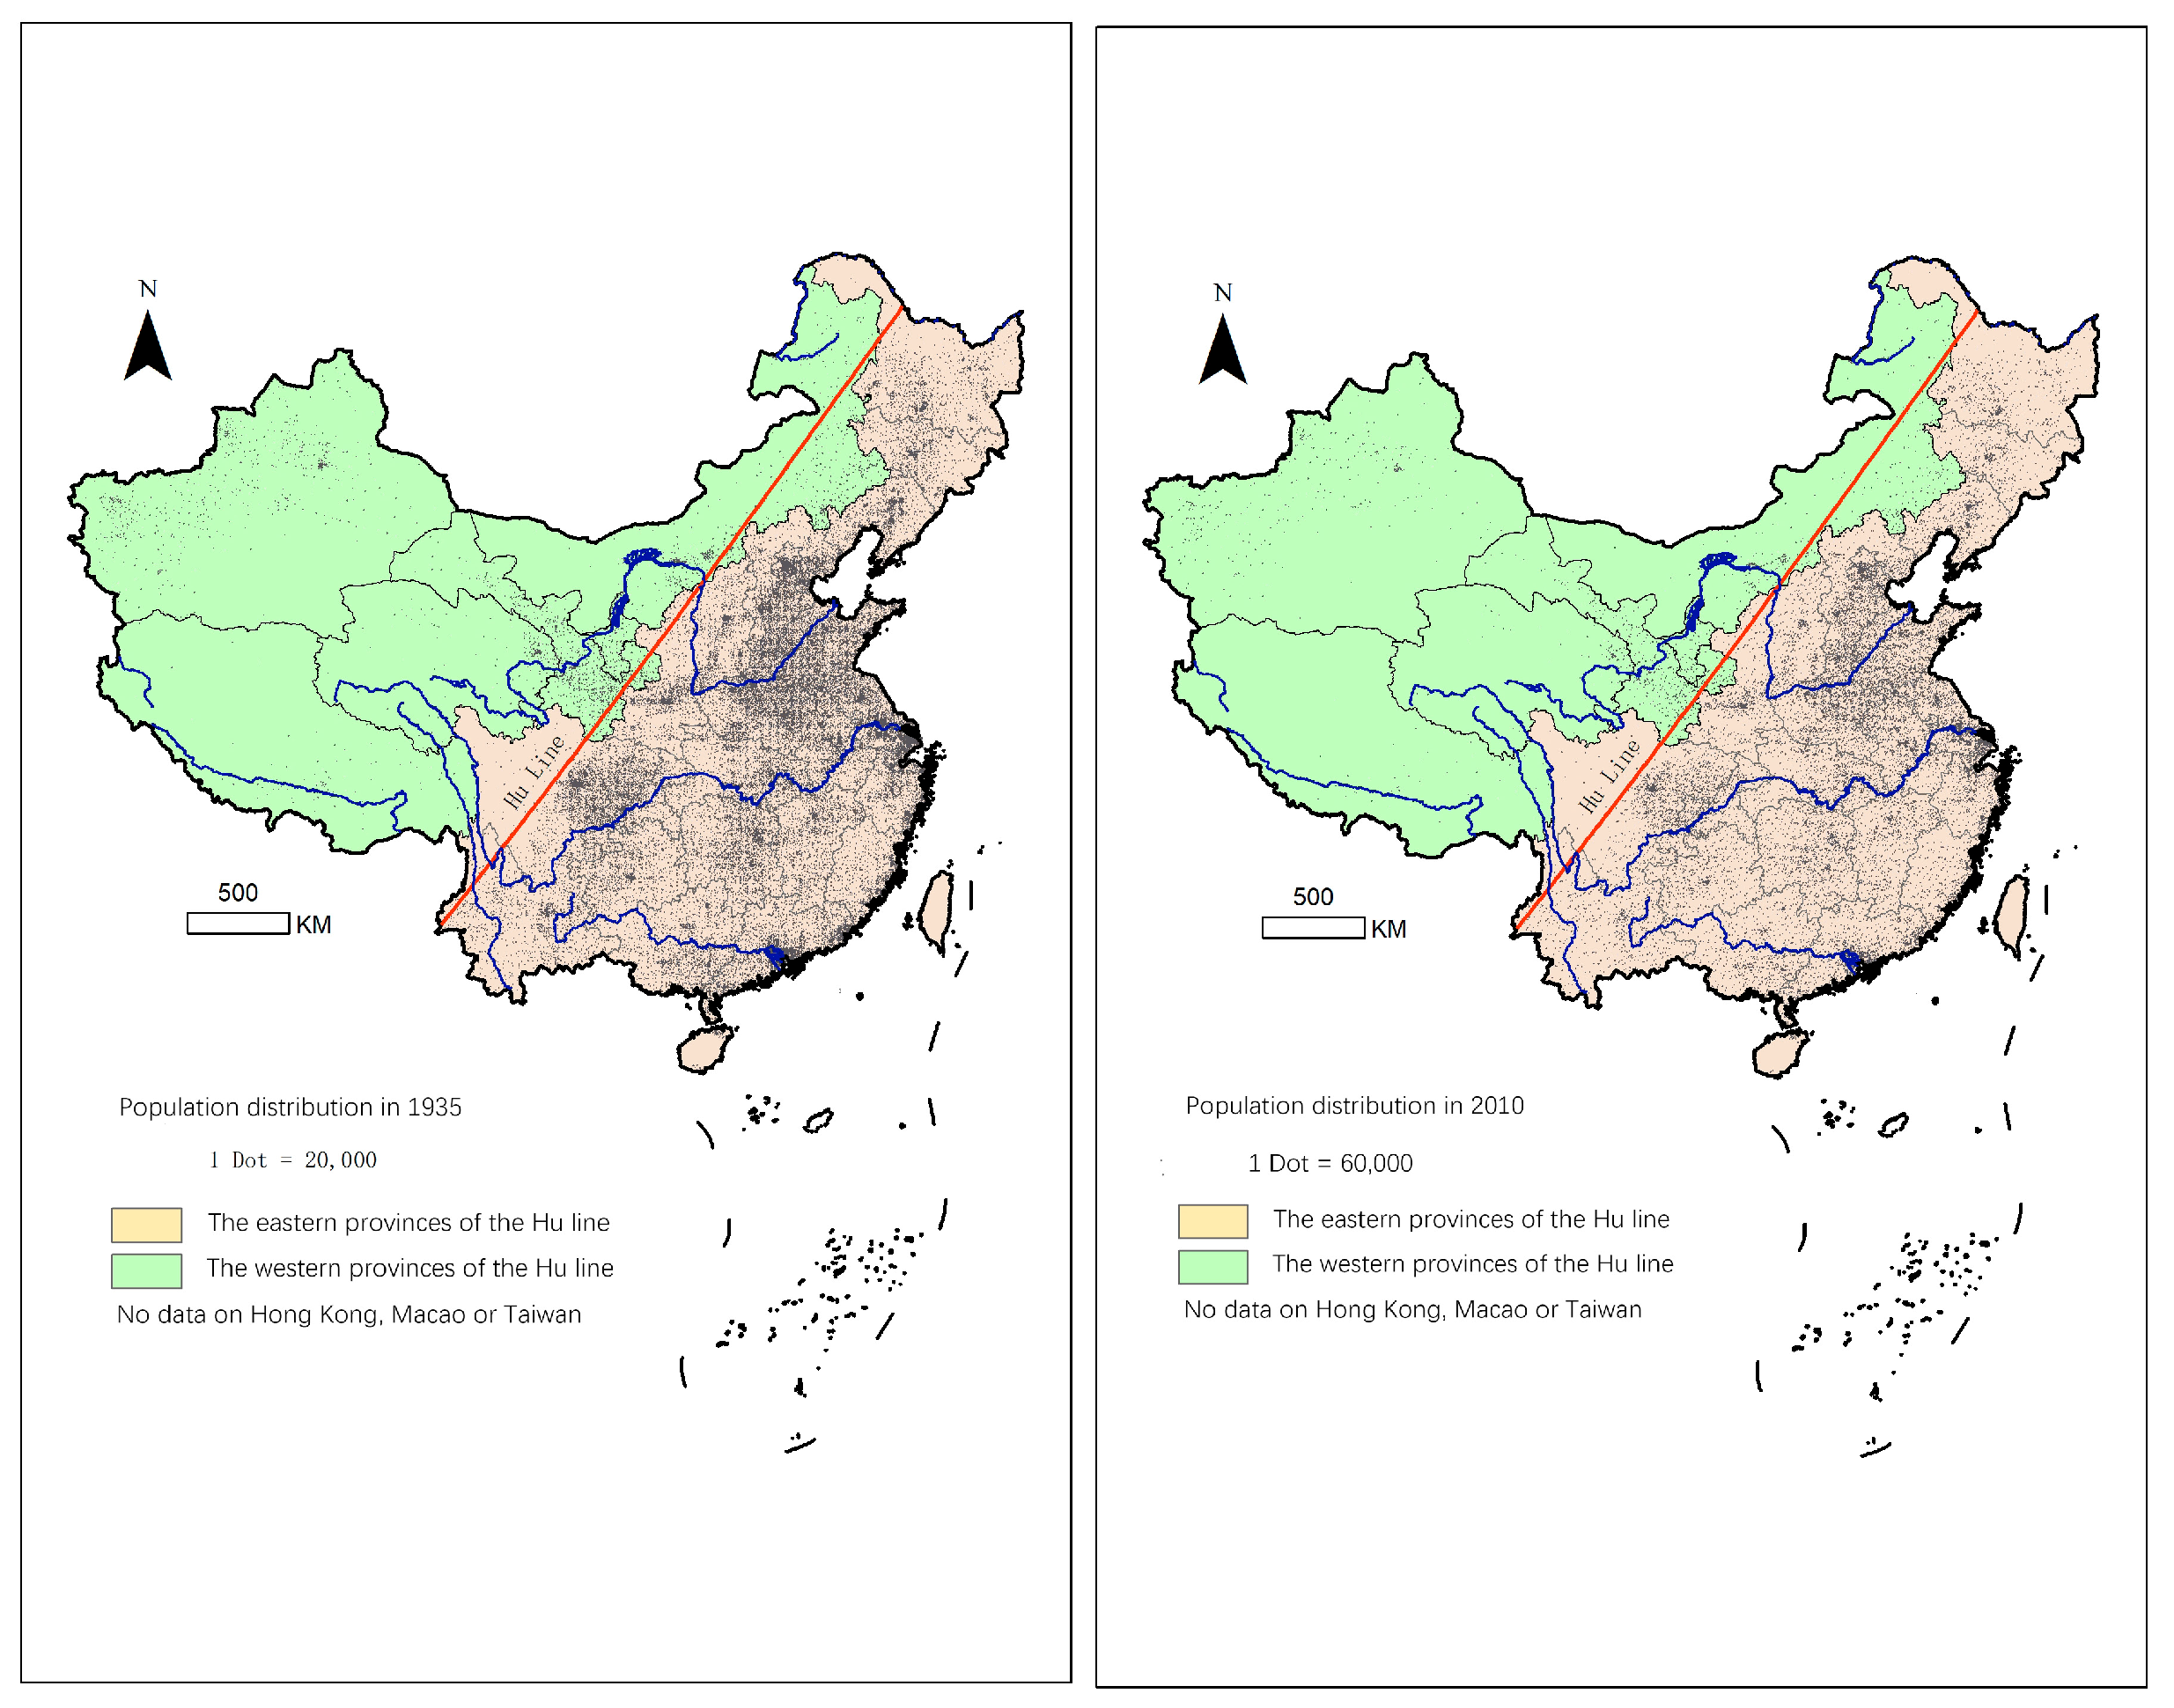
3.1. Population Distribution on Both Sides of the Hu Line
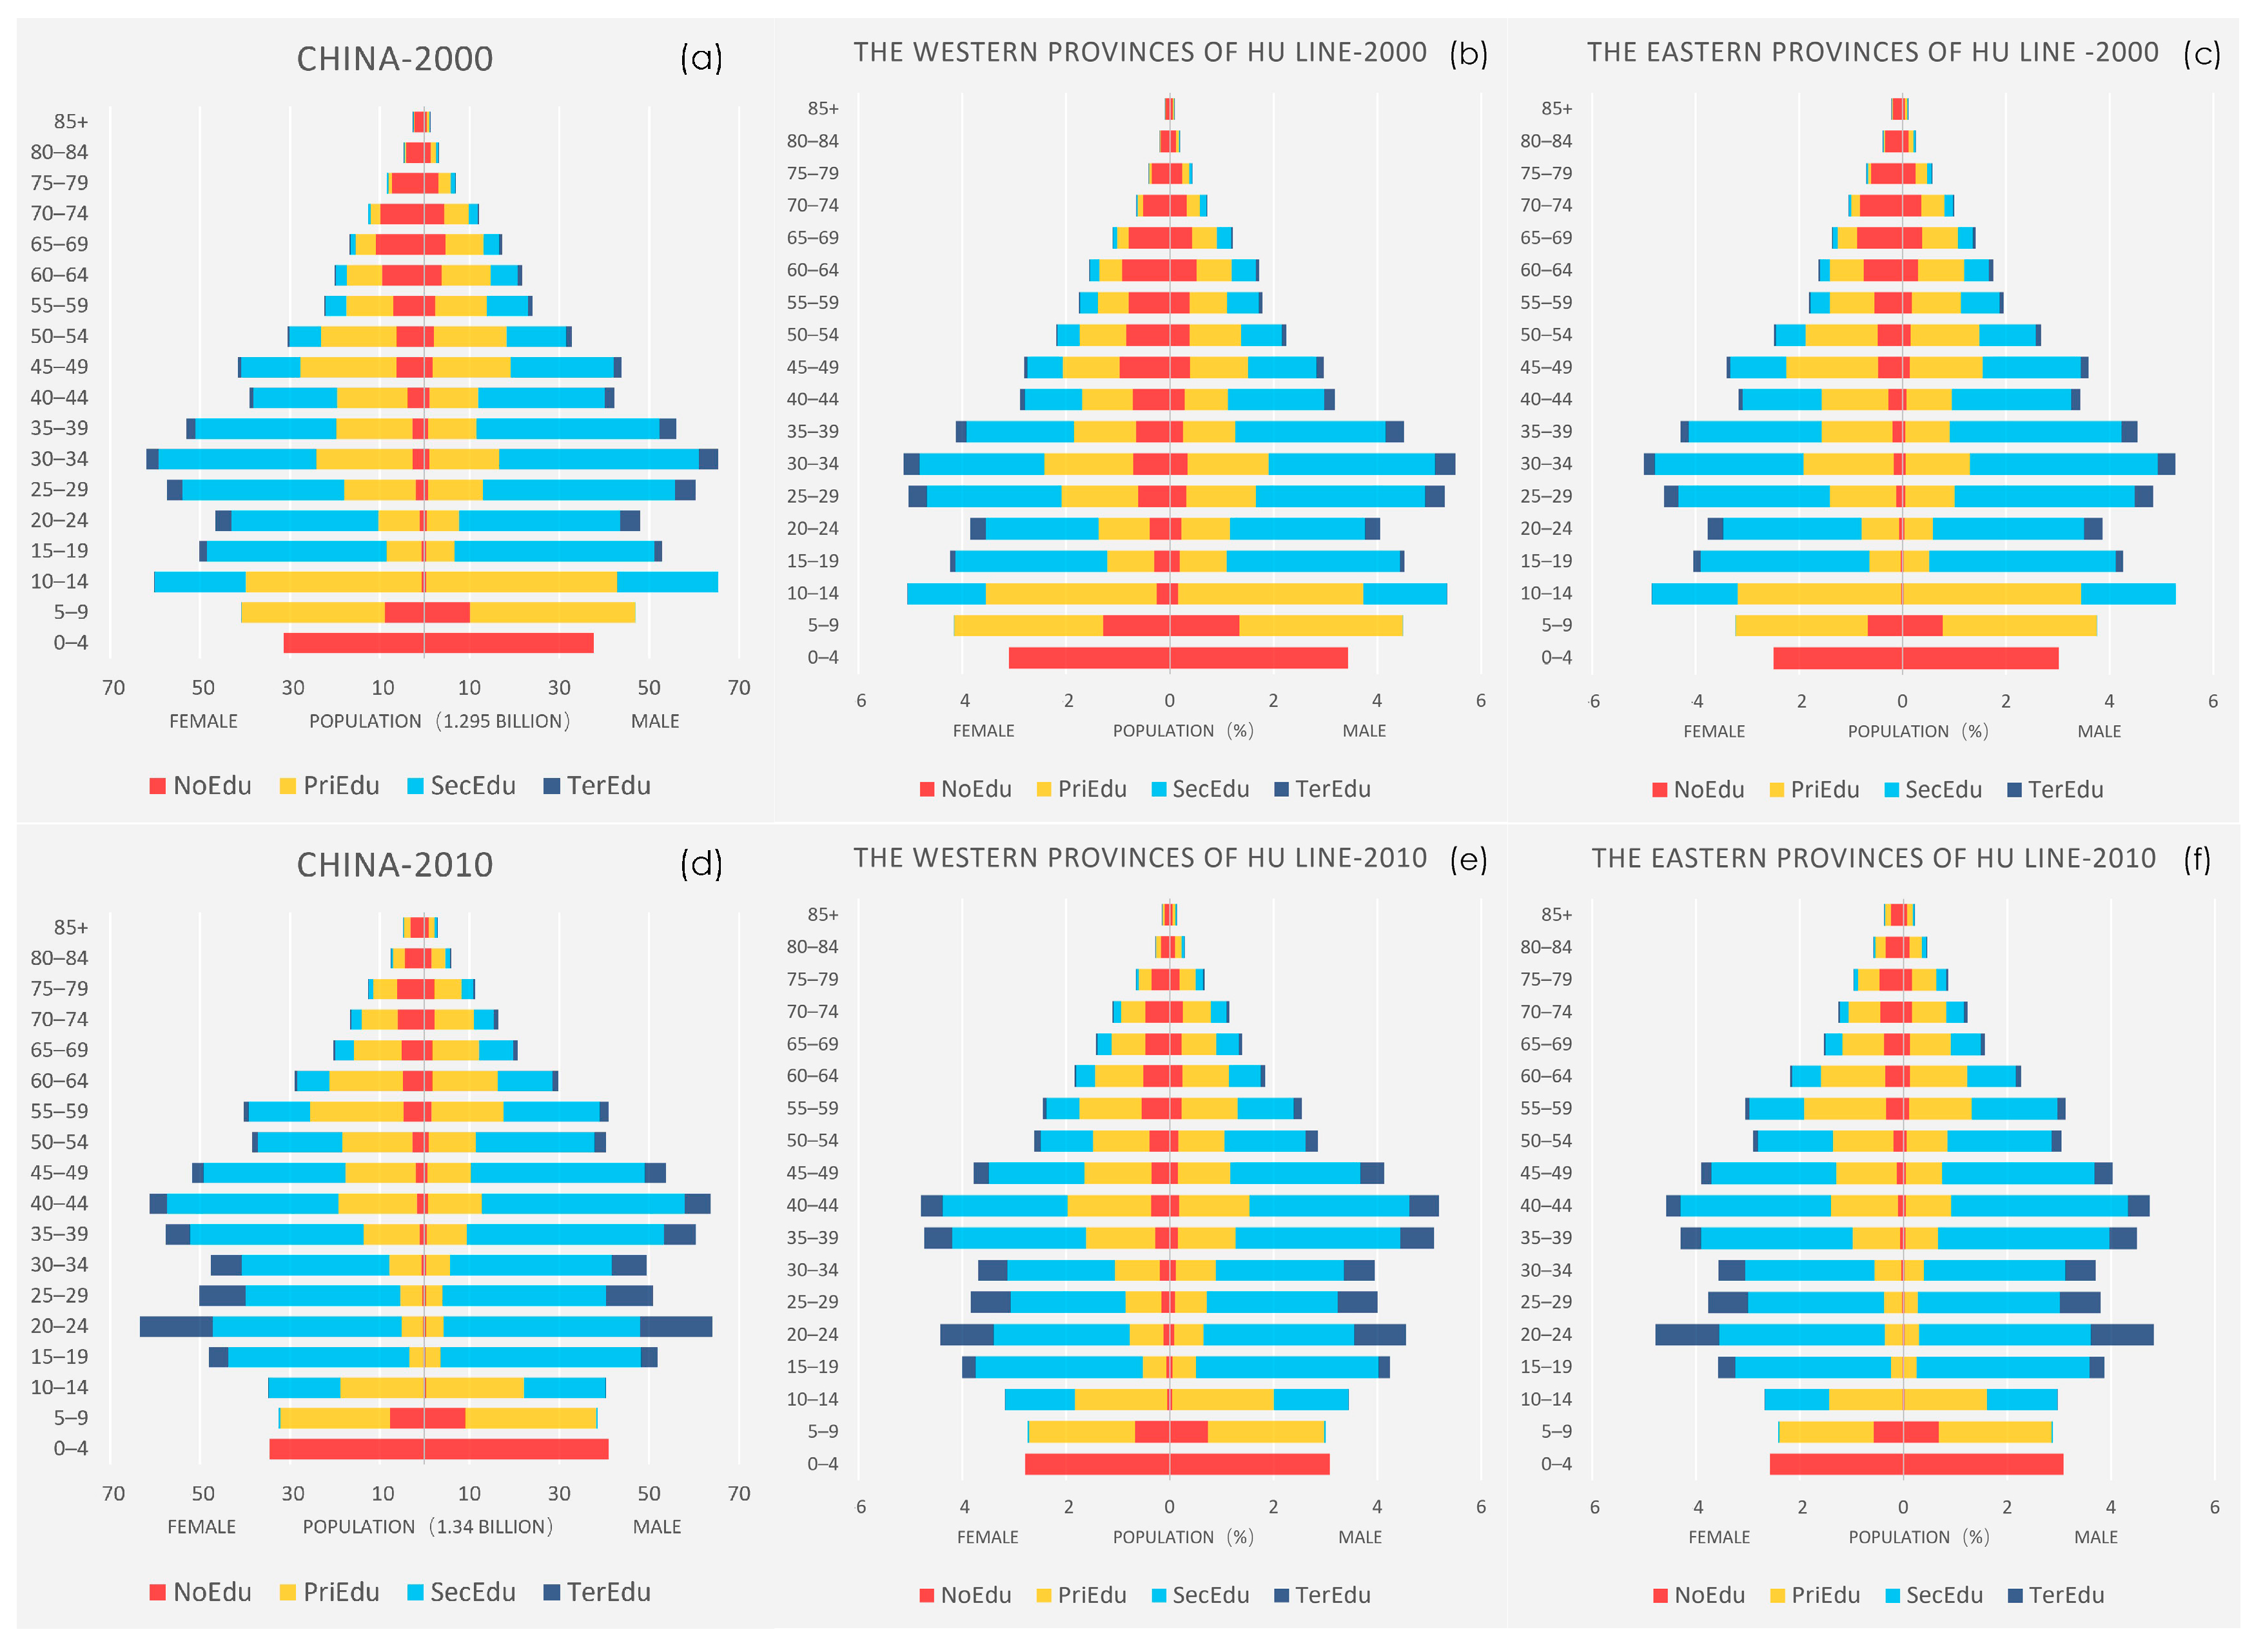
3.2. Population Structure on Both Sides of the Hu Line
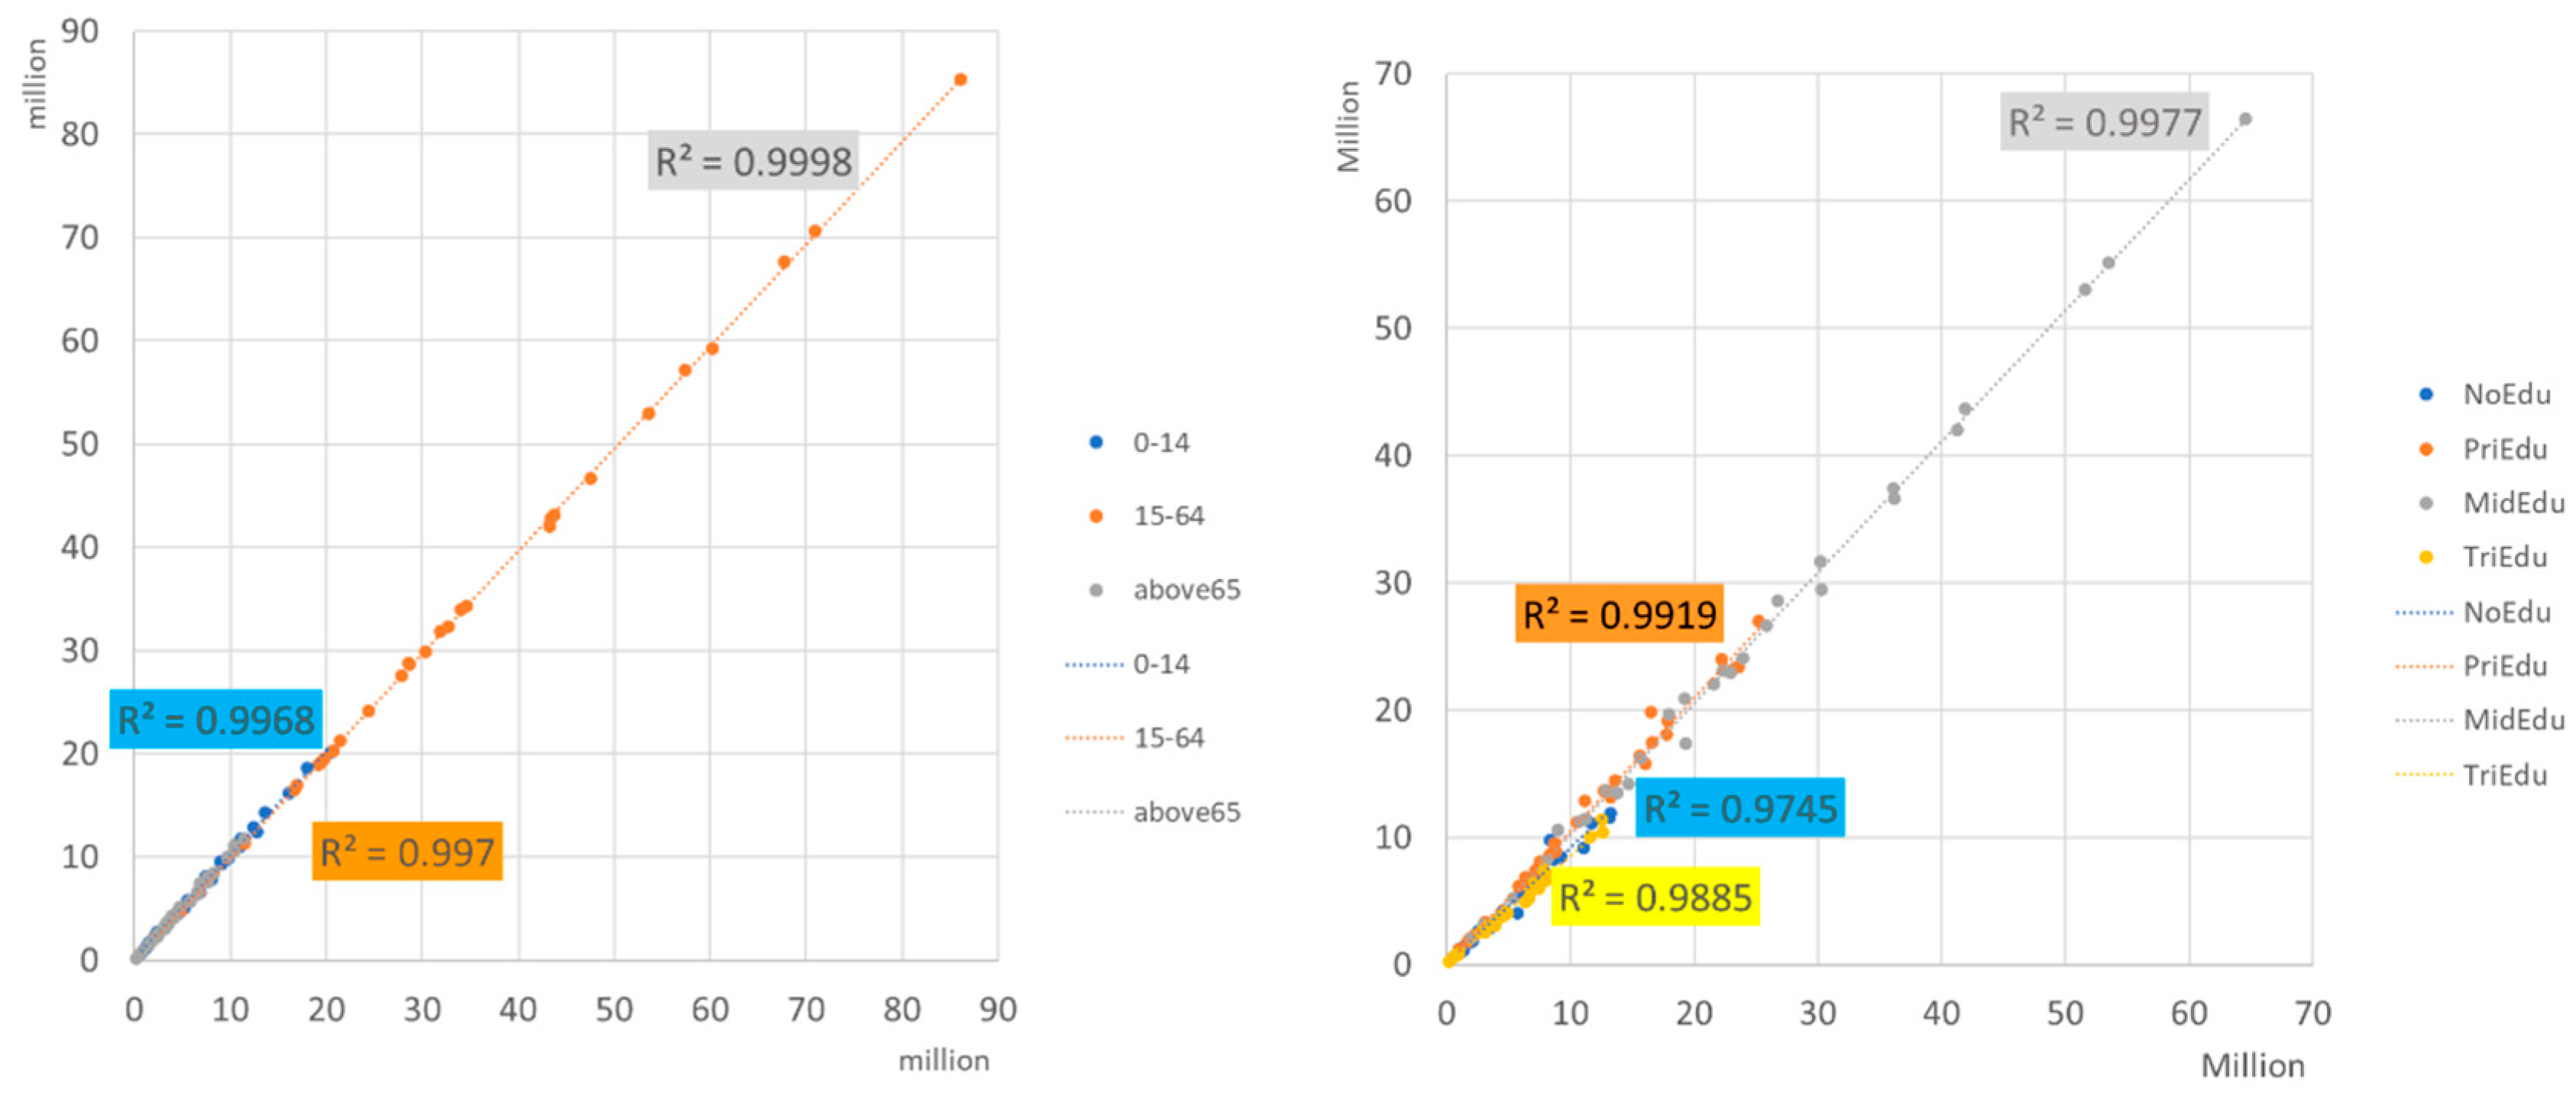
3.3. Multidimensional Variations in Population Proportions on Both Sides of the Hu Line
4. Future Trends in Multidimensional Demographic Characteristics on Both Sides of the Hu Line
4.1. The Approach of the Multidimensional Demographic Model
- No education: those who have never been to school and have received no formal education (no education);
- Primary: those with uncompleted primary to uncompleted lower secondary education (completed primary);
- Secondary: those with completed lower secondary to uncompleted first level of tertiary education (completed lower secondary, completed upper secondary or completed post-secondary, non-tertiary);
- Tertiary: those who at least completed the first level of tertiary (tertiary completed).
- Step 1: Find reliable empirical information on the proportions of population by levels of educational attainment for men and women for five-year age groups for the base year (around 2000).
- Step 2: Adjust the educational categories.
- Step 3: Apply the empirical proportions to the age structure for the year 2000.
- Step 4: Obtain the period life expectancy at age 15 for all men and women from the general model life table as used for the corresponding country for the period 1995–2000.
- Step 5: Calculate the corresponding education-specific period life expectancy at age 15 by using education differentials in life expectancy as described in Section 4.3.
- Step 6: Obtain survival ratios for all five-year age groups above age 15 corresponding to each education–sex-specific period life expectancy at age 15.
- Step 7: Calculate the number of people N (age,educ,sex,1995) by age (age going from 15–19 to 80–85), sex and education living five years earlier (in 1995) by using Equation (1) above.
- Step 8: Adjust for the transitions to secondary and tertiary education that happen after the age of 15.
- Step 9: Convert the number of people by age and education calculated for 1995 (t − 5) into age and sex-specific proportions and apply to the estimates of population structure for this year in order to assure full consistency (including adjustments for migration).
4.2. The Prediction of China’s Total Population in the Future
4.3. Comparative Analysis of Population Scenarios Across Three Versions of China’s SSPs
4.3.1. IIASA Version of China’s SSPs Population Scenarios
4.3.2. NUIST Version of China’s SSP Population Scenarios
4.3.3. Tsinghua Version of China’s SSP Population Scenarios
4.3.4. Summary Across Three Versions of China’s SSPs
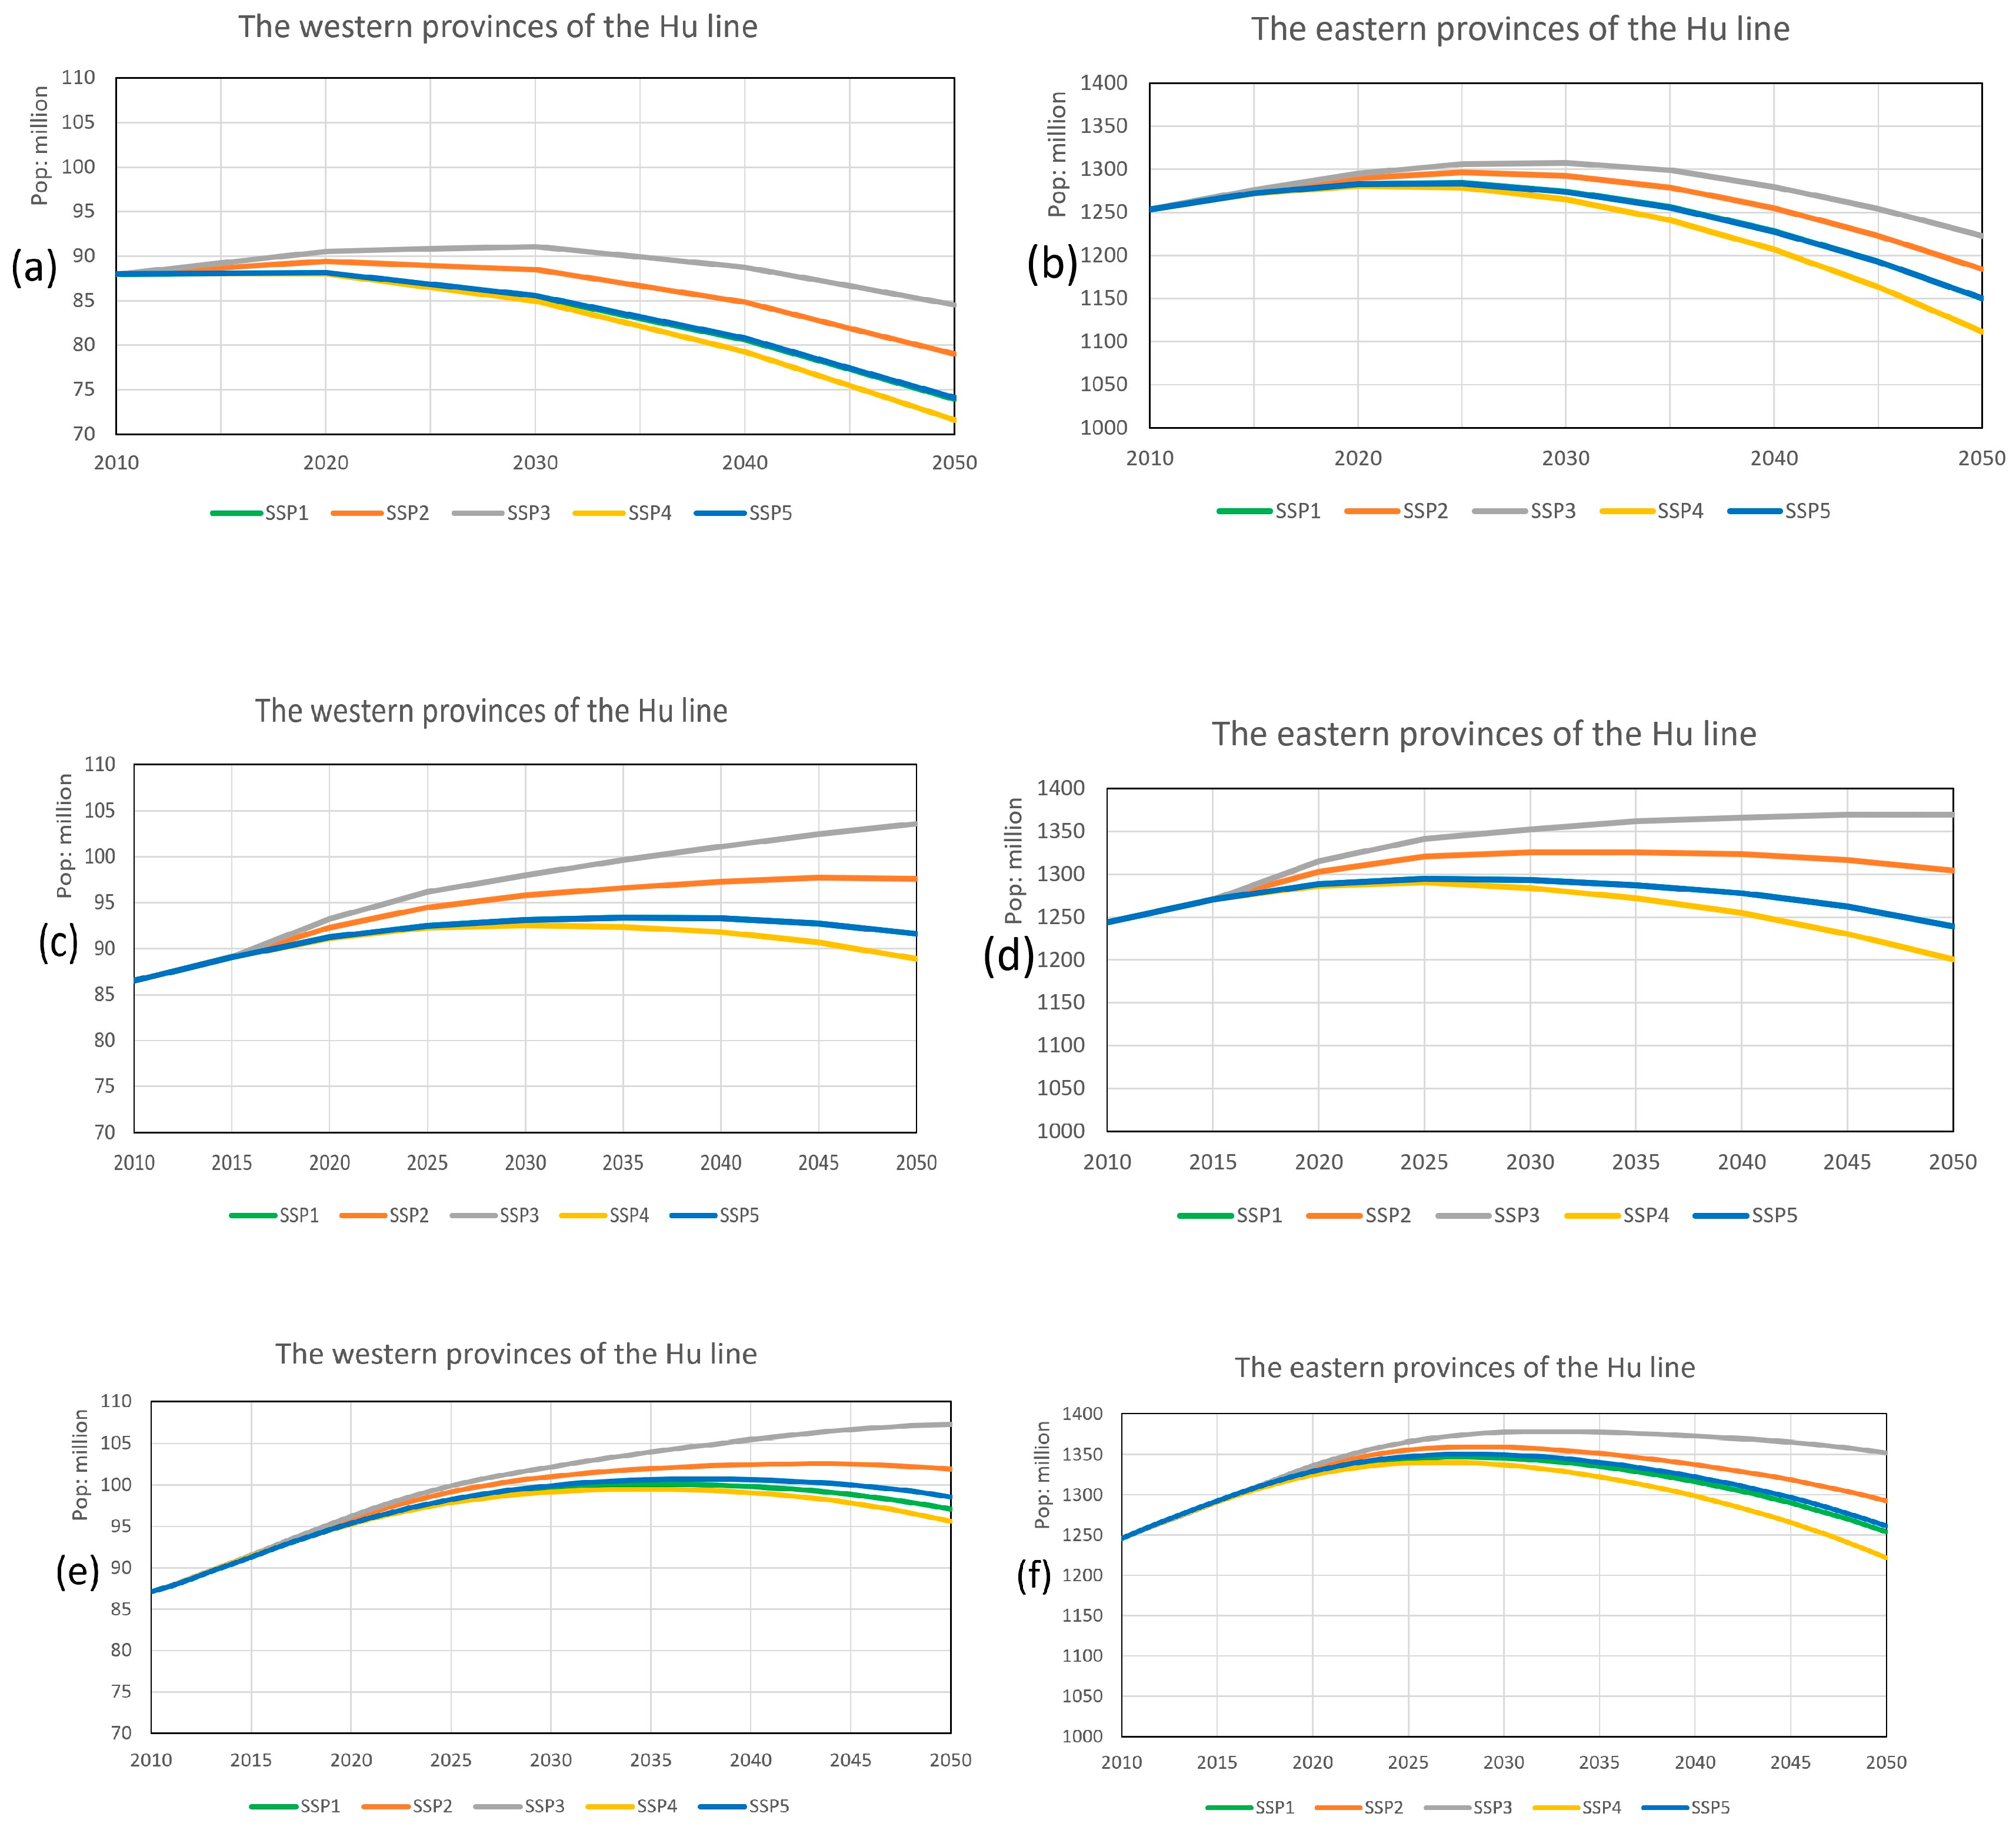
4.4. Future Population Size and Proportion Changes on Both Sides of the Hu Line
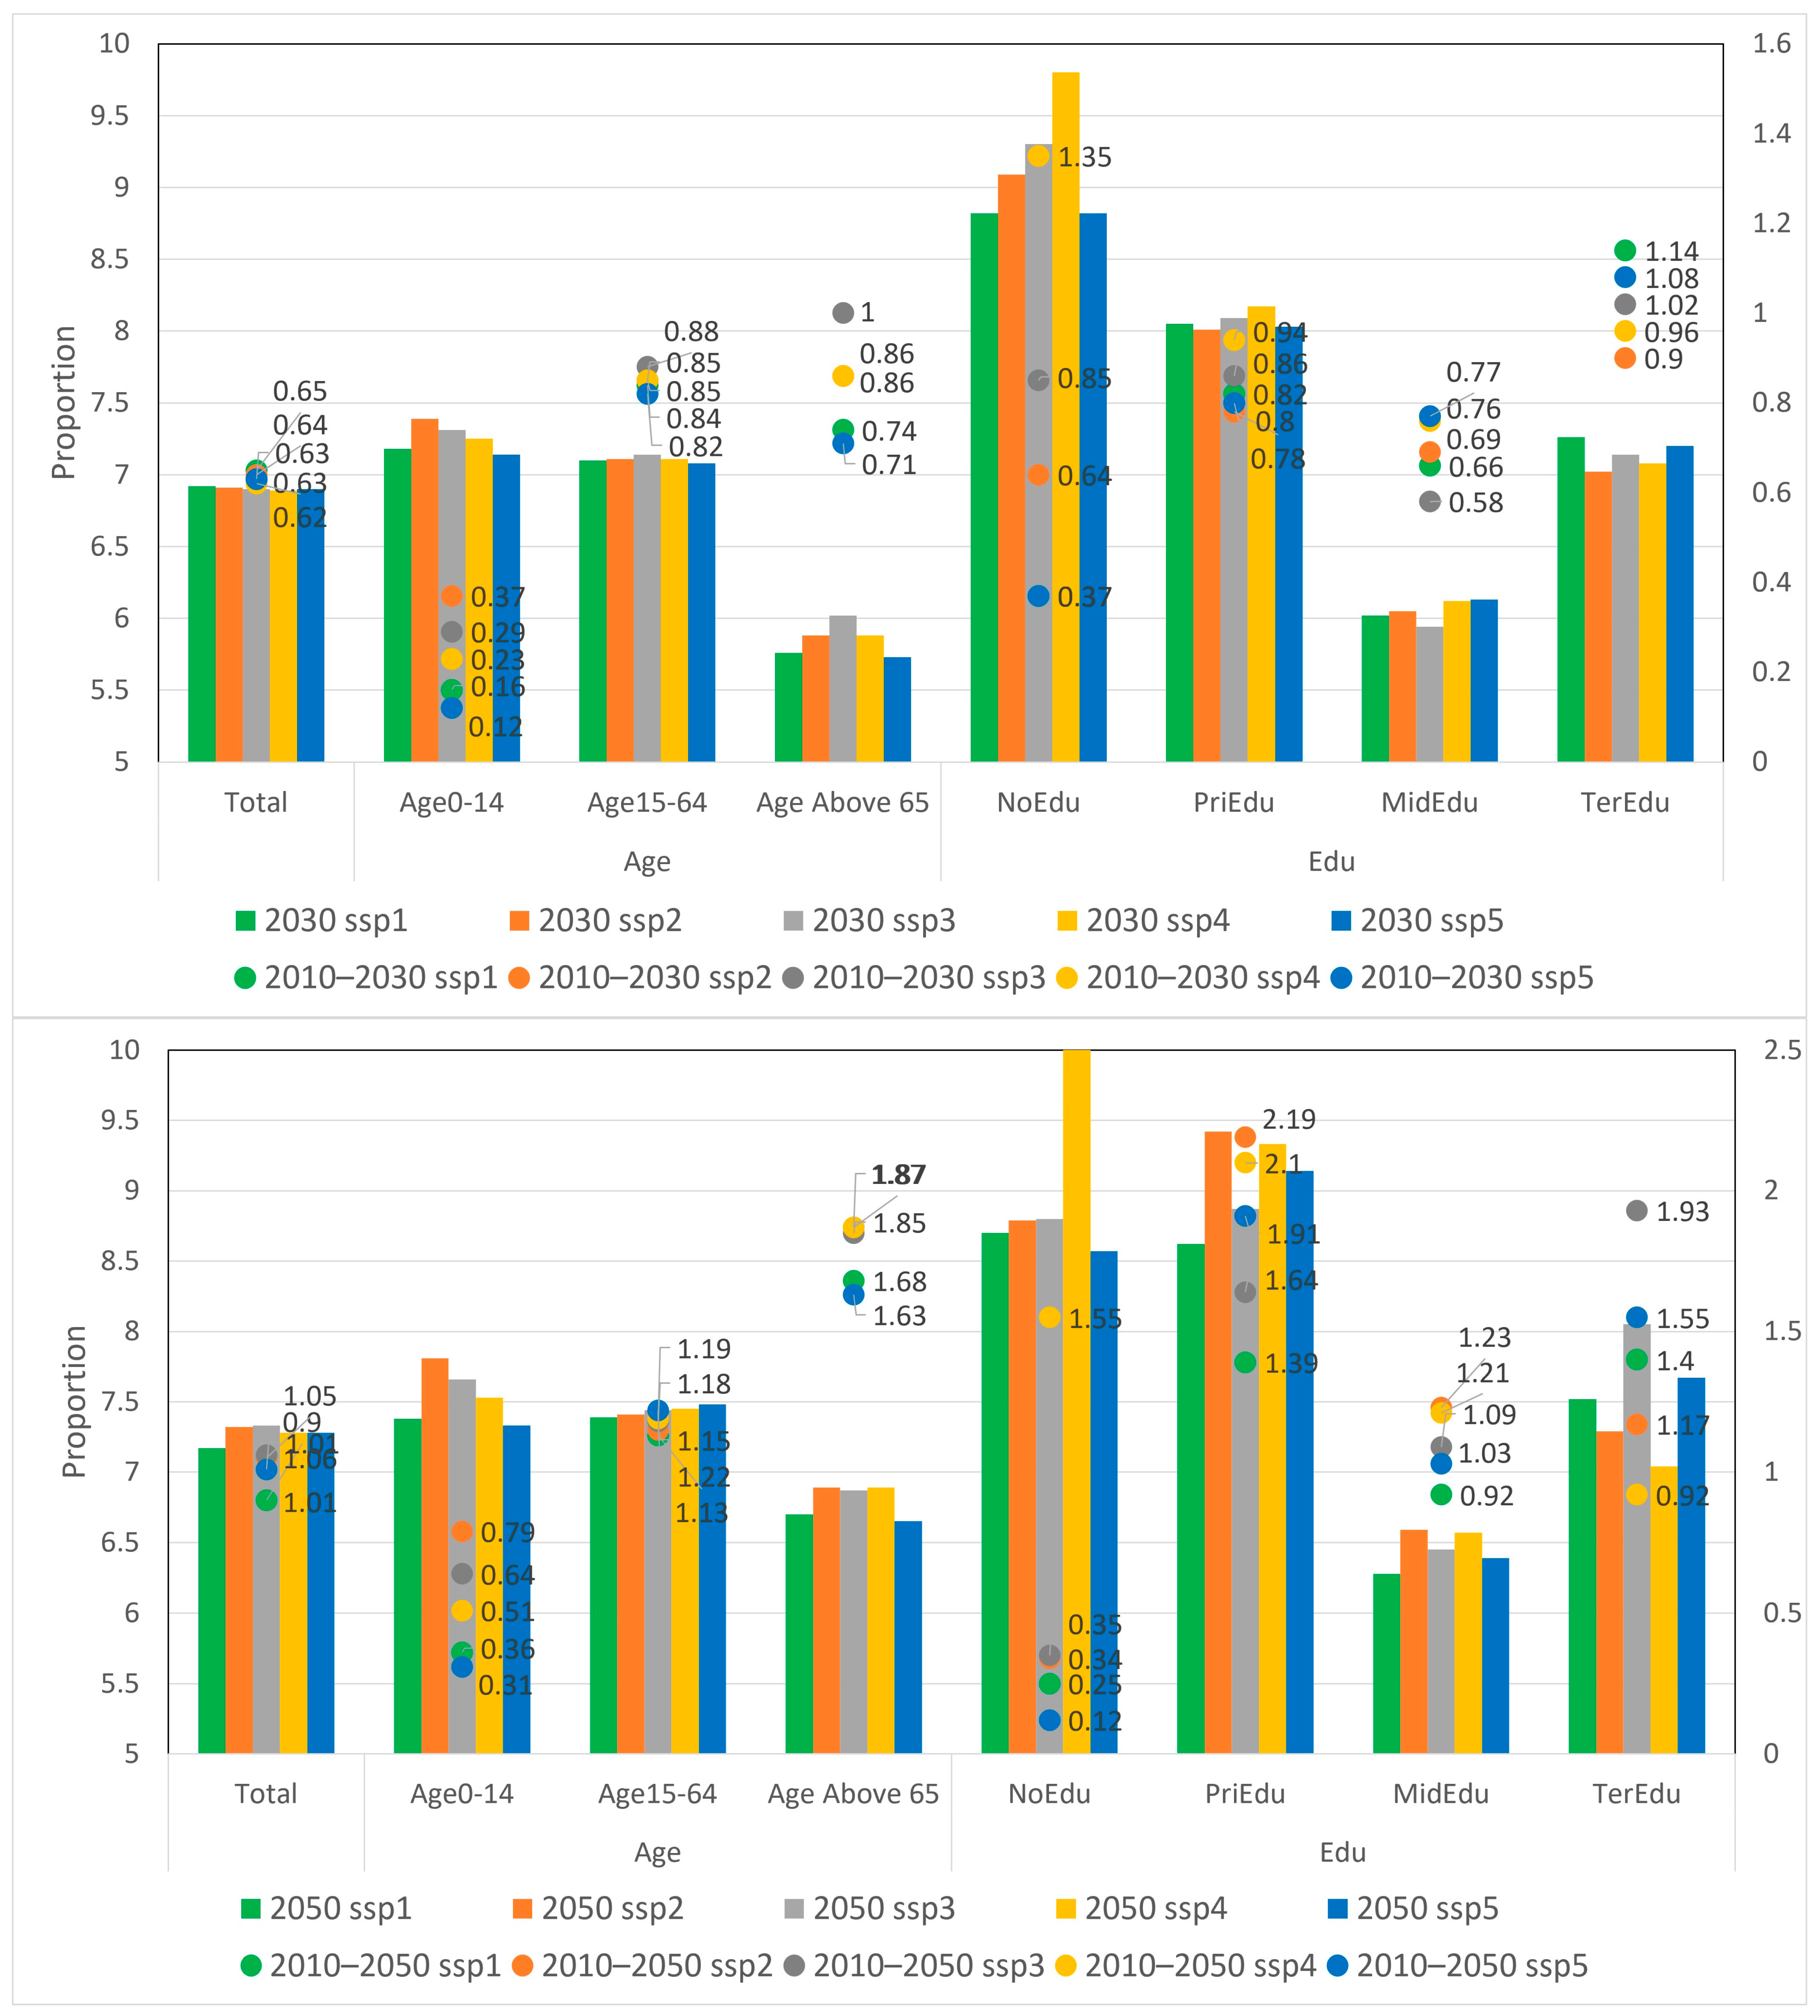
4.5. Future Multidimensional Changes in Population Proportions on the Eastern and Western Sides of the Hu Line
5. Summary
5.1. Breakthrough Mechanisms of the Hu Line Under Population–Socioeconomic–Natural Environment Coupling
5.2. Changes in Population Proportions on Both Sides of the Hu Line Under Shared Socioeconomic Pathways (SSPs)
5.3. Shared Socioeconomic Pathway (SSP) Selection and Its Influence on Multidimensional Population Characteristics Across the Hu Line
5.4. Increasing Investment in Basic Education in Provinces West of the Hu Line
5.5. Rational Layout and Development of New-Type Towns in Provinces West of the Hu Line
6. Future Work
Author Contributions
Funding
Institutional Review Board Statement
Informed Consent Statement
Data Availability Statement
Acknowledgments
Conflicts of Interest
References
- Hu, H. The Distribution of Population in China, With Statistics and Maps. Acta Geogr. Sin. 1935, 2, 33–74. [Google Scholar]
- Hu, H. The Distribution, Regionalization and Regionalization and Prospect of China’s Population. Acta Geo-Graph. Sin. 1990, 57, 139–145. [Google Scholar]
- Ge, M.; Feng, Z. A Study of population distribution pattern in China in 2000 based on GIS—And a comparison with Hu Huanyong’s 1935 study. Popul. Res. 2008, 32, 51–57. [Google Scholar]
- Qi, W.; Liu, S.; Zhao, M. Study on the stability of Hu Line and different spatial patterns of population growth on its both sides. Acta Geogr. Sin. 2015, 70, 551–566. [Google Scholar]
- Bai, Z.; Wang, J.; Yang, Y.; Sun, J. Characterizing spatial patterns of population distribution at township level across the 25 provinces in China. Acta Geogr. Sin. 2015, 70, 1229–1242. [Google Scholar]
- Chen, M.; Li, Y.; Gong, Y.; Lu, D.; Zhang, H. The population distribution and trend of urbanization pattern on two sides of Hu Huanyong population line: A tentative response to Premier Li Keqiang. Acta Geogr. Sin. 2016, 71, 179–193. [Google Scholar]
- Wang, K.; Deng, Y. Can new urbanization break through the Hu Huanyong Line? Further discussion on the geo-graphical connotations of the Hu Huanyong Line. Geogr. Res. 2016, 35, 825–835. [Google Scholar]
- Wang, Z.; Xia, H.; Tian, Y.; Wang, K.; Hua, H.; Geng, W.; Tian, L.; Zheng, B.; Zhao, J. Big-data analysis of HU Line existence in the ecology view and new economic geographical understanding based on population distribution. Acta Ecol. Sin. 2019, 39, 5166–5177. [Google Scholar] [CrossRef]
- Ding, J.; Cheng, C.; Zhang, W.; Tian, Y. The ideological origins and geographical demarcation significance of Hu Huanyong Line. Acta Geogr. Sin. 2021, 76, 1317–1333. [Google Scholar]
- Wang, L.; Yany, Y.; Feng, Z.; You, Z. Prediction of China’s population in 2020 and 2030 on county scale. Geo-Graph. Res. 2014, 33, 310–322. [Google Scholar]
- Wang, Z.; Yue, Q.; Xia, H.; Sun, Y.; Zhong, Z.; Xu, C.; Wang, Y.F. China 2050: Climate scenarios and stability of Hu-line. Sci. Sin. Terra 2016, 46, 1505–1514. [Google Scholar]
- Nüchel, J.; Bøcher, P.K.; Svenning, J.-C. Topographic slope steepness and anthropogenic pressure interact to shape the distribution of tree cover in China. Appl. Geogr. 2019, 103, 40–55. [Google Scholar] [CrossRef]
- Liu, C.; Wang, F.; Xu, Y. Habitation environment suitability and population density patterns in China: A regionalization approach. Growth Change 2019, 50, 184–200. [Google Scholar]
- Chen, D.; Zhang, Y.; Yao, Y.; Hong, Y.; Guan, Q.; Tu, W. Exploring the spatial differentiation of urbanization on two sides of the Hu Huanyong Line—Based on nighttime light data and cellular automata. Appl. Geogr. 2019, 112, 102081. [Google Scholar] [CrossRef]
- Lu, D.; Wang, Z.; Feng, Z.; Zeng, G.; Fang, C.; Dong, X.; Liu, S.; Jia, S.; Fang, Y.; Meng, G.; et al. Academic debates on Hu Huanyong population line. Geogr. Res. 2016, 35, 805–824. [Google Scholar]
- Mara, H. China’s Population Growing Slowly, Changing Fast. Science 2011, 332, 650–651. [Google Scholar] [CrossRef] [PubMed]
- Peng, X. China’s Demographic History and Future Challenges. Science 2011, 333, 581–587. [Google Scholar] [CrossRef] [PubMed]
- Lutz, W.; Kc, S. Global Human Capital: Integrating Education and Population. Science 2011, 333, 587–592. [Google Scholar] [CrossRef] [PubMed]
- Lee, R. The Outlook for Population Growth. Science 2011, 333, 569–573. [Google Scholar] [CrossRef] [PubMed]
- Blumenstock, J.E. Fighting poverty with data. Science 2016, 353, 753–754. [Google Scholar] [CrossRef] [PubMed]
- Lutz, W.; Cuaresma, J.C.; Kebede, E.; Prskawetz, A.; Sanderson, W.C.; Striessnig, E. Education rather than age structure brings demographic dividend. Proc. Natl. Acad. Sci. USA 2019, 116, 12798–12803. [Google Scholar] [CrossRef] [PubMed]
- van Vuuren, D.P.; Riahi, K.; Calvin, K.V.; Dellink, R.B.; Emmerling, J.; Fujimori, S.; Kc, S.; Kriegler, E.; O’Neill, B. The Shared Socio-economic Pathways: Trajectories for human development and global environmental change. Glob. Environ. Change-Hum. Policy Dimens. 2017, 42, 148–152. [Google Scholar] [CrossRef]
- O’Neill, B.C.; Dalton, M.; Fuchs, R.; Jiang, L.; Pachauri, S.; Zigova, K. Global demographic trends and future carbon emissions. Proc. Natl. Acad. Sci. USA 2010, 107, 17521–17526. [Google Scholar] [CrossRef] [PubMed]
- Shayegh, S. Outward migration may alter population dynamics and income inequality. Nat. Clim. Change 2017, 7, 828–833. [Google Scholar] [CrossRef]
- Lutz, W.; Striessnig, E. Demographic aspects of climate change mitigation and adaptation. Popul. Stud. A J. Demogr. 2015, 69, 69–76. [Google Scholar] [CrossRef] [PubMed]
- O’Neill, B.C.; Jiang, L.; Kc, S.; Fuchs, R.; Pachauri, S.; Laidlaw, E.K.; Zhang, T.; Zhou, W.; Ren, X. The effect of education on determinants of climate change risks. Nat. Sustain. 2020, 3, 520–528. [Google Scholar] [CrossRef]
- McLeman, R.A.; Hunter, L.M. Migration in the context of vulnerability and adaptation to climate change: Insights from analogues. Wiley Interdiscip. Rev.-Clim. Change 2010, 1, 450–461. [Google Scholar] [CrossRef] [PubMed]
- Cattaneo, C.; Beine, M.; Fröhlich, C.J.; Kniveton, D.; Martinez-Zarzoso, I.; Mastrorillo, M.; Millock, K.; Piguet, E.; Schraven, B. Human Migration in the Era of Climate Change. Rev. Environ. Econ. Policy 2019, 13, 189–206. [Google Scholar] [CrossRef]
- Hu, H. Population Density and Population Policy in China’s Eight Major Regions; Shanghai Foreign Language Education Press: Shanghai, China, 1983. [Google Scholar]
- Yin, W.; Yin, X.; Yan, H. The Hu Huanyong Line: A 65-Year Development Perspective. Chin. J. Popul. Sci. 2016, 12, 25–40. [Google Scholar]
- Kc, S.; Lutz, W. Demographic scenarios by age, sex and education corresponding to the SSP narratives. Popul. Environ. 2014, 35, 243–260. [Google Scholar] [CrossRef]
- Hvistendahl, M. Has China Outgrown the One-Child Policy? Science 2010, 329, 1458–1461. [Google Scholar] [CrossRef] [PubMed]
- O’Neill, B.C.; Tebaldi, C.; van Vuuren, D.P.; Eyring, V.; Friedlingstein, P.; Hurtt, G.; Knutti, R.; Kriegler, E.; Lamarque, J.-F.; Lowe, J.; et al. The Scenario Model Intercomparison Project (ScenarioMIP) for CMIP6. Geosci. Model Dev. 2016, 9, 3461–3482. [Google Scholar] [CrossRef]
- Riahi, K.; Van Vuuren, D.P.; Kriegler, E.; Edmonds, J.; O’Neill, B.C.; Fujimori, S.; Bauer, N.; Calvin, K.; Dellink, R.; Fricko, O.; et al. The Shared Socioeconomic Pathways and their energy, land use, and greenhouse gas emissions implications: An overview. Glob. Environ. Change-Hum. Policy Dimens. 2017, 42, 153–168. [Google Scholar] [CrossRef]
- Jones, B.; O’Neill, B.C. Spatially explicit global population scenarios consistent with the Shared Socioeconomic Pathways. Environ. Res. Lett. 2016, 11, 084003. [Google Scholar] [CrossRef]
- Jiang, L.; O’Neill, B.C. Global urbanization projections for the Shared Socioeconomic Pathways. Glob. Environ. Change-Hum. Policy Dimens. 2017, 42, 193–199. [Google Scholar] [CrossRef]
- Chen, Y.; Guo, F.; Wang, J.; Cai, W.; Wang, C.; Wang, K. Provincial and gridded population projection for China under shared socio-economic pathways from 2010 to 2100. Sci. Data 2020, 7, 83. [Google Scholar] [CrossRef] [PubMed]
- Jiang, T.; Zhao, J.; Jing, C.; Cao, L.; Wang, Y.; Sun, H.; Wang, A.; Haung, J.; Su, B.; Wang, R. National and Provincial Population Projected to 2100 Under the Shared Socioec-onomic Pathways in China. Clim. Change Res. 2017, 13, 128–137. [Google Scholar]
- Zhai, Z.; Chen, J.; Li, L. What is the total fertility rate of China at the present stage?—New evidence from household registration data. Popul. Res. 2015, 39, 22–34. [Google Scholar]
- Wang, J.; Ge, Y. China’s Population Development Trend under the implementation of the comprehensive two-child Policy. Popul. Res. 2016, 40, 3–21. [Google Scholar]
- Zhang, J.; Wang, R.; Lu, C. A quantitative analysis of Hukou reform in Chinese cities: 2000–2016. Growth Change 2019, 50, 201–221. [Google Scholar] [CrossRef]
- Lin, S.; Sidaway, J.D.; Woon, C.Y. Reordering China, Respacing the World: Belt and Road Initiative (一带一路) as an Emergent Geopolitical Culture. Prof. Geogr. 2019, 71, 507–522. [Google Scholar] [CrossRef]
- Brakman, S.; Frankopan, P.; Garretsen, H.; Van Marrewijk, C. The New Silk Roads: An introduction to China’s Belt and Road Initiative. Camb. J. Reg. Econ. Soc. 2019, 12, 3–16. [Google Scholar] [CrossRef]



| Type | 2010 | 2000 | ||||||||
|---|---|---|---|---|---|---|---|---|---|---|
| Population (in Millions) | Population Proportion (%) | Population (in Millions) | Population Proportion (%) | West Side of Hu Line Specific Gravity Change (%) | ||||||
| West of the Hu Line | East of the Hu Line | West of the Hu Line | East of the Hu Line | West of the Hu Line | East of the Hu Line | West of the Hu Line | East of the Hu Line | |||
| Total population | 85 | 1277 | 6.27 | 93.73 | 77 | 1196 | 6.07 | 93.93 | 0.2 | |
| Age | 0–14 years old | 16 | 210 | 7.02 | 92.98 | 20 | 270 | 6.92 | 93.08 | 0.1 |
| 15–64 years old | 63 | 950 | 6.26 | 93.74 | 53 | 838 | 5.98 | 94.02 | 0.28 | |
| Aged 65 and above | 6 | 116 | 5.02 | 94.98 | 4 | 87 | 4.29 | 95.71 | 0.73 | |
| Education | Uneducated | 13 | 139 | 8.45 | 91.55 | 19 | 178 | 9.53 | 90.47 | −1.08 |
| Primary education | 26 | 336 | 7.23 | 92.77 | 27 | 419 | 6.04 | 93.96 | 1.19 | |
| Secondary education | 39 | 681 | 5.36 | 94.64 | 29 | 547 | 5 | 95 | 0.36 | |
| Tertiary education | 8 | 121 | 6.12 | 93.88 | 3 | 52 | 5.18 | 94.82 | 0.94 | |
| Type | 2010 | 2030 | 2050 | 2010–2030 | 2010–2050 | ||||
|---|---|---|---|---|---|---|---|---|---|
| Population Ratio (%) | Population Ratio (%) | Population Ratio (%) | Change in Population Proportion | Change in Population Proportion | |||||
| West of the Hu Line | East of the Hu Line | West of the Hu Line | East of the Hu Line | West of the Hu Line | East of the Hu Line | on the West Side of the Hu Line (%) | on the West Side of the Hu Line (%) | ||
| IIASA | SSP1 | 6.27 | 93.73 | 6.28 | 93.72 | 6.04 | 93.96 | 0.01 | −0.23 |
| SSP2 | 6.27 | 93.73 | 6.41 | 93.59 | 6.26 | 93.74 | 0.14 | −0.01 | |
| SSP3 | 6.27 | 93.73 | 6.51 | 93.49 | 6.47 | 93.53 | 0.24 | 0.2 | |
| SSP4 | 6.27 | 93.73 | 6.29 | 93.71 | 6.05 | 93.95 | 0.02 | −0.22 | |
| SSP5 | 6.27 | 93.73 | 6.28 | 93.71 | 6.04 | 93.96 | 0.01 | −0.23 | |
| NUIST | SSP1 | 6.27 | 93.73 | 6.72 | 93.28 | 6.88 | 93.12 | 0.45 | 0.61 |
| SSP2 | 6.27 | 93.73 | 6.74 | 93.26 | 6.96 | 93.04 | 0.47 | 0.69 | |
| SSP3 | 6.27 | 93.73 | 6.75 | 93.25 | 7.03 | 92.97 | 0.48 | 0.76 | |
| SSP4 | 6.27 | 93.73 | 6.72 | 93.28 | 6.89 | 93.12 | 0.45 | 0.61 | |
| SSP5 | 6.27 | 93.73 | 6.72 | 93.28 | 6.88 | 93.12 | 0.45 | 0.61 | |
| Tsinghua | SSP1 | 6.27 | 93.73 | 6.89 | 93.11 | 7.18 | 92.82 | 0.62 | 0.91 |
| SSP2 | 6.27 | 93.73 | 6.92 | 93.08 | 7.32 | 92.68 | 0.65 | 1.05 | |
| SSP3 | 6.27 | 93.73 | 6.9 | 93.1 | 7.35 | 92.65 | 0.63 | 1.08 | |
| SSP4 | 6.27 | 93.73 | 6.91 | 93.09 | 7.28 | 92.72 | 0.64 | 1.01 | |
| SSP5 | 6.27 | 93.73 | 6.89 | 93.11 | 7.27 | 92.73 | 0.62 | 1 | |
Disclaimer/Publisher’s Note: The statements, opinions and data contained in all publications are solely those of the individual author(s) and contributor(s) and not of MDPI and/or the editor(s). MDPI and/or the editor(s) disclaim responsibility for any injury to people or property resulting from any ideas, methods, instructions or products referred to in the content. |
© 2026 by the authors. Licensee MDPI, Basel, Switzerland. This article is an open access article distributed under the terms and conditions of the Creative Commons Attribution (CC BY) license.
Share and Cite
Xia, H.; Liu, Q.; Yin, J.; Xie, X.; Sun, F. The Spatio-Temporal Dynamic Mechanism of Multidimensional Population on Both Sides of the Hu Line in China Under Climate Change. Sustainability 2026, 18, 7957. https://doi.org/10.3390/su18157957
Xia H, Liu Q, Yin J, Xie X, Sun F. The Spatio-Temporal Dynamic Mechanism of Multidimensional Population on Both Sides of the Hu Line in China Under Climate Change. Sustainability. 2026; 18(15):7957. https://doi.org/10.3390/su18157957
Chicago/Turabian StyleXia, Haibin, Qingchun Liu, Jie Yin, Xiangyu Xie, and Feiran Sun. 2026. "The Spatio-Temporal Dynamic Mechanism of Multidimensional Population on Both Sides of the Hu Line in China Under Climate Change" Sustainability 18, no. 15: 7957. https://doi.org/10.3390/su18157957
APA StyleXia, H., Liu, Q., Yin, J., Xie, X., & Sun, F. (2026). The Spatio-Temporal Dynamic Mechanism of Multidimensional Population on Both Sides of the Hu Line in China Under Climate Change. Sustainability, 18(15), 7957. https://doi.org/10.3390/su18157957